Abstract
In this paper, the radar imaging technology based on the time-domain (TD) electromagnetic scattering algorithm is used to generate image datasets quickly and apply them to target detection research. Considering that radar images are different from optical images, this paper proposes an improved strategy for the traditional You Only Look Once (YOLO)v3 network to improve target detection accuracy on radar images. The speckle noise in radar images can cover the real information of a target image and increase the difficulty of target detection. The attention mechanisms are added to the traditional YOLOv3 network to strengthen the weight of the target region. By comparing the target detection accuracy under different attention mechanisms, an attention module with higher detection accuracy is obtained. The validity of the proposed detection network is verified on a simulation dataset, a measured real dataset, and a mixed dataset. This paper is about an interdisciplinary study of computational electromagnetics, remote sensing, and artificial intelligence. Experiments verify that the proposed composite network has better detection performance.
1. Introduction
Automatic target classification and recognition based on radar images has always been an important and challenging problem [1,2]. As computer technology advances rapidly, electromagnetic scattering simulation has emerged as a crucial method for obtaining radar images [3,4]. Relevant research based on simulation images replacing measured images also has significance because the reliability of used simulation images has been verified. In fact, many scholars have carried out various studies based on simulation images in recent years. In [5], the researchers extracted key points from simulated inverse synthetic aperture radar (ISAR) images for estimating object pose. In [6], the problem of fast recognition of space targets based on simulated ISAR images was studied. In [7], the researchers introduced some simulated ISAR images to help classify a target.
Traditional radar image recognition methods usually need to extract the contour, area, size, and other features of the target manually and then design a classifier to classify these features [8,9,10]. Artificial feature extraction is not only tedious, but the extracted features are mostly shallow features of the image, which cannot contain the deep features of the image. In recent years, convolutional neural networks (CNNs) [11] have shown significant advancements in the field of optical image detection and recognition [12,13], and deep learning detection networks with CNNs as the core component perform well in various detection problems. As a representative method of the two-stage target detection network, Faster Region–CNN (R-CNN) [14] has higher accuracy, while the single-stage target detection model represented by the YOLO series [15,16,17] and single shot multi-box detector (SSD) [18] sacrifices a certain accuracy in exchange for good speed.
This paper focuses on target detection based on simulation radar images. It is well known that the YOLOv3 detection network is a mature optical image detection network. However, radar images are different from optical images, which usually contain multiple bands of gray information and have higher resolution for easy target recognition and classification extraction. The existence of speckle noise on radar images will cover up the real data in the target image, reduce the image quality, and increase the difficulty of target recognition and image interpretation. Therefore, the traditional YOLOv3 detection networks suitable for optical images may not be suitable for radar image detection because they cannot fully use the image feature information.
The attentional mechanism can diminish the speckle noise influence in radar images on the detection network by strengthening the weight of the target region and enhancing the network’s capability to suppress speckle noise. However, it should be noted that not all models with the attentional mechanism can carry out forward optimization on the target dataset. In addition, the attentional mechanism embedded at different network layers may have different effects on the detection results. We adopt the YOLOv3 network as the basic detection network and apply K-means clustering to determine the size of the anchor boxes in this paper. For the purpose of improving the traditional YOLOv3 network and adapting it for radar image detection, we try to introduce different types of attention modules, such as the squeeze-and-excitation (SE) attention module [19] and the convolutional-block (CB) [20] attention module, into the YOLOv3 network. Finally, the optimal composite YOLOv3 network structure with higher detection accuracy is obtained through experiments.
This paper is about an interdisciplinary study of computational electromagnetics, remote sensing, and artificial intelligence. The structure of this paper is as follows. The relevant work about the radar imaging model, the YOLOv3 network, and different attention mechanisms are presented in Section 2. In Section 3, the experimental results of the improved composite YOLOv3 network are shown. Section 4 concludes our research.
2. Description of the Radar Imaging Method
In this paper, the echoes for radar imaging are obtained by using the TD electromagnetic scattering algorithm, which is a hybrid algorithm of TD geometrical optics (GO) and physical optics (PO). Compared with the frequency domain (FD) algorithm, the TD scattering algorithm avoids time-consuming frequency-sweep and saves a lot of simulation time. As shown in Figure 1, the target is subdivided into triangular patches. When the incident wave reaches the triangular patch, the reflected wave can be traced by using TDGO to determine which triangular patches are illuminated. Finally, the TD electromagnetic scattering fields of each illuminated triangular patch can be obtained by the TDPO method [1]:
where . For a triangular patch, can be reduced to a closed-form representation. is the excitation pulse. and are the EM currents. is the impulse function, and “” represents the convolution operation. are the normalized incident and scattered wave vectors, respectively. is the light speed, and is the time delay caused by the bounce of electromagnetic wave.
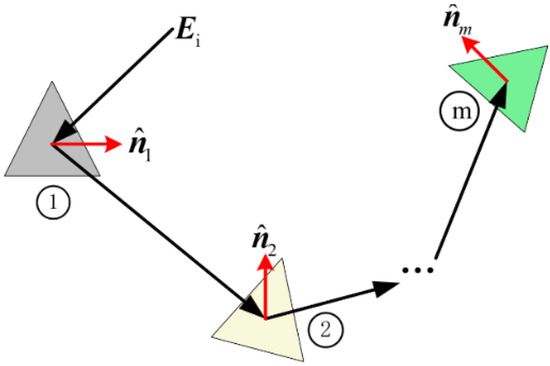
Figure 1.
Geometry of ray propagation and reflection.
In order to obtain the dataset required for target detection efficiently, this paper uses a reliable and efficient radar imaging model [4] based on the TD scattering algorithm to generate the image dataset. Considering the turntable imaging model shown in Figure 2, assume that radar scans a small angle near azimuth .
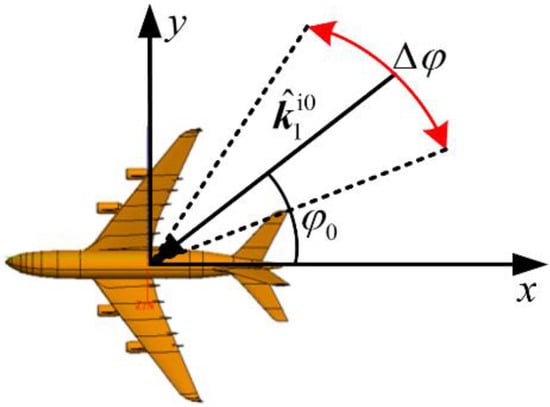
Figure 2.
Top view of the turntable imaging.
Detailed imaging theory formulas based on the TD electromagnetic scattering echo were proposed in our previous work [3,4]. This paper is a continuation of our previous work, focusing on the application of electromagnetic simulation radar images in target detection. More detailed formulas are not repeated here. In this section, taking one of the triangular vertexes on target as an example, the image expression can be formulated as follows:
where A is the intensity of the image. is the direction at azimuth angle and incident angle . is the position vector of one triangular vertex. and are two Sinc-type window functions. The vertex is projected onto the imaging plane defined by and .
3. Improvement in the YOLOv3 Network
Figure 3 presents the framework of the YOLOv3 network. The main part of the YOLOv3 network is Darknet53, which is composed of 53 layers of convolution. Darknet53 has three main modules, namely, the DBL module, residual (RES) module, and RESn module. The DBL module consists of a convolution layer, a batch normalization (BN) layer, and a leaky-relu layer. In the RES module, the feature is first input into two DBL modules to attain the output feature; following that, the output feature and the input feature are combined to slow down the gradient disappearance in the depth network. The convolution kernel dimension of the convolution layer in the first DB module is 1 × 1, and that of the convolution layer in the second DB module is 3 × 3. The n in RESn means the number of RES modules.
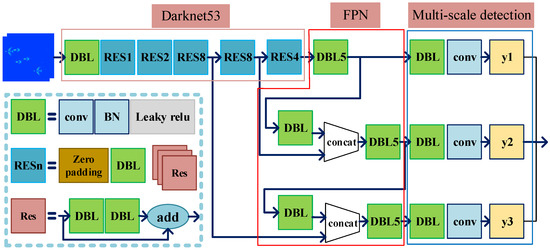
Figure 3.
The structure of the YOLOv3 network.
The detection head of YOLOv3 uses multi-scale target feature fusion. The small feature map has a deep feature level, which helps to detect large targets, while the large feature map can integrate deep semantic and shallow geometric information, which helps to detect small targets. The detection head includes the following parts: feature pyramid networks (FPNs) and multi-scale detection. The FPN is a new network structure proposed in 2017 [21], which integrates the characteristics of the deep layer and the shallow layer in the network. The new feature map contains both the deep semantic information and the shallow coordinate information. Finally, multi-scale target detection is realized by multi-scale regression prediction.
For the purpose of increasing the detection accuracy of the original YOLOv3 network, two different types of attention modules are introduced. The first attention module is the SE module, whose structure is shown in Figure 4. It can aggregate the features obtained from each convolution kernel into a 1 × 1 convolution, and the value of each 1 × 1 convolution means the importance of the convolution kernel in different channels. Then, the 1 × 1 convolution is multiplied by the original convolution of the same channel so that the refined convolution of each channel contains not only the image features of the channel but also the importance of the channel.

Figure 4.
The structure of the SE attention module.
Unlike the SE attention module, the CB attention module not only pays attention to the channel but also the space, so it can retain the coordinate information of the target. Figure 5 illustrates the structure of the CB attention module. It firstly captures the importance of different channels in the channel dimension by maximum and mean pooling, which adds an additional layer of Multilayer Perceptron (MLP) to enhance nonlinearity. Then, a convolution kernel having the same width and height as the feature map, but a one-dimensional channel dimension is obtained by compressing the channel dimension. Each number in the new convolution kernel represents the importance of the space.
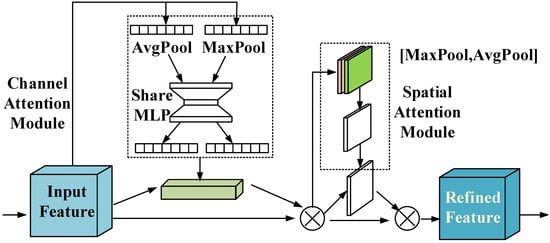
Figure 5.
The structure of the CB attention module.
It can be seen from the above analysis that an attention mechanism can help the network to shift the focus from the global area to a local area. Moreover, it can also enhance the accuracy of the network by suppressing noise and enhancing important features. Therefore, in this paper, the attention mechanism is integrated into the network to enhance the detection accuracy of the YOLOv3 network.
Figure 6 illustrates the RES module with different attention modules. Figure 6a shows the structure of the original RES module. In Figure 6a, it can be seen that in the original RES module, the input features are directly integrated with the deep features obtained through two-layer convolution operations. However, some implicit information in the feature map cannot be fully extracted. Since the feature map for different channels and locations can provide different information, in order to improve the original RES module, we add the attention mechanisms described in this paper. The SE and CB attention modules are combined with the original RES unit module in YOLOv3. Specifically, the attention module is embedded after two layers of convolution operations, and the output of the attention module is integrated with the deep feature map. The new structures are shown in Figure 6b,c.
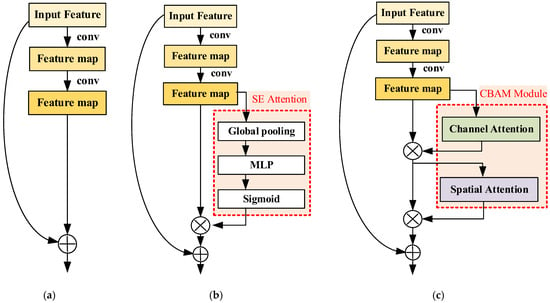
Figure 6.
The RES module with attention mechanisms. The (a) original RES module; (b) SE-RES module; and (c) CB-RES module.
Moreover, this paper attempts to use two methods for embedding attention networks. The first method replaces all RES units in the network with the above two kinds of attention RES units (ARUs). Because of this, the number of parameters may increase sharply in the network. For the purpose of reducing the number of weight parameters as much as possible, the second method replaces only the shallow RES units of the network with the above two kinds of ARUs. Another reason for this is that we consider that the weight of a shallow layer network usually has a great impact on the accuracy of the network. Then, by comparing the average precision (AP), we can find a suitable fusion method that is more beneficial to improving the accuracy of the model. Here, we need to explain the definition of the “shallow layer”. YOLOv3 can extract different feature maps at different network depths; the network layer before extracting the first feature map can be called the shallow layer, which is shown in Figure 7a.
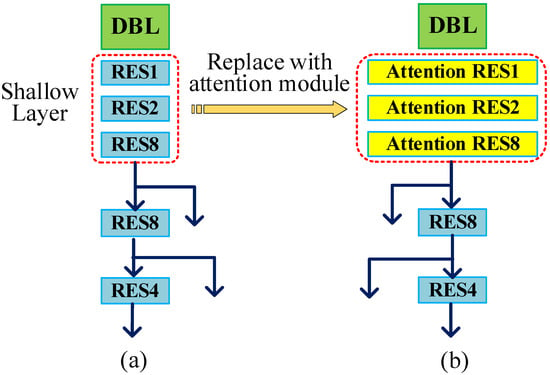
Figure 7.
(a) The backbone of YOLOv3. (b) The backbone of the improved network.
4. Experiments and Analysis
4.1. Accuracy Verification of Imaging Algorithm
In order to confirm the accuracy of the imaging algorithm, the radar images of the flight target (see Figure 2) simulated by commercial software FEKO 2021 and our method are shown in Figure 8 and Figure 9, respectively. The size of the flight target is 9.5 m × 10 m. The carrier frequency f and the bandwidth are 10 GHz and 1 GHz, respectively, and the resolution is 0.15 m.
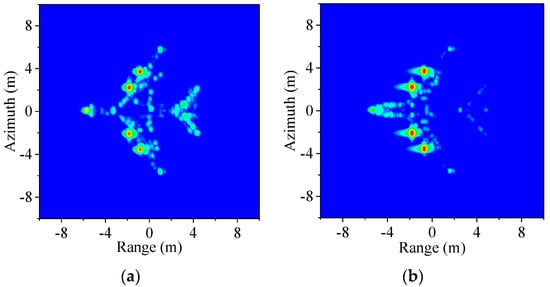
Figure 8.
Radar images simulated by FEKO. (a) θ0 = 60°. (b) θ0 = 90°.
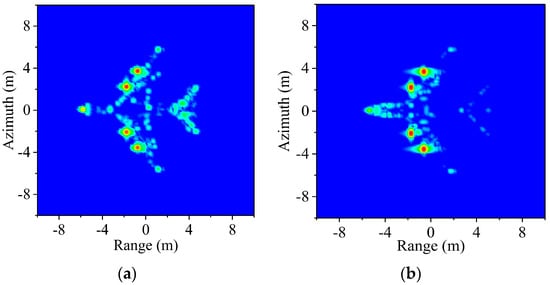
Figure 9.
Radar images simulated by our method. (a) θ0 = 60°. (b) θ0 = 90°.
The similarity among the images can be quantified using the correlation coefficient given in the following equation:
where A and B represent two images, and and are the mean values of the images.
The calculation time and similarity are shown in Table 1. The similarity in Figure 8a and Figure 9a is 0.97, and that in Figure 8b and Figure 9b is 0.98. In Table 1, we can see that the simulation efficiency of the proposed algorithm is much higher than that of FEKO software 2021. This proves that the proposed method enhances efficiency without compromising image quality. The method is well suited for generating abundant radar image datasets for target detection.

Table 1.
Computation time and similarity comparison.
4.2. Evaluation of Detection Performance on Simulated Datasets
Next, the radar imaging model in Section 2 is used to generate 2200 images of three kinds of flight targets. Figure 10 shows the geometric models of the three aircraft. The geometric dimensions are 7.0 m × 10.5 m (T1), 7.6 m × 10.25 m (T2), and 9.5 m × 10 m (T3). These images are used as a dataset for the detection network with a split ratio of 90:10. That is, 90% of the dataset goes into the training set and 10% goes into the test set. And the k-means clustering method is used to determine the size of the anchor box.

Figure 10.
Geometric models of three aircraft. (a) Target 1 (T1). (b) Target 2 (T2). (c) Target 3 (T3).
For the AP of a single target, we provide the following brief explanation:
where TP represents the number of positive samples judged as positive samples. FP represents the number of negative samples misjudged as positive samples, and FN represents the number of positive samples judged as negative samples. (Note: Positive samples represent the area including the target images and negative sample represents the background area without target images.) The criterion used is IoU (Intersection over Union). IoU is used to quantify the overlap degree between the prediction box and the real box, that is, the ratio of the intersection area of the prediction box and the real box to the union area. It is calculated as follows:
If the IoU value is greater than the threshold, the predicted box is successfully matched with the real box. Then, the test set is predicted based on the set threshold and the values of P and R are calculated. Finally, the P-R curve is plotted with P as the y-axis and R as the x-axis. The AP value is the area under the P-R curve. In this paper, the threshold for IoU is 0.5.
Figure 11 shows the training processes for different networks. We can see that the total loss in all the networks tends to 0 after training with 70 epochs. The convergent value of the loss function in the different models is different. As depicted in the right picture in Figure 11, the convergent value corresponding to the “YOLOv3-shallow CB” network is the smallest, and the loss function is relatively stable.
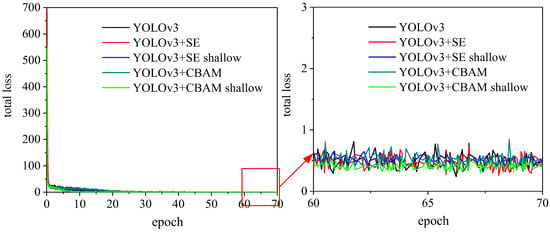
Figure 11.
The loss function training curve and local enlargement of the loss function value.
In Table 2, we compare the AP based on different networks. Here, Ti-AP (i = 1, 2, 3) denotes the average precision of each kind of target, and mAP stands for the mean average precision (mAP) of all targets. It can be seen from the mAP values that except for the YOLOv3 + CB network, for the improved network with an attention mechanism, its accuracy is higher than that of the original network. The low detection accuracy of the YOLOv3 + CB network is mainly caused by network overfitting. First, comparing Figure 4 and Figure 5 in this paper, we can see that the complexity of the CB attention module is higher than that of the SE attention module. This means there are more parameters in the CB-RES module shown in Figure 6. Second, as depicted in the figure below, all original RES modules in YOLOv3-CB are replaced with CB-RES. Therefore, compared with other networks, YOLOv3-CB is the most complex and contains the most parameters. This results in the phenomenon of overfitting.

Table 2.
Comparison of the AP for different targets.
Moreover, it can be found that the accuracy of the CB block is higher than that of the SE block. The main reason lies in the different network structures of the two blocks. Radar images are composed of discrete scattering points, which come from the scattering contribution of geometric structures at different positions on the target. The SE block only considers the channel information, while CB not only considers the channel information but also the target spatial information. It is important to notice the spatial features of radar images. Thus, the accuracy of the “YOLOv3-shallow CB” network can reach 0.94, which is a more satisfactory result.
The running time of each network is displayed in Table 3. FPS indicates the quantity of images that the network can process per second. The dimensions of the image are 416 × 416. FPS values on other networks are smaller than those on traditional YOLOv3 networks because of the addition of an attention module that consumes some processing time. In addition, since the attention module is only added in the shallow layer of the YOLOv3-shallow SE and YOLOv3-shallow CB, there is no significant decrease in FPS.

Table 3.
Comparison of the running efficiency of different networks.
In order to show the difference in network detection performance, the prediction results of different networks on the same images are shown in Figure 12. The corresponding confidences of the predicted results are given in the upper left corner of every prediction box. The solid square to the right of the prediction box represents the real target type. By comparing the detection accuracy of the different networks, we can conclude that the YOLOv3-shallow CB network has the best detection performance.
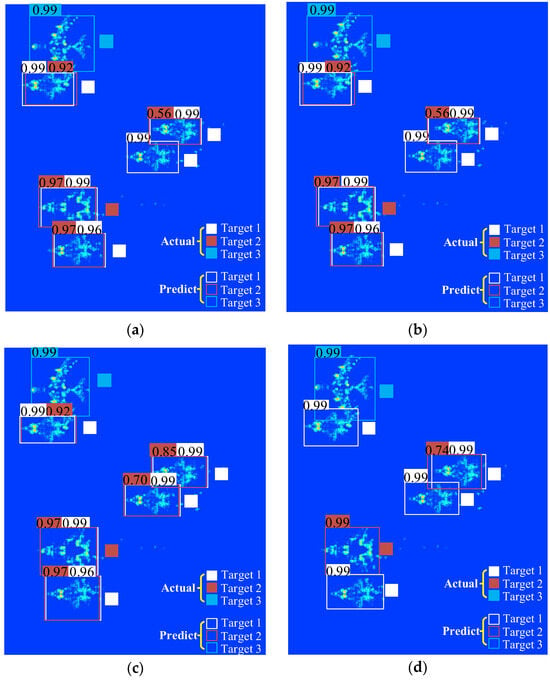
Figure 12.
Prediction results of different networks. (a) YOLOv3. (b) YOLOv3-CB. (c) YOLOv3-SE. (d) YOLOv3-shallow CB.
4.3. Evaluation of Detection Performance on Real Datasets
Next, the effectiveness of YOLOv3-shallow CB on real SAR image datasets was further validated. The dataset used in this section is the Moving and Stationary Target Acquisition and Recognition (MSTAR) dataset, which provides high-resolution real SAR data. The T72 tank, 2S1 vehicle, and ZSU-23-4 vehicle in the dataset are selected as the experimental targets. We choose the MSTAR dataset with a pitch angle of 17 degrees. In this dataset, 299 images are selected as samples for each target. We take four random images and stitch them together into one. In this way, SAR images of multiple targets with different orientations on the ground are generated. We build a total of 3000 images as a dataset, of which 2400 images are applied as a training set and 600 images as a test set. The image size is set to 280 × 280. It is important to note that the original amplitude values of the MSTAR data were used. In this paper, Figure 13 shows two of these images. The prediction results are depicted in Figure 14. As can be observed in the figure, the prediction accuracy of all three targets exceeds 97%. Figure 15 shows the AP values and mAP values for the three targets.
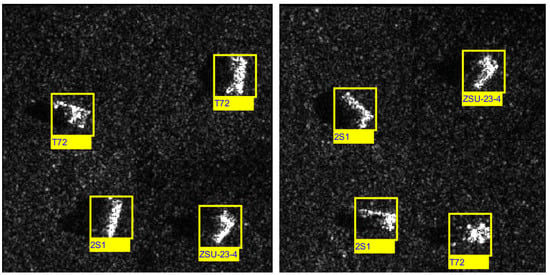
Figure 13.
SAR images of multiple targets with different orientations on the ground.
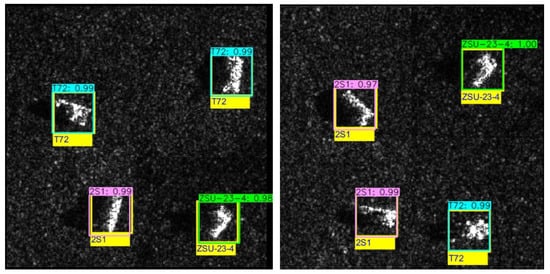
Figure 14.
Prediction result of YOLOv3-shallow CB.
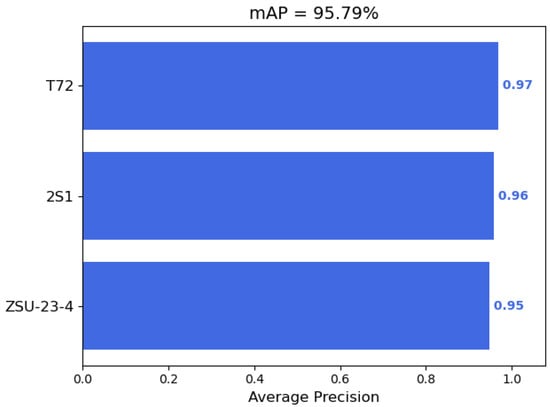
Figure 15.
AP values and mAP values for the three targets.
4.4. Evaluation of Detection Performance on Mixes Datasets
Based on the previous experiments, the validity of the network model is further verified on the mixed dataset, which is composed of measured data and simulation data. Specifically, we replace part of the real images of the T72 tank with simulation images. These simulated images are generated using the imaging method that is proposed in this paper. The mixed dataset of the T72 tank consists of 239 simulated images and 60 real images. In order to confirm the accuracy of the proposed imaging algorithm, we compare the simulated image with the real data of the T72 tank. The optical photograph and geometric model of the T72 tank are shown in Figure 16. The size of the T72 tank is 10 m × 3.9 m × 3 m.
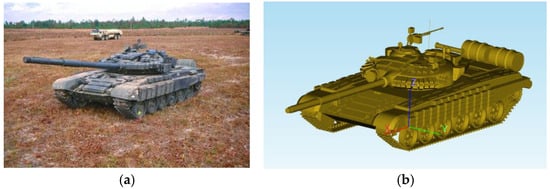
Figure 16.
Optical photograph and geometric model of the T72 tank. (a) Optical photograph. (b) Geometric model.
Figure 17 shows the real and simulated images at a pitch angle of 17 degrees and a target azimuth angle of 30 degrees. Figure 18 shows the real and simulated images at a pitch angle of 17 degrees and a target azimuth angle of 90 degrees. The carrier frequency is 9.6 GHz and the resolution is 0.3 m.
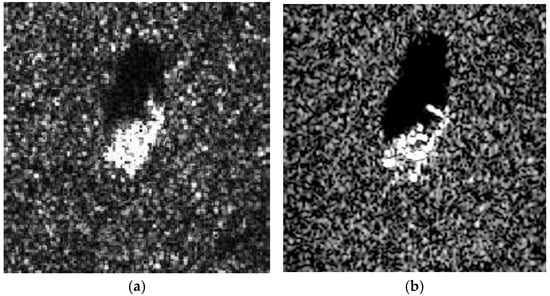
Figure 17.
Real and simulated images of the T72 tank at a target azimuth angle of 30 degrees. (a) Real and (b) simulated.
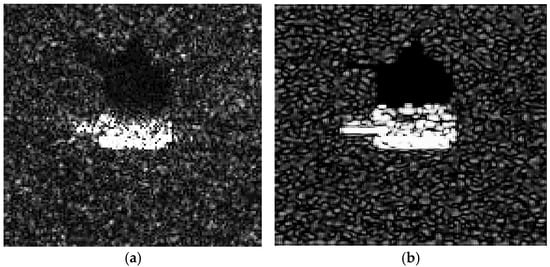
Figure 18.
Real and simulated images of the T72 tank at a target azimuth angle of 90 degrees. (a) Real and (b) simulated.
Through comparison, it can be found that the simulated image and the real image have high similarity. The similarity in Figure 17 is 0.90 and in Figure 18, it is 0.89. The reliability of the imaging algorithm in this paper is verified.
Following the previous method, we make a dataset containing 3000 images, of which 2400 images are applied as a training set and 600 images as a test set. Figure 19 shows two samples of these images. The label with the letter “m” as the suffix represents the real image, and the label with the letter “s” as the suffix represents the simulated image. For example, “T72M” represents a real image and “T72S” represents a simulated image.
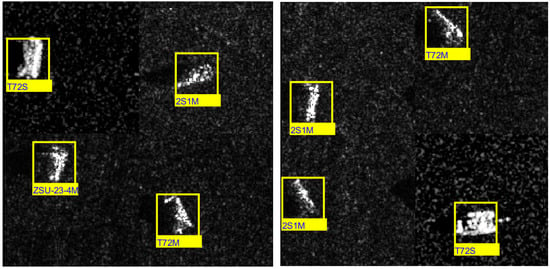
Figure 19.
Two images of multiple targets with different orientations on the ground.
The prediction results under the combination of different target types are depicted in Figure 20. In the figure, we can see that the prediction accuracy of all three targets exceeds 96%. The AP values of T72, 2S1, and ZSU-23-4 are 0.93, 0.95, and 0.94, respectively. The mAP value is 0.94.
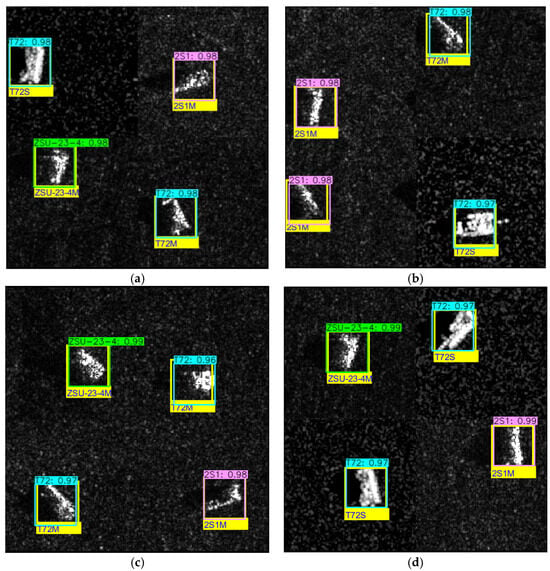
Figure 20.
Prediction results under the combination of different target types. (a,b) T72S and T72M exist simultaneously. (c) Only T72M. (d) Only T72S.
4.5. Comparison with Other Methods
We further conduct a benchmark comparison with other CNN-based object detection networks, including Faster R-CNN, RetinaNet, and SSD, as shown in Table 4. The dataset used is still a mixed dataset. After comparison with the other methods, we found that the YOLOv3-shallow CB network in this paper obtains the largest mAP value and is the best detection method. Figure 21 shows the detection results of different network models. As depicted in the figure, there are missed and false detection results using RetinaNet and SSD. Although Faster R-CNN accurately detected the target, its detection accuracy is lower than that of YOLOv3-shallow CB.

Table 4.
Comparison with other methods.
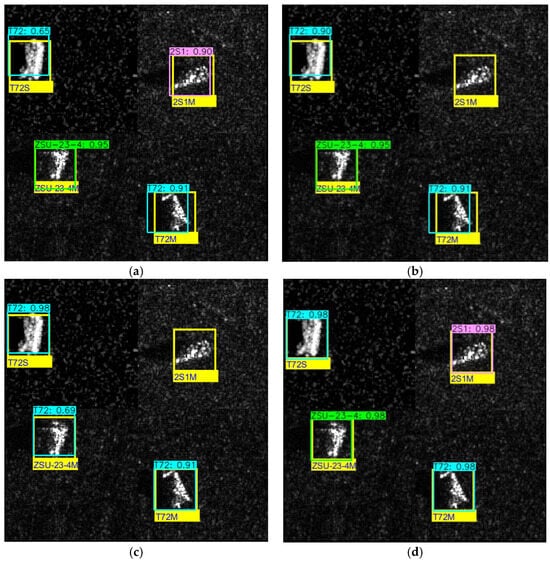
Figure 21.
The detection results of different network models. (a) Faster R-CNN, (b) RetinaNet, (c) SSD, and (d) YOLOv3-shallow CB.
5. Conclusions
In this paper, a radar imaging framework based on the TD electromagnetic scattering algorithm is used to rapidly generate image datasets for target detection. Then, different composite YOLOv3 networks are constructed by introducing different attention mechanisms to enhance the detection accuracy of the original network. From the results, we can conclude that the SE attention mechanism has little effect on improving the detection accuracy of YOLOv3. The introduction of the CB attention mechanism obviously enhances the detection accuracy. At the same time, the experiment shows that adding the attention mechanism in the shallow layer is a better scheme. The composite YOLOv3-shallow CB network has a better ability to suppress target detection errors and a higher correct detection rate than the other networks because it makes full use of channel and spatial information of the feature maps. Through quantitative experiments on various datasets, we comprehensively evaluate the effectiveness of the proposed detection network. In particular, the results of these experiments on the mixed dataset also prove the effectiveness of simulation data in the target detection network training process.
Author Contributions
Conceptualization, G.G. and R.W.; methodology, G.G. and R.W.; software, G.G. and R.W.; validation, G.G. and R.W.; investigation, G.G. and L.G.; writing—original draft preparation, G.G.; funding acquisition, G.G., R.W. and L.G. All authors have read and agreed to the published version of the manuscript.
Funding
This research was funded by the National Natural Science Foundation of China under Grant 62101417/62071348/62231021/U21A20457, the Fundamental Research Funds for the Central Universities under grant XJSJ24032, and the Key Research and Development Program of Shaanxi under grant 2024GX-YBXM-013/2023-YBGY-013.
Data Availability Statement
The original contributions presented in the study are included in the article, further inquiries can be directed to the corresponding author.
Conflicts of Interest
The authors declare no conflicts of interest.
Abbreviations
| Acronym | Full Name |
| TD | time domain |
| YOLO | You Only Look Once |
| ISAR | inverse synthetic aperture radar |
| CNNs | convolutional neural networks |
| SSD | single-shot multi-box detector |
| SE | squeeze-and-excitation |
| CB | convolutional block |
| GO | geometrical optics |
| PO | physical optics |
| FD | frequency domain |
| BN | batch normalization |
| RES | residual |
| FPN | feature pyramid networks |
| MLP | Multilayer Perceptron |
| AP | average precision |
| IoU | Intersection over Union |
| mAP | mean average precision |
| MSTAR | Moving and Stationary Target Acquisition and Recognition |
References
- Lee, S.J.; Lee, M.J.; Kim, K.T.; Bae, J.H. Classification of ISAR Images Using Variable Cross-Range Resolutions. IEEE Trans. Aerosp. Electron. Syst. 2018, 54, 2291–2303. [Google Scholar] [CrossRef]
- Xue, B.; Tong, N.; Xu, X. DIOD: Fast, Semi-Supervised Deep ISAR Object Detection. IEEE Sens. J. 2019, 19, 1073–1081. [Google Scholar] [CrossRef]
- Guo, G.; Guo, L.; Wang, R. ISAR Image Algorithm Using Time-Domain Scattering Echo Simulated by TDPO Method. IEEE Antennas Wirel. Propag. Lett. 2020, 19, 1331–1335. [Google Scholar] [CrossRef]
- Guo, G.; Guo, L.; Wang, R.; Liu, W.; Li, L. Transient Scattering Echo Simulation and ISAR Imaging for a Composite Target-Ocean Scene Based on the TDSBR Method. Remote Sens. 2022, 14, 1183. [Google Scholar] [CrossRef]
- Xie, P.; Zhang, L.; Du, C.; Wang, X.; Zhong, W. Space Target Attitude Estimation from ISAR Image Sequences with Key Point Extraction Network. IEEE Signal Proc. Let. 2021, 28, 1041–1045. [Google Scholar] [CrossRef]
- Yang, H.; Zhang, Y.; Ding, W. A Fast Recognition Method for Space Targets in ISAR Images Based on Local and Global Structural Fusion Features with Lower Dimensions. Int. J. Aerospace Eng. 2020, 2020, 3412582. [Google Scholar] [CrossRef]
- Vatsavayi, V.K.; Kondaveeti, H.K. Efficient ISAR image classification using MECSM representation. J. King Saud Univ. Comput. Inf. Sci. 2018, 30, 356–372. [Google Scholar] [CrossRef]
- Pastina, D.; Spina, C. Multi-feature based automatic recognition of ship targets in ISAR. IET Radar Sonar Nav. 2009, 3, 406–423. [Google Scholar] [CrossRef]
- Saidi, M.N.; Daoudi, K.; Khenchaf, A.; Hoeltzener, B.; Aboutajdine, D. Automatic target recognition of aircraft models based on ISAR images. In Proceedings of the 2009 IEEE International Geoscience and Remote Sensing Symposium, Cape Town, South Africa, 12–17 July 2009; pp. IV-685–IV-688. [Google Scholar]
- Saidi, M.N.; Toumi, A.; Khenchaf, A.; Hoeltzener, B.; Aboutajdine, D. Pose estimation for ISAR image classification. In Proceedings of the 2010 IEEE International Geoscience and Remote Sensing Symposium, Honolulu, HI, USA, 25–30 July 2010; pp. 4620–4623. [Google Scholar]
- Lecun, Y.; Bottou, L.; Bengio, Y.; Haffner, P. Gradient-based learning applied to document recognition. Proc. IEEE 1998, 86, 2278–2324. [Google Scholar] [CrossRef]
- Krizhevsky, A.; Sutskever, I.; Hinton, G. ImageNet Classification with Deep Convolutional Neural Networks. In Proceedings of the Advances in Neural Information Processing Systems, Lake Tahoe, CA, USA, 3–6 December 2012. [Google Scholar]
- Chen, K.; Wang, L.; Zhang, J.; Chen, S.; Zhang, S. Semantic Learning for Analysis of Overlapping LPI Radar Signals. IEEE Trans. Instrum. Meas. 2023, 72, 8501615. [Google Scholar] [CrossRef]
- Ren, S.Q.; He, K.M.; Girshick, R.; Sun, J. Faster R-CNN: Towards Real-Time Object Detection with Region Proposal Networks. IEEE Trans. Pattern Anal. 2017, 39, 1137–1149. [Google Scholar] [CrossRef] [PubMed]
- Redmon, J.; Divvala, S.; Girshick, R.; Farhadi, A. You Only Look Once: Unified, Real-Time Object Detection. In Proceedings of the 2016 IEEE Conference on Computer Vision and Pattern Recognition (CVPR), Las Vegas, NV, USA, 27–30 June 2016; pp. 779–788. [Google Scholar]
- Redmon, J.; Farhadi, A. YOLO9000: Better, Faster, Stronger. In Proceedings of the 2017 IEEE Conference on Computer Vision and Pattern Recognition (CVPR), Honolulu, HI, USA, 21–26 July 2017; pp. 6517–6525. [Google Scholar]
- Redmon, J.; Farhadi, A. YOLOv3: An Incremental Improvement. arXiv 2018, arXiv:1804.02767. [Google Scholar]
- Liu, W.; Anguelov, D.; Erhan, D.; Szegedy, C.; Reed, S.; Fu, C.-Y.; Berg, A.C. SSD: Single Shot MultiBox Detector. In Proceedings of the 2016 European Conference on Computer Vision; Springer: Cham, Switzerland, 2016; pp. 21–37. [Google Scholar]
- Hu, J.; Shen, L.; Sun, G. Squeeze-and-Excitation Networks. In Proceedings of the 2018 IEEE/CVF Conference on Computer Vision and Pattern Recognition, Salt Lake City, UT, USA, 18–23 June 2018; pp. 7132–7141. [Google Scholar]
- Woo, S.; Park, J.; Lee, J.-Y.; Kweon, I.S. CBAM: Convolutional Block Attention Module. In Proceedings of the 2018 European Conference on Computer Vision; Springer: Cham, Switzerland, 2018; pp. 3–19. [Google Scholar]
- Lin, T.Y.; Dollár, P.; Girshick, R.; He, K.; Hariharan, B.; Belongie, S. Feature Pyramid Networks for Object Detection. In Proceedings of the 2017 IEEE Conference on Computer Vision and Pattern Recognition (CVPR), Honolulu, HI, USA, 21–26 July 2017; pp. 936–944. [Google Scholar]
Disclaimer/Publisher’s Note: The statements, opinions and data contained in all publications are solely those of the individual author(s) and contributor(s) and not of MDPI and/or the editor(s). MDPI and/or the editor(s) disclaim responsibility for any injury to people or property resulting from any ideas, methods, instructions or products referred to in the content. |
© 2024 by the authors. Licensee MDPI, Basel, Switzerland. This article is an open access article distributed under the terms and conditions of the Creative Commons Attribution (CC BY) license (https://creativecommons.org/licenses/by/4.0/).