Article

Relationship between Tibetan Plateau Surface Heat Fluxes and Daily Heavy Precipitation in the Middle and Lower Yangtze River Basins (1980–2022)

1
College of Hydraulic & Environmental Engineering, China Three Gorges University, Yichang 443002, China
2
Engineering Research Center for the Ecological Environment of the Three Gorges Reservoir Area, Ministry of Education, Yichang 430072, China
3
Land-Atmosphere Interaction and Its Climatic Effects Group, State Key Laboratory of Tibetan Plateau Earth System, Resources and Environment (TPESRE), Institute of Tibetan Plateau Research, Chinese Academy of Sciences, Beijing 100101, China
4
College of Earth and Planetary Sciences, University of Chinese Academy of Sciences, Beijing 100049, China
5
College of Atmospheric Science, Lanzhou University, Lanzhou 730000, China
6
National Observation and Research Station for Qomolongma Special Atmospheric Processes and Environmental Changes, Dingri 858200, China
7
Kathmandu Center of Research and Education, Chinese Academy of Sciences, Beijing 100101, China
8
China-Pakistan Joint Research Center on Earth Sciences, Chinese Academy of Sciences, Islamabad 45320, Pakistan
9
Institute of International Rivers and Eco-Security, Yunnan University, Kunming 650504, China
10
Yunnan Key Laboratory of International Rivers and Transboundary Eco-Security, Yunnan University, Kunming 650504, China
11
Faculty of Geo-Information Science and Earth Observation, University of Twente, 7500 AE Enschede, The Netherlands
*
Author to whom correspondence should be addressed.
These authors contributed equally to this work.
Remote Sens. 2024, 16(20), 3779; https://doi.org/10.3390/rs16203779
Submission received: 23 August 2024 / Revised: 8 October 2024 / Accepted: 10 October 2024 / Published: 11 October 2024

Abstract

:
Variable heat fluxes over the Tibetan Plateau (TP) interact thermally with the atmosphere, affecting weather in surrounding areas, particularly in the Middle and Lower Yangtze River (MLYR). However, the circulation patterns and time-lag effects between TP heat fluxes and MLYR precipitation remain unclear. This study identified 577 large-scale daily heavy precipitation events (LSDHPEs) in the MLYR from 1980 to 2022. We analyzed the weather causation and spatiotemporal correlations between the TP surface heat fluxes and MLYR LSDHPEs using self-organizing map clustering, singular value decomposition, and harmonic analysis of time series. The results found two dominant synoptic patterns of LSDHPEs at 500 hPa: one, driven by anticyclonic and cyclonic circulations coinciding with shifts in the West Pacific subtropical high and South Asian high, increased from 2000 to 2022; the other, influenced by MLYR cyclonic circulation, showed a significant decrease. For the first time, we revealed lagged effects of the latent heat anomalies (with a lag time of 1–10 d and 130–200 d) and sensible heat anomalies (with a lag time of 2–4 months) over the TP during LSDHPEs in the MLYR. The results may enhance our understanding of TP heat flux anomalies as precursor signals for early warning of heavy rainfall and flooding in the MLYR.

1. Introduction

Surface heat flux is the most important variable in land–atmosphere interactions on the Tibetan Plateau (TP) [1,2]. It is crucial in influencing the climate anomalies on the TP and in neighboring regions [3,4,5,6], which include the Middle and Lower Yangtze River (MLYR) [7,8,9,10]. The MLYR is one of the most important economic development zones in China, with a dense population, and contributes 35% of the total GDP of China; however, it is influenced significantly by frequent heavy precipitation [11,12,13,14]. Previous studies demonstrated the existence of a linkage between precipitation in the MLYR and surface heat fluxes over the TP [7,15,16,17]. In recent decades, the amount of extreme precipitation events has increased in the MLYR [18,19], and the TP has become progressively warmer and wetter [20,21]. Correctly recognizing the relationship between the two under the background of climate change is essential because it is critical in developing early warning systems for rainstorms and floods in the MLYR.
Various researchers have studied the formation mechanism of heavy precipitation in the MLYR, aiming to understand the specific influence of the TP in this process [8,22,23,24]. The process by which the TP surface heat flux affects the precipitation in the MLYR can be summarized as follows. First, the unique TP topography reinforces mesoscale disturbances, indirectly increasing the surface heat flux over the TP [25,26]. Subsequently, surface heat changes of the plateau and its differences from the surrounding region can stimulate or hinder the development of atmospheric (e.g., vortices, clouds, and high potential vorticity systems) or monsoon systems in the plateau [27,28]. Furthermore, weather systems (e.g., vortices and jets) carrying large amounts of water vapor move eastward from the plateau and its surroundings to the MLYR to produce rainfall [29,30]. Chen [9] found that an eastward-moving cloud from the TP encountered a significant water vapor enhancement accompanied by a low-level vortex and jet streams up into the troposphere at an altitude of 5.5 to 7 km, a strong precursor of heavy rainfall in the MLYR in 2016. The surface diabatic heating of the TP can stimulate the vigorous vertical motion and mutual proximity of the South Asian High (SAH) and Western North Pacific Subtropical High (WNPSH) [31,32]. Moreover, Ma [33] also illustrated that intense latent heating resulted in a cyclonic anomaly in the middle and lower levels of the troposphere, leading to wind anomalies that shifted extreme precipitation southward over the Yangtze River from 1961 to 2013. However, current studies on the correlation between precipitation in the MLYR and the TP always focus on individual storm events or local weather systems (the Yangtze River region or the plateau). Few studies have categorized weather patterns covering the two regions from the perspective of daily heavy rainfall events.
Quantifying the temporal connection between surface heat flux over the TP and precipitation in the MLYR faces various challenges. Previous studies have established that TP influences MLYR precipitation [15,34,35]. Wan [36] noted that surface air temperatures over the TP rose 3 to 4 d before extreme precipitation occurred in southeastern China, while Zhao [8] found that vortices associated with 51 heavy rainfall events took 3-5 d to travel from the TP to the MLYR. Despite these insights into the movement of convective weather systems, the exchange of matter and energy between the land and atmosphere over the TP remains inadequately addressed. Specifically, spring sensible heat (SH) flux from the TP may signal abnormal summer precipitation in the MLYR [35,37,38]. Some studies have examined factors affecting surface heat flux (e.g., soil moisture content and snow cover) in relation to precipitation in the MLYR [31,39,40,41]. It is worth noticing that in these studies, the rainfall mainly refers to cumulative rainfall on a monthly or seasonal scale, and the lag time analyzed is also on a seasonal scale. However, research on the time-lag correlation between daily surface heat flux variations on the TP and extreme precipitation events in the MLYR is still lacking.
To address the identified research gaps, the objectives of this paper are to (1) analyze the synoptic patterns corresponding to Large-Scale Daily Heavy Precipitation events (LSDHPEs) in the MLYR and variation trends so that upon the appearance of a certain synoptic pattern, the LSDHPEs in the MLYR are to be expected and (2) quantify the lag time between heat flux changes over the TP and heavy precipitation in the MLYR so as to enable a certain prediction of the LSDHPEs in the MLYR. The remainder of this paper is organized as follows: Section 2 and Section 3 describe our data sources and methods. Section 4.1 presents the spatio-temporal characteristics of precipitation in the MLYR, and Section 4.2 further displays the dominant synoptic patterns of LSDHPEs among the six categories and the dynamic and thermodynamic contributions to the trends of the LSDHPEs. Section 4.3 describes the time-lagged effect of the heat flux anomaly over the TP on LSDHPEs in the MLYR using the singular value decomposition (SVD) and harmonic analysis of time series (HANTS) methods. Section 5 and Section 6 present the discussion and conclusions, respectively.

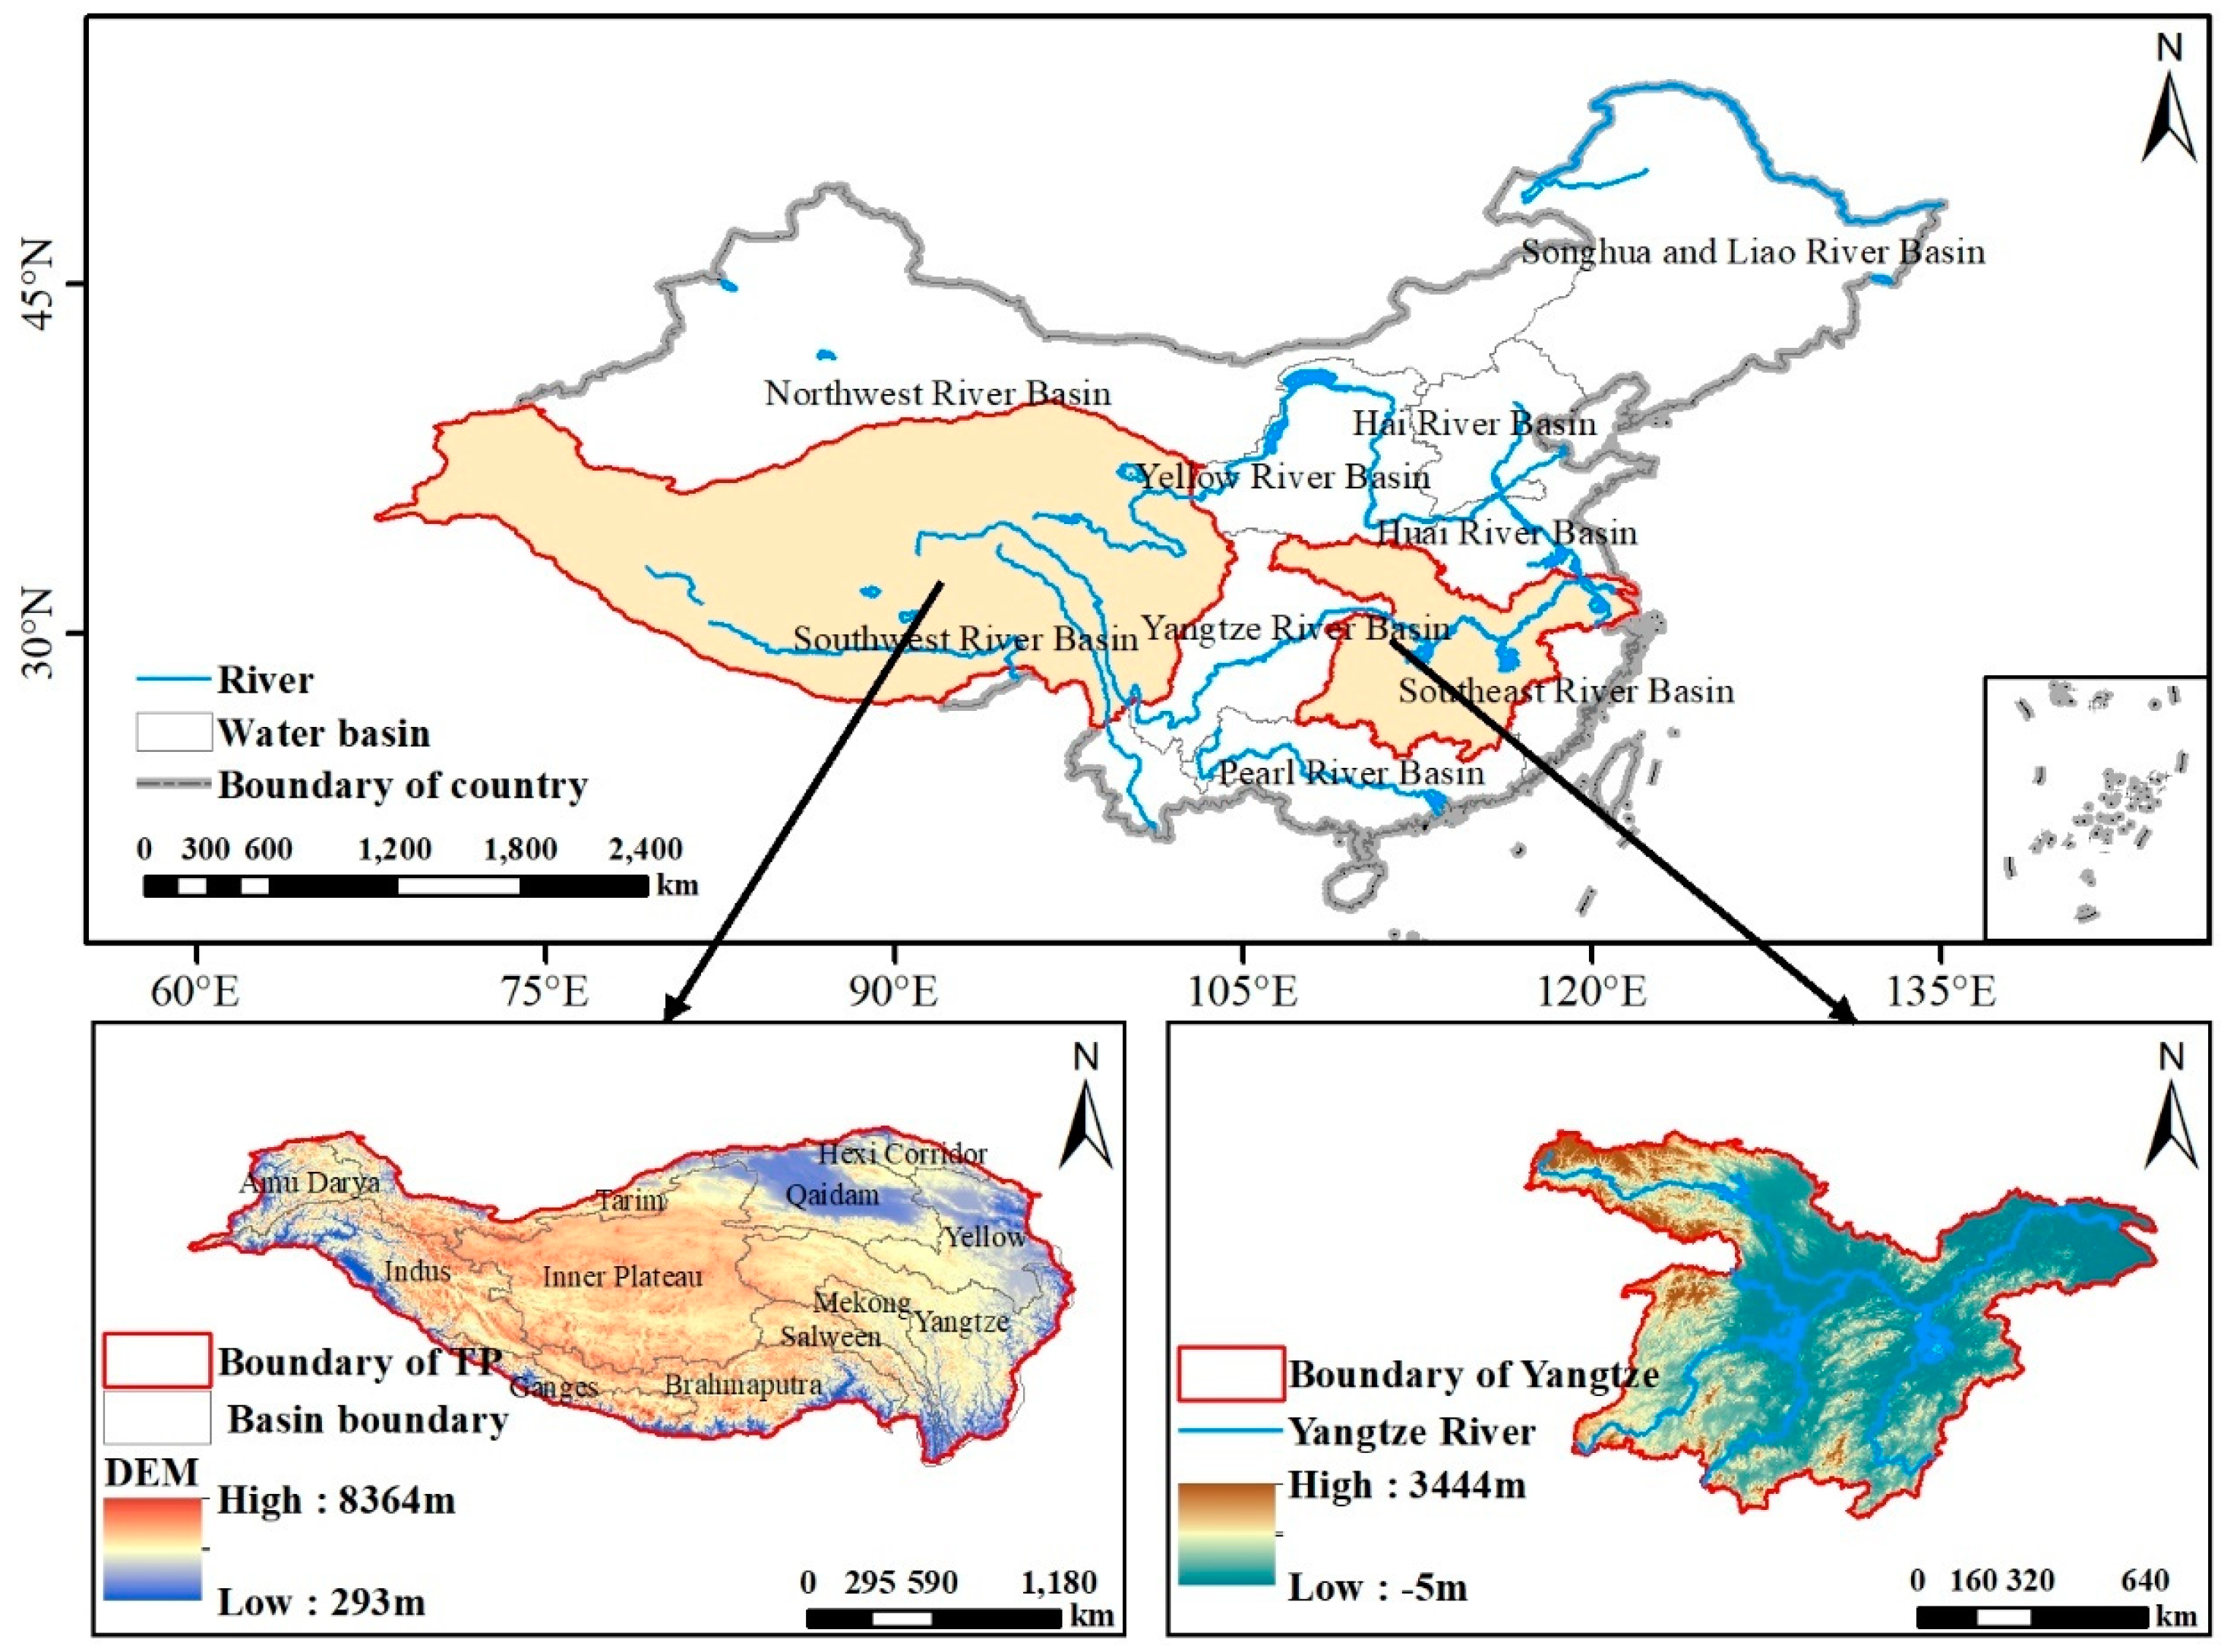
2. Study Regions and Data Acquisition
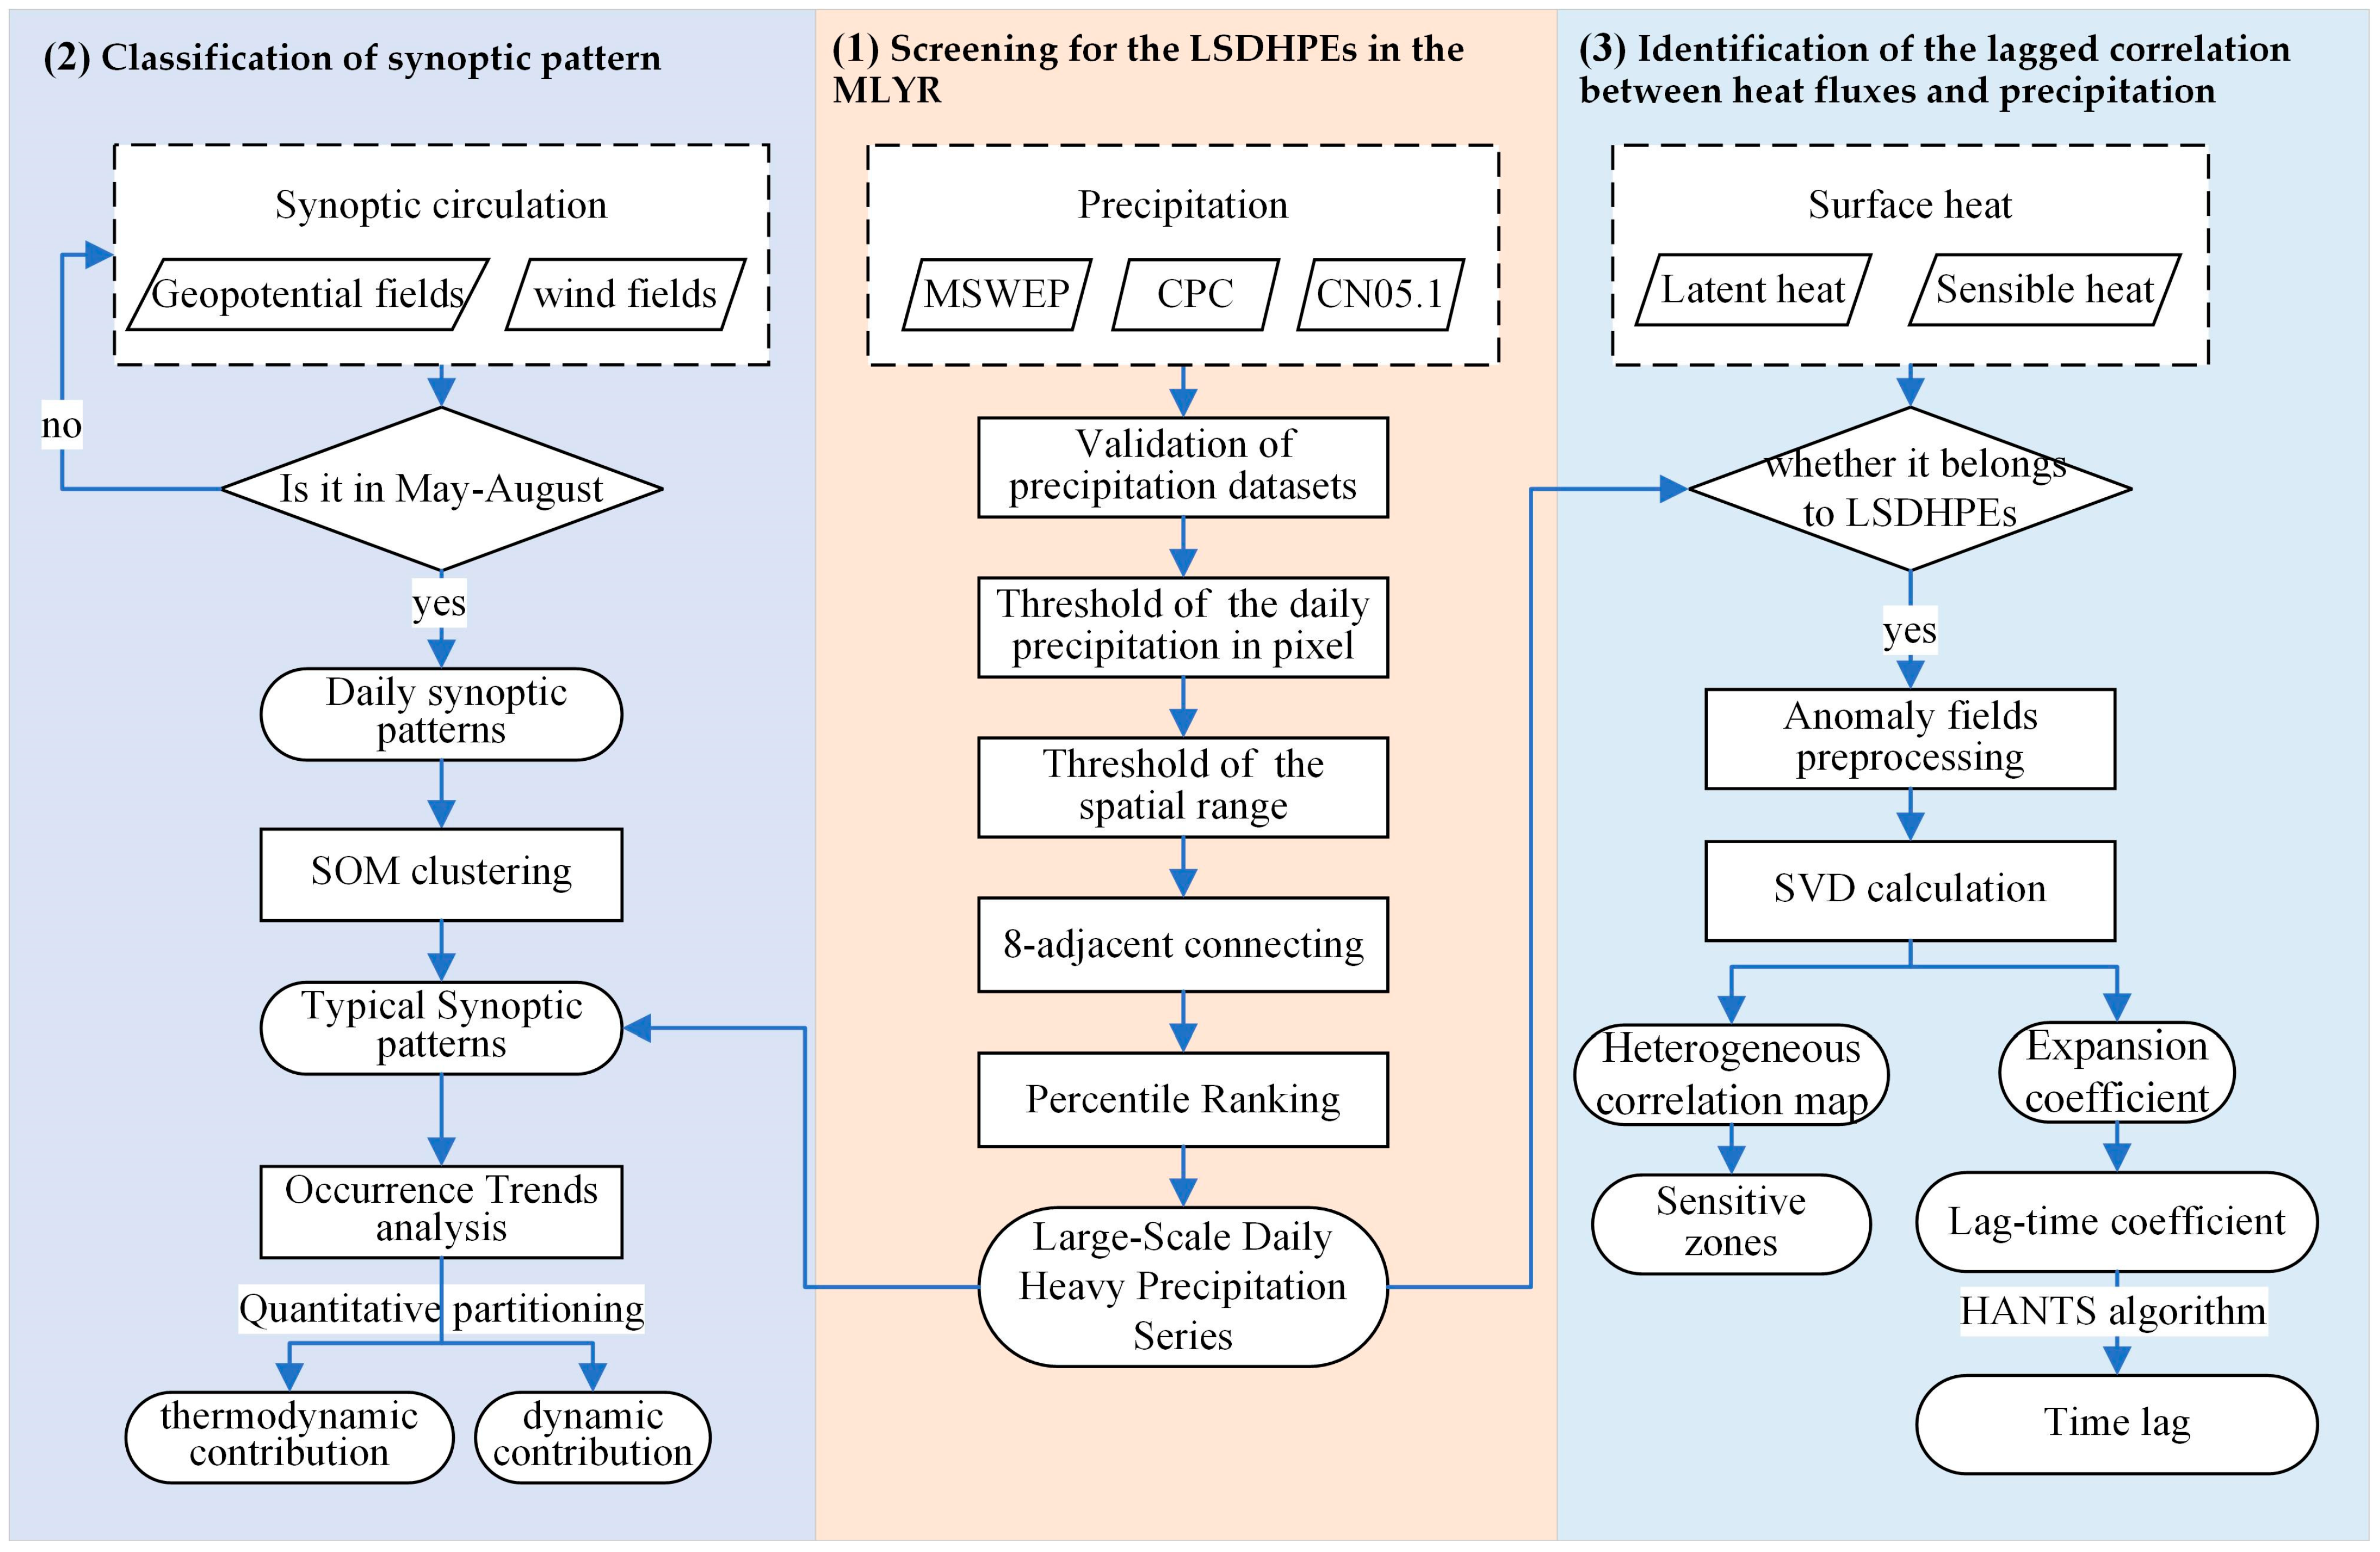
The study regions were the TP and MLYR in China (Figure 1) during the period from 1980 to 2022. The boundary of the MLYR was obtained from the National Earth System Science Data Center, with a specific range of 106–122°E, 24–36°N. This study used the TP boundary proposed by Zhang Yili in 2021, with a specific range of 25°59′30″–40°1′0″N, 67°40′37″–104°40′57″E.
To accurately screen heavy precipitation events in the MLYR, three precipitation datasets were used: daily Multi-Source Weighted-Ensemble Precipitation (MSWEP V2.2) data at a spatial resolution of 0.1° × 0.1°, Climate Prediction Center (CPC) global precipitation data released by the National Oceanic and Atmospheric Administration at a spatial resolution of 0.5° × 0.5°, and the CN05.1 daily precipitation dataset, which employs an anomaly approach to process observed data from 2400 stations in China at a resolution of 0.25° × 0.25° [42]. Furthermore, daily geopotential height fields, u wind fields, and v wind fields at 500 hPa from ERA5-Land reanalysis data were used to examine the mesoscale generation mechanisms of LSDHPEs. SH and latent heat (LH) flux data were collected from ERA5 daily datasets.

3. Methodologies

To reach the objectives of this research, the following methodologies were employed: (1) screening for the LSDHPEs in the MLYR, that is, selecting the LSDHPEs from daily precipitation series from 1980 to 2022; (2) classification of synoptic patterns, that is, clustering the synoptic patterns from plum rain period (from May to August), finding the typical synoptic patterns leading to the LSDHPEs, and analyzing the synoptic pattern trends; (3) identification of the lagged correlation between heat fluxes and precipitation to calculate the spatial correlation between the precipitation anomaly fields of the LSDHPEs and the heat anomaly fields of the TP at different lead times and determining the lag times and sensitive areas in which the correlation coefficients are at high values. An overview of the study framework is provided in Figure 2. The terms in Figure 2 are organized from left to right as steps 2, 1, and 3.

3.1. Screening for the LSDHPEs in the MLYR

By comparing of the accuracy of three rainfall products, the one with the highest accuracy was selected to identify regional heavy precipitation events. LSDHPEs were derived by defining extreme hourly precipitation events [43] with some modifications. First, the number of pixels in the MLYR with precipitation exceeding 50 mm·d−1 were counted. Second, using the eight-connected-domain method in graph theory, areas of heavy rainfall were identified, and their areas were calculated; the pixels connected and the precipitation exceeding 50 mm were recognized as a daily heavy precipitation events (DHPEs). A DHPE must satisfy the spatial range and precipitation intensity thresholds to be classified as an LSDHPE. The 75th percentile of the DHPE area is the first-range threshold. Given that two recognized DHPEs may be spatially disjointed yet in proximity, the second regional threshold was the 85th percentile of the sequence of daily heavy precipitation grid point counts. Finally, once the daily precipitation reached either of the two thresholds, an LSDHPE was considered to occur.

3.2. Classification of Synoptic Patterns

LSDHPE circulation patterns are classified using the SOM cluster analysis method. As an unsupervised clustering method proposed by Kohonen [44], the SOM captures more robust and distinctive topology information compared to traditional clustering methods (such as k-means and Ward’s method) [45] and has been widely applied in atmospheric and meteorological sciences [46,47]. In the MLYR, LSDHPEs are concentrated from May to August (Figure 3b). Incorporating the weather system development process into the classification samples indirectly adds time weights to typical weather events, improving the representativeness of the classification results. Therefore, continuous daily weather from May to August is more reasonable for clustering than LSDHPE weather. Consequently, daily geopotential height anomaly fields, u wind anomaly fields, and v wind anomaly fields from May to August at 500 hPa during 1980–2022 were used as inputs for the SOM to categorize weather regimes over the TP and the MLYR. Using two criteria from previous studies to quantify the accuracy of the SOM node numbers [48,49], we determined the optimal number of nodes to be 6 (Figure A2 in the Appendix A). All input data were standardized to eliminate the influence of time trends and various magnitudes of values for each parameter.
Under the background of global warming, dynamic and thermodynamic changes are closely associated with extreme events [1,50]. Referring to the methods used by Cassano et al. [51] to assess thermodynamic- and circulation-related changes in precipitation events, the line trends (d · y−1 y−1) of annual occurrence values of LSDHPEs in each SOM pattern were calculated. The equation was used to partition the contributions of thermodynamic and dynamic changes to the LSDHPE trend [49,51].
d E d t = i = 1 K ( f i ¯ d E i d t + E i ¯ d f i d t + d ( E i f i ) d t )
where E represents the frequency of LSDHPE occurrences; f i represents the frequency of the pattern i occurrences; K indicates the total number of SOM nodes; f ¯ i and E ¯ i indicate the mean values of E i and f i , respectively; and E i and f i indicate the deviation values of E i and f i , respectively. The terms on the right-hand side of the equation indicate, from left to right, the thermodynamic, dynamic and interaction contributions. Thermodynamic contributions are associated with circulation-related influences, such as radiation, green gas, and surface fluxes. Dynamic contribution refers to the influence of circulation, and interaction contribution represents the dynamic changes acting on thermodynamic changes, for example, the effect of surface-air interactions on the thermal conditions (soil heat flux) of the land surface [49].

3.3. Identifying the Lagged Correlation between Heat Fluxes and Precipitation

This study used a combination of singular value decomposition (SVD) and HANTS to identify lag correlations between the surface heat over the TP and precipitation in the MLYR. SVD is commonly used to determine the correlation between two meteorological fields [52,53,54]. This method allows the weather field to be divided into multiple linear combinations (also known as modes), with the new variables of these linear combinations being pairwise correlated [55]. The heterogeneous correlation map is an output of SVD that depicts the correlation between the grid pixel values in the k-th mode of one variable and k-th time coefficient series of another variable. In this study, precipitation and surface heat anomalies were normalized and weighted using the cosine of latitude in advance. Using all surface heat flux and precipitation anomaly fields corresponding to LSDHPEs as SVD inputs, we calculated the correlation coefficients (CCs) of the expansion coefficients of the two variables in the first mode (which had the largest covariance and was tested by the Monte Carlo method) [53]. Key zones can be selected from the pixels that pass significance tests and have high correlation values in heterogeneous maps.
Considering the time lag between heat flux and precipitation events, SVD calculations were performed on the rainfall fields corresponding to LSDHPEs and the heat fields of the preceding k-th day (with k ranging from 0 to 366). The resulting sequence of CCs served as the input for the HANTS calculation. Referring to the previous literature on parameter values in the HANTS algorithm [56,57], the smoothed curves obtained after excluding outliers can be used to identify the lag time corresponding to the interval with the maximum correlation between the heat flux field over the TP and the precipitation field in the MLYR.

4. Results

4.1. Features of Precipitation and LSDHPEs in the MLYR

Figure 3 shows the temporal distribution of the LSDHPEs selected from the three datasets in the MLYR during 1980–2022 and the spatial distribution of precipitation derived from the CN05.1 dataset. When comparing the distribution of LSDHPEs across the three precipitation datasets, the ability to identify LSDHPEs was closely related to the spatial resolution of the datasets (Figure 3a). Before 2016, a high spatial resolution corresponded to many LSDHPEs. The ranking of the LSDHPEs was MSWEP > CN05.1 > CPC. After 2016, this phenomenon was alleviated and the difference in LSDHPE amounts was reduced owing to improvements in the number and spatial coverage of surface stations [58]. The common denominator for the LSDHPEs of the three products was more than 60% of the total LSDHPEs in the MLYR occurred in June and July (Figure 3b).
The accuracies of the three precipitation datasets were evaluated using daily precipitation observations from surface stations in the MLYR (Figure A1 in the Appendix A). Notably, CN05.1 performed better than the others, capturing spatiotemporal features consistent with those of the other two datasets, MSWEP and CPC, indicating its robustness. Overall, the frequency and intensity of precipitation in the MLYR were high in the southeast and low in the northwest (Figure 3c); the high-value areas were located on the eastern border. The frequency of heavy precipitation events exhibited a similar distribution (Figure 3d). Moreover, the magnitude of precipitation was higher at lower latitudes than those at higher latitudes. In total, 577 LSDHPEs presented in CN05.1 were selected for further analysis.
Figure 3. (a,b) Temporal distribution of LSDHPEs selected from MSWEP, CPC, and CN05.1 in MLYR. (c) The average annual precipitation of MLYR from CN05.1 during 1980–2022. (d) Spatial distribution of heavy precipitation events selected from CN05.1 in MLYR.
Remotesensing 16 03779 g003

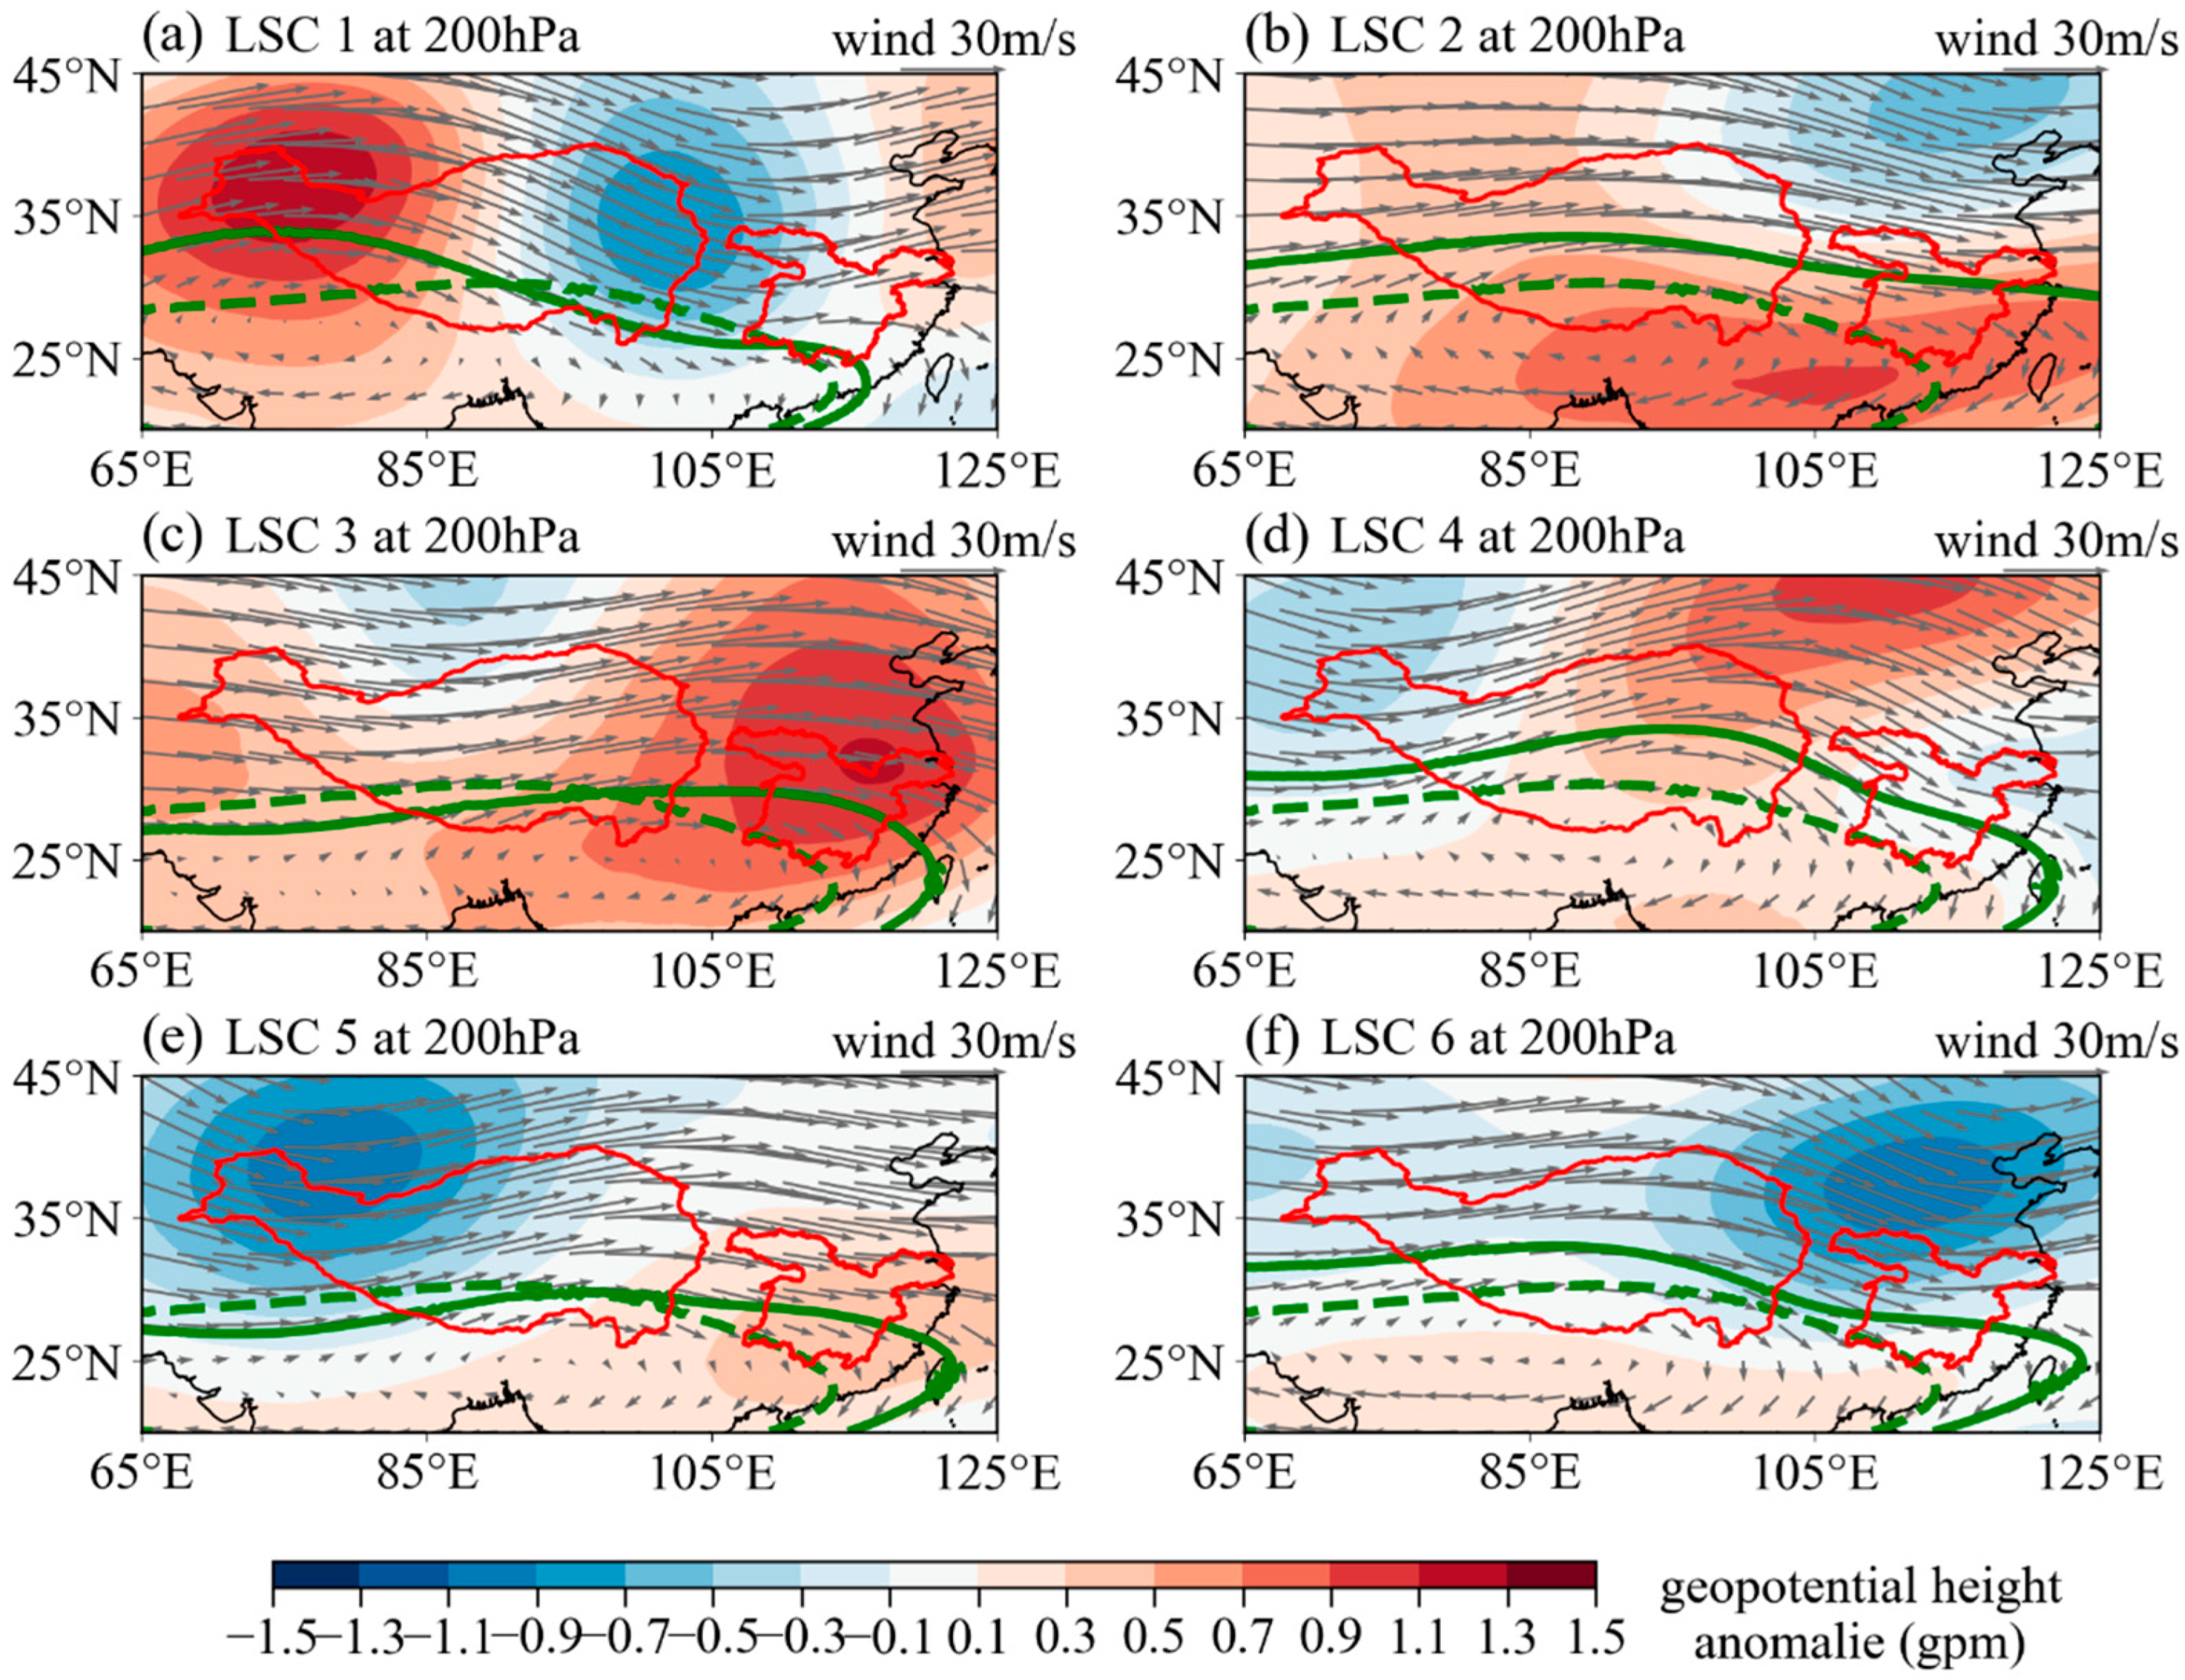
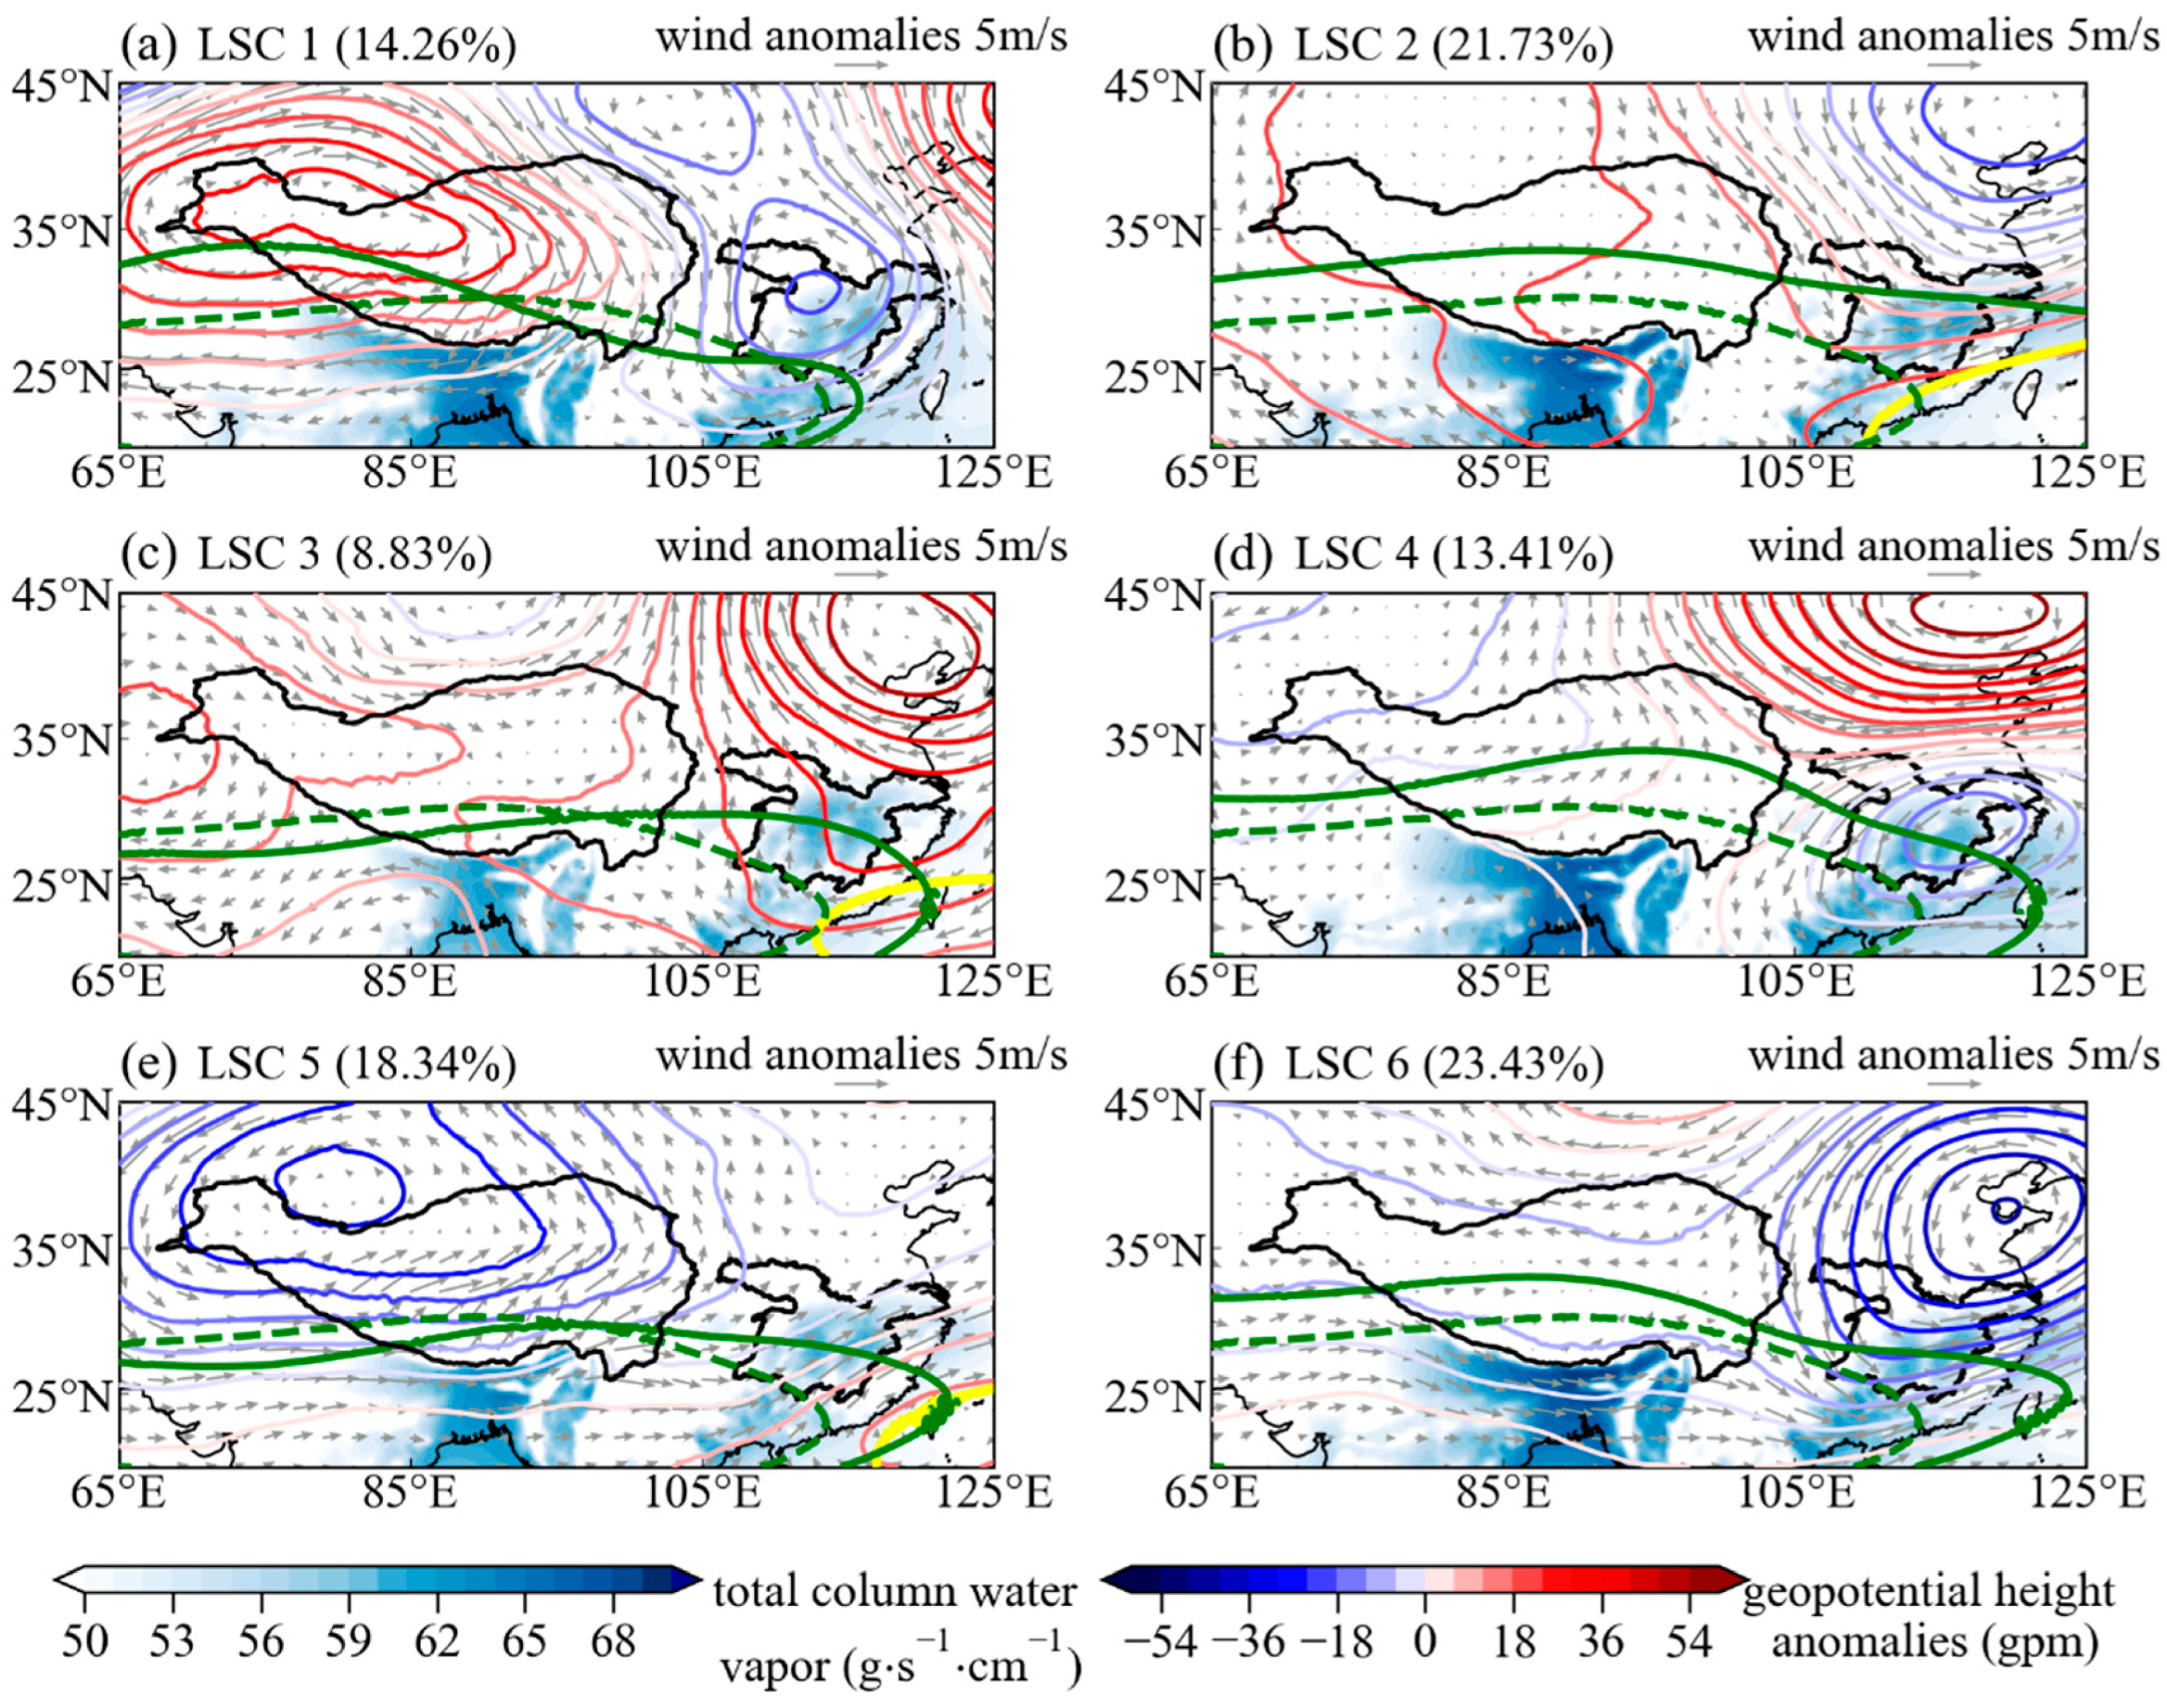
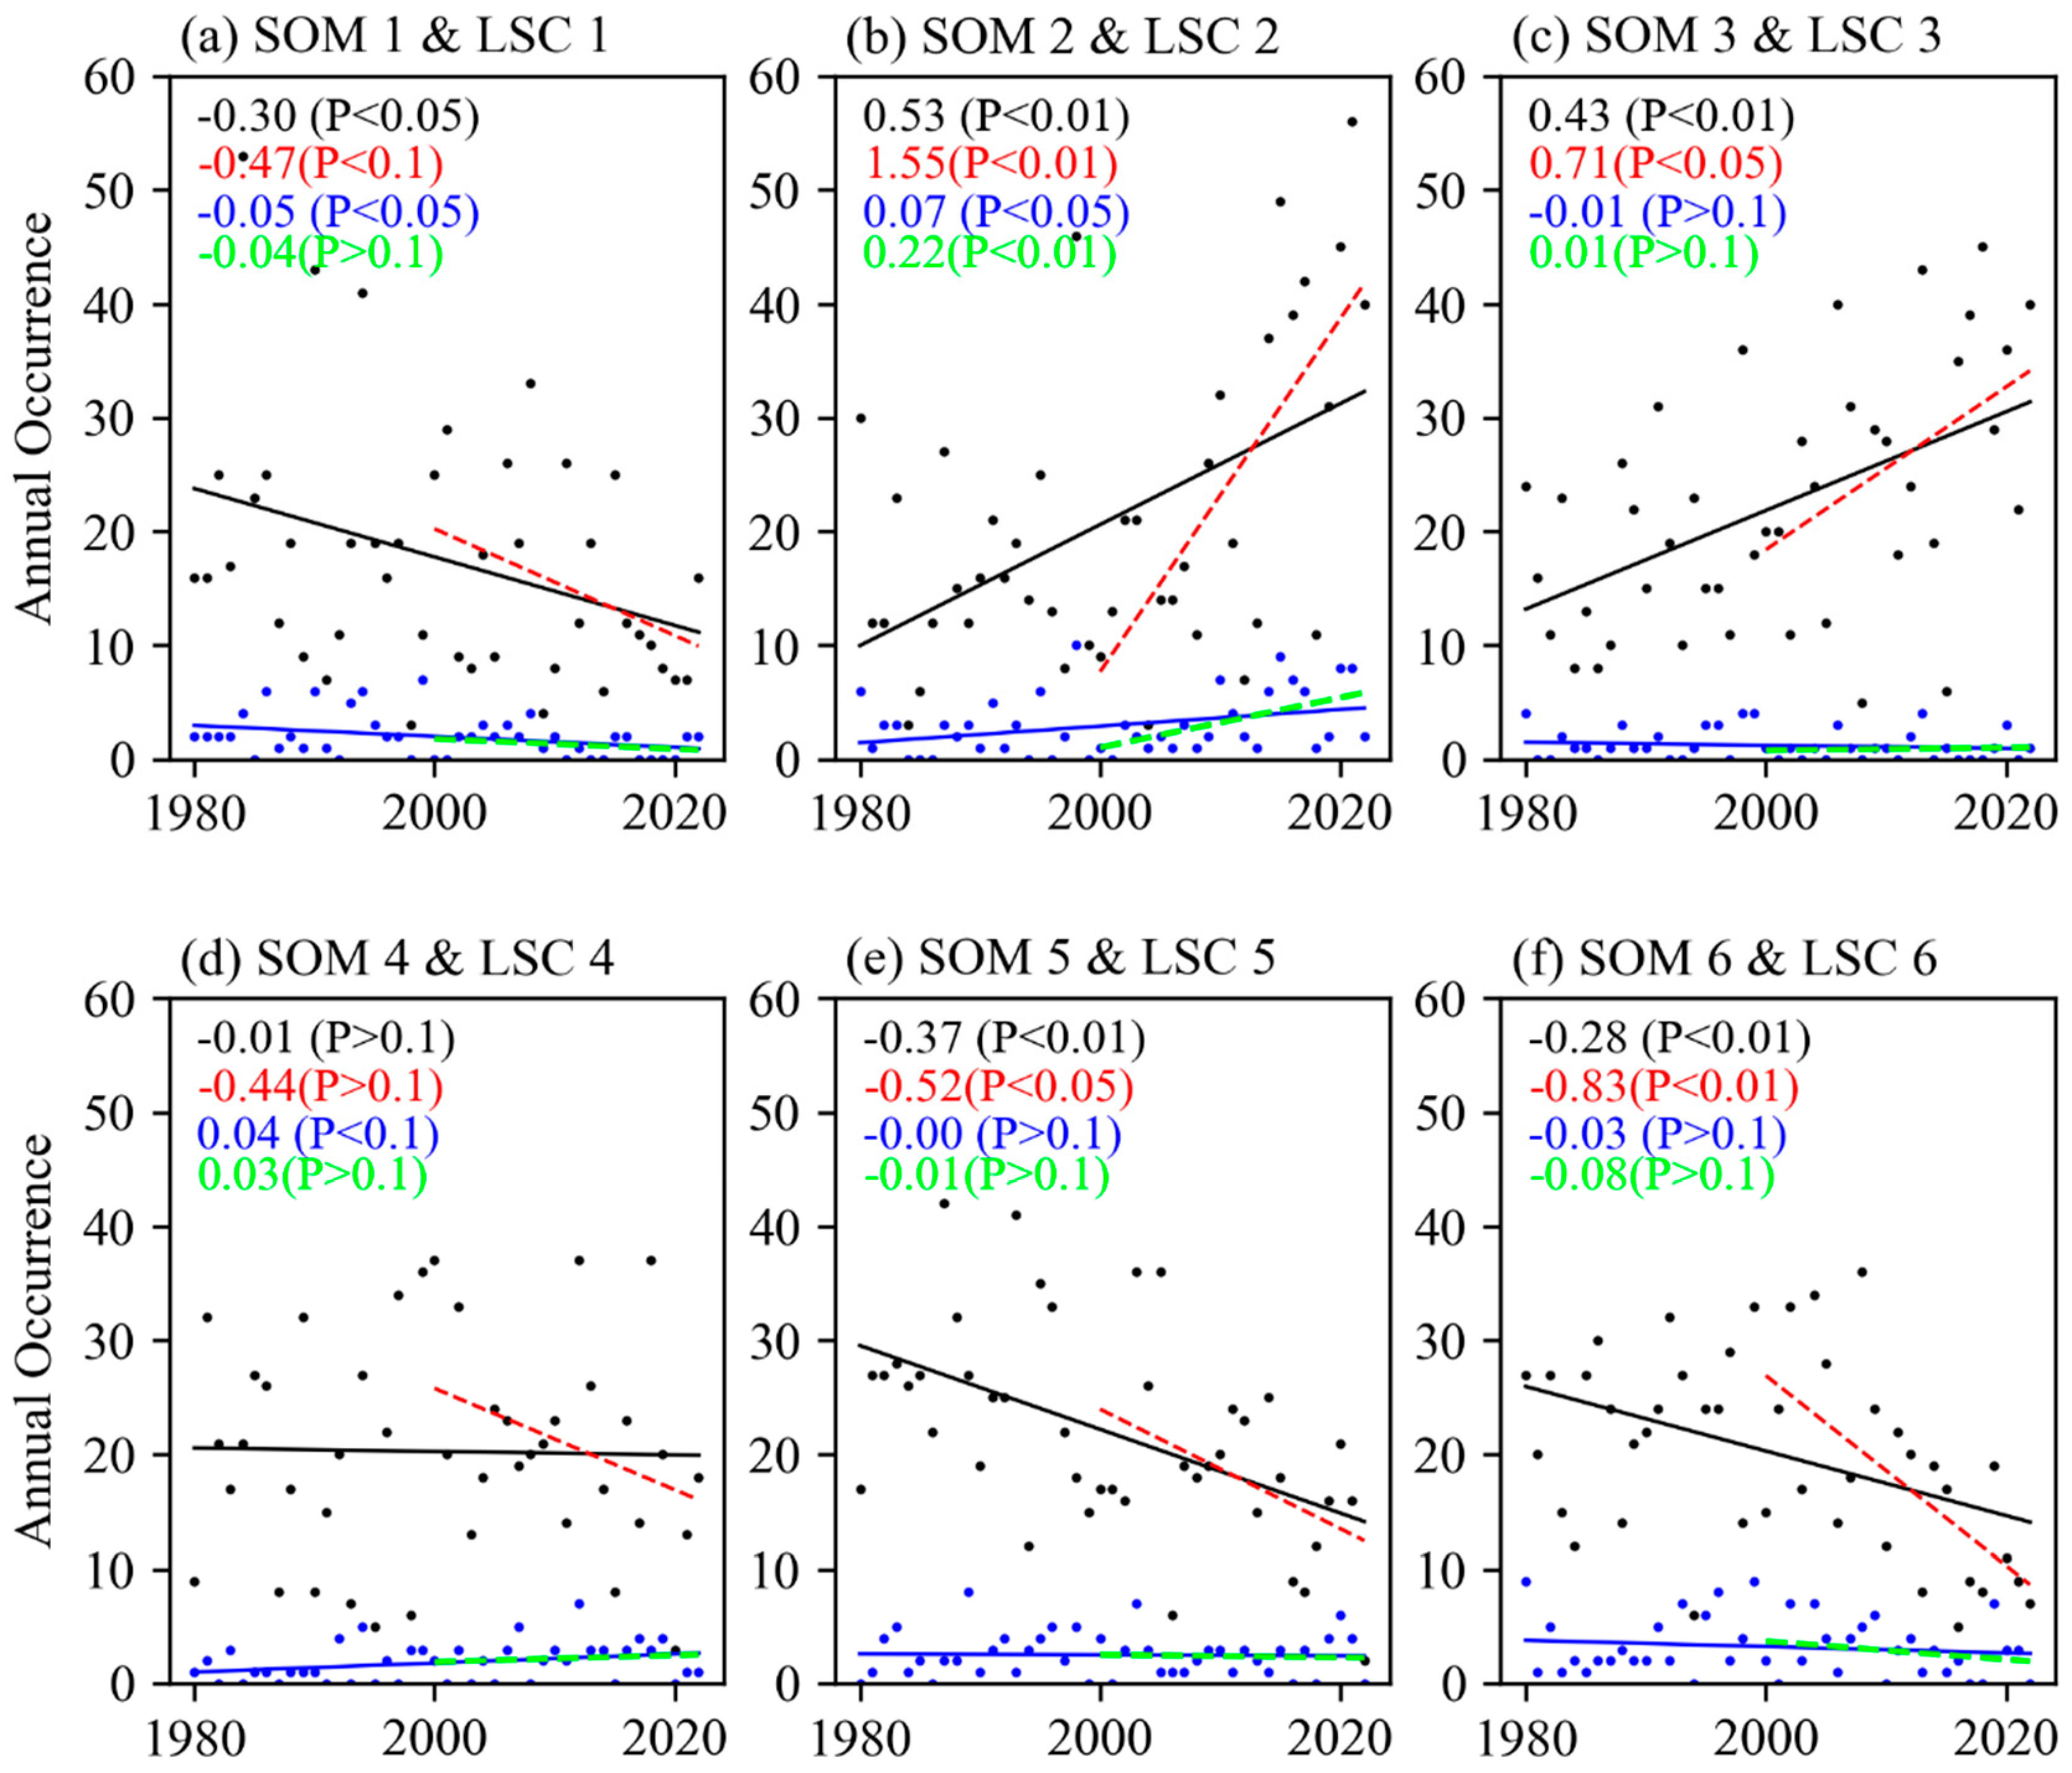
4.2. Typical Synoptic Pattern of LSDHPEs in the MLYR

The synoptic anomalous patterns classified by the SOM are presented in Figure 4. Overall, the synoptic patterns from May to August of 1980–2022 were categorized into six clusters based on the location of high (low) pressure anomaly systems and vortex anomalies. Notably, geopotential height anomalies were calculated considering the 1981–2022 period as the climatological mean benchmark and then normalized.
The first SOM pattern (SOM 1) exhibited a typical anomalously high–low–high pattern (Figure 4a), with a north–south-oriented trough extending from the center of the MLYR and an east–west-oriented high-pressure ridge developing from the TP center. The strong anticyclonic anomaly in the west triggered northeasterly wind convergence at the eastern margin of the TP. In the synoptic patterns described in SOM 2 (Figure 4b), the high-pressure anomaly system strongly affected the TP and MLYR, with a low-pressure system over the northeast. This scheme was affected by a strong eastward-extended SAH at 200 hPa and a westward-extended WNPSH at 500 hPa. Additionally, the MLYR lies in the junction area between the cyclone and anticyclone, with dense isobars and westerly winds. SOM 3 represents a single east-high pattern over the MLYR, with a distinct westward-extended WNPSH and a slight eastward-extended SAH. Moreover, the commonality between SOM 3 and 4 is that the wind is easterly in the MLYR. The synoptic pattern of SOM 4 displayed a configuration opposite that of SOM 2. SOM 5 and 6 were affected by typical cyclone anomalies. SOM 5 was affected by a cyclone anomaly over the TP and an anticyclone in the southeastern portion of the study area, associated with a strong southwesterly airflow anomaly at the border of the TP and the MLYR. Furthermore, SOM 6 was controlled by a low-pressure anomaly system with a deep trough extending along an east–west axis from the MLYR to the TP, leading to airflow convergence south of the MLYR. The wind field represents the direction of water vapor movement. Overall, the main sources of water vapor for the MLYR were the South China Sea, East China Sea, and Bay of Bengal, consistent with the results of previous studies [9,30,59].
To further analyze the circulation pattern of heavy precipitation events, the composite mean synoptic fields of the LSDHPEs in each SOM Cluster (hereafter, LSC) are depicted in Figure 5. LSC 1(Figure 5a) accounted for 14.26% of the LSDHPEs. In addition to an additional north–south trough in the MLYR, the synoptic schemes of LSC 1 and SOM 1 were similar. Compared with SOM 1, the position of the SAH in LSC 1 has a significant eastward shift, which coincided with its position in the climatology of 1980–2022. The total column water vapor was concentrated in the eastern part of the MLYR, along with the anomalous cyclone. Furthermore, a mass of anomalous water vapor shifting in a northeasterly direction occurred behind a low-pressure trough in the lower troposphere above the MLYR (Figure A3 in the Appendix A). LSC 2 had the second-high frequency of LSDHPEs (21.73%). Its circulation pattern (Figure 5b) highlighted the south-high system and a deep trough of anomalously low pressure propagating from north to south in the MLYR. Moisture convergence and strong eastward water vapor were observed over the MLYR. In LSC 3 (Figure 5c), the eastern region was controlled by two anomalous high-pressure systems and an anomalous anticyclone located north of the MLYR, leading to a southerly anomalous wind. With the lowest frequency of LSDHPEs (8.83%), the water vapor in LSC 3 originated from the South China Sea and East China Sea. Moreover, the mean convective potential energy values in the MLYR were the lowest among all the patterns (Figure 6). Compared with SOM 4, the anticyclonic center above the MLYR in LSC 4 (Figure 5d) exhibited a significant westward shift. In addition to the joint influence of the WNPSH and SAH, the cyclone over the TP evoked the northerly wind blowing over the eastern margin in LSC 5, jointly leading to a reduction in the intensity and extension of positive precipitation anomalies in the MLYR (Figure 5e). Bearing the highest frequency among the LSDHPEs (23.43%), the circulation pattern of LSC 6 was consistent with that of SOM 6. Under the influence of a strong cyclone, westerly winds from the Bay of Bengal and India converged with northerly winds from North China. It blew over the MLYR, resulting in large amounts of water vapor southeast of the MLYR.
To determine the potential linkages between flux variation over the TP and precipitation in the MLYR, LSCs 1, 2, 5, and 6 were selected as the core representative types from the six patterns, based on their occurrence frequency. The typical synoptic pattern accounted for 65.42% of the daily circulation from May to August during 1980–2022 (Figure 4) and 77.76% of the LSDHPEs (Figure 5). All six synoptic patterns represented profound weather systems, with the distribution of geopotential height anomalies from the 850 hPa (Figure A4 in the Appendix A) to the 200 hPa (Figure A5 in the Appendix A).
Heavy precipitation events are often associated with high atmospheric Convective Available Potential Energy (CAPE), wind shear, and water vapor accumulation. As seen in the total water vapor distribution in Figure 5, the MLYR had high water vapor values. Combined with the distribution of air temperature at 500 hPa, wind fields, and the CAPE distribution in Figure 6, the water vapor in the MLYR was carried by westerly winds originating from the Bay of Bengal and the Arabian Sea. When these winds encountered the topography along the southern edge of the TP, they were blocked and diverted eastward, eventually reaching the MLYR. Additionally, a relatively high-temperature area extended from the east to southwest of the MLYR influenced by the temperature in the middle and lower troposphere (Figure A4 in the Appendix A). Influenced by temperature troughs, the abundant water vapor and high CAPE in the MLYR could trigger intense convective activity, making this region prone to heavy precipitation.
Figure 7 shows the linear trends in the annual occurrence of each SOM and LSC pattern. The significance of trends was evaluated using a t-test. SOM patterns 2 and 3 showed significantly increasing trends during 1980–2022, whereas the other SOM patterns showed decreasing or non-significant trends in annual occurrence. SOM 2 and LSC 2 notably showed significant and stable upward trends over the last 22 years. The comparison in Figure 5b shows that the synoptic pattern of LSC 2 is dominated by the synaptic forcing of the SAH and WNPSH, which account for 21.73% of LSDHPEs. As shown in Figure 7, LSDHPEs show a prominent decreasing trend in LSCs 1, 5, and 6, whereas a notable increasing trend is observed in LSCs 2 and 3. In LSC 1, 5, and 6 patterns, the SAH reached and covered the MLYR, whereas the WNPSH was not observed in the MLYR or nearby areas. However, in LSCs 2 and 3, the WNPSH was located in the coastal region near the MLYR. This indicated that the influence of WNPSH on the LSDHPEs in the MLYR gradually increased and the influence of SAH gradually decreased.
Table 1 shows that the total trend of LSDHPEs in the MLYR increased and was dominated by circulation pattern 2 (266.63%). Based on the explanation of the three contributions by Daniel [49], the increase has resulted from thermodynamic (36.34%) and dynamic changes (37.27%). In patterns 5 and 6, the occurrence of the LSDHPEs displayed a decreasing trend (−0.006 d · y−1 y−1 and 0.008 d · y−1 y−1, respectively), and the dynamic contribution motivated the decrease. For all the SOM patterns, the interaction change term (0.009) controlled for the total trend of LSDHPEs occurrence.

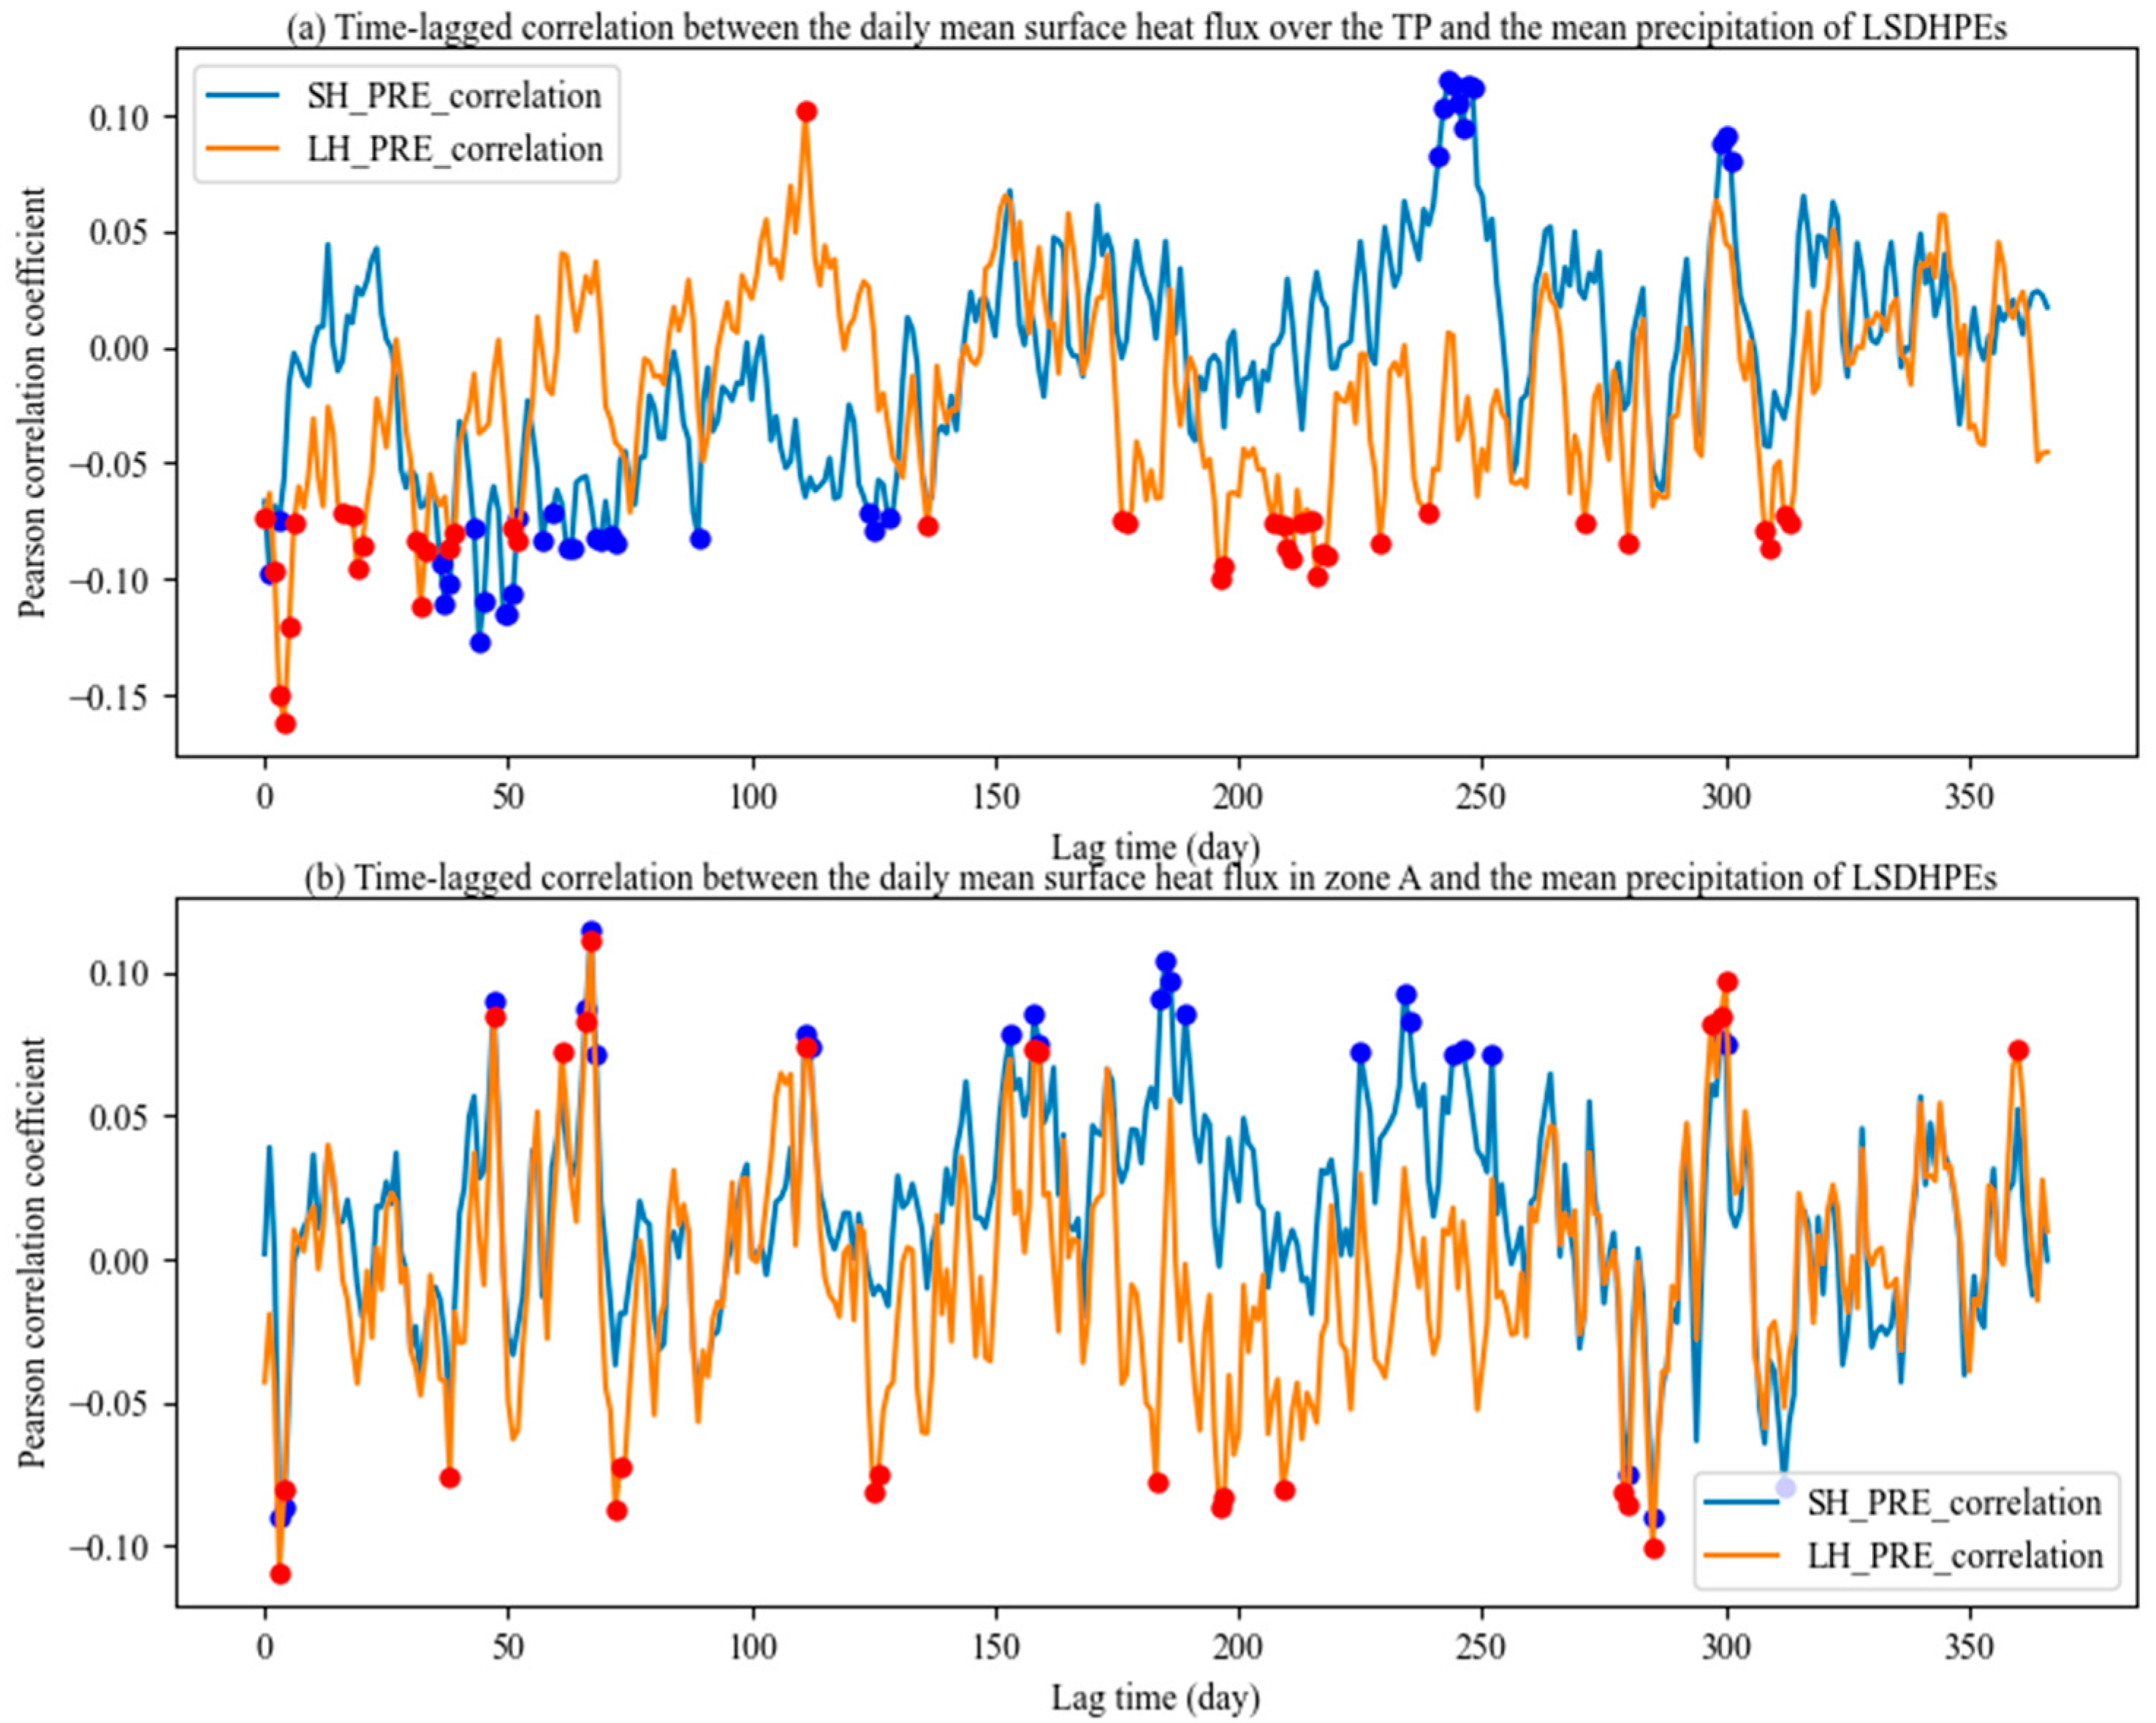
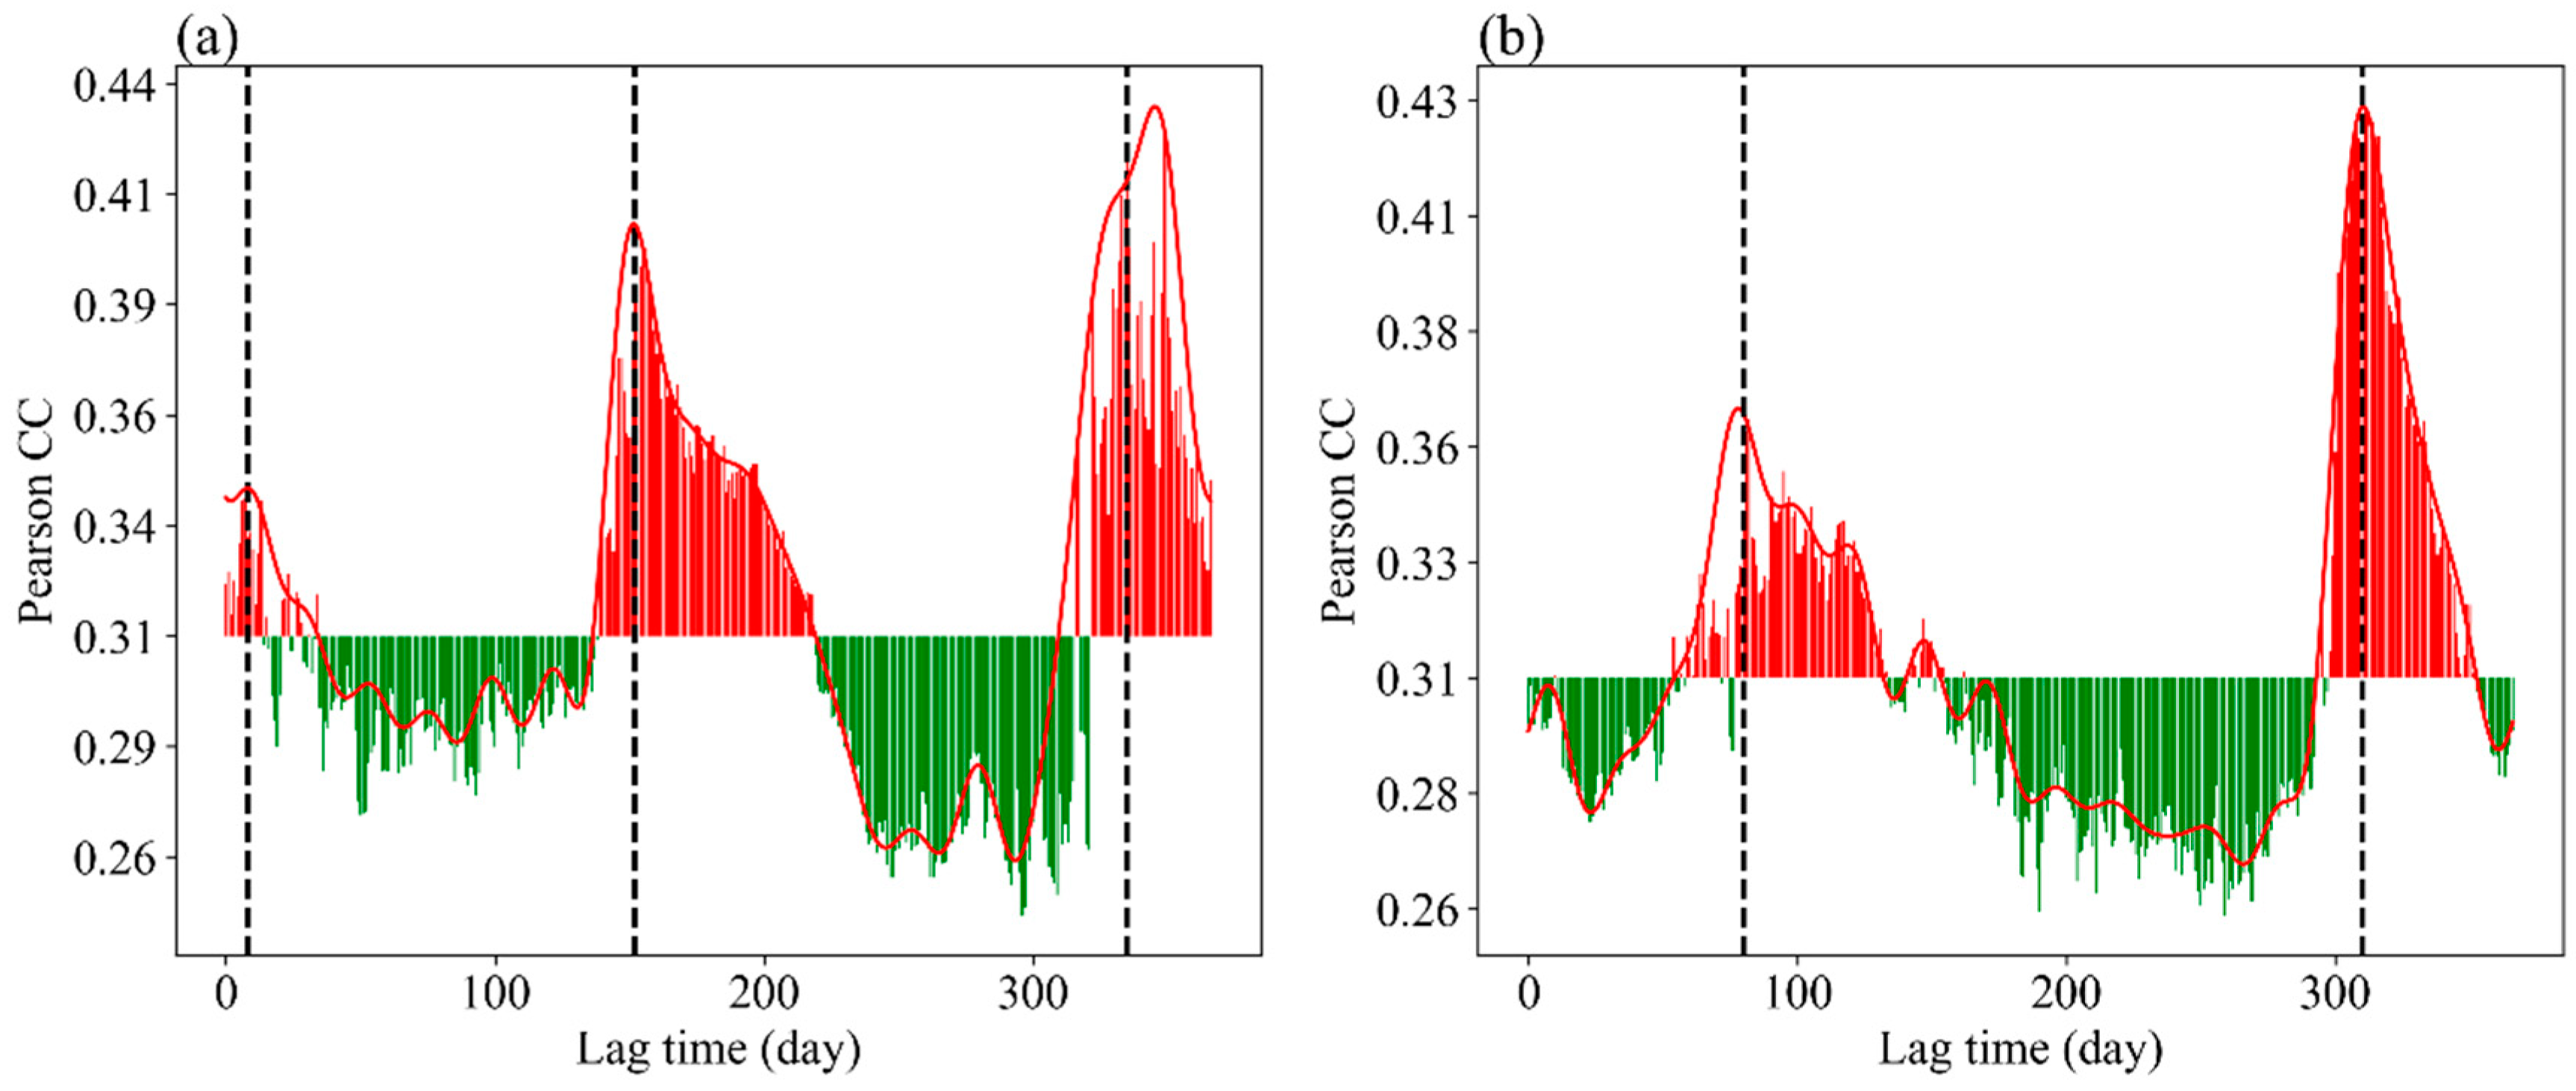
4.3. Time-Lagged Effect of TP Anomalous Surface Heat Flux on LSDHPEs

As shown in Figure 8a, the time-lagged CC curves between the anomalous LH and precipitation of the LSDHPEs exhibit three distinct peaks. The peak values of time-lagged CCs ranged from 0 to 10 d (mean value of 0.3178), 130 to 200 d (mean value of 0.352), and 330 to 365 d (mean value of 0.368). In contrast, the time-lagged CC curves between the anomalous SH and anomalous precipitation of the LSDHPEs showed two peaks, with the peak ranges varying between 60 and 135 d (mean value of 0.327) and 300 and 350 d (mean value of 0.371).
The first peak in Figure 8a (the lag time range of 0–10 d, and maximum CC value of 0.34) corroborates the previous research findings of Dong [10], indicating that the anomalous LH over the southeastern margin of the TP can be a strong signal of precipitation in the MLYR and has a 3–5 d lead-time before the plum rain period(known as the Mei-yu period in China). In addition, the second peak range was roughly equal to 4–6 months, which may have resulted from the teleconnection between winter snow cover on the TP and summer rainfall in the MLYR [39].
In addition, the first peak (60–135 d) in Figure 8b corroborates previous research findings, indicating that variations in springtime SH over the TP can influence precipitation patterns in eastern China. Previous studies ascribed this lag effect to soil moisture dynamics [6]. The last peak in Figure 8a,b, which has exceeded 10 months to almost a year, is likely to be interpreted as an effect of the interannual variability of large-scale circulation systems, for example, El Niño-Southern Oscillation and summer monsoon [60,61,62].
To further identify the key zone of surface heat flux over the TP, the spatial distribution of the heterogeneous CC between the first mode of the anomalous heat flux and anomalous precipitation at the first peak is presented in Figure 9. The time corresponding to the first maximum peak in Figure 8 was selected. Specifically, the lag time is 90 d for SH and 7 d for LH. The heterogeneous CC between the anomalous LH and anomalous precipitation of the LSDHPEs was significantly negative at the eastern margin of the TP (Figure 9a). The heterogeneous CC between the anomalous SH and anomalous precipitation of the LSDHPEs was significantly negative west of the TP, whereas it was significantly positive in the center of the TP (Figure 9c). In addition, the sensitive areas of SH and LH in the MLYR were essentially the same (Figure 9b,d). The results indicate that when the anomalous LH decreases in the center and east of the TP and increases in the western regions, the anomalous precipitation manifests as a decrease over the northwestern and southeastern parts of the MLYR, with a time lag of 7 d (as seen in Figure 9a,b). When the anomalous SH increased in the center of the TP, the anomalous precipitation increased over the northwestern and southeastern parts of the MLYR, with a time lag of 90 d (Figure 9c,d). The distribution of the heterogeneous CC on the TP, as shown in the statistical histograms of Figure 9a,c, was almost evenly split between the positive and negative values. However, in the MLYR, the CC values exhibited a completely different distribution, being either positive or negative.

5. Discussion

This study investigates the correlation between surface heat fluxes over the TP and daily heavy precipitation events in the MLYR, revealing the synoptic patterns associated with LSDHPEs and the time-lagged relationship between heat fluxes on the TP and LSDHPEs. The data used in the study are publicly available remote sensing and reanalysis data, characterized by wide coverage, continuous observation, and high resolution. This remote sensing-based approach can be applied not only to the attribution analysis of precipitation events but also to studying the relationship between extreme events, such as heatwaves and compound droughts, and the TP. Furthermore, the study region is not limited to the TP and Yangtze River basin and can be extended to eastern China and even further regions.
Previous studies have contended that TP thermal forcing, specifically diabatic heating anomalies, showed a vital impact on the Asian summer monsoon and summer precipitation in Eastern China [6,15,16,31]. Our study investigated the time-lagged effects of the LH and SH anomalies over TP on precipitation anomalies in the MLYR from May to August from 1980 to 2022. We observed that SH exhibited a more positive correlation with precipitation than LH (Figure 9). The main reason for this difference may be the composition of diabatic heating during the development of the TP vortex [32,63]. Dong [64] noted that the TP vortex, which moved off the eastern slope of the TP and brought abundant water vapor to East China, was mainly affected by the SH during the developing stage. Once it leaves the TP, the apparent heat source of the atmosphere, sourced from condensation, will be beneficial to the eastward movement of the TP vortex [65].
Mesoscale air masses or weather systems, such as vortices, typically travel from the TP to the MLYR within approximately 3–5 d [22,66]. However, our lag-correlation analysis revealed a notably high CC between the anomalous adiabatic heating over the plateau and precipitation in the MLYR after 3 months (Figure 8). Delayed teleconnection could be explained by the memory of subsurface soil temperature and soil moisture over the TP [31]. These diabatic heating anomalies persist in deep soil layers for several months, altering the land-atmosphere thermal contrast, which in turn influences the planetary atmosphere, and triggering mesoscale waves to generate precipitation anomalies [6,7].
To identify the sensitivity areas over the TP for forecasting precipitation events in the MLYR, the dynamic and thermodynamic characteristics of the land-atmosphere interactions over the TP have been investigated. Topographic heating in the Himalayas [67] and the convection of air masses [68] in the central and eastern parts of the TP are considered precursor signals for anomalous precipitation in the MLYR. The latter is located on the water vapor transport path and is in line with the southwesterly moving monsoon flows over the MLYR [69,70]. Moreover, Dong [10] depicted the southeastern TP as the sensitivity area, in which the average MLYR precipitation in July from 1979 to 2014 was significantly negatively correlated with the regional latent heat fluxes over the TP. However, this study was not adopted this definition because it ignores the time lag between TP heat fluxes and MLYR precipitation. In addition, the lagged CCs of the mean heat flux in the sensitive area and the MLYR mean precipitation did not outperform the results of the mean TP heat flux and the MLYR mean precipitation (Figure A6 in the Appendix A). The interpretation of Figure 9 leads to the conclusion that SH affects atmospheric circulation, promoting the development of convective cloud activity over the TP. This, in turn, enhances westerly belt long waves and causes vortex systems to shift from the plateau to eastern or northern China.
A limitation of this study is that only two variables, the surface heat flux and the daily precipitation, were used to establish a linkage between the land–atmosphere interactions over the TP and the heavy precipitation events in the MLYR. Actually, various other variables could be especially influential, such as vegetation cover, soil moisture and temperature, snow depth over the TP, etc. These data can be obtained through remote sensing satellites, indicating the possibility to establish a linkage between the meteorological indicators and climatic events in two big geographic units that are separating afar. The potential implication of this research is that by including more remote sensing data, the prediction of the heavy precipitation in the MLYR can be extended in the lead time and the accuracy can also be improved.

6. Conclusions

To gain insight into the linkages between the precipitation in the MLYR and the surface heat fluxes of the TP, LSDHPEs in the MLYR from 1980 to 2022 were selected to analyze their synoptic circulation patterns and identify the dominant ones. Using statistical analysis and time-lag correlation analysis methods, this study quantified the undetermined spatiotemporal relationships between changes in the surface heat fluxes of the TP and the heavy rainfall events in the MLYR. The conclusions of this paper are summarized as follows:
(1) In the MLYR, the frequency of heavy rainfall events exhibited a unimodal distribution throughout the year, with June standing out as the peak period, characterized by a high concentration of intense precipitation. Depending on the frequency of occurrence, 77.76% of the LSDHPEs were categorized into four core types, from which two dominant circulation schemes were identified. One dominant weather pattern of the LSDHPEs during the plum rain period was an anomalous eastern low-level vortex pattern (SOM 6). The second was the southern anomalously high-pressure weather pattern (SOM 2), under the WNPSH and SAH combined effect. Under the two circulation patterns, anomalous airflow exhibits eastward movement in the eastern margin of the TP, and the topography of the TP hampers the convergence of water vapor toward the MLYR. In particular, the increasing trend in SOM 2 over the last 20 years resulted from dynamic and thermodynamic changes. Dynamic changes induced the decreasing trend in SOM 6.
(2) For all LSDHPEs, the surface SH anomalies were significantly correlated with precipitation in the MLYR, with time lags of 2–4 months and 300–350 d. Meanwhile, anomalous LH was correlated with anomalous precipitations, with time lags of 0–10 d, 130–200 d, and 330–365 d. The phenomenon associated with a time lag of more than two months was widely recognized as a memory effect of soil moisture. Therefore, a more detailed investigation should be conducted considering the soil moisture therein.

Author Contributions

Conceptualization, L.L. and X.D.; methodology, L.L. and H.J.; software, L.L. and H.J.; validation, L.L., X.D. and Y.M.; formal analysis, X.D.; investigation, L.L.; resources, Y.M.; data curation, L.L.; writing—original draft preparation, L.L.; writing—review and editing, X.D., C.W. and B.S.; visualization, L.L. and H.J.; supervision, X.D.; project administration, X.D.; funding acquisition, Y.M. All authors have read and agreed to the published version of the manuscript.

Funding

This research was funded by the Second Tibetan Plateau Scientific Expedition and Research Program (STEP, Grant No. 2019QZKK0103), the European Space Agency (ESA), and the National Remote Sensing Center of China (Grant No. 58516), the National Natural Science Foundation of China (Grant No. 42401030).

Data Availability Statement

The boundary of the MLYR can be obtained from the website http://www.geodata.cn/, accessed on 22 August 2024. The TP boundary can be obtained from the website https://data.tpdc.ac.cn/, accessed on 22 August 2024. MSWEP V2.2 data can be obtained from the website https://www.gloh2o.org/mswep/, accessed on 22 August 2024, Climate Prediction Center (CPC) global precipitation data can be obtained from the website https://psl.noaa.gov/data/gridded/data.cpc.globalprecip.html, accessed on 22 August 2024. ERA5 data are at https://cds.climate.copernicus.eu/, accessed on 22 August 2024. The CN05.1 daily precipitation data and observed data from 2400 stations in China are obtained by request and not publicly available.

Acknowledgments

We thank the Three Gorges University Advanced Computing Center for their assistance.

Conflicts of Interest

The authors declare no conflicts of interest.

Appendix A

Appendix A.1. Precision Validation of Three Precipitation Datasets

To validate the accuracy of the three precipitation products, the spatial resolution of all three products was resampled to 0.25° using linear interpolation, taking the observed daily precipitation data from 133 hydrological stations from 1980 to 2019 to validate the accuracy of three precipitation products and using the Pearson correlation coefficient (CC), the root mean square error (RMSE), and the relative bias (RB) to quantitatively evaluate the difference in site scale (Figure A1). The RMSE for the three rainfall products, MSWEP, CPC, and CN05.1 dataset, at the 133 stations are 13.844, 14.323, and 8.755, respectively. The corresponding CCs are 0.518, 0.498, and 0.83. Additionally, RBs are 390.559%, 370.773%, and 171.406%, respectively. Overall, the order of accuracy of the three rainfall products at the daily site scale is CN05.1 > MSWEP > CPC.
Figure A1. Box plots of RMSE, CC, and RB for three rainfall products at rainfall observation sites in the MLYR.
Remotesensing 16 03779 g0a1

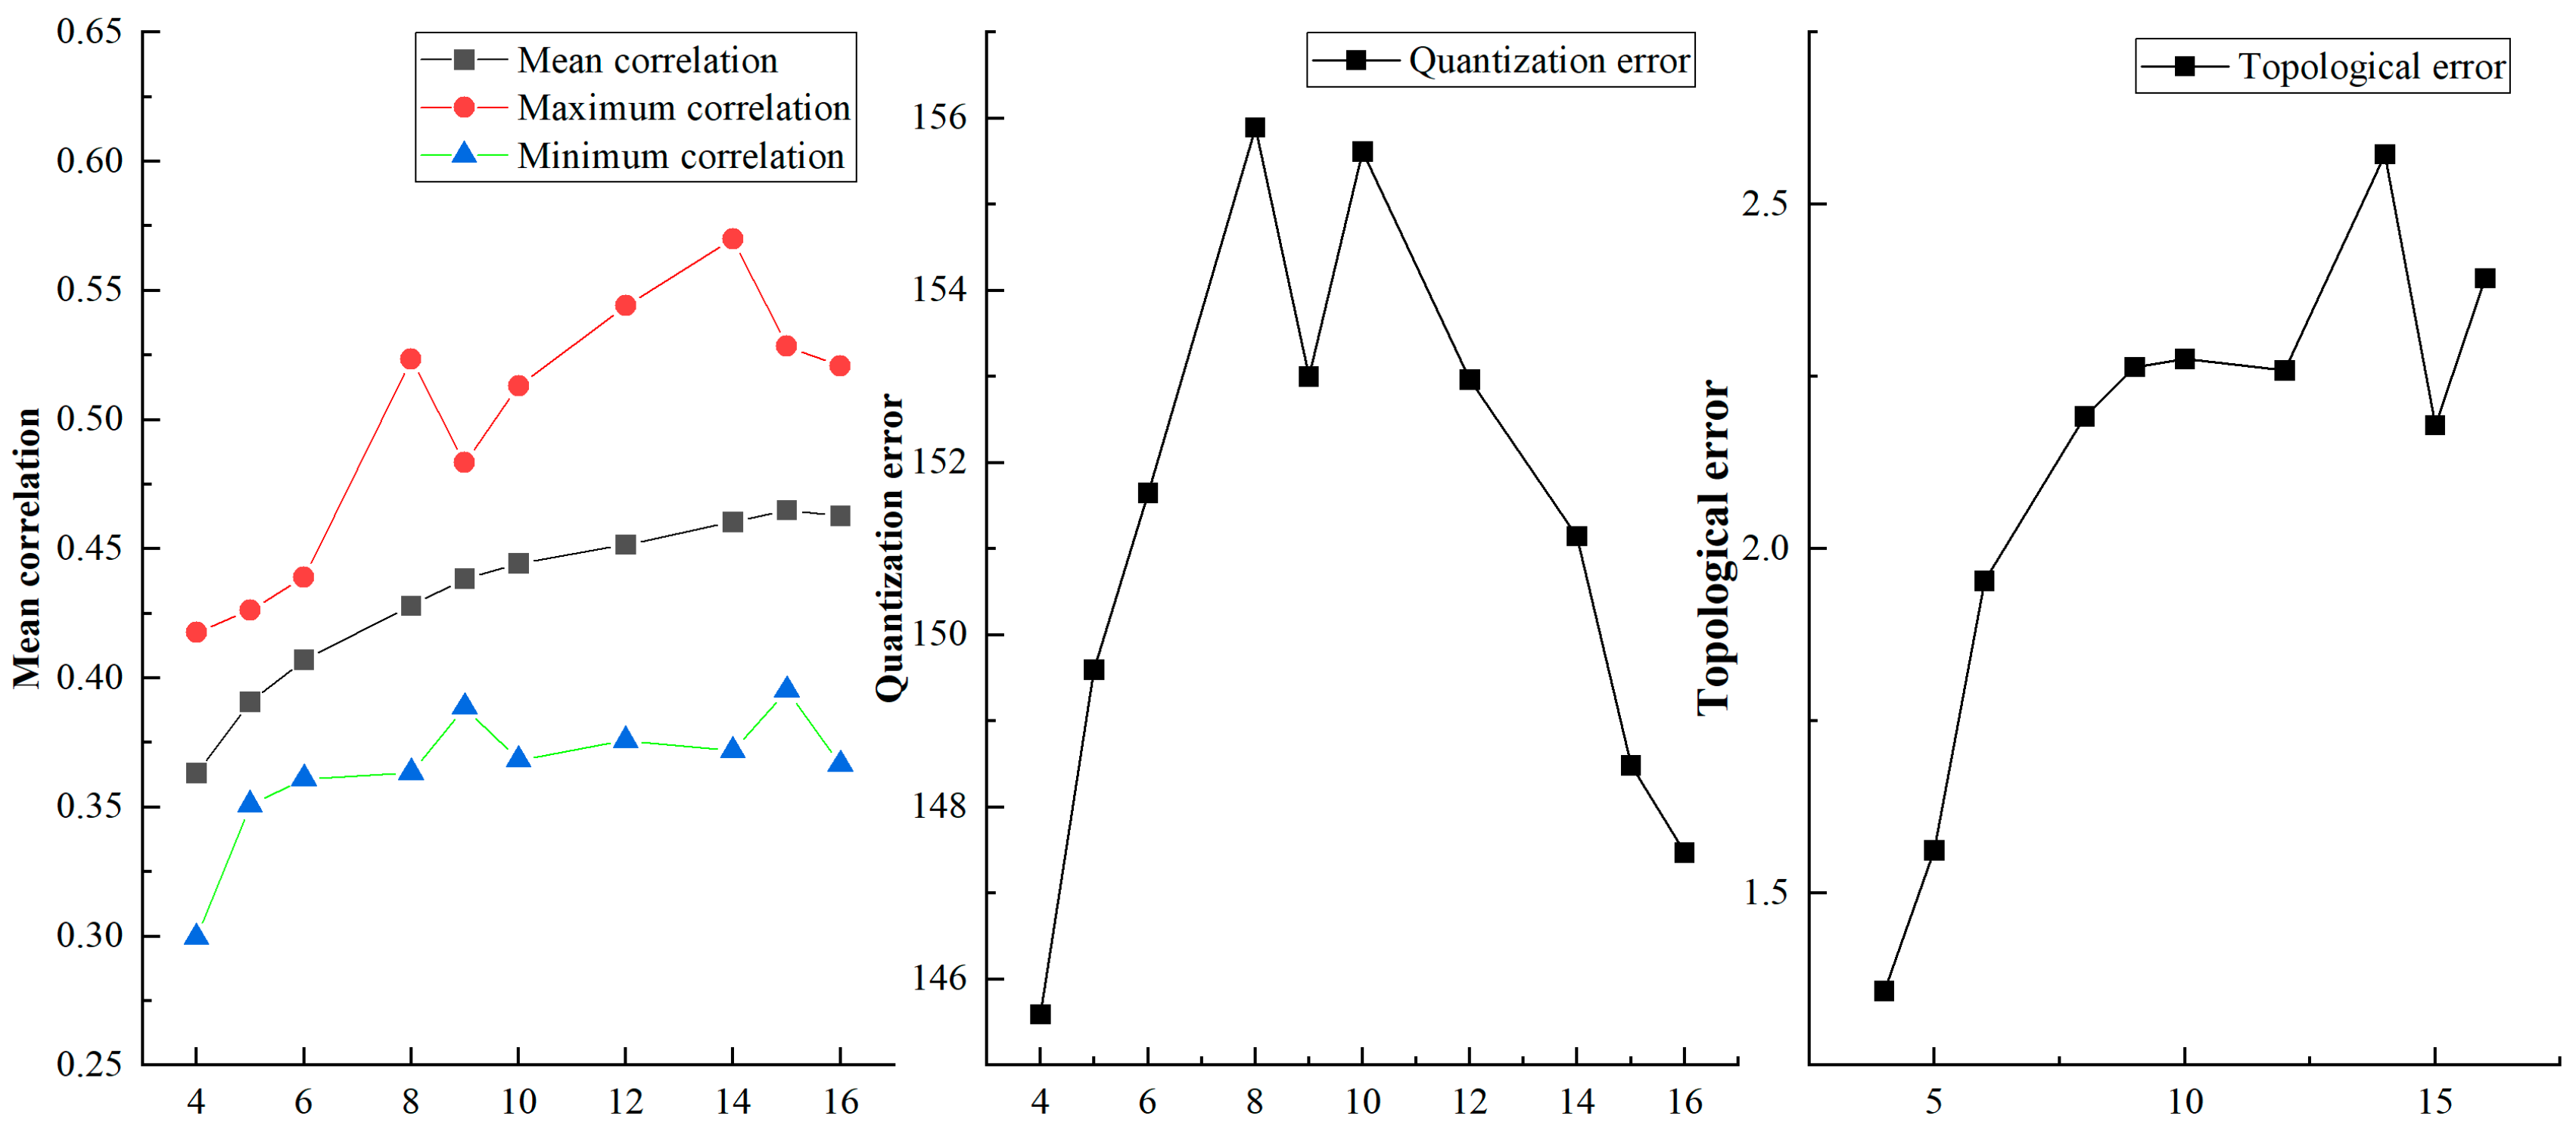
Appendix A.2. Accuracy Comparison of SOM Classification with Different Number of Nodes

Exploring a reasonable number of SOM nodes helps to accurately classify the synoptic circulation during the heavy rainfall concentration period in the MLYR. There are two principles for determining this, one is to capture a sufficiently large number of representative weather patterns, and the other is that the overlap between the categories should also be small. Referring to the previous method of determining the number of nodes and slightly modifying it [48,51], we calculate the topological error (mean Euclidean distance between daily original fields and the specific SOM pattern to which it belongs), quantization error (mean Euclidean distance between each mode of the SOM) [49], and correlation coefficient between daily original fields and the specific SOM pattern to which it belongs (Figure A2). Once the number of nodes exceeds six, the topological error and quantization error increase rapidly and stay at high values thereafter. By plotting the SOM weather type graph, it is found that the classification below six cannot completely segment all types of weather types. Therefore, the number of SOM classification nodes is determined to be six.
Figure A2. Evaluating the accuracy of SOM for different numbers of nodes.
Remotesensing 16 03779 g0a2
Figure A3. Water vapor flux anomalies of the LSDHPEs in SOM patterns at 850 hPa.
Remotesensing 16 03779 g0a3
Figure A4. Temperature and water vapor flux of the LSC patterns at 850 hPa.
Remotesensing 16 03779 g0a4
Figure A5. The synoptic patterns of the LSC at 200 hPa.
Remotesensing 16 03779 g0a5

Appendix A.3. Lagged Correlation Coefficient Curves in Various Locations and SOM Modes

Zone A (98°–105°E, 23°–32.5°N) is proposed by Dong [10] as the location of high correlation with the precipitation in the MLYR.
Figure A6. (a) Lagged correlation coefficient curves of the mean TP heat flux and MLYR mean precipitation. (b) Lagged correlation coefficient curves of the mean heat flux in the critical area A and the MLYR mean precipitation. Dots represent significance at the 95% confidence level.
Remotesensing 16 03779 g0a6

References

  1. Huang, J.; Zhou, X.; Wu, G.; Xu, X.; Zhao, Q. Global Climate Impacts of Land-Surface and Atmospheric Processes over the Tibetan Plateau. Rev. Geophys. 2023, 61, e2022RG000771. [Google Scholar] [CrossRef]
  2. Yao, T.; Thompson, L.G.; Mosbrugger, V.; Zhang, F.; Ma, Y.; Luo, T.; Xu, B.; Yang, X.; Joswiak, D.R.; Wang, W.; et al. Third Pole Environment (TPE). Environ. Dev. 2012, 3, 52–64. [Google Scholar] [CrossRef]
  3. Dong, W.; Lin, Y.; Wright, J.S.; Ming, Y.; Xie, Y.; Wang, B.; Luo, Y.; Huang, W.; Huang, J.; Wang, L.; et al. Summer rainfall over the southwestern Tibetan Plateau controlled by deep convection over the Indian subcontinent. Nat. Commun. 2016, 7, 10925. [Google Scholar] [CrossRef] [PubMed]
  4. Xu, X.; Zhao, T.; Lu, C.; Guo, Y.; Chen, B.; Liu, R.; Li, Y.; Shi, X. An important mechanism sustaining the atmospheric “water tower” over the Tibetan Plateau. Atmos. Chem. Phys. 2014, 14, 11287–11295. [Google Scholar] [CrossRef]
  5. Ye, Y.; Tian, R.; Jin, Z. Dynamic Effects of Atmosphere over and around the Tibetan Plateau on the Sustained Drought in Southwest China from 2009 to 2014. Remote Sens. 2023, 15, 2198. [Google Scholar] [CrossRef]
  6. Han, Y.; Jiang, D.; Si, D.; Ma, Y.; Ma, W. Time-lagged Effects of the Spring Atmospheric Heat Source over the Tibetan Plateau on Summer Precipitation in Northeast China during 1961–2020: Role of Soil Moisture. Adv. Atmos. Sci. 2024, 41, 1527–1538. [Google Scholar] [CrossRef]
  7. Xu, H.; Liang, X.-Z.; Xue, Y. Regional climate modeling to understand Tibetan heating remote impacts on East China precipitation. Clim. Dyn. 2022, 62, 2683–2701. [Google Scholar] [CrossRef]
  8. Zhao, Y.; Chen, D.; Deng, Y.; Son, S.-W.; Wang, X. How Were the Eastward-Moving Heavy Rainfall Events from the Tibetan Plateau to the Lower Reaches of the Yangtze River Enhanced? J. Clim. 2021, 34, 607–620. [Google Scholar] [CrossRef]
  9. Chen, Y.; Zhang, A.; Wang, B.; Fu, Y. A Heavy Precipitation Event in the Yangtze River Basin Led by an Eastward Moving Tibetan Plateau Cloud System in the Summer of 2016. J. Geophys. Res.-Atmos. 2020, 125, e2020JD032429. [Google Scholar] [CrossRef]
  10. Dong, L.; Xu, X.; Zhao, T.; Ren, H. Linkage between moisture transport over the Yangtze River Basin and a critical area of the Tibetan Plateau during the Meiyu. Clim. Dyn. 2019, 53, 2643–2662. [Google Scholar] [CrossRef]
  11. Xu, C.; Yuan, C.; Li, X.; Lin, Y.; Fan, H. Projection of disaster-causing risk of extreme precipitation in the Yangtze River Basin based on CMIP6. Hydrol. Res. 2023, 54, 401–407. [Google Scholar] [CrossRef]
  12. Sun, S.; Zhao, Y.; He, Y.; Xia, Z.; Chen, S.; Zhang, Y.; Sun, Q. Exacerbated climate risks induced by precipitation extremes in the Yangtze River basin under warming scenarios. Front. Ecol. Evol. 2023, 11, 1127875. [Google Scholar] [CrossRef]
  13. Bi, Y.; Zheng, L.; Wang, Y.; Li, J.; Yang, H. Coupling relationship between urbanization and water-related ecosystem services in China’s Yangtze River economic Belt and its socio-ecological driving forces: A county-level perspective. Ecol. Indic. 2023, 146, 109871. [Google Scholar] [CrossRef]
  14. Wang, Y.; Xu, Y.; Tabari, H.; Wang, J.; Wang, Q.; Song, S.; Hue, Z. Innovative trend analysis of annual and seasonal rainfall in the Yangtze River Delta, eastern China. Atmos. Res. 2020, 231, 104673. [Google Scholar] [CrossRef]
  15. Xu, X.; Lu, C.; Ding, Y.; Shi, X.; Guo, Y.; Zhu, W. What is the relationship between China summer precipitation and the change of apparent heat source over the Tibetan Plateau? Atmos. Sci. Lett. 2013, 14, 227–234. [Google Scholar] [CrossRef]
  16. Ge, J.; Youa, Q.; Zhang, Y. Effect of Tibetan Plateau heating on summer extreme precipitation in eastern China. Atmos. Res. 2019, 218, 364–371. [Google Scholar] [CrossRef]
  17. Wang, Z.; Duan, A.; Wu, G. Time-lagged impact of spring sensible heat over the Tibetan Plateau on the summer rainfall anomaly in East China: Case studies using the WRF model. Clim. Dyn. 2014, 42, 2885–2898. [Google Scholar] [CrossRef]
  18. Li, X.; Zhang, K.; Gu, P.; Feng, H.; Yin, Y.; Chen, W.; Cheng, B. Changes in precipitation extremes in the Yangtze River Basin during 1960–2019 and the association with global warming, ENSO, and local effects. Sci. Total Environ. 2021, 760, 144244. [Google Scholar] [CrossRef]
  19. Zhang, Q.; Xu, C.-Y.; Zhang, Z.; Chen, Y.D.; Chun-ling Liu, H.L. Spatial and temporal variability of precipitation maxima during 1960-2005 in the Yangtze River basin and possible association with large-scale circulation. J. Hydrol. 2008, 353, 215–227. [Google Scholar] [CrossRef]
  20. Xie, Y.; Huang, J.; Wu, G.; Liu, Y.; Dong, W.; Lu, M. Oceanic repeaters boost the global climatic impact of the Tibetan Plateau. Sci. Bull. 2023, 68, 2225–2235. [Google Scholar] [CrossRef]
  21. Kuang, X.; Jiao, J.J. Review on climate change on the Tibetan Plateau during the last half century. J. Geophys. Res. Atmos. 2016, 121, 3979–4007. [Google Scholar] [CrossRef]
  22. Yang, H.; Deng, Y.; Cui, C.; Wang, X.; Dong, X. Dynamic Trigger and Moisture Source of Two Typical Meiyu Front Rainstorms Associated with Eastward-Moving Cloud Clusters from the Tibetan Plateau. J. Meteorol. Res. 2022, 36, 478–499. [Google Scholar] [CrossRef]
  23. Wang, M.; Wang, J.; Duan, A.; Yang, J.; Liu, Y. Quasi-biweekly impact of the atmospheric heat source over the Tibetan Plateau on summer rainfall in Eastern China. Clim. Dyn. 2019, 53, 4489–4504. [Google Scholar] [CrossRef]
  24. Li, J.; Chen, Y.; Mao, J.; Zhai, P. Increase in optimal configuration of 25–60-day atmospheric circulations for Yangtze heavy rainfall under global warming background. Weather. Clim. Extrem. 2023, 42, 100630. [Google Scholar] [CrossRef]
  25. Xu, X.; Lu, C.; Shi, X.; Gao, S. World water tower: An atmospheric perspective. Geophys. Res. Lett. 2008, 35, L20815. [Google Scholar] [CrossRef]
  26. Su, Z.; Ma, Y.; Chen, X.; Dong, X.; Du, J.; Han, C.; He, Y.; Hofste, J.G.; Li, M.; Li, M.; et al. Monitoring Water and Energy Cycles at Climate Scale in the Third Pole Environment (CLIMATE-TPE). Remote Sens. 2021, 13, 3661. [Google Scholar] [CrossRef]
  27. Zhao, Y.; Xu, X.; Ruan, Z.; Chen, B.; Wang, F. Precursory strong-signal characteristics of the convective clouds of the Central Tibetan Plateau detected by radar echoes with respect to the evolutionary processes of an eastward-moving heavy rainstorm belt in the Yangtze River Basin. Meteorol. Atmos. Phys. 2019, 131, 697–712. [Google Scholar] [CrossRef]
  28. Zhao, Y.; Sun, R.; Xie, Z.; Duan, A. Upper-Troposphere Saddle-Like Response to Springtime Surface Sensible Heating Over the Tibetan Plateau: Combined Effect From Baroclinic and Barotropic Process. J. Geophys. Res.-Atmos. 2022, 127, e2021JD036002. [Google Scholar] [CrossRef]
  29. Zeng, J.; Huang, A.; Wu, P.; Huang, D.; Zhang, Y.; Tang, J.; Zhao, D.; Yang, B.; Chen, S. Typical Synoptic Patterns Responsible for Summer Regional Hourly Extreme Precipitation Events Over the Middle and Lower Yangtze River Basin, China. Geophys. Res. Lett. 2023, 50, e2023GL104829. [Google Scholar] [CrossRef]
  30. Chen, J.; Li, Y.; Xiong, B.; Wang, Y.; Zhou, S.; Huang, Y. Comparison of Moisture Sources of Summer Precipitation in 1998 and 2020 in the Middle and Lower Reaches of Yangtze River Basin. Int. J. Climatol. 2023, 43, 3493–3505. [Google Scholar] [CrossRef]
  31. Zhu, C.; Ullah, W.; Wang, G.; Lu, J.; Li, S. Diagnosing Potential Impacts of Tibetan Plateau Spring Soil Moisture Anomalies on Summer Precipitation and Floods in the Yangtze River Basin. J. Geophys. Res. Atmos. 2023, 128, e2022JD037671. [Google Scholar] [CrossRef]
  32. Wu, D.; Zhang, F.; Wang, C. Impacts of Diabatic Heating on the Genesis and Development of an Inner Tibetan Plateau Vortex. J. Geophys. Res.-Atmos. 2018, 123, 11691–11704. [Google Scholar] [CrossRef]
  33. Ma, J.; Wei, K.; Chen, W.; Wang, T.; Shi, D. The southward movement preference of large-scale persistent extreme precipitation events over the Yangtze River Valley during Mei-yu period. Clim. Dyn. 2023, 60, 3729–3747. [Google Scholar] [CrossRef]
  34. Tao, S.; Ding, Y. Observational Evidence of the Influence of the Qinghai-Xizang (Tibet) Plateau on the Occurrence of Heavy Rain and Severe Convective Storms in China. Bull. Am. Meteorol. Soc. 1981, 62, 23–30. Available online: https://www.jstor.org/stable/26221519 (accessed on 20 August 2024). [CrossRef]
  35. Zhan, C.; Shi, Q.; Liang, S. Assessing the impacts of the spring sensible heat flux over the Tibetan Plateau on Asian summer monsoon rainfall using observational and reanalysis data. Int. J. Climatol. 2019, 40, 2342–2358. [Google Scholar] [CrossRef]
  36. Wan, B.; Gao, Z.; Chen, F.; Lu, C. Impact of Tibetan Plateau Surface Heating on Persistent Extreme Precipitation Events in Southeastern China. Mon. Weather. Rev. 2017, 145, 3485–3505. [Google Scholar] [CrossRef]
  37. Sun, Y.; Shan, X.; Zhou, S.; Wang, M.; Wang, C.; Deng, Z. Impacts of Tibetan Plateau sensible heat and El Nino-Southern Oscillation on precipitation over South China under the background of the PDO. Front. Environ. Sci. 2023, 11, 1156206. [Google Scholar] [CrossRef]
  38. Huang, W.; Zhao, Y.; Sun, C.; Wang, H.; Wang, X. Climate modulation of summer rainstorm activity in eastern China based on the Tibetan Plateau spring heating. Arab. J. Geosci. 2020, 13, 126. [Google Scholar] [CrossRef]
  39. Yang, K.; Qi, Q.; Wang, C. Possible impacts of vegetation cover increment on the relationship between winter snow cover anomalies over the Third Pole and summer precipitation in East Asia. NPJ Clim. Atmos. Sci. 2023, 6, 140. [Google Scholar] [CrossRef]
  40. Qi, W.; He, L.; Hai, J.; Wei, W. Relationship between spring soil moisture in the Tibetan Plateau and summer precipitation in the Yangtze river basin and its possible mechanism. Chin. J. Geophys.-Chin. Ed. 2016, 59, 3985–3995. [Google Scholar] [CrossRef]
  41. Zhang, C.; Jia, X.; Wen, Z. Increased impact of the Tibetan Plateau Spring Snow Cover to the Meiyu Rainfall over the Yangtze River Valley after 1990s. J. Clim. 2021, 34, 5985–5997. [Google Scholar] [CrossRef]
  42. Xu, Y.; Gao, X.; Shen, Y.; Xu, C.; Shi, Y.; Giorgi, F. A Daily Temperature Dataset over China and Its Application in Validating a RCM Simulation. Adv. Atmos. Sci. 2009, 26, 763–772. [Google Scholar] [CrossRef]
  43. Xu, X.; Huang, A.; Huang, D.; Gu, C. What Are the Dominant Synoptic Patterns Leading to the Summer Regional Hourly Extreme Precipitation Events Over Central-Eastern Tibetan Plateau and Sichuan Basin. Geophys. Res. Lett. 2023, 50, e2022GL102342. [Google Scholar] [CrossRef]
  44. Kohonen, T. Self-organized formation of topologically correct feature maps. Biol. Cybern. 1982, 43, 59–69. [Google Scholar] [CrossRef]
  45. Ng, C.P.; Zhang, Q.; Li, W. Changes in Hourly Extreme Precipitation Over Eastern China From 1970 to 2019 Dominated by Synoptic-Scale Precipitation. Geophys. Res. Lett. 2021, 48, e2020GL090620. [Google Scholar] [CrossRef]
  46. Shin, Y.; Kim, J.-H.; Chun, H.-Y.; Jang, W.; Son, S.-W. Classification of Synoptic Patterns With Mesoscale Mechanisms for Downslope Windstorms in Korea Using a Self-Organizing Map. J. Geophys. Res. Atmos. 2022, 127, e2021JD035867. [Google Scholar] [CrossRef]
  47. Loikith, P.C.; Lintner, B.R.; Sweeney, A. Characterizing Large-Scale Meteorological Patterns and Associated Temperature and Precipitation Extremes over the Northwestern United States Using Self-Organizing Maps. J. Clim. 2017, 30, 2829–2847. [Google Scholar] [CrossRef]
  48. Lee, S.; Feldstein, S.B. Detecting Ozone- and Greenhouse Gas–Driven Wind Trends with Observational Data. Science 2013, 339, 563–567. [Google Scholar] [CrossRef]
  49. Horton, D.E.; Johnson, N.C.; Singh, D.; Swain, D.L.; Rajaratnam, B.; Diffenbaugh, N.S. Contribution of changes in atmospheric circulation patterns to extreme temperature trends. Nature 2015, 522, 465–469. [Google Scholar] [CrossRef]
  50. Cohen, J.; Coumou, D.; Screen, J.A.; Furtado, J.C.; Barlow, M.; Francis, J.; Dethloff, K.; Whittleston, D. Recent Arctic amplification and extreme mid-latitude weather. Nat. Geosci. 2014, 7, 627–637. [Google Scholar] [CrossRef]
  51. Cassano, J.J.; Uotila, P.; Lynch, A.H.; Cassano, E.N. Predicted changes in synoptic forcing of net precipitation in large Arctic river basins during the 21st century. J. Geophys. Res. 2007, 112, G04S49. [Google Scholar] [CrossRef]
  52. Gong, H.; Wang, L.; Zhou, W.; Chen, W.; Wu, R.; Liu, L. Revisiting the Northern Mode of East Asian Winter Monsoon Variation and Its Response to Global Warming. J. Clim. 2018, 31, 9001–9014. [Google Scholar] [CrossRef]
  53. Chen, Y.; Wang, A.; Feng, G. The relative contribution of large-scale circulation and local soil moisture to summer precipitation over Asian mid-low latitudes. Clim. Dyn. 2022, 60, 2097–2112. [Google Scholar] [CrossRef]
  54. Lin, R.; Zhu, J.; Zheng, F. The Application of the SVD Method to Reduce Coupled Model Biases in Seasonal Predictions of Rainfall. J. Geophys. Res.-Atmos. 2019, 124, 11837–11849. [Google Scholar] [CrossRef]
  55. Wallace, J.M.; Smith, C.; Bretherton, C.S. Singular Value Decomposition of Wintertime Sea Surface Temperature and 500-mb Height Anomalies. J. Clim. 1992, 5, 561–576. [Google Scholar] [CrossRef]
  56. Zhong, L.; MA, Y.; Salama, M.S.; Su, Z. Assessment of vegetation dynamics and their response to variations in precipitation and temperature in the Tibetan Plateau. Clim. Chang. 2010, 103, 519–535. [Google Scholar] [CrossRef]
  57. Roerink, G.J.; Menenti, M.; Verhoef, W. Reconstructing cloudfree NDVI composites using Fourier analysis of time series. Int. J. Remote Sens. 2000, 21, 1911–1917. [Google Scholar] [CrossRef]
  58. Sun, Q.; Miao, C.; Duan, Q.; Sorooshian, S.; Hsu, K.-L. A Review of Global Precipitation Data Sets: Data Sources, Estimation, and Intercomparisons. Rev. Geophys. 2017, 56, 79–107. [Google Scholar] [CrossRef]
  59. Chen, B.; Xu, X.-D.; Zhao, T. Main moisture sources affecting lower Yangtze River Basin in boreal summers during 2004–2009. Int. J. Climatol. 2012, 33, 1035–1046. [Google Scholar] [CrossRef]
  60. Xia, Y.; Yao, S.; Sun, T.; Guo, Z. Role of the Low-Latitude Quasi-Biweekly Oscillation in the Extreme Persistent Heavy Rainfall in the Mei-Yu Season over the Middle and Lower Reaches of the Yangtze River. J. Clim. 2023, 36, 3817–3832. [Google Scholar] [CrossRef]
  61. Zhang, J.; Zhao, K.; Wang, Y.; Kong, X.; Shao, X.; Liang, Y. Modulation of centennial-scale hydroclimate variations in the middle Yangtze River Valley by the East Asian-Pacific pattern and ENSO over the past two millennia. Earth Planet. Sci. Lett. 2021, 576, 117220. [Google Scholar] [CrossRef]
  62. Xiao, M.; Zhang, Q.; Singh, V.P. Influences of ENSO, NAO, IOD and PDO on seasonal precipitation regimes in the Yangtze River basin, China. Int. J. Climatol. 2015, 35, 3385–3720. [Google Scholar] [CrossRef]
  63. Deng, M.; Meng, X.; Sheng, D.; Niu, H.; Wu, P.; Li, Z.; Zhao, L.; Chen, H. Observed surface heat fluxes partitioning during the local growing season over the Tibetan Plateau. Agric. For. Meteorol. 2024, 356, 110186. [Google Scholar] [CrossRef]
  64. Dong, Y.; Li, G.; Xie, X.; Yang, L.; Zhang, P.; Zeng, B. Mechanism of Diabatic Heating on Precipitation and the Track of a Tibetan Plateau Vortex over the Eastern Slope of the Tibetan Plateau. Adv. Atmos. Sci. 2024, 41, 155–172. [Google Scholar] [CrossRef]
  65. Li, L.; Zhang, R.; Wen, M.; Duan, J. Development and eastward movement mechanisms of the Tibetan Plateau vortices moving off the Tibetan Plateau. Clim. Dyn. 2019, 52, 4849–4859. [Google Scholar] [CrossRef]
  66. Xu, H.; Zhao, D.; Yin, J.; Duan, Y.; Gao, W.; Li, Y.; Zhou, L. Indirect Effects of Binary Typhoons on an Extreme Rainfall Event in Henan Province, China From 19 to 21 July 2021. 3. Sensitivities to Microphysics Schemes. J. Geophys. Res.-Atmos. 2023, 128, e2022JD037936. [Google Scholar] [CrossRef]
  67. Wu, G.; Liu, Y.; He, B.; Bao, Q.; Duan, A.; Jin, F.-F. Thermal Controls on the Asian Summer Monsoon. Sci. Rep. 2012, 2, 404. [Google Scholar] [CrossRef]
  68. Hu, L.; Deng, D.; Gao, S.; Xu, X. The seasonal variation of Tibetan Convective Systems: Satellite observation. J. Geophys. Res. Atmos. 2016, 121, 5512–5525. [Google Scholar] [CrossRef]
  69. Xu, X.D.; Shi, X.Y.; Wang, Y.Q.; Peng, S.Q.; Shi, X.H. Data analysis and numerical simulation of moisture source and transport associated with summer precipitation in the Yangtze River Valley over China. Meteorol. Atmos. Phys. 2008, 100, 217–231. [Google Scholar] [CrossRef]
  70. Zhao, Y.; Xu, X.; Liu, L.; Zhang, R. Effects of convection over the Tibetan Plateau on rainstorms downstream of the Yangtze River Basin. Atmos. Res. 2019, 219, 24–35. [Google Scholar] [CrossRef]
Figure 1. Location of the study area.
Remotesensing 16 03779 g001
Figure 2. Research framework of this study.
Remotesensing 16 03779 g002
Figure 4. Synoptic patterns of SOM correspond to the May to August period during 1980–2022 at 500 hPa. (Contour represents mean geopotential height anomalies. Arrows represent the wind field anomalies. The yellow line represents the WNPSH outlined by 5880 gpm contour at 500 hPa. The green line represents the SAH outlined by a 12500 gpm contour at 200 hPa. The green dashed line indicates the SAH at 200 hPa relative to the climatic mean from May to August 1980–2022.)
Remotesensing 16 03779 g004
Figure 5. Composite mean synoptic fields of LSDHPEs in SOM patterns at 500 hPa. (The contours represent geopotential height anomalies. The left color bar represents the water vapor flux at 500 hPa. The yellow line represents the WNPSH outlined by 5880 gpm contour at 500 hPa. The green line represents the SAH outlined by the 12500 gpm contour at 200 hPa. The green dashed line indicates the SAH at 200 hPa relative to the climatic mean from May to August during 1980–2022.)
Remotesensing 16 03779 g005
Figure 6. Mean air temperature at 500hPa and the total CAPE field of the LSC patterns. (The contours represent the CAPE. The left color bar represents the temperature at 500 hPa).
Remotesensing 16 03779 g006
Figure 7. The annual occurrence of SOM and LSC patterns. (The blue dots and black dots indicate the occurrence of the SOM and LSC patterns, respectively. Solid lines represent the trend line from 1980 to 2022. Dashed lines represent the trend line of the corresponding dots from 2000 to 2022. The slope and P values (parentheses) are displayed in the top left corner.)
Remotesensing 16 03779 g007
Figure 8. Time-lagged correlation coefficients between the surface heat flux anomalies over the TP and the precipitation anomalies in LSDHPEs. ((a), the correlation between the anomalous LH on the TP and the anomalous precipitation over the MLYR. (b), the correlation between the anomalous SH on the TP and the anomalous precipitation over the MLYR. All values (bar) passed the 95% significance level test; the baseline indicates the mean value of the correlation coefficient. Red line represents the fitted curve obtained by using the HANTS algorithm.).
Remotesensing 16 03779 g008
Figure 9. The spatial distribution of heterogeneous CCs between the anomalous LH and anomalous precipitation with a time lag of 7 days (a,b). The distribution of heterogeneous CCs between the anomalous SH and anomalous precipitation with a time lag of 90 days (c,d). (The slash lines are statistically significant at 5% level. The statistical histograms in each subfigure are the distribution of the CCs that passed the significance test.)
Remotesensing 16 03779 g009
Table 1. Quantitative partitioning of the LSDHPEs trend in each SOM pattern.
ItemsSOM 1SOM 2SOM 3SOM 4SOM 5SOM 6Total
Trend in the thermodynamic influence−0.0060.010−0.0020.005−0.001−0.0040.004
Trend in the dynamic influences−0.0040.0100.0030.000−0.006−0.006−0.002
Trend in the interaction influences−0.0020.007−0.0010.0010.0010.0020.009
Total trend−0.0120.0280.0010.007−0.006−0.0080.011
Percent of total trend−109.59266.637.5962.36−53.74−73.24
Percent of thermodynamic48.2436.34−245.0780.759.6447.47
Percent of dynamic33.6637.27433.84−2.74107.6777.83
Percent of the interaction18.1126.40−88.7721.99−17.31−25.30
Disclaimer/Publisher’s Note: The statements, opinions and data contained in all publications are solely those of the individual author(s) and contributor(s) and not of MDPI and/or the editor(s). MDPI and/or the editor(s) disclaim responsibility for any injury to people or property resulting from any ideas, methods, instructions or products referred to in the content.

