Article

SA-Pmnet: Utilizing Close-Range Photogrammetry Combined with Image Enhancement and Self-Attention Mechanisms for 3D Reconstruction of Forests

1
State Key Laboratory of Efficient Production of Forest Resources, Beijing Forestry University, Beijing 100083, China
2
Beijing Key Laboratory of Precision Forestry, College of Forestry, Beijing Forestry University, Beijing 100083, China
3
Key Laboratory of Forest Cultivation and Protection, Ministry of Education, Beijing Forestry University, Beijing 100083, China
*
Author to whom correspondence should be addressed.
Remote Sens. 2024, 16(2), 416; https://doi.org/10.3390/rs16020416
Submission received: 9 November 2023 / Revised: 13 January 2024 / Accepted: 17 January 2024 / Published: 21 January 2024

Abstract

:
Efficient and precise forest surveys are crucial for in-depth understanding of the present state of forest resources and conducting scientific forest management. Close-range photogrammetry (CRP) technology enables the convenient and fast collection of highly overlapping sequential images, facilitating the reconstruction of 3D models of forest scenes, which significantly improves the efficiency of forest surveys and holds great potential for forestry visualization management. However, in practical forestry applications, CRP technology still presents challenges, such as low image quality and low reconstruction rates when dealing with complex undergrowth vegetation or forest terrain scenes. In this study, we utilized an iPad Pro device equipped with high-resolution cameras to collect sequential images of four plots in Gaofeng Forest Farm in Guangxi and Genhe Nature Reserve in Inner Mongolia, China. First, we compared the image enhancement effects of two algorithms: histogram equalization (HE) and median–Gaussian filtering (MG). Then, we proposed a deep learning network model called SA-Pmnet based on self-attention mechanisms for 3D reconstruction of forest scenes. The performance of the SA-Pmnet model was compared with that of the traditional SfM+MVS algorithm and the Patchmatchnet network model. The results show that histogram equalization significantly increases the number of matched feature points in the images and improves the uneven distribution of lighting. The deep learning networks demonstrate better performance in complex environmental forest scenes. The SA-Pmnet network, which employs self-attention mechanisms, improves the 3D reconstruction rate in the four plots to 94%, 92%, 94%, and 96% by capturing more details and achieves higher extraction accuracy of diameter at breast height (DBH) with values of 91.8%, 94.1%, 94.7%, and 91.2% respectively. These findings demonstrate the potential of combining of the image enhancement algorithm with deep learning models based on self-attention mechanisms for 3D reconstruction of forests, providing effective support for forest resource surveys and visualization management.

1. Introduction

The forest ecosystem affects the global and regional carbon–water cycle and the stability of the climate system. Accurate investigation of forest resources is essential for forest protection as well as scientific planning and management [1]. The sample plot survey is the basis of forest resource inventory and management planning; accurate and efficient parameter extraction of individual trees in the forest is also an important prerequisite for conducting various forest ecological studies [2]. Therefore, rapid and automatic acquisition of individual tree parameters is essential for forest resource monitoring and scientific forest management. Traditional methods involve manually measuring the parameters of each tree in the samples and recording these measurements in digital form [3]. However, this method is both time-consuming and labor-intensive, making it difficult to efficiently obtain rich data from a large number of plots in a short period of time.
Automatic extraction of individual tree parameters based on 3D forest models can overcome the limitations of traditional survey methods, transforming extensive field investigations into computer data processing, and thereby enhancing survey efficiency. Light detection and ranging (LiDAR) is an active remote sensing technology that has been rapidly advancing. It enables the accurate and efficient acquisition of point cloud data that covers a wide range, effectively extracting forest structure information. In forestry surveys, LiDAR plays an increasingly pivotal role, particularly individual tree segmentation and parameter extraction. Airborne laser scanning (ALS) and terrestrial laser scanning (TLS) can acquire high-density 3D point clouds of forest environments, facilitating precise 3D modelling [4,5]. Notably, ALS is particularly proficient in swiftly capturing extensive point cloud data over large areas. Nonetheless, the vertical perspective of the overhead scanning results in fewer lateral details of objects in the point cloud, thus impeding the acquisition of information, such as diameter at breast height DBH and height below branches. Conversely, TLS scans the objects from the ground to obtain full point clouds of the trunk and is suitable for extracting DBH and height below branches. However, such equipment is expensive and requires specialized technical expertise for data collection. Close-range photogrammetry (CRP) is a ground-based measurement method based on multi-view geometry and spatial transformation matrices, enabling the acquisition of 3D point cloud data from sequences of images [6,7,8]. CRP possesses the capacity to automatically match sets of images, thus transforming images into novel data sources for 3D point clouds [9]. In recent years, CRP has been a promising technology in forestry surveys, providing products akin to LiDAR data but at reduced costs [10,11]. Furthermore, CRP demonstrates the capability for rapid on-site measurement and efficient data processing, showing considerable potential for precise forestry applications [12,13,14].
The dominant 3D reconstruction methods are Structure from Motion (SfM) and Multi-View Stereo (MVS) [15,16]. These methods have found wide applications in precision agriculture, geographic surveying, archaeology, and others [17]. SfM is a commonly used sparse reconstruction algorithm that aims to reconstruct the 3D coordinates of image feature points [18]. MVS leverages the camera model based on SfM to compute the camera poses and conducts dense reconstruction to recover the geometric information of the scene [19]. This multi-view 3D reconstruction technique has been extensively utilized in reconstruction of forest trees and stands using unmanned aerial systems [20,21,22], showing its effectiveness in 3D reconstruction [23]. However, in complex forest scenes, traditional 3D reconstruction techniques face a range of problems and challenges, such as mutual occlusion among trees, uneven lighting distribution, and high texture repetition. These factors introduce uncertainties to feature matching [24], which may result in point cloud noise, incomplete imaging, or imaging overlap, leading to significant deviations in parameter extraction. Although the use of a large number of multi-angle, highly overlapping images and higher pixel photos can enhance the accuracy and completeness of 3D imaging [25], it also increases the difficulty and time required for data processing. Therefore, there is a pressing need to explore improved methods for forest 3D reconstruction. Deep learning, with its neural network-based feature extraction capability [26], holds great potential for forestry visualization and management. Nonetheless, to date, there have been relatively few studies on applying deep learning to 3D reconstruction of forest scenes.
Taking advantage of the advancements in convolutional neural networks (CNN) in image processing, researchers have been striving to enhance the performance of MVS. MVSNet pioneered the integration of deep learning techniques into depth map-based MVS tasks [27]. It constructs a cost volume and employs 3DCNN for cost volume regularization, leading to outstanding reconstruction results and unveiling novel avenues for learning-based MVS methods. However, using 3D CNN for regularization in MVSNet consumes too much GPU memory and poses practical challenges. Consequently, subsequent studies have proposed a series of improved supervised and unsupervised networks, including P-MVSNet, CVP-MVSNet, Fast-MVSNet, and Unsup-MVSNet [28,29,30,31,32,33,34,35,36]. Nonetheless, these approaches still struggle to strike a perfect balance between memory consumption and reconstruction accuracy.
Therefore, an efficient and high-precision learning-based MVS method is of wide practical significance. PatchmatchNet [37] eliminates the algorithmic framework of MVSNet, which is derived from the traditional stereo matching method, and implements a dense reconstruction algorithm based on deep learning with the idea of PatchMatch [38]. The PatchmatchNet framework is composed of multi-scale feature extraction and learning-based Patchmatch, which combines the advantages of traditional algorithms and deep learning to improve the accuracy and completeness of the reconstruction. In addition, the memory consumption and running time are also dramatically reduced compared to other methods. However, the network is unable to capture important information for deep inference tasks in the feature extraction module, and this means that critical information in the data is missed, which affects the accuracy of the 3D model in terms of details.
To address these critical concerns, this research proposes a deep learning network model based on the self-attention mechanism for SA-Pmnet and validates its performance using forest stand sequence images taken using an iPad Pro. This network model is capable of generating high-quality dense point clouds and achieving a high reconstruction rate and high-precision DBH extraction in complex forest environments. The specific research objectives are as follows:
  • Comparing two image enhancement algorithms, median–Gaussian filtering and histogram equalization, to solve the impact of lighting factors on image quality.
  • Proposing a SA-Pmnet model by combining the self-attention mechanism with the multi-scale feature extraction module to enhance the ability of image details.
  • Using the SfM+MVS algorithm to verify the superiority of the proposed deep learning network model for 3D reconstruction in complex forest environments.

2. Materials and Methods

2.1. Study Area

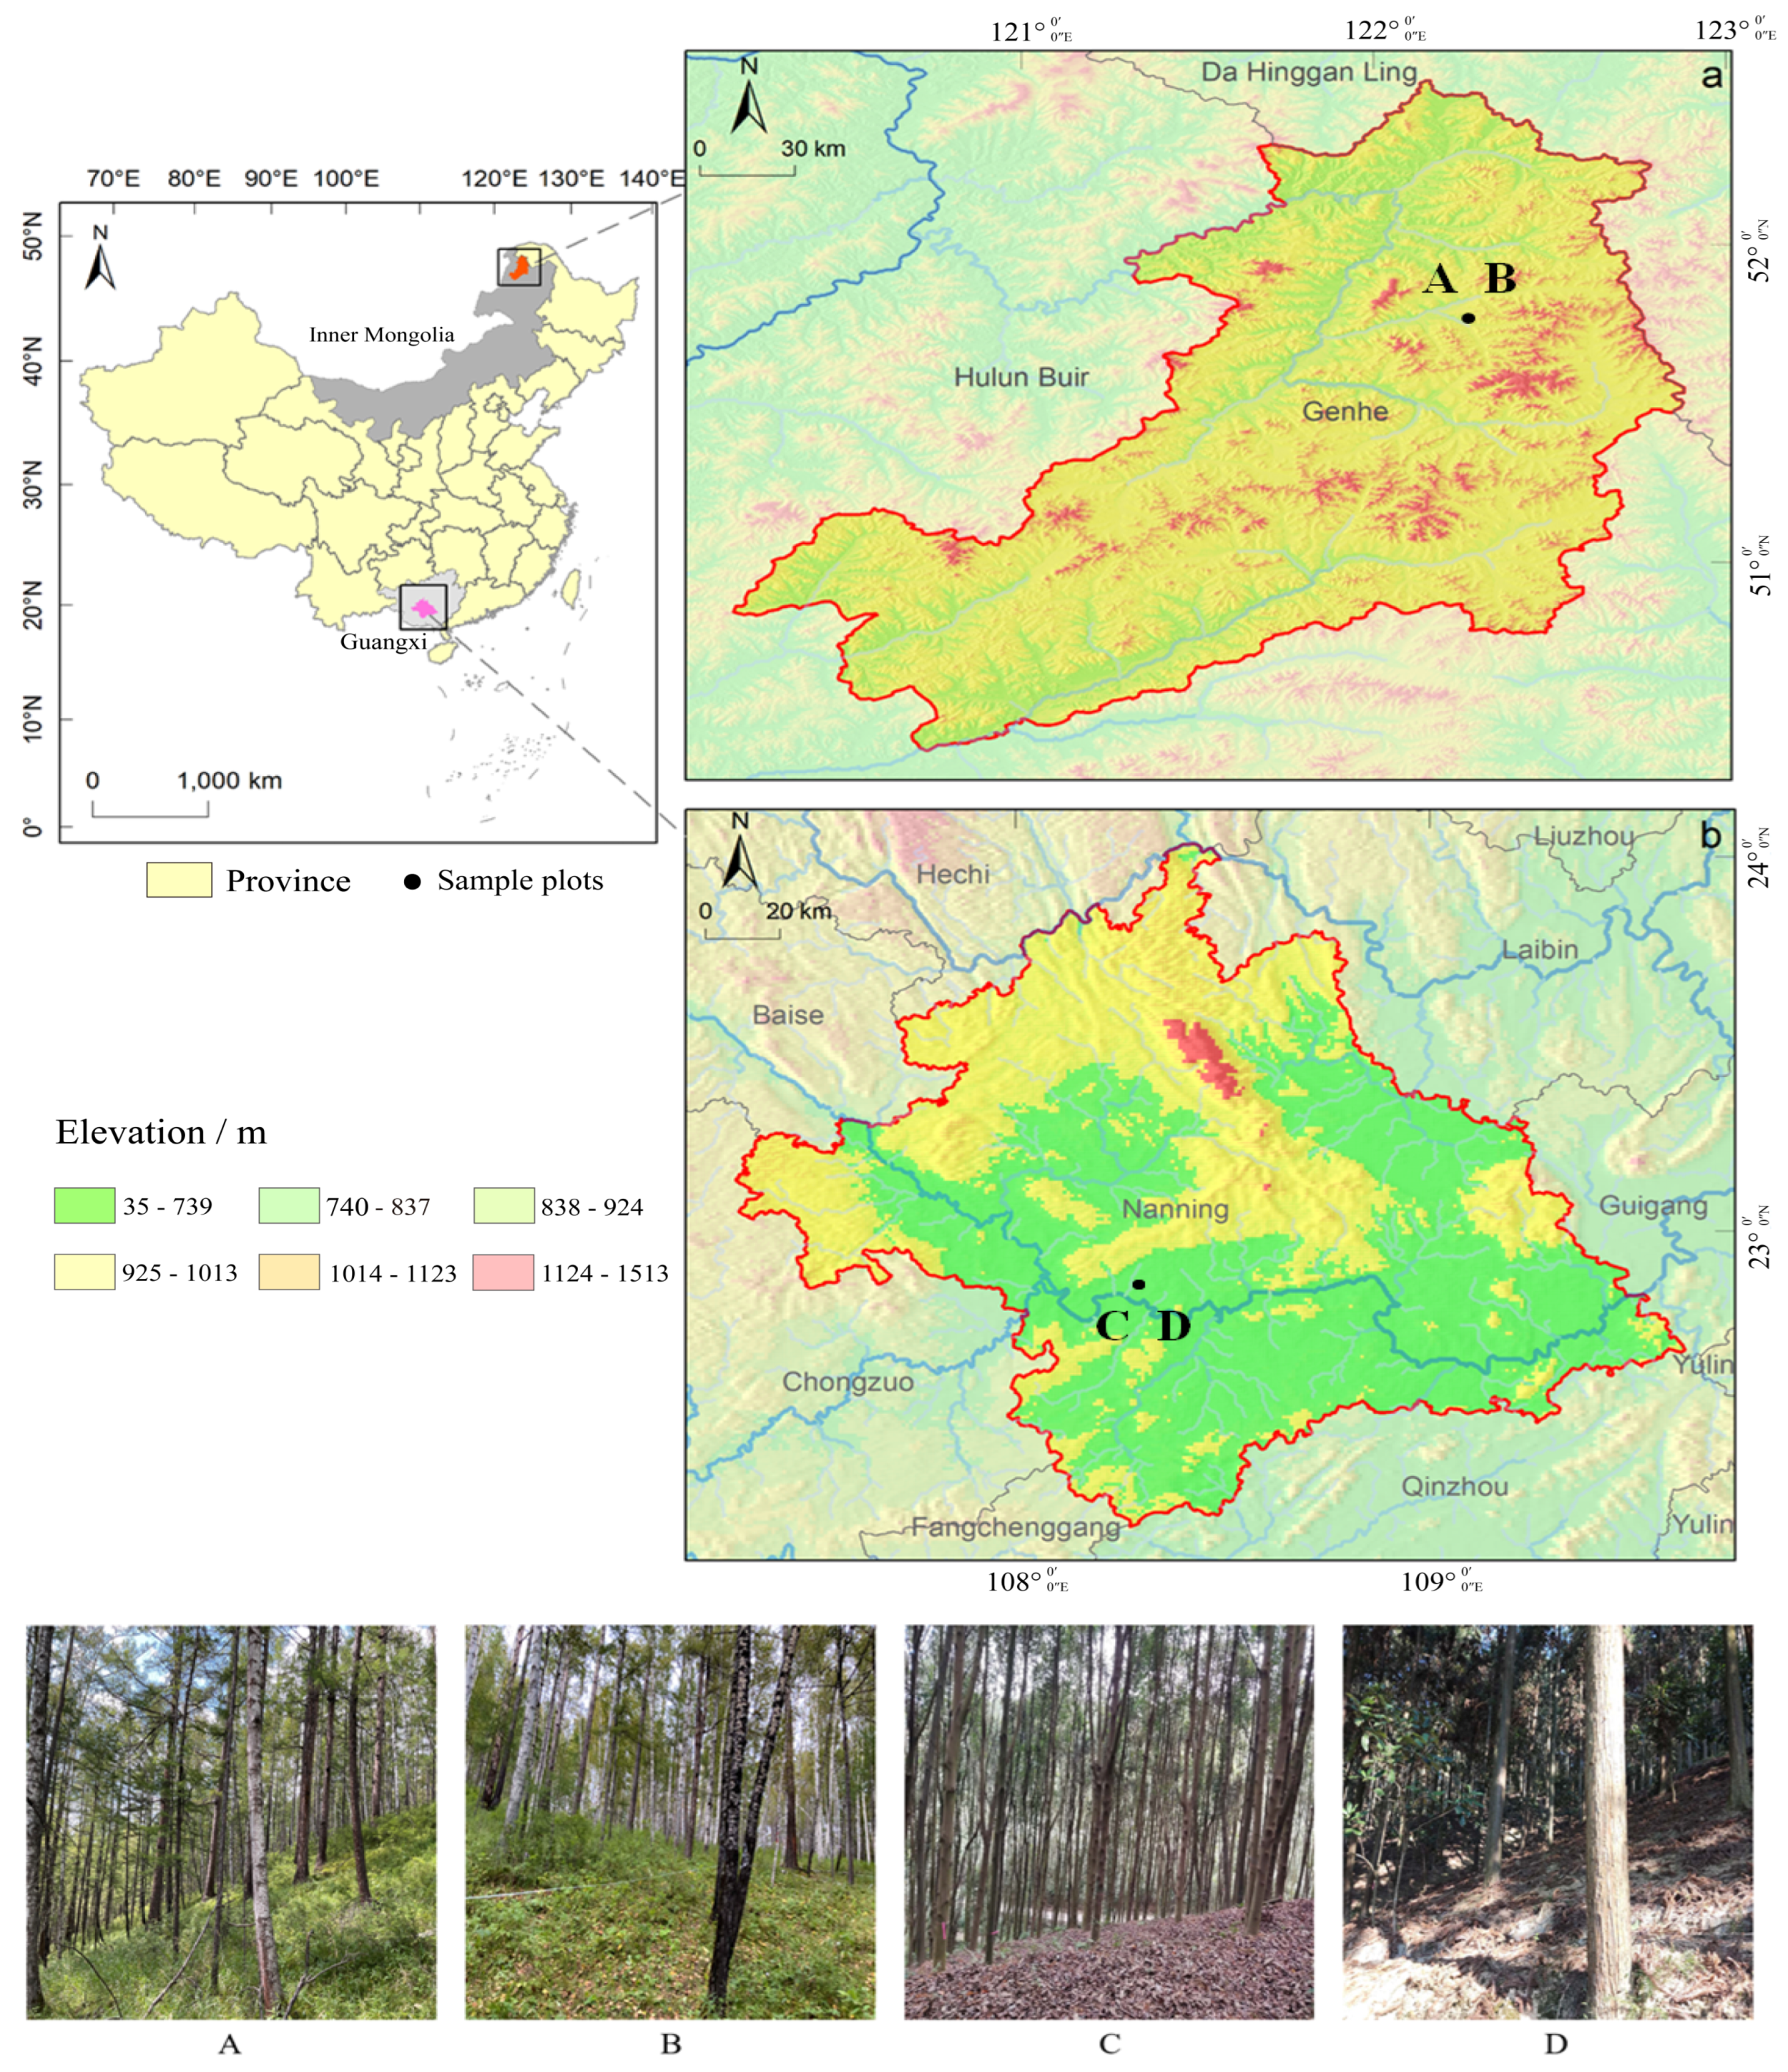
Four typical sample plots of different plant species in southern and northern China were selected (Figure 1). The sample plots were set as a square with a size of 20 m × 20 m.
Two of the sample sites are situated in the Genhe Forest Farm located in the Inner Mongolia Autonomous Region. They have a latitude range of 51°40′ to 51°52′ and a longitude range of 122°12′ to 122°21′. The elevation in this region ranges from 700 to 1300 m. Larch is the dominant species covering 76% (1.14 million hectares) of the area. Additionally, birch and larch mixed forests account for 19.3% (290,000 hectares) of the total forested area.
The other two sample sites are situated in the Gaofeng Forest Farm located in Nanning City, Guangxi Province. They have a latitude range of 22°49′ to 23°5′ and a longitude range of 108°7′ to 108°38′. The elevation in this region ranges from 100 to 450 m. Various forest types can be found, with Red oatchestnut (Castanopsis hystrix Hook.) forests and Chinese fir (Cunninghamia lanceolata (Lamb.) Hook.) being the predominant ones.

2.2. Data

The data for this study were collected in August 2022 and January 2023. The information of the sample plots is shown in Table 1. The DBH of each tree was measured with a diameter tape, which was used for the accuracy verification of the extracted parameters.
Sequential images were captured using the primary camera (with a focal length of 3.99 mm, aperture size of f/1.8, and 12 megapixels) of a portable iPad Pro (Apple Inc., Cupertino, CA, USA). The images were taken from a fixed focal point, with a distance of 0.5 meters between adjacent points and a distance of 1 meter from the edge of the plot. The overlap ratio for each pair of images exceeded 70%. The number of photos taken for each plot was limited to a range of 400 to 600.

2.3. Methods

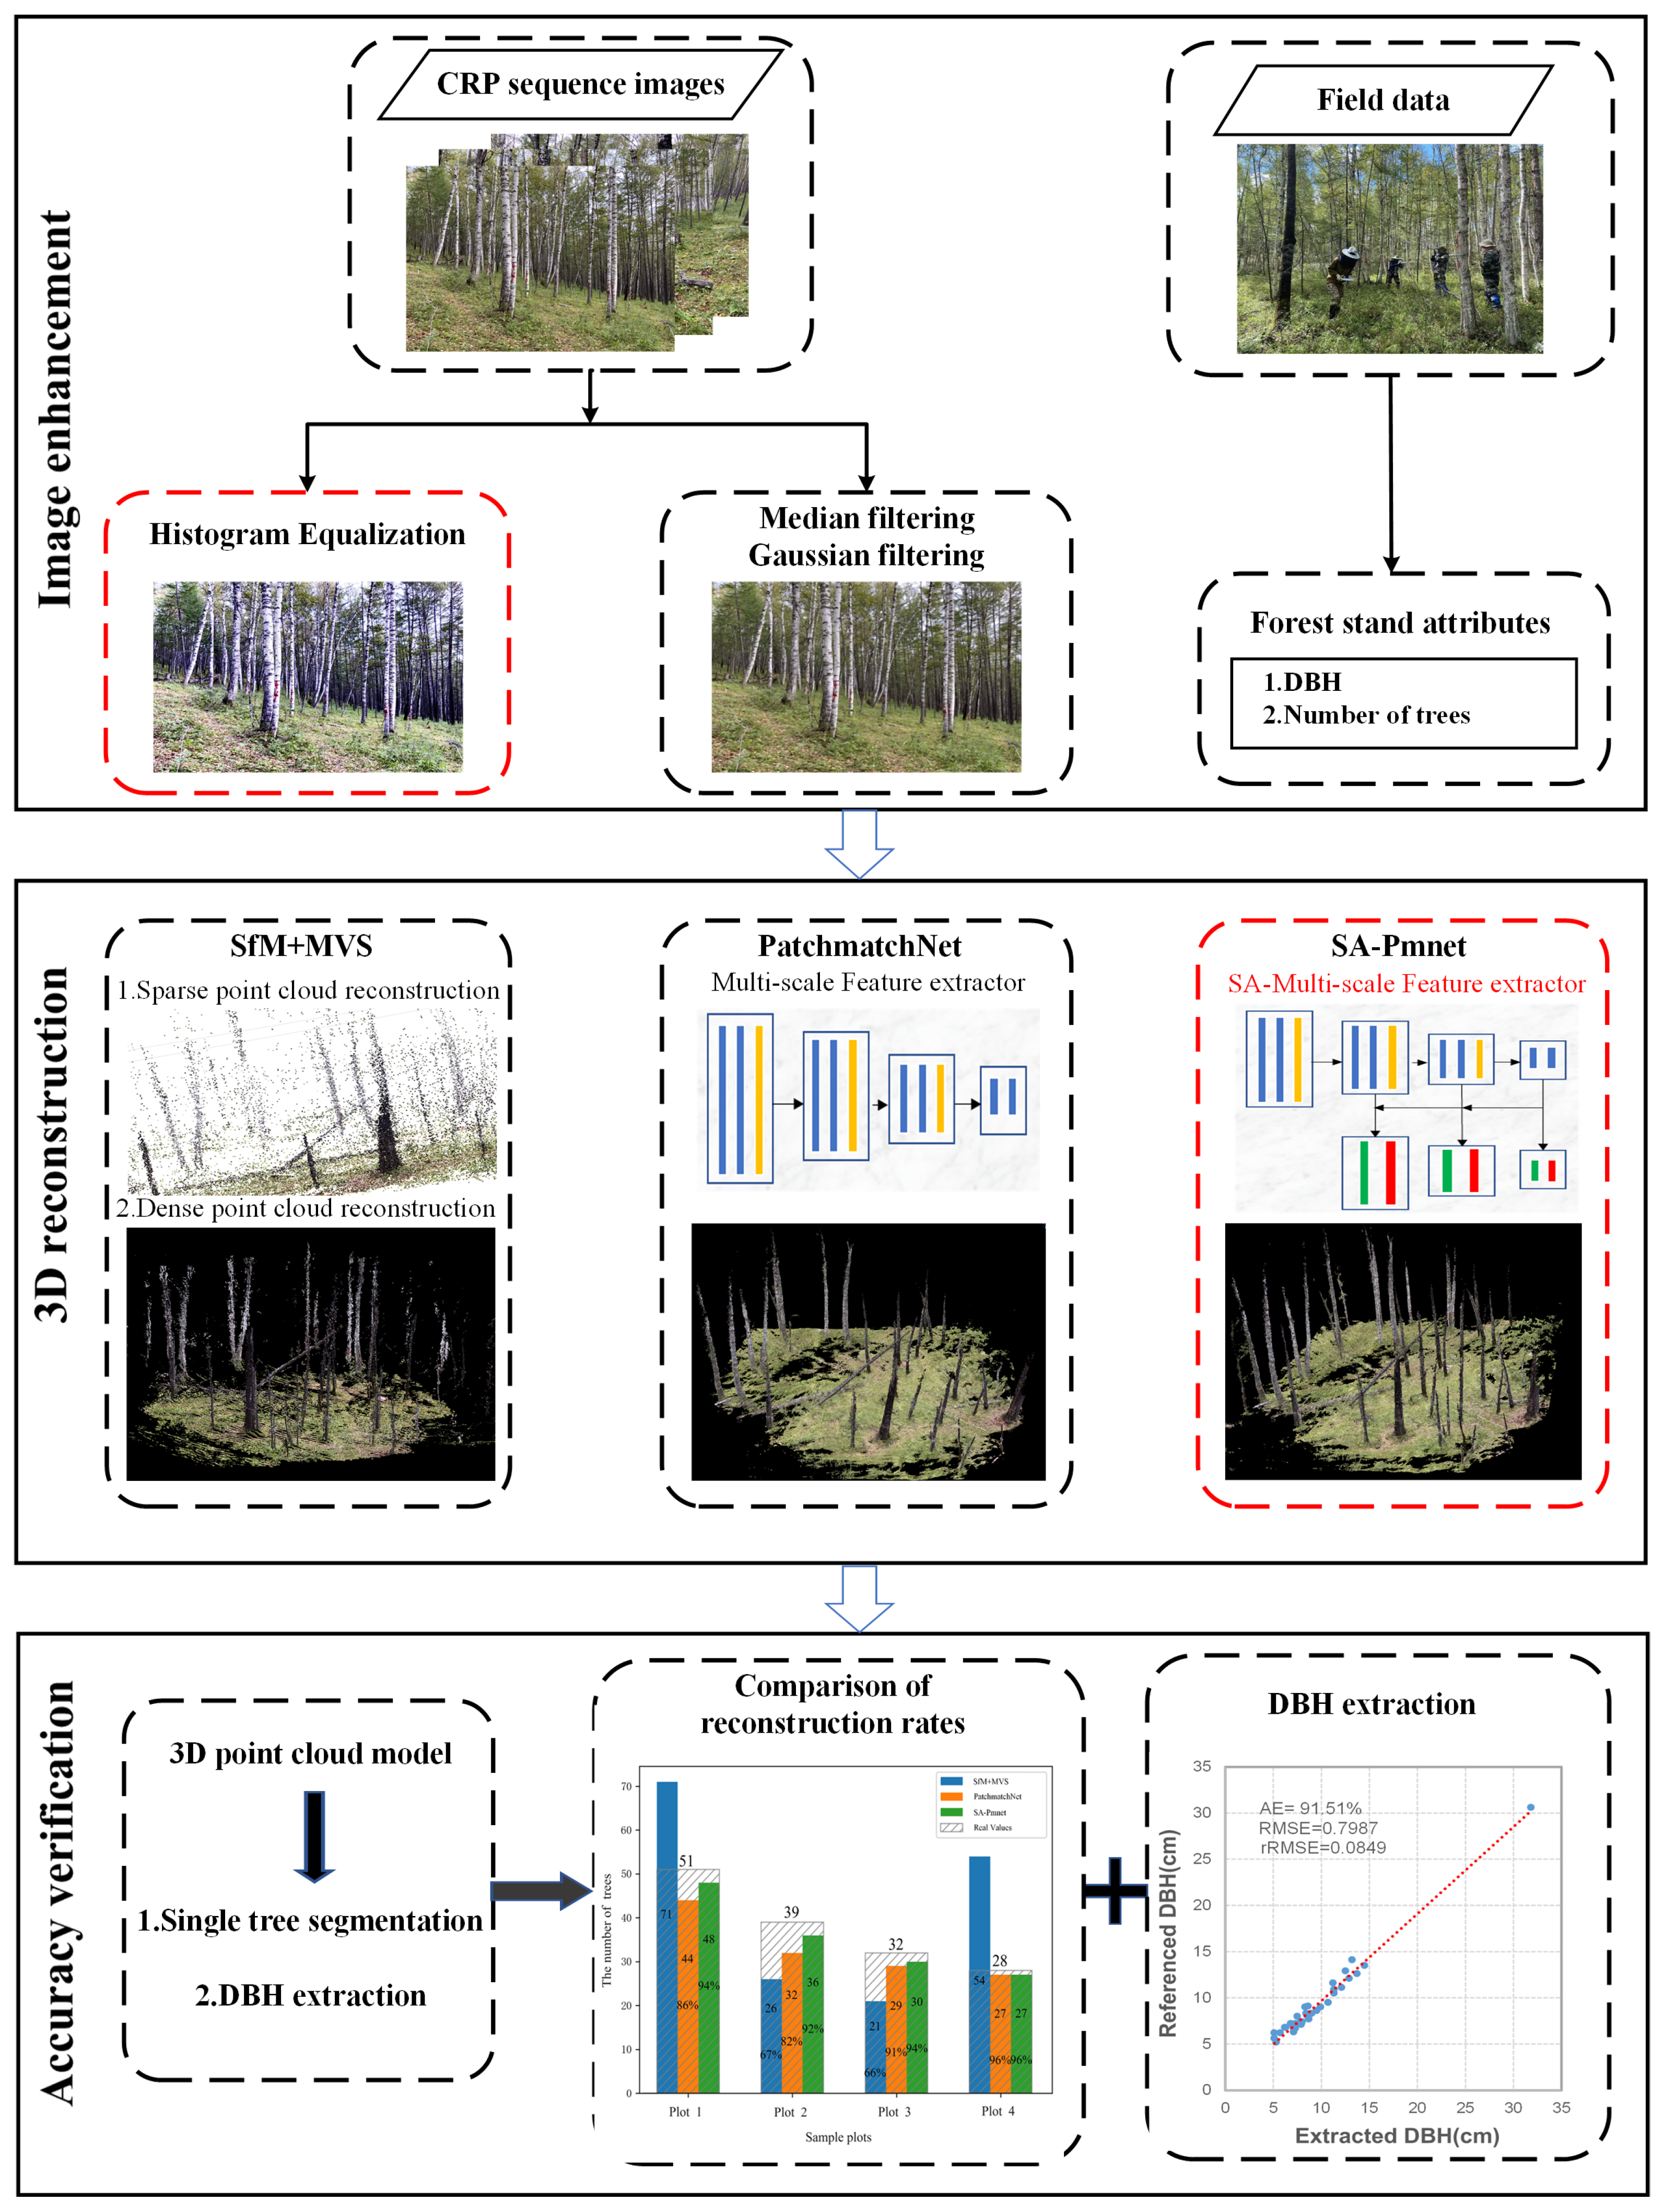
An overview of the workflow is shown in Figure 2, which encompasses the following procedures: (1) sequential image enhancement of the four plots, (2) presentation of SA-Pmnet model and comparison with SfM+MVS algorithm and PatchmatchNet model in generating the 3D model, and (3) extraction of the parameters and evaluation of the applicability of the SA-Pmnet model using accuracy validation.

2.3.1. Image Enhancement

Occlusion and shadow in forest environments can cause uneven illumination within images, consequently impacting image quality and the accuracy of extracting pertinent information. Intense lighting results in blurred boundaries, whereas weak lighting reduces grayscale values in localized areas, concealing detailed information. Enhancing the quality of captured image sequences before conducting feature detection is crucial. Taking into account the requirements and objectives of feature detection, we compared histogram equalization and median–Gaussian filtering algorithms to identify the suitable image enhancement method for detecting tree features in forest scenes.
  • Median–Gaussian filtering
The spatial enhancement algorithm processes the grayscale values of every pixel in the image based on their respective positions [39]. The median filter is a simple and efficient spatial filter that reduces image noise while preserving edge information. In the context of precise 3D reconstruction of forest scenes, the detailed features of the image are particularly important, especially for the identification of tree trunks and ground edges. Low-lying branches and shrubs are the primary sources of noise that affect the accuracy of the reconstruction model. The Gaussian filter enhances trunk edges by emphasizing the edge information within the image. To address this, a 3×3 filtering window is employed, enabling sequential application of both the median filter and Gaussian high-pass filter. This process effectively removes noise and enhances the edge information in the image.
2.
Histogram Equalization
Histogram equalization (HE) serves as a widely adopted image enhancement technique for improving image contrast and facilitating visual analysis and processing [40]. By redistributing the grayscale levels of image pixels, it ensures a more uniform distribution of pixel values across the entire grayscale range, thereby enhancing the visual quality of the image. In this experiment, we divided the color image into three channels (blue, green, and red), individually applying histogram equalization to each channel, and subsequently merging the equalized channels to obtain the resultant histogram-equalized color image.

2.3.2. 3D Model Reconstruction

(1) SA-Pmnet
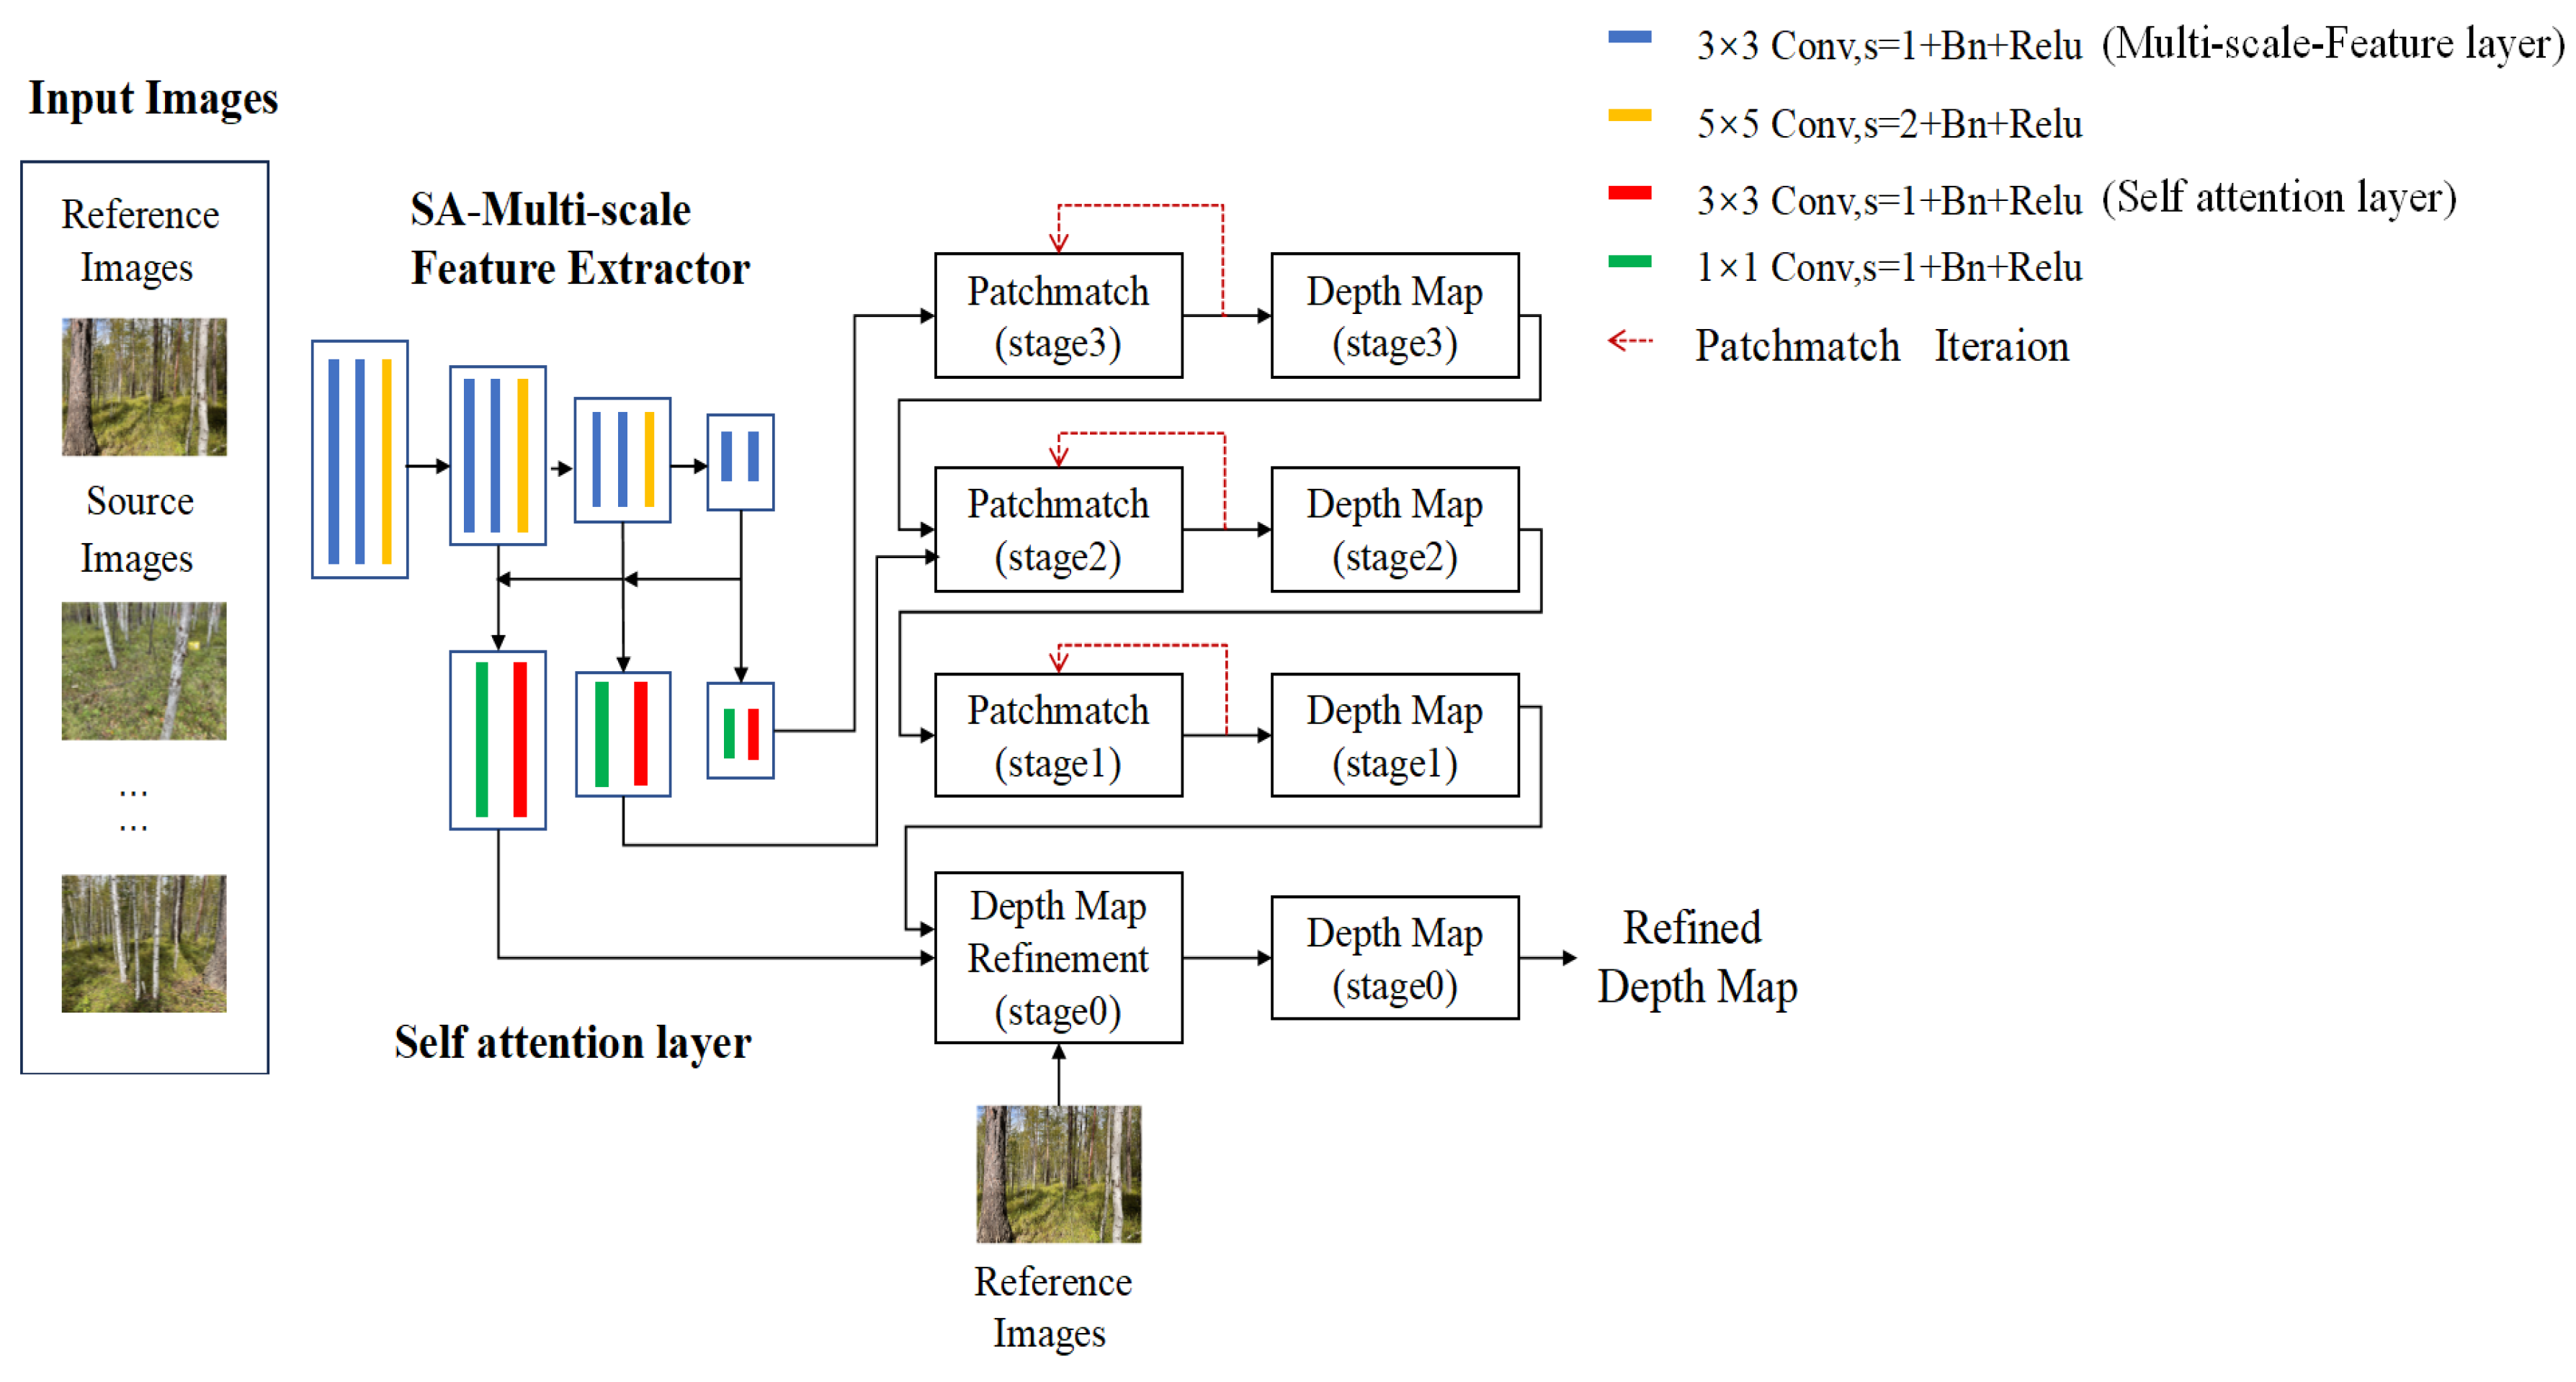
SA-Pmnet is a network that utilizes a reference image and multiple source images as input with the core task of generating a depth map for each reference image. The network’s innovation lies in its incorporation of a self-attention mechanism into the feature extraction process. This integration enables the capture of global information, resulting in a larger receptive field and contextual awareness. Consequently, it enhances the feature extraction capability and produces higher-quality depth maps. The primary modules of this network model consist of multi-scale feature extraction utilizing the self-attention mechanism and a learnable Patchmatch approach for progressively refining results. The specific structure of the network is shown in Figure 3.
Self-Attention Multi-scale Feature extractor:
The self-attention multi-scale feature extraction (SA-MsFe) module is shown in Figure 4. Overall, the architecture adopts the Feature Pyramid Network [41] (FPN), which includes convolutional layers and self-attention layers. The feature extraction process involves two steps: first, performing pixel-level feature extraction on the input reference image and source images at multiple resolutions; second, inputting the pixel features into the self-attention layer at the lowest resolution level, followed by convolution and subsequent input of the final pixel features to the corresponding stage of the learnable Patchmatch module. During this process, the upsampled features are fused with those obtained from the previous convolutional layer, serving as input for the self-attention layer at a higher resolution level.
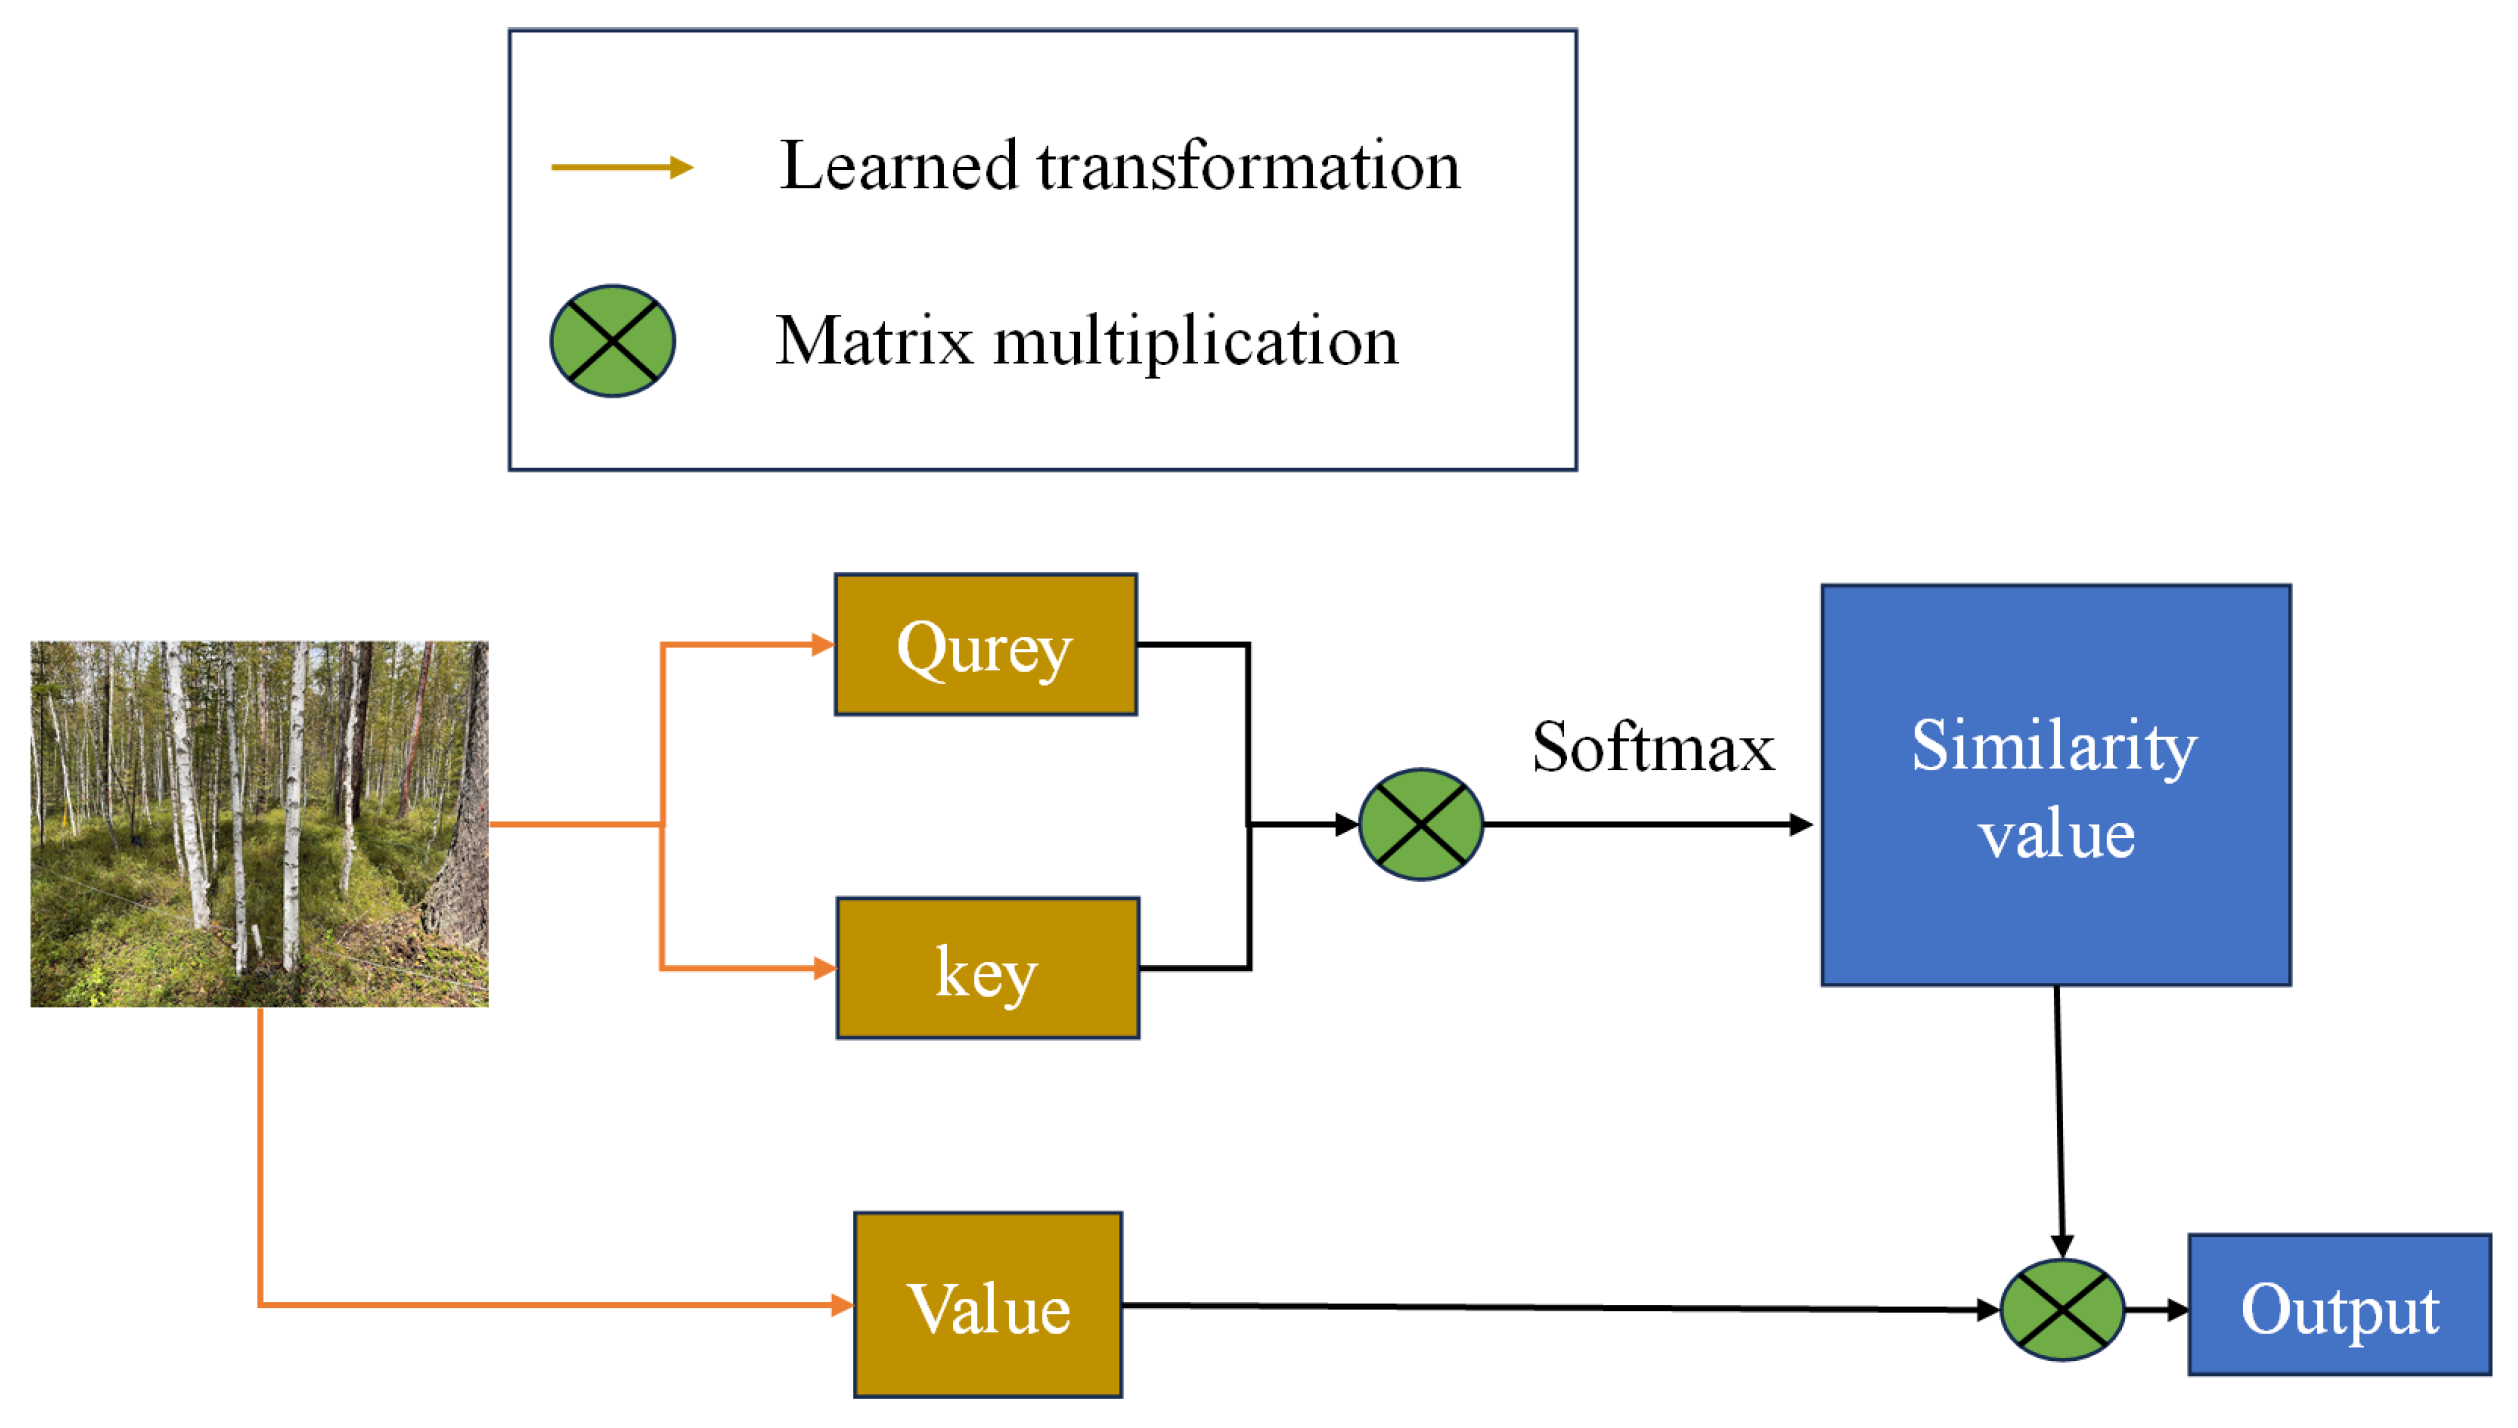
In this paper, the feature pyramid network incorporates a self-attention mechanism to acquire significant depth information. Self-attention connects various positions within a sequence and aims to compute the sequence’s representation (Figure 2). It is designed for a single context and can establish dependencies directly without considering their respective positions in the input or output sequences. The attention function maps queries and a set of key-value pairs to an output, wherein queries, keys, and values are all vectors. The output is obtained by weighing the query values, and the assignment of weights relies on the compatibility between query results and corresponding keys. The specific formula is as follows [42]:
y u v = m , n B s o f t m a x m n ( q u v T k m n ) v m n
In the equation, q u v = W Q x u v represents the query, k m n = W k x m n represents the key, and v m n = W V x m n represents the value. The matrix W p ( p = Q , K , V ) is a weight matrix that is learned and composed of learning parameters. B corresponds to an image block utilized for the convolution calculation, which possesses the same dimensions as the convolution kernel. Lastly, y u v denotes the output.
The equation involves three steps:
  • Calculating the queries ( q u v ), keys ( k m n ), and values ( v m n );
  • Assessing their similarity by computing the inner product of queries and keys ( q u v T k m n ), followed by mapping the similarity into the range of (0,1) using the softmax operation;
  • Assigning weights to the similarity values from step 2, repeating these steps for each pixel in B, and ultimately summing all the outputs.
Matrix W Q is employed to extract pixel information across all channels surrounding m m n , while matrix W k is responsible for extracting information from all channels within x m n . Therefore, matrices W Q and W K are utilized to quantify similarity. Additionally, matrix W V is employed as a linear transformation to map x m n from input channels to output channels.
Learnable PatchMatch:
The traditional PatchMatch algorithm is capable of rapidly searching for approximate nearest neighbor matches between image blocks. By employing iterative steps including initialization, cost propagation, and random search, it efficiently identifies matching pixel blocks. In comparison to the traditional PatchMatch, the learnable PatchMatch algorithm introduces neural networks to acquire the knowledge of similarity between matching pixel blocks, enabling it to handle more intricate matching tasks. The learnable PatchMatch algorithm comprises three main steps:
  • Depth initialization, which involves the generation of random depth hypotheses;
  • Propagation, in which the depth hypotheses are propagated to neighboring pixels;
  • Evaluation, focusing on the computation of matching costs for all depth hypotheses and the selection of the optimal solution.
This structure serves as the central component of the network. Following the feature extraction process, the feature map is fed into this structure, and subsequent steps encompass depth map initialization, matching cost calculation, cost aggregation, and depth estimation, culminating in the generation of a coherent depth map. Finally, by integrating the depth map, the generation of a point cloud model is achieved.
Experimental environment and details:
Hardware environment: a CPU with 8 cores and 64GB of memory, along with an NVIDIA GeForce RTX 3090 (NVIDIA Corporation, Santa Clara, CA, USA) graphics card, which has 24GB of memory.
Software environment: Ubuntu 20.04.3 LTS, Python 3.8, PyTorch 1.10.1, CUDA 11.1, and cuDNN 8.0.5.
During the training phase, images with a resolution of 640 × 512 are utilized. To account for GPU consumption, the batch size is set to 1, with each batch containing 1 reference image and 4 source images. For training, a total of 49 × 7 × 128 images were used, acquired from the DTU dataset accessed on 13 June 2023. (https://roboimagedata.compute.dtu.dk). These images consist of 49 positions, 7 different lighting intensities, and 128 scenes in total. Regarding the preset depth assumption range, it spans from 425 mm to 935 mm. The number of PatchMatch iterations in stages 3, 2, and 1 are set to 2, 2, and 1, respectively. In stages 3, 2, and 1, the number of random perturbations is set to 16, 8, and 1, respectively. Furthermore, the neighborhood size for adaptive propagation is established as 16, 8, and 0 in stages 3, 2, and 1, respectively, while the neighborhood size for adaptive matching cost aggregation is set to 9. As for the network’s initial learning rate, it is set to 0.001. At the 10th, 12th, and 14th epochs, the learning rate is halved, resulting in a total of 16 epochs of training. Lastly, the Adam optimizer is employed with β1 = 0.9 and β2 = 0.999.
(2) SfM+MVS
The traditional method for reconstructing 3D (3D) scenes based on visual geometry primarily relies on the geometric information embedded in two-dimensional (2D) images as prior knowledge. This process can be divided into two main steps: SfM and MVS. Sparse reconstruction recovers the 3D coordinates of feature points and camera poses from the images, while dense reconstruction utilizes depth maps to perform registration and reconstruct dense point clouds.
SfM determines the spatial and geometric relationships of objects through camera movements. First, feature points are extracted from a given set of multi-view images using feature extraction algorithms. These points are then matched, and only the ones that satisfy geometric constraints are retained. Second, the intrinsic and extrinsic camera parameters are calculated based on the matching points, and the spatial coordinates of the points are triangulated. In order to achieve better reconstruction results, techniques such as bundle adjustment [43] can be employed to iteratively refine the camera parameters and scene structure.
MVS utilizes the corresponding images and camera parameters obtained from sparse reconstruction to reconstruct a dense point cloud model using multi-view stereo vision. Given the known camera parameters, the epipolar geometry principle is employed to locate corresponding points on the source images for every point on the reference image. By making different assumptions regarding disparities, a 3D matrix cost volume is obtained. The aggregated cost volume is then used to calculate the optimal depth value for each pixel. Depth map optimization techniques, including view consistency detection and brightness consistency constraints, are applied to eliminate incorrect depth values, leading to further enhancement and smoothing of the depth map quality. Finally, a fusion method [44] based on visibility, stability, or confidence is utilized to merge the depth maps acquired from multiple viewpoints, ultimately generating a dense point cloud.

2.4. Accuracy Verification

The results obtained from DBH measurements are utilized as reference data for evaluating the accuracy of various parameters, including the reconstruction rate (r), root mean square error (RMSE), relative root mean square error (rRMSE), and accuracy evaluation (AE). The formula is as follows [45]:
r = n m × 100 %
where n is the number of reconstructed trees, and M is the number of trees in the plot.
R M S E = 1 n i = 1 n ( T e x t r a c t i o n T t r u t h ) 2
r R M S E = R M S E x ¯ × 100 %
A E = ( 1 r R M S E ) × 100 %
Here, n is the number of reconstructed trees, T e x t r a c t i o n is the value of extracted DBH, and T t r u t h is the value of measured DBH.

3. Results

3.1. Results of Different Image Enhancement Methods

3.1.1. Image Enhancement

The image enhancement results of the histogram equalization (HE) and median–Gaussian (MG) filtering algorithms are shown in Figure 5. It can be seen that after applying the HE algorithm, the overall brightness of the images of all sample plots was significantly enhanced, while the texture features of the trees became clearer. This effect is especially prominent in sample plots 1 and 4, which have large shadows under the forest due to excessive light. After the histogram equalization process, the contrast of the shadowed area is greatly increased, which makes the details that were originally covered by the shadows stand out, and the image is subsequently more conducive to the detection and matching of feature points. Although MG filtering makes the image smoother overall and effectively removes some of the noise, it also brings some negative effects. Especially on the tree trunks and the ground, we can observe the loss of some texture and detail information. This may adversely affect further feature point matching and 3D reconstruction.

3.1.2. Results of Feature Matching

The results of feature point matching are shown in Figure 6. The yellow lines indicate the same feature points detected in two consecutive images. It can be observed that the distribution of matching points is mainly concentrated on the ground and tree trunks. In the original image processed by the median–Gaussian filtering, the number of total matching points does not increase significantly, while there are some wrong matches. After the histogram equalization, the matching feature points are significantly increased, and the number of feature points in the trunk position is also improved accordingly, which reduces the influence of sunlight on the pictures. This experiment was repeated with two methods for four sample plots, and similar results were obtained.
Typically, low vegetation is the main source of noise in the images. As can be seen from Table 2, in sample plots 1 and 2, which have more understory shrubs and weeds, the number of feature point matches of the images processed by MG filtering is improved more, with improvements in matching point pairs of 12 and 24, respectively. Whereas in sample plots 3 and 4 with a relatively clear understory, the number of feature point matches does not increase significantly and even decreases after MG filtering. However, after being processed using the HE algorithm, the contrast of the images is adjusted to capture details in the shadows and avoid uneven light distribution; thus, the number of feature point matches in the four sample plots reaches 72, 103, 116, and 97, respectively, which is improved by 2–3 times compared with the original images.

3.2. 3D Forest Model Reconstruction Results

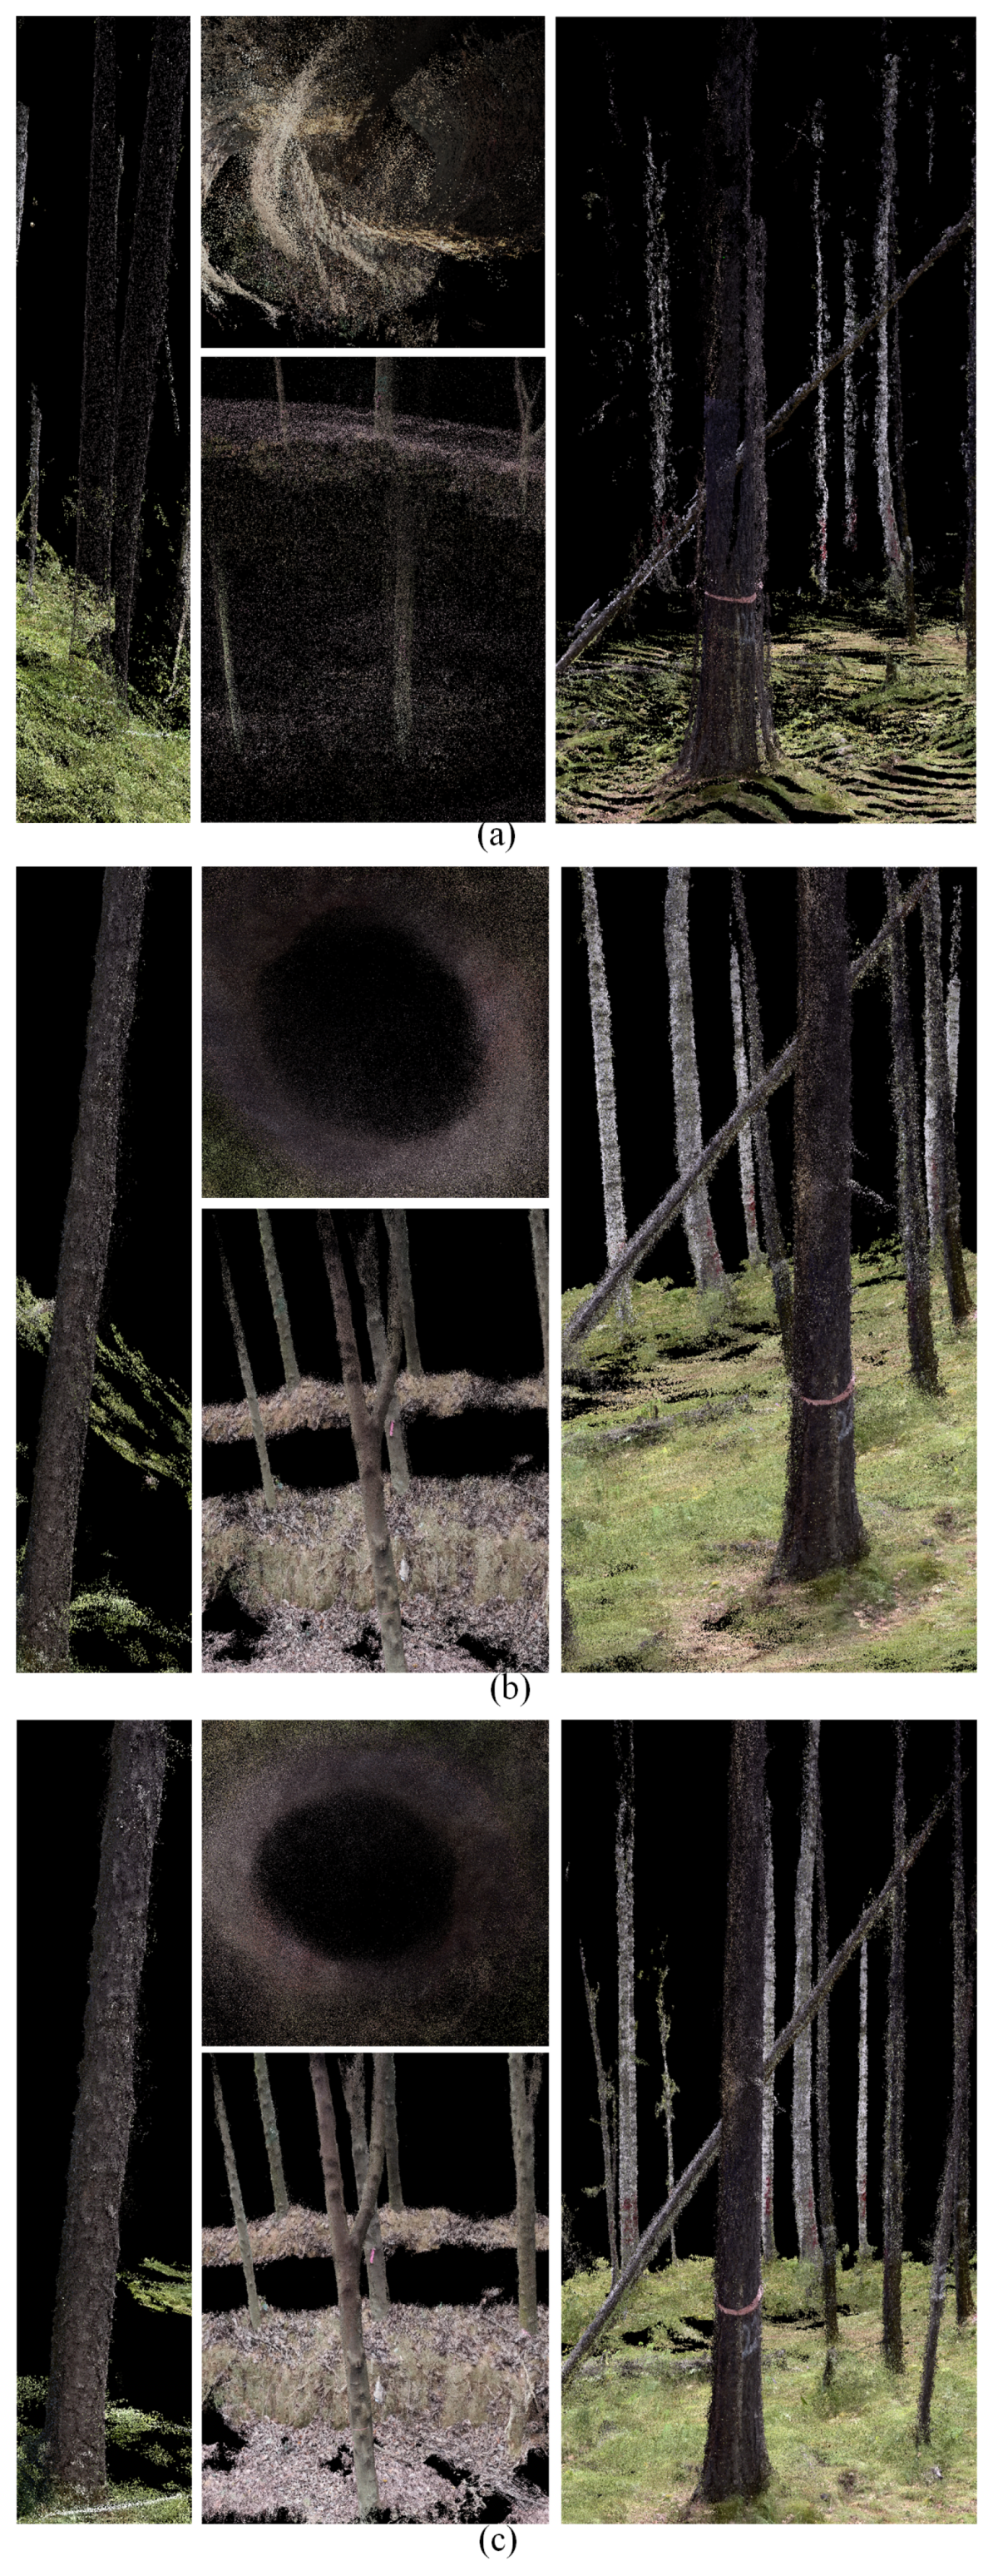
Figure 7 and Table 3 show the 3D reconstruction results and point cloud density information of the different reconstruction models after histogram equalization filtering for all the images. The results show that SfM+MVS is more seriously affected by environmental factors in recovering the forest scene, resulting in sparse point clouds on the ground and tree trunks. In sample plots 1 and 4 with larger slopes, the same tree is reconstructed several times to different degrees, which seriously affects the quality of the point cloud. Compared to the SfM+MVS algorithm, both deep learning models increase the point cloud density by 3 to 8 times, resulting in improved accuracy and 3D model quality. Particularly, the point cloud density of the 3D model generated by SA-Pmnet network based on the self-attention mechanism is also slightly higher than that of PatchmatchNet, indicating that the supplementation of detail information makes the point cloud model denser.
Table 4 compares the computational time complexity of different methods. Deep learning models usually have a large number of parameters and complex network structures, which makes them require more computational resources. The overall computational time of the SfM+MVS algorithm is less than that of the deep learning methods, and the computational times of the PatchmatchNet and SA-Pmnet models are basically the same.
Figure 8 shows the point cloud details at the same locations in the four sample plots, for comparing the variability between different models. It is observed that in the 3D models using the SfM+MVS algorithm, the point clouds at the trunk and ground are relatively sparse, the overall point cloud density is low, and they are greatly affected by environmental factors, such as slope and shading, leading to incorrect matching of feature points. As a result, multiple duplicate trees were generated at the same location, causing a large impact on subsequent parameter extraction. In contrast, the models generated using the PatchmatchNet and SA-Pmnet deep learning network have a high point cloud density without tree trunk overlapping and produce a more realistic reconstruction of the forest scenes. However, in terms of model details, the trunk texture generated using SA-Pmnet is clearer compared to PatchmatchNet, and the trunk contour is closer to a circle at the location of DBH, which is favorable for the subsequent DBH extraction of the tree.

3.2.1. Reconstruction Rate Results

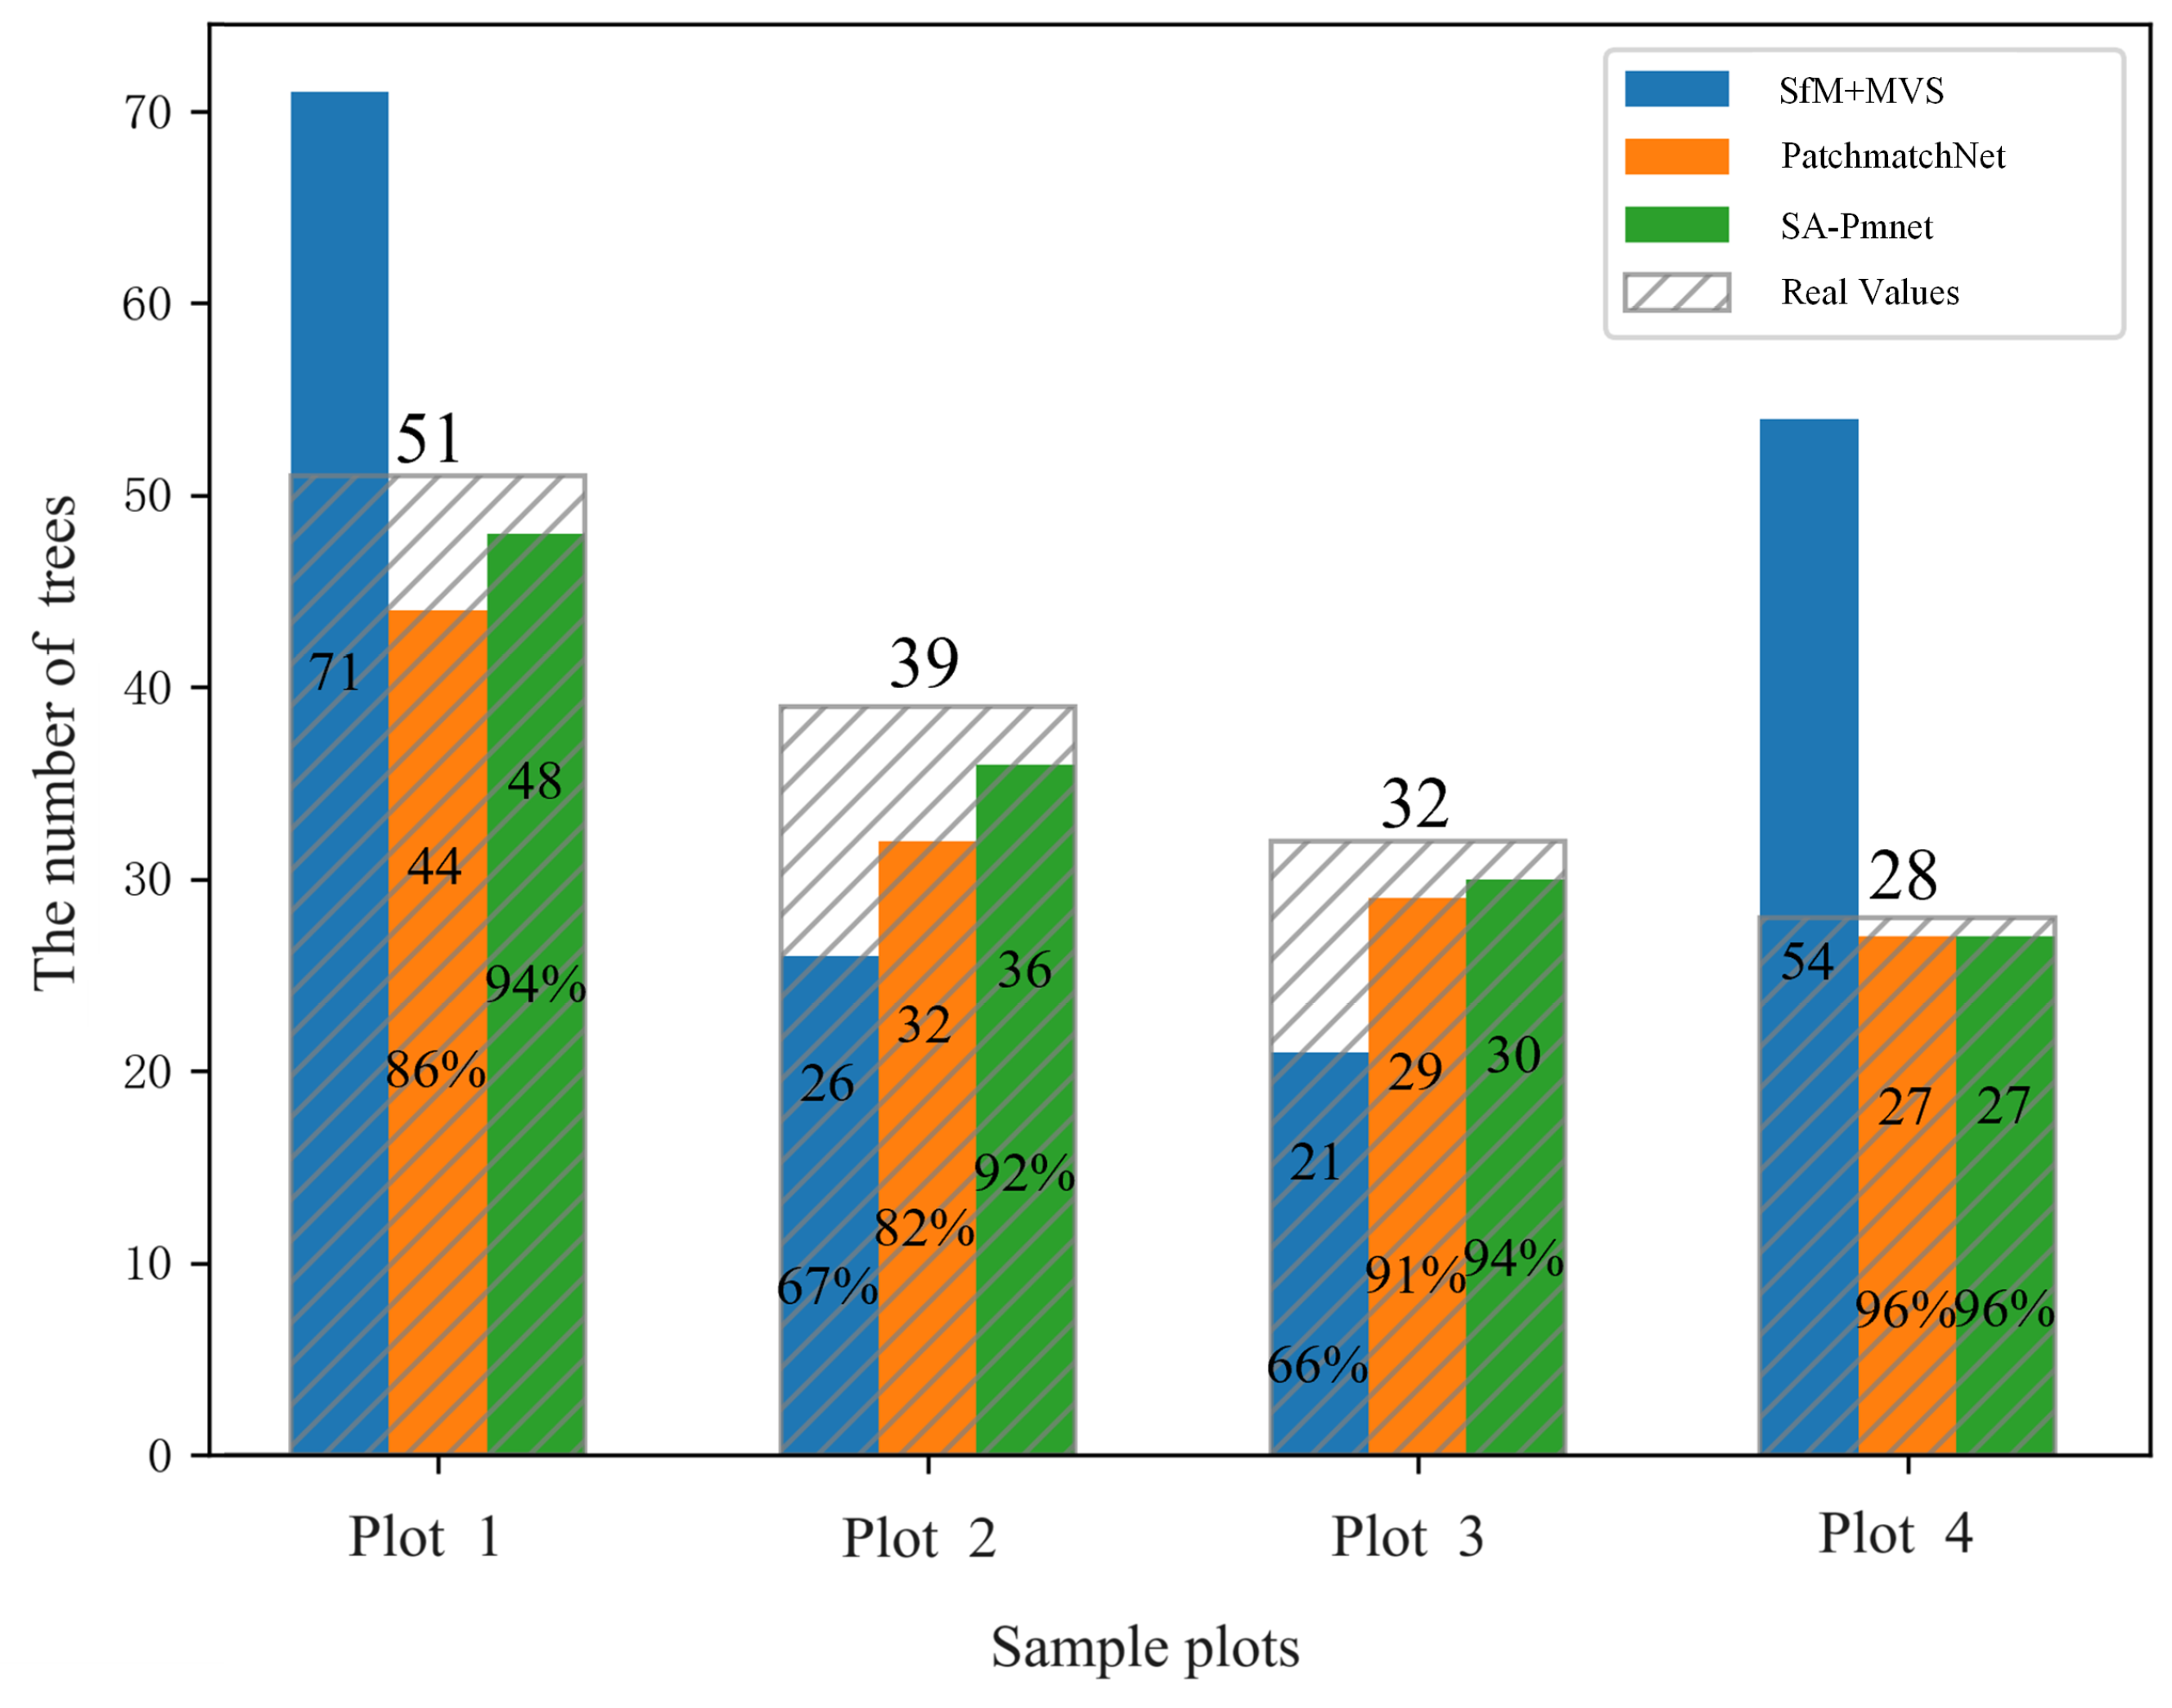
To validate the reconstruction results of the different methods, we used LiDAR360 software (V6.0.3.0) to perform preprocessing, including point cloud filtering and point cloud normalization, and counted the number of trees in each model using single-tree segmentation. The results are shown in Figure 9. The two numbers in the columns represent the number of reconstructed trees and the reconstruction rate, separately. In sample plots 1 and 4 with large slopes, the SfM+MVS algorithm incorrectly reconstructed single trees into multiple repetitive models. Thus, the number of trees in the generated 3D point cloud model far exceeded the true number. The reconstruction rates of 67% and 66% in the other two sample plots are also unsatisfactory overall. However, the results using the deep learning approaches are much closer to the real situation. The SA-Pmnet network model achieves reconstruction rates of 94%, 92%, 94%, and 96% in the four sample plots. It is worth noting that the self-attention mechanism plays a significant role in sample plots 1 and 2, which have more understory shrubs and weeds, resulting in 8% and 10% improvements in the reconstruction rate, respectively, compared with the PatchmatchNet model. This indicates that the self-attention mechanism can improve the reconstruction accuracy of the point cloud to a great extent in the complex understory environment.

3.2.2. Individual Tree DBH Extraction

The overall point cloud density of the SfM+MVS algorithm is low, and the trunks appear to overlap, which is not favorable for DBH extraction. Therefore, the two deep learning networks models were utilized to extract DBH of individual trees in the four plots, and their accuracies were compared. Figure 10 and Table 5 demonstrate that both deep learning networks models have good performance in terms of DBH extraction accuracy. In particular, the accuracies of DBH extracted from the model generated by the SA-Pmnet network reach 91.83%, 91.51%, 93.55%, and 92.35%, and the overall accuracies are higher than those of the PatchmatchNet model, with improvements of 1.89%, 0.85%, 0.71%, and 1.03%, respectively. In the sample plots with a greater slope, the enhancement is more pronounced, indicating that the self-attention mechanism can reduce the influence of topographic factors on the results and extract the DBH parameter more accurately under the complex forest environmental conditions.

4. Discussion

In this paper, we explored a forest 3D scene reconstruction method that combines image enhancement and deep learning-based 3D reconstruction techniques. The method can effectively solve the problems of low image quality and low model reconstruction rates caused by the complex forest environment. We used a histogram equalization algorithm to improve the quality of the images and proposed a deep learning network model based on the self-attention mechanism SA-Pmnet to improve the ability of feature extraction, which in turn generates high-quality point cloud models. Ultimately, high-precision DBH extraction based on the reconstruction of 3D models for forest visualization was achieved.

4.1. The Effects of Different Image Enhancement Algorithms on Feature Matching

In the task of multi-view 3D reconstruction of forest scenes, improving the quality of the original images is an essential process to improve the accuracy of 3D reconstruction of forest scenes. Through our research on median–Gaussian filtering and histogram equalization algorithms, we discover that the median–Gaussian filtering algorithm can effectively remove the noise in the images, make the images smooth, and retain the edge information in the images [46]. However, it also causes the loss of detail information in the central part of the image, which results in no significant increase in the number of feature matching points in the trunk with some false matches. In contrast, the histogram equalization algorithm significantly increases the contrast of the image, making the details of the shaded parts clearly visible [47]. Compared with the original images and the matching results after using the median–Gaussian filtering algorithm, the histogram equalization algorithm can significantly increase the total number of feature points, and the feature points in the trunk area are more concentrated, which is more conducive to the three-dimensional reconstruction of the tree model and the subsequent parameter extraction. At the same time, the method is suitable for situations such as large shadows in the understory area resulting from excessive sunlight and an uneven brightness distribution due to poor light quality, which helps to reduce the limitation of weather, topography, and other environmental conditions for investigators to collect data in the field.
Our findings also highlight that the uneven distribution of lighting is a crucial factor affecting the matching of feature points. The histogram equalization algorithm can reduce the impact of lighting conditions effectively, and the median–Gaussian filtering algorithm is ideal for eliminating noise in forest environments with low and dense vegetation. Therefore, different image enhancement algorithms should be considered to improve image quality when dealing with different environmental conditions. Additionally, in sample plots 1 and 4, the number of feature point matches is significantly lower compared to other sample plots, primarily due to the steep terrain and mutual occlusion of understory vegetation. This further shows that the terrain factor has a large impact on the matching of image feature points [48].

4.2. The Differences between the SfM+MVS Algorithm and Deep Learning Models for 3D Models

This paper compared the accuracy of the SfM+MVS algorithm and deep learning models for 3D reconstruction of forest scenes. The result shows that in the forest scene with a gentle slope and simple environment, the point cloud model generated by the SfM+MVS algorithm has a low density, and the number of reconstructed trees is less than the actual number [49]. In the sample plots with a large slope and more shrubs and weeds, the same problem exists, and the number of trees in the generated point cloud model exceeds the actual number of trees due to the large slope of the sample plots and the high similarity of texture features in the scene, which reduces the number of feature points and mis-matching, resulting in the generation of multiple repetitive models for a single tree. Therefore, the SfM+MVS algorithm requires high-quality original images and is not suitable for complex forest scenes.
In contrast, the deep learning methods surpasses traditional algorithms by learning and comprehending scene features from datasets and utilizing neural networks for feature extraction and matching. This approach produces high-quality point cloud models and enhances the reconstruction rate and point cloud density. The data presented in Figure 9 and Table 5 indicate that the deep learning method closely aligns with actual measurements in terms of reconstructing the number of trees and extracting DBH. Even in complex environments with steep slopes, the deep learning method achieves remarkable reconstruction rates of around 80% to 90%. Its flexibility and adaptability make it a potent tool for tackling the challenges of 3D model reconstruction under diverse forest and terrain conditions. These findings further underscore the immense potential of deep learning in forest visualization management.

4.3. The Superiority of the SA-Pmnet Network Model

The complexity of forest environments, including uneven terrain, high repetition in texture features, and obstruction by shrubs and grass, poses significant challenges to the recovery of 3D models [50,51]. Therefore, careful attention to the details in images is crucial for generating high-quality point cloud models.
This study proposed the SA-Pmnet network model, which integrates the self-attention mechanism with the multi-scale feature extraction module in the PatchmatchNet network. This combination allows for improved handling of the intricate textures and structures of tree trunks and vegetation in images. It enables the capture of boundaries and details of different objects and facilitates the establishment of associations between various regions, thereby enhancing the model’s understanding of the image content [52]. Additionally, the vegetation cover and camera position limitations in forests may result in occluded areas or low-resolution captures. The self-attention multi-scale feature extraction (SA-MsFe) module can identify and address these issues by balancing local and global features and extracting pixel-level features at different resolutions, leading to the more accurate 3D restoration.
The experimental results indicate that the SA-Pmnet model surpasses the PatchmatchNet model in performance. The reconstruction rate of the model in the four sample plots reaches 94%, 92%, 94%, and 96%, respectively. In the understory complex sample plots 1 and 2, the reconstruction rate shows a more significant improvement compared with the PatchmatchNet network, with increases of 8% and 10%, respectively. This demonstrates that the self-attention multi-scale feature extraction module can substantially reduce the effect of low reconstruction rate due to occlusion. Meanwhile, the extraction accuracy of DBH is improved by 1.89%, 0.85%, 0.71%, and 1.03%, respectively, compared with the PatchmatchNet model. The accuracy improvement is significantly higher in sample plots 1 and 4, which have larger slopes. Consequently, the self-attention mechanism lessens the impact of errors attributable to terrain factors in deep learning 3D reconstruction tasks. Moreover, it also enhances the model’s ability to capture fine details, thereby fulfilling the requirement for high-precision extraction of individual tree parameter. Therefore, the SA-Pmnet model proposed in this paper is not only applicable to the planted and natural forests in the north and south of China mentioned in this paper, but is also suitable for forest samples with complex environments. In addition, better reconstruction results can be achieved compared with the traditional 3D reconstruction algorithms.

4.4. Research Limitations

In this study, the relationship between the size of the sample plots and the number of images taken was not taken into account when obtaining stand sequence photographs to ensure that the sample plot as a whole was densely photographed. This resulted in a large number of redundant images in the data, which increased the time of the field survey task and reduced the efficiency of network operation. Additionally, the image quality improvement in this study was solely achieved using the histogram equalization algorithm, without incorporating other algorithms that account for diverse environmental conditions, which remains for further improvement and validation in other tree species and sample plot environments with different densities.

5. Conclusions

This study proposes a SA-Pmnet model, a deep learning network based on the self-attention mechanism. By incorporating the self-attention mechanism into the feature extraction network for multi-scale extraction, this network enhances feature extraction capabilities and captures more details in deep inference tasks. For solving the problem of uneven light distribution, the histogram equalization algorithm increases the number of feature point matches and improves the image quality. The feasibility of the proposed method was validated in four typical artificial and natural forests in northern and southern China. The results show that the reconstruction rate of the point cloud model in the four sample plots reaches 94%, 92%, 94%, and 96%, and the extraction accuracy for DBH reaches 91.83%, 91.51%, 93.55%, and 92.35%, respectively. It demonstrates the effectiveness of the proposed model in 3D reconstruction and DBH extraction of individual trees in complex forest conditions, which has significant potential for application in forest precision survey and visualized management.

Author Contributions

X.Y. completed the experiments and wrote the paper. G.C. designed the specific scheme. L.L. and X.H. completed the result data analysis. G.W. and X.J. collected field data. X.Z. modified and directed the writing of the paper. All authors have read and agreed to the published version of the manuscript.

Funding

This research was funded by the National Natural Science Foundation of China (grant number: 32171779), the National Key Research and Development Program of China (grant number: 2021YFE0117700), and Dragon 5 Cooperation [ID: 59257].

Data Availability Statement

The data presented in this study are available on request from the corresponding author. The data are not publicly available due to privacy.

Acknowledgments

We are grateful for support from the National Natural Science Foundation of China (grant number: 32171779), the National Key Research and Development Program of China (grant number: 2021YFE0117700), and Dragon 5 Cooperation [ID: 59257].

Conflicts of Interest

The authors declare no conflicts of interest.

References

  1. Chirico, G.B.; Bonavolontà, F. Metrology for Agriculture and Forestry 2019. Sensors 2020, 20, 3498. [Google Scholar] [CrossRef] [PubMed]
  2. Holopainen, M.; Vastaranta, M.; Hyyppä, J. Outlook for the next Generation’s Precision Forestry in Finland. Forests 2014, 5, 1682–1694. [Google Scholar] [CrossRef]
  3. You, L.; Tang, S.; Song, X.; Lei, Y.; Zang, H.; Lou, M.; Zhuang, C. Precise Measurement of Stem Diameter by Simulating the Path of Diameter Tape from Terrestrial Laser Scanning Data. Remote Sens. 2016, 8, 717. [Google Scholar] [CrossRef]
  4. Yu, R.; Ren, L.; Luo, Y. Early Detection of Pine Wilt Disease in Pinus Tabuliformis in North China Using a Field Portable Spectrometer and UAV-Based Hyperspectral Imagery. For. Ecosyst. 2021, 8, 44. [Google Scholar] [CrossRef]
  5. Akay, A.E.; Oǧuz, H.; Karas, I.R.; Aruga, K. Using LiDAR Technology in Forestry Activities. Environ. Monit. Assess. 2009, 151, 117–125. [Google Scholar] [CrossRef]
  6. Faugeras, O.D.; Luong, Q.T.; Maybank, S.J. Camera Self-Calibration: Theory and Experiments. In Computer Vision—ECCV’92, Proceedings of the Second European Conference on Computer Vision, Santa Margherita, Italy, 19–22 May 1992; Lecture Notes in Computer Science (including subseries Lecture Notes in Artificial Intelligence and Lecture Notes in Bioinformatics); Sandini, G., Ed.; Springer: Berlin/Heidelberg, Germany, 1992. [Google Scholar]
  7. Andrew, A.M. Multiple View Geometry in Computer Vision. Kybernetes 2001, 30, 1333–1341. [Google Scholar] [CrossRef]
  8. Petschko, H.; Goetz, J.; Böttner, M.; Firla, M.; Schmidt, S. Erosion Processes and Mass Movements in Sinkholes Assessed by Terrestrial Structure from Motion Photogrammetry. In Advancing Culture of Living with Landslides; Springer: Berlin/Heidelberg, Germany, 2017. [Google Scholar]
  9. Liang, X.; Wang, Y.; Jaakkola, A.; Kukko, A.; Kaartinen, H.; Hyyppä, J.; Honkavaara, E.; Liu, J. Forest Data Collection Using Terrestrial Image-Based Point Clouds from a Handheld Camera Compared to Terrestrial and Personal Laser Scanning. IEEE Trans. Geosci. Remote Sens. 2015, 53, 5117–5132. [Google Scholar] [CrossRef]
  10. Mokro, M.; Liang, X.; Surový, P.; Valent, P.; Čerňava, J.; Chudý, F.; Tunák, D.; Saloň, I.; Merganič, J. Evaluation of Close-Range Photogrammetry Image Collection Methods for Estimating Tree Diameters. ISPRS Int. J. Geo-Inf. 2018, 7, 93. [Google Scholar] [CrossRef]
  11. Forsman, M.; Holmgren, J.; Olofsson, K. Tree Stem Diameter Estimation from Mobile Laser Scanning Using Line-Wise Intensity-Based Clustering. Forests 2016, 7, 206. [Google Scholar] [CrossRef]
  12. Mikita, T.; Janata, P.; Surovỳ, P. Forest Stand Inventory Based on Combined Aerial and Terrestrial Close-Range Photogrammetry. Forests 2016, 7, 156. [Google Scholar] [CrossRef]
  13. Chai, G.; Zheng, Y.; Lei, L.; Yao, Z.; Chen, M.; Zhang, X. A Novel Solution for Extracting Individual Tree Crown Parameters in High-Density Plantation Considering Inter-Tree Growth Competition Using Terrestrial Close-Range Scanning and Photogrammetry Technology. Comput. Electron. Agric. 2023, 209, 107849. [Google Scholar] [CrossRef]
  14. Yang, H.; Meng, X.; Liu, Y.; Cheng, J. Measurement and Calculation Methods of a Stem Image Information. Front. For. China 2006, 1, 59–63. [Google Scholar] [CrossRef]
  15. Ullman, S. The Interpretation of Structure from Motion. Proc. R. Soc. Lond. B Biol. Sci. 1979, 203, 405–426. [Google Scholar] [CrossRef] [PubMed]
  16. Schonberger, J.L.; Frahm, J.M. Structure-from-Motion Revisited. In Proceedings of the IEEE Computer Society Conference on Computer Vision and Pattern Recognition, Las Vegas, NV, USA, 27–30 June 2016. [Google Scholar]
  17. Luhmann, T. Close Range Photogrammetry for Industrial Applications. ISPRS J. Photogramm. Remote Sens. 2010, 65, 558–569. [Google Scholar] [CrossRef]
  18. Gao, L.; Zhao, Y.; Han, J.; Liu, H. Research on Multi-View 3D Reconstruction Technology Based on SFM. Sensors 2022, 22, 4366. [Google Scholar] [CrossRef] [PubMed]
  19. Slocum, R.K.; Parrish, C.E. Simulated Imagery Rendering Workflow for Uas-Based Photogrammetric 3d Reconstruction Accuracy Assessments. Remote Sens. 2017, 9, 396. [Google Scholar] [CrossRef]
  20. Puliti, S.; Ørka, H.O.; Gobakken, T.; Næsset, E. Inventory of Small Forest Areas Using an Unmanned Aerial System. Remote Sens. 2015, 7, 9632–9654. [Google Scholar] [CrossRef]
  21. Zarco-Tejada, P.J.; Diaz-Varela, R.; Angileri, V.; Loudjani, P. Tree Height Quantification Using Very High Resolution Imagery Acquired from an Unmanned Aerial Vehicle (UAV) and Automatic 3D Photo-Reconstruction Methods. Eur. J. Agron. 2014, 55, 89–99. [Google Scholar] [CrossRef]
  22. Zhang, Y.; Wu, H.; Yang, W. Forests Growth Monitoring Based on Tree Canopy 3D Reconstruction Using UAV Aerial Photogrammetry. Forests 2019, 10, 1052. [Google Scholar] [CrossRef]
  23. Berveglieri, A.; Imai, N.N.; Tommaselli, A.M.G.; Casagrande, B.; Honkavaara, E. Successional Stages and Their Evolution in Tropical Forests Using Multi-Temporal Photogrammetric Surface Models and Superpixels. ISPRS J. Photogramm. Remote Sens. 2018, 146, 548–558. [Google Scholar] [CrossRef]
  24. Xu, C.; Wu, C.; Qu, D.; Xu, F.; Sun, H.; Song, J. Accurate and Efficient Stereo Matching by Log-Angle and Pyramid-Tree. IEEE Trans. Circuits Syst. Video Technol. 2021, 31, 4007–4019. [Google Scholar] [CrossRef]
  25. Yang, B.; Ali, F.; Yin, P.; Yang, T.; Yu, Y.; Li, S.; Liu, X. Approaches for Exploration of Improving Multi-Slice Mapping via Forwarding Intersection Based on Images of UAV Oblique Photogrammetry. Comput. Electr. Eng. 2021, 92, 107135. [Google Scholar] [CrossRef]
  26. Jing, L.; Zhao, M.; Li, P.; Xu, X. A Convolutional Neural Network Based Feature Learning and Fault Diagnosis Method for the Condition Monitoring of Gearbox. Measurment 2017, 111, 1–10. [Google Scholar] [CrossRef]
  27. Yao, Y.; Luo, Z.; Li, S.; Fang, T.; Quan, L. MVSNet: Depth Inference for Unstructured Multi-View Stereo. In Proceedings of the IEEE International Conference on Computer Vision, Salt Lake City, UT, USA, 18–23 June 2018. [Google Scholar]
  28. Luo, K.; Guan, T.; Ju, L.; Huang, H.; Luo, Y. P-MVSNet: Learning Patch-Wise Matching Confidence Aggregation for Multi-View Stereo. In Proceedings of the IEEE International Conference on Computer Vision, Seoul, Republic of Korea, 27 October–2 November 2019. [Google Scholar]
  29. Xue, Y.; Chen, J.; Wan, W.; Huang, Y.; Yu, C.; Li, T.; Bao, J. MVSCRF: Learning Multi-View Stereo with Conditional Random Fields. In Proceedings of the IEEE International Conference on Computer Vision, Seoul, Republic of Korea, 27 October–2 November 2019. [Google Scholar]
  30. Gu, X.; Fan, Z.; Zhu, S.; Dai, Z.; Tan, F.; Tan, P. Cascade Cost Volume for High-Resolution Multi-View Stereo and Stereo Matching. In Proceedings of the IEEE Computer Society Conference on Computer Vision and Pattern Recognition, Seattle, WA, USA, 13–19 June 2020. [Google Scholar]
  31. Yang, J.; Mao, W.; Alvarez, J.M.; Liu, M. Cost Volume Pyramid Based Depth Inference for Multi-View Stereo. In Proceedings of the IEEE Computer Society Conference on Computer Vision and Pattern Recognition, Seattle, WA, USA, 13–19 June 2020. [Google Scholar]
  32. Yu, Z.; Gao, S. Fast-MVSNet: Sparse-to-Dense Multi-View Stereo with Learned Propagation and Gauss-Newton Refinement. In Proceedings of the IEEE Computer Society Conference on Computer Vision and Pattern Recognition, Seattle, WA, USA, 13–19 June 2020. [Google Scholar]
  33. Yi, H.; Wei, Z.; Ding, M.; Zhang, R.; Chen, Y.; Wang, G.; Tai, Y.W. Pyramid Multi-View Stereo Net with Self-Adaptive View Aggregation. In Computer Vision—ECCV 2020, Proceedings of the 16th European Conference, Glasgow, UK, 23–28 August 2020; Proceedings of the Lecture Notes in Computer Science (including subseries Lecture Notes in Artificial Intelligence and Lecture Notes in Bioinformatics); Springer: Berlin/Heidelberg, Germany, 2020. [Google Scholar]
  34. Yu, A.; Guo, W.; Liu, B.; Chen, X.; Wang, X.; Cao, X.; Jiang, B. Attention Aware Cost Volume Pyramid Based Multi-View Stereo Network for 3D Reconstruction. ISPRS J. Photogramm. Remote Sens. 2021, 175, 448–460. [Google Scholar] [CrossRef]
  35. Zhang, J.; Li, S.; Luo, Z.; Fang, T.; Yao, Y. Vis-MVSNet: Visibility-Aware Multi-View Stereo Network. Int. J. Comput. Vis. 2023, 131, 199–214. [Google Scholar] [CrossRef]
  36. Zhang, J.; Ji, M.; Wang, G.; Xue, Z.; Wang, S.; Fang, L. SurRF: Unsupervised Multi-View Stereopsis by Learning Surface Radiance Field. IEEE Trans. Pattern Anal. Mach. Intell. 2022, 44, 7912–7927. [Google Scholar] [CrossRef] [PubMed]
  37. Wang, F.; Galliani, S.; Vogel, C.; Speciale, P.; Pollefeys, M. PatchMatchNet: Learned Multi-View Patchmatch Stereo. In Proceedings of the IEEE Computer Society Conference on Computer Vision and Pattern Recognition, Nashcille, TN, USA, 20–25 June 2021. [Google Scholar]
  38. Barnes, C.; Shechtman, E.; Finkelstein, A.; Goldman, D.B. PatchMatch. ACM Trans. Graph. 2009, 28, 1–11. [Google Scholar] [CrossRef]
  39. Chen, H.; Li, A.; Kaufman, L.; Hale, J. A Fast Filtering Algorithm for Image Enhancement. IEEE Trans. Med. Imaging 1994, 13, 557–564. [Google Scholar] [CrossRef]
  40. Cheng, H.D.; Shi, X.J. A Simple and Effective Histogram Equalization Approach to Image Enhancement. Digit. Signal Process. A Rev. J. 2004, 14, 158–170. [Google Scholar] [CrossRef]
  41. Lin, T.Y.; Dollár, P.; Girshick, R.; He, K.; Hariharan, B.; Belongie, S. Feature Pyramid Networks for Object Detection. In Proceedings of the 30th IEEE Conference on Computer Vision and Pattern Recognition (CVPR), Honolulu, HI, USA, 21–26 July 2017. [Google Scholar]
  42. Vaswani, A.; Shazeer, N.; Parmar, N.; Uszkoreit, J.; Jones, L.; Gomez, A.N.; Kaiser, Ł.; Polosukhin, I. Attention Is All You Need. In Proceedings of the Advances in Neural Information Processing Systems, Long Beach, CA, USA, 4–9 December 2017. [Google Scholar]
  43. Triggs, B.; McLauchlan, P.F.; Hartley, R.I.; Fitzgibbon, A.W. Bundle Adjustment—A Modern Synthesis. In Vision Algorithms: Theory and Practice, Proceedings of the International Workshop on Vision Algorithms, Corfu, Greece, 21–22 September 1999; Lecture Notes in Computer Science (including subseries Lecture Notes in Artificial Intelligence and Lecture Notes in Bioinformatics); Springer: Berlin/Heidelberg, Germany, 2000. [Google Scholar]
  44. Merrell, P.; Akbarzadeh, A.; Wang, L.; Mordohai, P.; Frahm, J.M.; Yang, R.; Nistér, D.; Pollefeys, M. Real-Time Visibility-Based Fusion of Depth Maps. In Proceedings of the IEEE International Conference on Computer Vision, Rio de Janeiro, Brazil, 14–24 October 2007. [Google Scholar]
  45. Karunasingha, D.S.K. Root Mean Square Error or Mean Absolute Error? Use Their Ratio as Well. Inf. Sci. 2022, 585, 609–629. [Google Scholar] [CrossRef]
  46. Zhu, R.; Guo, Z.; Zhang, X. Forest 3d Reconstruction and Individual Tree Parameter Extraction Combining Close-Range Photo Enhancement and Feature Matching. Remote Sens. 2021, 13, 1633. [Google Scholar] [CrossRef]
  47. Zhu, H.; Chan, F.H.Y.; Lam, F.K. Image Contrast Enhancement by Constrained Local Histogram Equalization. Comput. Vis. Image Underst. 1999, 73, 281–290. [Google Scholar] [CrossRef]
  48. Nurminen, K.; Karjalainen, M.; Yu, X.; Hyyppä, J.; Honkavaara, E. Performance of Dense Digital Surface Models Based on Image Matching in the Estimation of Plot-Level Forest Variables. ISPRS J. Photogramm. Remote Sens. 2013, 83, 104–115. [Google Scholar] [CrossRef]
  49. Capolupo, A. Accuracy Assessment of Cultural Heritage Models Extracting 3D Point Cloud Geometric Features with RPAS SfM-MVS and TLS Techniques. Drones 2021, 5, 145. [Google Scholar] [CrossRef]
  50. Eulitz, M.; Reiss, G. 3D Reconstruction of SEM Images by Use of Optical Photogrammetry Software. J. Struct. Biol. 2015, 191, 190–196. [Google Scholar] [CrossRef]
  51. Zeng, W.; Zhong, S.; Yao, Y.; Shao, Z. 3D Model Reconstruction Based on Close-Range Photogrammetry. Appl. Mech. Mater. 2013, 263–266, 2393–2398. [Google Scholar] [CrossRef]
  52. Zhao, H.; Jia, J.; Koltun, V. Exploring Self-Attention for Image Recognition. In Proceedings of the IEEE Computer Society Conference on Computer Vision and Pattern Recognition, Seattle, WA, USA, 13–19 June 2020. [Google Scholar]
Disclaimer/Publisher’s Note: The statements, opinions, and data contained in all publications are solely those of the individual author(s) and contributor(s) and not of MDPI and/or the editor(s). MDPI and/or the editor(s) disclaim responsibility for any injury to people or property resulting from any ideas, methods, instructions, or products referred to in the content.
Figure 1. Overview of the study area. (A) Plot_1, (B) plot_2, (C) plot_3, (D) plot_4. (a) Genhe, (b) Nanning.
Remotesensing 16 00416 g001
Figure 2. The technical framework.
Remotesensing 16 00416 g002
Figure 3. The SA-Pmnet Network framework.
Remotesensing 16 00416 g003
Figure 4. The self-attention framework.
Remotesensing 16 00416 g004
Figure 5. Different image enhancement results. (a) Plot_1, (b) plot_2, (c) plot_3, (d) plot_4, 1: original images, 2: images after HE algorithm, 3: images after MG filtering.
Remotesensing 16 00416 g005
Figure 6. Feature point matching results of different image enhancement algorithms. (a) Plot_1, (b) plot_2, (c) plot_3, (d) plot_4, 1: original images, 2: images after HE algorithm, 3: images after MG filtering.
Remotesensing 16 00416 g006
Figure 7. Results of three different 3D reconstruction methods. (A) Plot_1, (B) plot_2, (C) plot_3, (D) plot_4, 1: SfM+MVS, 2: PatchmatchNet 3: SA-Pmnet.
Remotesensing 16 00416 g007
Figure 8. Details of three point cloud models. (a) SfM+MVS, (b) PatchmatchNet, (c) SA-Pmnet.
Remotesensing 16 00416 g008
Figure 9. Comparison of the reconstructed rates of the three models.
Remotesensing 16 00416 g009
Figure 10. Accuracy verification of the extracted DBH. (a) Plot_1, (b) plot_2, (c) plot_3, (d) plot_4, 1: PatchmatchNet, 2: SA-Pmnet, red dashed line: Linear Regression Line.
Remotesensing 16 00416 g010
Table 1. Sample plot information.
Sample PlotSlope (°)Major Tree SpeciesNumber of TreesStand Complexity
136Larch, Birch51Complex
29Larch, Birch39Complex
313Red oatchestnut32Simple
427Chinese fir28Medium
Table 2. Comparison of the number of feature matching point pairs.
Sample PlotsOriginal ImagesHEMG
1297241
23810362
35711645
4319739
Table 3. Comparison of point cloud densities of different methods.
Sample PlotsSfM+MVS (106)PatchmatchNet (106)SA-Pmnet (106)
13.3210.9611.78
24.7519.8720.64
32.5822.6124.05
434.5879.4684.17
Table 4. Comparison of the computational time complexity of different methods.
Sample PlotsSfM+MVS (h)PatchmatchNet (h)SA-Pmnet (h)
171010
281212
36.51010
4101515
Table 5. Comparison of the accuracy of the extracted DBH.
Sample PlotsSA-Pmnet (%)PatchmatchNet (%)Accuracy Improvement
Ratio (%)
191.8389.941.89
291.5190.660.85
393.5592.840.71
492.3591.321.03
Disclaimer/Publisher’s Note: The statements, opinions and data contained in all publications are solely those of the individual author(s) and contributor(s) and not of MDPI and/or the editor(s). MDPI and/or the editor(s) disclaim responsibility for any injury to people or property resulting from any ideas, methods, instructions or products referred to in the content.