Article

Cutting the Greenness Index into 12 Monthly Slices: How Intra-Annual NDVI Dynamics Help Decipher Drought Responses in Mixed Forest Tree Species

by
Andrea Cecilia Acosta-Hernández
,
Marín Pompa-García
*,
José Alexis Martínez-Rivas
and
Eduardo Daniel Vivar-Vivar
Laboratorio de Dendroecología, Facultad de Ciencias Forestales y Ambientales, Universidad Juárez del Estado de Durango, Río Papaloapan y Blvd. Durango s/n Col. Valle del Sur, Durango 34120, Durango, Mexico
*
Author to whom correspondence should be addressed.
Remote Sens. 2024, 16(2), 389; https://doi.org/10.3390/rs16020389
Submission received: 22 December 2023 / Revised: 11 January 2024 / Accepted: 15 January 2024 / Published: 18 January 2024

Abstract

:
We studied the correspondence between historical series of tree-ring width (TRW) and the normalized difference vegetation index (NDVI, i.e., greenness index) values acquired monthly over an entire year by unmanned aerial vehicles. Dendrochronological techniques revealed differentiated responses between species and seasonality. Pinus engelmannii Carrière and Juniperus deppeana Steudel were affected by warm temperatures (TMAX) during the winter prior to growth and benefited from precipitation (PP) during the seasons prior to the spring period. The standardized precipitation–evapotranspiration index (SPEI) confirmed the high sensitivity of P. engelmannii to drought (r = 0.7 SPEI). Quercus grisea Liebm. presented a positive association with PP at the beginning and end of its growth season. Monthly NDVI data at the individual tree level in the three species (NDVI ~0.37–0.48) statistically confirmed the temporal differences. Q. grisea showed a drastic decrease during the dry season (NDVI = 0.1) that had no impact on drought sensitivity in the same period, according to the climate-TRW relationship. We conclude that a relationship is plausible between the crown greenness index and radial growth, although more extended temporal windows of the NDVI should be explored. Differences in susceptibility to drought found among the species would presumably have implications for the composition of these forests under drought scenarios.

Graphical Abstract

1. Introduction

Climate change has caused changes in the biogeography of ecosystems [1], and rates of modification in species composition and structure are expected to increase in intensity and speed [2], with a consequent conversion of vegetation [3]. With their heterogeneity of species and ages, mixed forests make an ideal laboratory for understanding these processes of change in growth rates, phenological transitions, and relationships with the environment.
In particular, regions under drought stress, in which changes in seasonal precipitation [4,5] are associated with increasingly frequent heat waves [6], provide an excellent opportunity to improve our understanding of the susceptibility of tree species to these phenomena. These climatic adversities produce alterations in plant community composition, with implications for reduced resilience and recovery rates and thus for ecosystem functioning. Drought is recognized as an environmental disaster (see [7]) comprising different hydrometeorological variables and environmental factors, not to mention the stochastic nature of water demand [8].
However, these complex ecological mechanisms represent a research challenge given the multifactorial nature of the drivers underlying the forest response to the interconnectedness of biotic and abiotic factors [9]. For example, in response to drought stress, the tree limits its nutrient supply, with a reduction in radial growth [10], defoliation, and crown decline [11]. In other words, although the phenomenon is multifactorial, climatic adversity can be manifested in symptoms of reduced radial growth and modification of photosynthetic activity with implications for the dynamics of carbon allocation [9].
An alternative recently pursued by the scientific community is the integration of dendroecological data with remote sensing [12,13,14], assuming an interconnection between tree structures explained by the rates of increase recorded in the growth rings and vegetation indices. However, testing these connections has been challenging due to several inconsistencies that require further research [15]. For example, the limited temporal and spatial resolutions of satellite images act to increase their uncertainty in spectral resolution, especially in natural stands where there is a mix of species of uneven ages and variations in density [16]. As a current response, the advent of unmanned aerial vehicle (UAV or drone) technology has come to resolve these inconsistencies through the capacity of these devices to monitor near-real-time variations in vegetation indices at the individual tree level with a high level of reliability and flexibility [17].
One of the most widely used indices is the NDVI as a proxy for photosynthetically active biomass; this greenness index is derived from measurements of the optical reflectance of solar light in the red and near-infrared wavelengths, for which reason it is very sensitive to the conditions of the ecosystem. However, certain inconsistencies or divergences, such as foliage production over growth ring increase, still require clarification [18,19]. Thus, the combination of dendrochronological data and drones offers a promising alternative for refining our understanding of tree growth in the face of climatic variation and is now clearly positioned as a research strategy on the research agenda [9,20].
In practice, however, it is clear that scientific understanding of the conjunction of the TRW series with the NDVI poses three problems that merit further analysis to strengthen their dependence [21]: First, the spatial coverage of the tree-ring data must correspond spatially with the spectral data; second, the NDVI data are assumed to be equally correlated with TRW throughout the year, regardless of the time of sampling. Changes in phenology and combinations of species, as well as the discontinuous seasonality of satellite NDVI and the scarcity of continuous data at the tree level, produce a differential response in the seasonality of the NDVI-TRW relationship. Third, most of the studies that use the NDVI in forestry lack periodic replications that cover at least one phenological cycle in the same area, for which reason conducting continuous periodic flights from UAVs provides a comparative and novel advantage of seasonality that can contribute to scientific knowledge.
Consequently, a strategy is required to identify the contribution of the NDVI to seasonal radial wood growth, which has implications for the productivity of forest ecosystems. That is to say, the conjunction of continuous spectral data from UAVs with in situ field information on trunk growth as a product of photosynthesis is assumed to be an optimal tool to achieve a refined understanding of species growth in the face of hydroclimatic variations. In the future, this algorithm could be useful for adapting the inconsistencies found with satellite technologies [19,21].
Moreover, to our knowledge, there is no dendroecological research featuring multiple species converged in a single stand, despite the great diversity of these ecotones. Above all, these studies have excluded leafy species and tend to focus on species that are easily dated [22]. Nevertheless, from an ecological perspective, hard-to-date species such as those of Quercus, Arbutus, and Juniperus have been reported as useful for fuel, shelter, and food for fauna, among other ecological connections [23].
In this study, we evaluated the coupling of NDVI-growth relationships by comparing multispecies tree-ring data with monthly NDVI series at the individual tree level. We hypothesized that the responses would be differential as a function of species and their seasonal responses to climate.
We posed the following specific research questions: (1) What is the sensitivity to climatic variables and drought of the three species in a mixed forest? (2) What is the variation in the NDVI over the year among the species? (3) Is there a plausible correspondence between the NDVI and tree-ring width?

2. Materials and Methods

2.1. Description of the Study Area

We selected a strategic area where species of three genera cohabit in one hectare located in the Sierra Tarahumara (Figure 1). This region is considered an important source of environmental goods and services for the communities in the area [24]. The study site is characterized by young trees in a mixed forest. These forests are physiognomically dominated by the genera Pinus and Quercus, with varying proportions and species compositions, in association with species of the genera Arbutus and Juniperus [25].
The studied species belong to the genera Pinus, Quercus, and Juniperus. Pinus engelmannii Carrière is a frost-resistant species found in a wide distribution range from 1200 to 3000 m asl in elevation. Its wood is used for commercial purposes [23]. Quercus grisea Liebm. is distributed from the southern United States of America to central Mexico and can tolerate both cold damage and drought stress [26]. Its wood can be used for producing cellulose. Juniperus deppeana Steudel is distributed from the southern United States of America to the states of Michoacán and Veracruz in Mexico, at elevations of 1200 to 2900 m asl. It is a drought- and fire-resistant species that can tolerate compacted, nutrient-poor, and alkaline soils [23]. It is not a commercial species, but it is used as fuel in mountainous areas and its wood can be utilized for the production of fences or small items of furniture of high durability.

2.2. Dendrochronological Data and Processing

At least 14 dominant trees per species were randomly sampled for the dendrochronological analysis. From each tree, two increment cores were taken using a Pressler borer (Ø = 5.1 mm) as a strategy to reduce bias due to the eccentricity of the trunk pith. Diameter at breast height (DBH) and total height (TH) were also recorded (Table 1).
The samples were mounted on wooden rails and dried at around 18 °C. The extracted cores were polished with different grades of sandpaper (from 80 to 1000 in grain size) to highlight their features. The growth rings were counted and dated using a standard dendrochronological technique [27], which consists of measuring the total ring width (TRW) to an accuracy of 0.01 mm using the Velmex measuring system (Velmex Inc., Bloomfield, NY, USA). Dating was checked using the COFECHA program, which compares the series of each tree with a master chronology [28]. Standardization was then performed to eliminate biological and geometric growth trends not associated with climatic variables, using a negative exponential model to obtain the ring width indices (RWIs) for each species. Standardization and chronologies were developed using the dplR library [29,30,31]. Finally, statistics were calculated, obtaining the mean (Mean), first-order autocorrelation (AC), mean correlation among trees (Rbar), and expressed population signal (EPS). The quality of the chronologies was evaluated through the EPS value, a statistic considered to reflect well-replicated chronologies (>0.85) [32].
Following the dendroecological convention, as part of the statistical analysis [27,28], Pearson correlation indices (r) were calculated to assess the influence of local climate on radial growth. For this, correlations were performed between the climatic variables of maximum temperature (TMAX), minimum temperature (TMIN), and precipitation (PP), and the residual annual growth series of each species. Monthly climatic data obtained from the KNMI-Climate Explorer website (http://climexp.knmi.nl/, accessed on 29 August 2023) of the CRU TS 4.07 base were used for the 0.5° grid centered on the site at 27.0–27.5°N and 107.0–107.5°W. The correlation analysis window was from August of the previous year to July of the growth year.
The SPEI [33] was used to determine the influence of drought severity and duration on radial growth. This is a robust strategy in dendroecology because it allows estimation of the influence of cumulative drought, given the ability of trees to respond differentially according to the seasonality of the water stress [34]. The SPEI was obtained from the website http://sac.csic.es/spei/index.html (accessed on 30 August 2023) for the same grid as mentioned above. Values were obtained on time scales from 1 to 24 months. Finally, correlations were calculated between these values and the residual growth series for each species.

2.3. Remote Sensing Data and Procedures

To record the phenology of an entire year starting from the growth season, images were acquired monthly from April 2021 to April 2022, preferably on sunny days, around the 15th day of each month. One UAV flight per session was conducted in an east-to-west direction at around midday as a strategy to avoid changes attributable to the diurnal variation in reflectance since this time of day is reported to be ideal for recording spectral data [15]. To eliminate radiometric interference that could reduce the potential interpretation of the images and distort the results of the remote sensing analysis, we decided to perform a periodic calibration of the spectral sensor, following the procedure referred to by Daniels et al. [35]. This was fundamental to preserving the spectral quality of the images at different weather stations, and thus sustaining the capability for NDVI monitoring [36].
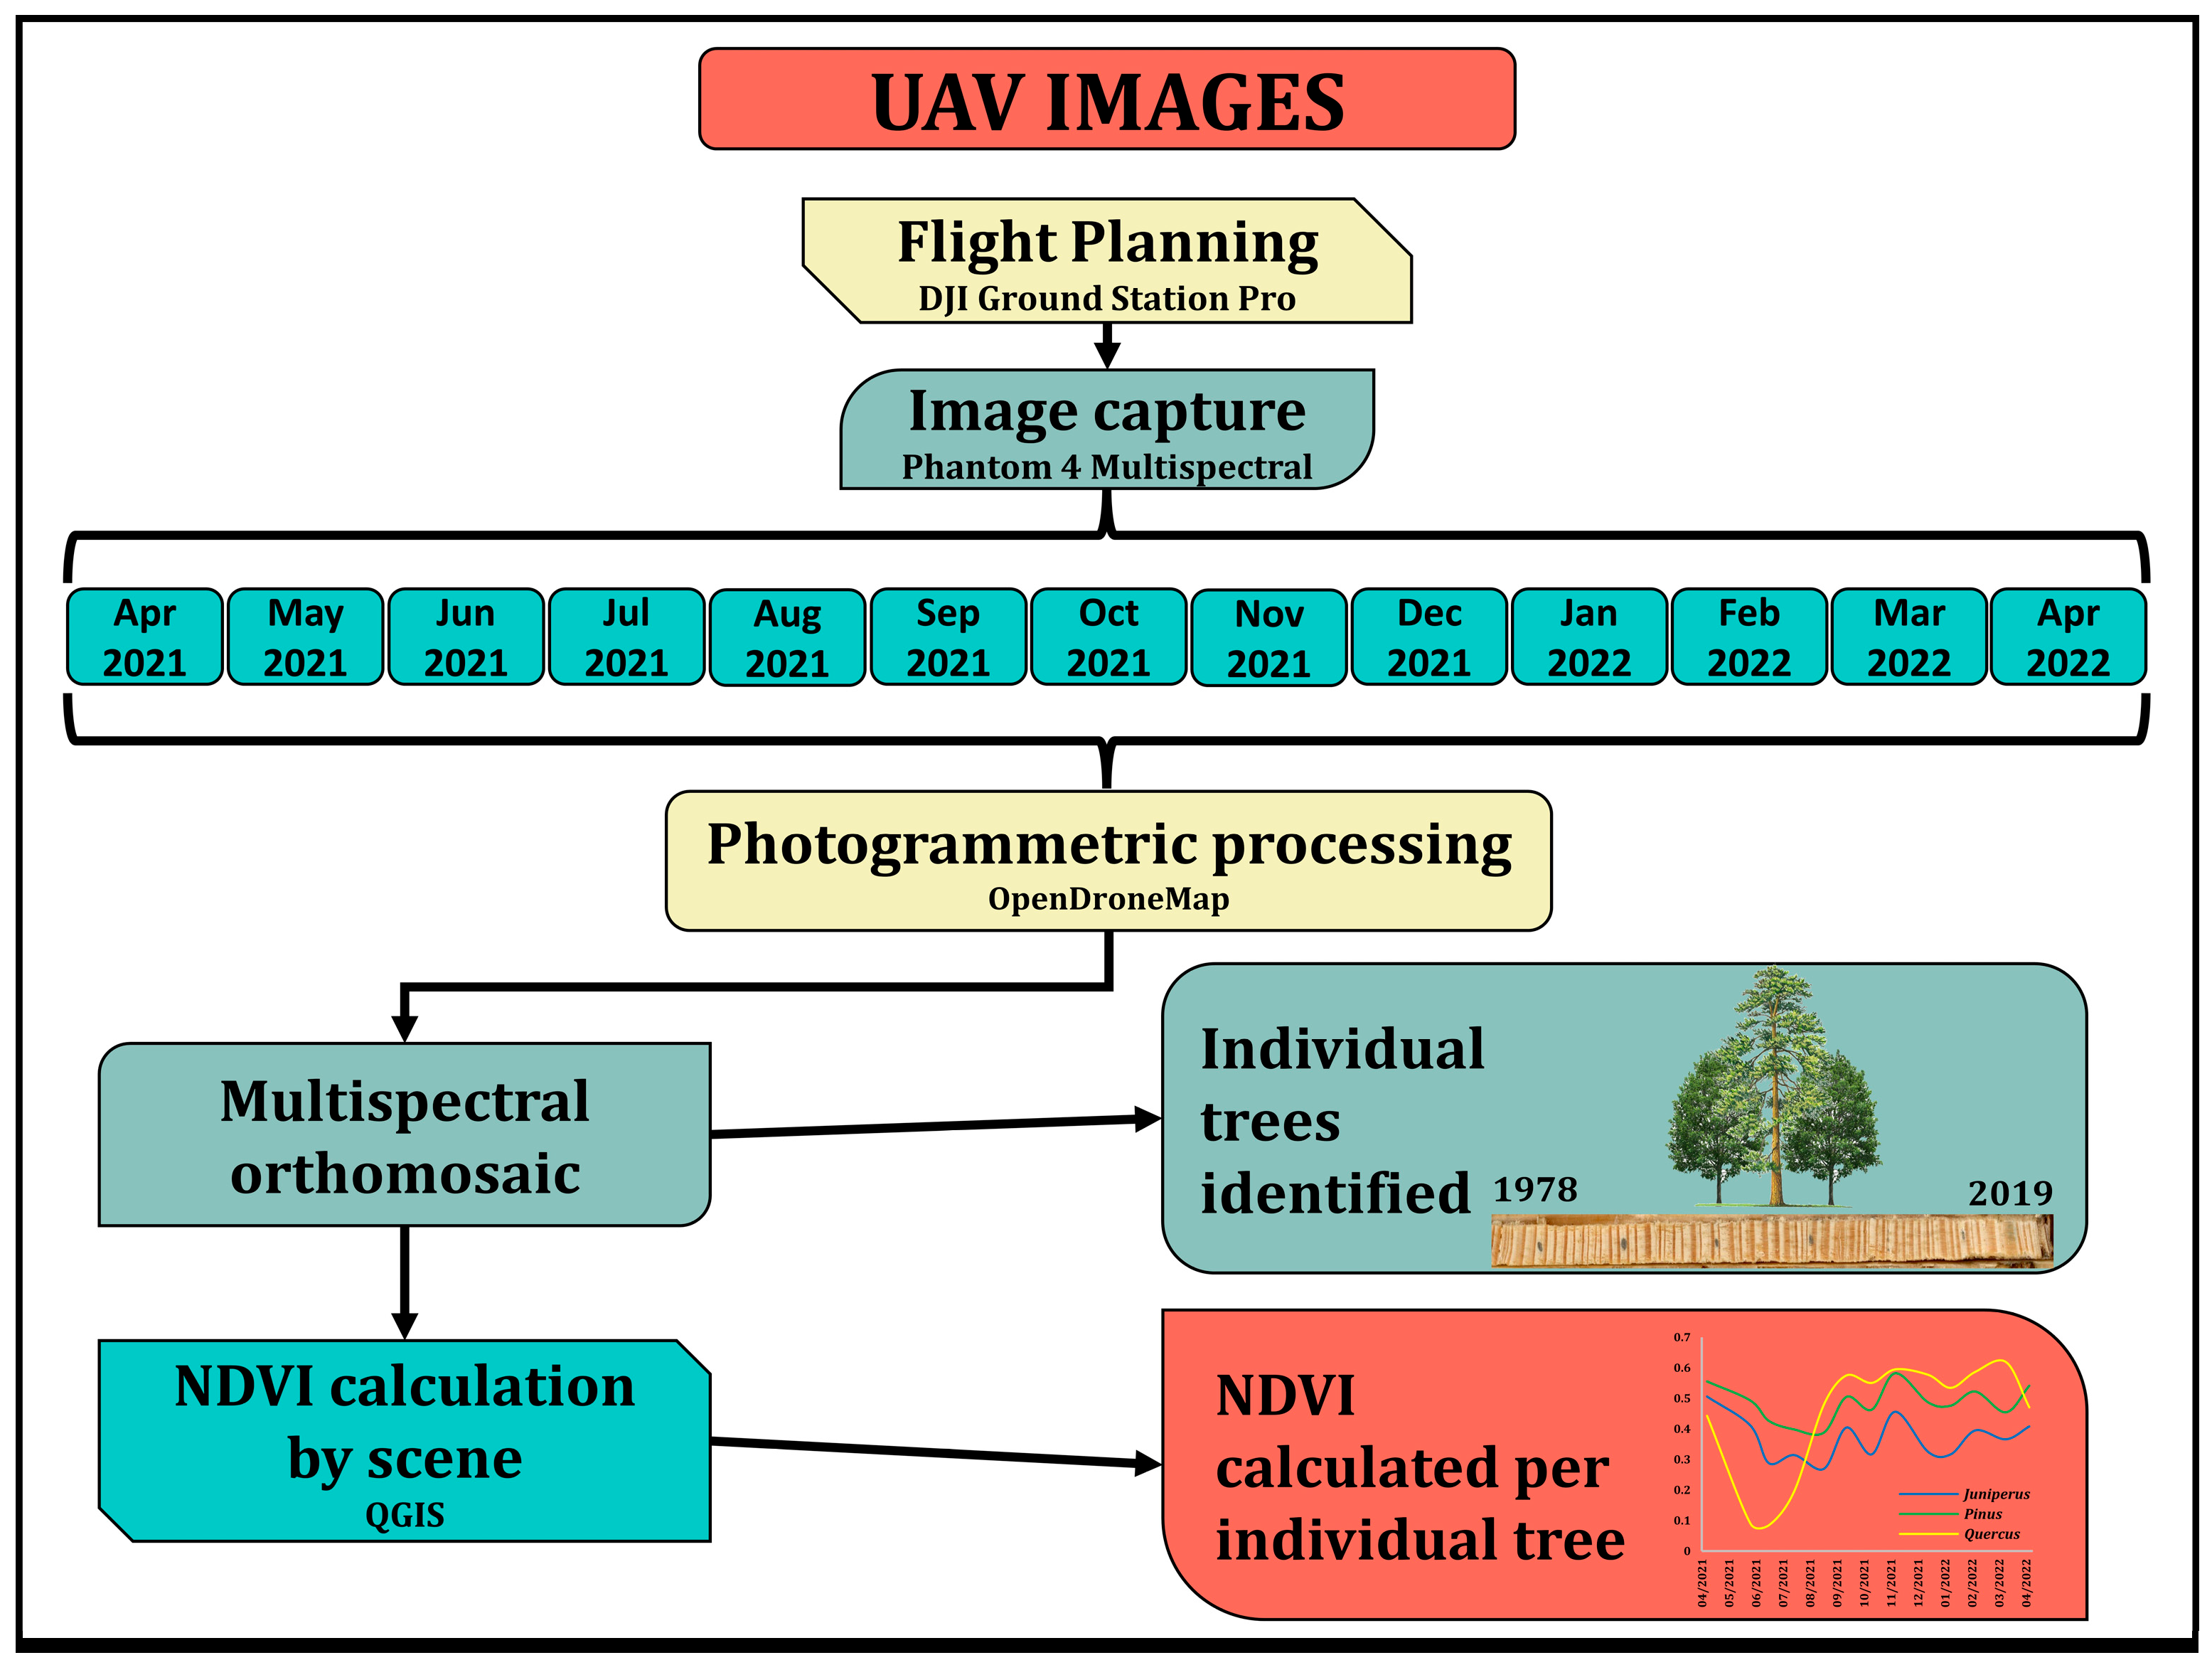
The equipment used was a DJI Phantom 4 multispectral quadcopter (Dajiang Innovation Technology Co., Shenzhen, China) equipped with an RGB digital camera and a set of five multispectral cameras, covering blue (450 nm ± 16 nm), green (560 nm ± 16 nm), red (650 nm ± 16 nm), red edge (730 nm ± 16 nm), and near-infrared (840 nm ± 26 nm) spectra, all with a global obturator of 2 MP [37]. During each flight mission, at least 846 photographs were taken in JPG format at an altitude of 60 m, with the camera fixed at an angle of 90° (e.g., the nadir angle) and overlaps of 80 and 70% in the horizontal and vertical orientations, respectively. Figure 2 illustrates the workflow followed to acquire and process the images for subsequent linkage with dendroecological data. The UAV employs an integrated georeferencing system during the flights and, therefore, we do not consider it necessary to use the real-time-kinematic (RTK) system, since this procedure allows vertical and horizontal accuracies of ±0.1 and ±0.3 m, respectively (see [37]).
The images were processed and analyzed using digital photogrammetric and computer vision techniques with the open-source software OpenDroneMap (ODM version: 2.8.4; Cleveland Metroparks, Cleveland, OH, USA, https://github.com/OpenDroneMap/ODM, accessed on 18 January 2022) version 2.8.4. LTS. This software is open access and its robust operation utilizes the structure from motion and multi-view stereo (SfM and MVS) algorithms, obtaining 3D point clouds of 1000–20,000 points m−2, resulting in a multispectral orthomosaic of good accuracy.
As part of the processing, individual trees were manually geolocated on the orthomosaic, and delimitation of the crown area was complemented with the ForestTools algorithm of the statistical software R Studio, version 4.3.1 (The R Project for Statistical Computing, Vienna, Austria). This tool also helps to delimit the tree crowns through the variable window filter algorithm. Using the zone statistics tool of QGIS version 3.16.15, descriptive NDVI statistics for each tree of the genera P. engelmannii, Q. grisea, and J. deppeana were extracted from the center of each canopy, with the mean selected as the variable of interest.
The reflectance level was calculated according to the wavelength of each band through the multispectral orthophotos at the tree level. To calculate the multispectral indices, the semiautomatic classification add-on was run in the free software QGIS. This tool allows the calculation of reflectance in a given area according to the values of each band. The photosynthetic capacity of the vegetation was obtained through the NDVI. Although a variety of indices exist, this indicator stands out as a measure of chlorophyll abundance and absorption of photosynthetically active radiation and is thus an indicator of the potential biomass captured by the tree [38]. The calculation was performed with the raster calculator of the QGIS software using the following equation:
NDVI = NIR RED NIR + RED
where NDVI = normalized difference vegetation index, NIR = near-infrared band (840 ± 26 nm), and RED = red band (=650 ± 16 nm).
To rule out autocorrelation between the monthly NDVI readings and the species studied, we subjected the data to an analysis of variance (ANOVA) statistical test with software R Studio, version 4.3.1 (R Core Team, Vienna, Austria. Available on: https://www.R-project.org/, accessed on 3 October 2022). Using the significant intra-annual and interspecies differences, it was possible to attribute variations in the NDVI among dates and species to changes inherent to the tree phenology as a biological explanation that strengthens the link between photosynthetic activity in the canopy and radial growth. Finally, to evaluate the differences between the different factors (species and dates), a Bonferroni post hoc test was performed as a strategy that allowed control of the simultaneous confidence level for the full set of each interval (see Table A1).

3. Results

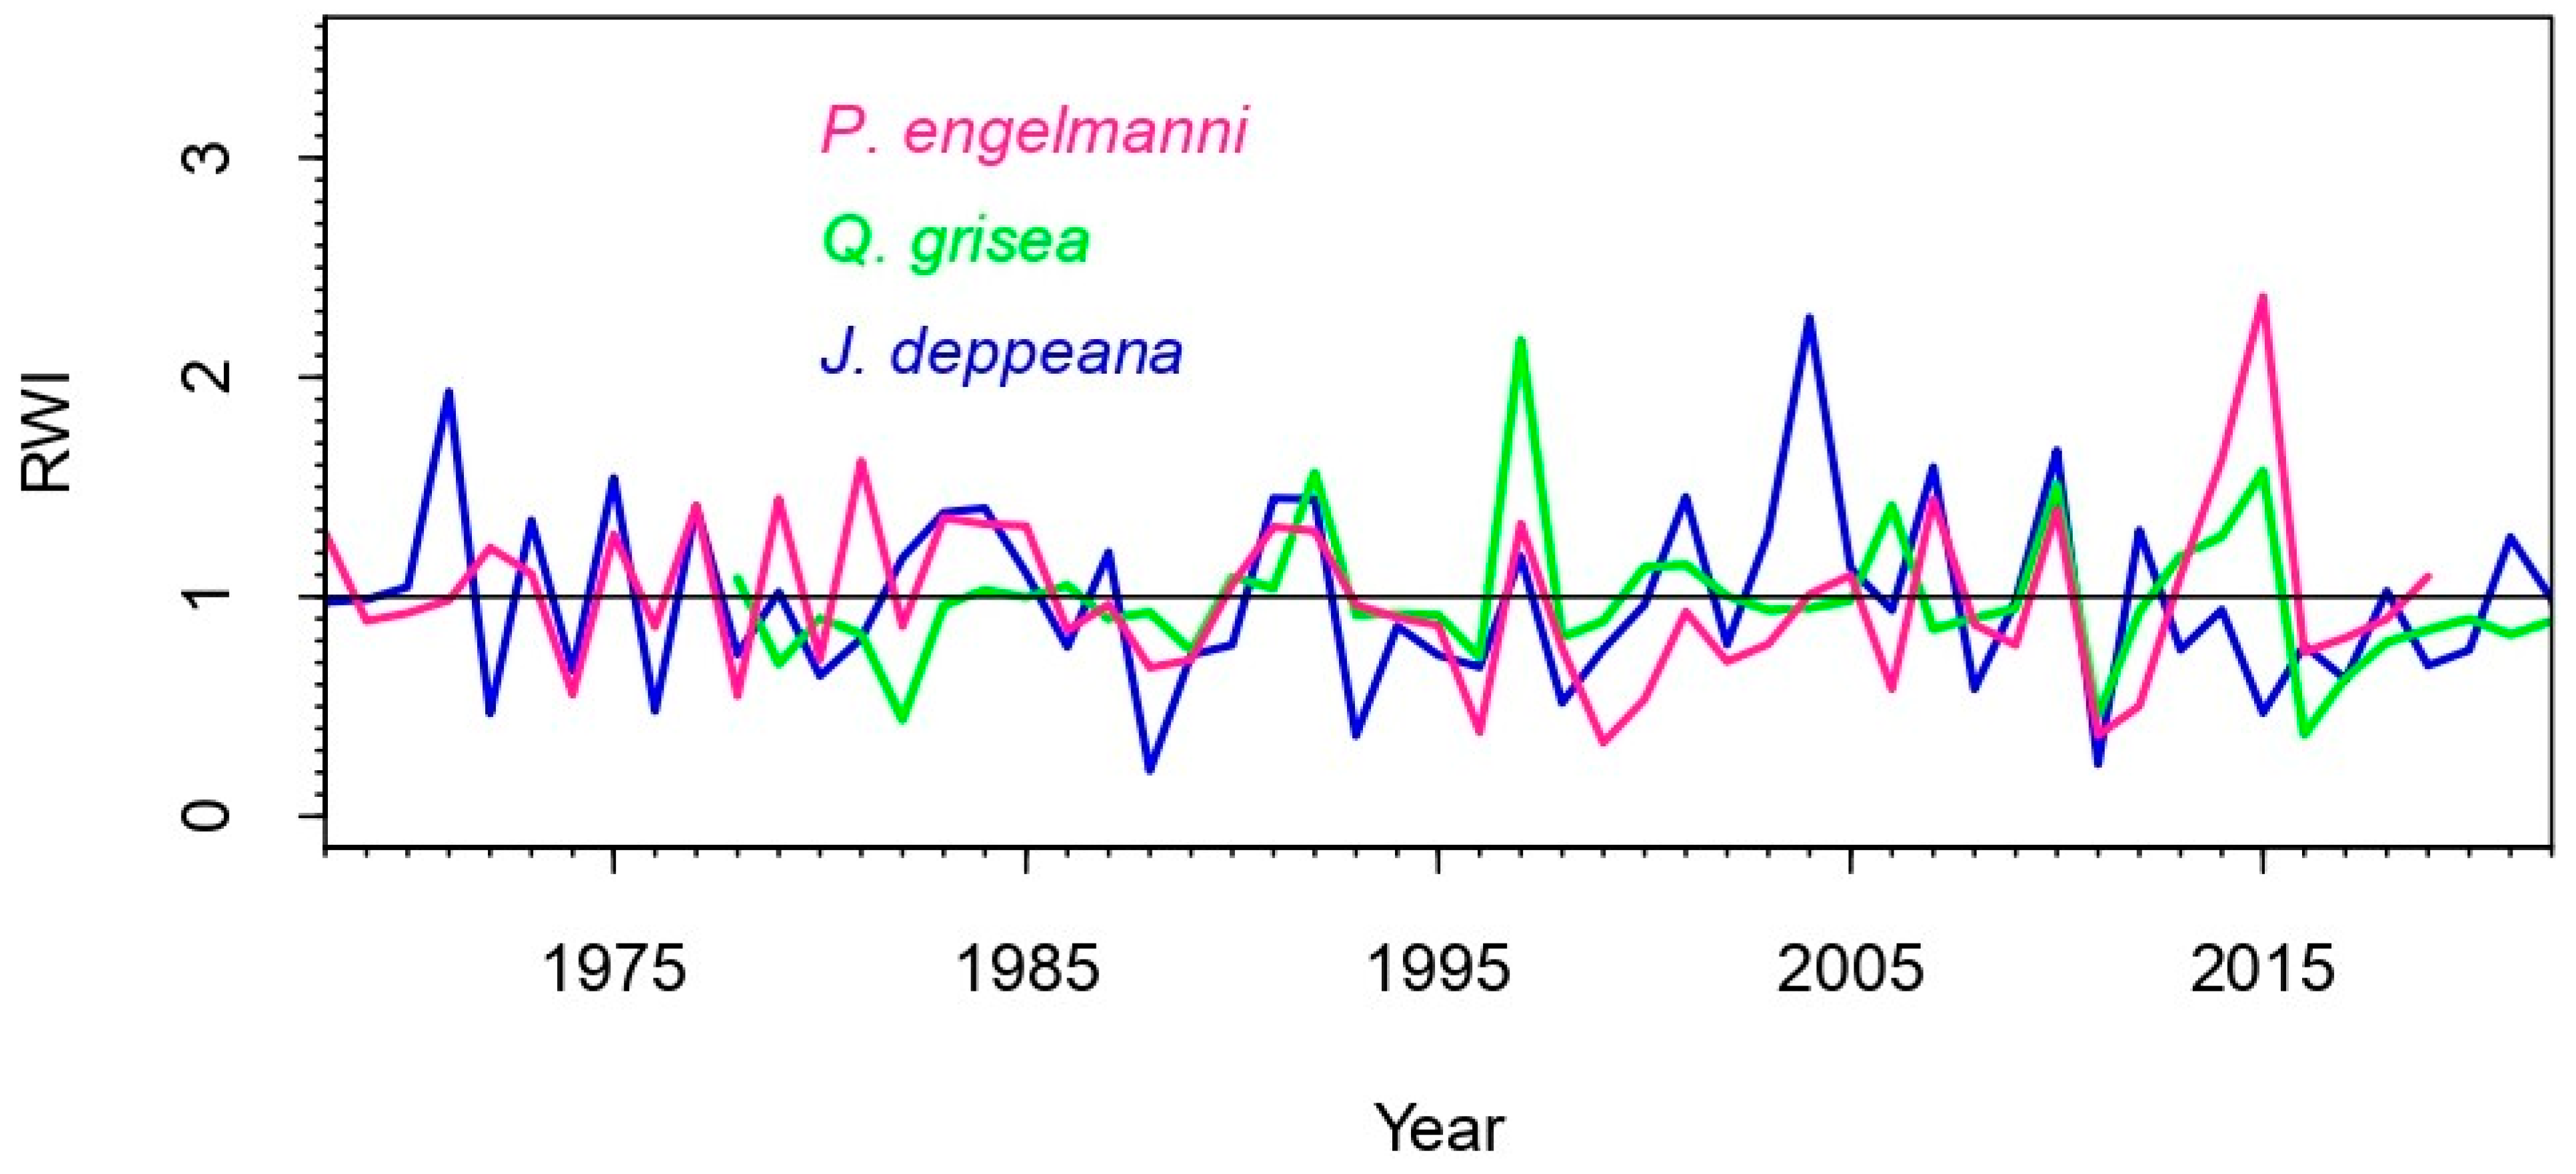
The species present at the site had a well-replicated common period in their chronologies between 1975 and 2019. Pinus engelmannii was the longest-lived species, followed by J. deppeana and Q. grisea (Table 1). The mean total tree-ring width ranged from 1.20 mm for Q. grisea to 2.13 mm for P. engelmannii. Juniperus deppeana recorded a mean growth of 1.40 mm per year. Juniperus deppeana and P. engelmannii had higher proportions of earlywood and latewood (93% and 7%; 83% and 17%, respectively) compared with Q. grisea (16% and 84%). Figure A1 presents the interannual variability in growth, showing similar behaviors in some specific years. All three species presented a decrease in growth in the years 1996, 2002, and 2011, while an increase in species growth occurred in the years 1997 and 2010. These increases and decreases in growth were represented by narrow and wide growth rings, respectively.
Regarding the dendrochronological statistics, the highest values of the first-order autocorrelation (AC) were presented by J. deppeana (0.40). On the other hand, the highest mean inter-tree correlation (Rbar) and the best expressed population signal (EPS) were observed in P. engelmannii, at 0.66 and 0.99, respectively (Table 2). All species showed an EPS value suitable for dendroclimatic analysis (>0.85) [39].

3.1. Variable Climate–Growth Relationships

The behavior of the species in relation to the climatic variables is shown in Figure 3a. Pinus engelmannii presented the highest correlation with the climatic variables. This species was found to be susceptible to TMAX in the period from September of the previous year to April of the growth year, except for December and February, with correlation values of r = −0.22 to r = −0.39. This same species showed a positive correlation with TMIN in December of the previous year (r = 0.24). Finally, rainfall during the previous growth season (from August of the previous year to May of the current year) had a positive influence on the radial growth of P. engelmannii, with correlation values ranging from r = 0.24 to r = 0.45.
Juniperus deppeana showed a negative correlation between radial growth and TMAX prior to the growth season (January r = −0.28 and February r = −0.29 of the current year), and a positive correlation with PP for some months of the winter period prior to the growth season (October of the previous year r = 0.26 and January of the current year r = 0.37).
Finally, Q. grisea showed a negative correlation between radial growth and TMAX in the initial months of growth (March and April of the current year, r = −0.22 to −0.25) and a positive correlation with PP in November of the previous year (r = 0.29), and at the beginning of the growth season in March, April, and May of the current year (r = 0.25, r = 0.34, and r = 0.22, respectively).
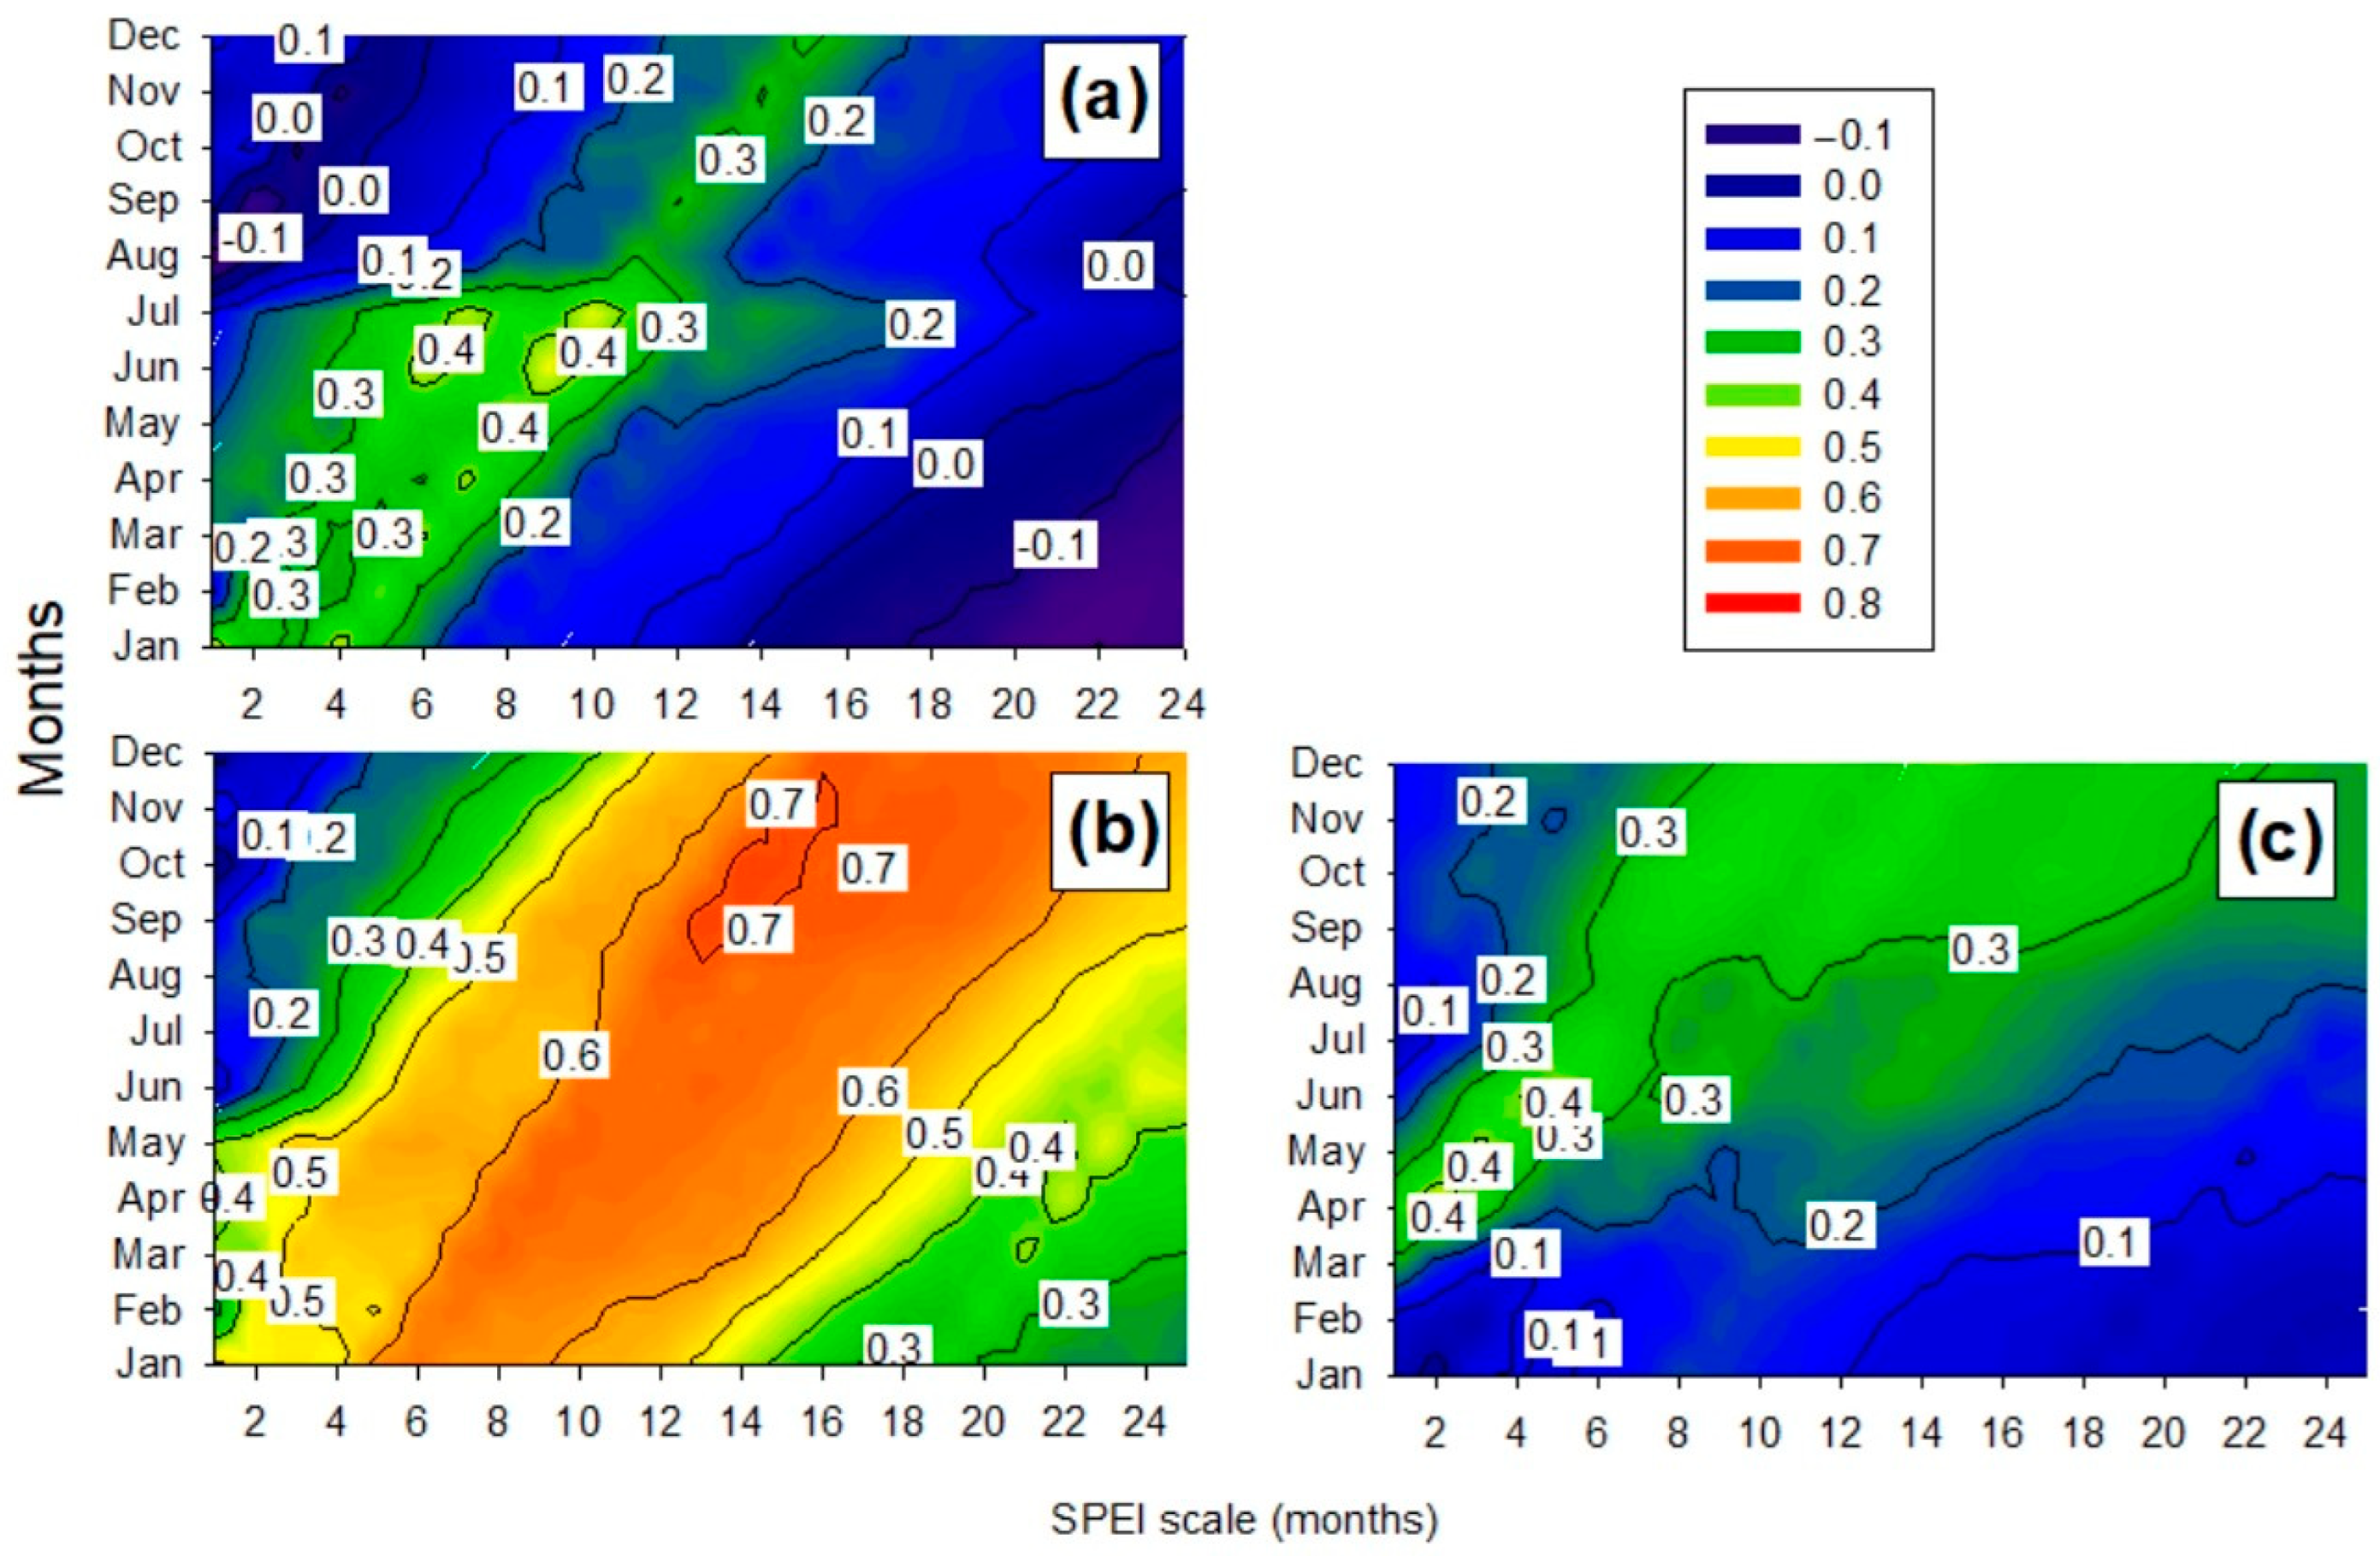
The growth of the three species showed a differentiated response to the drought index among species (Figure A2). Pinus engelmannii was shown to be the species most sensitive to the drought index, with high correlation values of up to 0.7 for the period October to December on a scale of 14 to 16 months. Juniperus deppeana and Q. grisea both showed a moderate response to drought. On the one hand, J. deppeana presented a higher association on the scale of 8 to 10 months duration for June and July, while moderate associations were identified in Q. grisea on the scale of 2 to 6 months for May and June.

3.2. NDVI and Statistical Analysis

A total of 13 monthly flights were conducted in the period April 2021 to April 2022 as a strategy to capture phenological variations over a year. Although trees tend to respond seasonally to drought, here, we refined the flight period to every thirty days, assuming the ability to record obvious variations in the NDVI during this period. To ensure consistent imagery with the UAV, monthly calibration of the sensors was conducted prior to drone flight. The product-specific application “DJI Assistant 2” was used in this process (https://www.dji.com/mx/downloads/softwares/assistant-dji-2, accessed on 7 April 2021). The NDVI was obtained at the individual tree level for 270 trees, with a higher proportion of P. engelmannii, J. deppeana, and Q. grisea found, as is typical in the forests of the Sierra Madre Occidental. The analysis was classified by genus and monthly trend plots were generated (Table 3 and Figure 3b). The highest values were obtained for P. engelmannii, with a mean of 0.48 and minimum and maximum values of 0.18 and 0.68, respectively. The mean NDVI values found for Q. grisea and J. deppeana were 0.45 and 0.37, with minimum values of 0.30 and 0.14 and maximum values of 0.58 and 0.61, respectively (Table 3).
The average DBH of the 270 trees per species was greater in Q. grisea than in P. engelmannii and J. deppeana (15.86 ± 0.90 cm, 11.37 ± 0.13 cm, and 7.94 ± 0.19 cm, respectively) and the average total height was greater in Q. grisea than in P. engelmannii and J. deppeana (6.55 ± 0.16 m, 6.43 ± 0.06 m, and 3.63 ± 0.05 m, respectively; Table 4). For those NDVI values that may reach saturation and are not attributable to phenological stages, it is recommended to apply the solution algorithm proposed by Liu et al. [40] (but see [41]).
On the other hand, the highest mean NDVI values were found for the species P. engelmannii, Q. grisea, and J. deppeana (0.48, 0.45 ± 0.02, and 0.37 ± 0.01, respectively; Table 4). Regarding the NDVI for P. engelmannii and J. deppeana, smoothed inter-monthly oscillations were observed, being of lesser magnitude for J. deppeana (Figure 3b). For Q. grisea, the NDVI decreased drastically from April to June, which can be explained by the gradual loss of leaves.
The analysis of variance revealed statistically significant differences among species, between sampling dates, and in the species × sampling date interaction, proving that the monthly NDVI variations differ significantly for the two sampling dates, and among the species and species dynamics throughout the year (Table 5, Figure A3).
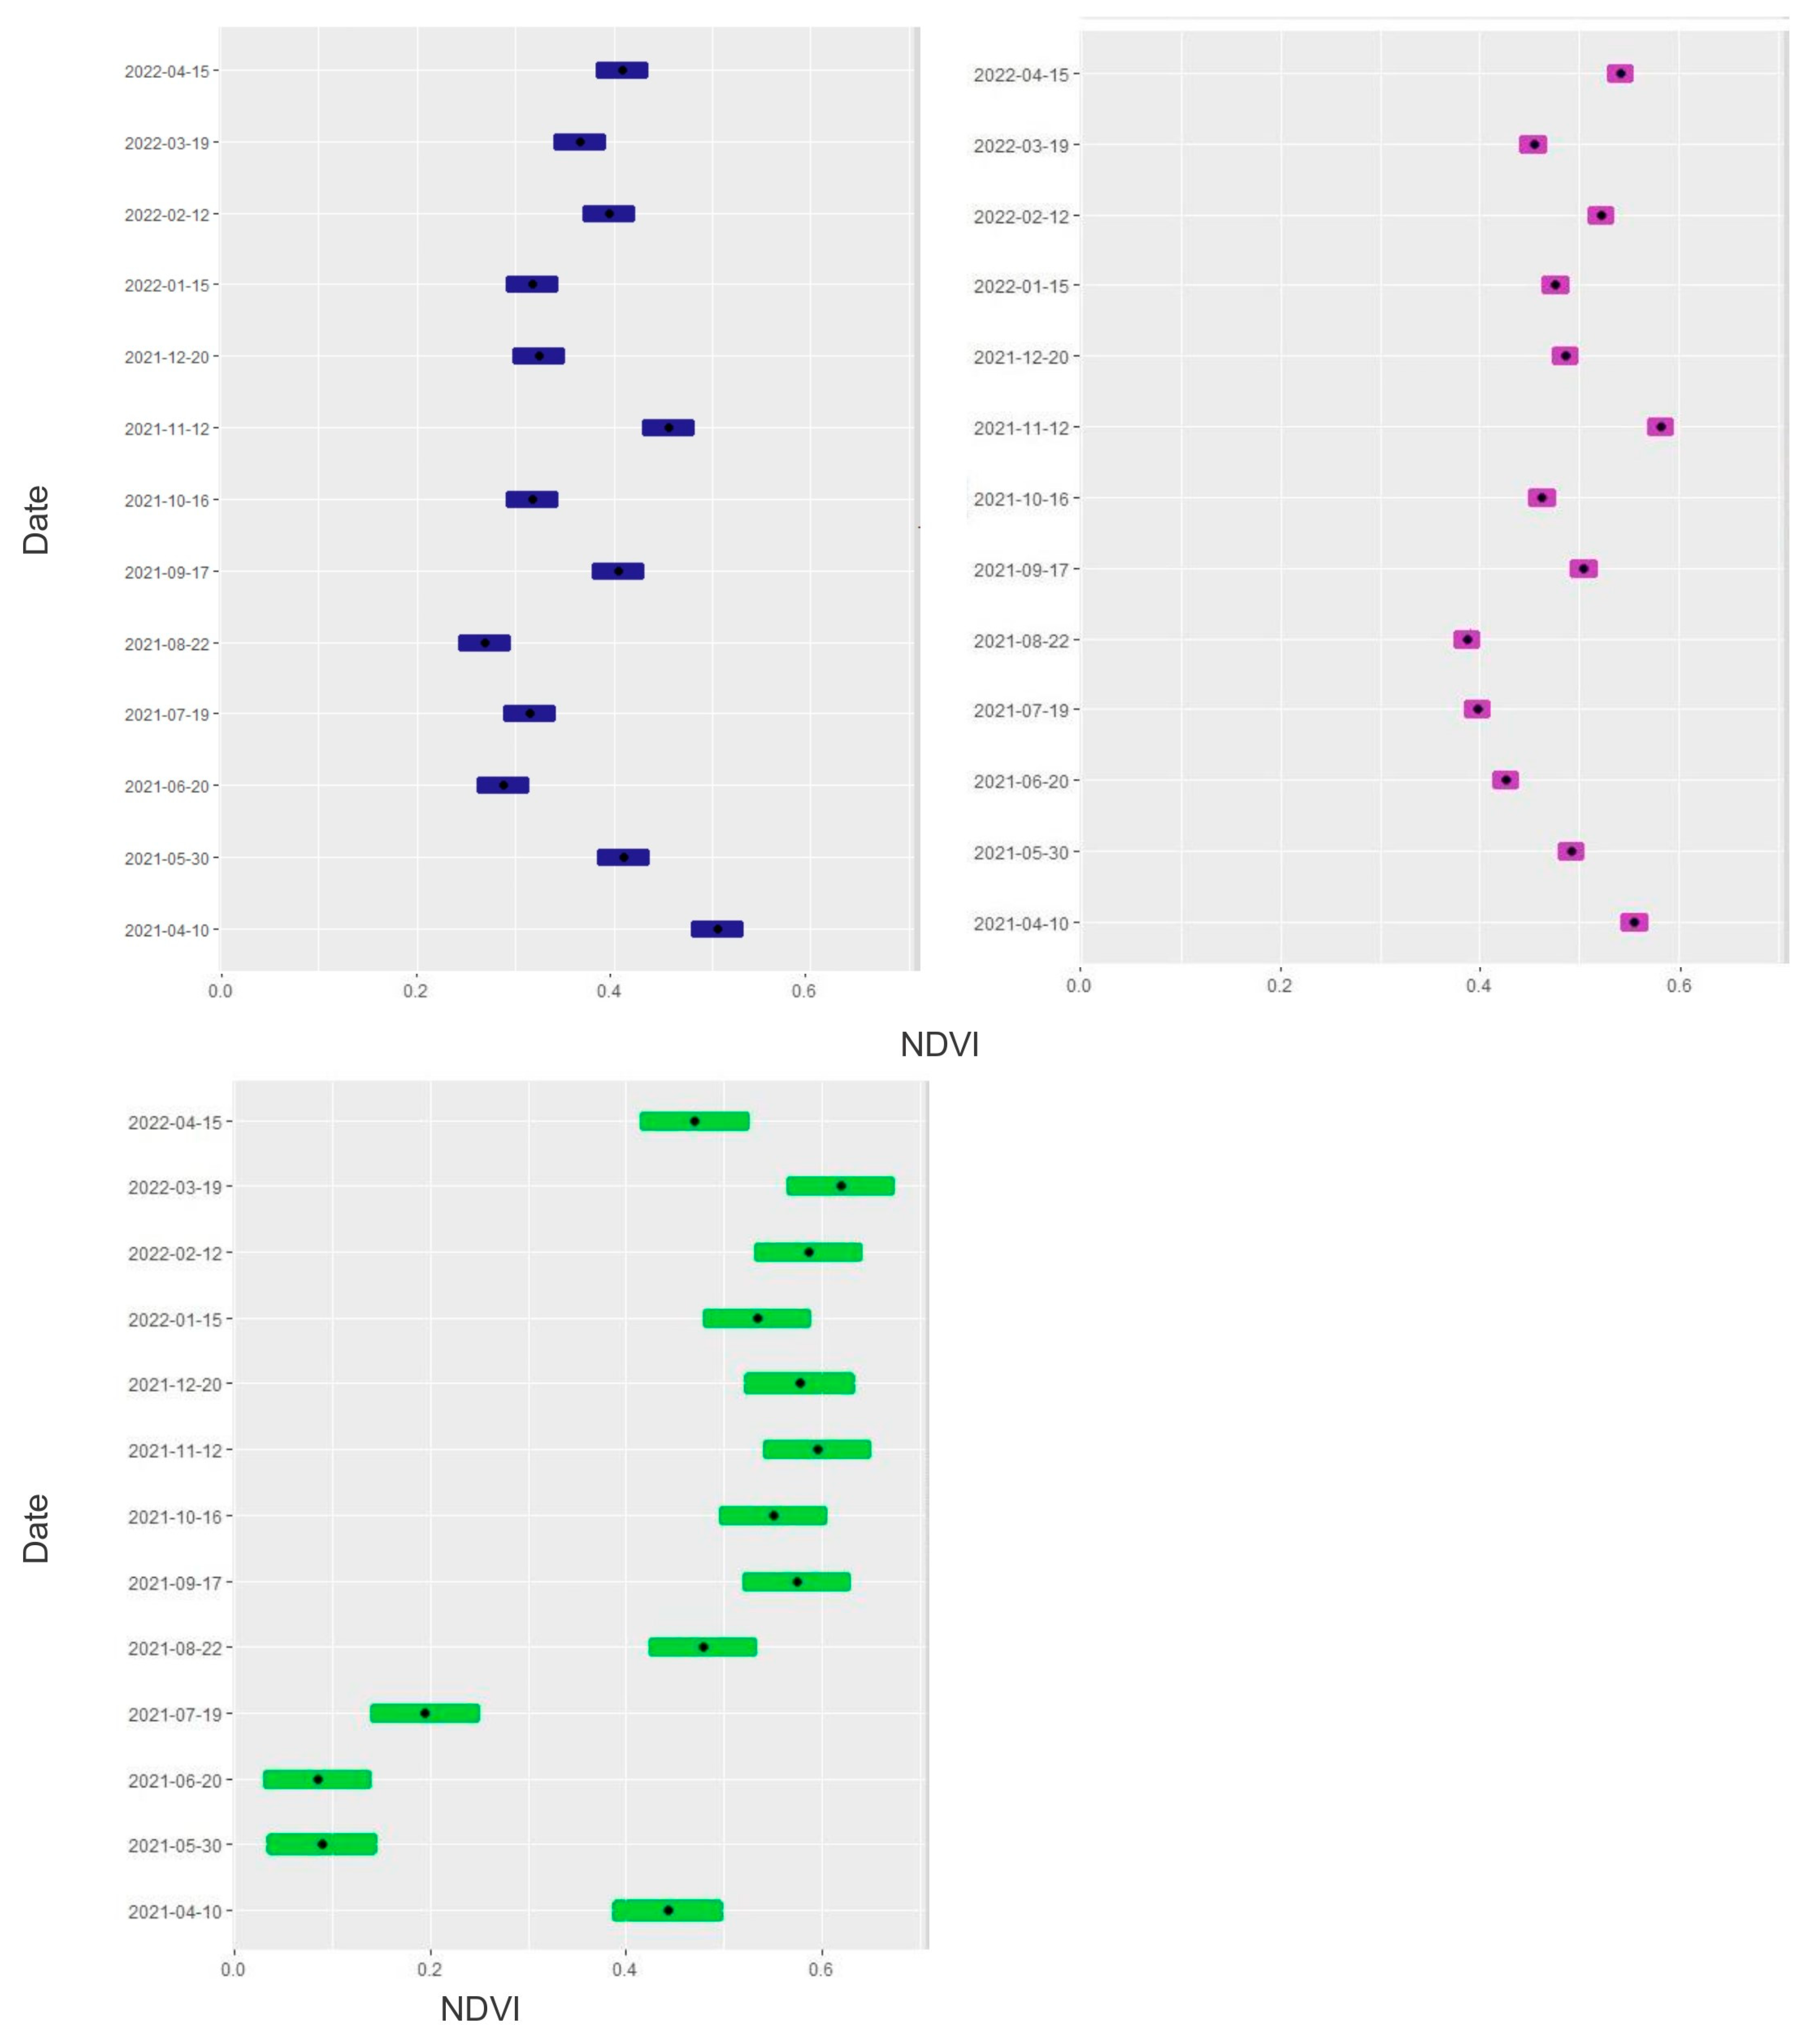
The NDVI statistical values differed among the three genera in May, June, July, August, October, and December 2021, as well as in March 2022 (Figure A4). These differences occurred among one of the three species for April, September, and November 2021, and in January, February, and April 2022 (Figure A4). In April 2021 and 2022, Q. grisea and J. deppeana showed similar behavior, while statistical differences were found for the species P. engelmannii (2021: p = 0.0002 and 0.0020, and 2022: p = 0.0360 and <0.0001, respectively). At the end of summer (September), and in the winter period (November 2021 and January and February 2022), the species Q. grisea and P. engelmannii behaved similarly and no significant differences were found between them, while J. deppeana behaved significantly differently from the other species (Figure A4 and Figure A5).
Significant statistical differences were found in the monthly NDVI values per species throughout the year. Figure 3b shows the variations found for the species studied. For Q. grisea in the period May to July, there were very marked differences corresponding to the highest SPEI correlations occurring in the same period of limited soil moisture.

4. Discussion

Tree vigor is usually reported using qualitative visual criteria in the upper canopy (e.g., current percentage of crown transparency or defoliation; see [9]), conferring an inherent bias to the subjectivity of the assessors, as well as their partial perspective of the canopy. However, it is important to note that remote sensing through NDVI per se does not account for tree vigor as such but instead presents reflectance rates that should not be considered as true photosynthetic rates.
Our study makes an advantageous contribution with the numerical intra-annual assessment provided by the NDVI, continuously over the same tree and from an aerial perspective of the crown. This is most useful in mixed forests, where species coexistence provides multiple ecological connections that are still worthy of further study. For example, species composition is a useful management strategy that decision-makers should have in their portfolio of tools to address climate change [42].
The relationship between trunk growth and photosynthetic activity is the main mechanism that scientists seek to understand; that is, the interdependence of trunk TRW data with those of canopy NDVI helps to discern responses to predicted drought scenarios and their implications for vegetation productivity rates, as seen in [43]. The results found here show that NDVI data taken with drones at the individual tree level are sensitive to the biomass growth recorded by the trunk, so the spatial and spectral resolution seems to contribute significantly to knowledge in this area. The NDVI has shown strong connections with TRW, so the literature gives it the ability to spatially predict the trend of the RWI (see [21]).
Furthermore, there is a clear seasonal association between TRW and the NDVI, attributed to phenological responses and interspecies drought stress. Thus, it is demonstrated that NDVI values obtained continuously with drones are suitable for monitoring vegetation dynamics in ecosystems such as the one studied here. Notably, it has been demonstrated that the NDVI has a seasonal relationship with tree radial growth; therefore, the optimal time windows for the use of monthly NDVI data in association with the TRW of the species studied have been identified. In this case, the radial growth trends in Figure A1 show evident episodes of recovery and synchronized disturbances. The studied area is drought-limited, as shown by the correlations of TMAX and SPEI in Figure 3a and Figure A2, and has been previously documented as such [44]. Thus, the results of the NDVI dynamics in Figure 3b support that the drought factor differentially affects the species.
Juniperus deppeana showed the greatest variation in NDVI values throughout the year (Figure 3b); in contrast, P. engelmannii had the most consistent mean NDVI values, which is attributed to the fact that it retains its leaves throughout the year. Quercus grisea showed the greatest variation in NDVI, with the lowest values in the dry months (Figure 3b).
The drastic reduction in the NDVI in Q. grisea during the dry season is explained by the loss of foliage, and, although a reduction in radial growth during the dry season is plausible, the species did not show sensitivity to drought (Figure A2). One possible interpretation is that the oaks can redistribute their carbon stocks as a drought adaptation strategy [45]. This is consistent with the fact that growth begins prior to the formation of new foliage [46]. Furthermore, given the loss of foliage, evapotranspiration rates are reduced with a consequent and progressive saving of carbon stocks [47]. However, this growth in earlywood formation could potentially lead to carbohydrate depletion, making this species susceptible to dieback in the event of severe drought. The minimum carbohydrate thresholds that species must meet to survive should therefore be the subject of future study [48].
Pinus engelmannii had the highest NDVI values, followed by J. deppeana and finally Q. grisea, evidencing differentiated rates in the canopy as a photosynthetic driver [49,50]. In the cases of P. engelmannii and J. deppeana, high NDVI values (Figure 3b) in spring suggest correspondence with earlywood formation, which is consistent with Michelot et al. [45]. With the available data, we therefore speculate that there is a direct transfer of newly synthesized assimilates for radial growth. Moreover, the photosynthetic capacity of these species during the pre-growth seasons seems to reinforce carbon reserves with which to form the new tree ring in spring [51]. Likewise, the increase in the NDVI during autumn (Figure 3b) is a strategy that strengthens cell lignification before winter. However, these results are inconclusive, and other variables such as age, a factor that affects carbohydrate distribution and efficiency, still require consideration.
The distribution of carbohydrates in tree structures can make it difficult to match NDVI and TRW values [52], for which reason it is recommended to extend observations of phenology and xylogenesis, as well as to extend the spatial and temporal resolution of the remote sensor. In other words, the delay of carbon allocation in radial stands may take longer than the period of analysis utilized here, depending on the physiological conditions of the tree, including its distribution priorities throughout its structures. It has been documented, for example, that trees allocate reserves in times of stress [53]. Thus, the UAV data were operationally valuable and allowed us to elucidate how reflectance and its association with TRW diverge among species (Figure 3b, Table 3). Our NDVI series should therefore be temporally robust, and it is recommended to progressively continue the flight missions beyond one year, given the occurrence of interannual ecophysiological processes, as well as to subdivide the growth rings sub-annually.
Phenology changes according to differences in carbon distribution, which is inherent to each particular species [45], especially in our case, where edaphic and climatic conditions did not vary. From the available data, P. engelmannii and J. deppeana showed a synchronized trend of NDVI values, with pronounced reductions in winter and summer. These findings could be associated with sensitivity to TMAX during the same periods (Figure 3a); i.e., the warm conditions during winter and summer trigger reactivation of the cambium [54], decreasing the availability of carbohydrates in the aerial part of the tree (Figure 3a). Under this premise, intra-annual growth does not have a time lag with the phenology of these species, although more temporal NDVI data are required. Quercus grisea, a contrasting species in terms of phenology and anatomy, seems to show a different carbon assimilation strategy that is reflected in seasonal delays in phenology and radial growth [55].
This approach remains to be replicated in other ecotones, since it has been shown in agricultural sciences [56,57] and viniculture [58,59] that further replication efforts are still required to optimize the potential uses of this type of sensor. For example, our methodology could be used in agricultural crops where drought is a limiting factor [60], albeit with the pertinent adjustments made to the flight configurations.
Variations in climatic conditions throughout the year can affect the quality of NDVI data acquired by drones. This is a limitation that must be taken into account. Maintaining the integrity and reliability of the data is critical, so the best conditions for image acquisition, including complementary robust sensors, should be sought.
Photosynthesis is a function of the ecophysiological processes occurring in the tree, which in turn correspond to its seasonality [61]. In other words, carbohydrate translocation may be temporally out of phase between the TRW and photosynthesis, the understanding of which becomes more challenging during periods of drought stress. Therefore, ground-truth photosynthetic measurements should be estimated at the canopy, and eventually at the leaf level, and should also be complemented with subsequent investigations. For example, vessel lumen size is directly related to the capacity for hydraulic conductivity [62], highlighting the need for studies of wood anatomy and formation (xylogenesis) to refine metrics and associate these with changes in NDVI rates across seasons (Figure 3b).
The overlapping of canopies in very dense forests is another limitation of our methodology, which could be overcome with radar sensors, for example, although the cost remains to be assessed.

5. Conclusions

The results of this study helped to address the three research questions posed and were of ecological significance. Inclusion of the NDVI as an explanatory factor contributed to deciphering responses to the climate experienced by mixed forests. Of particular note is the novel inclusion of periodic flights on a monthly scale over a year covering the different phenological stages of the same trees, which refined certain ecological mechanisms related to drought that have not been addressed in previous studies.
Vulnerability to drought was differentiated into two divergent groups: on the one hand, evergreen conifers suggested the correspondence of crown phenology with radial growth, presumably with no pauses in carbohydrate allocation, while on the other, the oaks are less susceptible to drought and have no correspondence between the greenness index and tree-ring growth, which is attributed to delays in C distribution; i.e., P. engelmannii and J. deppeana seem to depend on crown phenology, whereas the radial growth of Q. grisea is governed by its C reserves. We could speculate that radial growth was mainly photosynthesis-dependent, although with different strategies presented between coniferous and porous trees. We therefore recommend complementing these analyses with additional data pertaining to anatomy, xylogenesis, and age.
The NDVI at the individual tree level is an ally of dendroecology in terms of explaining drought. Thus, multiple proxies seem to amplify the outstanding responses of trees to adverse climatic conditions. According to these results, changes in species composition may occur in mixed forests if drought duration and severity are magnified. In addition, changes in carbon fluxes and productivity rates could be modified. However, it is advisable to validate these findings with a temporal extension of the NDVI data and the inclusion of anatomical variables of higher resolution.

Author Contributions

Conceptualization, M.P.-G.; methodology, A.C.A.-H., M.P.-G., J.A.M.-R. and E.D.V.-V.; formal analysis, A.C.A.-H., M.P.-G., J.A.M.-R. and E.D.V.-V.; writing—original draft preparation, A.C.A.-H., M.P.-G., J.A.M.-R. and E.D.V.-V.; project administration, A.C.A.-H. and M.P.-G.; funding acquisition, A.C.A.-H. and M.P.-G. All authors have read and agreed to the published version of the manuscript.

Funding

The first author expresses thanks to CONAHCYT for her postdoctoral scholarship project No: 4762386.

Data Availability Statement

The data presented in this study are available on request from the corresponding author. The data are not publicly available due to privacy and legal reasons.

Acknowledgments

We thank DendroRed (https://dendrored.ujed.mx, accessed on 8 June 2022) for supporting the academic stay of A.C.A.H.

Conflicts of Interest

The authors declare no conflicts of interest.

Appendix A

Table A1. Statistics of the post hoc test.
Date10 April 2021:
InteractionEstimateSEdft.ratiop-Value
J. deppeana-P. engelmannii−0.04920.01453471−3.4020.002
J. deppeana-Q. grisea0.06340.030434712.0840.1116
P. engelmannii-Q. grisea0.11270.028234713.9930.0002
Date30 May 2021:
InteractionEstimateSEdft.ratiop-Value
J. deppeana-P. engelmannii−0.08170.01453471−5.647<0.0001
J. deppeana-Q. grisea0.32140.0304347110.561<0.0001
P. engelmannii-Q. grisea0.40310.0282347114.288<0.0001
Date20 June 2021:
InteractionEstimateSEdft.ratiop-Value
J. deppeana-P. engelmannii−0.13790.01453471−9.531<0.0001
J. deppeana-Q. grisea0.20350.030434716.687<0.0001
P. engelmannii-Q. grisea0.34150.0282347112.102<0.0001
Date19 July 2021:
InteractionEstimateSEdft.ratiop-Value
J. deppeana-P. engelmannii−0.08330.01453471−5.759<0.0001
J. deppeana-Q. grisea0.11950.030434713.9260.0003
P. engelmannii-Q. grisea0.20280.028234717.189<0.0001
Date22 August 2021:
InteractionEstimateSEdft.ratiop-Value
J. deppeana-P. engelmannii−0.11780.01453471−8.143<0.0001
J. deppeana-Q. grisea−0.2090.03043471−6.867<0.0001
P. engelmannii-Q. grisea−0.09110.02823471−3.230.0037
Date17 September 2021:
InteractionEstimateSEdft.ratiop-Value
J. deppeana-P. engelmannii−0.10.01453471−6.909<0.0001
J. deppeana-Q. grisea−0.17020.03043471−5.593<0.0001
P. engelmannii-Q. grisea−0.07020.02823471−2.490.0385
Date16 October 2021:
InteractionEstimateSEdft.ratiop-Value
J. deppeana-P. engelmannii−0.14560.01453471−10.063<0.0001
J. deppeana-Q. grisea−0.23340.03043471−7.669<0.0001
P. engelmannii-Q. grisea−0.08780.02823471−3.1110.0056
Date12 November 2021:
InteractionEstimateSEdft.ratiop-Value
J. deppeana-P. engelmannii−0.12580.01453471−8.691<0.0001
J. deppeana-Q. grisea−0.13850.03043471−4.55<0.0001
P. engelmannii-Q. grisea−0.01270.02823471−0.451
Date20 December 2021:
InteractionEstimateSEdft.ratiop-Value
J. deppeana-P. engelmannii−0.16180.01453471−11.178<0.0001
J. deppeana-Q. grisea−0.25220.03043471−8.288<0.0001
P. engelmannii-Q. grisea−0.09050.02823471−3.2060.0041
Date15 January 2022:
InteractionEstimateSEdft.ratiop-Value
J. deppeana-P. engelmannii−0.15870.01453471−10.969<0.0001
J. deppeana-Q. grisea−0.21690.03043471−7.128<0.0001
P. engelmannii-Q. grisea−0.05820.02823471−2.0620.1178
Date12 February 2022:
InteractionEstimateSEdft.ratiop-Value
J. deppeana-P. engelmannii−0.12680.01453471−8.764<0.0001
J. deppeana-Q. grisea−0.19140.03043471−6.288<0.0001
P. engelmannii-Q. grisea−0.06460.02823471−2.2880.0666
Date19 March 2022:
InteractionEstimateSEdft.ratiop-Value
J. deppeana-P. engelmannii−0.08780.01453471−6.07<0.0001
J. deppeana-Q. grisea−0.25290.03043471−8.309<0.0001
P. engelmannii-Q. grisea−0.1650.02823471−5.849<0.0001
Date15 April 2022:
InteractionEstimateSEdft.ratiop-Value
J. deppeana-P. engelmannii−0.1330.01453471−9.19<0.0001
J. deppeana-Q. grisea−0.06210.03043471−2.0390.1244
P. engelmannii-Q. grisea0.07090.028234712.5140.036
Figure A1. Residual chronologies of the total ring width indices of the studied species.
Remotesensing 16 00389 g0a1
Figure A2. Pearson correlations (r) between the standardized precipitation and evapotranspiration index (SPEI) and residual tree-ring width chronologies for each species: (a) J. deppeana, (b) P. engelmannii, and (c) Q. grisea. SPEI was obtained on a scale from 1 to 24 months.
Remotesensing 16 00389 g0a2
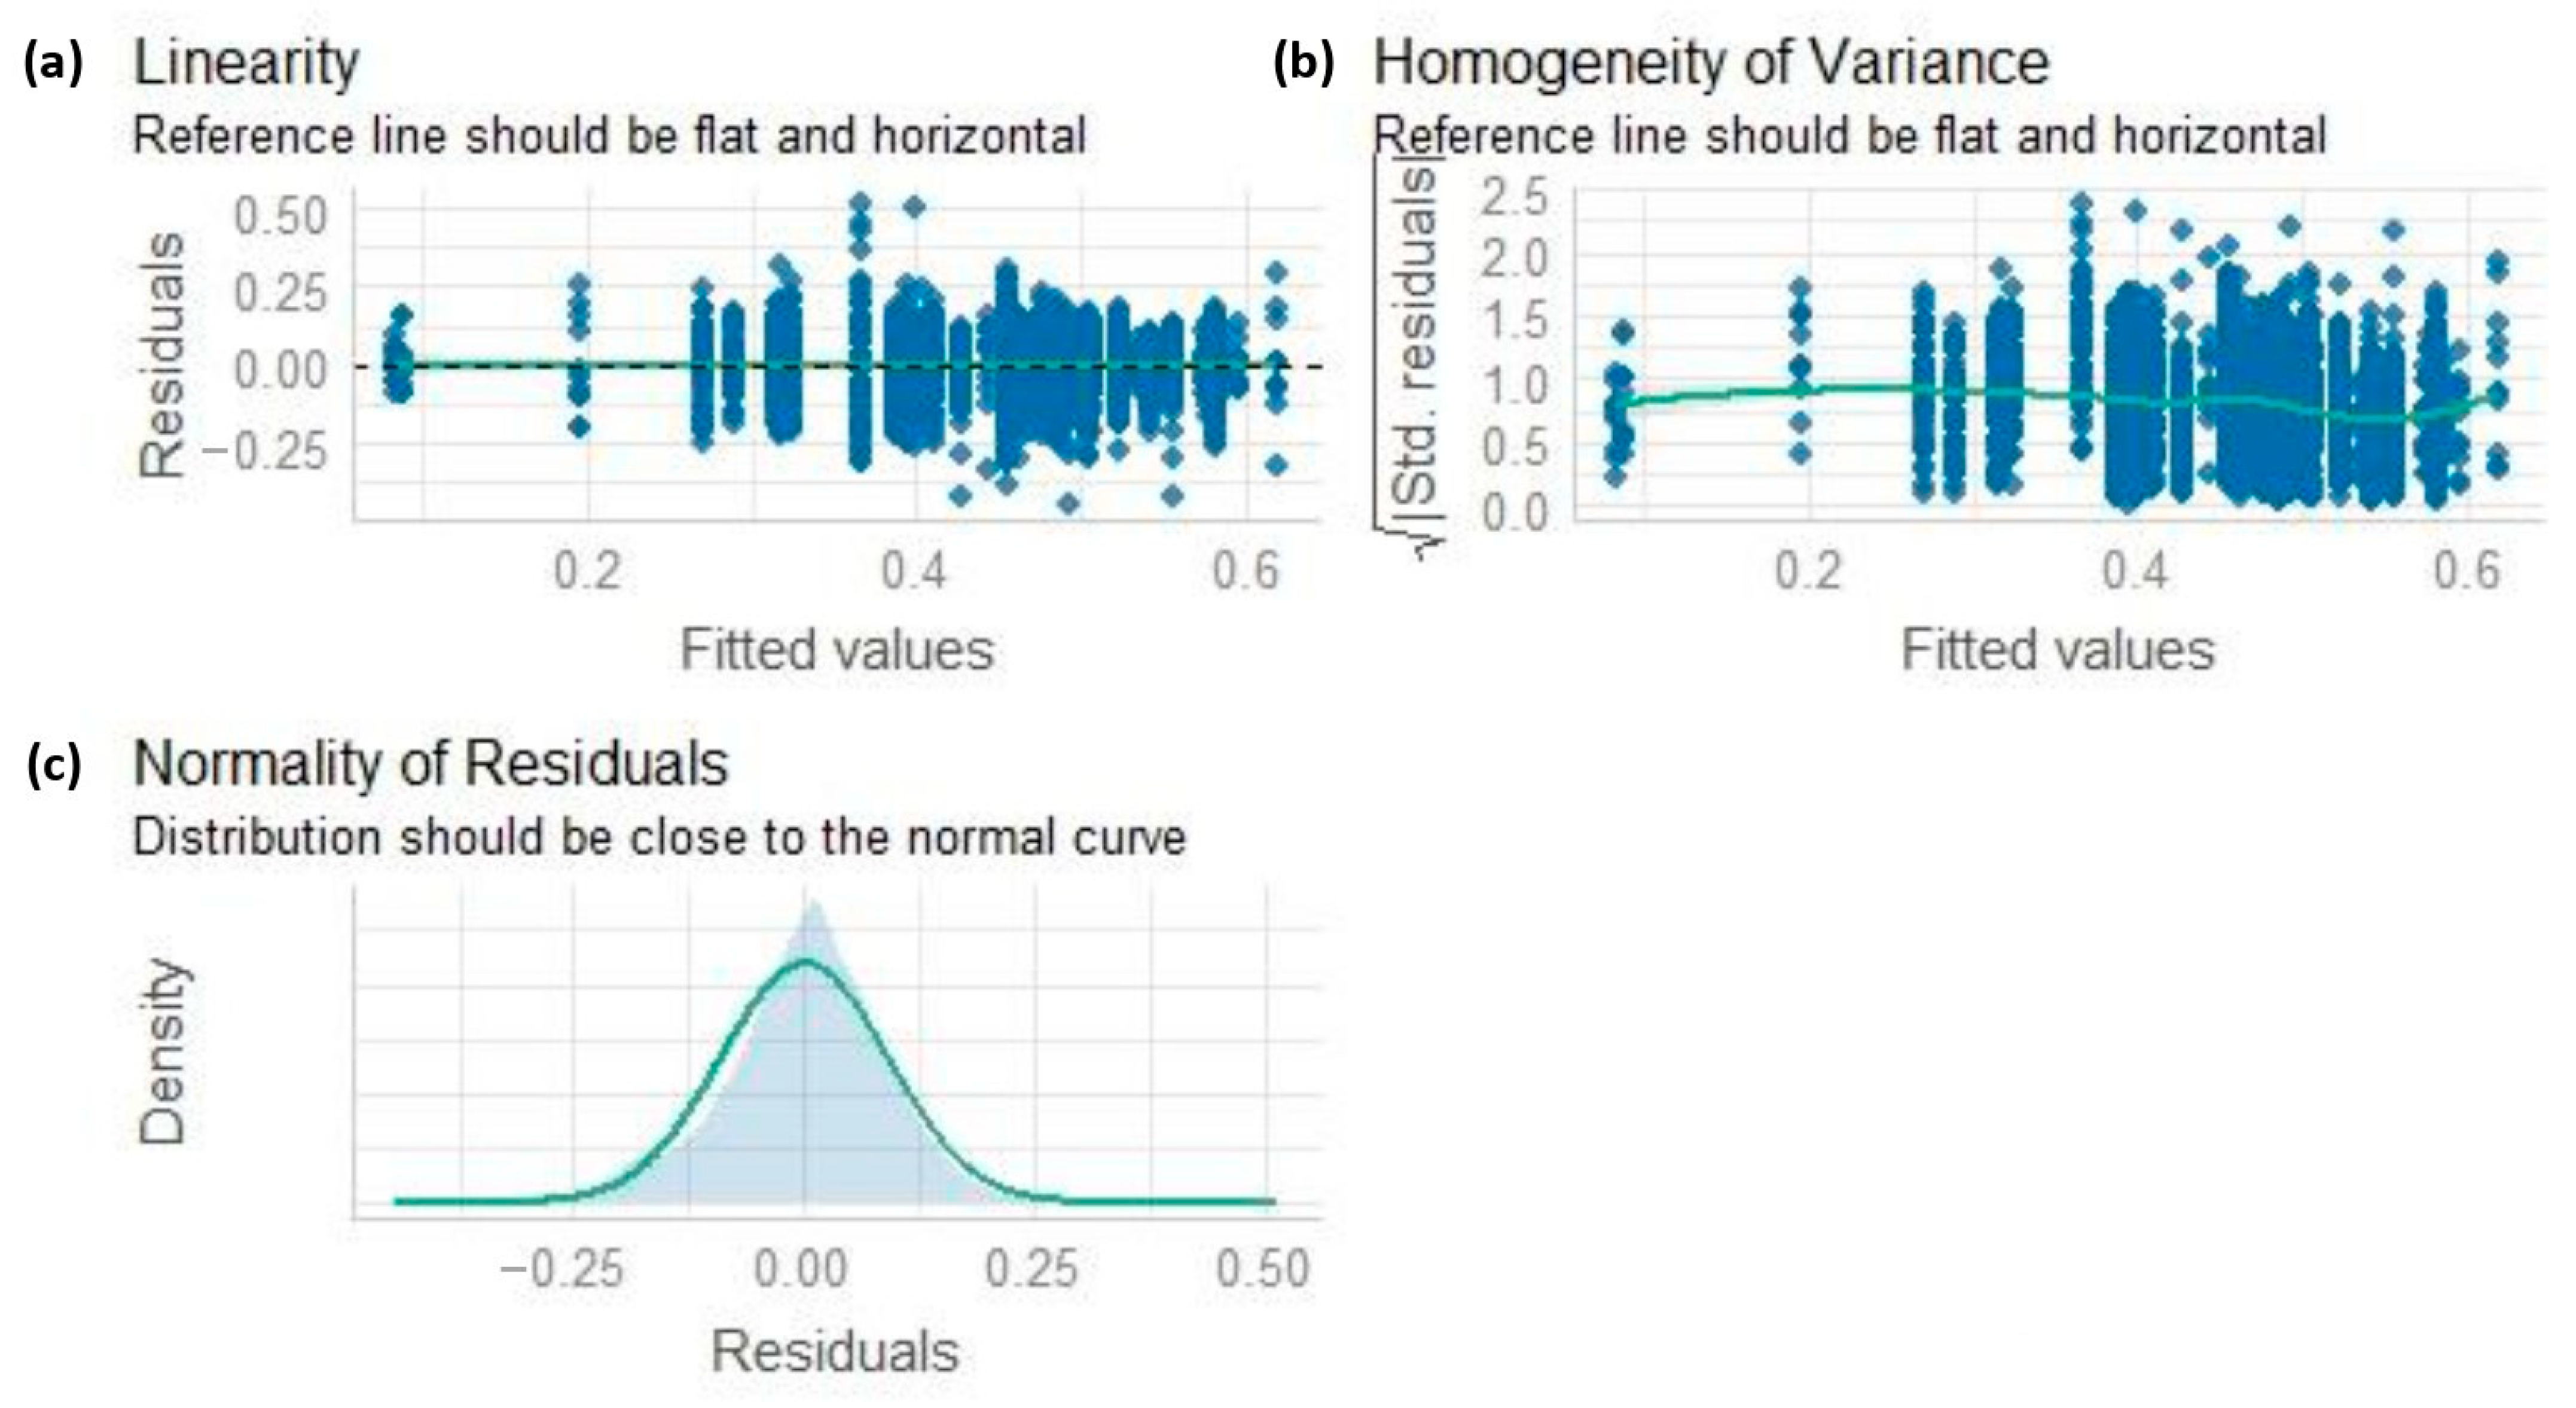
Figure A3. Graphs of the goodness of fit of the model. (a) Linearity, (b)Homogeneity of variance and (c) Normality of residuals. The green line denotes a normal distribution.
Remotesensing 16 00389 g0a3
Figure A4. Post hoc test plot per species. Values correspond to NDVI calculated from flights conducted in the years 2021–2022. Green, pink, and blue colors correspond to Q. grisea, P. engelmannii, and J. deppeana, respectively. Rectangles indicate those months in which there were no significant differences between all the genera studied.
Remotesensing 16 00389 g0a4
Figure A5. Diagram of NDVI variations per genus throughout the sampling year. Green, pink, and blue colors correspond to the genera Q. grisea, P. engelmannii, and J. deppeana, respectively.
Remotesensing 16 00389 g0a5

References

  1. Bosela, M.; Tumajer, J.; Cienciala, E.; Dobor, L.; Kulla, L.; Marčiš, P.; Popa, I.; Sedmák, R.; Sedmáková, D.; Sitko, R.; et al. Climate warming induced synchronous growth decline in Norway spruce populations across biogeographical gradients since 2000. Sci. Total Environ. 2021, 752, 141794. [Google Scholar] [CrossRef] [PubMed]
  2. De Frenne, P.; Lenoir, J.; Luoto, M.; Scheffers, B.R.; Zellweger, F.; Aalto, J.; Ashcroft, M.B.; Christiansen, D.M.; Decocq, G.; De Pauw, K.; et al. Forest microclimates and climate change: Importance, drivers and future research agenda. Glob. Chang. Biol. 2021, 27, 2279–2297. [Google Scholar] [CrossRef] [PubMed]
  3. Batllori, E.; Lloret, F.; Aakala, T.; Anderegg, W.R.L.; Aynekulu, E.; Bendixsen, D.P.; Bentouati, A.; Bigler, C.; Burk, C.J.; Camarero, J.J.; et al. Forest and woodland replacement patterns followingdrought-related mortality. Proc. Nat. Acad. Sci. USA 2020, 117, 29720–29729. [Google Scholar] [CrossRef] [PubMed]
  4. Lu, J.; Carbone, G.J.; Huang, X.; Lackstrom, K.; Gao, P. Mapping the sensitivity of agriculture to drought and estimating the effect of irrigation in the United States, 1950–2016. Agric. For. Meteorol. 2020, 108124, 292–293. [Google Scholar] [CrossRef]
  5. Bradford, J.B.; Schlaepfer, D.R.; Lauenroth, W.K.; Palmquist, K.A. Robust ecological drought projections for drylands in the 21st century. Glob. Chang. Biol. 2020, 26, 3906–3919. [Google Scholar] [CrossRef] [PubMed]
  6. Breshears, D.D.; Fontaine, J.B.; Ruthrof, K.X.; Field, J.P.; Feng, X.; Burger, J.R.; Law, D.J.; Kala, J.; Hardy, G.E.S.J. Underappreciated plant vulnerabilities to heat waves. New Phytol. 2021, 231, 32–39. [Google Scholar] [CrossRef] [PubMed]
  7. 2021 Disasters in Numbers. Brussels: CRED. 2022. Available online: https://cred.be/sites/default/files/2021_EMDAT_report.pdf (accessed on 1 January 2023).
  8. Mishra, A.K.; Singh, V.P. A review of drought concepts. J. Hydrol. 2010, 391, 202–216. [Google Scholar] [CrossRef]
  9. Italiano, S.S.P.; Camarero, J.J.; Colangelo, M.; Borghetti, M.; Castellaneta, M.; Pizarro, M.; Ripullone, F. Assessing Forest Vulnerability to Climate Change Combining Remote Sensing and Tree-Ring Data: Issues, Needs and Avenues. Forests 2023, 14, 1138. [Google Scholar] [CrossRef]
  10. Férriz, M.; Martin-Benito, D.; Cañellas, I.; Gea-Izquierdo, G. Sensitivity to water stress drives differential decline and mortality dynamics of three co-occurring conifers with different drought tolerance. For. Ecol. Manag. 2021, 486, 118964. [Google Scholar] [CrossRef]
  11. Navarro-Cerrillo, R.M.; González-Moreno, P.; Ruiz-Gómez, F.J.; Sánchez-Cuesta, R.; Gazol, A.; Camarero, J.J. Drought stress and pests increase defoliation and mortality rates in vulnerable Abies pinsapo forests. For. Ecol. Manag. 2022, 504, 119824. [Google Scholar] [CrossRef]
  12. Meyer, B.F.; Buras, A.; Rammig, A.; Zang, C.S. Higher susceptibility of beech to drought in comparison to oak. Dendrochronologia 2020, 64, 125780. [Google Scholar] [CrossRef]
  13. Brehaut, L.; Danby, R.K. Inconsistent relationships between annual tree ring-widths and satellite-measured NDVI in a mountainous subarctic environment. Ecol. Indic. 2018, 91, 698–711. [Google Scholar] [CrossRef]
  14. Mašek, J.; Tumajer, J.; Lange, J.; Kaczka, R.; Fišer, P.; Treml, V. Variability in Tree-ring Width and NDVI Responses to Climate at a Landscape Level. Ecosystems 2023, 26, 1144–1157. [Google Scholar] [CrossRef]
  15. Huang, S.; Tang, L.; Hupy, J.P.; Wang, Y.; Shao, G. A commentary review on the use of normalized difference vegetation index (NDVI) in the era of popular remote sensing. J. For. Res. 2021, 32, 1–6. [Google Scholar] [CrossRef]
  16. Bolyn, C.; Lejeune, P.; Michez, A.; Latte, N. Mapping Tree Species Proportions from Satellite Imagery Using Spectral–Spatial Deep Learning. Remote Sens. Environ. 2022, 280, 113205. [Google Scholar] [CrossRef]
  17. Wang, H.; Müller, J.; Tatarinov, F.; Yakir, D.; Rotenberg, E. Disentangling Soil, Shade, and Tree Canopy Contributions to Mixed Satellite Vegetation Indices in a Sparse Dry Forest. Remote Sens. 2022, 14, 3681. [Google Scholar] [CrossRef]
  18. Gamon, J.A.; Field, C.B.; Goulden, M.L.; Griffin, K.L.; Hartley, A.E.; Joel, G.; Penuelas, J.; Valentini, R. Relationships between NDVI, Canopy Structure, and Photosynthesis in Three Californian Vegetation Types. Ecol. Appl. 1995, 5, 28–41. [Google Scholar] [CrossRef]
  19. Vicente-Serrano, S.M.; Camarero, J.J.; Olano, J.M.; Martín-Hernández, N.; Peña-Gallardo, M.; Tomás-Burguera, M.; Gazol, A.; Azorin-Molina, C.; Bhuyan, U.; Kenawy, A.E. Diverse relationships between forest growth and the Normalized Difference Vegetation Index at a global scale. Remote Sens. Environ. 2016, 187, 14–29. [Google Scholar] [CrossRef]
  20. Gallardo-Salazar, J.L.; Lindig-Cisneros, R.A.; Lopez-Toledo, L.; Endara-Agramont, A.R.; Blanco-García, A.; Sáenz-Romero, C. Analysis of the Vigor of Pinus hartwegii Lindl. along an Altitudinal Gradient Using UAV Multispectral Images: Evidence of Forest Decline Possibly Associated with Climatic Change. Forests 2023, 14, 1176. [Google Scholar] [CrossRef]
  21. Xu, P.; Fang, W.; Zhou, T.; Zhao, X.; Luo, H.; Hendrey, G.; Yi, C. Spatial Upscaling of Tree-Ring-Based Forest Response to Drought with Satellite Data. Remote Sens. 2019, 11, 2344. [Google Scholar] [CrossRef]
  22. Acosta-Hernández, A.C.; Pompa-García, M.; Camarero, J.J. An Updated Review of Dendrochronological Investigations in Mexico, a Megadiverse Country with a High Potential for Tree-Ring Sciences. Forests 2017, 8, 160. [Google Scholar] [CrossRef]
  23. Farjon, A.; Styles, B.T. Pinus (Pinaceae). Flora Neotropica; New York Botanical Garden: New York, NY, USA, 1997. [Google Scholar]
  24. González, B.A. La Sierra Tarahumara, El Bosque Y Los Pueblos Originarios: Estudio de Caso de Chihuahua (México). 2012. Available online: http://www.fao.org/forestry/17194-0381f923a6bc236aa91ecf614d92e12e0.pdf (accessed on 7 November 2023).
  25. González-Elizondo, M.S.; González-Elizondo, M.; Tena-Flores, J.A.; Ruacho-González, L.; López-Enríquez, I.L. Vegetación de la Sierra Madre Occidental, México: Una síntesis. Acta Bot. Mex. 2012, 100, 351–403. [Google Scholar] [CrossRef]
  26. Fallon, B.; Cavender-Bares, J. Leaf-level trade-offs between drought avoidance and desiccation recovery drive elevation stratification in arid oaks. Ecosphere 2018, 9, e02149. [Google Scholar] [CrossRef]
  27. Stokes, M.A.; Smiley, T.L. Tree-Ring Dating; The University of Chicago Press: Chicago, IL, USA, 1968. [Google Scholar]
  28. Holmes, R.L. Computer-Assisted Quality Control in Tree-Ring Dating and Measurement. Tree-Ring Bull. 1983, 43, 51–67. [Google Scholar]
  29. Bunn, A.G. A dendrochronology program library in R (dplR). Dendrochronologia 2008, 26, 115–124. [Google Scholar] [CrossRef]
  30. Bunn, A.G. Statistical and visual crossdating in R using the dplR library. Dendrochronologia 2010, 28, 251–258. [Google Scholar] [CrossRef]
  31. Bunn, A.; Korpela, M.; Bindi, F.; Campelo, F.; Mérian, P.; Queadan, F.; Zand, C.; Buras, A.; Cecile, A.; Mudelsee, M.; et al. Package ‘dplR’. Dendronhronology Program Library in R, Version 1.6.3. 2015. Available online: https://CRAN.R-project.org/package=dplR (accessed on 21 January 2015).
  32. Mérian, P.; Pierrat, J.-C.; Lebourgeois, F. Effect of sampling effort on the regional chronology statistics and climate–growth relationships estimation. Dendrochronologia 2013, 31, 58–67. [Google Scholar] [CrossRef]
  33. Vicente-Serrano, S.M.; Beguería, S.; López-Moreno, J.I. A Multiscalar Drought Index Sensitive to Global Warming: The Standardized Precipitation Evapotranspiration Index. J. Clim. 2010, 23, 1696–1718. [Google Scholar] [CrossRef]
  34. Stefanidis, S.; Rossiou, D.; Proutsos, N. Drought Severity and Trends in a Mediterranean Oak Forest. Hydrology 2023, 10, 167. [Google Scholar] [CrossRef]
  35. Daniels, L.; Eeckhout, E.; Wieme, J.; Dejaegher, Y.; Audenaert, K.; Maes, W.H. Identifying the Optimal Radiometric Calibration Method for UAV-Based Multispectral Imaging. Remote Sens. 2023, 15, 2909. [Google Scholar] [CrossRef]
  36. Kedzierski, M.; Wierzbicki, D.; Sekrecka, A.; Fryskowska, A.; Walczykowski, P.; Siewert, J. Influence of Lower Atmosphere on the Radiometric Quality of Unmanned Aerial Vehicle Imagery. Remote Sens. 2019, 11, 1214. [Google Scholar] [CrossRef]
  37. DJI P4 Multispectral Specs. Available online: https://www.dji.com/p4-multispectral/specs (accessed on 2 May 2022).
  38. Rouse, J.W., Jr.; Deering, D.W.; Schell, J.A.; Harlan, J.C. Monitoring the Vernal Advancement and Retrogradation (Green Wave Effect) of Natural Vegetation; NASA: Greenbelt, MD, USA, 1974. [Google Scholar]
  39. Wigley, T.M.L.; Briffa, K.R.; Jones, P.D. On the Average Value of Correlated Time Series, with Applications in Dendroclimatology and Hydrometeorology. J. Appl. Meteorol. Climatol. 1984, 23, 201–213. [Google Scholar] [CrossRef]
  40. Liu, F.; Qin, Q.; Zhan, Z. A novel dynamic stretching solution to eliminate saturation effect in NDVI and its application in drought monitoring. Chin. Geogr. Sci. 2012, 22, 683–694. [Google Scholar] [CrossRef]
  41. Zhen, Z.; Chen, S.; Yin, T.; Gastellu-Etchegorry, J.P. Globally quantitative analysis of the impact of atmosphere and spectral response function on 2-band enhanced vegetation index (EVI2) over Sentinel-2 and Landsat-8. ISPRS J. Photogramm. Remote Sens 2023, 205, 206–226. [Google Scholar] [CrossRef]
  42. Yousefpour, R.; Jacobsen, J.B.; Thorsen, B.J.; Meilby, H.; Hanewinkel, M.; Oehler, K. A review of decision-making approaches to handle uncertainty and risk in adaptive forest management under climate change. Ann. For. Sci. 2012, 69, 1–15. [Google Scholar] [CrossRef]
  43. Berner, L.T.; Beck, P.S.A.; Bunn, A.G.; Lloyd, A.H.; Goetz, S.J. High-latitude tree growth and satellite vegetation indices: Correlations and trends in Russia and Canada (1982–2008). J. Geophys. Res. Biogeosci. 2011, 116, 1–13. [Google Scholar] [CrossRef]
  44. González-Cásares, M.; Pompa-García, M.; Camarero, J.J. Differences in climate–growth relationship indicate diverse drought tolerances among five pine species coexisting in Northwestern Mexico. Trees 2017, 31, 531–544. [Google Scholar] [CrossRef]
  45. Michelot, A.; Simard, S.; Rathgeber, C.; Dufrêne, E.; Damesin, C. Comparing the intra-annual wood formation of three European species (Fagus sylvatica, Quercus petraea and Pinus sylvestris) as related to leaf phenology and non-structural carbohydrate dynamics. Tree Physiol. 2012, 32, 1033–1045. [Google Scholar] [CrossRef]
  46. Sass-Klaassen, U.; Sabajo, C.R.; den Ouden, J. Vessel formation in relation to leaf phenology in pedunculate oak and European ash. Dendrochronologia 2011, 29, 171–175. [Google Scholar] [CrossRef]
  47. Cailleret, M.; Jansen, S.; Robert, E.M.R.; Desoto, L.; Aakala, T.; Antos, J.A.; Beikircher, B.; Bigler, C.; Bugmann, H.; Caccianiga, M.; et al. A synthesis of radial growth patterns preceding tree mortality. Glob. Chang. Biol. 2016, 23, 1675–1690. [Google Scholar] [CrossRef]
  48. Hagedorn, F.; Joseph, J.; Peter, M.; Luster, J.; Pritsch, K.; Geppert, U.; Kerner, R.; Molinier, V.; Egli, S.; Schaub, M.; et al. Recovery of trees from drought depends on belowground sink control. Nat. Plants 2016, 2, 16111. [Google Scholar] [CrossRef] [PubMed]
  49. Lang, A.C.; Härdtle, W.; Bruelheide, H.; Geißler, C.; Nadrowski, K.; Schuldt, A.; Yu, M.; von Oheimb, G. Tree morphology responds to neighbourhood competition and slope in species-rich forests of subtropical China. For. Ecol. Manag. 2010, 260, 1708–1715. [Google Scholar] [CrossRef]
  50. Li, Y.; Zhao, M.; Montesharrei, S.; Mu, Q.; Kalnay, E.; Li, S. Local cooling and warming effects of forests based on satellite observations. Nat. Commun. 2015, 6, 6603. [Google Scholar] [CrossRef] [PubMed]
  51. Mirabel, A.; Girardin, M.P.; Metsaranta, J.; Campbell, E.M.; Arsenault, A.; Reich, P.B.; Way, D. New tree-ring data from Canadian boreal and hemi-boreal forests provide insight for improving the climate sensitivity of terrestrial biosphere models. Sci. Total Environ. 2022, 851, 158062. [Google Scholar] [CrossRef] [PubMed]
  52. D’Andrea, G.; Šimůnek, V.; Castellaneta, M.; Vacek, Z.; Vacek, S.; Pericolo, O.; Zito, R.G.; Ripullone, F. Mismatch between Annual Tree-Ring Width Growth and NDVI Index in Norway Spruce Stands of Central Europe. Forests 2022, 13, 1417. [Google Scholar] [CrossRef]
  53. Bréda, N.; Huc, R.; Granier, A.; Dreyer, E. Temperate forest trees and stands under severe drought: A review of ecophysiological responses, adaptation processes and long-term consequences. Ann. For. Sci. 2006, 63, 625–644. [Google Scholar] [CrossRef]
  54. Deslauriers, A.; Rossi, S.; Anfodillo, T.; Saracino, A. Cambial phenology, wood formation and temperature thresholds in two contrasting years at high altitude in southern Italy. Tree Physiol. 2008, 28, 863–871. [Google Scholar] [CrossRef]
  55. Suzuki, M.; Yoda, K.; Suzuki, H. Phenological Comparison of the Onset of Vessel Formation Between Ring-Porous and Diffuse-Porous Deciduous Trees in a Japanese Temperate Forest. IAWA J. 1996, 17, 431–444. [Google Scholar] [CrossRef]
  56. Yeom, J.; Jung, J.; Chang, A.; Ashapure, A.; Maeda, M.; Maeda, A.; Landivar, J. Comparison of Vegetation Indices Derived from UAV Data for Differentiation of Tillage Effects in Agriculture. Remote Sens. 2019, 11, 1548. [Google Scholar] [CrossRef]
  57. Li, M.; Shamshiri, R.R.; Weltzien, C.; Schirrmann, M. Crop Monitoring Using Sentinel-2 and UAV Multispectral Imagery: A Comparison Case Study in Northeastern Germany. Remote Sens. 2022, 14, 4426. [Google Scholar] [CrossRef]
  58. Damiano, N.; Bonfante, A.; Cirillo, C.; Amitrano, C.; Erbaggio, A.; Brook, A.; De Micco, V. Retrospective Reconstruction of the Ecophysiological Grapevine Behaviour Through the Analysis of Tree-Ring Series to Validate an Approach to Extract Data From Space-Born and UAV Techniques. In Proceedings of the 2019 IEEE International Workshop on Metrology for Agriculture and Forestry (MetroAgriFor), Portici, Italy, 24–26 October 2019; pp. 191–195. [Google Scholar] [CrossRef]
  59. Vélez, S.; Barajas, E.; Rubio, J.A.; Vacas, R.; Poblete-Echeverría, C. Effect of Missing Vines on Total Leaf Area Determined by NDVI Calculated from Sentinel Satellite Data: Progressive Vine Removal Experiments. Appl. Sci. 2020, 10, 3612. [Google Scholar] [CrossRef]
  60. Zhen, Z.; Chen, S.; Yin, T.; Han, C.; Chavanon, E.; Lauret, N.; Guilleux, J.; Gastellu-Etchegorry, J.P. A Dynamic L-system based Architectural Maize Model for 3D Radiative Transfer Simulation. IEEE Trans. Geosci. Remote Sens. 2024. early access. [Google Scholar] [CrossRef]
  61. Charrier, G.; Martin-StPaul, N.; Damesin, C.; Delpierre, N.; Hänninen, H.; Torres-Ruiz, J.M.; Davi, H. Interaction of drought and frost in tree ecophysiology: Rethinking the timing of risks. Ann. For. Sci. 2021, 78, 40. [Google Scholar] [CrossRef]
  62. Colangelo, M.; Camarero, J.J.; Battipaglia, G.; Borghetti, M.; De Micco, V.; Gentilesca, T.; Ripullone, F. A multi-proxy assessment of dieback causes in a Mediterranean oak species. Tree Physiol. 2017, 37, 617–631. [Google Scholar] [CrossRef]
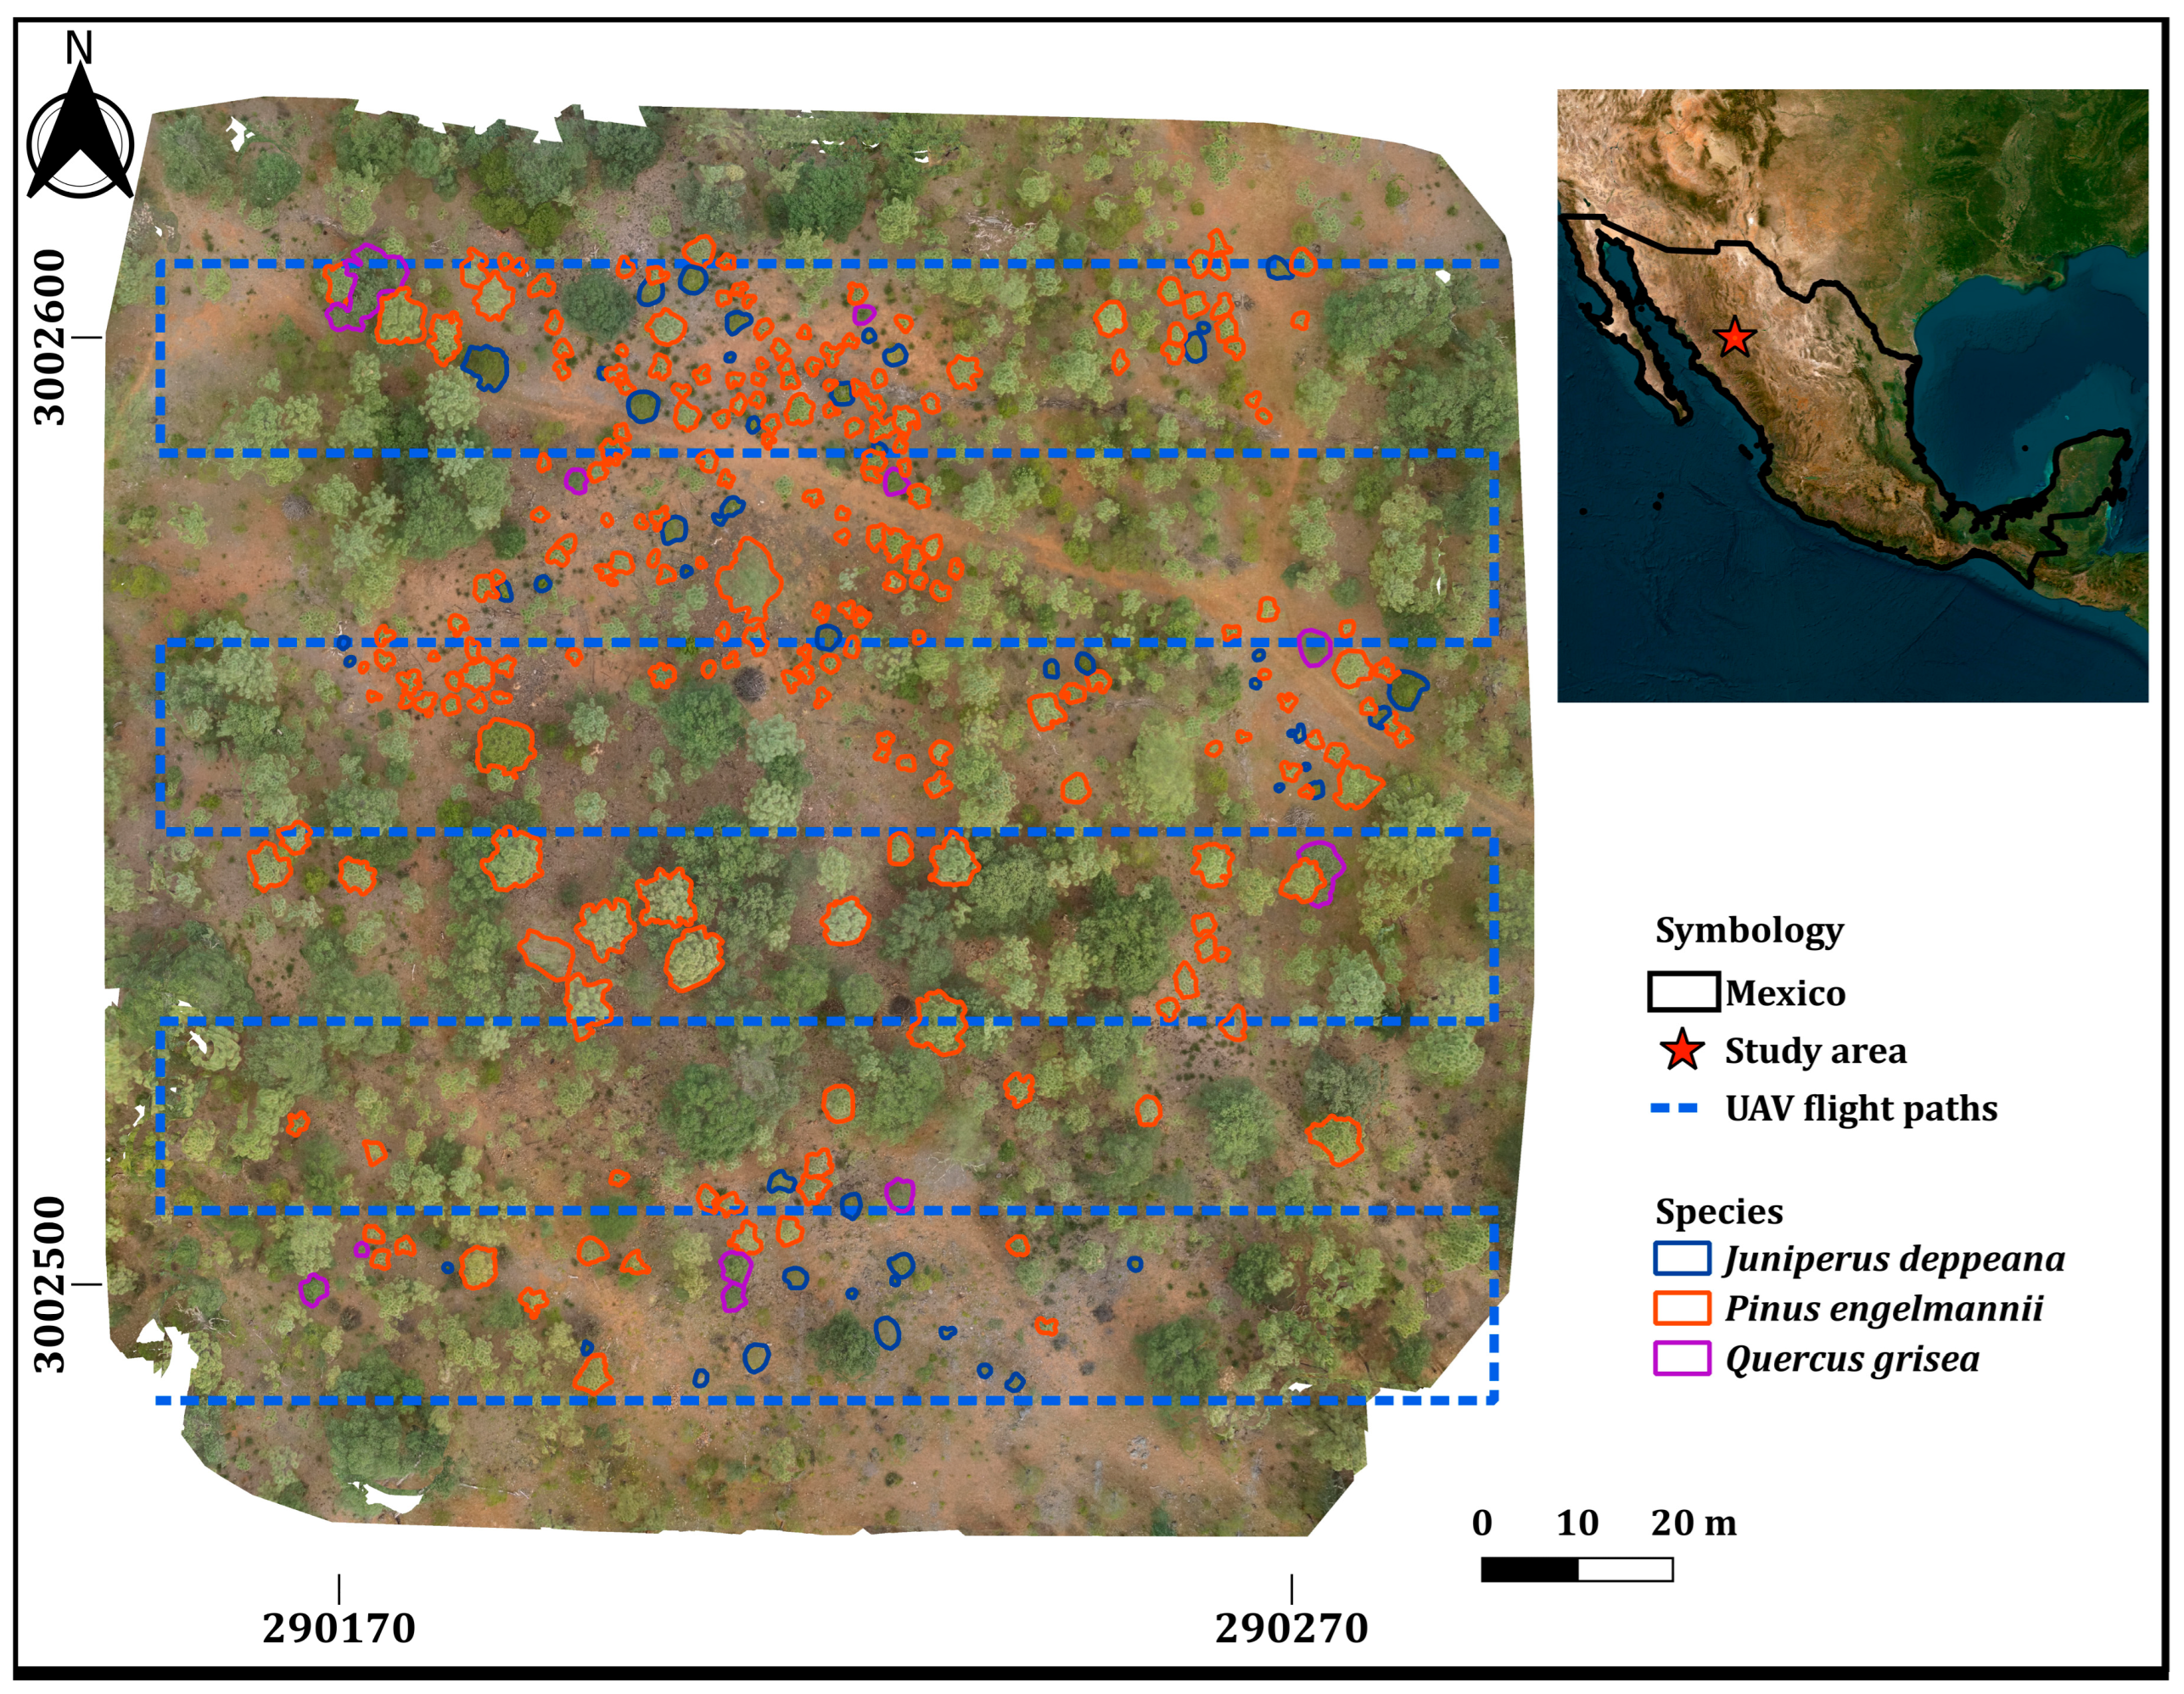
Figure 1. Map of study site location, UAV flight paths, and sampled tree crowns per species.
Remotesensing 16 00389 g001
Figure 2. Workflow of the procedure followed to generate and process the NDVI data at the individual tree level for twelve months and to link the data to the tree rings to decipher the relationship between crown activity and radial activity.
Remotesensing 16 00389 g002
Figure 3. (a) Climate–radial growth correlations in the studied species. The months of the previous and current year are represented by lower- and upper-case letters, respectively. Horizontal lines denote the p < 0.05 significance level. (b) Monthly boxplot of NDVI at the species level for the annual period of the flight. The values correspond to the NDVI calculated from flights conducted from August to December 2021 and from January to July 2022.
Remotesensing 16 00389 g003
Table 1. Dasometric statistics of the study species for the dendrochronological sampling.
SpeciesDBH
(cm)
Total Height (m)Age at DBH (Years)No. of Trees Sampled/No. of Cores Measured
J. deppeana17.04 ± 1.85.7 ± 0.445 ± 315/29
P. engelmannii36.2 ± 1.411.8 ± 0.360 ± 222/42
Q. grisea13.47 ± 0.76.01 ± 0.242 ± 114/28
Values are means ± SE. Abbreviations: DBH = diameter at breast height and SE = standard error.
Table 2. Dendrochronological statistics of the studied trees.
Tree SpeciesTRW Mean ± SD (mm)ACRbarEPS
J. deppeana1.40 ± 0.090.400.450.96
P. engelmannii2.13 ± 0.080.380.660.99
Q. grisea1.20 ± 0.060.230.380.95
Values are means ± SE. Abbreviations: AC = first-order autocorrelation; Rbar = mean correlation among trees; and EPS = expressed population signal.
Table 3. Descriptive statistics of NDVI per species on the different sampling dates in the study area.
SpeciesNMeanSDMinMax
J. deppeana490.370.120.140.61
P. engelmannii2100.480.080.180.68
Q. grisea110.450.090.300.58
N = number of trees, Mean = mean NDVI value, SD = standard deviation, Min = minimum, Max = maximum.
Table 4. Descriptive statistics of dasometric variables per species in the study site.
SpeciesVarNMinMaxMedianQ1Q3IQRModeMeanSDSE
J. deppeanaDB492.8028.8010.508.2015.907.705.7811.715.440.22
DBH490.0022.607.705.0011.406.405.197.944.890.19
CH490.713.361.781.452.120.670.491.770.490.02
TH491.516.343.702.674.491.821.263.631.170.05
CA490.0114.901.860.864.013.151.872.872.860.11
NDVI490.020.880.360.270.470.200.140.370.140.01
P. engelmanniiDB2106.0066.4012.8010.9016.405.503.3415.237.940.15
DBH2103.7056.409.107.6012.304.702.9711.376.910.13
CH2101.4212.552.512.202.840.640.453.031.960.04
TH2102.2120.765.474.387.042.661.896.433.240.06
CA2100.5835.412.631.674.632.961.674.695.720.11
NDVI2100.000.890.490.420.560.130.100.480.100.00
Q. griseaDB119.8052.3018.0014.3021.707.405.4921.8612.361.03
DBH115.8044.5011.409.6015.806.204.8915.8610.730.90
CH110.964.521.911.722.430.710.432.150.860.07
TH113.8111.705.845.497.532.040.656.551.950.16
CA111.3937.216.334.269.515.253.079.339.520.80
NDVI110.000.910.520.340.580.240.120.450.210.02
Var = variable, N = no. of trees, Min = minimum, Max = maximum, Q1 = quantile 1, Q3 = quantile 3, IQR = inter-quantile range, SD = standard deviation, SE = standard error, DB = diameter at base, DBH = diameter at breast height, CH = commercial height, TH = total height, CA = crown area, and NDVI = normalized difference vegetation index.
Table 5. ANOVA of the monthly NDVI and per species in the study site.
SVDfSum SqMean SqF ValuePr(>F)Signif.
Species26.9993.5420.58<2 × 10⁻¹⁶***
Date1211.8030.984118.21<2 × 10⁻¹⁶***
Species × Date244.6850.19523.46<2 × 10⁻¹⁶***
Residuals347128.8820.008
SV = source of variation, Df = degrees of freedom, Sum Sq = sum of squares, Mean Sq = mean squared, F value = F calculated, Pr(>F) = probability of finding an F value greater than alpha (α = 0.05), Signif. Codes = significance codes (0 ‘***’).
Disclaimer/Publisher’s Note: The statements, opinions and data contained in all publications are solely those of the individual author(s) and contributor(s) and not of MDPI and/or the editor(s). MDPI and/or the editor(s) disclaim responsibility for any injury to people or property resulting from any ideas, methods, instructions or products referred to in the content.