Article

Identification of Lunar Craters in the Chang’e-5 Landing Region Based on Kaguya TC Morning Map

1
School of Science, Jiangxi University of Science and Technology, Ganzhou 341000, China
2
College of Science, Guilin University of Technology, Guilin 541006, China
3
Key Laboratory of Geological Survey and Evaluation of Ministry of Education, China University of Geosciences, Wuhan 430074, China
*
Author to whom correspondence should be addressed.
Remote Sens. 2024, 16(2), 344; https://doi.org/10.3390/rs16020344
Submission received: 20 October 2023 / Revised: 22 December 2023 / Accepted: 11 January 2024 / Published: 15 January 2024

Abstract

:
Impact craters are extensively researched geological features that contribute to various aspects of lunar science, such as evaluating the model age, regolith thickness, etc. The method for identifying impact craters has gradually transitioned from manual counting to automated identification. Automatic crater detection based on the digital elevation model (DEM) is commonly used to detect larger craters. However, using only DEM has limitations in discerning smaller craters (diameter < ~1 km). This study utilizes an improved Faster R-CNN algorithm and the Kaguya Terrain Camera (TC) morning map to detect small impact craters in the Chang’e-5 (CE-5) landing site. It uses model fusion to improve the precision of small crater identification. The results show a recall rate of 96.33% and a precision value of 90.19% for craters with diameters exceeding 200 m. The model found a total of 187,101 impact craters in the CE-5 region. The spatial distribution density of impact craters with diameters ranging from 100 m to 200 m is approximately 2.5706/km2. For craters with diameters ranging from 200 m to 1 km, the average spatial distribution density is about 0.9016/km2. By the unbiased impact crater density of chronological analysis, the model age of the Im2 and Em4 geological units in the CE-5 region is 3.78 Ga and 2.07 Ga, respectively.

Graphical Abstract

1. Introduction

Impact craters are among the most typical and widespread geological features and structures on the lunar surface. In lunar science, impact craters represent one of the extensively studied geological landforms [1,2,3]. Research on impact craters contributes to investigations into various aspects of lunar science, including the model age of mare units on the moon [4], rock abundance [5], regolith thickness [6,7], and dielectric constants [8]. In addition, the study of impact craters is not limited to the moon, but is also be applied to different planetary systems. Examples include terrain analysis of Enceladus [9] and crater studies associated with the DART mission [10,11].
The lunar surface is abundant, with numerous impact craters of varying sizes. Research related to impact craters relies on their identification and characterization. Early identification of impact craters primarily relied on manual labeling [12,13,14], morphological feature extraction algorithms [15,16,17,18], and machine learning-based identification [2,19,20]. With advancements in computer vision and artificial intelligence, identifying impact craters has gradually shifted toward deep learning. Continuously evolving deep learning algorithms have made crater detection more accurate and efficient. In 2019, Silburt et al. [21] processed the lunar digital elevation model (DEM) using UNET to identify craters. By comparing with a manually generated crater catalogue, they achieved a recall rate of 92%. Recall rate is an evaluation metric for evaluating neural network algorithms, indicating how many samples are correctly recognized in real samples. In 2020, Yang et al. [22] employed transfer learning with neural networks to identify craters, discovering a total of 109,956 new craters, of which 18,996 were larger than 8 km in diameter. By 2022, Tewari et al. [23] adopted unsupervised and semi-supervised learning for crater identification, extracting crater morphology using a morphological approach. Moreover, algorithms based on various neural network architectures have been successfully applied to crater detection, yielding commendable results [24,25,26,27,28].
Automatic crater detection based on the DEM is commonly used to detect large craters [26,28,29,30,31]. However, there are notable limitations in identifying small impact craters using DEM data. This is primarily due to the typical image resolution of DEM being 59 m/pixel or larger [32]. Automated detection necessitates a minimum of 10 pixels to identify impact craters reliably [33]. Consequently, accurate identification is possible only for impact craters with a diameter of at least 590 m. Therefore, the lack of datasets and pertinent references constrain research regarding the automated recognition of small impact craters. Nevertheless, delving into the automated identification of small impact craters holds significant importance. For example, Fu et al. [34] conducted a study on the subsurface structure and stratigraphy of Chang’e-4 mission’s landing site by analyzing small impact craters (diameter < ~1 km) at the bottom of the Von Kármán crater. Fassett et al. [35] delved into the study of terrain degradation utilizing small impact craters. During lunar missions, a spacecraft’s lander needs to navigate potential landing hazards during its descent. Small impact craters act as challenges for the landing process. Navigation sensors and hazard detection cameras give the navigation system essential measurement data [36]. Research into the automatic identification of small craters can assist the descent and landing process, contributing to the safe landing of the lander. Additionally, small impact craters find frequent applications in secondary crater analysis [37,38] and the determination of equilibrium diameters for specific regions [6,39]. The currently documented lunar impact crater database contains over a million craters with diameters exceeding 1 km [14,31]. For small craters with a radius greater than r, the equilibrium cumulative size–frequency distribution (SFD) per unit region is proportional to r   2 [40]. This infers that impact craters larger than 100 m might exceed a billion in number, rendering manual identification of small impact craters nearly infeasible. As a result, developing an automated method of identifying smaller craters is important, although significant progress has been made in crater recognition of large (diameter > ~1 km) craters.
The advancements in deep learning algorithms have significantly propelled research on small lunar craters, yet challenges remain. In 2022, Fairweather et al. [41] manually annotated impact samples and utilized the YOLOv3 network for training and identifying craters in the Lunar Reconnaissance Orbiter (LRO) Narrow-Angle Camera (NAC) images. For impact craters ranging from 100 m to 1 km, the recall rate is 0.89, but the precision value is only 0.67. In 2023, La Grassa et al. [42] used a deep learning model based on YOLOLens for impact crater identification. They employed Robbins’s impact crater catalogue [14] and LRO wide-angle camera (WAC) images for crater detection. However, since Robbins’s impact crater catalogue only includes craters with diameters larger than 1 km, there are inherent limitations in identifying craters with diameters smaller than 1 km. Hence, automated identification of small impact craters remains a challenging problem.
The landing site of Chang’e-5 (CE-5) is located in the Rümker region, with its geographic coordinates at 43.06°N, 51.92°W [43]. The CE-5 mission has collected 1731 g of lunar samples from this region [44,45,46,47]. Li et al. [48] conducted lead–lead dating on the basalt clasts returned by the CE-5 mission and obtained a radiometric age estimate of approximately 2.03 Ga. The present lunar time scale is divided into pre-Nectarian, Nectarian (Nectaris basin), Imbrian (Imbrium basin), Eratosthenian (Eratosthenes crater), and Copernican (Copernicus crater) based on the sediments and characteristics of the four impact events [49,50]. The period of landing site in the CE-5 region is Nectarian. This suggests that some geological units in the CE-5 region represent a relatively young geological model age and have a smaller equilibrium diameter compared with the Apollo and Luna landing sites, making studying small craters especially significant. Therefore, in this study, an improved Faster R-CNN algorithm [51] and Kaguya Terrain Camera (TC) morning map [52] were utilized to identify small impact craters in the CE-5 landing site, enhancing the precision of crater identification through model fusion [53]. The TC morning map boasts a remarkable resolution of 7.403 m/pixel, significantly superior to the 59 m/pixel resolution typically found in DEM imagery. This higher resolution enables more precise detection of smaller craters. Furthermore, unlike LRO NAC images, the TC morning map eliminates the need for image registration, thereby reducing errors in latitude and longitude that may arise during the registration process. The improved Faster R-CNN model and Kaguya TC morning map were employed to predict the lunar impact crater catalogue for the CE-5 region. Following crater catalogue retrieval, region density and dating analyses were conducted, comparing them with the radiometric dating of samples collected in the CE-5 region. This comparison can provide reference data for lunar dating and a new understanding of the Moon’s geological history.

2. Materials and Methods

This section will introduce data preparation, neural network architecture, preprocessing of images in the prediction region, post processing, model evaluation, and chronological method. We created a workflow diagram (Figure 1) containing all steps based on the data processing.
The experiment was conducted on the CentOS 8.5 operating system, with the CPU device being an Intel(R) Xeon(R) Platinum 8273CL CPU @2.20 GHz and the GPU device being an NVIDIA RTX 3080Ti GPU with 12 GB onboard memory. The neural network model used in the experiment is built based on Python’s deep framework Pytorch [54]. The PyTorch version is 1.11.0, with CUDA version 11.6.

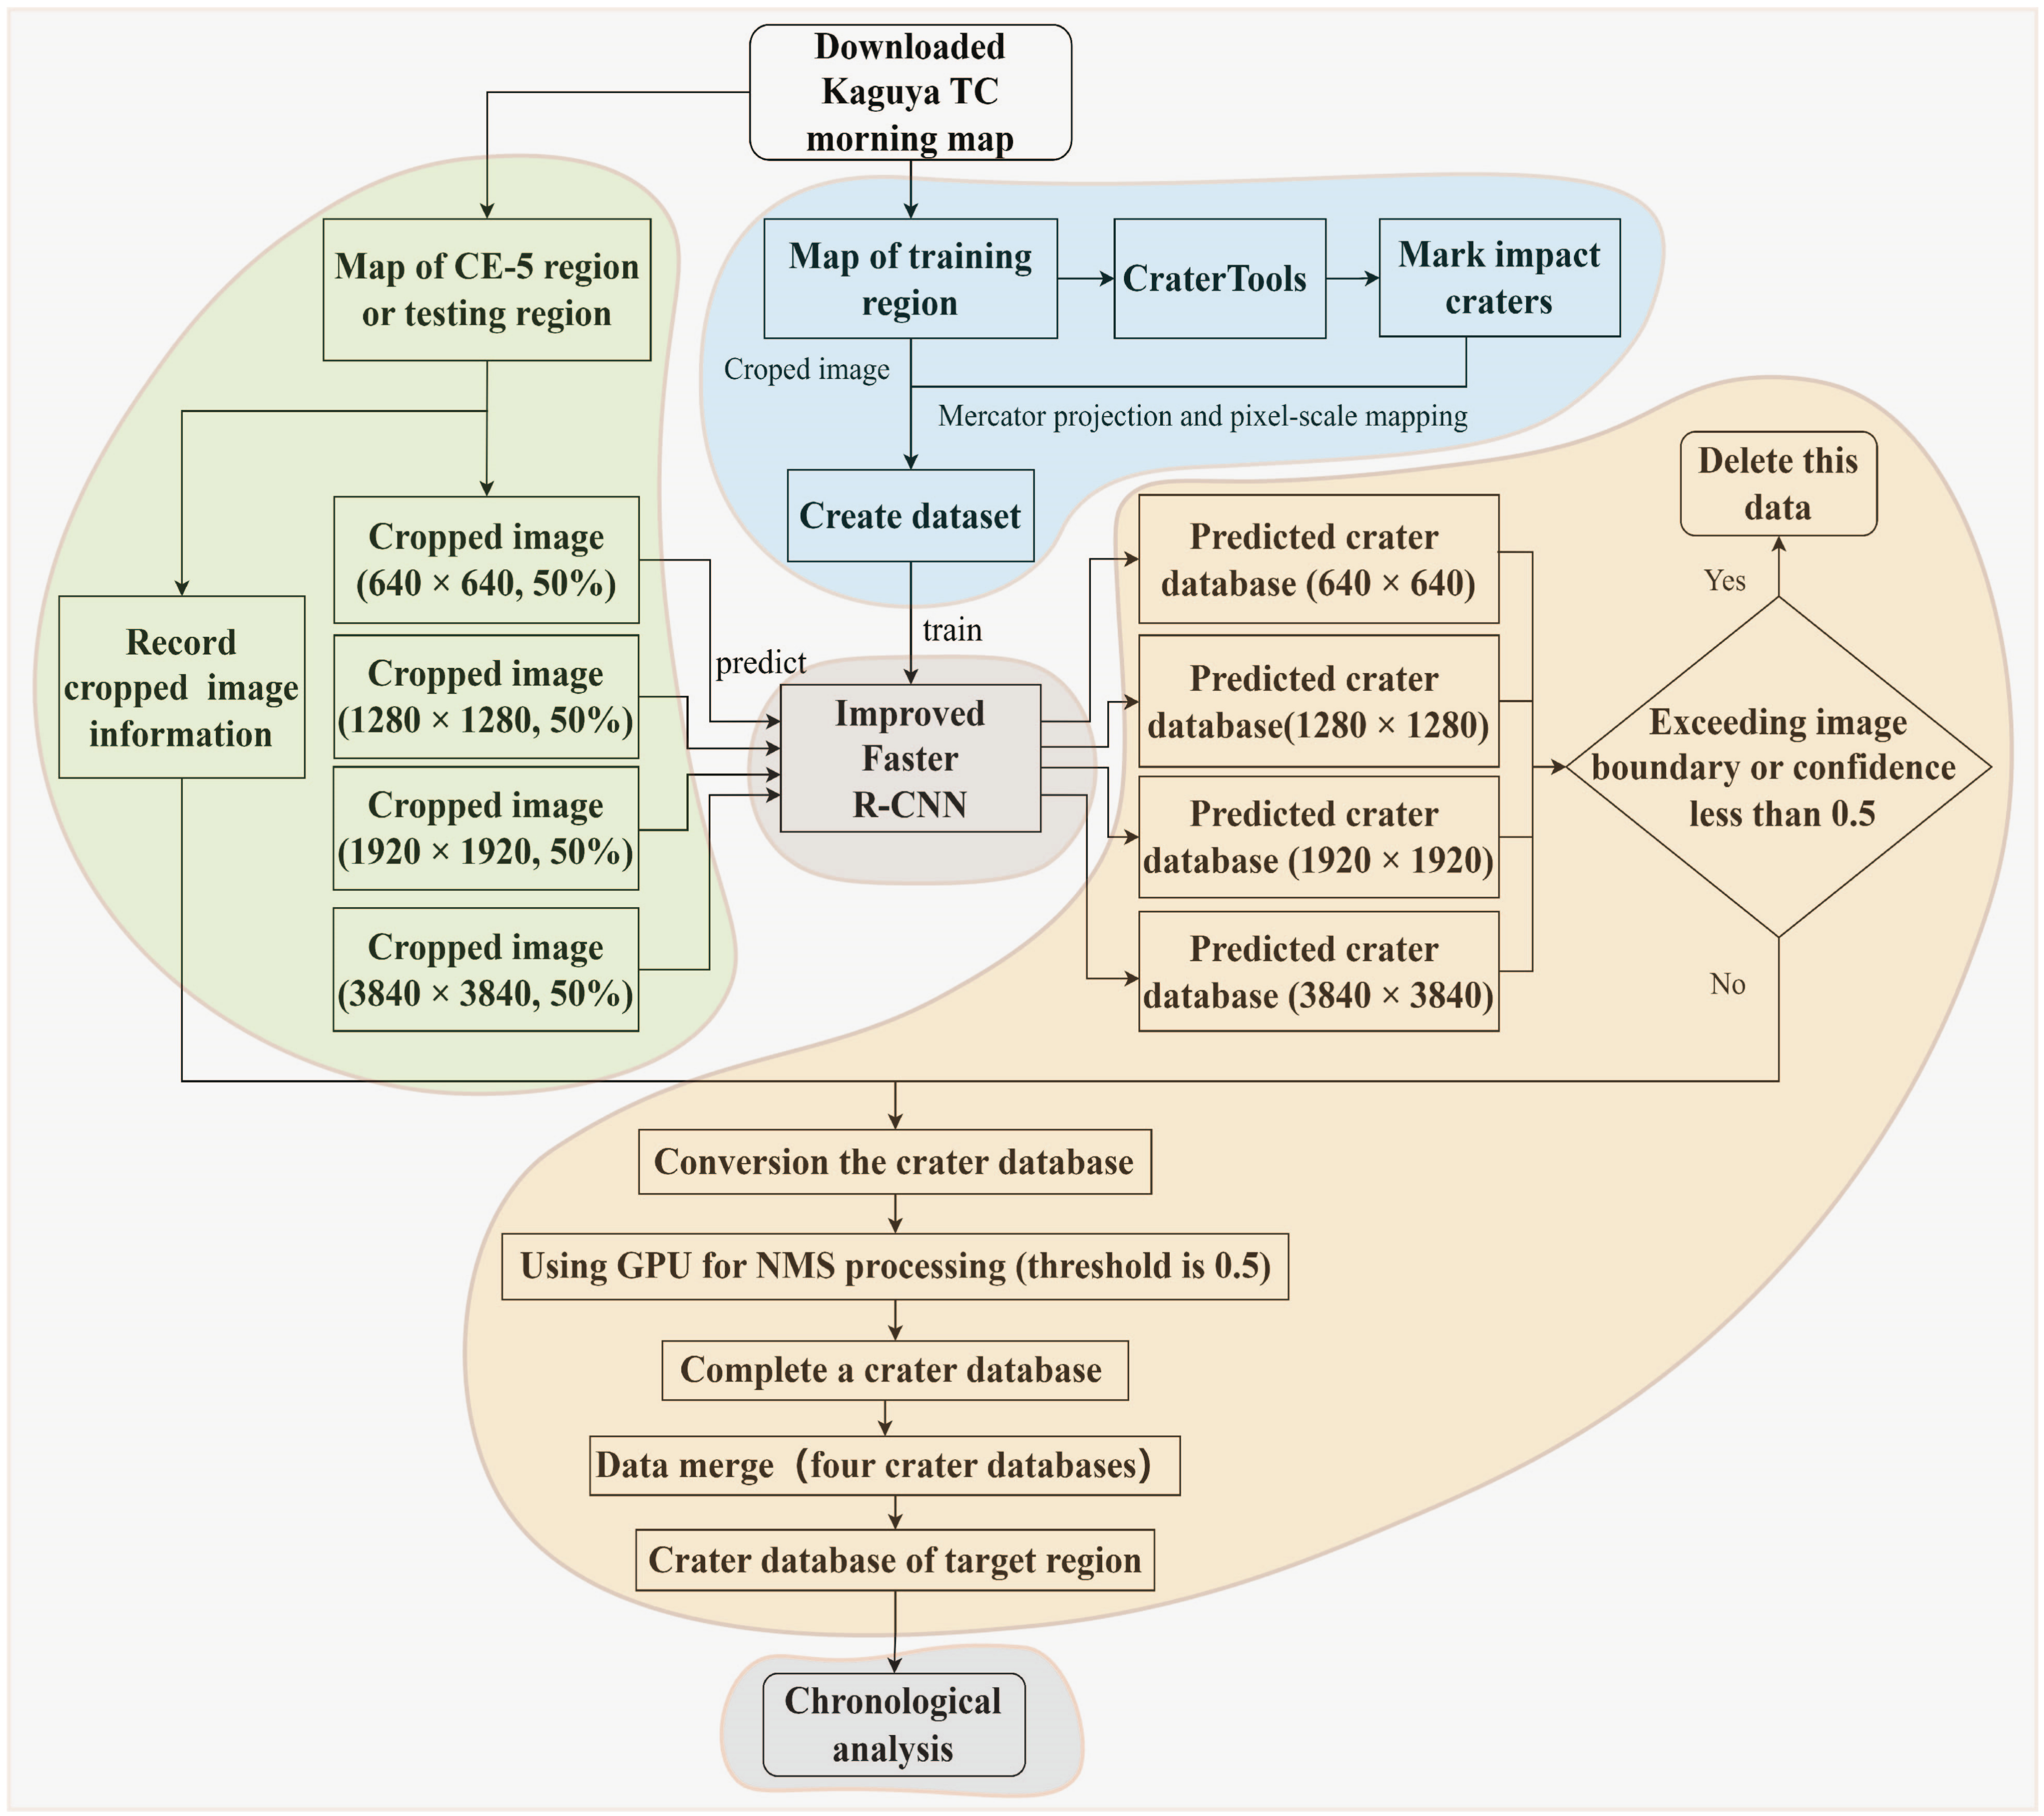
2.1. Data Preparation

The dataset preparation process consists of two main components: The first part is the preparation before creating the dataset, which mainly includes the preparation of the map, impact crater data and the matching method. The second part is dedicated to dataset creation for training and testing neural networks.

2.1.1. Preparation before Creating Dataset

The dataset format used in this paper is the PASCAL VOC [55] format, commonly used in object detection tasks. Creating a dataset in this format requires image and label data. For image data, the Mercator projection method is utilized to reproject the Kaguya TC morning map to get a new projection map (image). For label data, we employed the CraterTools tool [56] in ArcMap to manually annotate craters on the Kaguya TC morning map to obtain crater data (basic label data), which is presented in the form of latitude and longitude coordinates. To create a dataset in PASCAL VOC format, the label data and image data need to be matched; that is, the vector data (labels) are associated with the raster data (pixels), which means that the corresponding impact crater area can be marked on the image through the label data. Because the image data is expressed in the form of pixels, the data in the latitude and longitude format of the label need to be converted into the format of pixel coordinates in order to match the image. The process is shown in the light-blue area in Figure 1. Converting coordinates in the latitude and longitude format of the label data into coordinates in the pixel format requires using the Mercator projection formula. The Mercator projection formula is expressed as follows.
X = K ln tan π 4 + B 2 × 1 e sin B 1 + e sin B e 2 ,
Y = K L L 0 ,
K = a 2 b 1 + e × c o s 2 B 0 × c o s 2 B 0 ,
e = 1 a b 2 ,
e = a b 2 1 .
The coordinate conversion utilized the Mercator projection, with a first latitude ( B 0 ) of 44.1 degrees. The origin longitude ( L 0 ) was set to 0 degrees. The semi-major axis a and semi-minor axis b of the Moon were assumed to conform to standard spherical dimensions, both set to 1,737,400 m. The first eccentricity of the Moon ( e ) and the second eccentricity ( e ) were also taken into account. The transformation from geographical coordinates L , B to lunar meter coordinates X , Y was achieved through Equations (1)–(5). Here, the longitude and latitude coordinate range of the overall image region, the image resolution, and the image pixel scale (the number of pixels in width and height) are known. By using the latitude and longitude coordinates of the overall image region and the Mercator projection Formulas (1)–(5), the meter-level coordinates of the upper-left and lower-right corners of the overall image can be calculated. The longitude and latitude coordinates of the center point of the impact crater are converted to meter-level coordinates through Mercator projection, and then the mapping relationship between the meter-level coordinates of the upper-left and lower-right corner points of the overall image, as well as the pixel scale of the overall image, is used to match the longitude and latitude geographic coordinates of the center point of the impact crater with its corresponding position on the image. The diameter of the impact crater is mapped to pixel level based on the resolution of the image.
The predicted craters in the target area are represented by pixel-level data, so the pixel data need to be converted into longitude and latitude data to determine the location of the impact crater on the lunar surface. The conversion process is the inverse process of the above. Converting meter coordinates to geographical coordinates requires the inverse Mercator projection transformation. The inverse Mercator projection transformation formula is as follows.
B = π 2 2 a r c t a n e x p X K × e x p e 2 × ln 1 e sin B 1 + e sin B ,
L = Y K + L 0 .

2.1.2. Region Partitioning and Dataset Generation

The alignment between the crater label data and the crater positions on the TC morning map was achieved using the Mercator projection formula and associated calculations. A synthetic TC morning map was defined within the range of 48°W to 69°W longitude and 39°N to 48°N latitude, which facilitates map data processing. This region comprised a pixel dimension of 61,771 × 36,602. The CE-5 region encompasses the coordinates from 49°W to 69°W and 41°N to 45°N. The training region is designated within the coordinates of 59°W to 69°W longitude and 45°N to 48°N latitude. Additionally, the testing region was set within the coordinates of 55°W to 59°W longitude and 45°N to 48°N latitude. The training and testing regions are located above the CE-5 region. Because the two regions are adjacent to the CE-5 region, this is helpful for identifying the craters in the CE-5 region (see Section 3.2 for the results).
Creating the dataset involves simultaneously processing image data and label data. In dealing with image data, given the fixed 640 × 640 dimensions required by the improved Faster R-CNN for input, it is crucial to crop the images from the training region to ensure accurate extraction of impact crater features. To effectively train on smaller impact craters, images measuring 1280 × 1280 pixels were randomly cropped within the training region, and the data where the coordinates of the crater center lie within the cropped image region and where the crater diameter is greater than 20 pixels were selected. Subsequently, these images were resized to fit CNN’s input size.
In both the training and validation regions, a dataset was created by randomly cropping images. This approach effectively enlarges the dataset without using the data augmentation technique. The training set and the testing set generated randomly contain 4000 and 1000 images, respectively. Rather than segmenting the test region into smaller subsets, the entire test region was evaluated as a whole, which enables a more accurate evaluation of the performance of improved Faster R-CNN in the test region without introducing additional errors. Additionally, employing model fusion [53] to enhance impact crater identification precision involves using four models, necessitating four sets of training and validation data.

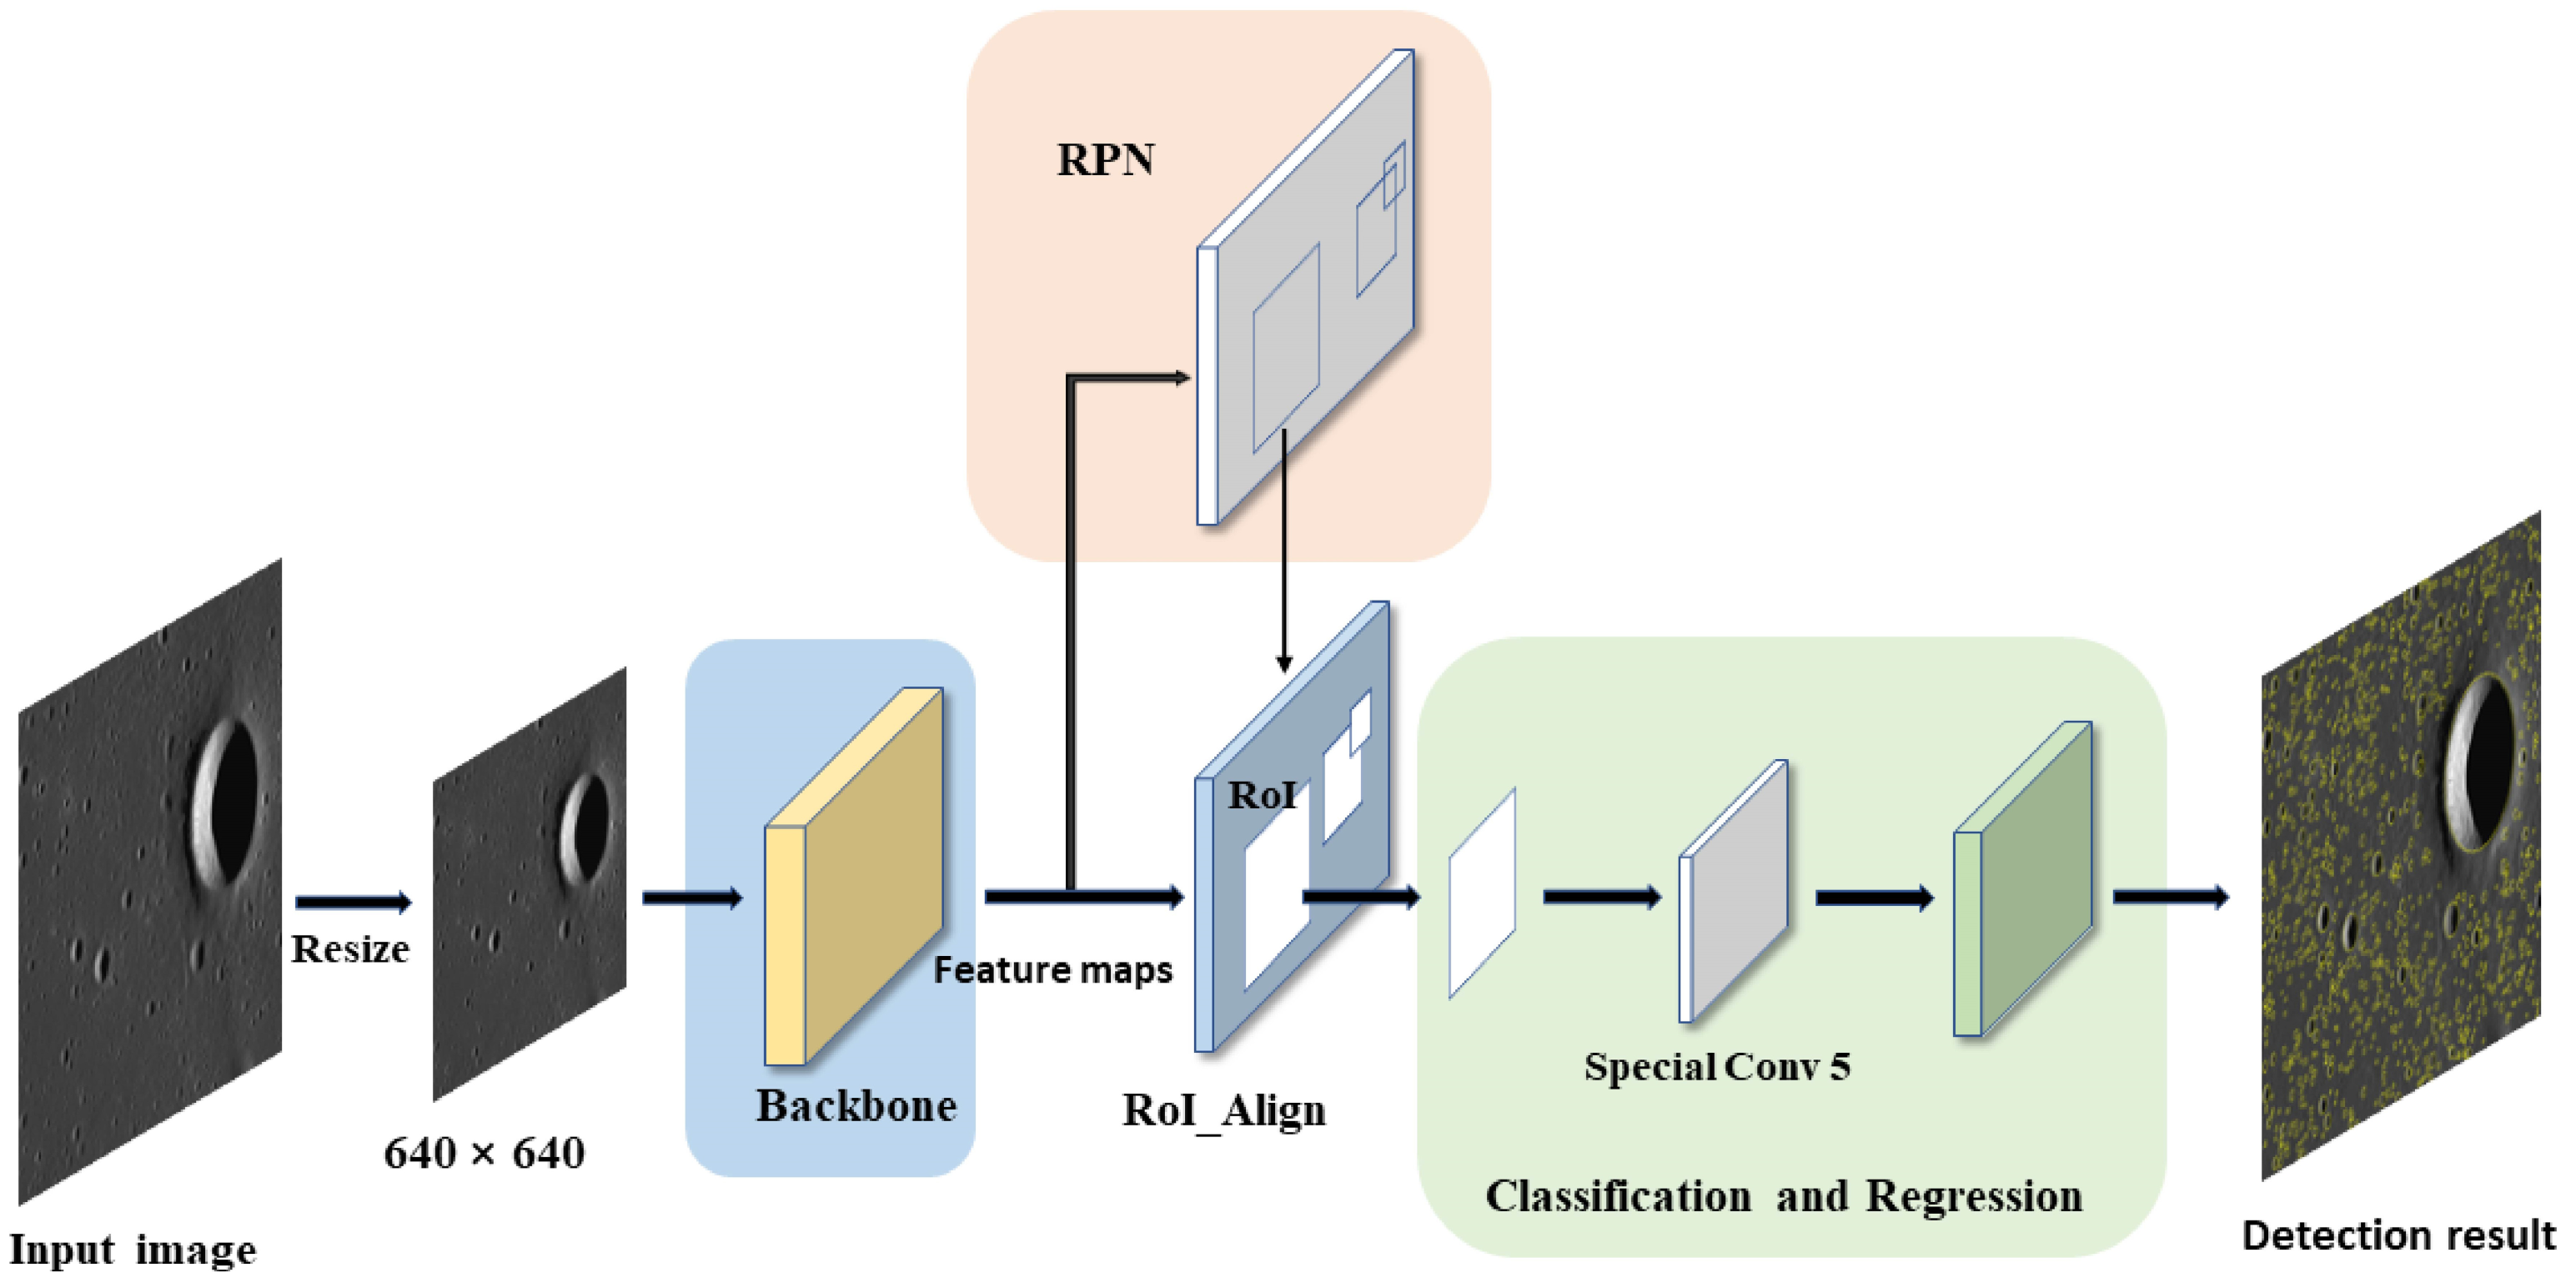
2.2. Neural Network Architecture

In this study, the Faster R-CNN algorithm was adopted as the baseline of impact crater recognition. Faster R-CNN belongs to the end-to-end object detection networks, which is a classic two-stage object detection algorithm. However, the original Faster R-CNN demonstrates suboptimal recognition performance for small targets. The RoI_Align structure [57] was employed here to detect small impact craters better to replace the original RoI_Pool structure. The RoI_Align structure has shown heightened accuracy for detection tasks, especially for smaller objects. Given that all craters exhibit simple impact structures characterized by bowl-shaped interiors and smooth walls [50], the three anchor box aspect ratios { 1 : 2 ,   1 : 1 ,   2 : 1 } of the original Region Proposal Network (RPN) were uniformly set to { 1 : 1 }. To further tailor the detection for smaller craters, the dimensions of the anchor boxes after mapping were set to 8 × 8 ,   16 × 16 ,   32 × 32 ,   64 × 64 ,   108 × 108 ,   192 × 192 ,   256 × 256 ,   320 × 320 ,   394 × 394 . These selections and configurations help accommodate the specific shapes and sizes of lunar impact craters and reduce errors in small impact crater identification. Additionally, ResNet-50 [58] was utilized as the backbone network.
The input image size for the improved Faster R-CNN model was set to 640 × 640 pixels, with each cropped image having a resolution of approximately 7.403 m/pixel. This implies that any crater with a diameter exceeding 4737.92 m would exceed the image dimensions. Given the presence of impact craters in the CE-5 region surpassing this diameter, it is necessary to crop images larger than the size of 640 × 640 pixels. However, the improved Faster R-CNN mandates a fixed input image size, necessitating resizing images exceeding this dimension to match the neural network’s input size.
Figure 2 illustrates the structure of the improved Faster R-CNN network. The structure consists of four parts.
  • Resize Processing: The first part involves resizing the input images to the fixed size required by the improved Faster R-CNN.
  • Backbone: The second part consists of the backbone, which employs ResNet-50 to generate feature maps of a specific size. These feature maps are instrumental in extracting essential feature information from the images.
  • RPN: The third part is the RPN, which primarily focuses on extracting the region of interest that potentially contains the target.
  • Classification and Regression: The fourth part includes convolutional and pooling layers used to output detection positions and classification information for the target images.
  • Additionally, Table 1 elucidates the alterations in improved Faster R-CNN feature maps at different stages, helping to understand the feature extraction process.
The resize operation is similar to downsampling, and it has not been included as a part of the feature map transformations in Table 1. Special Conv 1, Max Pooling 1, Special Conv 2, Special Conv 3, and Special Conv 4 constitute a portion of the backbone network (ResNet-50), yielding feature maps with dimensions of 40 × 40 × 1024. Replace the RoI_Pool structure in the baseline with the RoI_Align in the baseline to improve the accuracy of identifying small targets. Special RoI_Align extracts all regions of interest into feature maps with fixed dimensions. Subsequently, classification and regression operations are performed via Special Conv 5 and Average Pooling, culminating in the recognition results for the input image.

2.3. Preprocessing of Images in the Prediction Region

The prediction region is split into two distinct sections: the test and the CE-5 regions. Before prediction by the improved Faster R-CNN, the map in the prediction region was cropped into smaller images. To accurately locate impact craters of different sizes, the image dimensions were sorted into four distinct scales: 640 × 640, 1280 × 1280, 1920 × 1920, and 3840 × 3840. Smaller images target the detection of small craters, medium-sized images were calibrated for detecting medium-sized craters, while larger scales focus on detecting large craters. This approach mirrors the concept of an image pyramid [59], ensuring the model retains sensitivity to craters across different scales.
The impact craters might be truncated in cropping images in the prediction regions. There should be a 50% overlap region between adjacent cropped images of the same dimension. This approach ensures that truncated impact craters remain intact in adjacent or larger images, enhancing detection results. The final row and column of cropped images might experience overlaps exceeding 50%. With this method, it could be calculated that the maximum diameter of a complete Impact crater was approximately 14,214 m, which was sufficient for crater detection in the test and the CE-5 region. In addition, when cropping the predicted image, the longitude and latitude information and cropped pixel information of each predicted sample image will be recorded, which is helpful for analysis and subsequent research on the predicted crater data.

2.4. Postprocessing

The location and related details of the impact crater can be obtained through the prediction of the improved Faster R-CNN. Predicted crater data expressed as DR. This section encompasses handling impact crater data within the predicted regions, the extraction method and the evaluation methods.

2.4.1. Data Processing for Predicted Impact Craters

The pixel coordinates information of the impact crater on the image were obtained through the prediction of the improved Faster R-CNN model. Because the impact crater might be truncated in the images, the predicted crater pixel coordinates extend beyond the image boundaries, which leads to inaccurate crater identification. Impact craters with low prediction confidence (less than 0.5) are also considered inaccurate. The inaccurately recognized impact crater data need to be discarded. Furthermore, because there was an overlap between adjacent images and shared regions in different-sized images, the exact impact crater might be detected multiple times. Non-maximum suppression (NMS) using GPU acceleration addressed this issue. The predetermined NMS threshold was set at 0.5. Ultimately, an impact crater database for the predicted region by a single improved Faster R-CNN model was obtained.
Predictions from multiple improved Faster R-CNN models yield multiple separate impact crater databases. These were merged into a comprehensive database through multi-model data fusion. The process is as follows:
  • Extracting an impact crater coordinate data from one of the databases.
  • Then calculate the intersection over union (IoU) value with all the coordinates of another impact crater database.
  • If a coordinate has an IoU value greater than 0.5, consider that both databases have detected the same impact crater. Calculate the average coordinates and confidence score of the two prediction results and retain the merged result. If the value of the intersection ratio is less than 0.5, it means that the two crater databases did not detect the same impact crater, and the data will be discarded.
  • Repeat this process until all coordinate data from one database has been processed.
  • Continue this merging process iteratively, merging multiple databases step by step; a comprehensive database containing all impact craters is eventually obtained.
This iterative merging approach ensures the accuracy and reliability of the final database while eliminating redundancies from duplicate detections of impact craters.
The data of impact craters in the database requires the conversion of pixel coordinates to geographic coordinates to determine the precise location of impact craters on the lunar surface. Assuming the DR data pixel coordinates relative to the entire map are given by ( a 1 , b 1 , a 2 , b 2 ) , we proceed to transform them into the new impact crater coordinates ( a c e n , b c e n , p d i a m ) using the conversion process outlined in Formulas (8)–(10). Subsequently, operations such as pixel mapping and inverse Mercator projection (Section 2.1.1) were used to convert the coordinate format and establish an impact crater database.
a c e n = a 1 + a 2 2 ,
b c e n = b 1 + b 2 2 ,
p d i a m = x 2 x 1 + y 2 y 1 2 .
Furthermore, certain refinements to the pixel coordinates of the DR are essential. The circular pixel coordinates for a DR are denoted by ( a c e n , b c e n , p d i a m 2 ) .

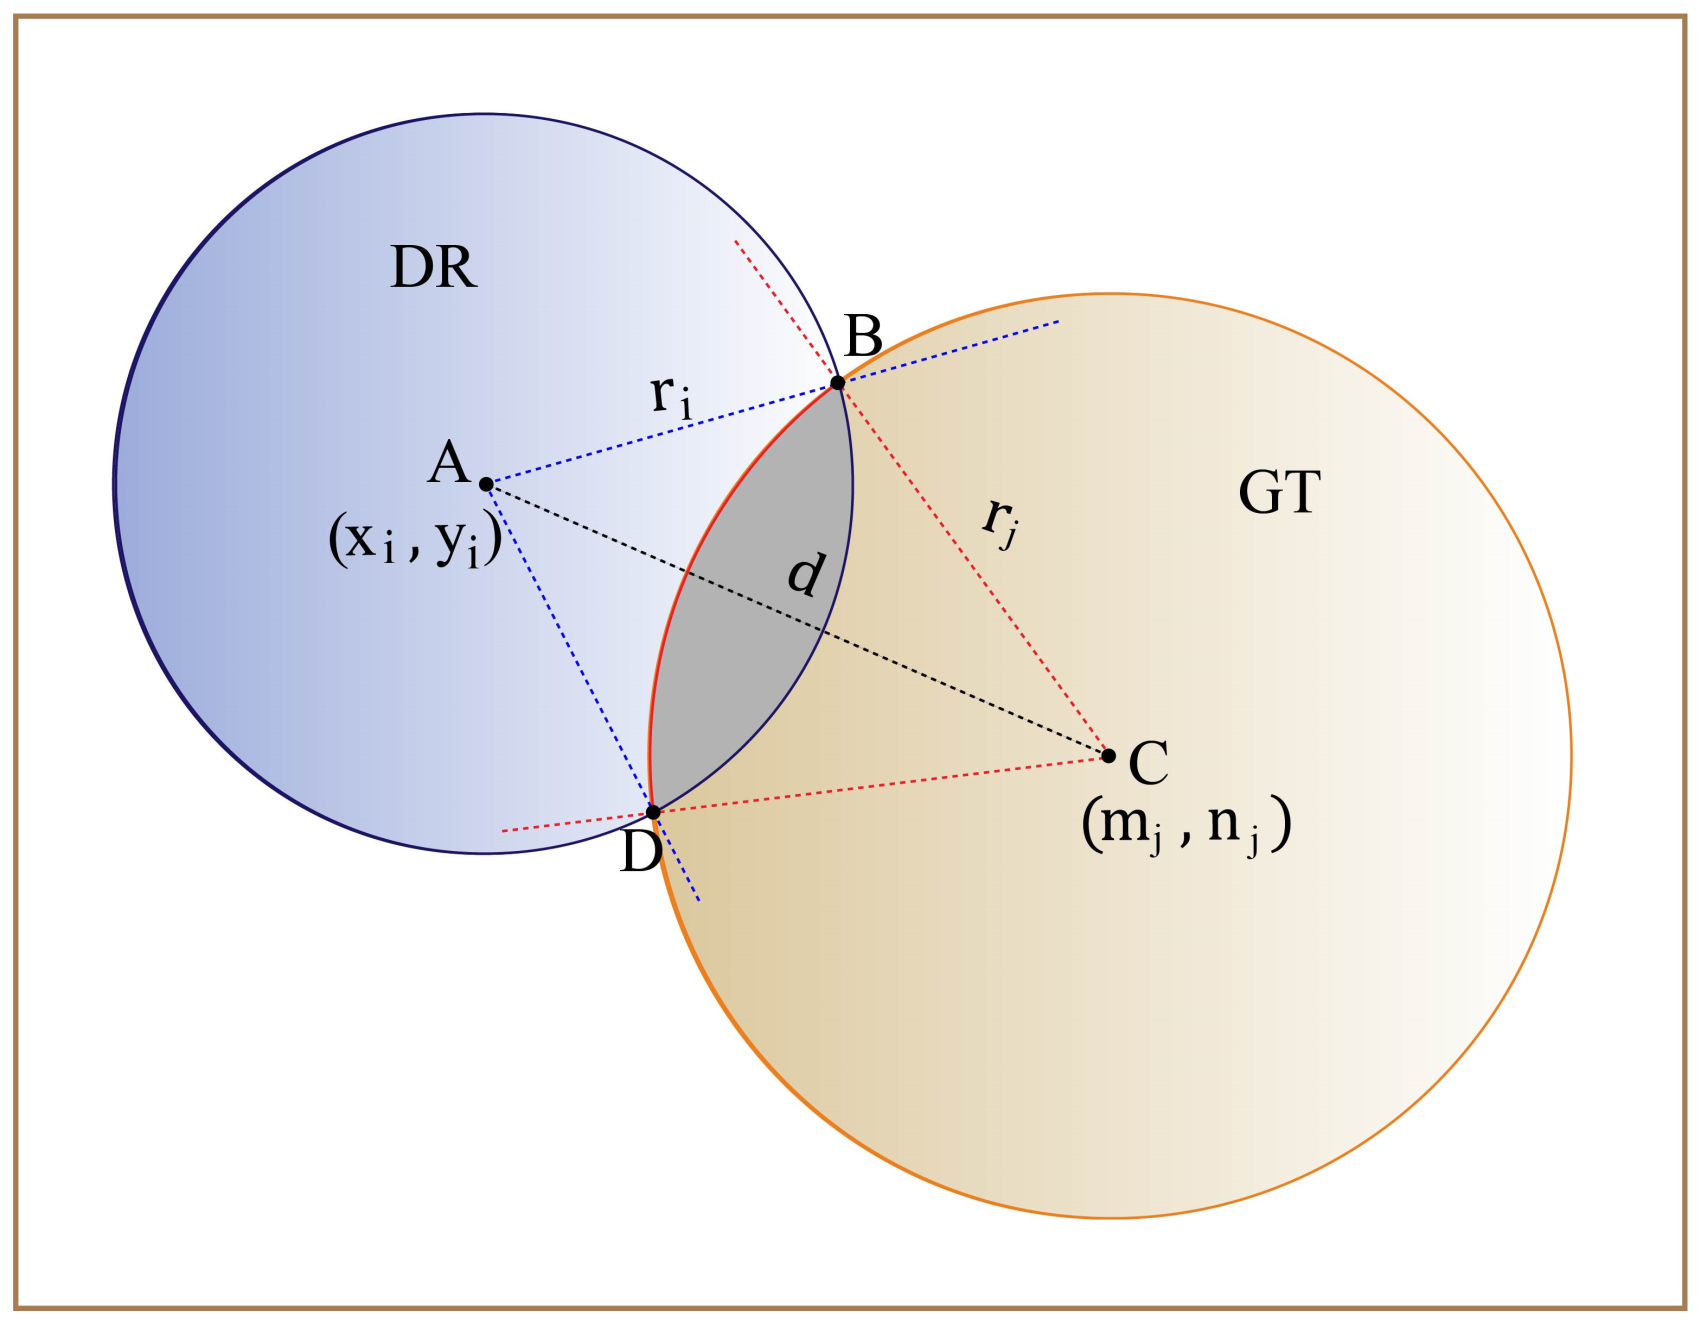
2.4.2. Processing Ground Truth Data for Impact Crater

The ground truth (GT) data regarding crater coordinates require relevant transformations for subsequent data processing analysis. Specifically, assume the geographic coordinates of the GT data are given by L o n 1 , L a t 1 , L D i a m , where L o n 1 , L a t 1 denote the longitude and latitude coordinates at the center of the actual impact crater, and L D i a m (m) represents the crater diameter. Initially, the geographic coordinates L o n 1 , L a t 1 were converted into pixel coordinates x c e n , y c e n using a transformation process. L D i a m was converted into pixel units l d i a m based on image resolution through the matching process outlined in Section 2.1.1, the details of which are omitted here for brevity. Following this transformation, the circular pixel coordinates are denoted as x c e n , y c e n , l d i a m 2 .

2.4.3. Extraction Method for Impact Crater

Upon obtaining the DR database, it is necessary to validate the recognition results of the improved Faster R-CNN model. A method to discern if the DR data are truly positive samples involves computing the IoU value between the pixel coordinates of DR and GT datasets. A higher IoU value indicates a closer positional match between the predicted and actual impact crater data. If the IoU value is larger than the defined threshold, the DR data are classified as a positive sample.
The methodology entails computing the IoU value between the DR and GT data, represented as circles, as illustrated in Figure 3. This data processing approach was adopted by Lin et al. [29]. Assuming the pixel coordinates of the DR circle are denoted as x i , y i , r i , and the pixel coordinates of the actual impact crater circle in the test region are denoted as m j , n j , r j , the calculation of IoU value was implemented using Formulas (11)–(17).
I o U = Intersection π r i 2 + π r j 2 Intersection ,
Intersection =     0                                                       , i f         r i + r j d min π r i 2 , π r j 2   ,   i f       r i r j d c                                                       , other   ,                            
d = x i m j 2 + y i n j 2 ,
Setting angle BAC as α and angle BCA as β . The region of quadrilateral ABCD is denoted as S A B C D .
α = a r c c o s r i 2 + d 2 r j 2 2 × r i × d ,
β = a r c c o s r j 2 + d 2 r i 2 2 × r i × d ,
S A B C D = 2 × 1 2 × r i × d × sin α = r i × d × sin α ,
c = 2 × α 360 ° × π r i 2 + 2 × β 360 ° × π r j 2 S A B C D .
Calculating the IoU value between the DR and GT data represented as circles and comparing it to a predefined IoU threshold can determine whether the DR data constitute a positive sample.

2.5. Model Evaluation

After establishing the criteria for identifying the impact crater as a positive sample, the improved Faster R-CNN model needs to be evaluated. In previous studies, neural network evaluations have hinged on metrics like recall rate, precision, and F 1 score [21,28,29]. Recall rate measures how many DR data are correctly identified, which is the proportion of predicted positive samples compared to the GT data. Precision evaluates the proportion of correctly predicted positive samples from the DR data. A frequent occurrence in these metrics is the trade-off between recall rate and precision: when one surges, the other might decline. Therefore, the F 1 score is a metric that balances recall rate and precision. Average precision ( AP ) is a comprehensive metric for the performance evaluation of neural network models. The formula for calculating recall rate, precision value, and F 1 score is as follows (18)–(20). “Recall” in Formula (18) is expressed as recall rate.
Recall = T P T P + F N ,
Precision = T P T P + F P ,
F 1 = 2 × Recalll × Precision Recalll + Precision .
where T P represents true positives, indicating the number of the DR data correctly identified as positive samples, F N , which stands for false negatives, represents the number of impact craters in the GT data that are not correctly identified as positive samples by the predictions, and F P , indicating false positives, refers to the number of the DR data points incorrectly classified as positive samples.
In calculating A P , the methodology starts by arranging the DR data in a descending hierarchy based on confidence scores. Recall rate and precision are determined progressively for N (N = 1), positive samples. The formula calculates the maximum precision value achieved at any recall rate level R ˜ e c a l l that satisfies R ˜ e c a l l R e c a l l . This maximum precision is considered the precision corresponding to the recall rate. The formula for calculation is as follows. In Formula (21), the recall rate is abbreviated as R and R ˜ e c a l l is abbreviated as R ˜ .
A P = n R n R n 1 max R ˜ : R ˜ R n P R ˜   .

2.6. Chronological Method

The chronological analysis of the Moon relies on a limited number of sampling points for radiometric dating. A method is the relative dating technique by studying the crater density within the geological unit, with impact crater size–frequency distribution (CSFD) analysis standing out as a prominent technique [49,50,60]. The rationale for crater-based dating is that the cumulative frequency of external impacts stemming from celestial bodies like asteroids and comets escalates with time. A region’s geological model age is inferred by establishing a correlation between the model age and the density of these impact craters, leveraging the knowledge gained from designated sampling points with known ages on the lunar surface [1,60,61,62].
Upon obtaining the impact craters within the CE-5 region, a chronological analysis of the geological units within the CE-5 region was conducted based on the impact crater chronology proposed by Xie et al. [63]. Xie et al. utilized a maximum-likelihood estimation approach to correct for biases in impact crater density, thus deriving the unbiased impact crater density within the target region. The method considers the influence of terrain variations on impact crater density, the effect of topographic degradation on crater density, and measurement error. Lunar impact crater chronological analysis needs to be conducted within consistent geological units. This study selected the geological units defined for the CE-5 region by Qian et al. [64]. The division of these geological units is depicted in Figure 4. In the CE-5 region, this study focuses on a chronological analysis of the larger geological units, specifically the Im1, Im2, Em3, and Em4 units. This analysis was based on the impact crater data of the selected geological units and their research methodology.

3. Results

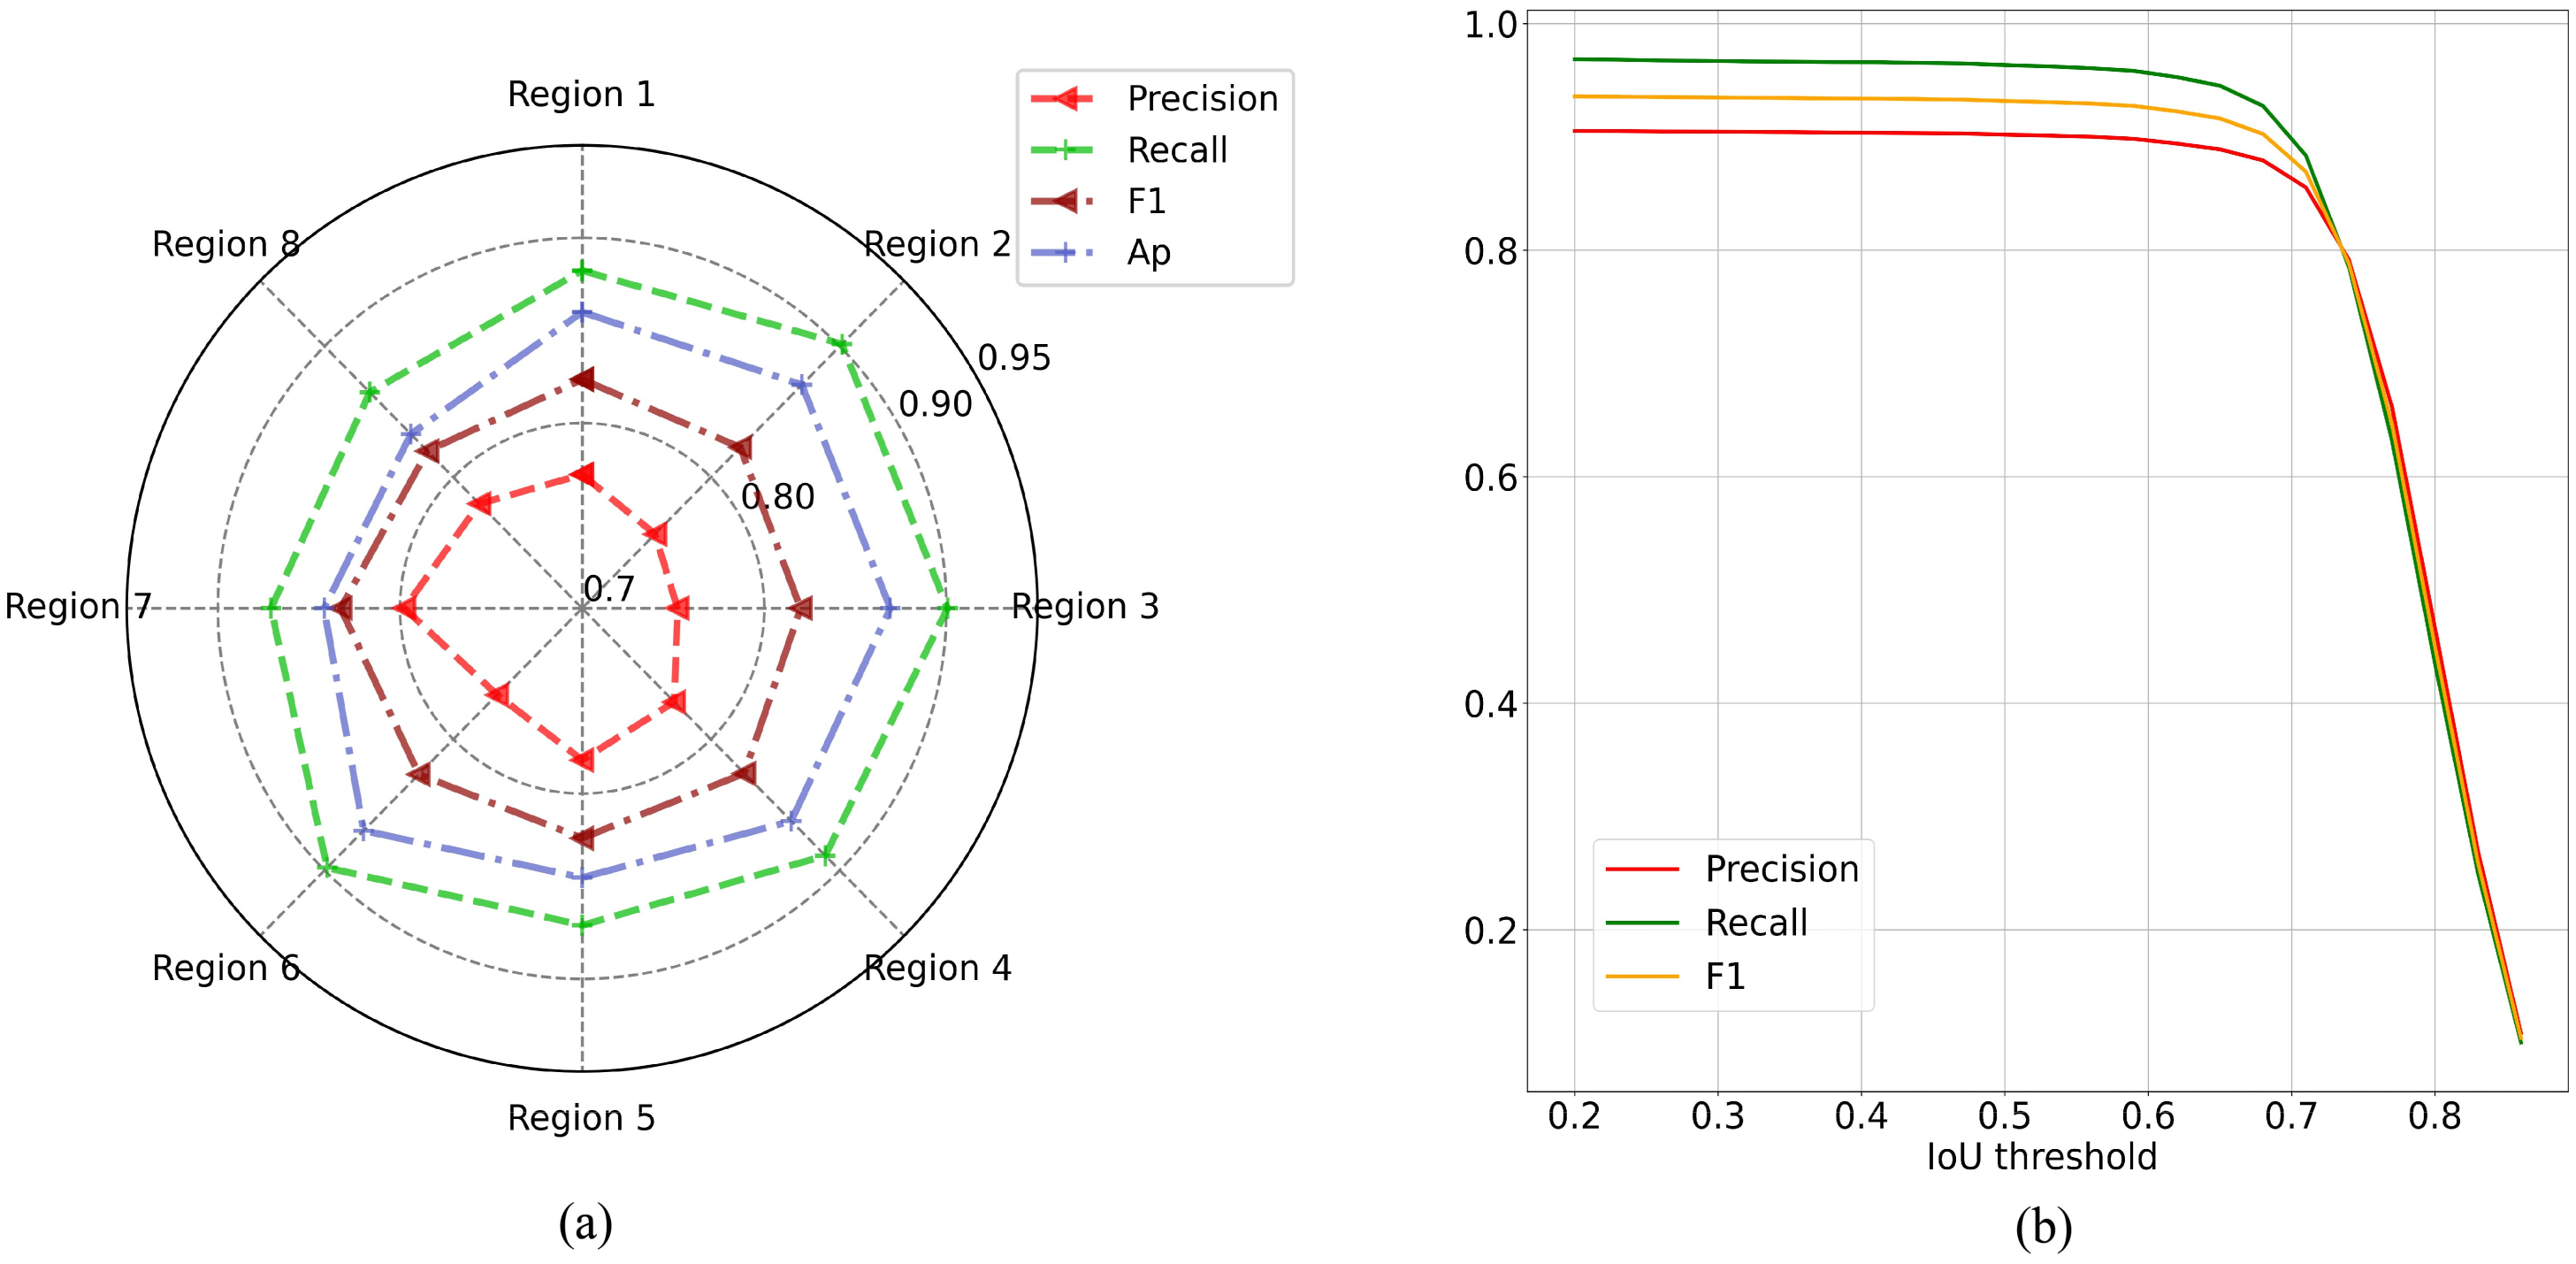
3.1. Model Evaluation of Test Region

Analyzing the prediction performance of the improved Faster R-CNN model in the test region involves the DR database and GT database of the region. Wang et al. [33] experimentally showed that impact crater identification is considered reliable when the crater size exceeds 10 pixels. For this study, the resolution of the TC morning map used is 7.403 m/pixel. During the evaluation process, data analysis was conducted using impact crater diameters larger than 100 m, 200 m, and 500 m.
In assessing impact crater data with a baseline diameter of 100 m, the DR and GT database used for this evaluation must encompass craters exceeding 100 m. For impact craters with diameters larger than 200 m or 500 m, while assessing the recall rate, the number of positive samples is determined by calculating the IoU value between the impact crater data with diameters greater than 200 m or 500 m in the GT database and all DR data. Meanwhile, in assessing precision, the number of positive samples is determined by calculating the IoU value between impact crater data with a diameter exceeding 200 m or 500 m in the DR database and all GT data. The minimum IoU threshold was set at 0.5, and the minimum confidence score for DR data was 0.8. The evaluation results are presented in Table 2.
Within the test region, the number of DR data with diameters exceeding 100 m and a confidence score above 0.8 was 30,060, whereas the actual count of craters in that region was 26,197. Referring to data from Table 2, when craters have a diameter threshold set at 100 m, the recall rate achieves 88.63%, and the AP value rises to 85.82%. By increasing the crater diameter benchmark to 200 m, the recall rate was enhanced to an impressive 96.33%. When the crater diameter threshold was set at 500 m, the precision value peaks at 97.06%.
The test region was divided into eight zones by averaging longitude to scrutinize the detection performance. Adjacent regions exhibit a longitude difference of 0.5°W, while the intervals of latitude remain consistent. Furthermore, if the center point of the crater falls within a zone, the data is considered to belong to that zone. We did not account for cases where DR data and their corresponding GT data are not in the same zone. Additionally, the minimum recorded impact crater diameter was larger than 100 m. The recognition results for these eight zones are depicted in Table 3 and Figure 5a. Furthermore, Figure 5b illustrates the variations in different evaluation metrics for impact craters with a diameter larger than 200 m under different IoU threshold conditions.
As depicted in Table 3 and Figure 5a, it is clear that Region 2 identified the most impact craters and achieved the highest recall rate among all regions—an impressive 90.17%. However, its precision value is 75.56%. While Region 6 echoes a recall rate akin to Region 2 and Region 3, its precision surpasses both. Region 7 exhibited the highest precision of all regions—79.76%. However, its recall rate was relatively lower, suggesting that while Region 7 excels in accurate crater identification, several craters might have eluded detection.
Figure 5b illustrates the variation in evaluation metrics within the IoU threshold continuum from 0.2 to 0.86, incremented by 0.03. The experimental results demonstrate a similar overall trend in the evaluation metrics. At an IoU threshold of 0.2, the recall rate is 96.84% and the precision value is 90.52%. The curves show minimal fluctuations within the IoU threshold spectrum of 0.2 to 0.6. However, around the IoU threshold of approximately 0.68, a pronounced dip becomes evident in all trajectories. When the IoU threshold escalates to 0.8, the recall rate and precision value drop to around 45%. As the IoU threshold increases, the alignment standard between DR data and GT data improves and the number of positive samples decreases, resulting in fewer data points on the evaluation curve.

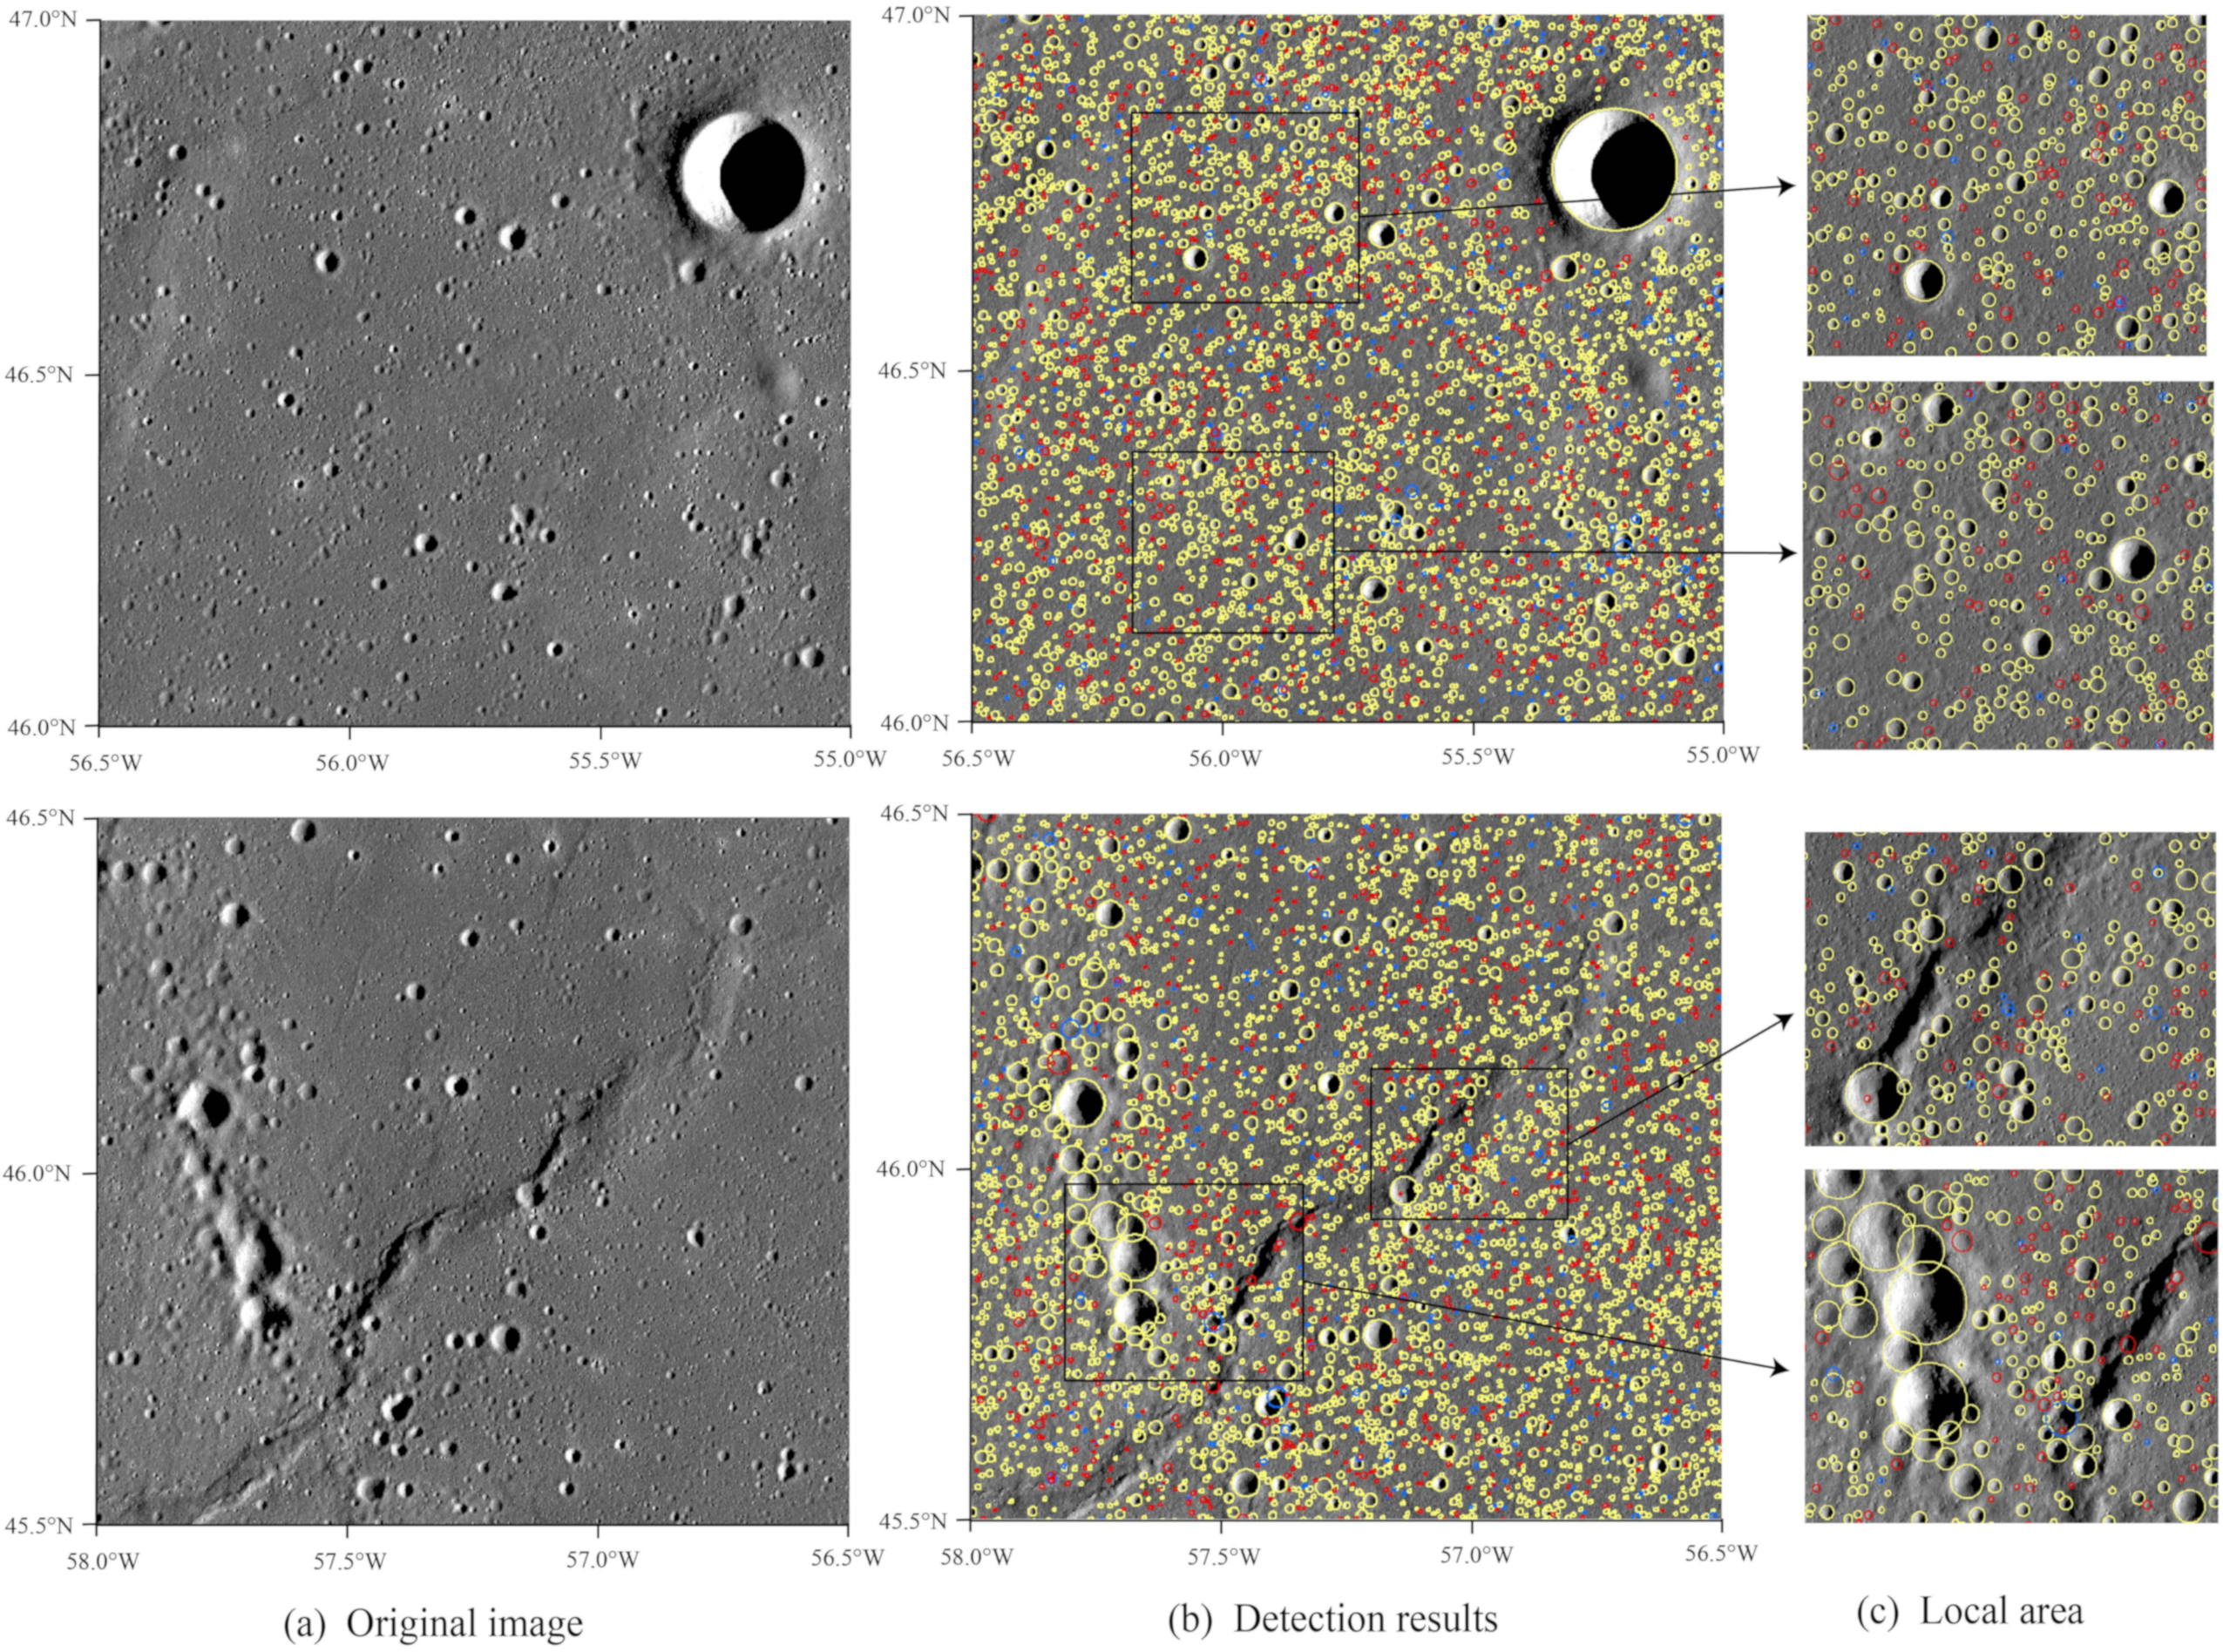
3.2. Identification of the CE-5 Region

This segment pertains to predicting impact craters in the CE-5 region, utilizing the Kaguya TC morning map. The region in the red box in Figure 6a represents the CE-5 region. Within this region, when the confidence score threshold was set at 0.5, the predicted number of impact craters reached 197,285, of which 50,492 have diameters exceeding 200 m. Elevating the confidence score benchmark to 0.8 trims the predicted crater total to 187,101, where 48,835 surpass the 200 m diameter mark. This indicates that craters falling below the 200 m diameter threshold form roughly three-fourths of the entire collection. The visualization of mapping DR (predicted impact crater) data with a confidence level exceeding 0.8 onto the Kaguya TC morning map is shown in Figure 6.
From Figure 6c, the improved Faster R-CNN model accurately detects impact craters with more regular shapes and achieves good results in less prominent impact craters. This suggests that utilizing the Kaguya TC morning map enables the effective extraction of crater features, resulting in more accurate crater identification. It is worth noting that this study defaults to using DR data in the CE-5 region with confidence scores exceeding 0.8.

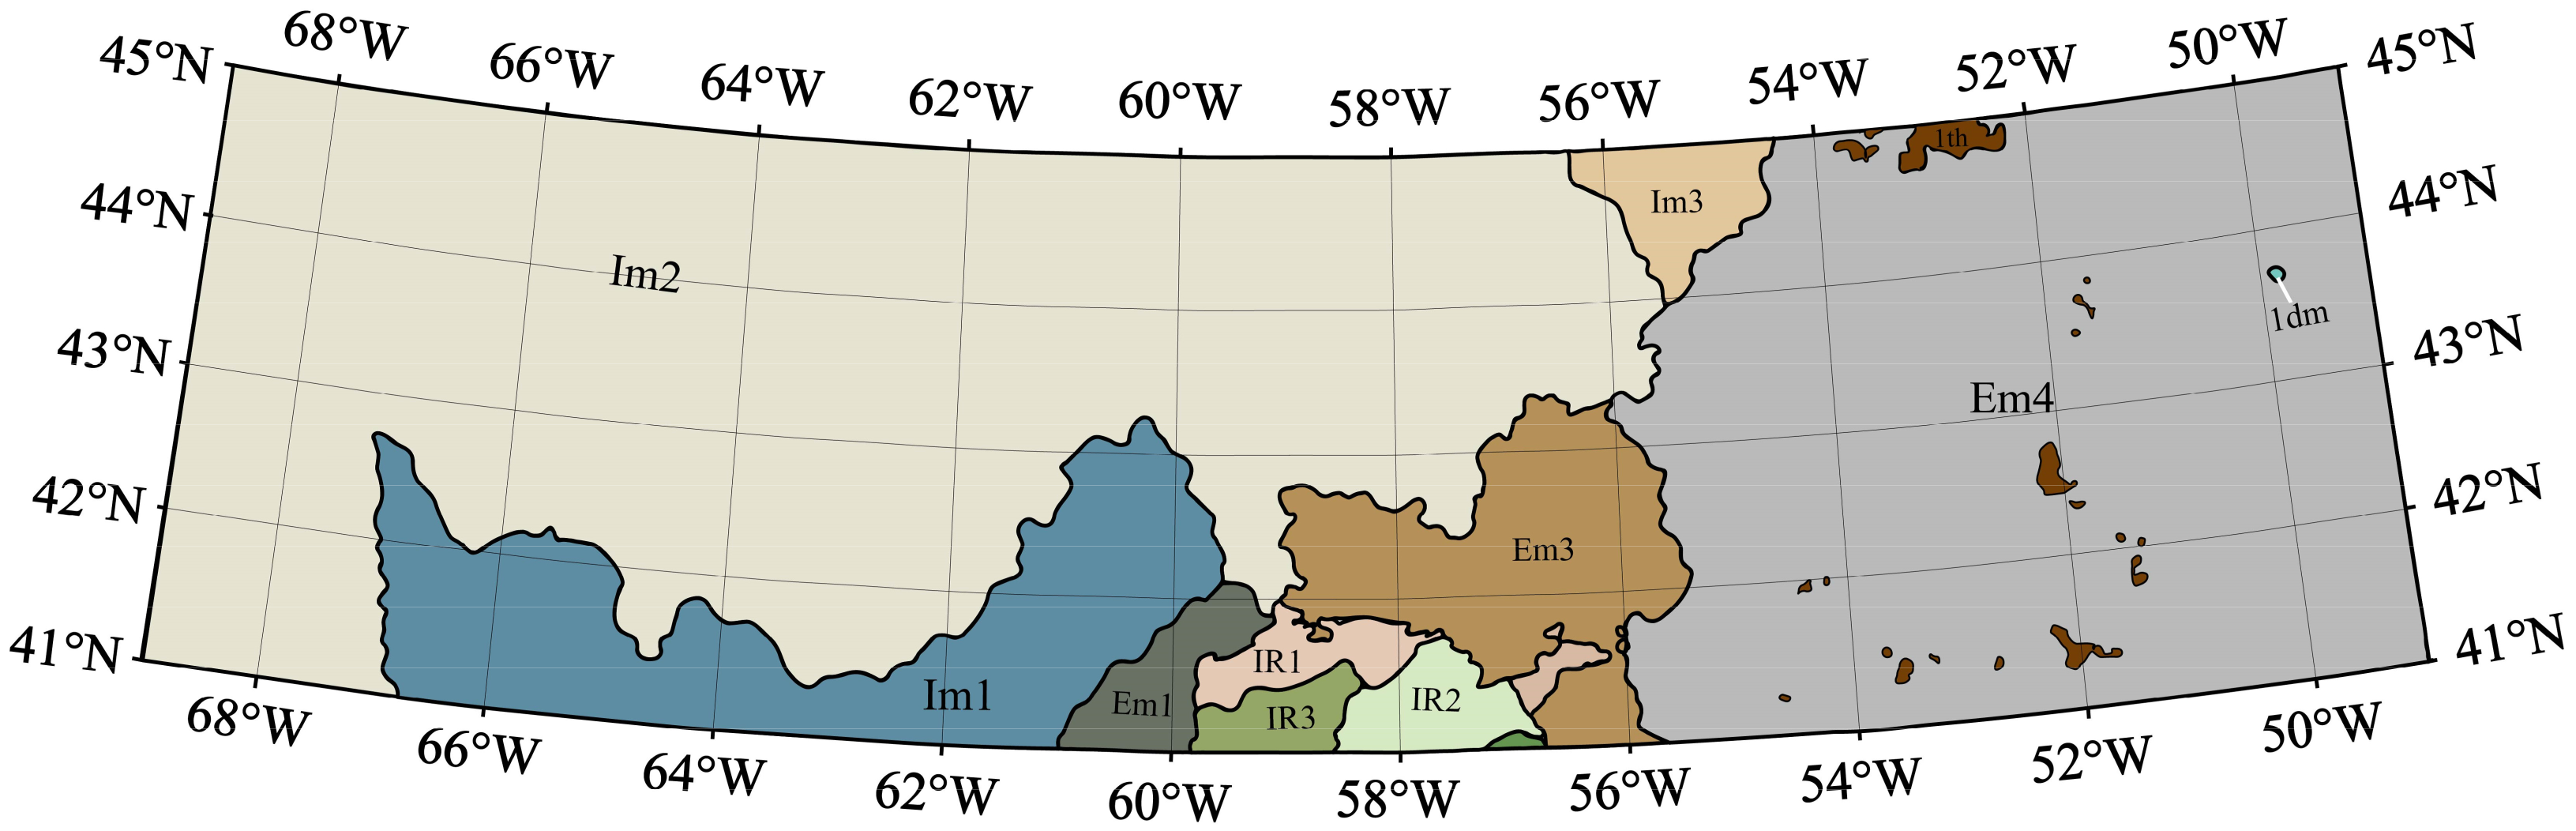
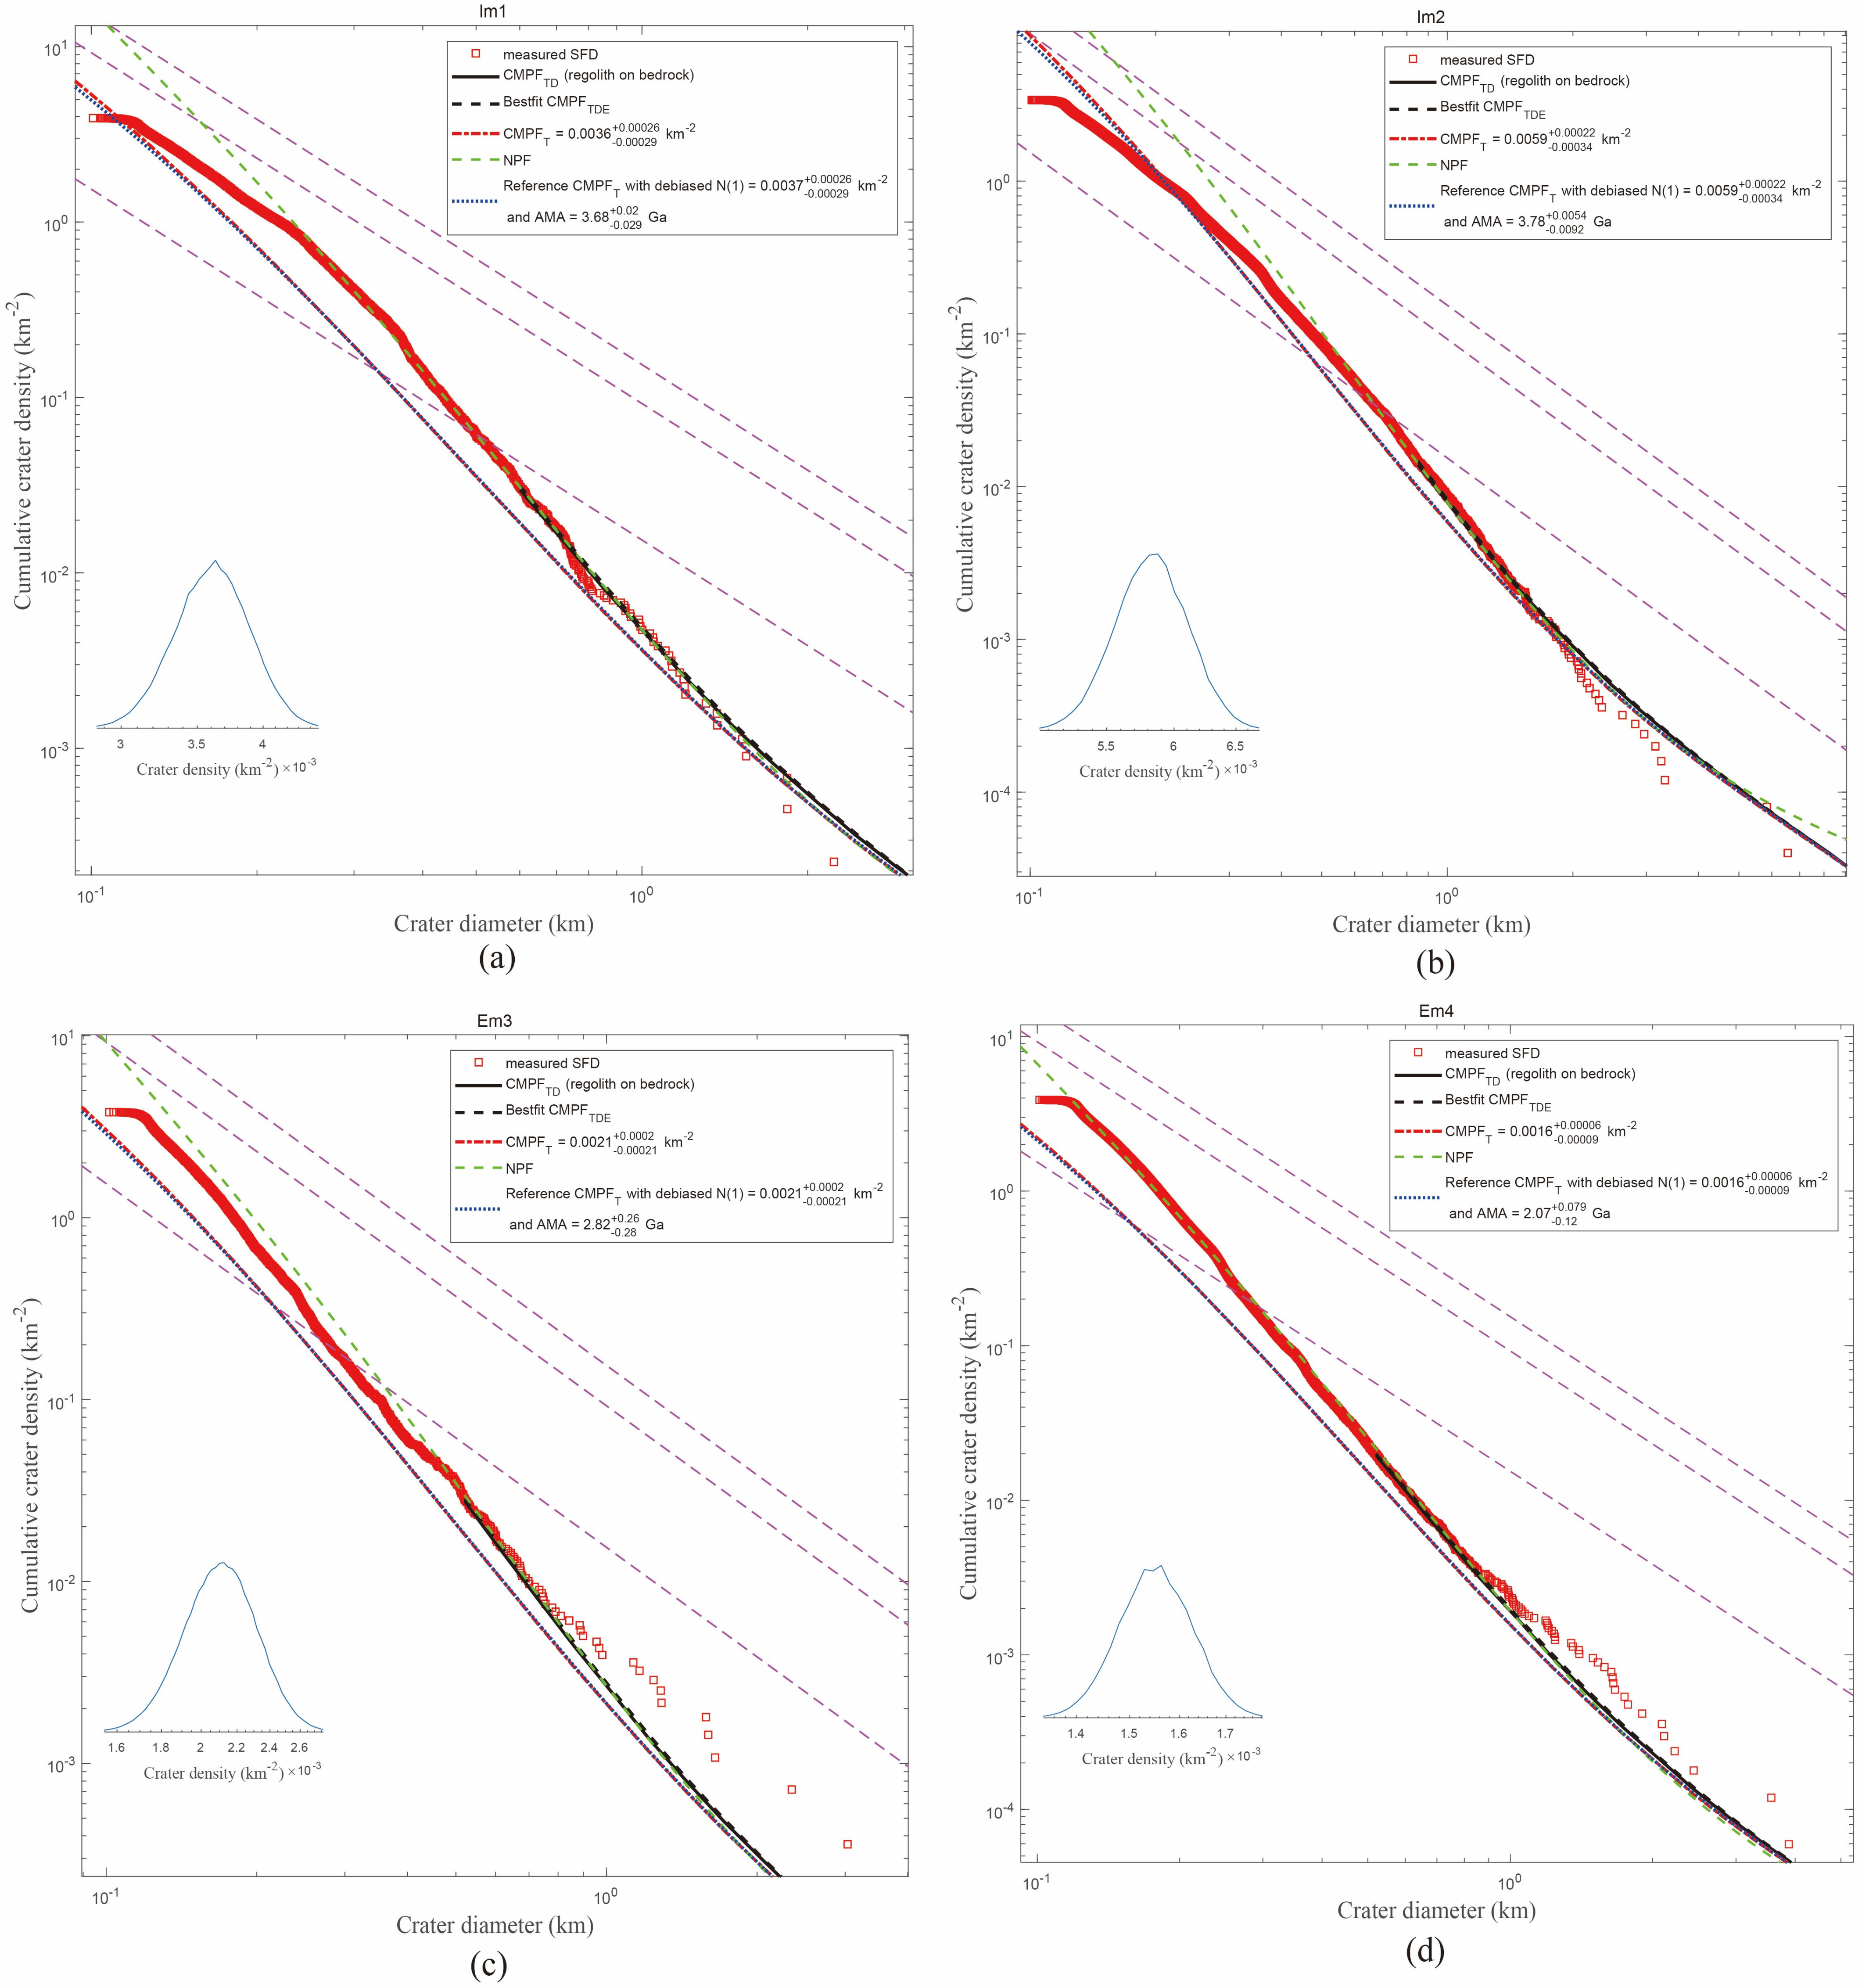
3.3. Chronological Analysis of Selected Geological Units in the CE-5 Region

This section includes information about the number of impact craters in the Im1, Im2, Em3, and Em4 geological units within the CE-5 region and chronological analysis. The number and area information of impact craters with different diameter ranges within each geological unit are shown in Table 4. For the impact craters located at the geological boundary, it is considered that the center of mass locates which geological unit and impact craters belong to that geological unit. N < 200   m represents the number of impact craters with a diameter less than 200 m, N 200   m 1   km represents the number of impact craters with a diameter ranging from 200 m to 1 km, and N > 1   km represents the number of impact craters with a diameter larger than 1 km.
Based on the data from Table 4, the Im2 geological unit encompasses the most extensive area, leading to the highest count of detected meteorite craters within it. Specifically, there were 216 impact craters that exhibited a diameter larger than 1 km. On the other hand, the Em3 geological unit, being the smallest area, registered the lowest count for craters exceeding 1 km in diameter, with a total of just 10. Furthermore, following Xie et al.’s new chronology based on unbiased impact crater density, chronological analysis was carried out for the geological units. The results are depicted in Figure 7.
In Figure 7, the red blocks depict the measured SFD, with the starting point of the black line indicating the minimum fitting diameter for the SFD. Among these geological units, the model age of Im2 geological unit is the oldest, estimated to be around 3.78 Ga, and its fitted cumulative crater diameter density is about 0.0059/km2. For the Em4 geological unit, the best-fitted cumulative density of crater diameters is 0.0016/km2, with an age estimation of 2.07 Ga. This is very close to the unbiased impact crater density derived by Xie et al. [63] (0.0015/km2) and with the sample age determined by Li et al. [48] (2.03 Ga). The model age results obtained using the automated crater recognition technique align closely with these studies, attesting to the accuracy of this dating methodology. Experimental results indicate that the Im1 and Im2 geological units are comparatively younger than the Em3 and Em4 units. We will further discuss the dating results of these four geological units in Section 4.4.

4. Discussion

4.1. New Evaluation Metrics

In the model evaluation section of Section 3.1, it is essential to consider the unique aspects of evaluating impact craters. During the labeling process, some manually marked impact craters, especially the tiny ones and those marked due to oversight, might have been inadvertently excluded from the labels. These factors were not considered in the evaluation, impacting the recall rate and precision of the assessment. Furthermore, despite implementing overlapping regions to mitigate the truncation effect on impact craters, truncation could still influence evaluation, particularly at the edges of the entire testing region.
The detection results in the testing region show that impact craters with diameters between 100 m and 200 m are the majority. Regrettably, the impact craters within this diameter range were prone to oversight during manual labeling. Therefore, a new formula has been introduced in the experiment to redefine the recall rate and precision values for impact craters with diameters exceeding 100 m. To diminish discrepancies in assessment, a reevaluation was conducted on the relationship between the number of F P impact craters with predicted confidence scores surpassing 0.99 and various evaluation criteria. N 99 represents the number of F P impact craters with predicted confidence scores exceeding 0.99. The F P impact craters with confidence scores exceeding 0.99 are illustrated in Figure 8b, where yellow circles delineate T P data and green circles outline impact craters with confidence scores above 0.99 among F P . The formulas for the redefined recall rate and precision are expressed as follows.
R e c a l l n e w = T P + N 99 F P × F N × Recall T P + F N ,
P r e c i s i o n n e w = T P + N 99 × R e c a l l T P + F P .
Upon examining the green circles in Figure 8b, it is evident that a majority of F P with a confidence score of 0.99 or higher are actually true-positive data. Most of these impact craters have diameters below 200 m, and number 1229. The new recall rate for impact craters with diameters above 100 m is 90.45%, and the new precision value is 80.87%. This signifies an improvement of 1.82% in recall rate and a 3.62% increase in precision compared to the original values. For instances where the confidence score dips below 0.99, there exists the likelihood of identifying genuine impact craters, T P . This suggests significant optimization potential in terms of impact crater labeling and evaluation.

4.2. Identification Performance in the Test Region

We used a comparison between two regions to analyze the prediction results. The first region spans from 55°W to 56.5°W and from 46°N to 47°N, which is characterized by relatively flat terrain. The second test region ranges from 56.5°W to 58°W and from 45.5°N to 46.5°N, and it features relatively complex terrain. Figure 9 displays the detection findings for these two zones, and Table 5 summarizes the identification results across both regions.
The recognition results in Figure 9a,b show that these two regions’ newly identified impact craters tend to have smaller diameters. Meanwhile, relatively larger and more distinct craters are almost all successfully detected. Comparing the data for the two regions in Table 5, Region 1 exhibits a recall rate 0.07% higher than that of Region 2, but with 1.59% lower precision. Under the revised evaluation criteria, the recall rate for both regions increases by about 1.4%, with precision value rising roughly 4%. Region 1 achieved slightly higher recall due to the relatively flat terrain. However, the abundance of newly identified impact craters contributes to a lower precision in identification. Conversely, in the comparatively intricate terrain of Region 2, the count of newly identified impact craters is lower, resulting in a higher precision. The disparities in detection results between these two regions are minor, indicating commendable recognition efficacy in simple and moderately complex terrains.

4.3. Density Analysis of the CE-5 Region

This section involves a comparative analysis of the DR data in the CE-5 region with the impact crater data presented by Jia et al. [47]. The objective is to analyze the number of impact craters within different diameter ranges and the spatial distribution density of impact craters in the CE-5 region. When calculating the density of impact craters in the CE-5 region, Jia et al. used a method based on a search radius to count and calculate the crater density. Slightly deviating from Jia’s method, this experiment divided the CE-5 region into 40 segments along the longitude direction, each spanning 0.5°W, and 20 segments along the latitude direction, each spanning 0.2°N. This division resulted in 800 smaller regions within the CE-5 region. Count the number of impact craters in each small region, calculate the area of each region using surface integration, and then calculate the spatial distribution density of impact craters. In the experiment, an impact crater is considered to be located within a specific region if its central coordinates fall within that region.
Figure 10a compares impact crater counts across various diameter ranges. Specifically, within the 100 to 200 m range, the DR data surpass Jia’s data by 29,748. In the 200 m to 1 km range, the DR data exceed Jia’s by 16,462. For impact craters with a diameter exceeding 1 km, the DR data outnumber Jia’s by over a hundred. Furthermore, in the CE-5 region, there are 338 impact craters with a diameter exceeding 1 km in the DR data. In comparison, Robbins’s lunar impact crater catalogue data [14] in the same range shows 357 impact craters. This indicates a close alignment between the DR data by the improved Faster R-CNN and Robbins’s data for impact craters with a diameter exceeding 1 km. Figure 10b,d represent the spatial distribution density of impact craters exceeding 200 m in diameter within the CE-5 region, with Figure 10b based on Jia’s database and Figure 10d based on the DR data. In the Em4 geological unit, the DR’s density closely aligns with Jia’s marked density. In contrast, in other regions, the DR’s density exceeds that of Jia. Figure 10c,d show the spatial distribution density of impact craters with diameters exceeding 100 m and 200 m, respectively, in the CE-5 region DR data. Within the longitude range of 58°W to 69°W and latitude range of 41°N to 45°N, the heatmap colors in Figure 10c,d remain relatively stable, suggesting a balance between the number of impact craters exceeding 200 m in diameter and those in the 100 to 200 m range. However, in the region spanning from 49°W to 58°W and 41°N to 45°N, there is a more noticeable color variation in both Figure 10c,d, indicating a relatively higher number of impact craters in the 100 to 200 m range. Additionally, the impact crater densities for the entire CE-5 region were calculated. The spatial distribution density for impact craters with diameters ranging from 100 m to 200 m is approximately 2.5706/km2. For craters with diameters ranging from 200 m to 1 km, the distribution density is approximately 0.9016/km2. For impact craters with diameters exceeding 1 km, the distribution density is approximately 0.0063/km2.

4.4. Chronological Analysis of CE-5 Geological Units

This section compares the results of the chronological analysis within the Im1, Im2, Em3, and Em4 geological units in the CE-5 region with the work of Jia [47] and Wu [5]. They utilized Neukum’s method [60] to analyze the model age of the geological units. This study used the method of Xie et al. to correct for biases in impact crater density, thus deriving the unbiased impact crater density within the geological units, and this method of N(1) is represented by (1) when modeling production functions (PFs) [63]. The comparative N(1) (Table 6) and model age (Table 7) of the geological units of Im1, Im2, Em3, and Em4 are shown.
From Table 6 and Table 7, the N(1) obtained by Neukum’s method for the geological unit data in this study is larger than that of Jia and Wu. These higher values are primarily from the increased impact craters identified through the automated recognition approach. The (1) derived using the density of unbiased impact craters method is lower than that obtained from Neukum’s method. The (1) value in the Im1, Em3, and Em4 geological units fall between the values reported by Jia and Wu. Conversely, in the Im1 and Em3 geological units, the chronological dating results of this study indicate an older age than those reported by Jia and Wu. This discrepancy might be attributed to the use of different chronology systems. Considering that the fitting diameter might affect the dating results, the same diameter fitting range is used for the Im1 geological unit here for comparison with previous works. The findings are in close agreement with the analysis in Table 6. In the Im1 and Im2 geological units, the relative age data obtained in this study align closely with Wu’s research. The age estimates for these two units are, on average, about 0.25 Ga higher than Wu’s. Conversely, for the Em3 and Em4 geological units, the results of this study are more in line with those presented by Jia et al. Within the Em3 geological unit, our assessments are roughly 0.28 Ga higher than Jia’s, while for the Em4 unit, the age values remain consistent. The dating results of the Em4 geological unit are highly consistent with the lead–lead dating results of the basalt debris returned by Li et al. [48]. This validates the effectiveness and reliability of the dating technique for the density of unbiased impact craters, further indicating a strong correlation between radioactive isotope dating and dating of the density of these unbiased impact craters, deepening researchers’ understanding of the sediment and characteristics of impact events, and providing a reference for the pre-Nectarian, Nectarian, Imbrian, Erasthenian, and Copernican systems on the moon during lunar history.

5. Conclusions

In this study, we demonstrate the performance of an improved Faster RCNN in identifying impact craters on the Kaguya TC morning map and use an unbiased crater density approach to date four geological units within the CE-5 region. The results show that the trained improved Faster R-CNN is effective in identifying impact craters with diameters exceeding 200 m on the Kaguya TC morning map (resolution 7.403 m/pixel). The model fusion strategy was used to process the identified impact craters. For craters with a diameter exceeding 200 m, the recall rate is 96.33% and the precision value is 90.19%. We compared the results to previous work. Fairweather et al. [41] used LRO NAC images to identify impact craters of 100 m–1 km with a recall rate of 89.0% and precision of 67.0%. Mao et al. [28] used DEM and LRO WAC image recognition, with a recall rate of 85.0% and precision of 81.4%. La Grassa et al. [42] used Robbins’s lunar catalogue and lunar mosaic LROC mission orthographic projection tiles to create a dataset. The results obtained using the super-resolution reconstruction method when the scale factor (SF) is 2 are that the recall rate is 90.3% and the accuracy is 85.9%. Different algorithms and data processing methods used, as well as different datasets, will lead to different results. Although we did not have a method to control the comparison variables, the results show that we have achieved good results in identifying impact craters using new maps, improved algorithms and data processing methods, as well as chronological analysis of unbiased crater densities for the Im1, Im2, Em3 and Em4 geological units within the CE-5 region. The analysis shows that the Im2 geological unit has the oldest model age, estimated to be approximately 3.78 Ga. In contrast, the Em4 geological unit has the youngest model age of approximately 2.07 Ga. Notably, the age determination of the Em4 unit is in good agreement with the radiometric dating of the CE-5 region.
In addition, we provide a complete workflow for automatic identification of impact craters and discovered a total of 187,101 impact craters in the CE-5 region, which is 12,808 more than the database of Jia et al. [47]. The spatial distribution density of impact craters within the range of 100 m to 200 m is approximately 2.5706/km2. For impact craters with diameters ranging from 200 m to 1 km, the spatial distribution density is approximately 0.9016/km2.
This study focuses on the automatic identification of small impact craters (diameter < ~1 km) in the CE-5 region. There are limitations in using DEM to identify small impact craters. It will be possible to combine DEM and image reconstruction methods [65] to identify impact craters in the future.

Author Contributions

Conceptualization, Y.L. and J.L.; methodology, Y.L., J.L., M.X. and J.Z.; software, Y.L. and M.X.; validation, Y.L., Y.Q., J.D. and C.Z.; formal analysis, Y.L. and J.L.; investigation, Y.L.; resources, Y.L., J.L. and M.X.; data curation, Y.L. and J.L.; writing—original draft preparation, Y.L.; writing—review and editing, Y.L., J.L., M.X., J.Z. and C.L.; visualization, Y.L.; supervision, J.L., M.X., J.Z. and C.L.; project administration, Y.L., J.L. and C.L.; funding acquisition, J.L. and C.L. All authors have read and agreed to the published version of the manuscript.

Funding

This work was funded by the National Natural Science Foundation of China (grants 12103020, 12363009, and 12173011), B-type Strategic Priority Program of the Chinese Academy of Sciences (grant XDB41000000), Opening Fund of Key Laboratory of Geological Survey and Evaluation of the Ministry of Education (GLAB2022ZR09), Natural Science Foundation of Jiangxi Province (grant 20224BAB211011), and Youth Talent Project of Science and Technology Plan of Ganzhou (grants 2022CXRC02 and 2023CYZ26970).

Data Availability Statement

The catalogue of impact craters identified in the CE-5 region has been made public and can be found at the following website: https://github.com/lixuesongxia/CE-5, accessed on 14 October 2023.

Acknowledgments

We thank the SELENE (Kaguya) TC team and the SELENE Data Archive for providing the SELENE (Kaguya) data. The download link for the map data is at https://darts.isas.jaxa.jp/planet/pdap/selene/product_search.html.

Conflicts of Interest

The authors declare no conflicts of interest.

References

  1. Hiesinger, H.; Head, J.W., III; Wolf, U.; Jaumann, R.; Neukum, G. Ages and Stratigraphy of Mare Basalts in Oceanus Procellarum, Mare Nubium, Mare Cognitum, and Mare Insularum. J. Geophys. Res. Planets 2003, 108, 3256–3272. [Google Scholar] [CrossRef]
  2. Di, K.; Li, W.; Yue, Z.; Sun, Y.; Liu, Y. A Machine Learning Approach to Crater Detection from Topographic Data. Adv. Space Res. 2014, 54, 2419–2429. [Google Scholar] [CrossRef]
  3. Gou, S.; Yue, Z.; Di, K.; Cai, Z.; Liu, Z.; Niu, S. Absolute Model Age of Lunar Finsen Crater and Geologic Implications. Icarus 2021, 354, 114046. [Google Scholar] [CrossRef]
  4. Qiao, L.; Xu, L.; Yang, Y.; Xie, M.; Chen, J.; Fang, K.; Ling, Z. Cratering Records in the Chang’e-5 Mare Unit: Filling the “Age Gap” of the Lunar Crater Chronology and Preparation for Its Recalibration. Geophys. Res. Lett. 2021, 48, e2021GL095132. [Google Scholar] [CrossRef]
  5. Wu, B.; Huang, J.; Li, Y.; Wang, Y.; Peng, J. Rock Abundance and Crater Density in the Candidate Chang’E-5 Landing Region on the Moon. J. Geophys. Res. Planets 2018, 123, 3256–3272. [Google Scholar] [CrossRef]
  6. Gault, D.E. Saturation and Equilibrium Conditions for Impact Cratering on the Lunar Surface: Criteria and Implications. Radio Sci. 1970, 5, 273–291. [Google Scholar] [CrossRef]
  7. Yue, Z.; Di, K.; Liu, Z.; Michael, G.; Jia, M.; Xin, X.; Liu, B.; Peng, M.; Liu, J. Lunar Regolith Thickness Deduced from Concentric Craters in the CE-5 Landing Area. Icarus 2019, 329, 46–54. [Google Scholar] [CrossRef]
  8. Lai, J.; Xu, Y.; Bugiolacchi, R.; Wong, H.K.; Xu, L.; Zhang, X.; Zhang, L.; Zhang, X.; Xiao, L.; Liu, B.; et al. A Complex Paleo-Surface Revealed by the Yutu-2 Rover at the Lunar Farside. Geophys. Res. Lett. 2021, 48, e2021GL095133. [Google Scholar] [CrossRef]
  9. Kirchoff, M.R.; Schenk, P. Crater Modification and Geologic Activity in Enceladus’ Heavily Cratered Plains: Evidence from the Impact Crater Distribution. Icarus 2009, 202, 656–668. [Google Scholar] [CrossRef]
  10. Pajola, M.; Barnouin, O.S.; Lucchetti, A.; Hirabayashi, M.; Ballouz, R.-L.; Asphaug, E.; Ernst, C.M.; Della Corte, V.; Farnham, T.; Poggiali, G.; et al. Anticipated Geological Assessment of the (65803) Didymos–Dimorphos System, Target of the DART–LICIACube Mission. Planet. Sci. J. 2022, 3, 210. [Google Scholar] [CrossRef]
  11. Daly, R.T.; Ernst, C.M.; Barnouin, O.S.; Chabot, N.L.; Rivkin, A.S.; Cheng, A.F.; Adams, E.Y.; Agrusa, H.F.; Abel, E.D.; Alford, A.L.; et al. Successful Kinetic Impact into an Asteroid for Planetary Defence. Nature 2023, 616, 443–447. [Google Scholar] [CrossRef] [PubMed]
  12. Head, J.W.; Fassett, C.I.; Kadish, S.J.; Smith, D.E.; Zuber, M.T.; Neumann, G.A.; Mazarico, E. Global Distribution of Large Lunar Craters: Implications for Resurfacing and Impactor Populations. Science 2010, 329, 1504–1507. [Google Scholar] [CrossRef]
  13. Povilaitis, R.Z.; Robinson, M.S.; van der Bogert, C.H.; Hiesinger, H.; Meyer, H.M.; Ostrach, L.R. Crater Density Differences: Exploring Regional Resurfacing, Secondary Crater Populations, and Crater Saturation Equilibrium on the Moon. Planet. Space Sci. 2018, 162, 41–51. [Google Scholar] [CrossRef]
  14. Robbins, S.J. A New Global Database of Lunar Impact Craters >1–2 Km: 1. Crater Locations and Sizes, Comparisons with Published Databases, and Global Analysis. JGR Planets 2019, 124, 871–892. [Google Scholar] [CrossRef]
  15. Salamuniccar, G.; Loncaric, S. Method for Crater Detection From Martian Digital Topography Data Using Gradient Value/Orientation, Morphometry, Vote Analysis, Slip Tuning, and Calibration. IEEE Trans. Geosci. Remote Sens. 2010, 48, 2317–2329. [Google Scholar] [CrossRef]
  16. Xie, Y.; Tang, G.; Yan, S.; Lin, H. Crater Detection Using the Morphological Characteristics of Chang’E-1 Digital Elevation Models. IEEE Geosci. Remote Sens. Lett. 2013, 10, 885–889. [Google Scholar] [CrossRef]
  17. Liu, D.; Chen, M.; Qian, K.; Lei, M.; Zhou, Y. Boundary Detection of Dispersal Impact Craters Based on Morphological Characteristics Using Lunar Digital Elevation Model. IEEE J. Sel. Top. Appl. Earth Obs. Remote Sens. 2017, 10, 5632–5646. [Google Scholar] [CrossRef]
  18. Zuo, W.; Zhang, Z.; Li, C.; Wang, R.; Yu, L.; Geng, L. Contour-Based Automatic Crater Recognition Using Digital Elevation Models from Chang’E Missions. Comput. Geosci. 2016, 97, 79–88. [Google Scholar] [CrossRef]
  19. Ding, M.; Cao, Y.; Wu, Q. Novel Approach of Crater Detection by Crater Candidate Region Selection and Matrix-Pattern-Oriented Least Squares Support Vector Machine. Chin. J. Aeronaut. 2013, 26, 385–393. [Google Scholar] [CrossRef]
  20. Kang, Z.; Wang, X.; Hu, T.; Yang, J. Coarse-to-Fine Extraction of Small-Scale Lunar Impact Craters From the CCD Images of the Chang’E Lunar Orbiters. IEEE Trans. Geosci. Remote Sens. 2019, 57, 181–193. [Google Scholar] [CrossRef]
  21. Silburt, A.; Ali-Dib, M.; Zhu, C.; Jackson, A.; Valencia, D.; Kissin, Y.; Tamayo, D.; Menou, K. Lunar Crater Identification via Deep Learning. Icarus 2019, 317, 27–38. [Google Scholar] [CrossRef]
  22. Yang, C.; Zhao, H.; Bruzzone, L.; Benediktsson, J.A.; Liang, Y.; Liu, B.; Zeng, X.; Guan, R.; Li, C.; Ouyang, Z. Lunar Impact Crater Identification and Age Estimation with Chang’E Data by Deep and Transfer Learning. Nat. Commun. 2020, 11, 6358. [Google Scholar] [CrossRef]
  23. Tewari, A.; Jain, V.; Khanna, N. Automatic Crater Shape Retrieval Using Unsupervised and Semi-Supervised Systems. arXiv 2022, arXiv:2211.01933. [Google Scholar] [CrossRef]
  24. Ali-Dib, M.; Menou, K.; Jackson, A.P.; Zhu, C.; Hammond, N. Automated Crater Shape Retrieval Using Weakly-Supervised Deep Learning. Icarus 2020, 345, 113749. [Google Scholar] [CrossRef]
  25. Wang, S.; Fan, Z.; Li, Z.; Zhang, H.; Wei, C. An Effective Lunar Crater Recognition Algorithm Based on Convolutional Neural Network. Remote Sens. 2020, 12, 2694. [Google Scholar] [CrossRef]
  26. Jia, Y.; Liu, L.; Zhang, C. Moon Impact Crater Detection Using Nested Attention Mechanism Based UNet++. IEEE Access 2021, 9, 44107–44116. [Google Scholar] [CrossRef]
  27. Wu, Y.; Wan, G.; Liu, L.; Jia, Y.; Wei, Z.; Wang, S. Fast and Accurate Crater Detection on Martian Surface Using SUNet 3+. In Proceedings of the 2022 IEEE 6th Information Technology and Mechatronics Engineering Conference (ITOEC), Chongqing, China, 4–6 March 2022; Volume 6, pp. 683–687. [Google Scholar]
  28. Mao, Y.; Yuan, R.; Li, W.; Liu, Y. Coupling Complementary Strategy to U-Net Based Convolution Neural Network for Detecting Lunar Impact Craters. Remote Sens. 2022, 14, 661. [Google Scholar] [CrossRef]
  29. Lin, X.; Zhu, Z.; Yu, X.; Ji, X.; Luo, T.; Xi, X.; Zhu, M.; Liang, Y. Lunar Crater Detection on Digital Elevation Model: A Complete Workflow Using Deep Learning and Its Application. Remote Sens. 2022, 14, 621. [Google Scholar] [CrossRef]
  30. Fan, L.; Yuan, J.; Zha, K.; Wang, X. ELCD: Efficient Lunar Crater Detection Based on Attention Mechanisms and Multiscale Feature Fusion Networks from Digital Elevation Models. Remote Sens. 2022, 14, 5225. [Google Scholar] [CrossRef]
  31. Wang, Y.; Wu, B.; Xue, H.; Li, X.; Ma, J. An Improved Global Catalog of Lunar Impact Craters (≥1 Km) With 3D Morphometric Information and Updates on Global Crater Analysis. J. Geophys. Res. Planets 2021, 126. [Google Scholar] [CrossRef]
  32. Barker, M.K.; Mazarico, E.; Neumann, G.A.; Zuber, M.T.; Haruyama, J.; Smith, D.E. A New Lunar Digital Elevation Model from the Lunar Orbiter Laser Altimeter and SELENE Terrain Camera. Icarus 2016, 273, 346–355. [Google Scholar] [CrossRef]
  33. Wang, Y.; Xie, M.; Xiao, Z.; Cui, J. The Minimum Confidence Limit for Diameters in Crater Counts. Icarus 2020, 341, 113645. [Google Scholar] [CrossRef]
  34. Fu, X.-H.; Qiao, L.; Zhang, J.; Ling, Z.-C.; Li, B. The Subsurface Structure and Stratigraphy of the Chang’E-4 Landing Site: Orbital Evidence from Small Craters on the Von Kármán Crater Floor. Res. Astron. Astrophys. 2020, 20, 008. [Google Scholar] [CrossRef]
  35. Fassett, C.I.; Beyer, R.A.; Deutsch, A.N.; Hirabayashi, M.; Leight, C.; Mahanti, P.; Nypaver, C.A.; Thomson, B.J.; Minton, D.A. Topographic Diffusion Revisited: Small Crater Lifetime on the Moon and Implications for Volatile Exploration. J. Geophys. Res. Planets 2022, 127, e2022JE007510. [Google Scholar] [CrossRef]
  36. Zhang, H.; Li, J.; Wang, Z.; Guan, Y. Guidance Navigation and Control for Chang’E-5 Powered Descent. Space Sci. Technol. 2021, 2021, 9823609. [Google Scholar] [CrossRef]
  37. Dundas, C.M.; McEwen, A.S. Rays and Secondary Craters of Tycho. Icarus 2007, 186, 31–40. [Google Scholar] [CrossRef]
  38. Plescia, J.B.; Robinson, M.S. Giordano Bruno: Small Crater Populations––Implications for Self-Secondary Cratering. Icarus 2019, 321, 974–993. [Google Scholar] [CrossRef]
  39. Xiao, Z.; Werner, S.C. Size-Frequency Distribution of Crater Populations in Equilibrium on the Moon. J. Geophys. Res. Planets 2015, 120, 2277–2292. [Google Scholar] [CrossRef]
  40. Minton, D.A.; Fassett, C.I.; Hirabayashi, M.; Howl, B.A.; Richardson, J.E. The Equilibrium Size-Frequency Distribution of Small Craters Reveals the Effects of Distal Ejecta on Lunar Landscape Morphology. Icarus 2019, 326, 63–87. [Google Scholar] [CrossRef]
  41. Fairweather, J.H.; Lagain, A.; Servis, K.; Benedix, G.K.; Kumar, S.S.; Bland, P.A. Automatic Mapping of Small Lunar Impact Craters Using LRO-NAC Images. Earth Space Sci. 2022, 9, e2021EA002177. [Google Scholar] [CrossRef]
  42. La Grassa, R.; Cremonese, G.; Gallo, I.; Re, C.; Martellato, E. YOLOLens: A Deep Learning Model Based on Super-Resolution to Enhance the Crater Detection of the Planetary Surfaces. Remote Sens. 2023, 15, 1171. [Google Scholar] [CrossRef]
  43. Wang, J.; Zhang, Y.; Di, K.; Chen, M.; Duan, J.; Kong, J.; Xie, J.; Liu, Z.; Wan, W.; Rong, Z.; et al. Localization of the Chang’e-5 Lander Using Radio-Tracking and Image-Based Methods. Remote Sens. 2021, 13, 590. [Google Scholar] [CrossRef]
  44. Xu, L.; Zou, Y.L.; Wu, J. Preliminary Imagines for the Planning and Its Scientific Objectives of China’s Lunar Research Station. In Proceedings of the 49th Annual Lunar and Planetary Science Conference, Houston, TX, USA, 19–23 March 2018; Volume 1856. [Google Scholar]
  45. Qian, Y.; Xiao, L.; Yin, S.; Zhang, M.; Zhao, S.; Pang, Y.; Wang, J.; Wang, G.; Head, J.W. The Regolith Properties of the Chang’e-5 Landing Region and the Ground Drilling Experiments Using Lunar Regolith Simulants. Icarus 2020, 337, 113508. [Google Scholar] [CrossRef]
  46. Hu, S.; He, H.; Ji, J.; Lin, Y.; Hui, H.; Anand, M.; Tartèse, R.; Yan, Y.; Hao, J.; Li, R.; et al. A Dry Lunar Mantle Reservoir for Young Mare Basalts of Chang’e-5. Nature 2021, 600, 49–53. [Google Scholar] [CrossRef]
  47. Jia, M.; Yue, Z.; Di, K.; Liu, B.; Liu, J.; Michael, G. A Catalogue of Impact Craters Larger than 200 m and Surface Age Analysis in the Chang’e-5 Landing Area. Earth Planet. Sci. Lett. 2020, 541, 116272. [Google Scholar] [CrossRef]
  48. Li, Q.-L.; Zhou, Q.; Liu, Y.; Xiao, Z.; Lin, Y.; Li, J.-H.; Ma, H.-X.; Tang, G.-Q.; Guo, S.; Tang, X.; et al. Two-Billion-Year-Old Volcanism on the Moon from Chang’e-5 Basalts. Nature 2021, 600, 54–58. [Google Scholar] [CrossRef]
  49. Wilhelms, D.E.; McCauley, J.F.; Trask, N.J. The Geologic History of the Moon. Prof. Pap. 1987, 1348. [Google Scholar] [CrossRef]
  50. Stoffler, D. Cratering History and Lunar Chronology. Rev. Mineral. Geochem. 2006, 60, 519–596. [Google Scholar] [CrossRef]
  51. Ren, S.; He, K.; Girshick, R.; Sun, J. Faster R-CNN: Towards Real-Time Object Detection with Region Proposal Networks. In Proceedings of the Advances in Neural Information Processing Systems; Curran Associates, Inc.: Red Hook, NY, USA, 2015; Volume 28. [Google Scholar]
  52. Haruyama, J.; Matsunaga, T.; Ohtake, M.; Morota, T.; Honda, C.; Yokota, Y.; Torii, M.; Ogawa, Y. LISM Working Group Global Lunar-Surface Mapping Experiment Using the Lunar Imager/Spectrometer on SELENE. Earth Planet Space 2008, 60, 243–255. [Google Scholar] [CrossRef]
  53. Huang, G.; Li, Y.; Pleiss, G.; Liu, Z.; Hopcroft, J.E.; Weinberger, K.Q. Snapshot Ensembles: Train 1, Get M for Free 2017. arXiv 2017, arXiv:1704.00109. [Google Scholar]
  54. Paszke, A.; Gross, S.; Massa, F.; Lerer, A.; Bradbury, J.; Chanan, G.; Killeen, T.; Lin, Z.; Gimelshein, N.; Antiga, L.; et al. PyTorch: An Imperative Style, High-Performance Deep Learning Library. In Proceedings of the Advances in Neural Information Processing Systems; Curran Associates, Inc.: Red Hook, NY, USA, 2019; Volume 32. [Google Scholar]
  55. Everingham, M.; Van Gool, L.; Williams, C.K.I.; Winn, J.; Zisserman, A. The Pascal Visual Object Classes (VOC) Challenge. Int. J. Comput. Vis. 2010, 88, 303–338. [Google Scholar] [CrossRef]
  56. Kneissl, T.; van Gasselt, S.; Neukum, G. Map-Projection-Independent Crater Size-Frequency Determination in GIS Environments—New Software Tool for ArcGIS. Planet. Space Sci. 2011, 59, 1243–1254. [Google Scholar] [CrossRef]
  57. He, K.; Gkioxari, G.; Dollar, P.; Girshick, R. Mask R-CNN. In Proceedings of the IEEE International Conference on Computer Vision (ICCV), Venice, Italy, 22–29 October 2017; pp. 2961–2969. Available online: https://arxiv.org/abs/1703.06870 (accessed on 14 October 2023).
  58. He, K.; Zhang, X.; Ren, S.; Sun, J. Deep Residual Learning for Image Recognition. In Proceedings of the IEEE Conference on Computer Vision and Pattern Recognition, Las Vegas, NV, USA, 27–30 June 2016; pp. 770–778. Available online: https://openaccess.thecvf.com/content_cvpr_2016/html/He_Deep_Residual_Learning_CVPR_2016_paper.html (accessed on 14 October 2023).
  59. Adelson, E.; Anderson, C.; Bergen, J.; Burt, P.; Ogden, J. Pyramid Methods in Image Processing. RCA Eng. 1983, 29, 33–41. [Google Scholar]
  60. Neukum, G.; Ivanov, B.A.; Hartmann, W.K. Cratering Records in the Inner Solar System in Relation to the Lunar Reference System. In Chronology and Evolution of Mars; Kallenbach, R., Geiss, J., Hartmann, W.K., Eds.; Space Sciences Series of ISSI; Springer: Dordrecht, The Netherlands, 2001; Volume 12, pp. 55–86. ISBN 978-90-481-5725-9. [Google Scholar]
  61. Xie, M.; Xiao, Z.; Xu, L.; Fa, W.; Xu, A. Change in the Earth–Moon Impactor Population at about 3.5 Billion Years Ago. Nat. Astron. 2021, 5, 128–133. [Google Scholar] [CrossRef]
  62. Neukum, G. Meteorite Bombardment and Dating of Planetary Surfaces; Ludwig-Maximilians University: Munich, Germany, 1984. [Google Scholar]
  63. Xie, M. A New Chronology from Debiased Crater Densities: Implications for the Origin and Evolution of Lunar Impactors. Earth Planet. Sci. Lett. 2023, 602, 117963. [Google Scholar] [CrossRef]
  64. Qian, Y.Q.; Xiao, L.; Zhao, S.Y.; Zhao, J.N.; Huang, J.; Flahaut, J.; Martinot, M.; Head, J.W.; Hiesinger, H.; Wang, G.X. Geology and Scientific Significance of the Rümker Region in Northern Oceanus Procellarum: China’s Chang’E-5 Landing Region. J. Geophys. Res. Planets 2018, 123, 1407–1430. [Google Scholar] [CrossRef]
  65. Robbins, S.J.; Bierhaus, E.; Spencer, J.R.; Lauer, T.R.; Weaver, H.; Marchi, S.; Barnouin, O.S.; Russo, D.; Levison, H.F.; Martin, L. Testing the Ability for Deconvolution and Nyquist-Sampling to Allow Detection of Small Impact Craters: Lunar Proof-of-Concept with Lucy’s L’LORRI Camera. In Proceedings of the 54th Lunar and Planetary Science Conference, Houston, TX, USA, 13–17 March 2023; LPI Contrib. No. 2806. Available online: https://www.hou.usra.edu/meetings/lpsc2023/pdf/2976.pdf (accessed on 14 October 2023).
Figure 1. Workflow diagram.
Remotesensing 16 00344 g001
Figure 2. The structure of improved Faster R-CNN.
Remotesensing 16 00344 g002
Figure 3. Circular IoU structure of the two impact crater coordinates.
Remotesensing 16 00344 g003
Figure 4. Division of geological units within the CE-5 region, as delineated by Qian et al. [56].
Remotesensing 16 00344 g004
Figure 5. (a) Evaluation results within the eight testing zones. (b) Variation in various evaluation parameters for impact crater data with diameters larger than 200 m within the entire testing region under different IoU threshold conditions.
Remotesensing 16 00344 g005
Figure 6. (a) Original Kaguya TC morning map. The red box below the training and testing region in this map represents the CE-5 region. (b) Mapping effect of DR data with confidence scores greater than 0.8 on the map. (c) Display effect in specific regions.
Remotesensing 16 00344 g006
Figure 7. Chronological analysis results for the geological units (a) Im1, (b) Im2, (c) Em3, and (d) Em4.
Remotesensing 16 00344 g007
Figure 8. (a) Original image. (b) Comparative image, where green circles outline impact craters with confidence scores above 0.99 among F P in the predictions, and yellow circles represent T P .
Remotesensing 16 00344 g008
Figure 9. Recognition results for the two test regions. (a) Original TC morning view. (b) Predictive efficacy of detected impact craters compared to actual ones. The IoU threshold for determining positive samples for DR and GT data was set to 0.5. Blue circles indicate undetected actual impact craters, red circles show newly identified predicted impact craters, and yellow circles outline accurately predicted impact craters that match actual ones. (c) Localized display of the two testing regions.
Remotesensing 16 00344 g009
Figure 10. (a) Comparison of the number of impact craters in different diameter ranges between the DR data and the Jia’s data in the CE-5 region. (b) Spatial distribution density of impact craters with diameters exceeding 200 m from Jia’s data. (c) Spatial distribution density of DR data with diameters exceeding 100 m in the CE-5 region. (d) Spatial distribution density of DR data with diameters exceeding 200 m in the CE-5 region.
Remotesensing 16 00344 g010
Table 1. Feature maps of the improved Faster R-CNN.
Layer NameFeature Maps (Input)Feature Maps (Output)
Special Conv 1 640 × 640 × 3 320 × 320 × 64
Max Pooling 1 320 × 320 × 64 160 × 160 × 64
Special Conv 2 160 × 160 × 64 160 × 160 × 256
Special Conv 3 160 × 160 × 256 80 × 80 × 512
Special Conv 4 80 × 80 × 512 40 × 40 × 1024
Special RoI_Align 40 × 40 × 1024 14 × 14 × 1024
Special Conv 5 14 × 14 × 1024 7 × 7 × 2048
Average Pooling 7 × 7 × 2048 1 × 1 × 2048
Table 2. Evaluation results for the test region with crater diameter thresholds.
Diameter (m) R e c a l l P r e c i s i o n F 1 A P
100 88.63 % 77.25 % 82.55 % 85.82 %
200 96.33 % 90.19 % 93.16 %
500 93.44 % 97.06 % 95.22 %
Table 3. Identification of 8 testing zones.
RegionLongitudeLatitudeGTDR T P F P F N
155°W–55.5°W45°N–48°N 3442 3933 3037 896 405
255.5°W–56°W45°N–48°N 3613 4306 3258 1048 355
356°W–56.5°W45°N–48°N 3351 4011 3018 993 333
456.5°W–57°W45°N–48°N 3373 3886 2998 888 375
557°W–57.5°W45°N–48°N 3259 3631 2839 792 420
657.5°W–58°W45°N–48°N 2999 3515 2693 822 306
758°W–58.5°W45°N–48°N 3118 3404 2715 689 403
858.5°W–59°W45°N–48°N 3042 3374 2631 743 411
Table 4. Number and area of impact craters in the Im1, Im2, Em3, and Em4 geological units.
Geological Unit N < 200   m N 200   m 1   km N > 1   km TotalArea (km2)
Im1 11 , 996 5346 21 17 , 363 4437.37
Im2 58 , 142 26 , 800 216   85 , 158 25 , 069.69
Em3 8704 1875 10 10 , 589 2786.20
Em4 53 , 596 11 , 690 39 65 , 325 16 , 790.08
Table 5. The recognition results for the two test regions.
RegionDiameter (m)GTDR T P F N F P R e c a l l P r e c i s i o n R e c a l l n e w P r e c i s i o n n e w
11003321404930242971035 91.06 % 74.50 % 92.50 % 78.66 %
2100321838482928290920 90.99 % 76.09 % 92.39 % 79.86 %
Table 6. N(1) for the Im1, Im2, Em3, and Em4 geological units.
Geologic UnitN(1)
( × 10 3 km 2 ;
This Study)
ℕ(1)
( × 10 3 km 2 ;
This Study)
N(1)
( × 10 3 km 2 ;
Jia et al. [47])
N(1)
( × 10 3 km 2 ;
Wu et al. [5])
Im14.693.72.994.48
Im28.315.93.104.44
Em32.972.102.131.73
Em41.951.61.741.24
Table 7. Model ages for the Im1, Im2, Em3, and Em4 geological units.
Geologic UnitArea
( km 2 )
Model Age
(Ga; This Study)
Model Age
(Ga; Jia et al. [47])
Model Age
(Ga; Wu et al. [5])
Im14437.37 3.68 0.029 + 0.02 3.23 0.042 + 0.035   3.48 0.04 + 0.03
Im225,069.69 3.78 0.0092 + 0.0054 3.27 0.025 + 0.022 3.47 0.02 + 0.02
Em32786.20 2.82 0.28 + 0.26 2.54 0.50 + 0.41 2.06 0.24 + 0.24
Em416,790.08 2.07 0.12 + 0.079 2.07 0.027 + 0.026 1.49 0.17 + 0.17
Disclaimer/Publisher’s Note: The statements, opinions and data contained in all publications are solely those of the individual author(s) and contributor(s) and not of MDPI and/or the editor(s). MDPI and/or the editor(s) disclaim responsibility for any injury to people or property resulting from any ideas, methods, instructions or products referred to in the content.

