Article

Tree-Level Chinese Fir Detection Using UAV RGB Imagery and YOLO-DCAM

1
Institute of Forest Resource Information Techniques, Chinese Academy of Forestry, Beijing 100091, China
2
Key Laboratory of Forestry Remote Sensing and Information System, National Forestry and Grassland Administration, Beijing 100091, China
3
Experimental Center of Subtropical Forestry, Chinese Academy of Forestry, Xinyu 336600, China
4
Department of Second Language Studies, University of Hawai‘i at Mānoa, 1890 East-West Road, Honolulu, HI 96822, USA
*
Author to whom correspondence should be addressed.
Remote Sens. 2024, 16(2), 335; https://doi.org/10.3390/rs16020335
Submission received: 30 November 2023 / Revised: 10 January 2024 / Accepted: 12 January 2024 / Published: 14 January 2024

Abstract

:
Achieving the accurate and efficient monitoring of forests at the tree level can provide detailed information for precise and scientific forest management. However, the detection of individual trees under planted forests characterized by dense distribution, serious overlap, and complicated background information is still a challenge. A new deep learning network, YOLO-DCAM, has been developed to effectively promote individual tree detection amidst complex scenes. The YOLO-DCAM is constructed by leveraging the YOLOv5 network as the basis and further enhancing the network’s capability of extracting features by reasonably incorporating deformable convolutional layers into the backbone. Additionally, an efficient multi-scale attention module is integrated into the neck to enable the network to prioritize the tree crown features and reduce the interference of background information. The combination of these two modules can greatly enhance detection performance. The YOLO-DCAM achieved an impressive performance for the detection of Chinese fir instances within a comprehensive dataset comprising 978 images across four typical planted forest scenes, with model evaluation metrics of precision (96.1%), recall (93.0%), F1-score (94.5%), and [email protected] (97.3%), respectively. The comparative test showed that YOLO-DCAM has a good balance between model accuracy and efficiency compared with YOLOv5 and advanced detection models. Specifically, the precision increased by 2.6%, recall increased by 1.6%, F1-score increased by 2.1%, and [email protected] increased by 1.4% compared to YOLOv5. Across three supplementary plots, YOLO-DCAM consistently demonstrates strong robustness. These results illustrate the effectiveness of YOLO-DCAM for detecting individual trees in complex plantation environments. This study can serve as a reference for utilizing UAV-based RGB imagery to precisely detect individual trees, offering valuable implications for forest practical applications.

1. Introduction

Planted forests constitute an essential component of forest resources, covering approximately 294 million hectares and representing a 7% area of global forests [1], playing important roles in ecosystem functions, including energy supply, climate regulation, and carbon sequestration [2,3,4]. In planted forests, it is imperative to accurately ascertain tree density, identify their positions, and analyze their distribution patterns [5,6]. Such inventory information is important for evaluating the state of forests [7] and serves as a critical prerequisite for practicing forest management and developing sustainable forestry. Hence, individual tree detection (ITD) has become a crucial part of forest inventory, arousing wide concern.
Achieving ITD through a field survey is arduous and time-consuming, making it unsuitable for large tracts of land despite offering relatively dependable inventory data. A necessity arises for developing cost-effective, accurate, and large-scale remote sensing methods for identifying and locating trees in forested regions. Several approaches employing diverse remote sensing data sources have emerged in response to this challenge. For instance, active remote sensing, based on laser scanning, allows for the acquisition of the detailed three-dimensional spatial information of forests, enabling high-precision ITD. However, from a cost perspective, it is exorbitant costing, impeding its large-scale application [8,9]. A high-resolution spectral image is readily available either cheaply or freely, but from an operational perspective, the resolution and accuracy of the data remain highly questionable concerning identifying and locating relatively clustered individual trees in forests [10,11].
In recent years, the utilization of advanced UAV remote sensing and computer vision techniques has presented promising potential for ITD through the use of RGB images captured by UAVs. Several approaches have been carried out for ITD, including local maxima [12], watershed segmentation [13], region growing [14], and support vector machines [15]. The utilization of conventional methods for ITD is constrained by various factors, such as the limited use of depth feature information, the need to readjust parameters for different scenarios, and high time complexity due to traversing and calculating the whole image. By contrast, detecting individual trees using deep learning has emerged as a promising research area, as its advantages in the automatic learning of complicated and abstract features result in high detection accuracy and adaptability to different data distributions and scene changes [10,16,17].
An object detector based on deep learning extracts high-level semantic features from input raw data and assigns the detected object with a bounding box and corresponding category in the image. A fundamental method classification can be established based on whether it generates candidate boxes. One is namely two-stage models, such as R-FCN [18] and Faster R-CNN [19], executing ITD with candidate boxes. The other is namely the one-stage model, with typical models including SSD [20] and YOLO [21]. The former proposes the regions that may contain objects. Then, it classifies and predicts the boundary boxes of these regions, which can achieve high detection accuracy but is limited by a slow inference speed. The latter directly classifies the entire image and boundary box prediction to achieve target detection by applying predefined anchor boxes while maintaining accuracy to achieve a high speed. Santos et al. [22] conducted a comparative assessment of three object detection models to identify individual trees. The two-stage Faster R-CNN model suffered from the highest computational cost and reasoning speed, while the one-stage model achieved superior performance in both detection accuracy and speed. The conventional method for ITD primarily focuses on predicting the location and category of trees. Recently, researchers extended this approach by segmenting each tree crown at the pixel level (i.e., detect all target instances in the image and label pixels belonging to its category for each instance). Sun et al. [23] utilized the two-stage Cascade Mask R-CNN model to detect the number of trees and delineate each tree crown across a vast sub-tropical megacity, achieving an R2 value of 88.32%. Mo et al. [24] employed a lightweight single-stage YOLCAT model to segment the Litchi Canopy, attaining an AP of 96.25% with real-time detection speed. However, individual tree crown segmentation demands an extensive amount of pixel-level labeling data for training, which consumes considerable manpower and time. Furthermore, the computational complexity and accuracy of this model are concerning.
In this study, the focus is on one-stage models, specifically YOLO-type models for ITD. These models have been reported to attain comparable levels of accuracy while also outperforming two-stage detection models in terms of reasoning speed [22,25]. Various advancements have been implemented in the YOLO family to enhance detection speed and accuracy, such as YOLOv1-v8 [21,26,27,28,29,30,31], showing promising results for ITD. Lou et al. [32] employed the YOLOv3 network to detect loblolly pines, resulting in a remarkable precision of over 93%. Chen et al. [33] introduced an improved YOLOv4 model for the detection of bayberry trees. Dong et al. [34] developed an improved YOLOv7 model, incorporating SimAM attention and SIoU modules, attaining a 90.34% [email protected] in detecting Metasequoia glyptostroboides tree crowns. Wardana et al. [35] evaluated the performance of YOLOv8 in detecting oil palm trees, achieving an accuracy of 98.5%. In the field of forestry, YOLOv5 has been widely employed to address various tasks related to individual tree detection [10], forest fire detection [36], and forest pest detection and control [37], consistently delivering a strong performance. Compared to other YOLO versions, YOLOv5 has achieved high-accuracy detection alongside a fast inferencing speed and low model complexity. Additionally, this model is a lightweight network with smaller weight files while taking significantly less time for model training. It is suitable for UAV inspection missions and can also be deployed on edge computing devices and cloud servers for real-time detection [10]. Therefore, we chose the YOLOv5 version for the detection of individual trees.
While the prevailing YOLOv5 network has demonstrated a commendable performance in low-density and uniform planted forest scenarios [38,39], it faces limitations when applied to planted forests characterized by high density, substantial tree crown occlusion, and a complicated background [40]. Within intricate environments, the feature extraction capability of YOLOv5 in the backbone module, while effective, can be considered relatively simplistic, potentially leading to the omission of crucial information. Additionally, the hierarchical feature extraction function employed by the network unavoidably compresses information, increasing the likelihood of object–background confusion. Consequently, the performance of YOLOv5 no longer meets the requirements of ITD, as it is inclined to false detection and missed detection.
Chinese fir (Cunninghamia lanceolata (Lamb.) Hook.) is one of the most important plantation tree species in China. Its planted area reaches 9.87 million hectares, ranking first in all dominant tree species’ plantations [41]. It is characterized by a high timber yield, exceptional wood quality, and significant ecological functions [5,41]. The tree-level location information is important for Chinese fir management practices, generally obtained using a manual inventory. To the best of our knowledge, there have been relatively few studies utilizing the object detection model for identifying individual Chinese fir trees within UAV RGB imagery, and its potential remains largely unexplored. Moreover, previous research on individual tree detection has primarily concentrated on regular and homogeneous plantation forest environments, lacking the inclusion of multiple complex plantation forest scenes concurrently.
To address these aforementioned challenges, we developed an enhanced YOLO model integrating deformable convolution and attention mechanism (YOLO-DCAM) to achieve the accurate detection of individual Chinese fir trees in diverse complex natural environments. Our main aims are as follows. (1) Constructing a comprehensive dataset for the detection of individual Chinese fir trees within a diverse range of planted forest environments, including high density, crown overlap, and complex background. This dataset was utilized to train the detection model, enhancing its robustness and adaptability across various environmental scenarios. (2) Employing deformable convolution in the backbone of the YOLOv5 network to enhance target feature extraction capabilities and augment the model’s detection accuracy in complex scenes. (3) Introducing a high-efficiency attention module into the neck of the YOLOv5 network, enabling a heightened focus on target information and reducing redundant information with background, which mitigates issues related to missed detection and false detection.
Overall, this study aims to develop an enhanced YOLO model for the detection of individual trees in diverse planted forest scenes based on the highly adaptable UAV platform and RGB imagery to enable a timely, cost-effective, and precise ITD, thus aiding intelligence forest management practices.

2. Materials and Methods

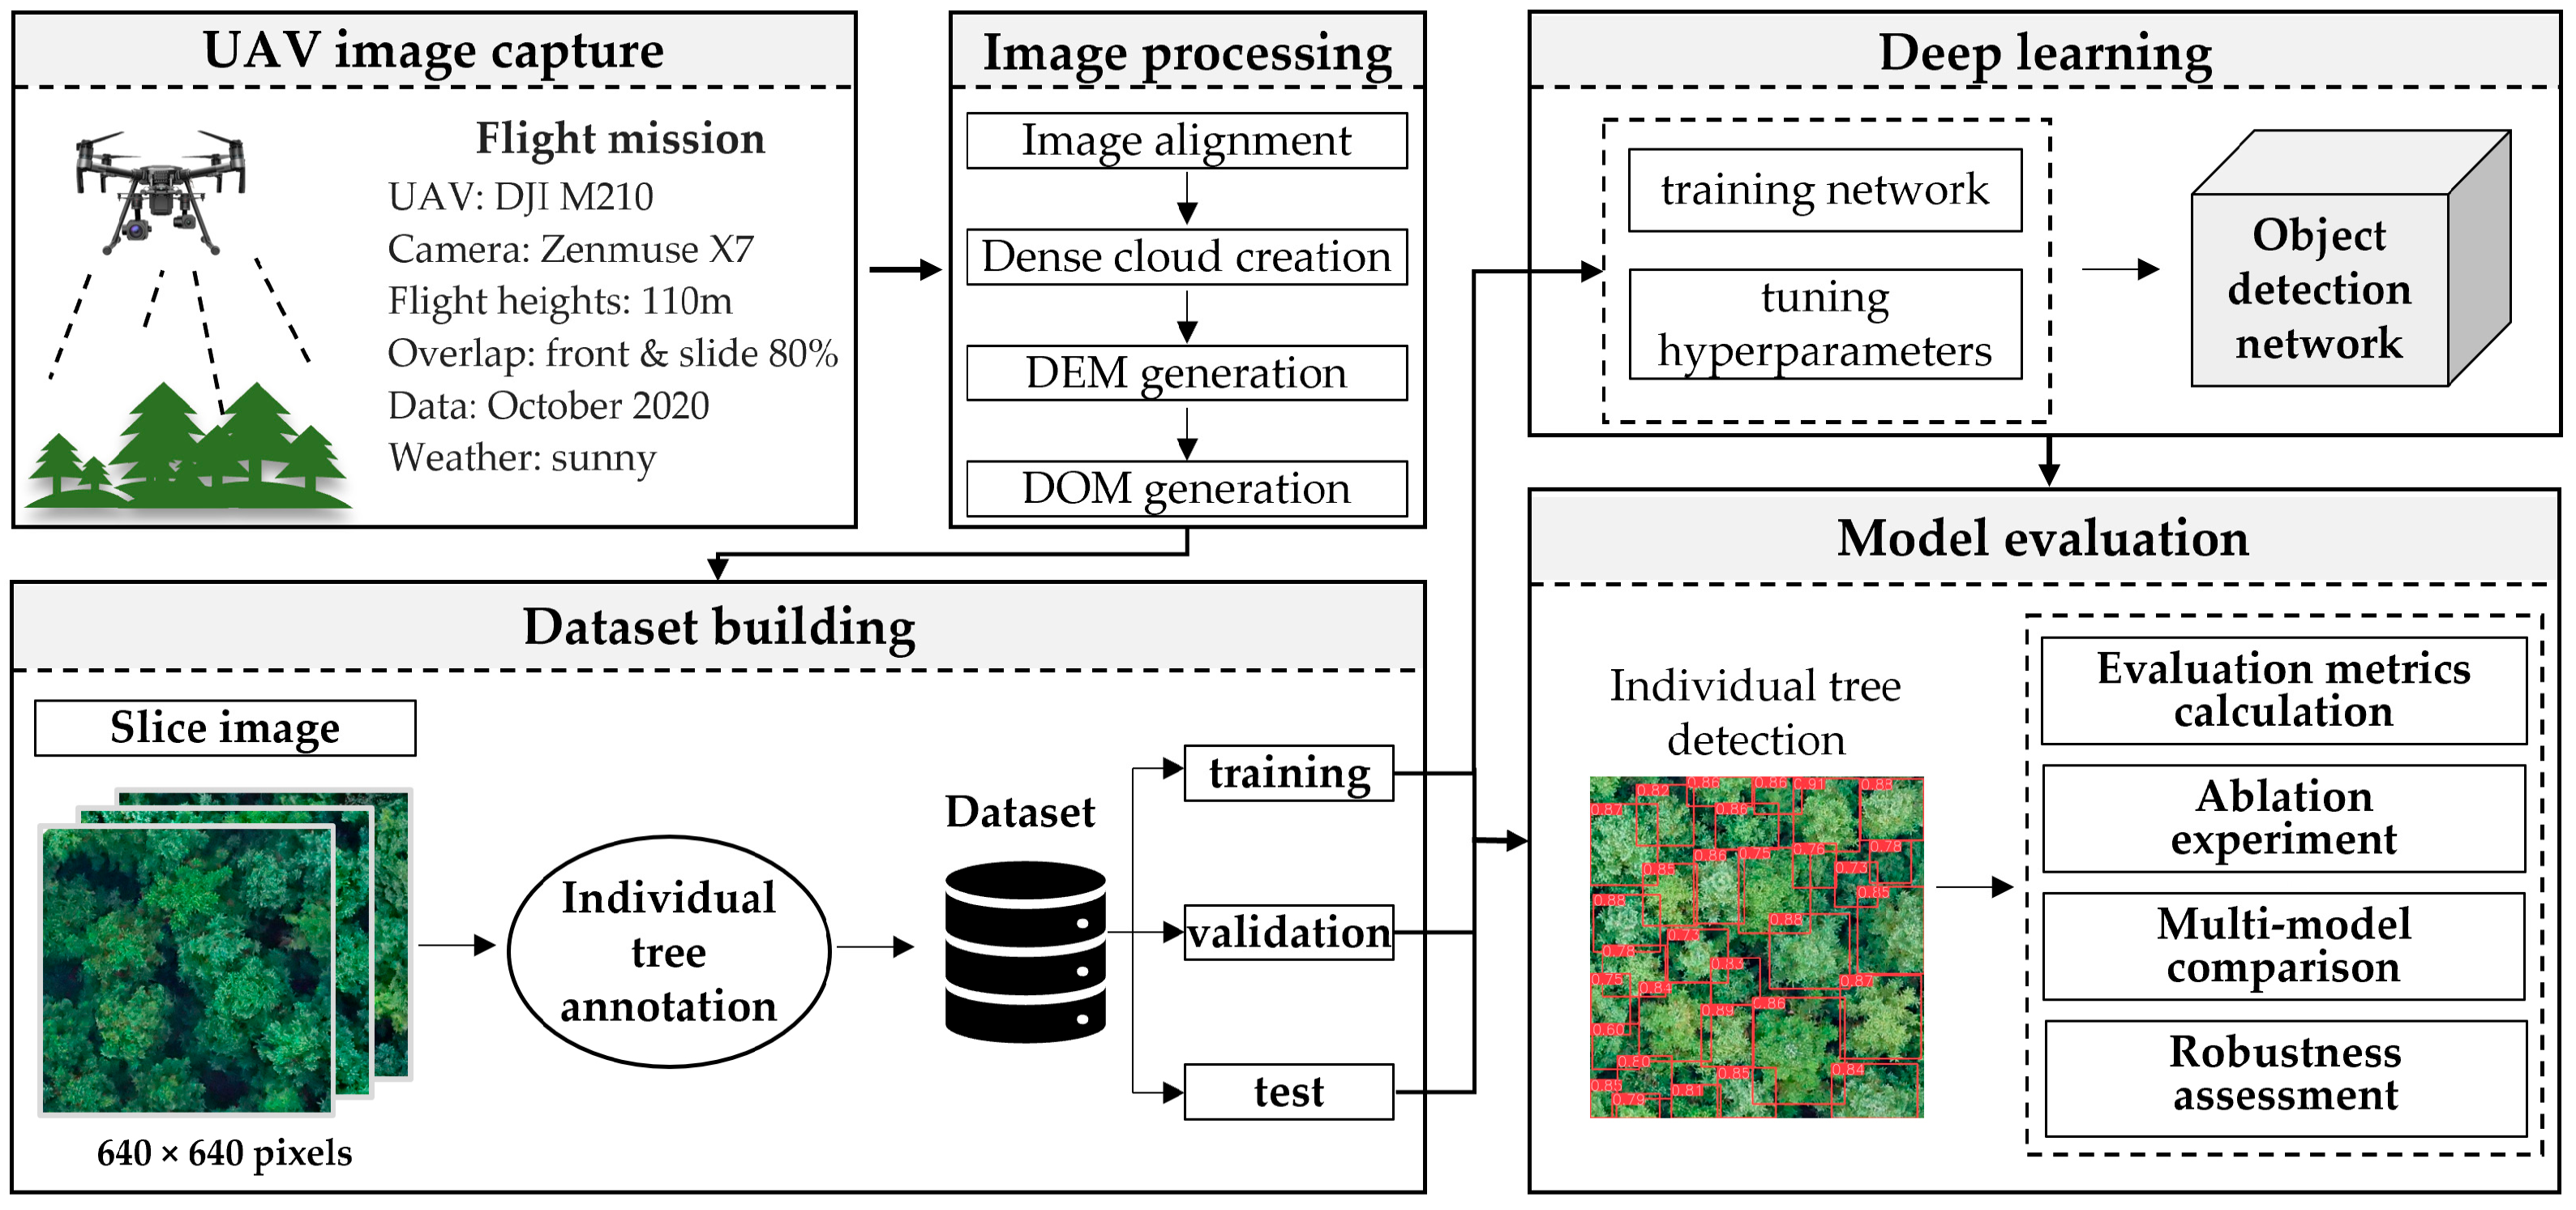
2.1. Framework of Study
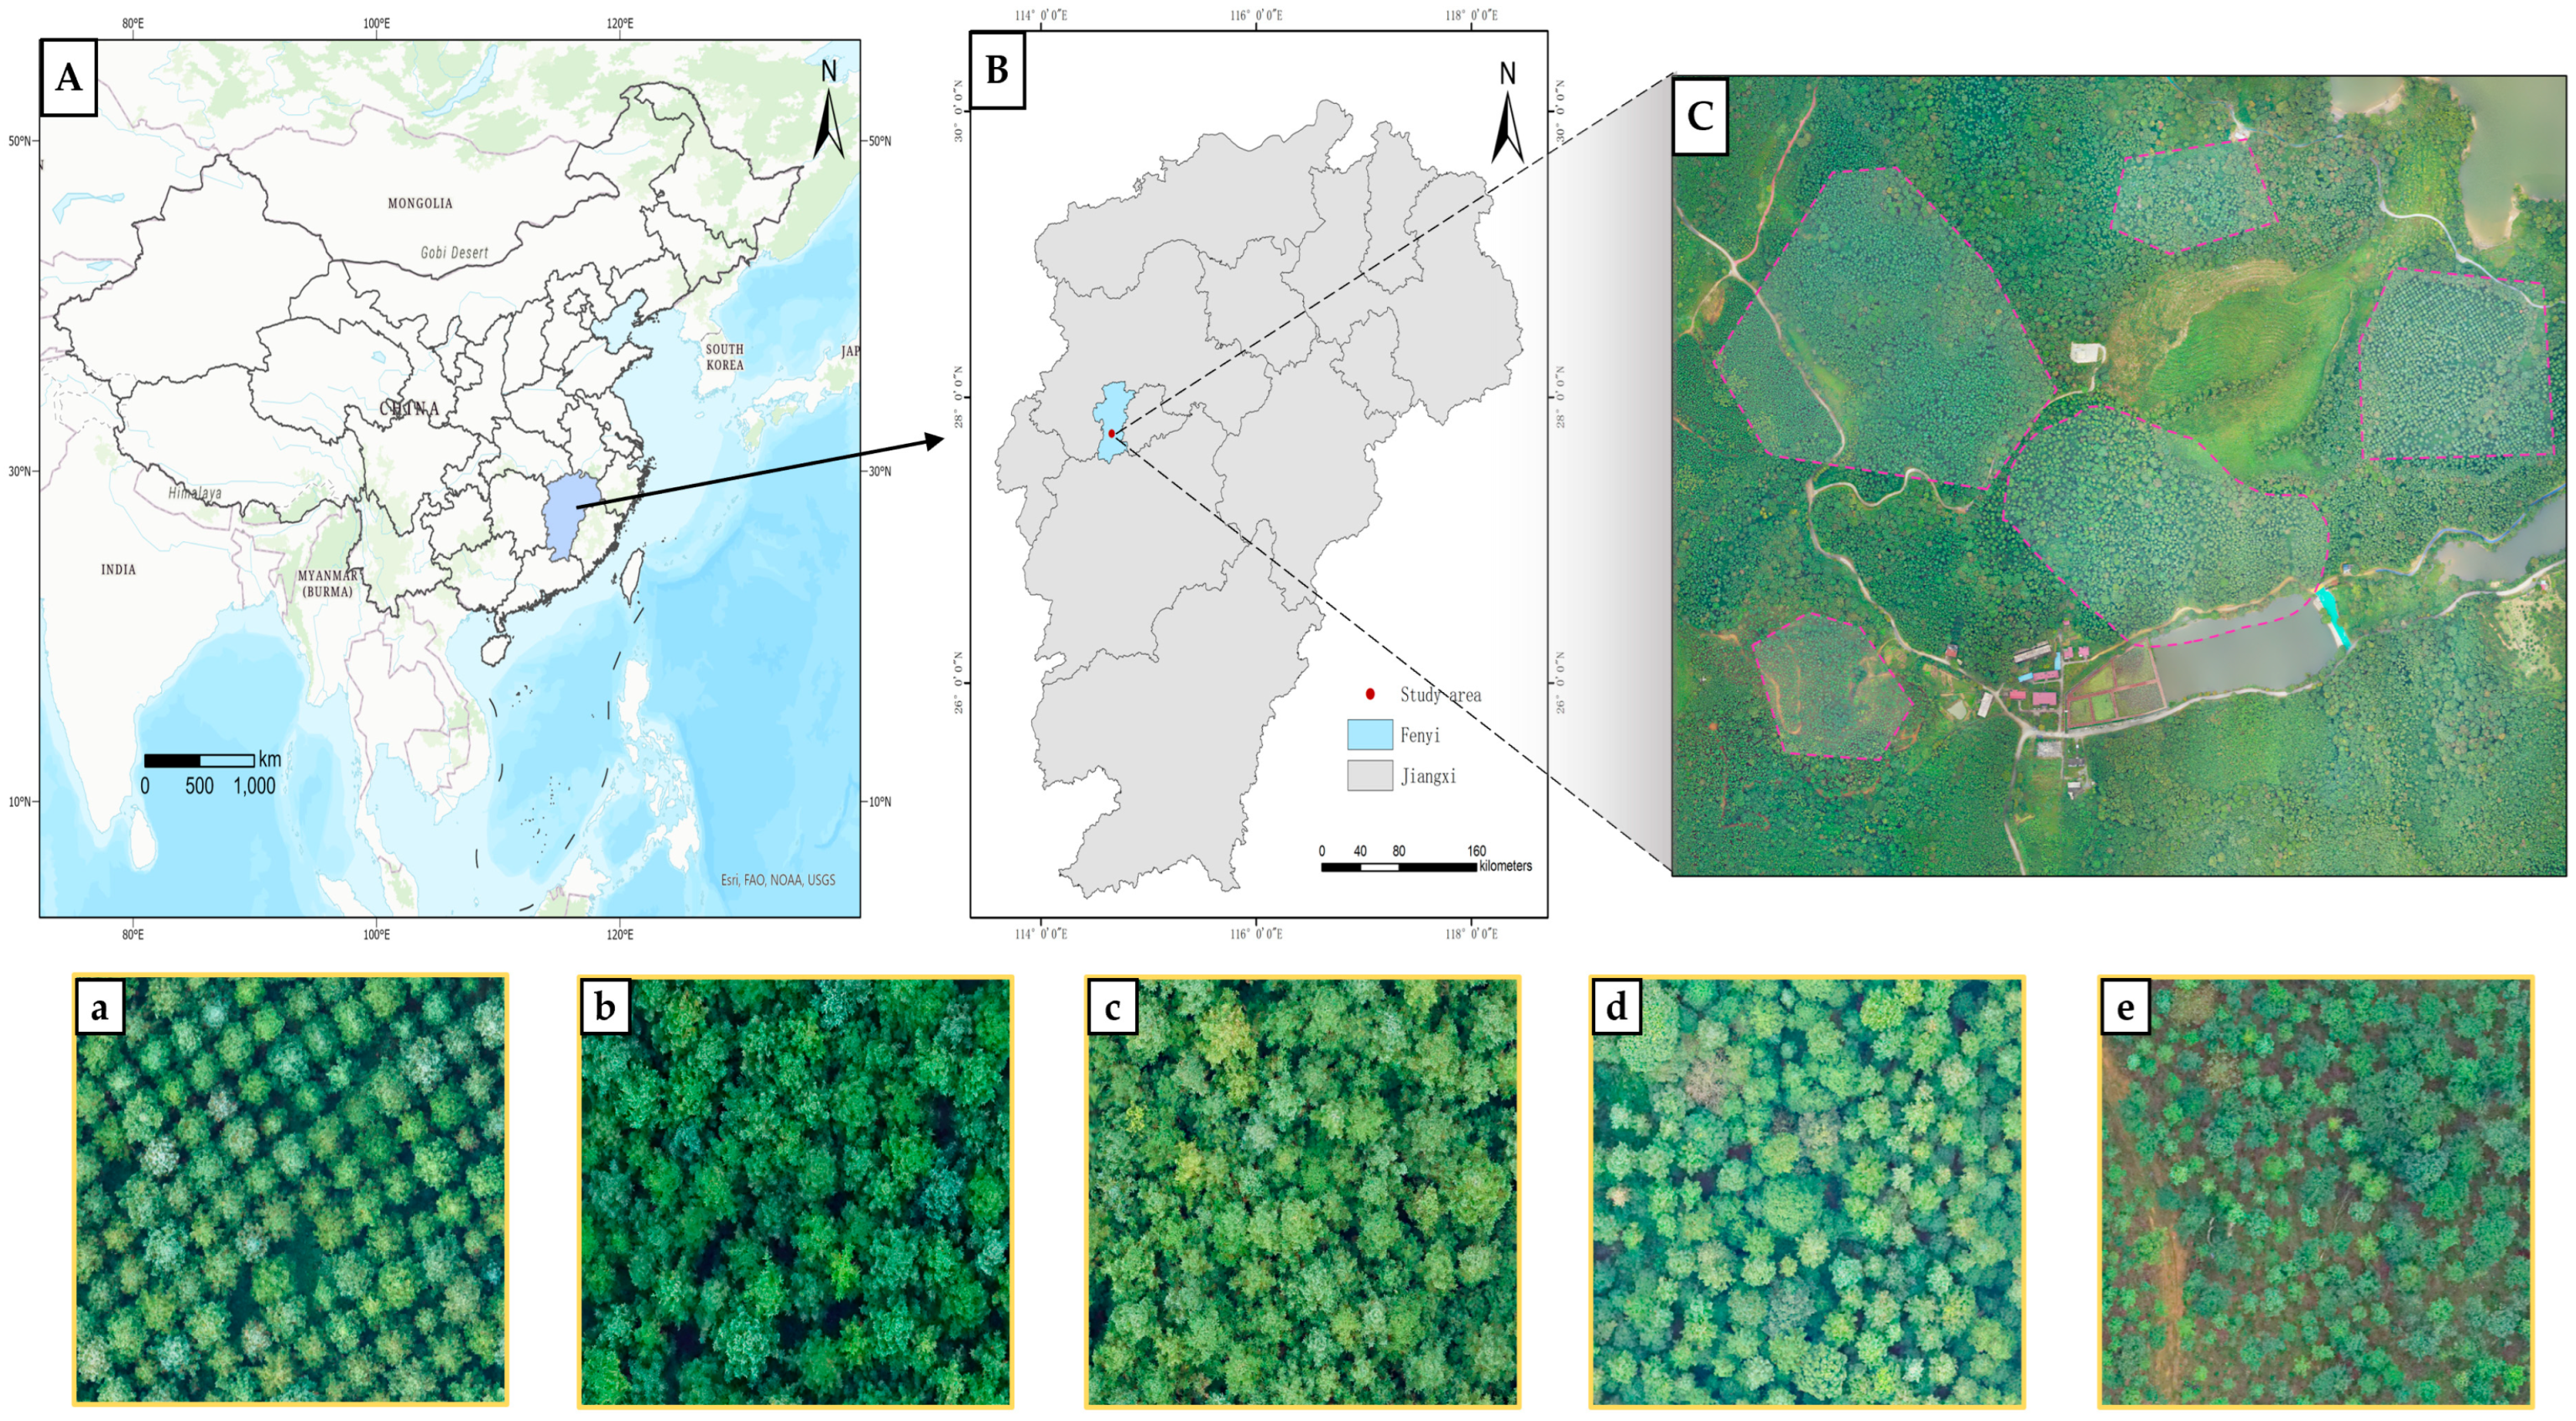
The schematic representation of our study’s framework is delineated in Figure 1. (1) Data preparation. We employed UAV to capture a Digital Orthophoto Map (DOM), subsequently slicing it into 640 × 640-pixel subblocks. Instances were meticulously annotated to construct the ITD dataset. (2) Model training. The training and validation sets were utilized to iteratively train and fine-tune the model parameters, culminating in the acquisition of the optimal model. (3) Model evaluation. An ablation experiment was conducted to compare YOLO-DCAM’s performance against the baseline YOLOv5. Then, a comprehensive assessment was conducted, benchmarking our model’s efficacy against eight mainstream single-stage detection models. Finally, we used three additional UAV RGB imagery subblocks sized at 100 × 100 m to further assess the model’s robustness.

2.2. Study Area

The study area was carried out in the Shanxia experimental forest farm (SEFF), Jiangxi Province, China (114°30′E, 27°30′N). SEFF is mainly composed of low hills. The climate of SEFF belongs to a subtropical monsoon humid type, with an average annual temperature of 17.9 °C and annual precipitation of 1593.7 mm, concentrated from April to July. Furthermore, the vegetation types of SEFFs are predominantly occupied by coniferous and mixed forests, encompassing a diverse range of tree species, including Chinese fir, Pinus massoniana, Schima superba, etc. In SEFF, Chinese fir exhibits extensive distribution in the whole forest farm, covering a variety of canopy density (i.e., the extent of vegetation cover in the forest) types, including low, medium, and high levels, as well as different developmental stages, including young, middle-aged, and mature forests.

2.3. UAV Data Acquisition

The RGB images were acquired using a DJI M210 UAV, which has a take-off weight of 3.84 kg. The UAV system was equipped with a consumer-grade visible light camera Zenmuse X7 with a 24 mm prime lens. Flight missions were carried out in October 2020 with sunny weather. The imagery data were acquired at an approximate flight height of 110 m with both forward and lateral overlap set at 80%. All the images were put into Agisoft Metashape to generate the DOM of the study area with a 3 cm spatial resolution, processed based on the standard photogrammetric processing workflow. This includes image alignment, dense cloud creation, DEM (the Digital Elevation Model), and DOM generation, etc. The DOM of the SEFF (refer to Figure 2) contains features such as vegetation, buildings, and bare land. Our primary focus is on the single-class detection of Chinese fir in a comprehensive natural environment. Therefore, a wide range of subsets on the orthophoto map (refer to Figure 2C) containing various planted forest environments were selected manually to produce the dataset, according to the guidelines of the subcompartment information table provided by forest farm staff, the visual interpretation of DOM, and field investigation.

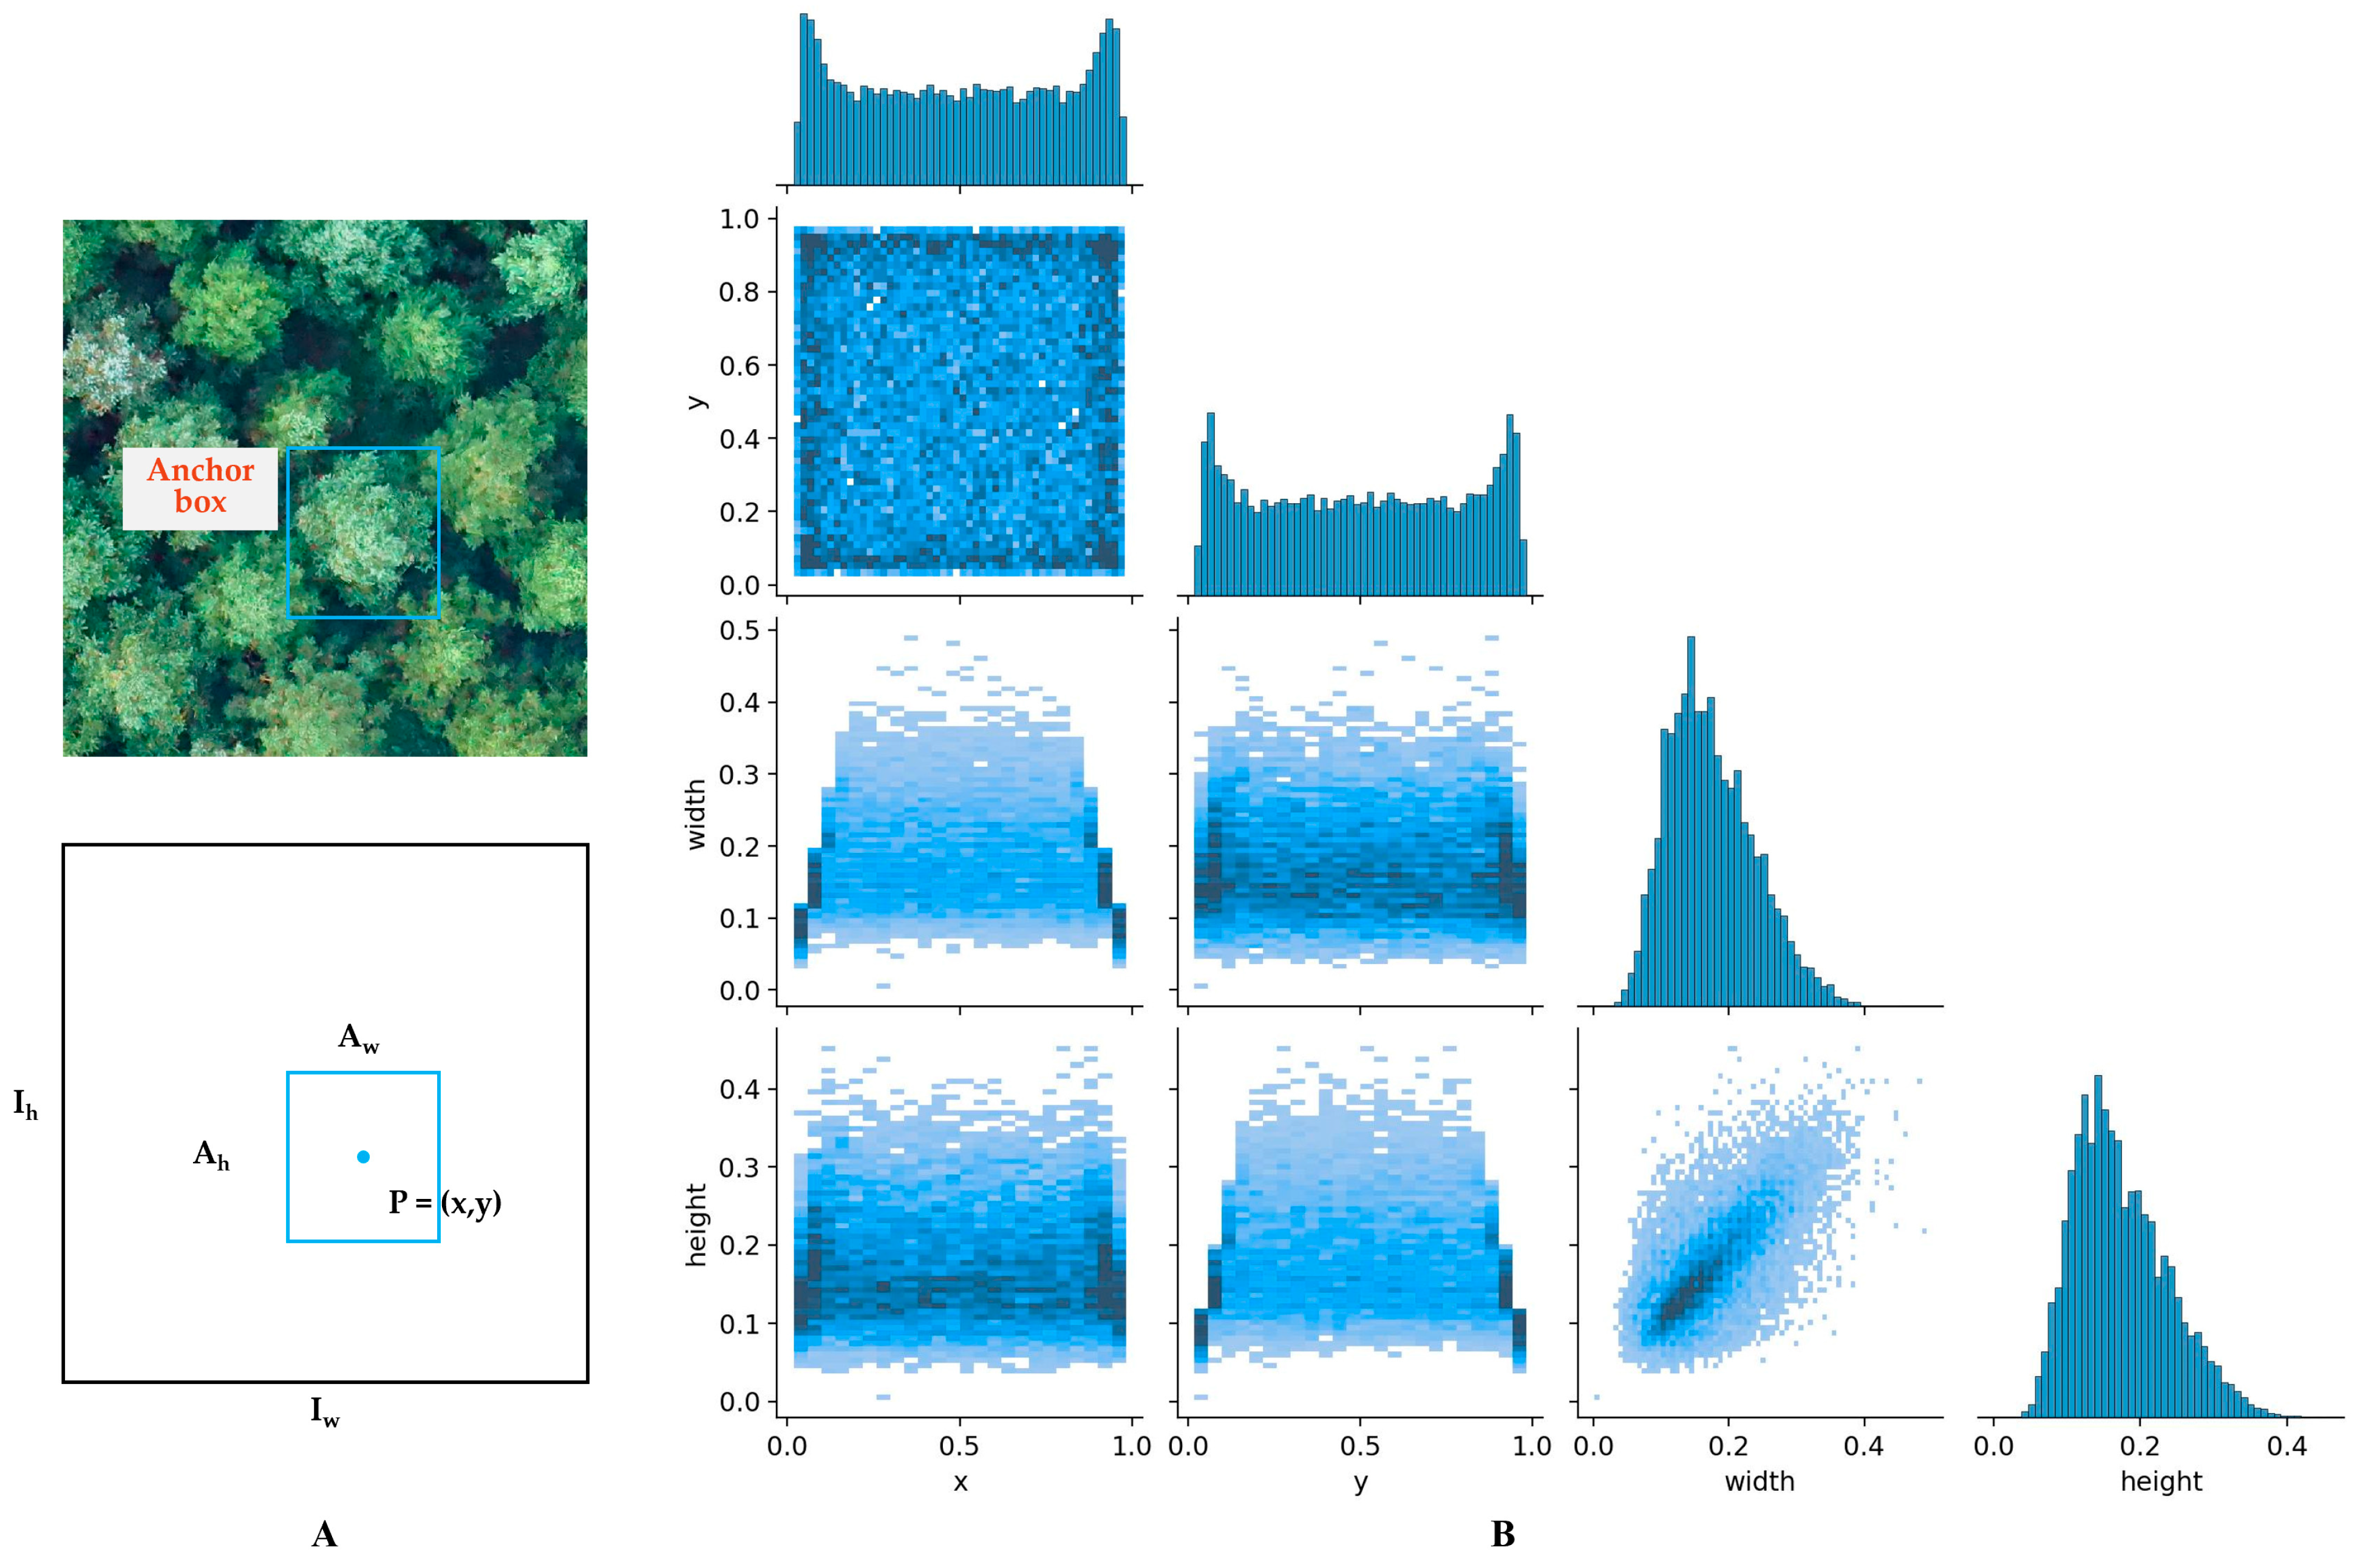
2.4. Dataset Preparation

The image data were partitioned into subblocks measuring 640 × 640 pixels, which not only ensured the inclusion of an appropriate number of Chinese fir trees within each image but also prevented overload hardware limitations. Furthermore, annotating the target object within each image is crucial for model training, validation, and testing. Manual annotation was performed using the annotation tool LabelImg (https://github.com/heartexlabs/labelImg (accessed on 5 August 2023)) to delineate rectangular bounding boxes around instances of individual Chinese fir trees.
Then, statistical analysis was conducted on the anchor boxes encompassing Chinese fir tree crowns (refer to Figure 3). Figure 3A illustrates the anchor box information of an annotated tree crown instance. For an image with a 640 × 640 pixel size, it is denoted as I h and I w for its height and width, respectively. For an anchor box within the image, its height and width are referred to as A h and A w , with its center coordinates denoted as P = (x, y). And height and width in Figure 3B represent the proportion of the tree crown anchor box to the image (i.e., height = A h / I h , width = A w / I w ). Based on the statistical chart, the center point positions (i.e., (x, y)) of anchor boxes exhibit an approximately nonuniform distribution, which is primarily attributed to the spatially heterogeneous distribution of trees. The width and height of anchor boxes are primarily concentrated around (0.15, 0.15) (i.e., the relative proportion of image size), displaying a trend akin to normal distribution, indicating that the dataset contains tree crowns of different sizes.
The resulting Chinese fir ITD dataset comprised 978 images, all sized at 640 × 640 pixels. The whole dataset contained four environment scenarios, and a detailed description is provided in Figure 2 and Table 1. These labeled individual tree samples in each scenario were divided into sub-training, sub-validation, and sub-testing sets using a random allocation ratio of 6:2:2. Recent research indicates that models trained using diverse heterogeneous datasets exhibit enhanced generalization and improved performance compared to models trained solely on a single homogeneous dataset [10]. Consequently, we amalgamated data from four scenarios to create a comprehensive dataset for training, validating, and evaluating the model’s performance.

2.5. The YOLO-DCAM Network

2.5.1. YOLOv5 Network Baseline

The YOLOv5 network demonstrates exceptional performance as an object detector, exhibiting remarkable capabilities in achieving high detection accuracy while maintaining a rapid inference speed. The YOLOv5 architecture encompasses a collection of five sub-versions, each characterized by a consistent underlying framework yet distinguished by variations in network widths and depths, which influence the accuracy and efficiency of detection. The underlying framework of YOLOv5 consists of three key components, namely the backbone, neck, and head. The backbone serves to extract features from input data by employing a sequence of operations, including Cross Stage Partial (CSP) networks [42], convolutional (Conv) blocks, and a Spatial Pyramid Pooling Fusion (SPPF) mechanism. These operations facilitate the extraction and integration of informative features, which are subsequently passed to the neck module. The neck is used for refining and enhancing features extracted from the backbone by a series of operations, including convolution, sampling, and feature fusion. The neck aggregates features from various network levels by employing horizontal connections and a top-down bidirectional fusion process, encompassing both low-level spatial details and high-level semantic information, which is achieved by applying a functional pyramid structure [43]. This effective fusion technique allows for capturing coarse-grained and fined-grained features at diverse levels. The head performs final predictions for the object’s locations and class by integrating multi-level features from the backbone and neck modules.

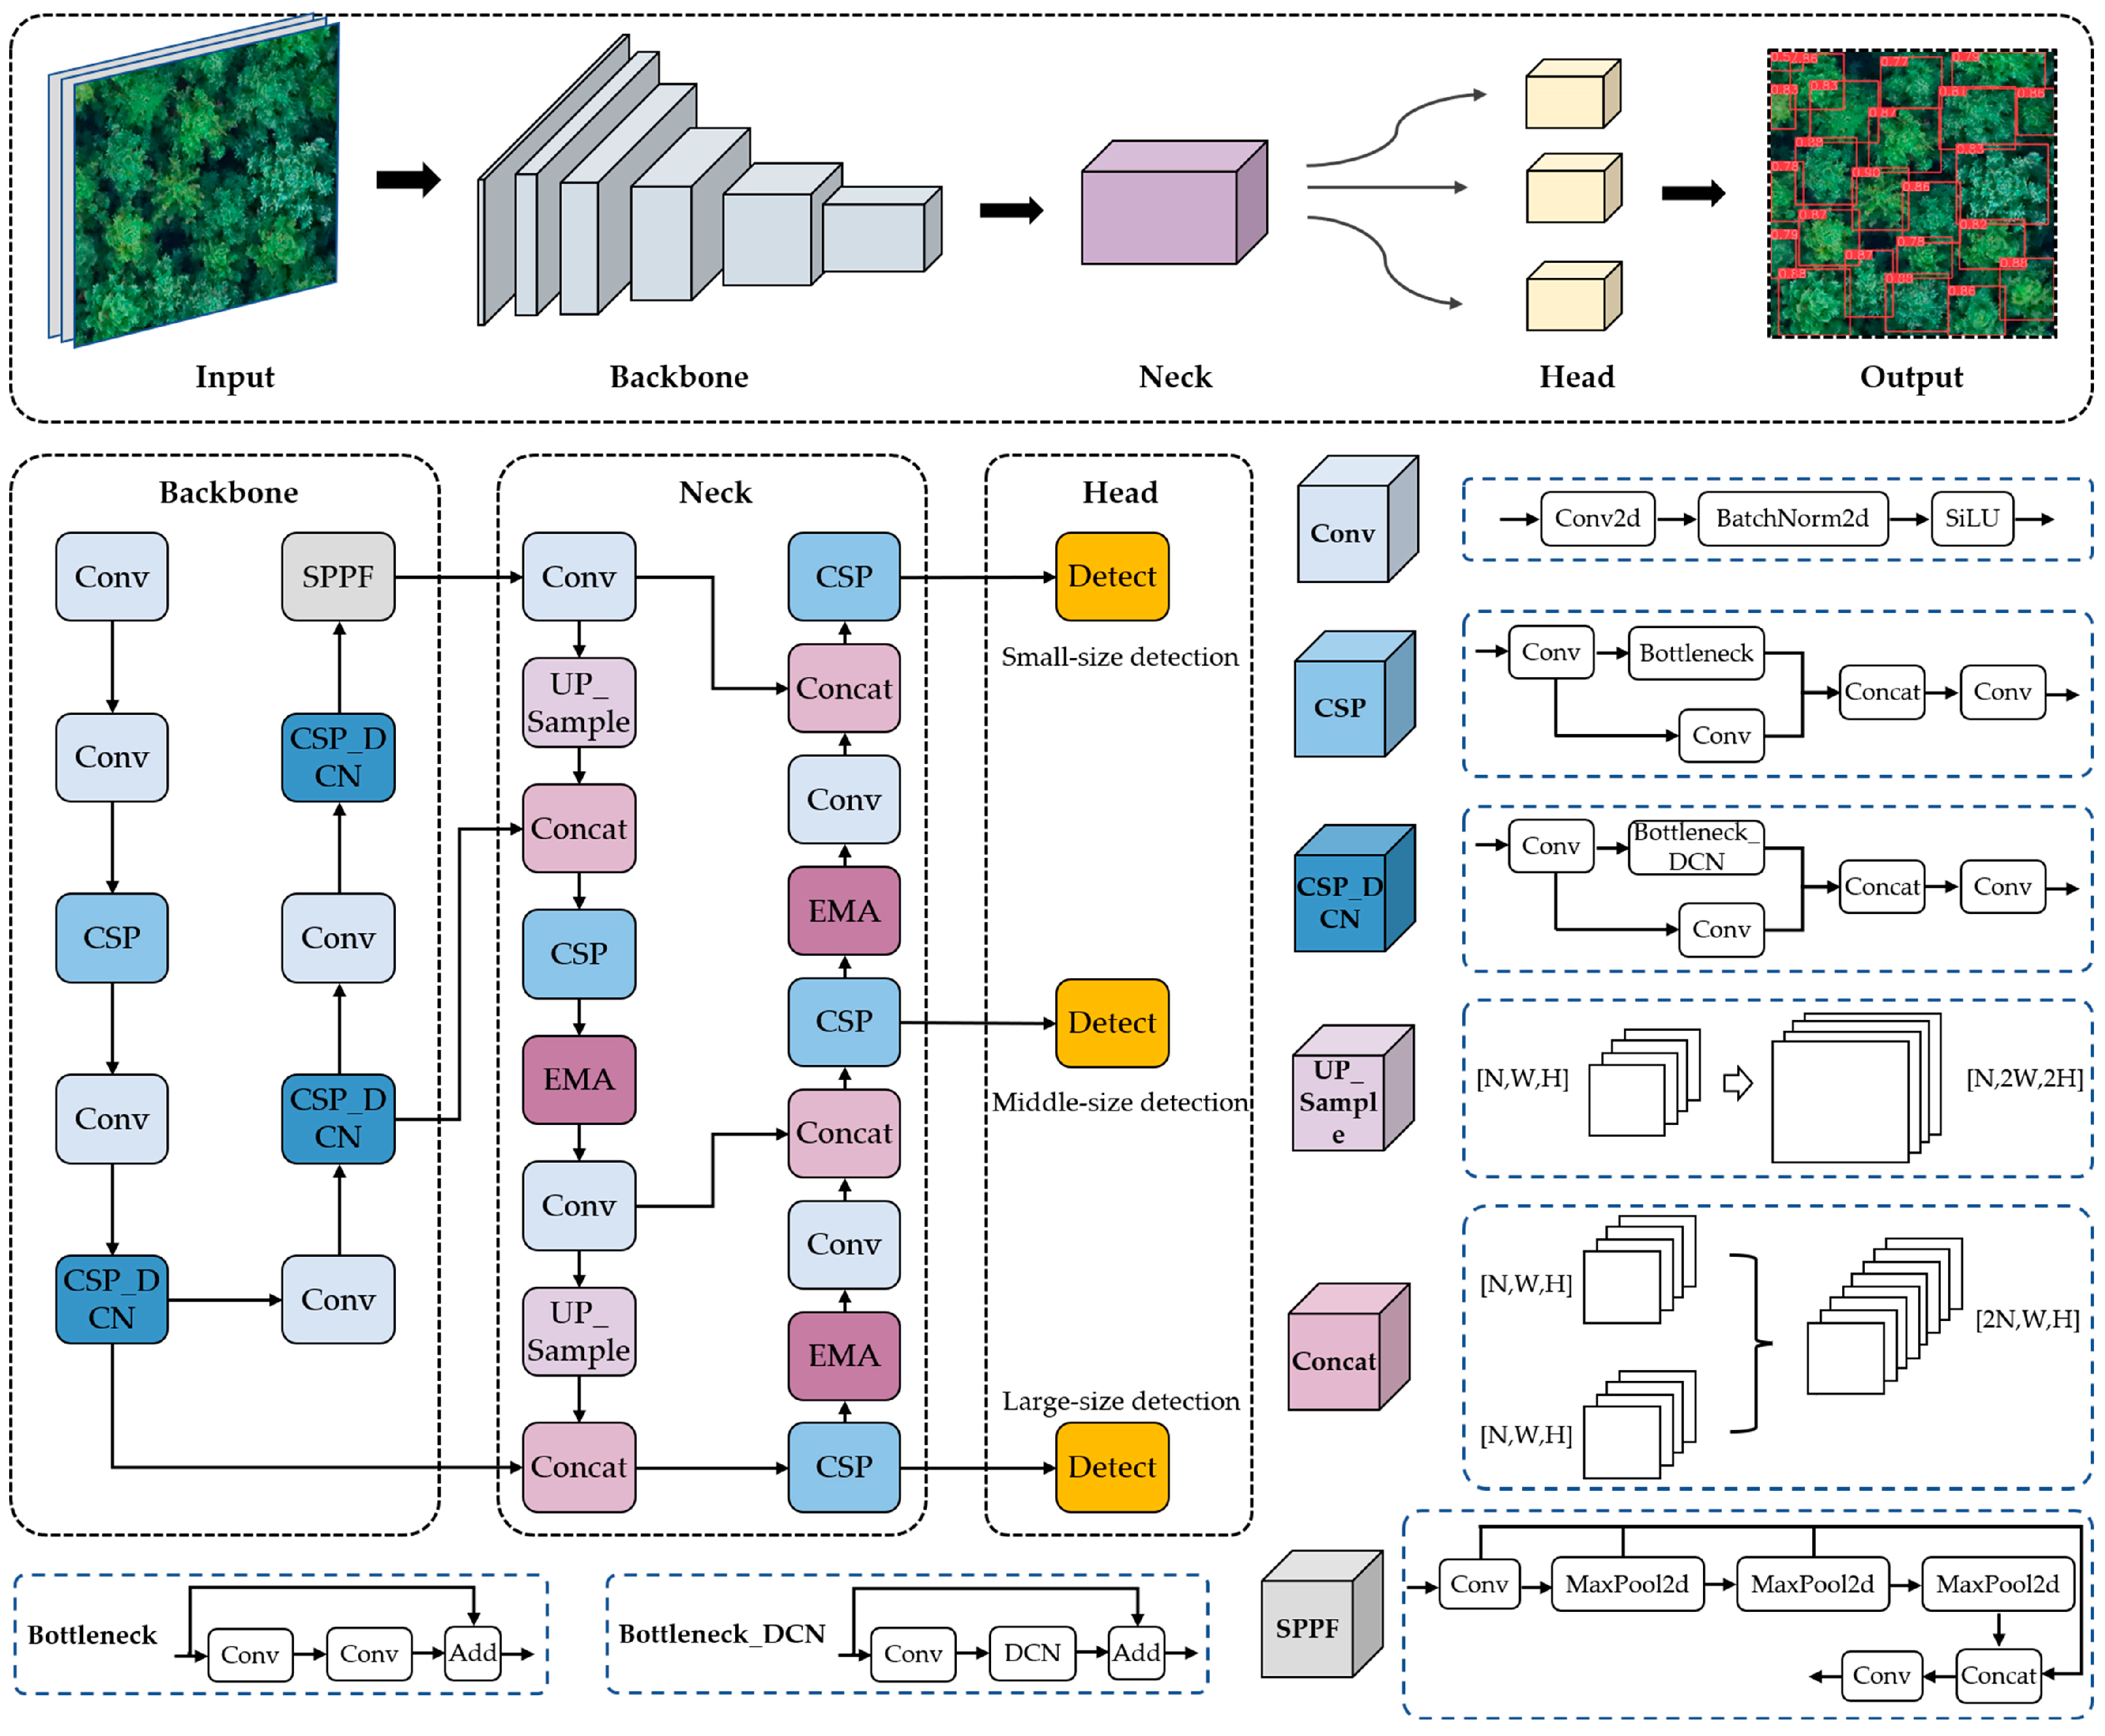
2.5.2. Overview of YOLO-DCAM Network Architecture

A detailed network structure of YOLO-DCAM is illustrated in Figure 4. For the backbone of YOLO-DCAM, a CSP-DCN module is reasonably embedded, which is constructed by leveraging the CSP module as a baseline and assembling the deformable convolution layer. The CSP-DCN is designed to effectively enhance the feature extraction capability. In the neck part, an efficient attention module with parallel, multi-scale, and cross-spatial learning methods is rationally added to capture local and global attention information effectively. This addition focuses the model on target features, reduces redundancy, and mitigates challenges related to the missed and false detection of individual trees in complex scenes.

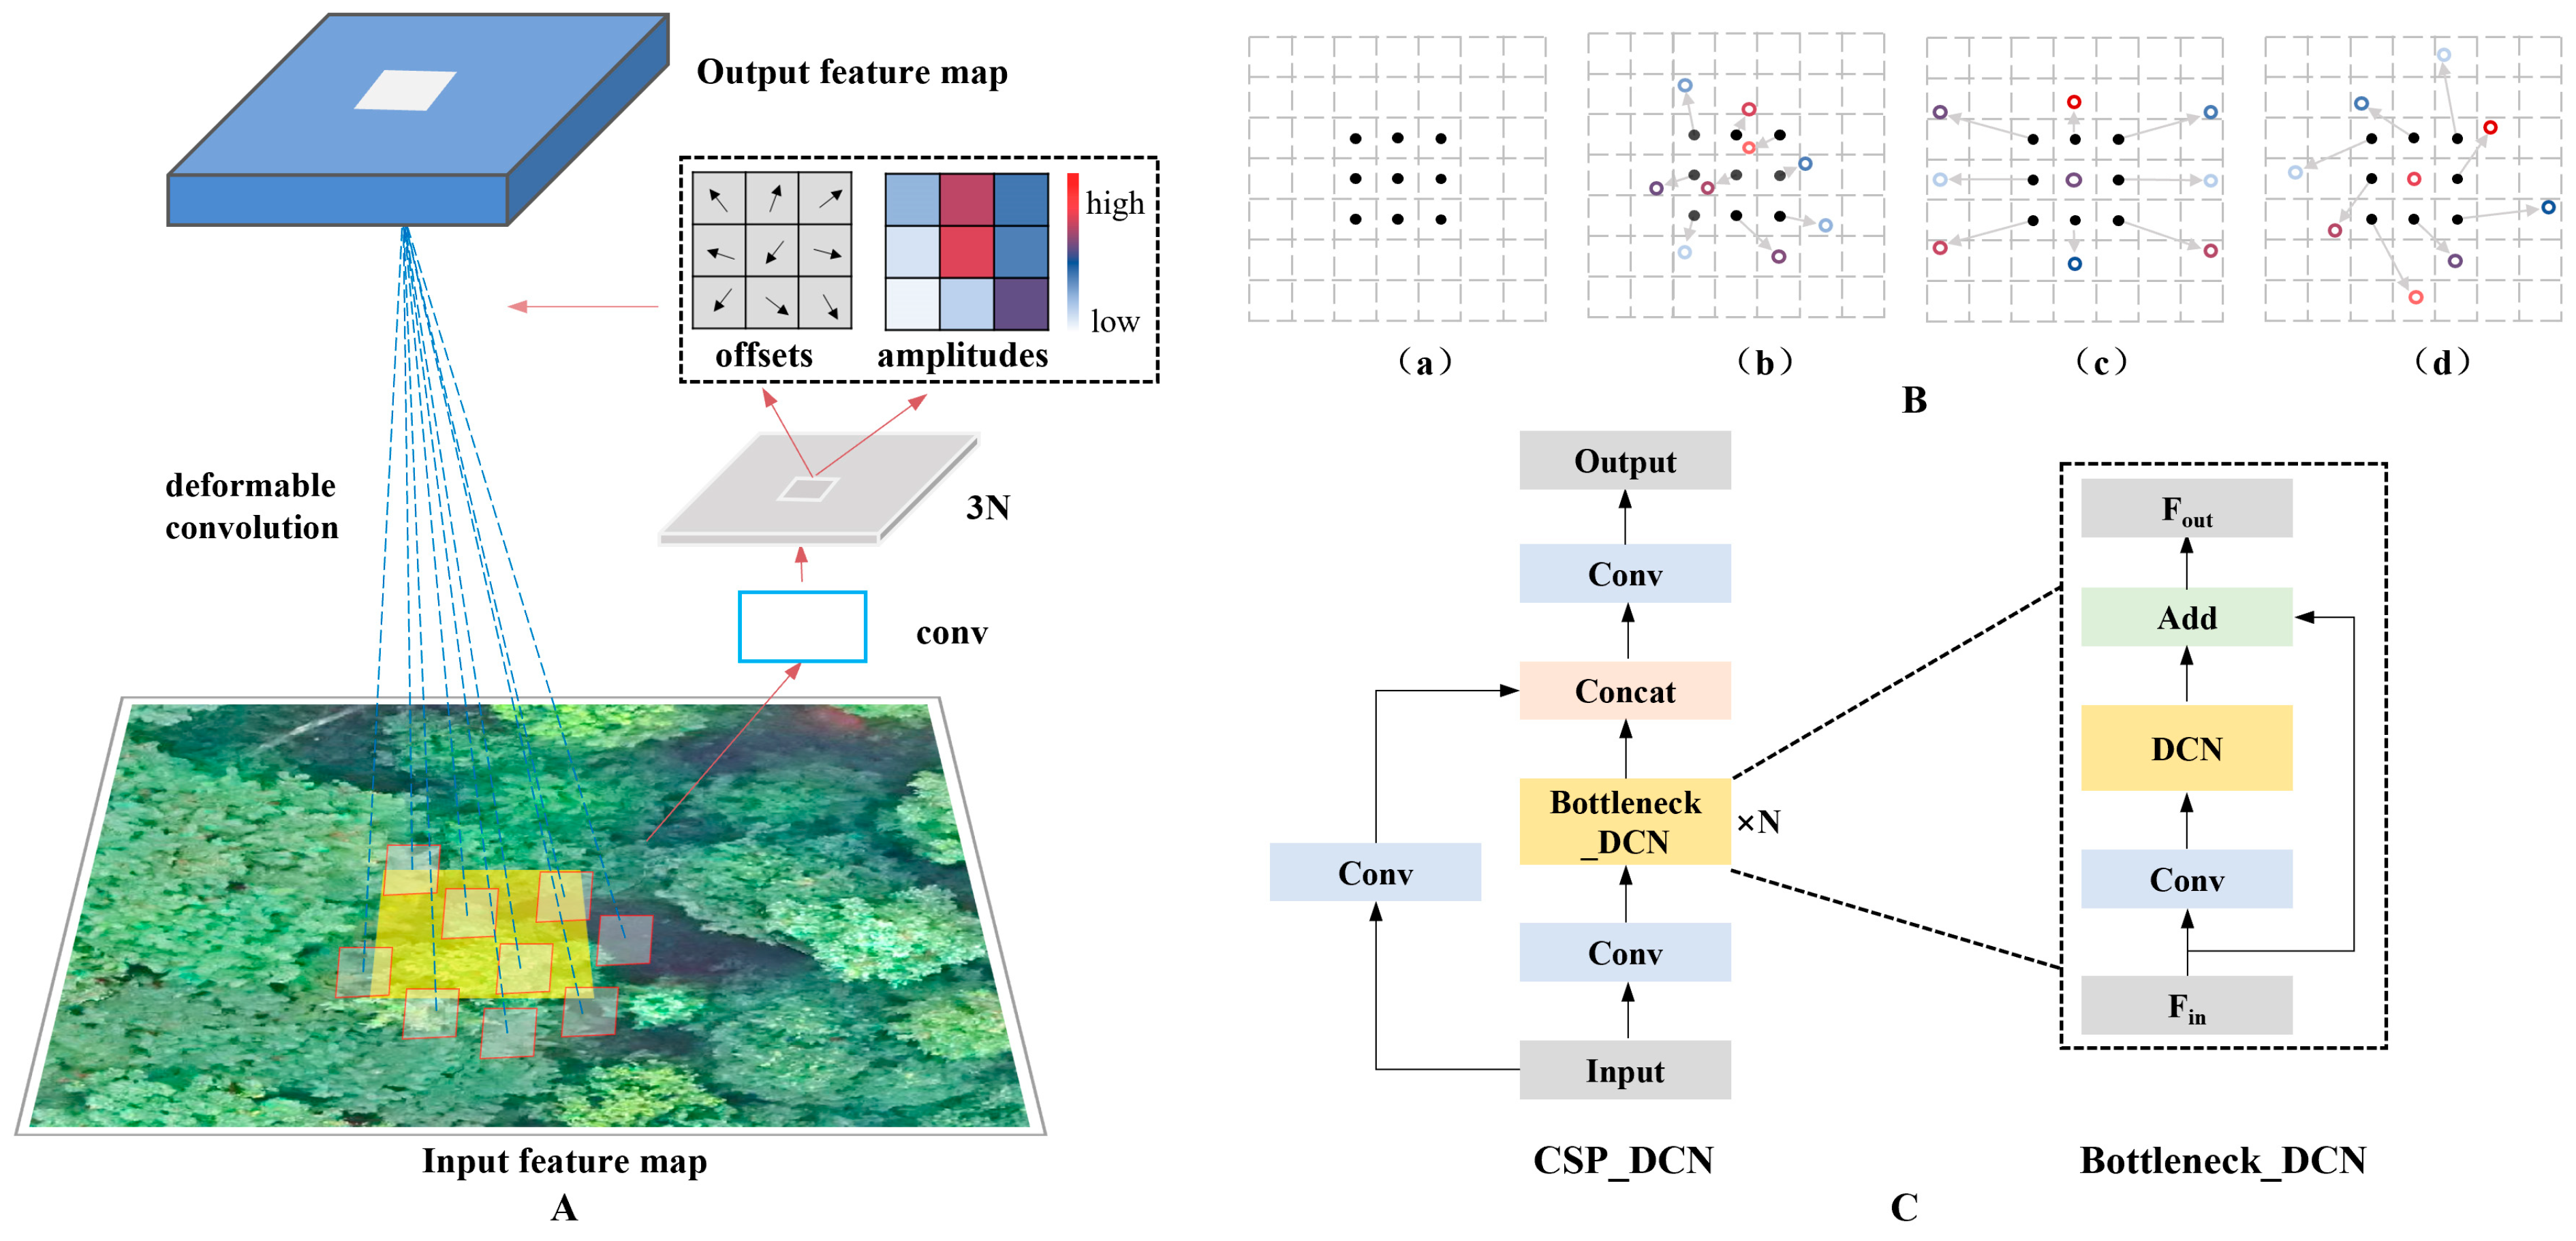
2.5.3. Improved Backbone with Deformable Convolution Network

The conventional convolutional method utilizes kernels of regular size and shape, thereby exhibiting strong feature extraction capabilities for objects of regular geometry. However, their efficacy of feature extraction potential is probably limited when confronted with irregularly shaped objects. The deformable convolutional network v2 (DCN) [44] is an advanced convolutional operation that incorporates a learnable offset variable to every sampling point within the convolution kernel, which means a wide and adaptive receptive field. This feature enables the local random sampling of the input feature map, surpassing the constraints imposed by regular grid point sampling in conventional convolution. By adaptively changing the current position of the convolution operation, DCN exhibits improved adaptability to diverse target shapes and sizes, enhancing the extraction capability of fine-grained and high-level semantic features.
The operational process of deformable convolution is displayed in Figure 5A. First, for a convention kernel with N sampling points, we define w i as the weight for the i-th sampling point on the input feature map x ; and p i is the pre-defined offset for the i-th sampling point location. For example, in a 2d convention kernel with a 3 × 3 size and dilation of 1, N is 9 and p i 1 , 1 , 1,0 , , 1,1 . The process using the standard convolution on the input feature map x to yield y p (i.e., the feature value on position p of the output feature map y ) can be defined as
y p = i = 1 N w i · x p + p i
For DCN, the operation can be expressed as
y p = i = 1 N w i · x p + p i + p i · m i  
p i is the learnable location offset for the i-th sample point, which adjusts the range of the receptive field. m i is the learnable modulation scalar used to modulate the perceived amplitude for the input feature map x . p i and m i are obtained via an additional convolution layer over the input feature maps x . The convolution kernel of the additional convolution layer is of the same spatial resolution and dilation as the current convolutional layer. It outputs 3 N channels, of which 2 N channels are used to generate the offsets for the x and y directions, which are then combined into p i .
The remaining N channels were processed through a sigmoid layer to produce m i . The sigmoid layer is mainly used to map the value range of m i to [0, 1]. Due to the effect of fractional p i , the value of x p + p i + p i may not correspond to the value in the integer position of the feature map x . Therefore, the bilinear interpolation is used to calculate x p + p i + p i . The bilinear interpolation operation is as follows.
x p = q G q , p · x q = q g q x , p x · g q y , p y · x q
Here, x p = x p + p i + p i , x q is the value of the integer position on x, g a , b = max ( 0 ,   1 a b ) .
The CSP module plays a pivotal role as a fundamental component in the backbone of YOLOv5, serving the purpose of feature extraction. Hence, we introduced DCN into the CSP module to enhance its feature extraction capability. However, the utilization of DCN incurs higher computational complexity compared to standard convolutional operations. Consequently, we selectively applied DCN solely to the bottleneck of the CSP module to balance model efficiency and detection accuracy. In the bottleneck, the substitution of DCN occurs solely in the second convolutional module, as the first convolutional module is employed for dimensionality reduction, rendering its replacement unnecessary. We refer to this improved variant as CSP-DCN. Figure 5 demonstrates its detailed structural configuration.

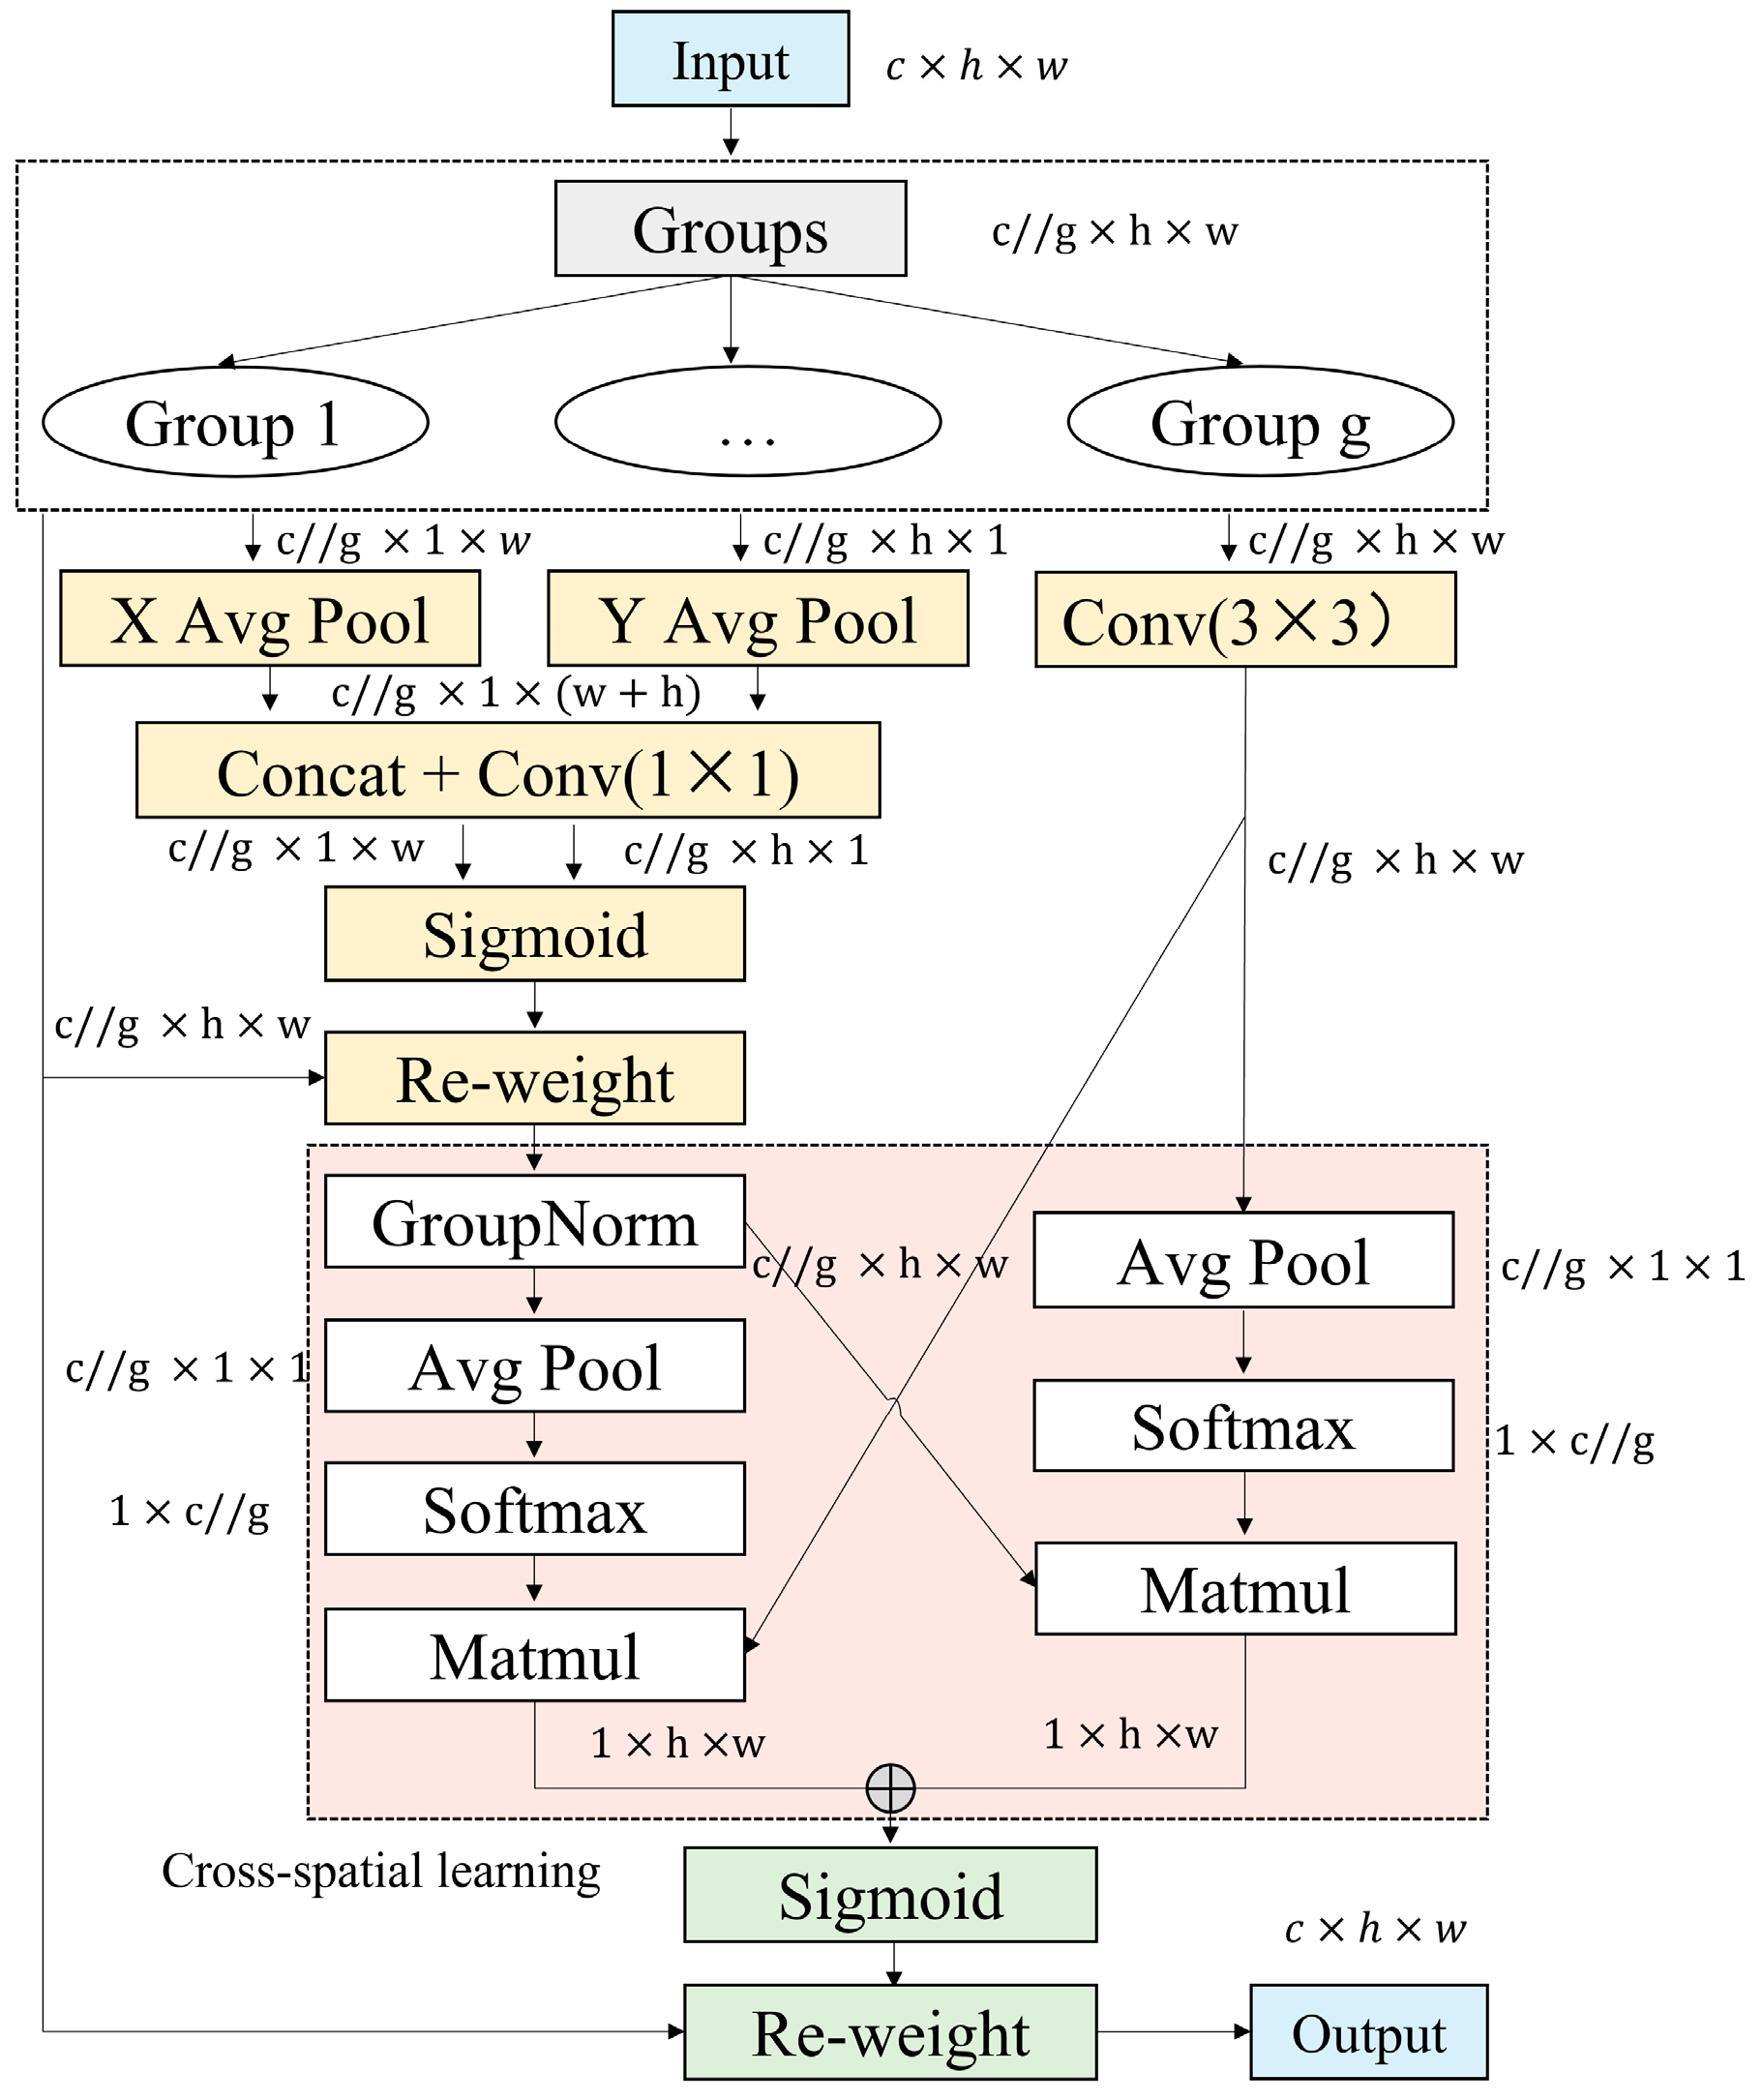
2.5.4. Improved Neck with the Attention Module

The significance of features varies across different positions and channels within the feature maps generated by the convolution operation. The attention mechanism is a prevalent detection enhancement strategy; through the assignment of varying weights to distinct components within the model, it strengthens the extraction of more discriminative feature representation, thereby optimizing the model and enabling more precise judgments. Nevertheless, standard channel-based and spatial-based attention modules feed the entire feature layer into the convolutional layer to extract channel and location information. This approach often results in the heightened consumption of memory and computational complexity.
The efficient multi-scale attention (EMA) [45] is a highly efficient approach that employs a feature grouping strategy for processing input feature data in parallel, thereby accelerating model training. Meanwhile, it integrates multi-scale parallel subnetworks alongside a cross-spatial learning approach to capture both short and long-range dependencies. The network representation of EMA is illustrated in Figure 6.
Firstly, for the input characteristics X R C × H × W , EMA organizes channel dimensions into G subfeature groups X i = X 1 ,   X 2 ,   X 3 ,   , X G ,   X i R C / / G × H × W to enable parallel processing operations. Subsequently, all grouped subfeatures are directed into three parallel branches to extract attention weights. Two of the branches utilize 1D horizontal global pooling (X avg pool) and 1D vertical global pooling (Y avg pool) to decompose the channel information of X i into two separate processes of one-dimensional feature coding, aggregating coded features along distinct spatial directions. The two 1D encoded features are merged along the height direction, followed by an input 1 × 1 convolution for further processing. This results in the generation of two feature vectors oriented in vertical and horizontal directions. Subsequently, the sigmoid function is applied to confine the value range of the vectors within (0,1). The channel-wise attention maps from both directions within each group are aggregated through multiplication to re-weight the input group feature maps. The third branch utilizes 3 × 3 convolutional operations to capture local cross-channel information, expanding the feature space in contrast to a 1 × 1 convolution. Further, the cross-spatial learning method is adopted to integrate richer features of different spatial dimensions, resulting in the output of two iterative feature maps. Finally, the two generated iterative feature maps were concatenated and then fed into the sigmoid function to generate the final attention weights.
In summary, EAM improves pixel-level attention in high-level feature maps by merging context information across different scales and enhancing short and long-range dependencies through parallelizing convolution kernels via cross-spatial learning [43].
Integrating the EMA module into the neck enhances its capability to capture both local and long-distance dependent information, significantly improving the model’s expressibility. The combination strategy facilitates a targeted information focus while reducing attention toward redundancy and background information, which effectively reduces error detection and missed detection.

2.5.5. Loss Function

The loss function of YOLO-DCAM includes the following three parts: coordinate loss L_coord, confidence loss L_conf, and class loss L_cls.
L_total = L_coord + L_conf + L_cls
The CIOU loss function is employed to compute L_coord, which calculates the disparity between predicted boxes and labels. L_conf employs binary cross-entropy to determine object presence and prediction accuracy. L_cls assesses the accuracy of predicted object classes. Since this study focuses on a single-class Chinese fir, the L_class is set to 0.

2.6. Model Evaluation

To evaluate the model performance for ITD, precision, recall, F1-score, and average precision (AP) metrics are employed for a comprehensive assessment. Precision represents the rate of accurate detection among all model prediction objects. Recall represents the ratio between correct predictions and all labels. The F1-score combines precision and recall to provide a comprehensive evaluation. AP represents the average precision calculated over different recall rates across varying levels of confidence thresholds equivalent to the area of the precision–recall curve. In particular, [email protected] is computed at an Intersection over the Union (IoU) threshold of 0.5. Higher values of these metrics indicate superior model performance. The specific formulas used to compute these metrics are as follows:
P r e c i s i o n = T P T P + F P × 100 %
R e c a l l = T P T P + F N × 100 %
F 1 = 2 × P × R P + R × 100 %
A P = 0 1 P R d R
where TP represents the count of trees correctly identified and located, which are truly positive and correctly recognized as such. FP corresponds to the count of falsely identified individual trees, which are negative but erroneously identified as positive. FN represents the missed detection of trees. P and R refer to precision and recall, respectively.

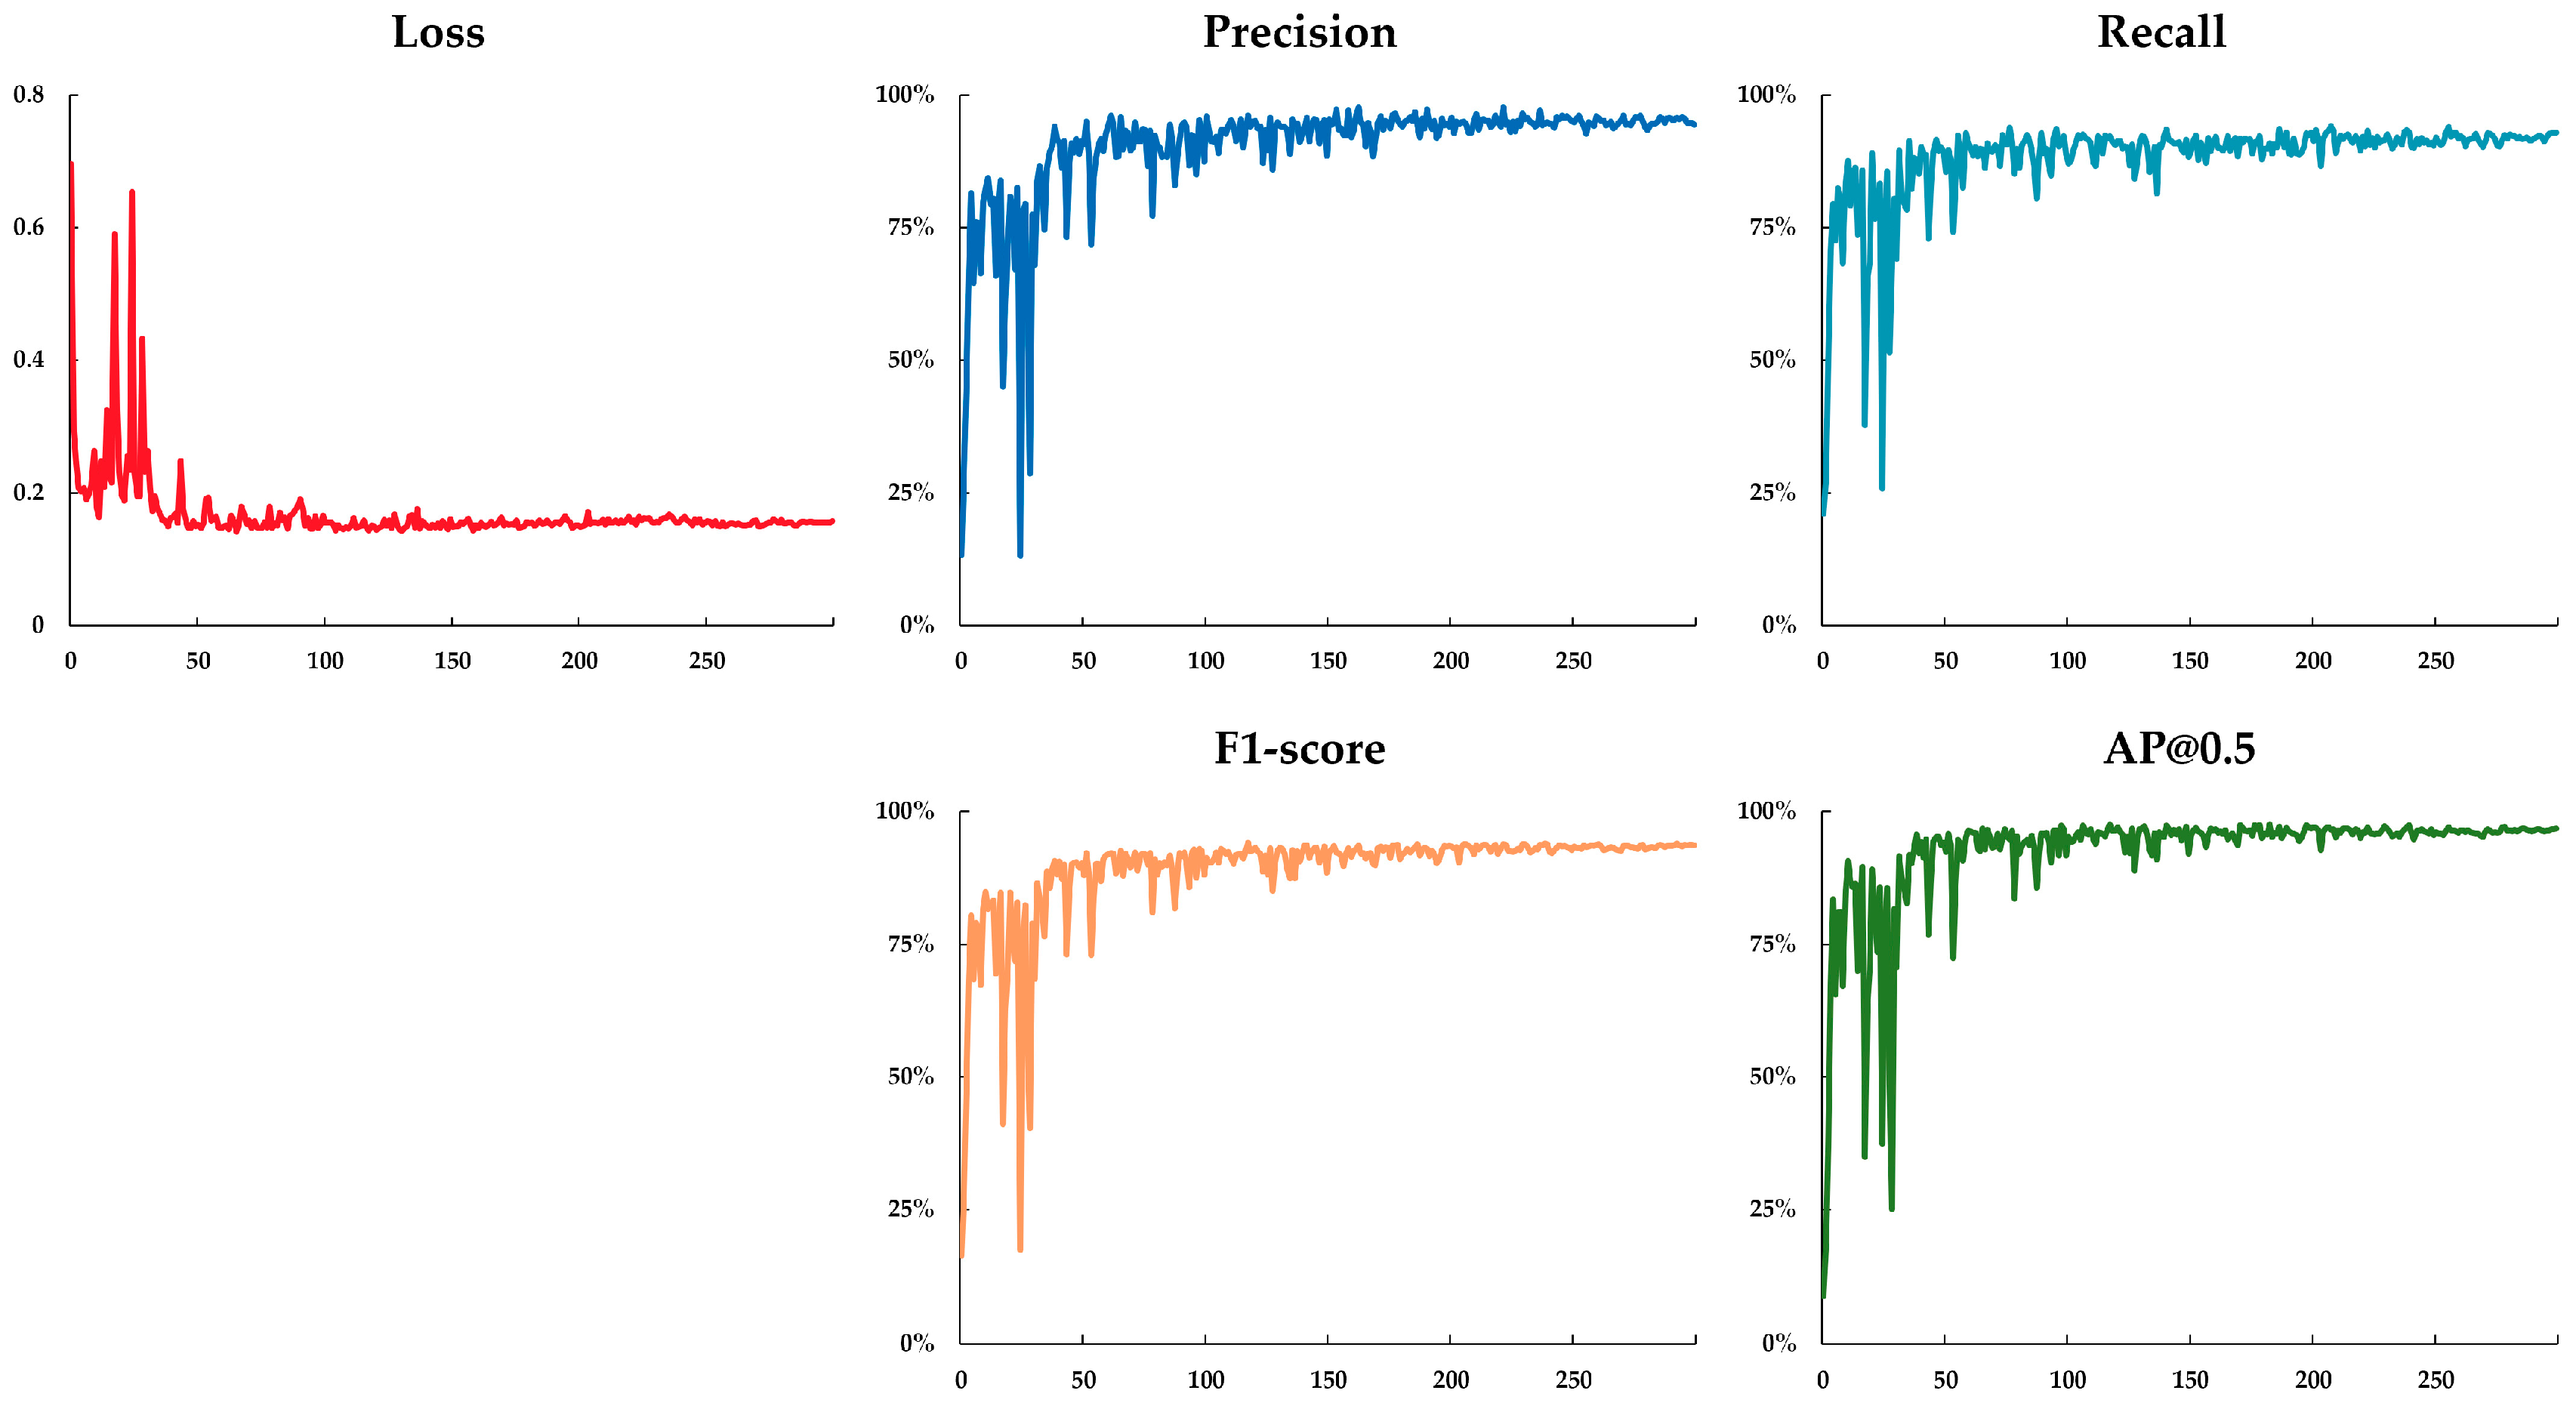
2.7. Experimental Settings

In this study, the deep learning network was trained using the PyTorch framework on a workstation running with a Windows 10 operating system. The hardware environment configuration consisted of an Intel(R) Xeon(R) W-2265 (3.50 GHz) CPU, NVIDIA GeForce RTX 3090 (24 GB) GPU, and 128 GB of RAM. The deep learning environment included Python 3.9, CUDA 11.6, and PyTorch 1.13. In the training stage, the pre-training strategy is used to initialize all models with a pre-training weight trained on the COCO dataset. We chose the Adam gradient optimization algorithm for training ITD models. It is known for its capacity to improve convergence and alleviate diminishing learning rates. The hyperparameters of momentum, learning rate, and weight decay are set as default values of 0.937, 0.01, and 0.0005, respectively. The training utilized an input data size of 640 × 640 × 3 with a batch size of 16, and the training epochs were set to 300.
Figure 7 shows the change curves of loss, precision, recall, and [email protected] during training. During the initial 100 epochs, the training loss value exhibited substantial fluctuations, whereas after approximately 100 epochs, it experienced slight fluctuation and tended to converge. Significant fluctuations could be attributed to the different data distributions and characteristics between the initial task (i.e., the pre-trained weight strategy) and the specific tree detection task, necessitating the model to adapt to new data patterns. The four evaluation metrics exhibit a rapid upward trend within the first 100 epochs, followed by a gradual convergence towards their respective peak values. The weight obtained from the epoch with the best detection performance on the validation set was employed as the final weight for detection.

3. Result and Analysis

3.1. Ablation Experiment

To evaluate the performance of the model proposed for ITD, we selected the standard YOLOv5 network as the baseline, and the impact of two enhancements, namely DCN and EMA, was explored. The experimental results are depicted in Table 2.
The basic network YOLOv5 achieved the detection of Chinese fir instances with model evaluation metrics of precision (93.5%), recall (91.4%), F1-score (92.4%), and [email protected] (95.9%), respectively. Upon incorporating the CSP-DCN module, several improvements were observed. Firstly, the network effectively expanded its receptive field through the offset feature sampling operation, enhancing its contextual comprehension capabilities. Consequently, feature extraction efficiency was enhanced, leading to a 0.5% increase in precision and a 0.6% increase in recall, F1-score, and [email protected], respectively. The results demonstrate how incorporating the CSP-DCN module yielded a positive effect, effectively enhancing the overall performance of ITD. Furthermore, the addition of the EMA module effectively heightened the foreground features in the images while the background regions were appropriately suppressed. This implementation yielded a 1.1% precision increase, a 0.5% increase in the F1-score, and a 0.4% increase in [email protected], alongside a slight decrease of 0.2% in recall. When both DCN and EMA modules were embedded in YOLOv5, the synergistic effect yielded substantial improvements, including a 2.6% increase in precision, a 1.6% increase in recall, a 2.1% increase in the F1-score, and a 1.4% improvement in [email protected]. These results highlight the synergistic effect of integrating both enhancements, showcasing their collective potential for enhancing the detection capacity of YOLOv5.
Furthermore, a visual qualitative comparison of heat maps for the test results before and after the addition of the DCN and EMA modules is depicted in Figure 8. The improved YOLO-DCAM model shows a stronger focus on the Chinese fir tree crown region compared to YOLOv5, and the confidence value of the detected object is higher, effectively improving the accuracy of detection. In addition, YOLO-DCAM can detect more Chinese fir, effectively reducing missed detections.

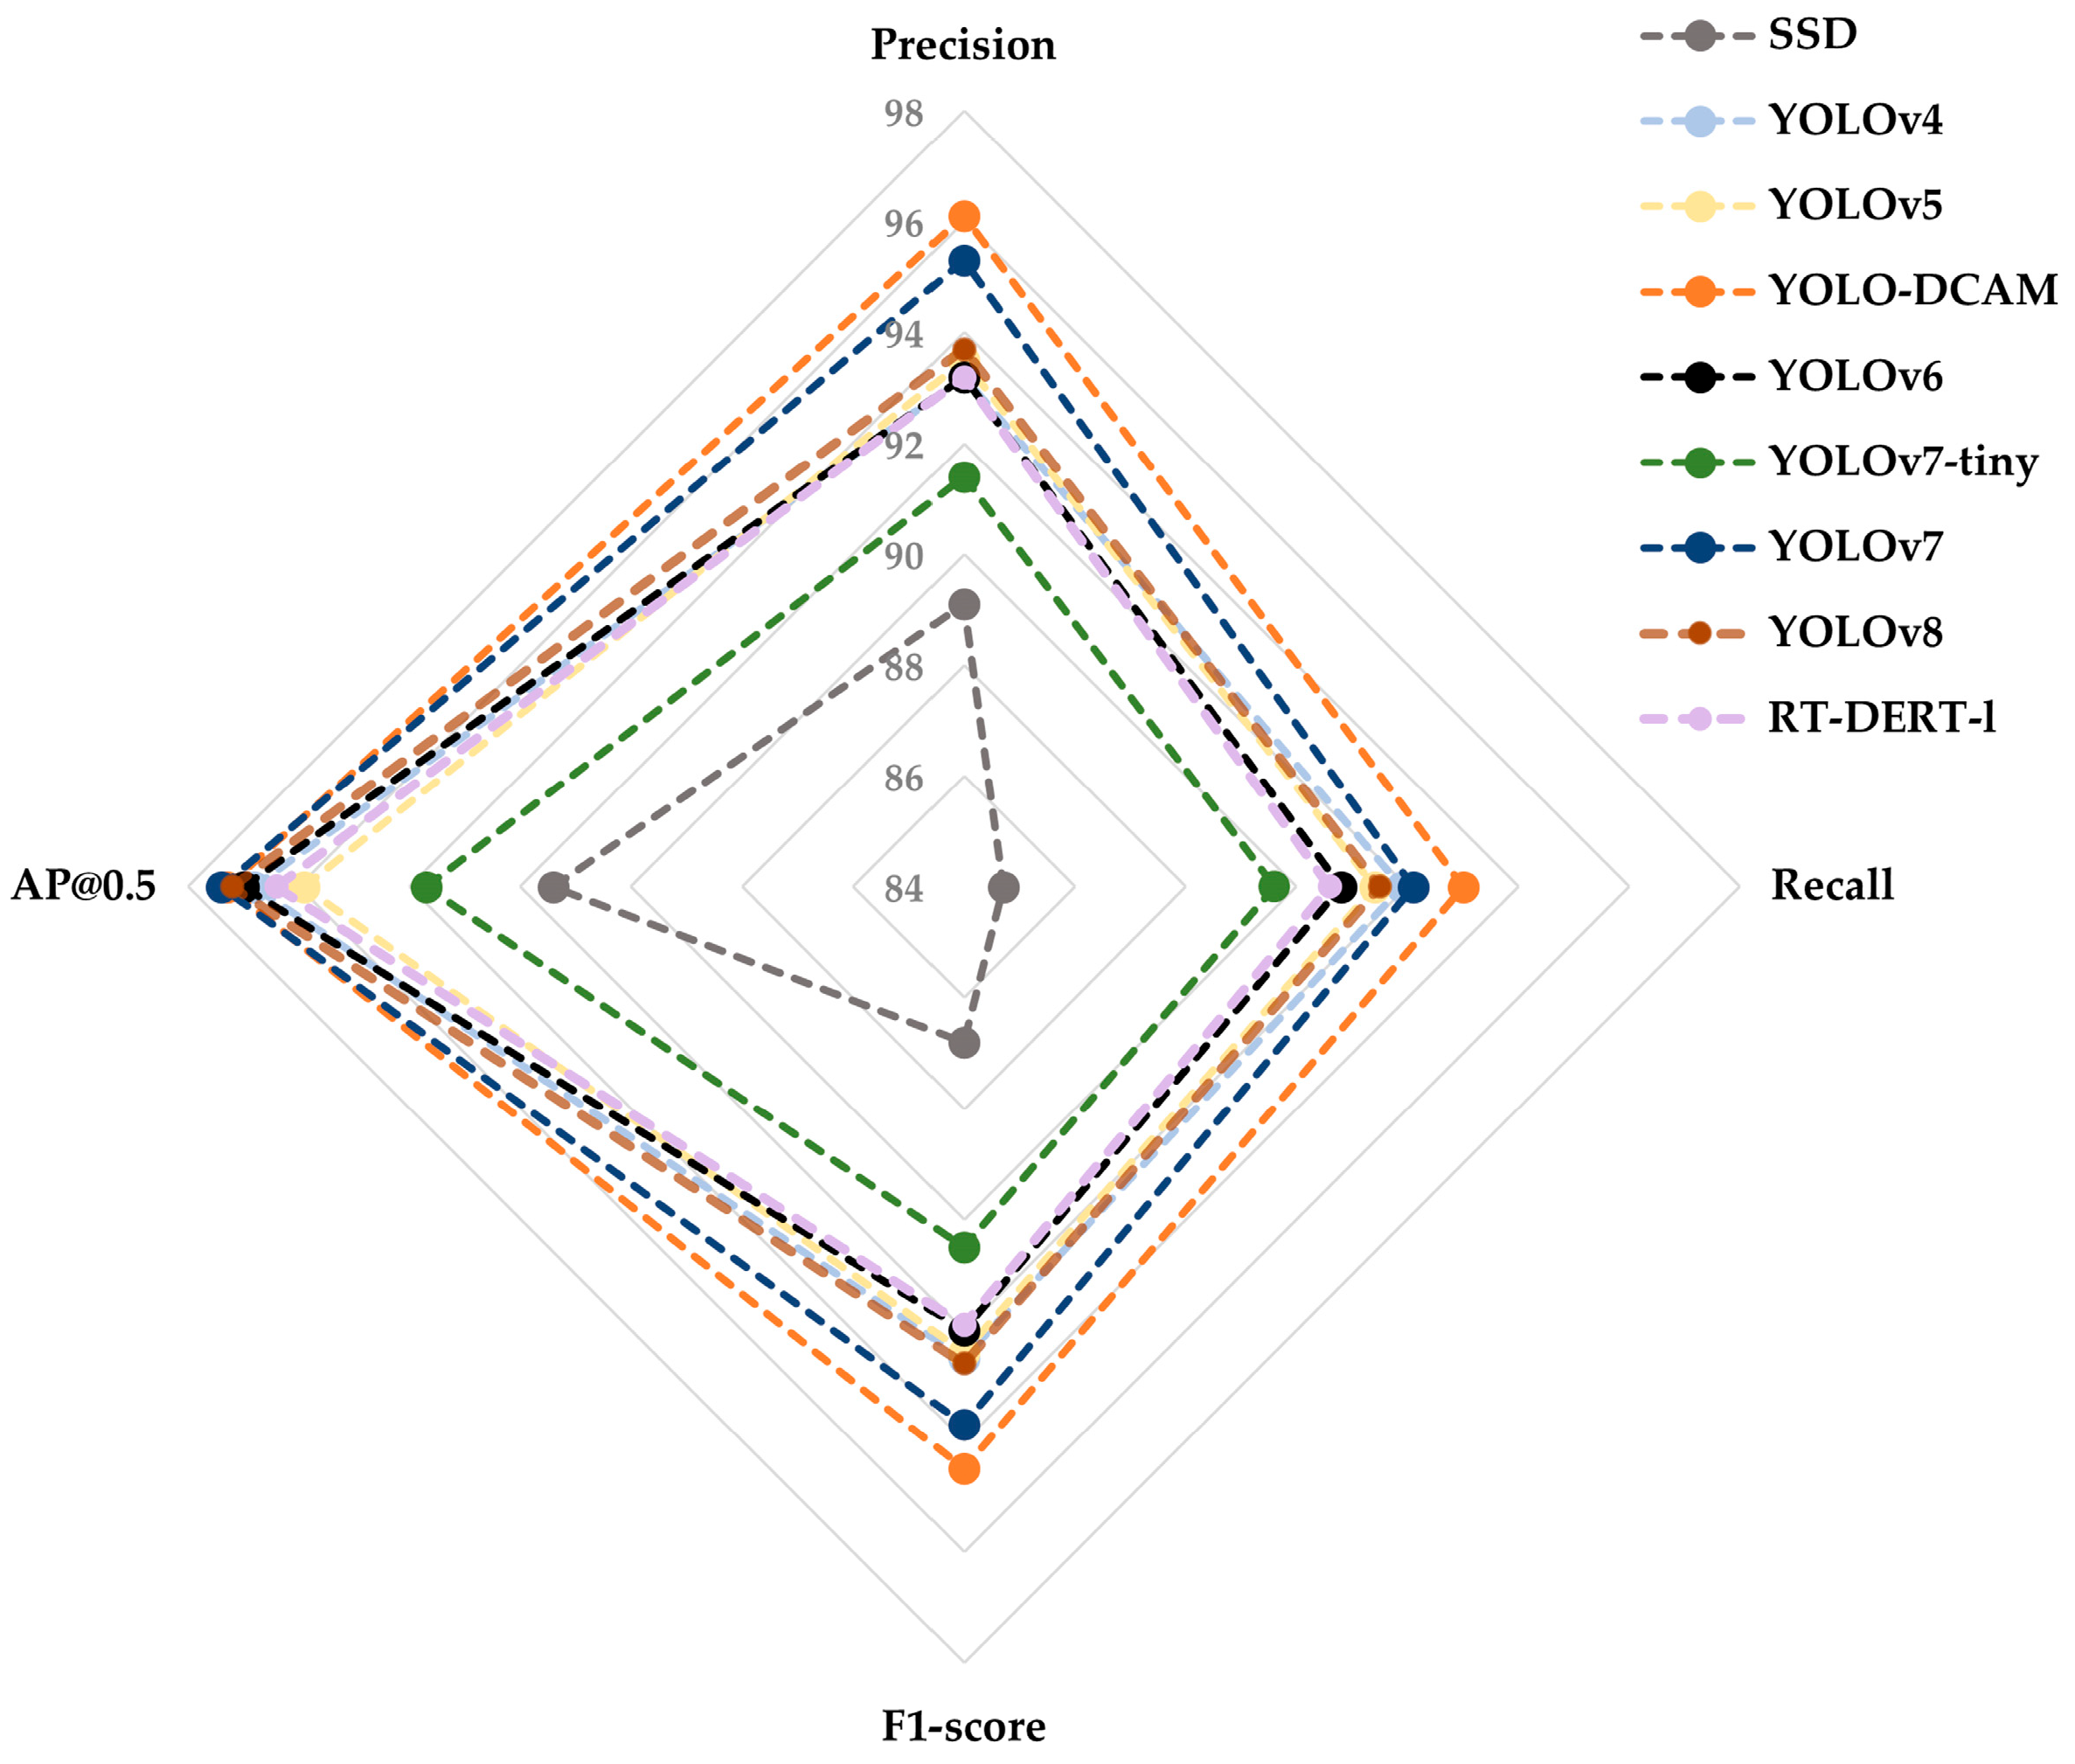
3.2. Comparison Experiments of Different Models

An insight into the performance of YOLO-DCAM, multi-model comparative tests were conducted with mainstream models. We aimed to achieve high-precision individual tree detection while striking a balance between model size and detection speed. Therefore, we did not include the two-stage model in the comparison model due to their high model complexity and computational resource requirements. The comparison models include SSD, YOLOv4, YOLOv5, YOLOv6, and the latest YOLOv7-tiny, YOLOv7, YOLOv8 and RT-DERT-l [46]. To ensure comparability in evaluating its effectiveness across different models, we employed identical training settings for the models mentioned above.
Table 3 and Figure 9 present the comparison results of multiple detection models, where precision, recall, the F1-score, [email protected], model size, and fps were selected as evaluation metrics. Precision, recall, F1-score, and [email protected] evaluate the model’s detection performance, while the model size and FPS indicate the model’s complexity and detection speed. The enhanced YOLOv5 demonstrates exceptional performance in comparative model experiments. Mainly, it achieves remarkable precision, recall, and F1-score values of 96.1%, 93.0%, and 94.5%, respectively, surpassing YOLOv5 and other state-of-the-art detection models. The [email protected] metric of YOLO-DCAM is 97.3%, which is slightly lower than the highest value but only 0.1% less than YOLOv7. It is worth noting that the model size of YOLO-DCAM is 14.8 MB, which is only 45.1% of the YOLOv6 model size and 65.7% of the YOLOv8 model size. For the fps metric, the improved YOLOv5 model has a nine-frame decrease compared to the YOLOv5 model and achieves only 71% of the detection speed of YOLOv8 and 62.4% of the detection speed of YOLOv6.
Although the introduction of the DCN module and  EMA module results in a slight increase in model size and a modest decrease in  detection speed, these changes lead to a significant improvement in the  detection accuracy of the model. Overall, YOLO-DCAM achieved the best results  in overall performance, with remarkable results in balancing accuracy, model  size, and detection speed.

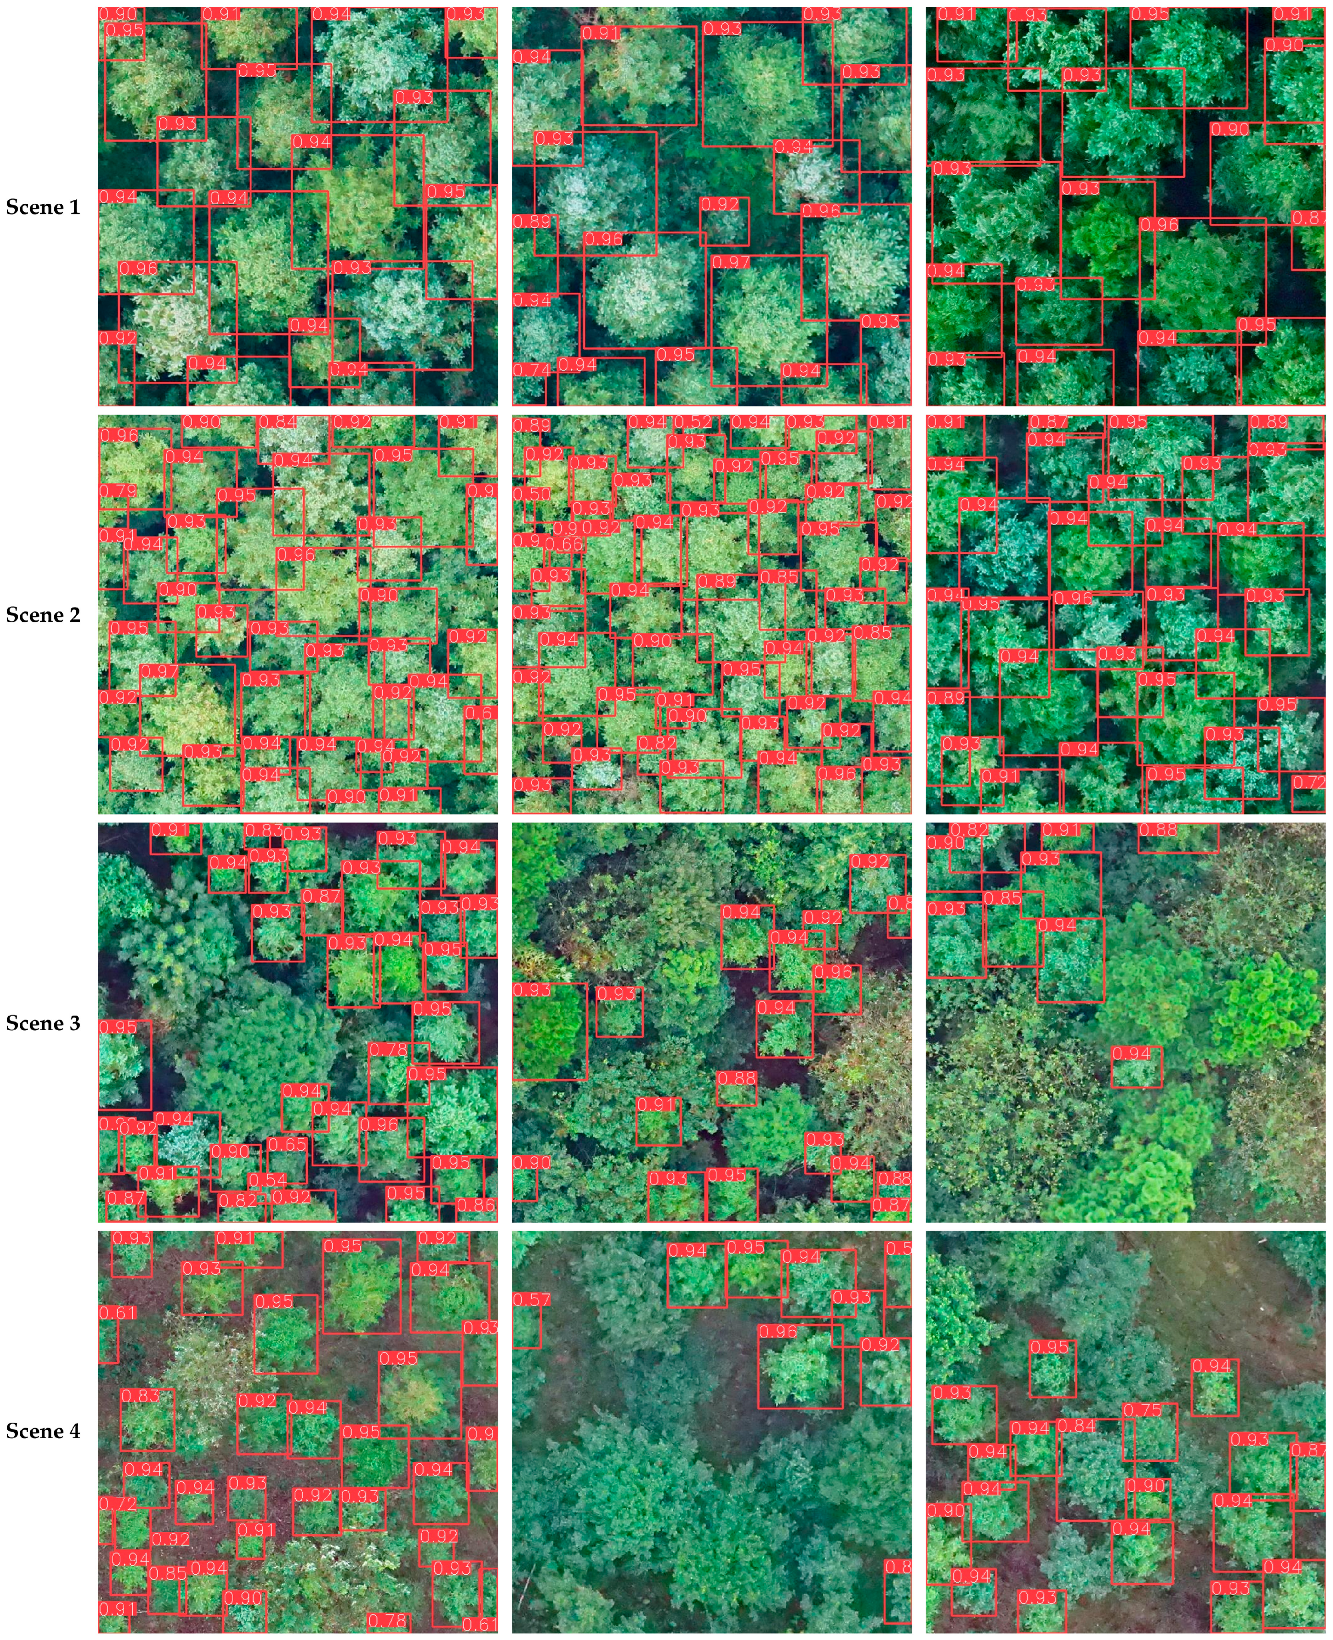
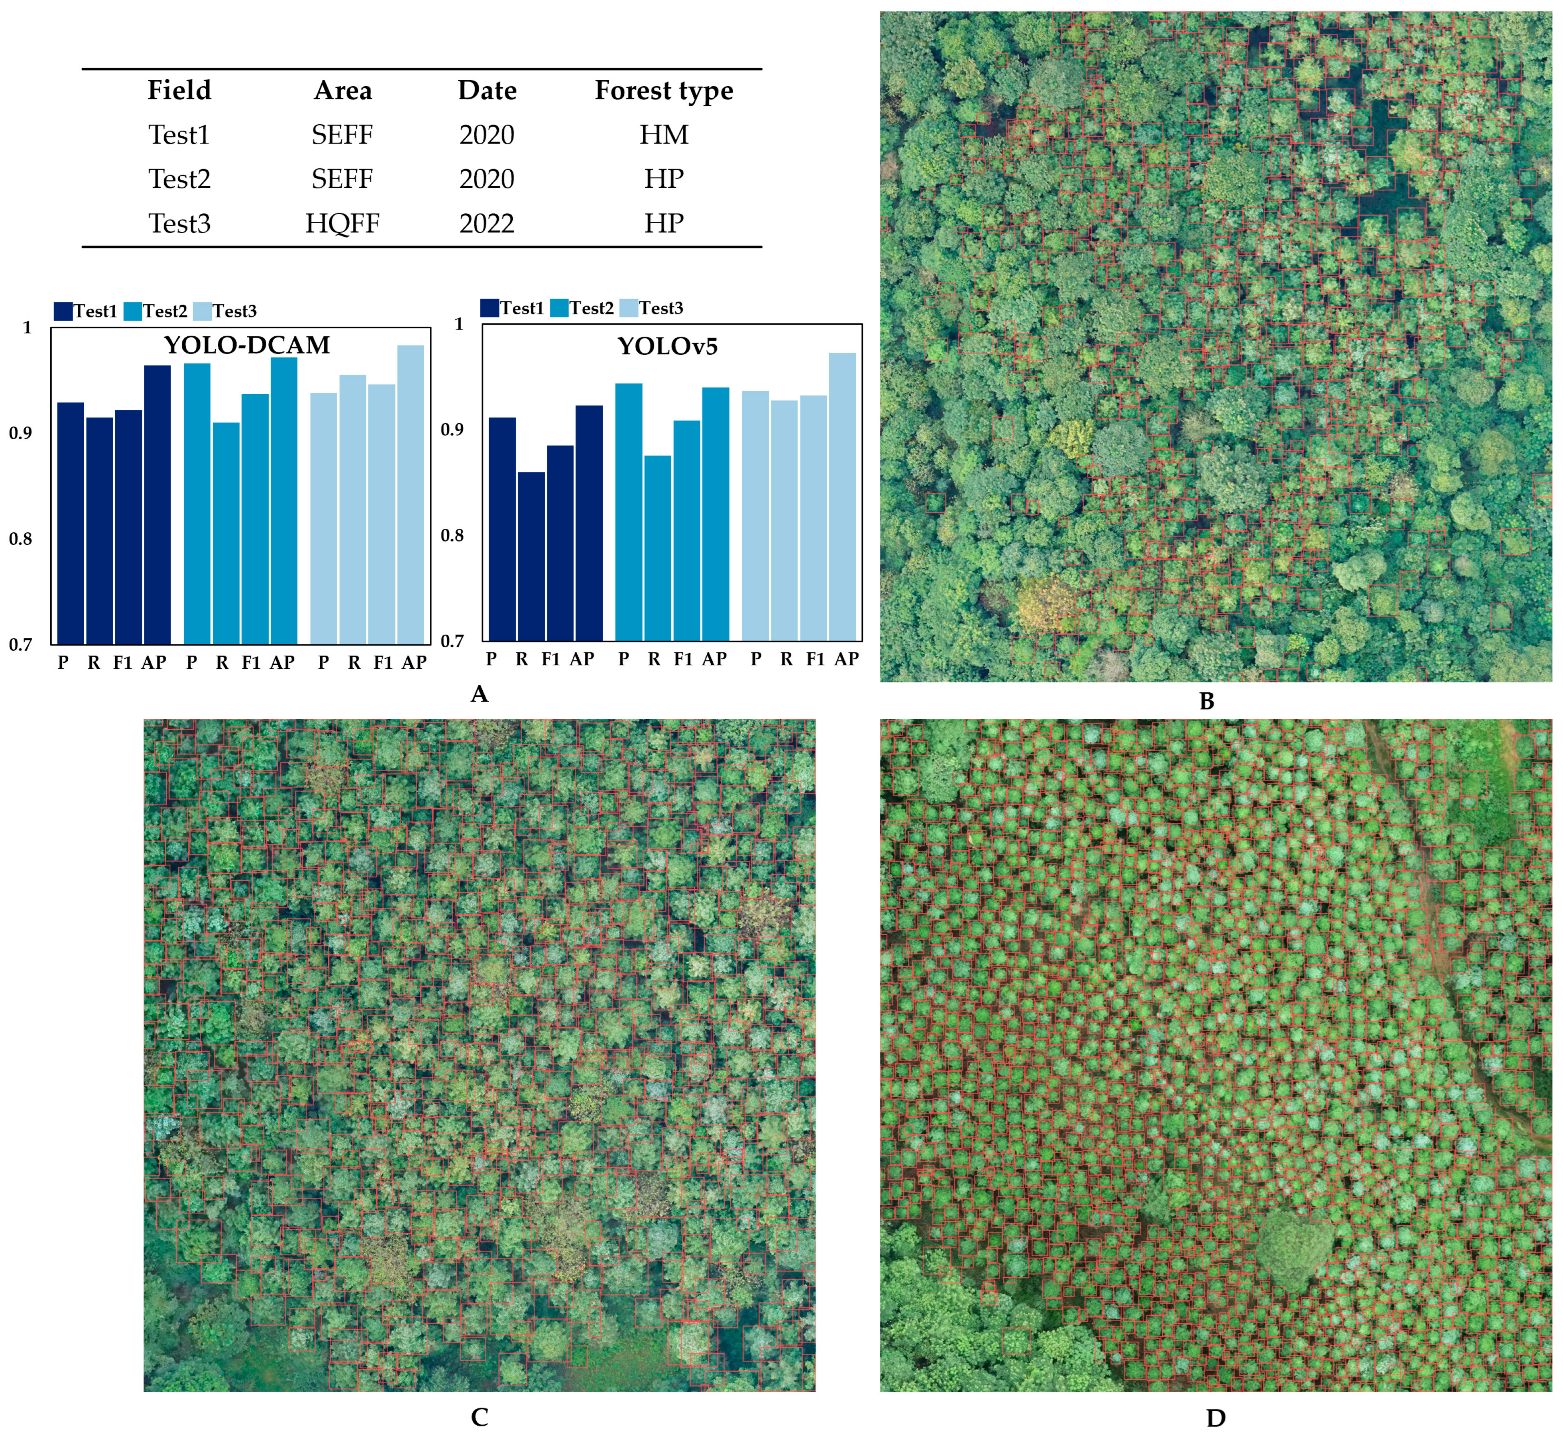
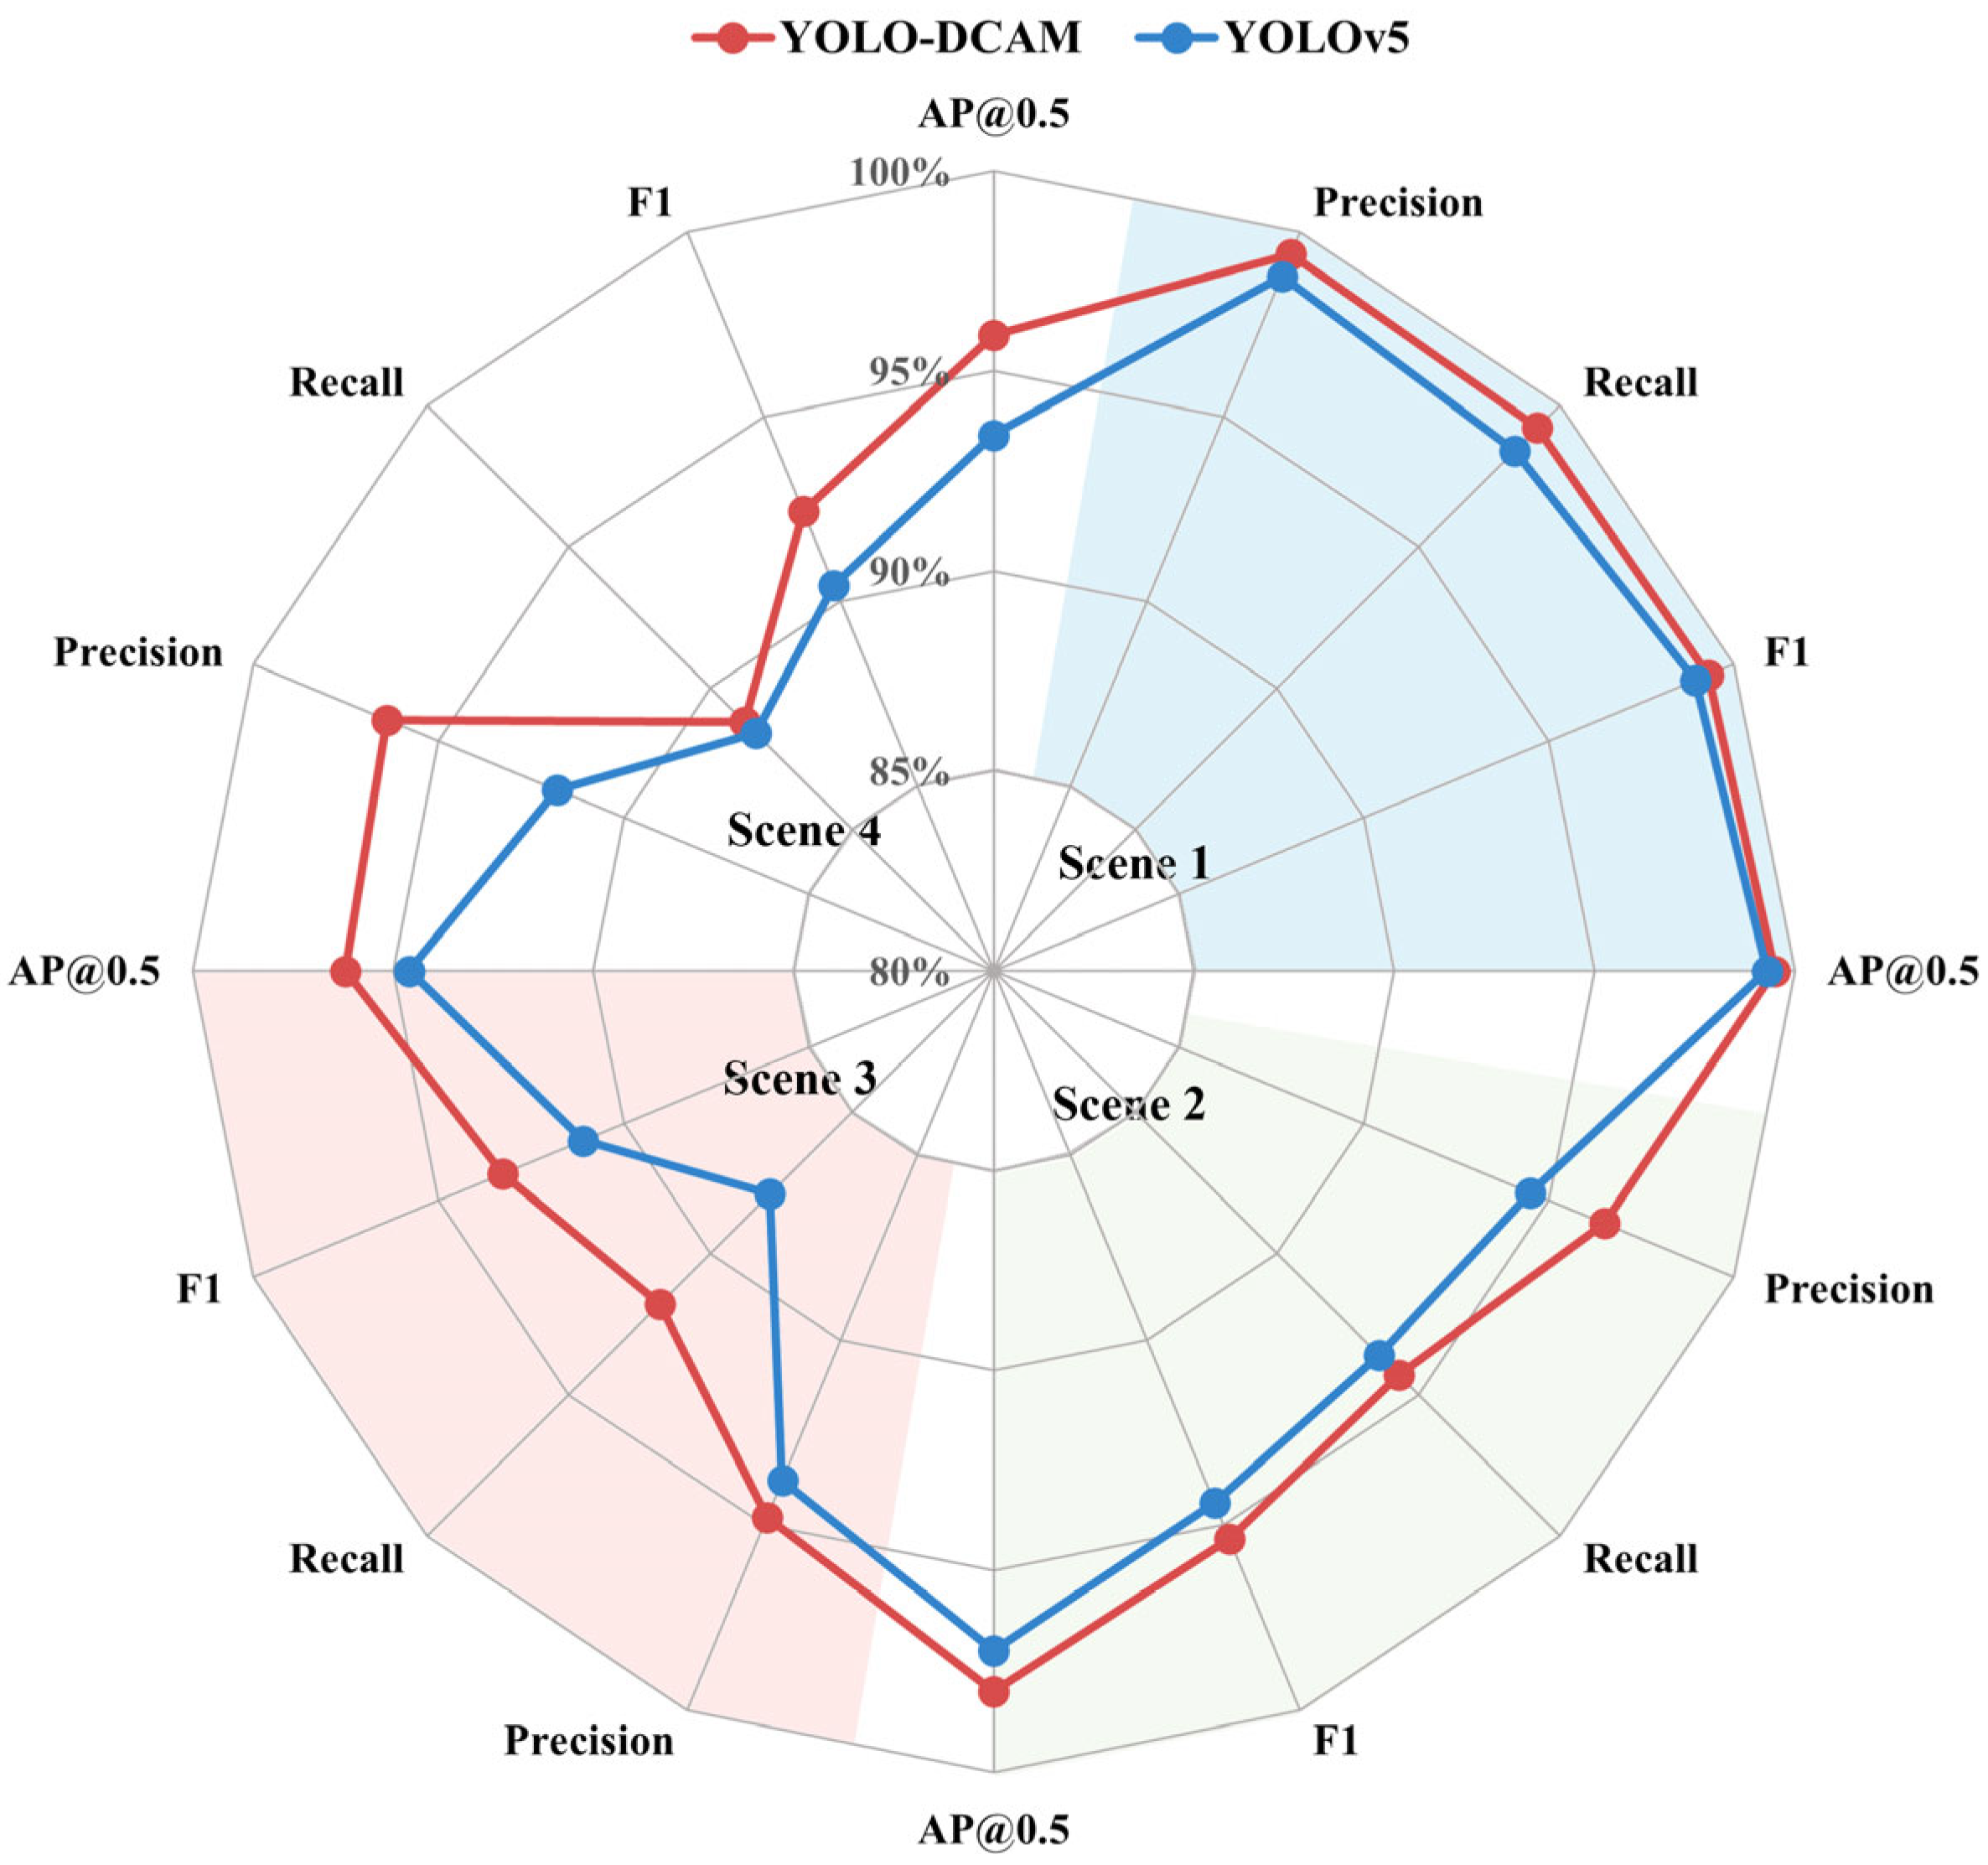
3.3. The Detection Result of YOLO-DCAM

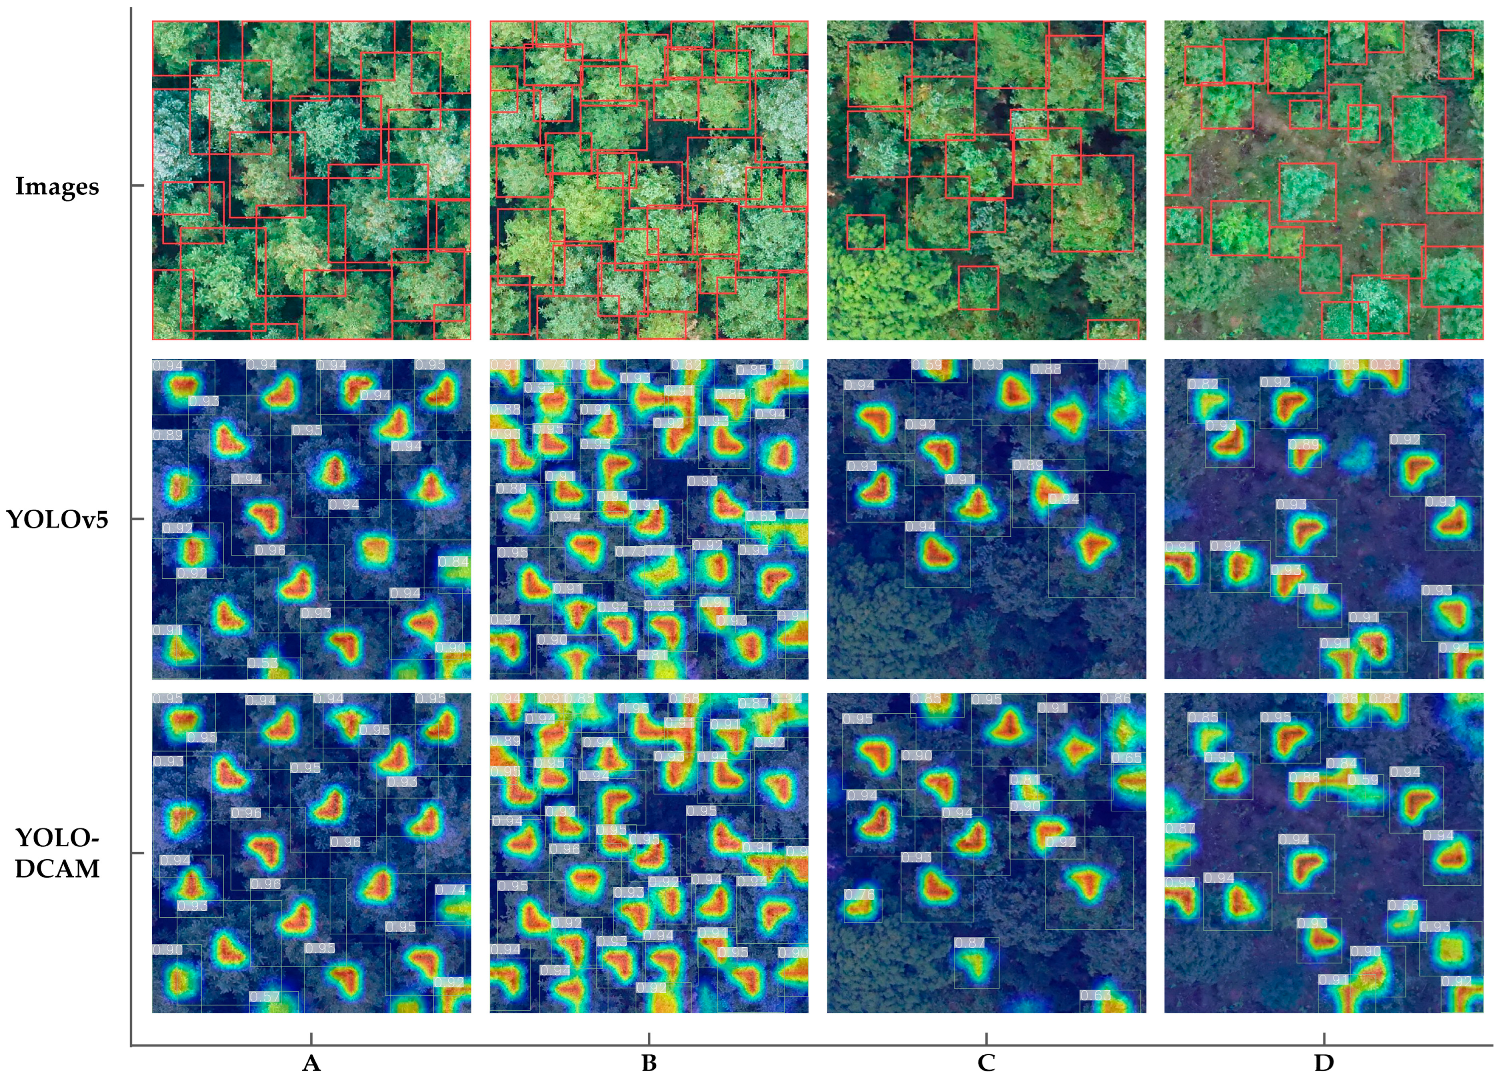
3.3.1. Visualized Detection Result of YOLO-DCAM

To intuitively assess the detection performances of individual Chinese fir trees across diverse environmental scenes, we utilized 640 × 640-pixel images from the test set comprising four scenes as the input for model inferencing. This process yielded the location, size, and confidence scores of the prediction-bounding boxes in each image. The initial reasoning results of the YOLO model encompassed numerous background-bounding boxes with low confidence levels. To offer clearer results, we retained only those bounding boxes with a confidence value greater than 0.5. Subsequently, these remaining detections were highlighted as red rectangular boxes overlaid on respective images, as illustrated in Figure 10. Remarkably, the proposed YOLO-ITD exhibits exceptional performance in accurately detecting individual trees within a diverse range of challenging planted forest environments.

3.3.2. Quantitative Detection Result of YOLO-DCAM

We utilized the test sets comprising four distinct planted forest scenes to calculate quantitative metrics, precision, recall, F1-score, and [email protected]. These results, as presented in Table 4 and Figure 11, were employed to evaluate the performance of YOLO-DCAM. As shown in Figure 11, all evaluation metrics of YOLO-DCAM outperformed those of the YOLOv5 model across different environmental scenarios. This substantiates the effectiveness of the YOLO-DCAM model in enhancing the detection performance of individual trees within diverse and complex planted forest environments.
Specifically, YOLO-DCAM achieves the highest detection performance in low-density pure Chinese fir forests (i.e., scene 1) with model evaluation metrics of precision (99.4%), recall (99.2%), F1-score (99.3%), and [email protected] (99.5%), respectively. The detection model demonstrates excellent performance, achieving near-complete and accurate detection. For the high-density pure Chinese fir forest (i.e., scene 2), the detection performance is lower than low-density pure forests. The precision achieved was 96.5%, with a recall of 94.3%, yielding an F1-score of 95.4% and an [email protected] of 98.0%. Within the mixed forest (i.e., scene 3), the model achieved a precision of 94.8%, a recall of 91.8%, an F1-score of 93.3%, and an [email protected] of 96.2%. Within Chinese fir forests with multi-species and bare ground as the background information, model detection performance was the worst among the four scenarios, presenting a precision of 96.4%, a recall of 88.8%, an F1-score of 92.4%, and an [email protected] of 95.9%. The overall precision of individual Chinese fir tree detection in four scenes was 96.1%, with the lowest and highest values of 94.8% and 99.4%, respectively. The overall recall rate was 93.0%, with the lowest and highest values of 88.8% and 99.2%, respectively. For the F1-score, the lowest F1-score was 92.4%, and the highest value was 99.3%, with an overall value of 94.5%. The [email protected] was higher than 95.9%, with the highest value of 99.5%.

3.3.3. Robustness Testing

Three supplementary subblocks of UAV RGB imagery, each approximately measuring 100 × 100 m, were used to enhance the evaluation of the model’s robustness. Test 1 and test 2 subblocks were obtained from SEFF. Geographically, their locations were randomly selected to avoid overlap with the region used to prepare the Chinese fir detection dataset, ensuring an unbiased evaluation of the model’s performance. Test 3 was collected from the Huangfengqiao Forest Farm (HQFF), Hunan Province, China (113°42′E, 27°20′N). Chinese fir stands as the dominant tree species in HQFF. The data collection took place in July 2022.
The YOLO-DCAM model consistently outperforms the YOLOv5 model across all three plots (refer to Figure 12). Specifically, YOLO-DCAM achieved the highest detection performance in test 3, with an F1-score of (94.7%) and [email protected] of (98.3%), respectively. Although the UAV image was collected from a different geographic region and year, YOLO-DCAM was still robust. Test 2 presents a precision of 96.6%, recall of 91.0%, F1-score of 93.7%, and [email protected] of 97.2%. For test 1, in the mixed forest with multiple tree species and dense canopy cover, YOLO-DCAM was able to accurately distinguish between non-target background tree species and Chinese fir, with a precision of 92.9%, a recall of 91.5%, an F1-score of 92.2%, and [email protected] of 96.24%. The proposed model effectively enhances both the precision and recall for Chinese fir detection, reducing false and missed detections. Overall, the YOLO-DCAM detection model demonstrates outstanding detection performance across a diverse range of complex plantation environments.

4. Discussion

4.1. YOLO-DCAM Network for Individual Chinese Fir Tree Detection

Mapping individual trees is a foundational task for forestry managers and scientists. Several studies have focused on achieving the accurate detection of individual trees. We compared accuracy metrics provided in similar ITD tasks to evaluate our model. Chen et al. [47] developed an improved K-means algorithm for detecting individual trees in Chinese fir plantations, covering canopy closures from low to high density. Their algorithm resulted in precision and recall rates of 78.48% and 83.72%, respectively, which are lower than the performance achieved by our method. Additionally, we achieved a higher F1-score (94.5%) than the result of Gan et al. [48] (F1-score: 57%). The latter performed ITD using the Detectree2 model in a temperate deciduous forest. On the other hand, Yu et al. [17] conducted a comparative experiment for individual Chinese fir detection using UAV imagery. The Mask R-CNN model yielded the best results, achieving an F1 score of 94.68%, which is comparable to our method. However, it is important to note that Yu’s study was conducted in a young Chinese fir plantation forest, where tree crowns were well-spaced and non-overlapping. In contrast, our experiment was conducted across a range of complex planted environments, including high density, overlapping tree crowns, and complex backgrounds.
The YOLO-DCAM model exhibits exceptional performance at identifying individual trees according to comprehensive experiment analysis. By incorporating a deformable convolution network, the sampling mode within the convolution operation is refined through the introduction of position offset variation. This innovative approach introduces spatial deformation to the feature map, enabling the self-adaptive adjustment of the sampling position based on the input feature content. This augmentation allows the network to effectively accommodate tree crowns of diverse shapes and sizes. As a result, the detection model can effectively capture detailed changes with the deformable receptive field, significantly enhancing its feature extraction capability. The impact of the deformable convolution network on the ITD in this paper is similar to the conclusions of object detection tasks in the literature [49,50]. Furthermore, the integration of the attention mechanism enables the network to dynamically adjust feature weights across different areas, thus enhancing the network’s focus on target features [51]. The fusion of the EMA module enhances its ability to capture local information and global long-distance dependencies, enabling the model to focus selectively on relevant target features while inhibiting irrelevant features and reducing the interference of complex background information. This refinement of attention enhances the accurate capture of intricate tree crowns and ultimately improves the monitoring capacity of forests at the tree level.

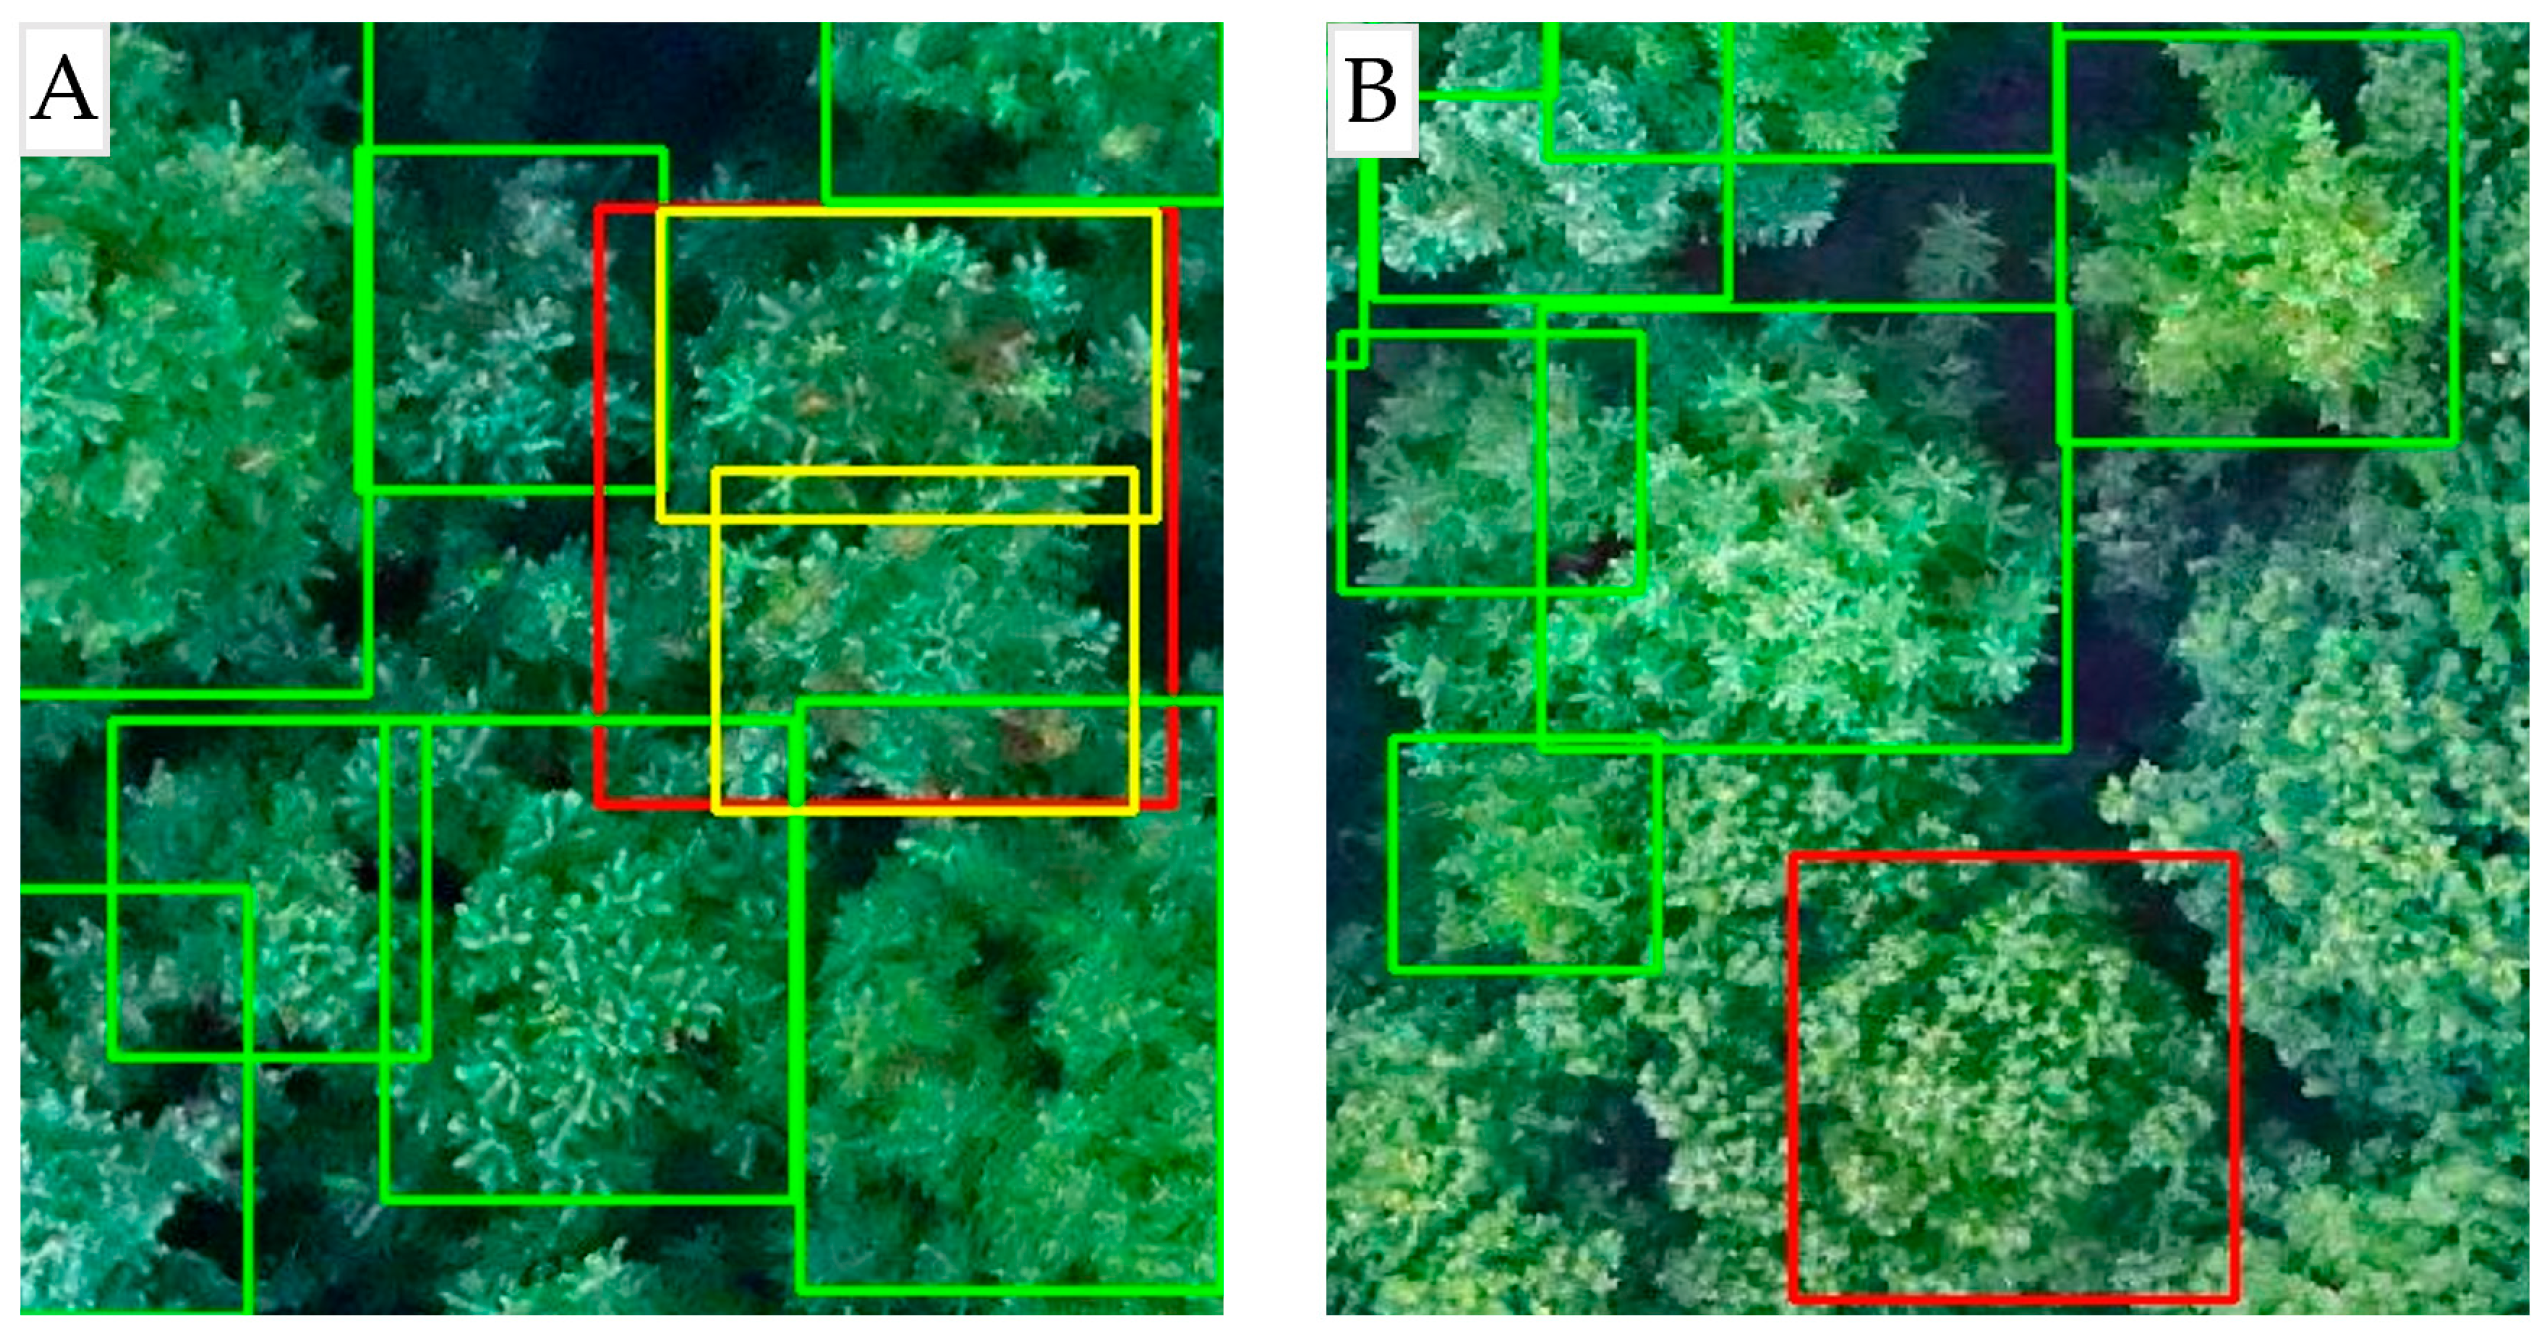
4.2. False and Missed Examination Analysis of Individual Tree Detection

In our research, we conducted a study that focused on detecting individual Chinese fir trees across four distinct plantation environments. Our findings revealed that the most accurate detection performance was observed in the low-density pure forest scene in contrast to the forest scene characterized by high density and a complex background. In this particular setting, nearly all individual trees were successfully and completely detected, aligning with conclusions drawn from prior studies [52,53]. Within the low-density pure forest scenario, the semantic features present in the tree crowns were relatively simple, with distinct and clear boundaries between individual trees, enabling the model to adeptly accommodate its features, resulting in more accurate detection. By contrast, the detection performance in other forest scenarios decreased, mainly due to the following reasons:
(1)
Tree crown overlap. Within the high-density forest scene, continuous tree crown coverage leads to significant overlap and occlusion among individual trees. Although this model can identify most individual trees in the high-density environment, it still tends to interpret partially and heavily overlapping multiple tree crowns as a single tree crown entity, leading to missed detection, as illustrated in Figure 13A.
(2)
Background information interference. For the mixed forest scene, these non-object tree species share similar visual characteristics with object trees, creating challenges in distinguishing the semantic characteristics between them. This similarity often leads to false detection, as depicted in Figure 13B.
Figure 13. Examples of missed and false detection of individual trees in complex scenes. (A) The misidentification of multiple tree crowns as a single tree crown. (B) The misidentification of non-target tree species as target trees. Green rectangles represent correct identification. Red rectangles represent false results. Yellow rectangles represent missed detection.
Remotesensing 16 00335 g013

4.3. Potential Uncertainty

Deep learning models are extensively employed for ITD tasks, as they can autonomously learn feature representations directly from raw data, eliminating the process of manual feature design and extraction. In our experiments, we initially trained the YOLO model using a dataset containing labeled instances of individual Chinese fir trees across various planted forest scenes. Subsequently, this trained model is deployed for ITD, showcasing exceptional performance. However, forest environments like tropical rainforests are far more complex than experimental pure and mixed forests, featuring multiple tree species, a nearly closed canopy, and a multi-layered forest structure, among other characteristics. Therefore, we face the challenge of working with a limited sample dataset that might not adequately encompass the complexity of forest environments. Although promising experimental results have been achieved in detecting individual trees in Chinese fir-planted forests, the applicability of our approach to other tree species in pure forests and mixed forests remains to be determined. Another challenge faced is the model’s robustness. The dataset employed to train the model for detecting individual Chinese fir trees was restricted to a specific temporal and weather condition. Consequently, the model’s robustness in detecting individual trees within UAV images of varying temporal resolutions and weather conditions remains incompletely tested. In addition, during the sample labeling process, even with the utilization of multi-person verification methods to minimize deviations, it was inevitable that the tree crown might not be accurately framed due to the challenges of image resolution, blurred crown boundaries, and subjectivity. This limitation could result in a slight deviation in the IoU value between the prediction and label, leading to error detection and missed detection.

4.4. Further Work

To further advance our research, we intend to collect a more diverse and extensive range of scenario data, incorporating multiple temporal and weather conditions. This approach systematically assesses the generalization capabilities of the YOLO-DCAM network, enhancing its adaptability to various complex environments. While our work focused on detecting one-class tree species, the real-world scenario often involves the coexistence of multiple tree species. Next, we broaden our scope by considering the detection and identification of multiple tree species simultaneously. In addition, it is essential to acknowledge that relying solely on UAV RGB imagery as the input data for the detection model restricts us from extracting spectral and textural features while neglecting crucial spatial information about the forest. This limitation could lead to a deterioration in the performance of ITD. As mentioned above, although active remote sensing (e.g., Light Detection and Ranging) offers detailed three-dimensional spatial information, they are burdened with high costs and intricate data processing procedures. In recent years, the leverage of UAV photogrammetry technology to generate point clouds [54] has been regarded as a cost-effective solution for acquiring spatial information. Integrating the spatial information derived from the photogrammetric point cloud with the optical information provided by UAV imagery obtains more comprehensive features [55], potentially enhancing the model’s understanding and recognition of the forest environment and improving the performance of ITD.

5. Conclusions

This study focuses on the accurate detection of individual trees within Chinese fir-planted forests, utilizing UAV-based RGB imagery. To address the challenges caused by complex forest environments, a new tree-level detection network, YOLO-DCAM, is introduced. Specifically, YOLO-DCAM leverages the deformable convolution module to replace the conventional CSP module in the YOLOv5 backbone and embed the efficient multi-scale module into the neck, which can effectively enhance this network’s capability of extracting features and heighten focus on target information. In comparative evaluations with other prominent detection models, YOLO-DCAM exhibits superior detection performance, achieving remarkable accuracy metrics, including precision of 96.1%, recall of 93.0%, F1 score of 94.5%, and [email protected] of 97.3%. Moreover, this heightened performance is accomplished while effectively managing model size and model complexity metrics. The robustness of YOLO-DCAM was reaffirmed through the testing results obtained from three supplementary plots. In summary, this method can emerge as a precise, cost-effective, and highly adaptable solution for ITD and support tree-level information monitoring.

Author Contributions

Conceptualization, J.W. and H.Z. (Huaiqing Zhang).; methodology, J.W.; software, J.W. and Y.L.; validation, J.W.; formal analysis, J.W.; investigation, H.Z. (Huacong Zhang); resources, J.W.; data curation, J.W.; writing—original draft preparation, J.W.; writing—review and editing, J.W. and H.Z. (Huaiqing Zhang); visualization, J.W. and D.Z.; supervision, J.W.; project administration, H.Z. (Huaiqing Zhang); funding acquisition, H.Z. (Huaiqing Zhang). All authors have read and agreed to the published version of the manuscript.

Funding

This research was funded by the National Key Research and Development Program of China, grant number 2022YFE0128100, the National Natural Science Foundation of China, grant number 32071681, 32271877, and the Foundation Research Funds of IFRIT, grant number CAFYBB2023PA003.

Data Availability Statement

The data used are confidential.

Acknowledgments

We are grateful to Jiangping Long, Central South University of Forestry and Technology, for providing supplementary data of the Huangfengqiao Forest Farm.

Conflicts of Interest

The authors declare no conflicts of interest.

References

  1. FAO. The State of the World’s Forests 2022: Forest Pathways for Green Recovery and Building Inclusive, Resilient and Sustainable Economies; FAO: Rome, Italy, 2022. [Google Scholar] [CrossRef]
  2. Bukoski, J.J.; Cook-Patton, S.C.; Melikov, C.; Ban, H.; Chen, J.L.; Goldman, E.D.; Harris, N.L.; Potts, M.D. Rates and drivers of aboveground carbon accumulation in global monoculture plantation forests. Nat. Commun. 2022, 13, 4206. [Google Scholar] [CrossRef] [PubMed]
  3. Smyth, M.-A. Plantation forestry: Carbon and climate impacts. Land Use Policy 2023, 130, 106677. [Google Scholar] [CrossRef]
  4. Payn, T.; Carnus, J.-M.; Freer-Smith, P.; Kimberley, M.; Kollert, W.; Liu, S.; Orazio, C.; Rodriguez, L.; Silva, L.N.; Wingfield, M.J. Changes in planted forests and future global implications. For. Ecol. Manag. 2015, 352, 57–67. [Google Scholar] [CrossRef]
  5. Zhou, P.; Sun, Z.; Zhang, X.; Wang, Y. A framework for precisely thinning planning in a managed pure Chinese fir forest based on UAV remote sensing. Sci. Total Environ. 2023, 860, 160482. [Google Scholar] [CrossRef]
  6. Pearse, G.D.; Tan, A.Y.S.; Watt, M.S.; Franz, M.O.; Dash, J.P. Detecting and mapping tree seedlings in UAV imagery using convolutional neural networks and field-verified data. ISPRS J. Photogramm. Remote Sens. 2020, 168, 156–169. [Google Scholar] [CrossRef]
  7. Guerra-Hernández, J.; Cosenza, D.N.; Rodriguez, L.C.E.; Silva, M.; Tomé, M.; Díaz-Varela, R.A.; González-Ferreiro, E. Comparison of ALS- and UAV(SfM)-derived high-density point clouds for individual tree detection in Eucalyptus plantations. Int. J. Remote Sens. 2018, 39, 5211–5235. [Google Scholar] [CrossRef]
  8. Fu, H.; Li, H.; Dong, Y.; Xu, F.; Chen, F. Segmenting individual tree from TLS point clouds using improved DBSCAN. Forests 2022, 13, 566. [Google Scholar] [CrossRef]
  9. Lindberg, E.; Holmgren, J. Individual tree crown methods for 3d data from remote sensing. Curr. For. Rep. 2017, 3, 19–31. [Google Scholar] [CrossRef]
  10. Puliti, S.; Astrup, R. Automatic detection of snow breakage at single tree level using YOLOv5 applied to UAV imagery. Int. J. Appl. Earth Obs. Geoinf. 2022, 112, 102946. [Google Scholar] [CrossRef]
  11. Wagner, F.H.; Ferreira, M.P.; Sanchez, A.; Hirye, M.C.M.; Zortea, M.; Gloor, E.; Phillips, O.L.; de Souza Filho, C.R.; Shimabukuro, Y.E.; Aragão, L.E.O.C. Individual tree crown delineation in a highly diverse tropical forest using very high resolution satellite images. ISPRS J. Photogramm. Remote Sens. 2018, 145, 362–377. [Google Scholar] [CrossRef]
  12. Xu, X.; Zhou, Z.; Tang, Y.; Qu, Y. Individual tree crown detection from high spatial resolution imagery using a revised local maximum filtering. Remote Sens. Environ. 2021, 258, 112397. [Google Scholar] [CrossRef]
  13. Qin, H.; Zhou, W.; Yao, Y.; Wang, W. Individual tree segmentation and tree species classification in subtropical broadleaf forests using UAV-based lidar, hyperspectral, and ultrahigh-resolution RGB data. Remote Sens. Environ. 2022, 280, 113143. [Google Scholar] [CrossRef]
  14. Gu, J.; Congalton, R.G. Individual tree crown delineation from UAS imagery based on region growing by over-segments with a competitive mechanism. IEEE Trans. Geosci. Remote Sens. 2022, 60, 1–11. [Google Scholar] [CrossRef]
  15. Wang, Y.; Zhu, X.; Wu, B. Automatic detection of individual oil palm trees from UAV images using HOG features and an SVM classifier. Int. J. Remote Sens. 2018, 40, 7356–7370. [Google Scholar] [CrossRef]
  16. LeCun, Y.; Bengio, Y.; Hinton, G. Deep learning. Nature 2015, 521, 436–444. [Google Scholar] [CrossRef] [PubMed]
  17. Yu, K.; Hao, Z.; Post, C.J.; Mikhailova, E.A.; Lin, L.; Zhao, G.; Tian, S.; Liu, J. Comparison of classical methods and Mask R-CNN for automatic tree detection and mapping using UAV imagery. Remote Sens. 2022, 14, 295. [Google Scholar] [CrossRef]
  18. Dai, J.; Li, Y.; He, K.; Sun, J. R-fcn: Object detection via region-based fully convolutional networks. arXiv 2016. [Google Scholar] [CrossRef]
  19. Ren, S.; He, K.; Girshick, R.; Sun, J. Faster R-CNN: Towards real-time object detection with region proposal networks. arXiv 2015. [Google Scholar] [CrossRef]
  20. Liu, W.; Anguelov, D.; Erhan, D.; Szegedy, C.; Reed, S.; Fu, C.-Y.; Berg, A.C. Ssd: Single shot multibox detector. In Proceedings of the Computer Vision–ECCV 2016: 14th European Conference, Amsterdam, The Netherlands, 11–14 October 2016; Proceedings, Part I 14, 2016. pp. 21–37. [Google Scholar] [CrossRef]
  21. Redmon, J.; Divvala, S.; Girshick, R.; Farhadi, A. You only look once: Unified, real-time object detection. In Proceedings of the IEEE Conference on Computer Vision and Pattern Recognition, Las Vegas, NV, USA, 27–30 June 2016; pp. 779–788. [Google Scholar] [CrossRef]
  22. Santos, A.A.D.; Marcato Junior, J.; Araújo, M.S.; Di Martini, D.R.; Tetila, E.C.; Siqueira, H.L.; Aoki, C.; Eltner, A.; Matsubara, E.T.; Pistori, H.; et al. Assessment of CNN-based methods for individual tree detection on images captured by RGB cameras attached to UAVs. Sensors 2019, 19, 3595. [Google Scholar] [CrossRef]
  23. Sun, Y.; Li, Z.; He, H.; Guo, L.; Zhang, X.; Xin, Q. Counting trees in a subtropical mega city using the instance segmentation method. Int. J. Appl. Earth Obs. Geoinf. 2022, 106, 102662. [Google Scholar] [CrossRef]
  24. Mo, J.; Lan, Y.; Yang, D.; Wen, F.; Qiu, H.; Chen, X.; Deng, X. Deep learning-based instance segmentation method of Litchi canopy from UAV-acquired images. Remote Sens. 2021, 13, 3919. [Google Scholar] [CrossRef]
  25. Jiang, P.Y.; Ergu, D.; Liu, F.Y.; Cai, Y.; Ma, B. A review of yolo algorithm developments. In Proceedings of the 8th International Conference on Information Technology and Quantitative Management (ITQM)—Developing Global Digital Economy after COVID-19, Chengdu, China, 9–11 July 2021; pp. 1066–1073. [Google Scholar] [CrossRef]
  26. Redmon, J.; Farhadi, A. YOLO9000: Better, faster, stronger. In Proceedings of the IEEE Conference on Computer Vision and Pattern Recognition (CVPR), Honolulu, HI, USA, 21–26 July 2017; pp. 6517–6525. [Google Scholar] [CrossRef]
  27. Redmon, J.; Farhadi, A. Yolov3: An incremental improvement. arXiv 2018, arXiv:1804.02767. [Google Scholar] [CrossRef]
  28. Bochkovskiy, A.; Wang, C.-Y.; Liao, H.-Y.M. YOLOv4: Optimal speed and accuracy of object detection. arXiv 2020, arXiv:1804.02767. [Google Scholar] [CrossRef]
  29. Ultralytics. YOLOv5. Available online: https://github.com/ultralytics/yolov5 (accessed on 4 March 2023).
  30. Li, C.; Li, L.; Jiang, H.; Weng, K.; Geng, Y.; Li, L.; Ke, Z.; Li, Q.; Cheng, M.; Nie, W.; et al. YOLOv6: A single-stage object detection framework for industrial applications. arXiv 2022, arXiv:2209.02976. [Google Scholar] [CrossRef]
  31. Wang, C.-Y.; Bochkovskiy, A.; Liao, H.-Y.M. YOLOv7: Trainable bag-of-freebies sets new state-of-the-art for real-time object detectors 2022. arXiv 2022, arXiv:2207.02696. [Google Scholar] [CrossRef]
  32. Lou, X.W.; Huang, Y.X.; Fang, L.M.; Huang, S.Q.; Gao, H.L.; Yang, L.B.; Weng, Y.H.; Hung, I.K.U. Measuring loblolly pine crowns with drone imagery through deep learning. J. For. Res. 2022, 33, 227–238. [Google Scholar] [CrossRef]
  33. Chen, Y.; Xu, H.; Zhang, X.; Gao, P.; Xu, Z.; Huang, X. An object detection method for bayberry trees based on an improved YOLO algorithm. Int. J. Digit. Earth 2023, 16, 781–805. [Google Scholar] [CrossRef]
  34. Dong, C.; Cai, C.; Chen, S.; Xu, H.; Yang, L.; Ji, J.; Huang, S.; Hung, I.-K.; Weng, Y.; Lou, X. Crown width extraction of Metasequoia Glyptostroboides using improved YOLOv7 based on UAV images. Drones 2023, 7, 336. [Google Scholar] [CrossRef]
  35. Wardana, D.P.T.; Sianturi, R.S.; Fatwa, R. Detection of oil palm trees using deep learning method with high-resolution aerial image data. In Proceedings of the 8th International Conference on Sustainable Information Engineering and Technology, Bali, Indonesia, 24–25 October 2023; ACM: Bali, Indonesia, 2023; pp. 90–98. [Google Scholar] [CrossRef]
  36. Xue, Z.; Lin, H.; Wang, F. A small target forest fire detection model based on YOLOv5 improvement. Forests 2022, 13, 1332. [Google Scholar] [CrossRef]
  37. Qin, B.; Sun, F.; Shen, W.; Dong, B.; Ma, S.; Huo, X.; Lan, P. Deep learning-based pine nematode trees’ identification using multispectral and visible UAV imagery. Drones 2023, 7, 183. [Google Scholar] [CrossRef]
  38. Moharram, D.; Yuan, X.; Li, D. Tree seedlings detection and counting using a deep learning algorithm. Appl. Sci. 2023, 13, 895. [Google Scholar] [CrossRef]
  39. Jintasuttisak, T.; Edirisinghe, E.; Elbattay, A. Deep neural network based date palm tree detection in drone imagery. Comput. Electron. Agric. 2022, 192, 106560. [Google Scholar] [CrossRef]
  40. Zhao, H.; Morgenroth, J.; Pearse, G.; Schindler, J. A systematic review of individual tree crown detection and delineation with convolutional neural networks (cnn). Curr. For. Rep. 2023, 9, 149–170. [Google Scholar] [CrossRef]
  41. Li, X.; Duan, A.; Zhang, J. Long-term effects of planting density and site quality on timber assortment structure based on a 41-year plantation trial of Chinese fir. Trees For. People 2023, 12, 100396. [Google Scholar] [CrossRef]
  42. Wang, C.Y.; Mark Liao, H.Y.; Wu, Y.H.; Chen, P.Y.; Hsieh, J.W.; Yeh, I.H. CSPNet: A new backbone that can enhance learning capability of cnn. In Proceedings of the IEEE Conference on Computer Vision and Pattern Recognition (CVPR 2020), Washington, DC, USA, 14–19 June 2020; pp. 390–391. [Google Scholar] [CrossRef]
  43. Wang, K.; Liew, J.H.; Zou, Y.; Zhou, D.; Feng, J. Panet: Few-shot image semantic segmentation with prototype alignment. In Proceedings of the IEEE International Conference on Computer Vision (ICCV 2019), Seoul, Republic of Korea, 20–26 October 2019; pp. 9197–9206. [Google Scholar] [CrossRef]
  44. Zhu, X.; Hu, H.; Lin, S.; Dai, J. Deformable convnets v2: More deformable, better results. In Proceedings of the IEEE Conference on Computer Vision and Pattern Recognition, Long Beach, CA, USA, 16–20 June 2019; pp. 9308–9316. [Google Scholar] [CrossRef]
  45. Ouyang, D.; He, S.; Zhang, G.; Luo, M.; Guo, H.; Zhan, J.; Huang, Z. Efficient multi-scale attention module with cross-spatial learning. In Proceedings of the ICASSP 2023 IEEE International Conference on Acoustics, Speech and Signal Processing (ICASSP), Rhodes Island, Greece, 4–9 June 2023; IEEE: Rhodes Island, Greece, 2023; pp. 1–5. [Google Scholar] [CrossRef]
  46. Lv, W.; Xu, S.; Zhao, Y.; Wang, G.; Wei, J.; Cui, C.; Du, Y.; Dang, Q.; Liu, Y. Detrs beat yolos on real-time object detection. arXiv 2023, arXiv:2304.08069. [Google Scholar] [CrossRef]
  47. Chen, X.; Yu, K.; Yu, S.; Hu, Z.; Tan, H.; Chen, Y.; Huang, X.; Liu, J. Study on single-tree segmentation of Chinese fir plantations using coupled local maximum and height-weighted improved k-means algorithm. Forests 2023, 14, 2130. [Google Scholar] [CrossRef]
  48. Gan, Y.; Wang, Q.; Iio, A. Tree crown detection and delineation in a temperate deciduous forest from UAV RGB imagery using deep learning approaches: Effects of spatial resolution and species characteristics. Remote Sens. 2023, 15, 778. [Google Scholar] [CrossRef]
  49. Zhao, S.; Zhang, S.; Lu, J.; Wang, H.; Feng, Y.; Shi, C.; Li, D.; Zhao, R. A lightweight dead fish detection method based on deformable convolution and YOLOV4. Comput. Electron. Agric. 2022, 198, 107098. [Google Scholar] [CrossRef]
  50. Li, Y.; Zhu, W.; Li, C.; Zeng, C. SAR image near-shore ship target detection method in complex background. Int. J. Remote Sens. 2023, 44, 924–952. [Google Scholar] [CrossRef]
  51. Niu, Z.; Zhong, G.; Yu, H. A review on the attention mechanism of deep learning. Neurocomputing 2021, 452, 48–62. [Google Scholar] [CrossRef]
  52. Beloiu, M.; Heinzmann, L.; Rehush, N.; Gessler, A.; Griess, V.C. Individual tree-crown detection and species identification in heterogeneous forests using aerial rgb imagery and deep learning. Remote Sens. 2023, 15, 1463. [Google Scholar] [CrossRef]
  53. Vauhkonen, J.; Ene, L.; Gupta, S.; Heinzel, J.; Holmgren, J.; Pitkanen, J.; Solberg, S.; Wang, Y.; Weinacker, H.; Hauglin, K.M.; et al. Comparative testing of single-tree detection algorithms under different types of forest. Forestry 2012, 85, 27–40. [Google Scholar] [CrossRef]
  54. Rosnell, T.; Honkavaara, E. Point cloud generation from aerial image data acquired by a quadrocopter type micro unmanned aerial vehicle and a digital still camera. Sensors 2012, 12, 453–480. [Google Scholar] [CrossRef]
  55. Li, L.; Mu, X.; Chianucci, F.; Qi, J.; Jiang, J.; Zhou, J.; Chen, L.; Huang, H.; Yan, G.; Liu, S. Ultrahigh-resolution boreal forest canopy mapping: Combining UAV imagery and photogrammetric point clouds in a deep-learning-based approach. Int. J. Appl. Earth Obs. Geoinf. 2022, 107, 102686. [Google Scholar] [CrossRef]
Figure 1. Workflow of detecting individual trees using UAV imagery and object detector.
Remotesensing 16 00335 g001
Figure 2. (A,B) Location of SEFF study area. (C) The DOM of the study area captured using UAV; the polygonal region with pink dotted borders represents sites used to create the dataset. (ae) Exemplary images of multiple forest environment scenes. These five images do not correspond to the five sites in (C). (A) The site in (C) may contain multiple cases of (ae).
Remotesensing 16 00335 g002
Figure 3. (A) I h and I w represent the height and width of the image, respectively. A h and A w correspond to the height and width of the anchor box within the image; P = (x, y) is the center coordinate of the anchor box. (B) The statistical information of annotated individual trees, including scatter plots for (x, y), (x, width), (x, height), (y, width), (y, height), and (width, height). Darker colors indicate higher frequency values at locations. In addition, statistical histograms for x, y, width, and height are depicted. x and y refer to the relative coordinates of the anchor box’s center point within the image, ranging from 0 to 1; height and width represent the proportion of the tree crown anchor box relative to the image, ranging from 0 to 1.
Remotesensing 16 00335 g003
Figure 4. The architecture of the YOLO-DCAM network.
Remotesensing 16 00335 g004
Figure 5. (A) Diagram of the deformable convolution operation process. (B) The comparative outputs of the deformable convolution and standard convolution; (a) the standard convolution operation; (bd) examples of deformable convolution operation. (C) Architectures of CSP_DCN and Bottleneck_DCN. F i n represents the feature map before the operation process; F o u t represents the feature map after the operation process.
Remotesensing 16 00335 g005
Figure 6. The architecture of efficient multi-scale attention.
Remotesensing 16 00335 g006
Figure 7. The changing values of loss, precision, F1-score, and [email protected] on the validation set throughout the epochs during the training process.
Remotesensing 16 00335 g007
Figure 8. Heat map visualization for comparative analysis of partial detection results between YOLOv5 and YOLO-DCAM networks, utilizing Grad-CAM methodology. Grad-CAM is a technique that visually interprets model decisions, revealing the model’s focus area within images and the intensity of its focus. The red area indicates the region identified by the model as Chinese fir, where increased color intensity corresponds to higher confidence levels in the identification of the target as the Chinese fir. The images in the first row depict the original image used for testing and its corresponding ground truth. A, B, C, and D correspond to scenes 1, 2, 3, and 4, respectively.
Remotesensing 16 00335 g008
Figure 9. Radar chart depicting a comparison of multiple models.
Remotesensing 16 00335 g009
Figure 10. The visualized detection results of YOLO-DCAM.
Remotesensing 16 00335 g010
Figure 11. The comparison results of YOLO-DCAM under four distinct planted forest scenes.
Remotesensing 16 00335 g011
Figure 12. (A) The fundamental plot information along with the quantitative detection results of the model. HM: high-density mixed forest; HP: high-density pure forest. P, R, F1, and AP represent precision, recall, F1-score, and [email protected], respectively. (BD) Visual detection outcomes of YOLO-DCAM in three test plots, corresponding to test 1, test 2, and test 3, respectively.
Remotesensing 16 00335 g012
Table 1. Data characteristics of the individual Chinese fir tree detection dataset.
DatasetCanopy
Density
Tree
Species
Ratio of Non-Target Tree SpeciesImage
Number
Chinese Fir
Instance
Description
Scene 10.55–0.70Single-class<2%1382501Pure Chinese fir forest with low density and uniform distribution. Corresponds to Figure 2a.
Scene 20.70–0.95Single-class<5%3108091Pure Chinese fir forest with high density, clustered, or random distribution. Corresponds to Figure 2b,c.
Scene 30.65–0.90Multi-class45%2844288Mixed forest and non-target tree species can be viewed as background information. Corresponds to Figure 2d.
Scene 40.45–0.65Multi-class30%2465559Low density and random distribution Chinese fir forest with multiple tree species and bare ground as background information. Corresponds to Figure 2e.
Table 2. Comparison results between the improved YOLOv5 and YOLOv5.
Basic NetworkPrecisionRecallF1-Score[email protected]
YOLOv593.591.492.495.9
YOLOv5 + DCN94.092.093.096.5
YOLOv5 + EMA94.691.292.996.3
YOLOv5 + DCN + EMA96.193.094.597.3
Table 3. Comparative experimental results for different detection models.
NetworkPrecisionRecallF1-Score[email protected]Model Size (MB)FPS
SSD89.184.786.891.490.528
YOLOv493.291.992.596.8100.644
YOLOv593.591.492.495.914.462
YOLO-DCAM96.193.094.597.314.853
YOLOv693.290.892.097.032.885
YOLOv7-tiny91.489.690.593.712.368
YOLOv795.392.193.797.474.847
YOLOv893.791.592.697.222.574
RT-DERT-l93.290.691.996.466.180
Table 4. Statistics of YOLO-DCAM performance for diverse planted forest environments calculated based on the test dataset.
ClassesPrecisionRecallF1-Score[email protected]
All96.193.094.597.3
Scene 199.499.299.399.5
Scene 296.594.395.498.0
Scene 394.891.893.396.2
Scene 496.488.892.495.9
Disclaimer/Publisher’s Note: The statements, opinions and data contained in all publications are solely those of the individual author(s) and contributor(s) and not of MDPI and/or the editor(s). MDPI and/or the editor(s) disclaim responsibility for any injury to people or property resulting from any ideas, methods, instructions or products referred to in the content.

