Abstract
Reservoirs are essential hydraulic facilities for water resource allocation in Xinjiang. Since the 1950s, many reservoirs have been constructed for oasis water resource utilization in Xinjiang, enhancing the storage capacity of water resources. There are a few intact and open reservoir archives containing both geolocations and hydraulic attributes, such as the reservoir completion year, which can facilitate our understanding of the correlation between hydraulic engineering and oasis expansion. This paper mapped all the reservoirs of Xinjiang using Sentinel-2 MSI images from 2022. It associated their attributes with the reservoir’s extent, such as the capacity, area, complete year, altitude, etc., by consulting historical almanac data to establish a full elemental dataset with both geographic and attribute information. Furthermore, the spatial variability and historical process of the reservoirs were discussed against geomorphic information and oasis evolution. The results showed that 804 reservoirs were mapped cumulatively in Xinjiang up to 2022, and 1960–1980 and 2005–2010 are the rapidly developed periods. The construction history of the reservoirs indicates that reservoirs’ locations have the spatial tendency to shift from being in oasis plain areas to mountainous areas, and the newly built reservoirs showed a trend of miniaturization in area and maximization in volume.
1. Introduction
Reservoirs along rivers are essential hydraulic infrastructures that regulate the water flow and improve the water resource utilization efficiency. The reservoirs migrate and redistribute the water resources through water release or impoundment, and they have various purposes, such as flood control, agricultural irrigation, municipal water supply, and hydroelectric generation [1,2,3]. Since the 1950s, the prosperity of oasis agriculture and economic development have driven a boom in the construction of hydraulic engineering facilities in Xinjiang, including reservoirs, dams, hydropower stations, and canals. In the water shortage areas of Xinjiang, reservoir regulation and storage is the primary approach to alleviating the water pressure caused by the uneven spatial and temporal distribution of the surface water resources [4]. However, reservoir construction poses the risk of hydrologic cycle changes [5], increasing the drought events downstream [6], ecological degradation, and biodiversity loss [7,8]. Mass reservoir impoundment in the upper reaches of rivers has led to a runoff decrease [9,10,11,12], water quality deterioration [13], wetland degradation [14], and riparian vegetation reduction [15] in the middle and lower reaches. And this is obvious in the Tarim River basin, where farmland expansion has occurred in the upper and middle reaches due to the construction of reservoirs and irrigated channels, while subsequent riparian forest degradation has spread out the middle and lower reaches due to water shortages [16]. Therefore, it is crucial to understand the spatial location, abundance, and area of the reservoirs to allocate and utilize water resources effectively, supporting the development of a local strategy for ecological conversation and the sustainable use of water resources.
Various global and regional reservoir products are online to the public [3,17,18,19,20,21,22,23]. However, few provide both spatial locations and the necessary attribute information. For example, the World Register of Dams (WRD) (https://www.icold-cigb.org/, accessed on 26 October 2023) dataset provides more than 40 attributes (e.g., reservoir storage capacity, dam height, and reservoir purpose), but the dam and reservoirs are, unfortunately, either not georeferenced or inaccessible to the public. Likewise, the Xinjiang Hydraulic Engineering archives provide detailed information on the reservoirs, including their location, purpose, basin area, storage capacity, and water level data, but these records are not spatially visualized. Up to the present, there are no public intact reservoir datasets for Xinjiang, and it is essential to develop a reservoir dataset with both spatial locations and hydraulic attributes by combing high remote sensing images and local hydraulic archives.
Optical remote sensing has significant advantages over conventional ground-based observations in large-scale, long-time-series water monitoring [24], providing the spatial extents and distributions of reservoirs. Many scholars have developed various reservoir datasets at the global or national scale based on remote sensing technologies. The Global Water System Project released the Global Reservoir and Dam Database (GRanD), which contains 6862 records of reservoirs with detailed attribute data [3]. The GOODD (GlObal geOreferenced Database of Dams) is a comprehensive global georeferenced database containing more than 38,000 reservoirs as well as their associated catchments, derived from Landsat (15 m), IKONOS (<1 m), and SPOT (2.5 m) images [18]. GeoDAR (Georeferenced Global Dams and Reservoirs) georeferenced the dam points listed in the WRD and GRnD using 21,515 reservoir polygons retrieved from high-resolution water masks, assisting in associating the GeoDAR spatial features with the WRD attribute information [22]. Donchyts et al. [19] monitored the state of small- (10–100 ha) to medium-sized (>100 ha, excluding 479 large ones) reservoirs globally using GEE and about 80 million satellite images in nearly 35 years. Song et al. [21] developed the China Reservoir Dataset (CRD), which contains 97,435 reservoir polygons and fundamental attribute information based on remote sensing mapping and the existing reservoir products or official statistics. Furthermore, reservoirs are also parts of global lake products. Based on high-resolution satellite imagery, Verpoorter C. et al. [25] proposed a GLOWABO (GLObal WAter BOdies) product, which contains about 27 million water bodies more prominent than 0.01 km2. Feng et al. [26] used 30 m Landsat and SRTM elevation data to produce the Global Inland Water (GIW) dataset for 2000. However, these global lake databases do not differentiate reservoirs from lakes and other water bodies, and few offer specialized statistics on reservoir information. The current reservoir products also omit small reservoirs less than 1 hectare, which are abundant in Xinjiang. Therefore, higher-resolution satellite images and high-accuracy mapping methods are essential for reservoir mapping.
Remote sensing technologies are also feasible for quantifying reservoir changes globally and over time. The multiple databases, including global monthly surface area and time-series water area curves, are provided using millions of Landsat satellite images from 1984 to 2015 [20,23,27,28,29]. Zhao et al. [30] developed a novel algorithm to automatically repair the contaminated water classification images and generated a dataset containing the time-series changes in 6817 global reservoirs. In Xinjiang, the built year and operating status of reservoirs are critical for evaluating farmland expansion and its ecological impacts. However, reservoirs are artificial facilities operated regularly, and their seasonal changes are usually periodic, consistent with river runoff and agricultural water use, and these changes are also obvious and significant. Therefore, time-series satellites images within a year are necessary to obtain basic hydrological parameters such as the maximum area and operation rules.
In this paper, we developed a scheme to map the processes of reservoir construction in Xinjiang by combining two types of data sources to produce a spatial dataset of reservoirs with detailed attributes. We also compared the reservoir product with the existing reservoir databases and briefly analyzed the spatial and temporal reservoir changes.
2. Materials and Methods
2.1. Study Area
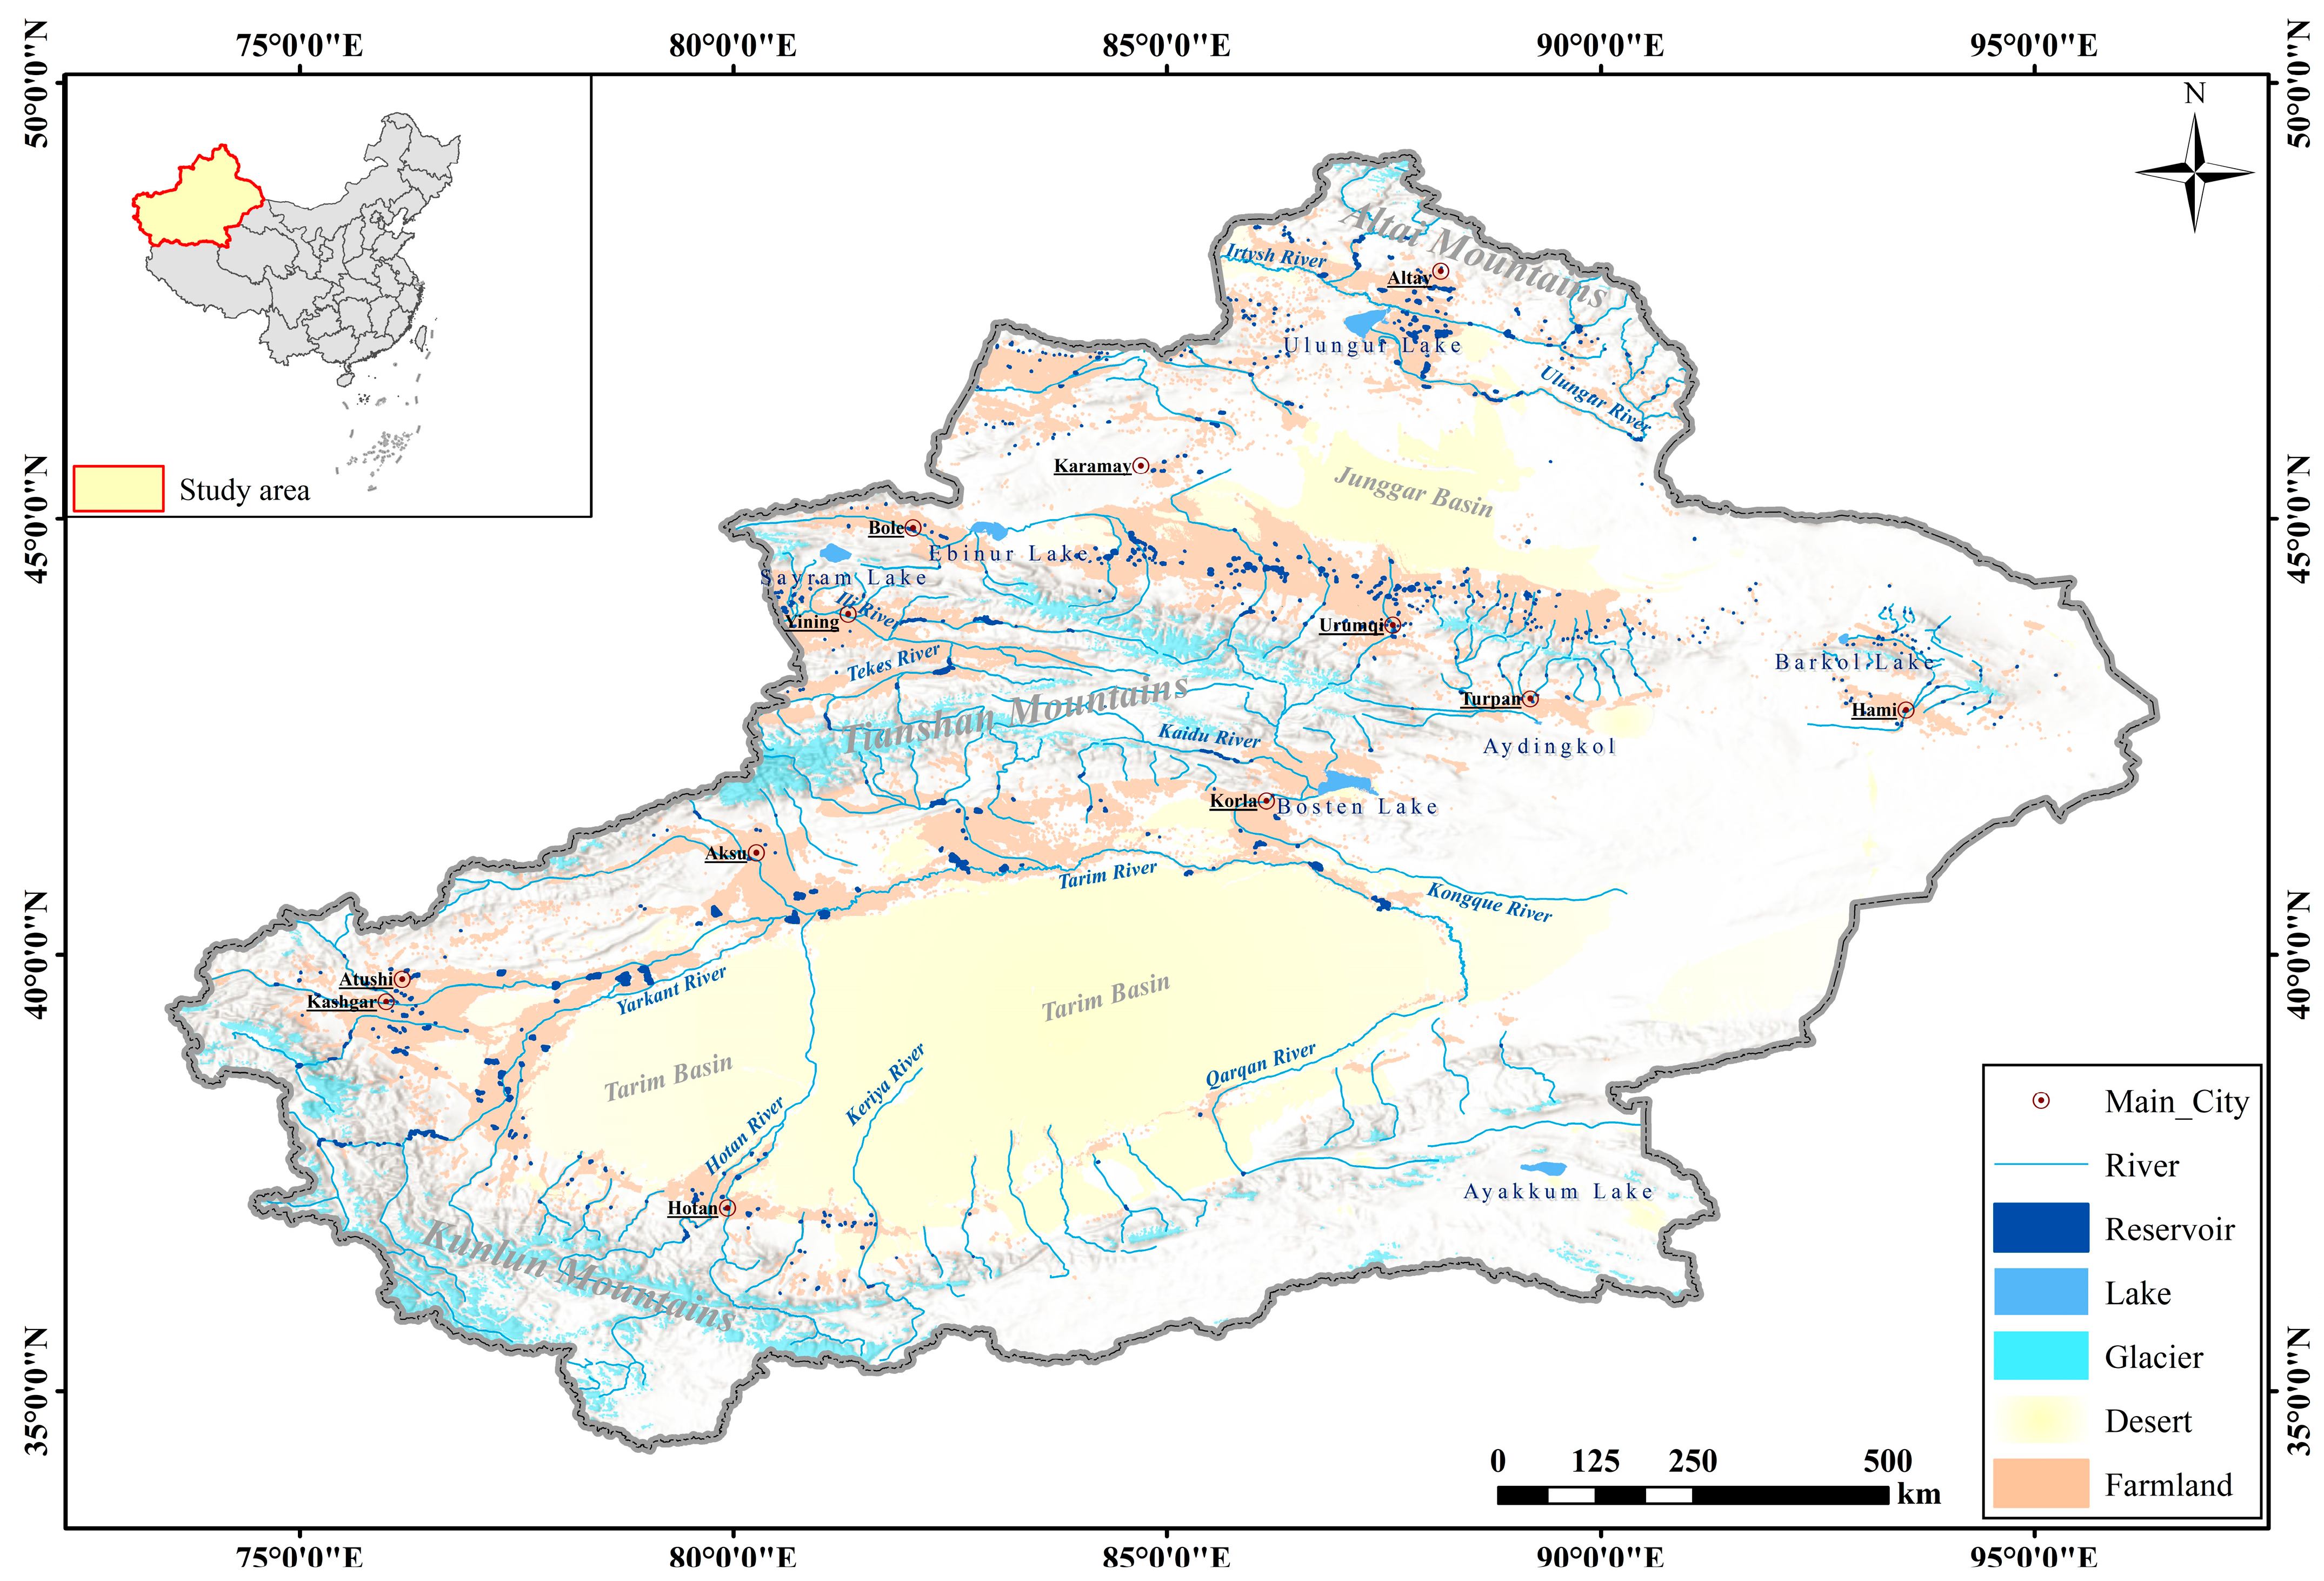
Xinjiang is a typical arid region in the northwest of China (73°40′~96°23′E, 34°25′~49°10′N), and it has a typical continental arid climate with intense evaporation and scarce precipitation [31]. Drought, desertification, and water scarcity are the main factors restricting the economic development of Xinjiang. The melting snow and glacier water in the alpine areas in Xinjiang are essential water resources, and about 570 rivers run across from the mountainous areas to the oasis and desert areas, with a total runoff of 75.96 billion m3 [32]. Due to the uneven spatial and temporal distributions, the limited surface water resources are reallocated for farmland irrigation by building dams and reservoirs on the rivers (Figure 1). Reservoirs ensure the water supply and security downstream by storing surplus water during the wet season and releasing water during the dry season. In recent decades, reservoirs have played an essential role in balancing agricultural development and ecological reservation.
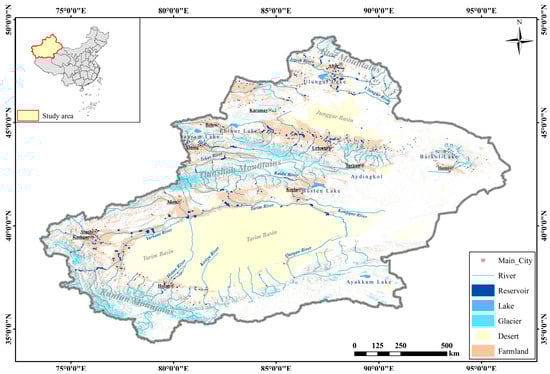
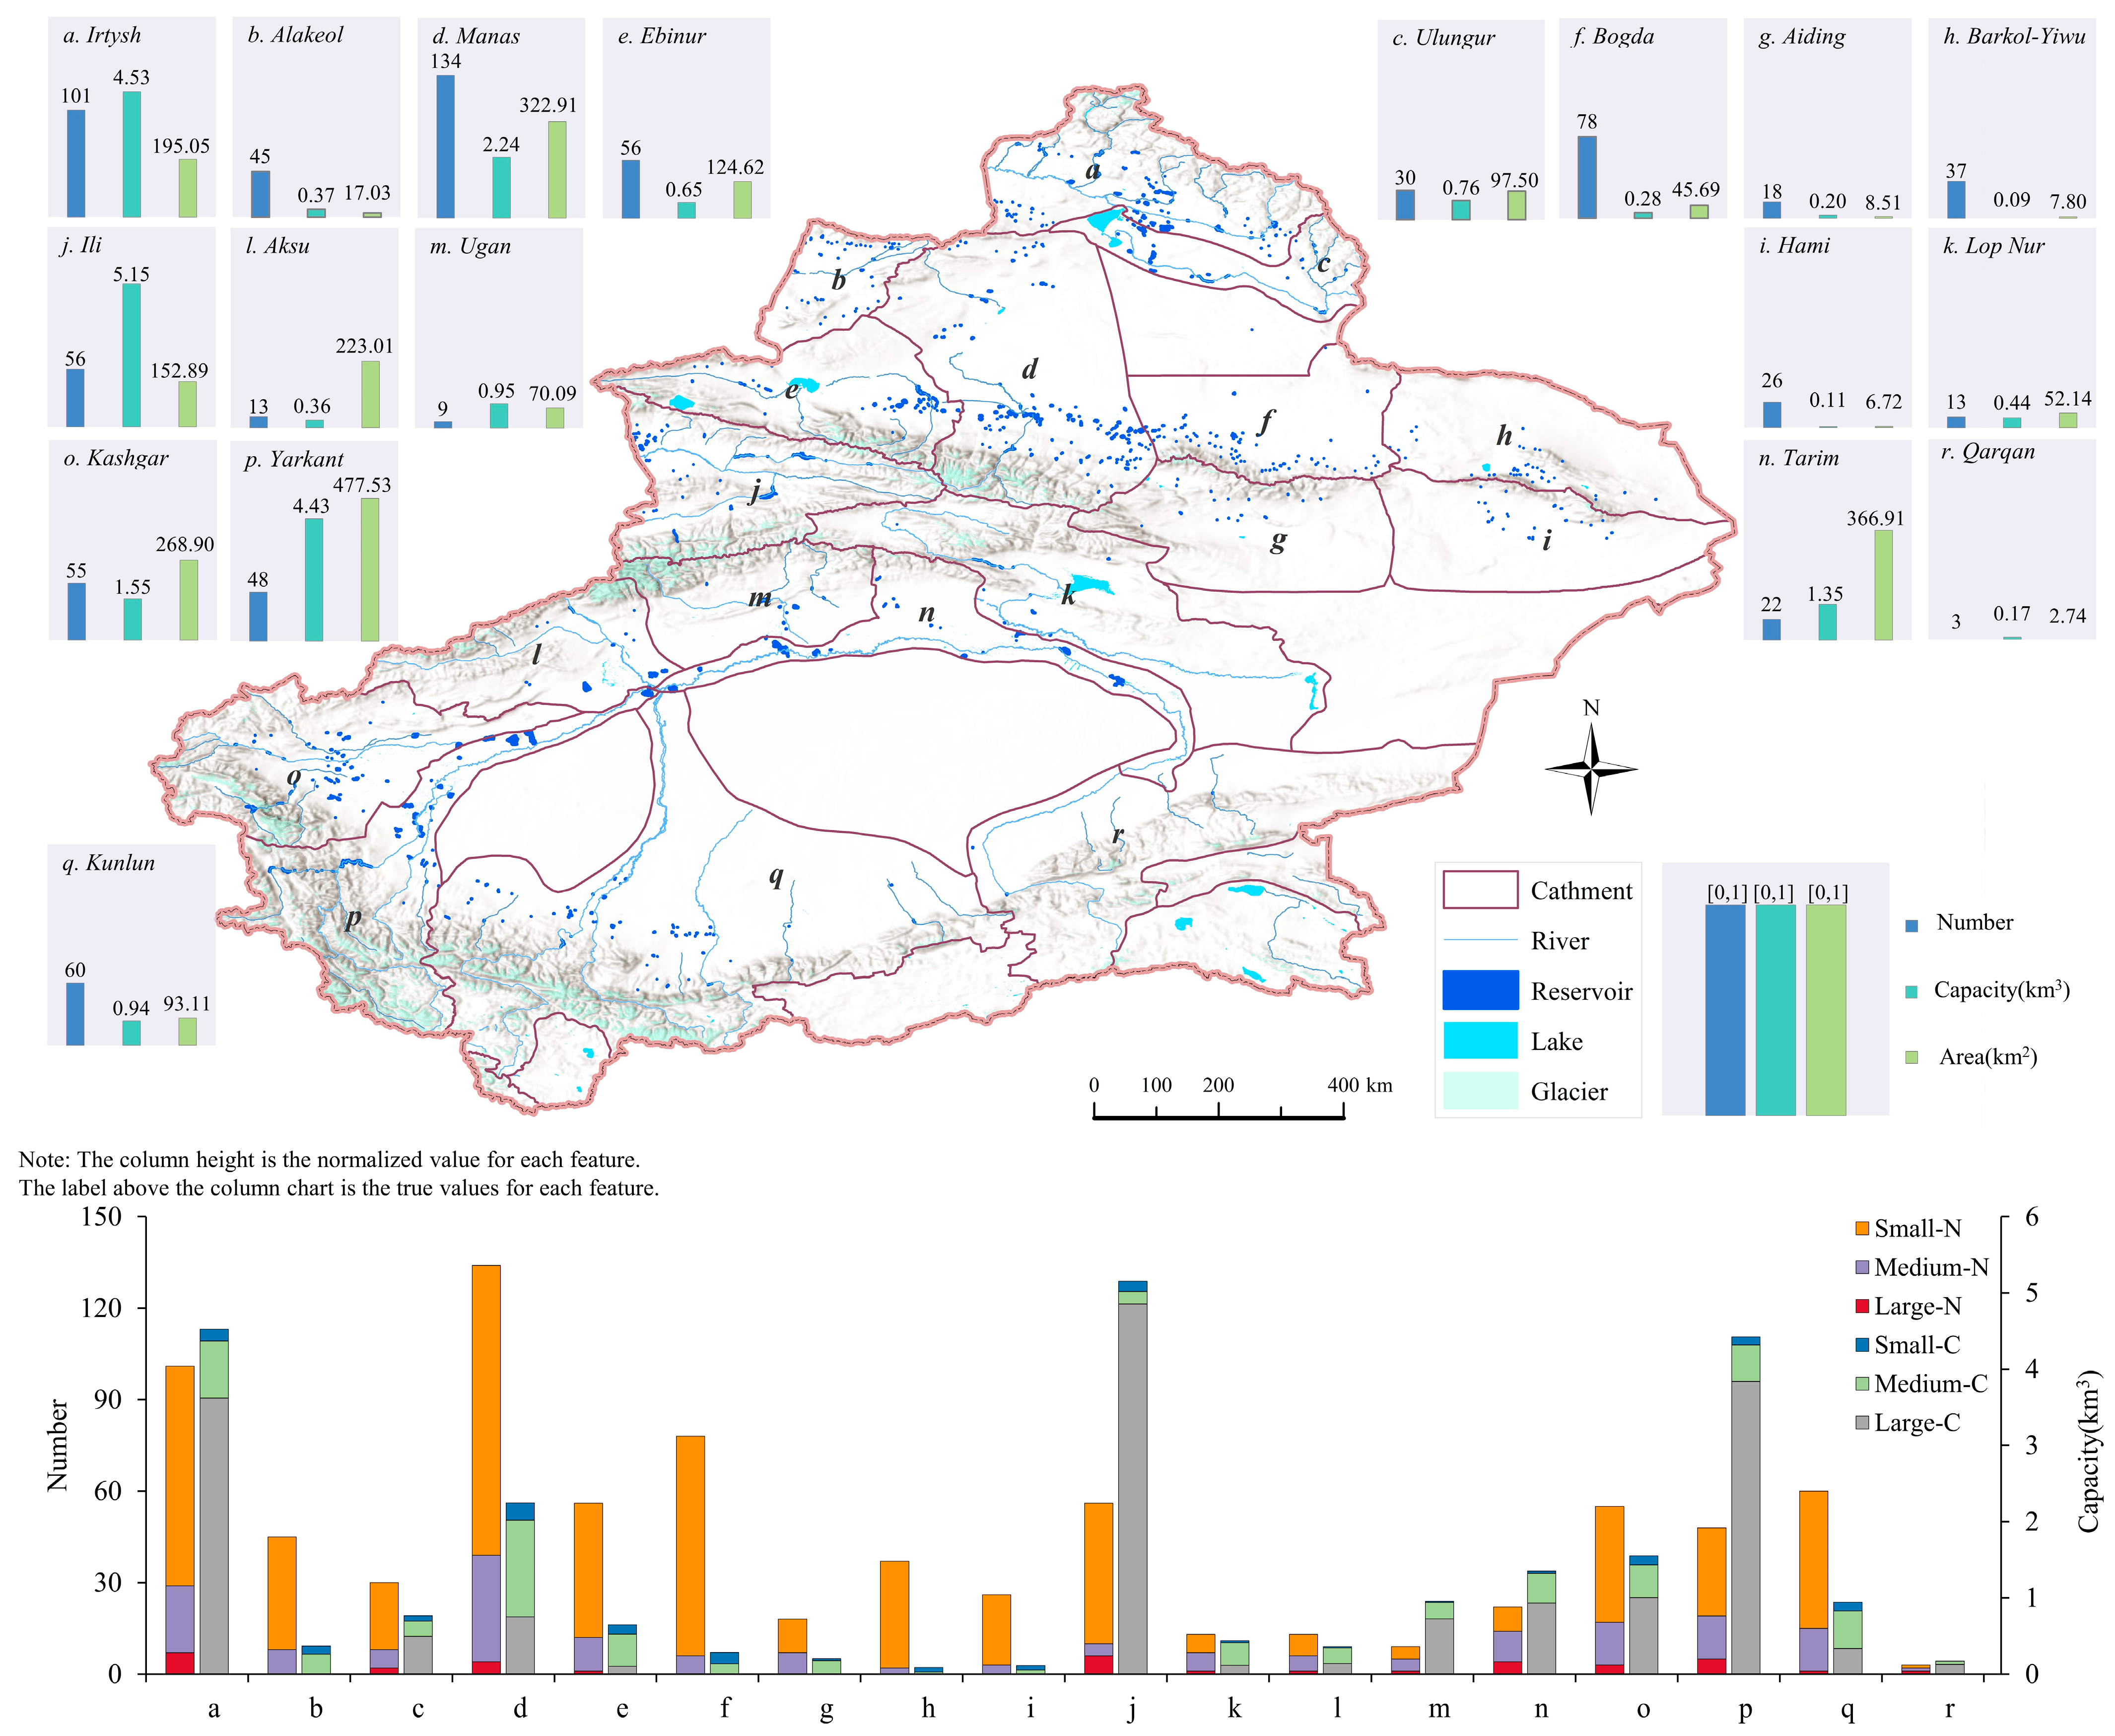
Figure 1.
Spatial distribution of main reservoirs, water systems, and oases in Xinjiang.
2.2. Data Sources
A new reservoir product is generated by combining satellite images and hydraulic engineering archives. Sentinel-2 MSI images from the period April–October are used to map the maximum reservoir extents, and the hydraulic engineering archives recorded in local chronicles are used to collect the reservoir attributes. If certain new or abandoned reservoirs are not recorded in local chronicles, their completion years are retrieved based on Landsat time-series imagery.
2.2.1. Sentinel-2
The Sentinel-2 mission has two optical satellites, 2A and 2B, and each satellite carries a wide-swath high-resolution multispectral imager, the Multispectral Instrument (MSI), with 13 spectral bands and a repeat period of 5 days. The spatial resolution of the visible and near-infrared bands is 10 m, which is conducive to monitoring small water bodies with higher accuracy in shorter periods [28,33]. As many of the reservoirs in Xinjiang are small reservoirs, the 10 m Sentinel-2 images have advantages in mapping them. In this study, the Level-1C (L1C) products with geometrical correction are publicly available from the official website of ESA (https://scihub.copernicus.eu/, accessed on 12 August 2023). We selected 2392 cloud-free and snow-free images from April to October 2022, which covered the entire Xinjiang region once a month. Moreover, the water extents derived from the monthly Sentinel-2 multispectral images from 2022 were combined to obtain the maximum reservoir extents.
2.2.2. Landsat
This study collected all the available Collection 2 T1 Level 1 Precision Terrain Corrected (L1TP) products of the Landsat 5 TM, Landsat 7 ETM+, Landsat 8 OLI, and Landsat 9 OLI 2 satellites for the target area. The L1TP data have been radiometrically calibrated and highly accurately orthorectified based on DEM data. These images formed a long time series, from 1985 to 2022, with a spatial resolution of 30 m. These datasets come from the EarthExplorer website of the United States Geological Survey (USGS) (https://earthexplorer.usgs.gov/, accessed on 3 September 2023). This paper uses 13,056 Landsat images to identify the years of reservoir completion using time-series analysis.
2.2.3. Hydraulic Engineering Archive
In order to generate the hydraulic attributes of the reservoirs in Xinjiang, 103 local chronicles, including 77 county chronicles, 22 municipal chronicles, 3 river basin chronicles, and 1 Xinjiang general chronicle (https://fz.wanfangdata.com.cn/, accessed on 7 August 2023), were collected, and 427, 515, 42 and 485 reservoirs and their hydraulic attributes were found, including name, location, completion year, volume, function type, dam height, dam type, and the operating conditions, as shown in Table 1. As these chronicles were published in different years and the reservoirs were counted regionally, these reservoir records have a lot of duplicates. Meanwhile, multiple hydraulic engineering archives from hydraulic and hydropower engineering projects (http://www.nlc.cn/web/index.shtml, accessed on 7 August 2023) and the Encyclopedia of Xinjiang Rivers and Lakes [34] were also used to fix the missing attributes. In total, we retrieved detailed attributes on 619 reservoirs from these local chronicles, and those of other newly built reservoirs in the last 10 years were retrieved from web maps, news reports, and water conservancy annals.

Table 1.
The hydraulic engineering archives for retrieving reservoir attributes.
2.3. Methodologies
We developed a flowchart generating the Xinjiang reservoir (XJR) dataset by bridging high-resolution reservoir extents with the reservoir attributes, as shown in Figure 2. The flowchart includes two parts: one is reservoir mapping and geolocation, and the other is attribute compilation and spatial bridging. The first part includes extracting water masks based on the U-Net model. The reservoirs are differentiated from other water bodies by locating their spatial relations to rivers. As most of the reservoirs in Xinjiang are barrage or diversion reservoirs, we can effectively distinguish them by setting up buffer zones for rivers and finding intersecting dams and reservoirs. Moreover, as many reservoirs in Xinjiang have small sizes, we selected Sentinel-2 images with a spatial resolution of 10 m to map the reservoir extents, and all the selected Sentinel-2 images with a good image quality from April to October were used to map the maximum area extents of the reservoirs. The second part focused on archive compilation and attribute assignment to every reservoir. Finally, we analyzed the spatial distribution and construction history of Xinjiang’s reservoirs in the last 60 years based on bridging the spatial and attribution information.
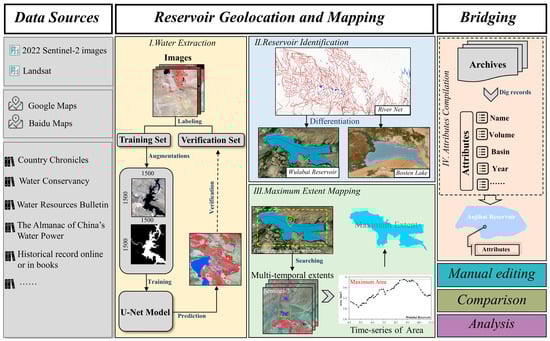
Figure 2.
Data sources and the workflow of the construction of XJR. The meaning of the dashed box is “a search window”.
2.3.1. Water Body Mapping via the U-Net Model
U-Net is one of the most common CNN models for water body mapping in various scenarios [38,39,40], especially for small water body mapping on high-resolution images [27,41,42]. In this study, we used the U-Net model to map all the water bodies in Xinjiang from 2392 Sentinel-2 images from April to October 2022. Firstly, we manually edited and produced 300 water body samples across Xinjiang, each with a size of 1500 × 1500 pixels, with 80% used for model training and 20% for validation. Secondly, in order to obtain enough training samples for the U-Net model, data augmentation of the 300 samples was conducted 108 times with a size of 256 × 256 pixels by flipping them horizontally, randomizing the brightness contrast, transposing them, flipping them vertically, and rotating them. Thirdly, the U-Net model was conducted with an initial learning rate of 0.005, using a batch size of 8 images, and each network had 300 epochs. The loss function used during the training was FocalLoss [43], which is efficient in solving class imbalance in segmentation compared to other classification loss. The U-Net model was running using the Cuda framework in Python on a powerful workstation with an NVIDIA Quadro RTX A6000 graphics card.
Furthermore, we tested the model performance using 4 indicators [38,44], which are Precision, Overall Accuracy (OA), Recall, and the F1 score (F1). The Precision, Overall Accuracy, and Recall results of the model are 93%, 91%, and 88%, respectively, indicating a good mapping performance similar to that of Pi et al. [27]. The F1 value is 90%, indicating a few cases of misclassified water bodies.
2.3.2. Reservoir Identification and Geolocation
The reservoirs are identified and differentiated from other water bodies by intersecting the water bodies with the river networks from the edited HydroRIVERS [45]. The HydroRIVERS layer provides continuous and detail lineal river networks, but they are not all river features, so we remove the non-river features by intersecting the existing high-accuracy river map. Furthermore, we patched up some river features missing from HydroRIVERS manually. Firstly, we generated a 0.5 km buffer zone with the river features from the edited HydroRIVERS. Then, we filtered out the water bodies that fell into or intersected with the buffer zone, which could identify two-thirds of the reservoirs approximately according to the characteristics of the barrage reservoirs. However, this process can omit some reservoirs or misclassify some lakes as reservoirs (134 lakes were found to be misclassified during our manual inspection). So, we edited the reservoirs by overlaying the ArcGIS online high-resolution image layer, and the water body was taken as a reservoir if there was a dam around it [46]. We identified 275 reservoirs that fell outside the river buffer and differentiated some reservoirs from lakes within the buffer. Eventually, all the reservoirs were fully validated manually with their exact location and extent.
2.3.3. Reservoir Maximum Area Mapping
The seasonal area changes in the reservoirs due to agricultural irrigation are remarkable, while the inter-annual changes are tiny and periodic [47,48,49,50]. We assumed that a reservoir could reach its maximum area within a year. As many of the reservoirs in the mountainous areas are frozen from November to March, the acquisition date of the selected Sentinel-2 images is out of this period. Firstly, the time-series area extents of each reservoir were mapped using all the cloudless Sentinel-2 images from April to October 2022, and then they were validated using manual editing. Finally, the maximum reservoir area was counted from the time-series area extents. Although the maximum reservoir area will may be omitted due to image quality and cloud cover, we ignored this situation due to the high temporal resolution of Sentinel-2. The aim is to standardize the extent of the reservoir, that is, to uniformly represent its boundaries with the maximum range related to the maximum storage capacity. Figure 3 is the time-series area curve of Daxigou Reservoir (43°18′55″N, 87°11′53″E) in 2022, which reached the maximum value of the year in September (yellow line marked), and the reservoir boundary corresponding to this maximum value would be used as the maximum extent of the reservoir.
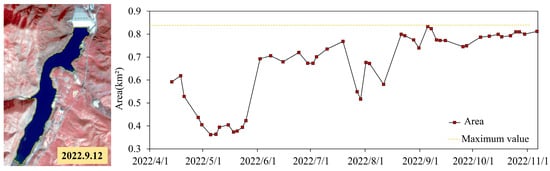
Figure 3.
Reservoir maximum extent mapping using cloud-free Sentinel-2 images (the yellow line indicates the boundary of Daxigou Reservoir). The remote sensing image is a VNIR, Red, and Green band composite.
2.3.4. Determining the Completion and Abandonment Years of Reservoirs
Up to the present, there are still some reservoirs with no records in the historical literature. This paper accurately determined the completion and abandonment years based on the time-series Landsat imagery. Compared with natural lakes, reservoirs are built up from nothing, so the completion year can be determined by the year when the annual average area is larger than 0. Firstly, we selected reservoirs with no records and generated their double-size buffer zones based on their maximum water surface. Secondly, the Landsat series images were intersected with the buffer zones and formed a long and continuous observation record. Then, the time-series reservoir extents were mapped using the U-Net model described above. Finally, the annual average areas were counted, and the year for which the annual average area changed from zero to a value greater than zero was determined the completion year. Using this method, we processed 128 reservoirs without a completion year and 15 without an abandonment year. However, for 25 reservoirs, we failed to determine the completion years, and for 8 reservoirs, we failed to determine the abandonment years, as the completion or abandonment years of these reservoirs were before 1989, when the Landsat images were absent or insufficient for annual coverage. Figure 4 shows the determination of the completion year for Tuanjie Reservoir (43°37′42″N, 93°14′46″E) using the time-series area curve derived using the Landsat imagery. Tuanjie Reservoir grew sharply in 1994 and has shown cyclical fluctuations. Therefore, the completion year was determined to be 1994.

Figure 4.
The time-series area curves of Tuanjie Reservoir.
2.3.5. Bridging Attributes and Geolocation
Reservoir names are the bridge between their spatial locations and attributes, which can be retrieved from various electronic maps, such as Bing Maps and Google Earth. We added these names to the attribute table of the reservoir vector layer, and then we used the Spatial Join tool to join the geolocations with the attribute information derived from the historical archives. The attribute table includes the reservoir name, volume, maximum area, elevation, completion year, etc. The value of the altitude attribute is derived from SRTM DEM data. The reservoirs are classified into mountain and plain reservoirs according to their ecoregions [51]. The reservoir attribute items are listed in Table 2.
Table 2.
Capital attributes in XJR.
3. Mapping Accuracies and Validations
3.1. Uncertainty Assessment of Reservoir Extent
We assessed the uncertainty of the reservoir extents with an index named area measurement error [52], which is calculated by multiplying the lake perimeter and half the pixel area, and the equation is listed below:
The error is the relative error of the reservoir extent, and G is the cell size of the Sentinel-2 image, so G = 10 m. P is the perimeter of an individual reservoir. The factor of 0.6872 (1σ) means that ∼69% of the edge pixels are error-prone. A is the area of the reservoir and D is the relative error of a single reservoir. The relative error D decreases when the reservoir area increases [53].
According to the mapping results, 522 reservoirs are less than 1.0 km2 in area, accounting for 64.92%, and the average relative error is 6.62% (Figure 5). Counted by area ranges, the average relative error within the area ranges of [0, 0.01], [0.01, 0.1], and [0.1, 1] is 21.30%, 9.96%, and 4.47%, respectively. Furthermore, the reservoirs with areas larger than 1.0 km2 have an average relative error of 1.79%. Overall, the relative errors of all reservoirs are below 40 percent, and 88% of the reservoirs have relative errors within 10%.
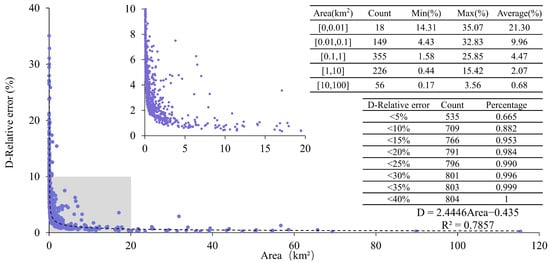
Figure 5.
The relative error for reservoir mapping (Purple circles represent each reservoir. The dashed line is the fitted curve).
3.2. Comparison with Existing Reservoir or Dam Databases
Compared with other reservoir databases, such as GeoDAR [22], GLAKES [27], and CRD [21], the XJR (Xinjiang Reservoir) dataset produced in this paper has the most comprehensive reservoirs with complete attribute information(Table 3), such as the completion year, the abandonment year, and capacity, providing the necessary information on the reservoir construction history in Xinjiang.
Table 3.
Inter-comparison with other existing datasets.
Different reservoir datasets are published for different uses, so their reservoir counts vary with different area or volume statistical standards. According to Figure 5, more than 60% of reservoirs have small areas less than 1.0 km2, and only 39 reservoirs have a storage capacity larger than 0.1 km3. Consequently, GeoDAR contains only 16 large reservoirs from Xinjiang, with a total capacity of 9.17 km3, and GLAKES is a global lake dataset with 626 reservoir polygons intersecting with XJR, but only 19 polygons are labeled as reservoirs, underestimating the abundance of reservoirs in Xinjiang. The 673 reservoirs of Xinjiang in the CRD database are recorded in shapefile and CSV format, with an estimated total storage capacity of 30.41 km3. The CRD contains the coordinates, area, and estimated capacity of the reservoirs, but lacks records on the built year.
Compared with other archives on Xinjiang reservoirs without geospatial information, their numbers and storage capacities are not inconsistent with XJR for different reasons. Gu et al. utilized the GSW and high-resolution satellite images in 2015 to map the reservoirs in China [54], and the number of Xinjiang reservoirs is 731, which is close to that of XJR, with 736 reservoirs before 2015. The difference between them is that some reservoirs were absent, as they dried up in 2015 and could not be detected. The Xinjiang reservoir dataset made by Li et al. [55] was derived from an authoritative water management department, and the dataset contains 751 reservoirs with a total capacity of 29.78 km3. Small tailings and abandoned reservoirs are not counted in this dataset, but large ones without water under construction are counted. Therefore, the number is smaller than that of XJR, but the storage capacity is much larger.
4. Results
4.1. Characteristics of Spatial Distribution
The XJR dataset contains 804 reservoirs with completion dates from 1940 to 2022, and the total storage capacity reached 24.58 km3. According to the rank classification criteria in China [56], reservoirs with volumes ≥1.0 × 10⁸ m3, between 0.1 × 10⁸ m3 and 1 × 10⁸ m3, and <0.1 × 10⁸ m3 are classified as large, medium, and small reservoirs. With these criteria, the large, medium, and small reservoir counts in Xinjiang are 37, 172, and 595, respectively, and their storage capacity is 170.35 × 10⁸ m3, 60.11 × 10⁸ m3, and 15.37 × 10⁸ m3, respectively.
The numbers, areas, and storage capacities vary in river catchments and endorheic basins (Figure 6). The reservoirs are numerous in the catchments of the Manas River (d), the Irtysh River (a), and the Bogda inner rivers (f), and the numbers of reservoirs are 101, 134, and 78, respectively. Specifically, the reservoirs in the Irtysh River (a) catchment account reach 12.56% in number and 17.49% in capacity, so both the number and total capacity are substantial. In the catchment of the Ili River (j) and the Yarkant River (p), the reservoir number accounts for 6.97% and 5.97%, respectively, but the capacity accounts for 19.88% and 17.19%, which means that large reservoirs occupy a large proportion. Meanwhile, in the contiguous area on the northern slope of the Tianshan Mountains, there are 268 reservoirs in the catchments of the Ebinur Lake (e), the Manas River (d), and the Bogda inner rivers (f), accounting for a large proportion of 33%, but their total capacity is 3.17 km3, accounting for 12.24%. In terms of reservoir capacity, the number of small reservoirs reaches 211 with a total capacity of 0.50 km3, accounting for a majority in numbers but a minority in capacity.
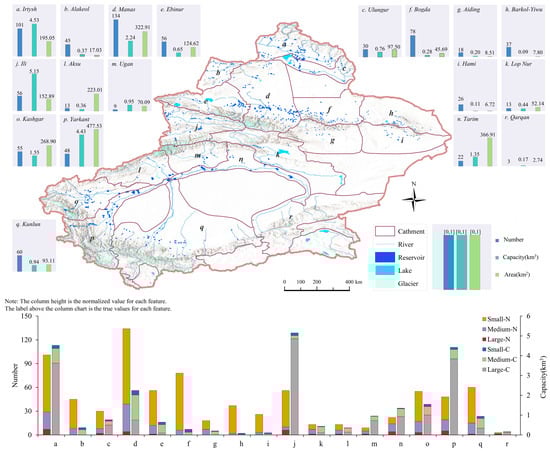
Figure 6.
Reservoir distribution in basin scale and the proportion of reservoirs of different grades in each river basin. N is number and C is capacity. Large reservoirs (0.1–1 km2); medium-sized reservoirs (0.01–0.1 km2); small reservoirs (0.0001–0.01 km2); ponds (smaller than 0.0001 km2).
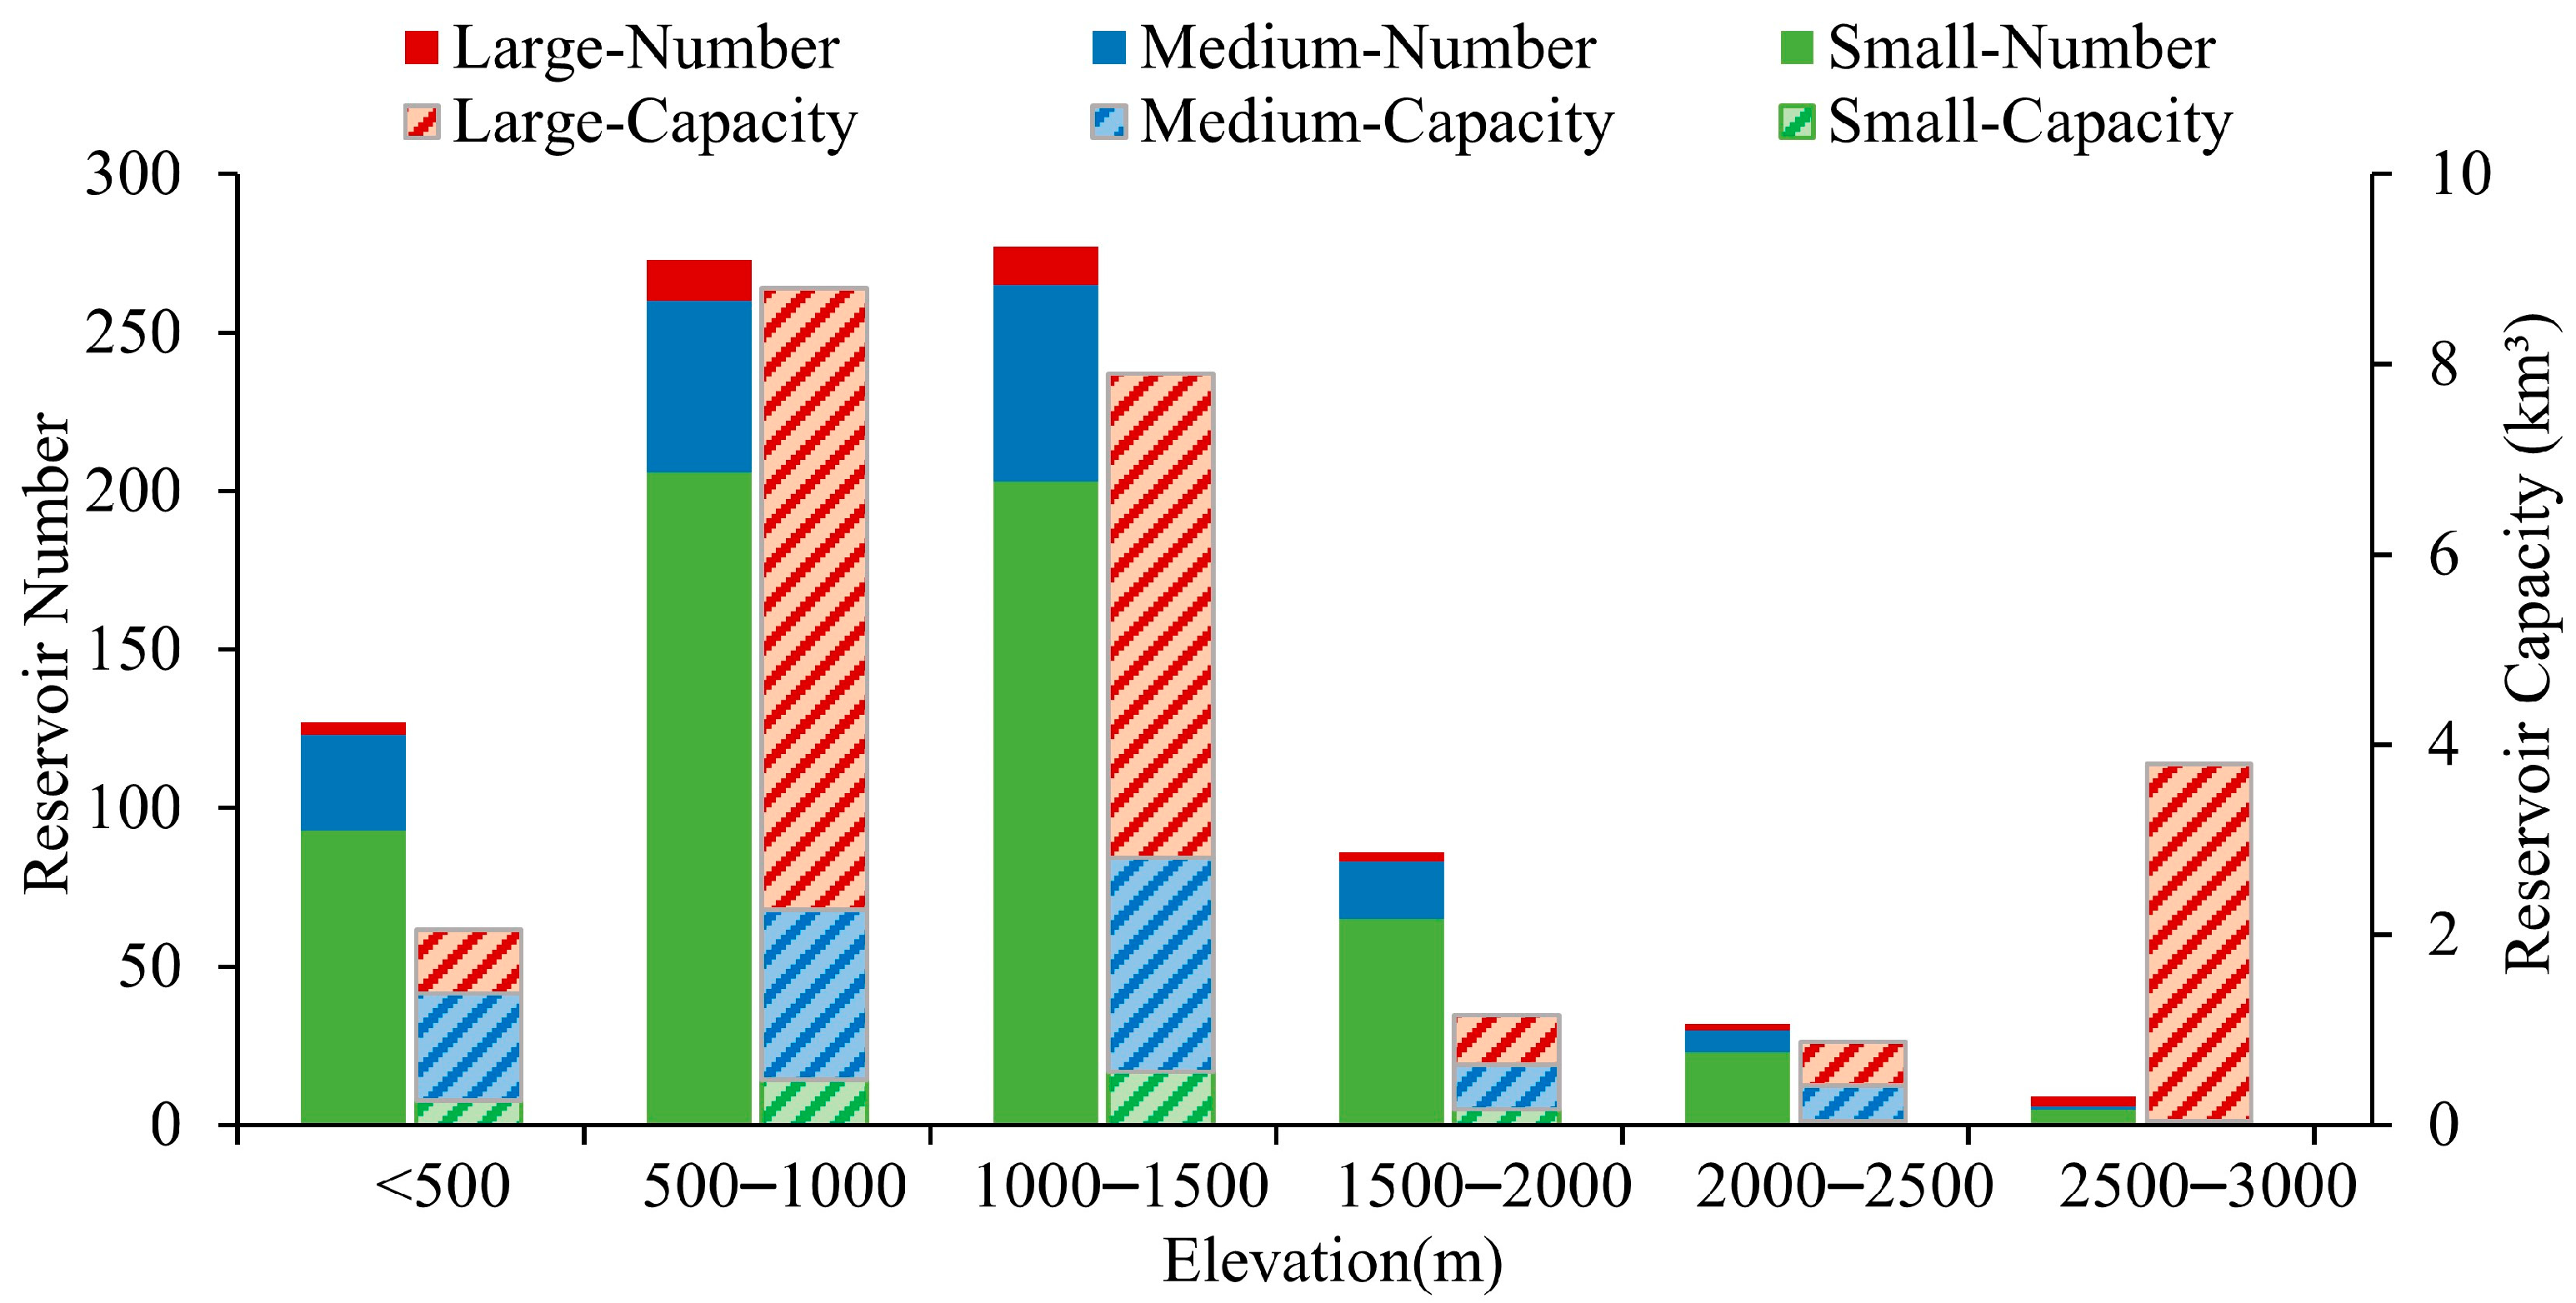
4.2. Characteristics of Altitudinal Distribution
The altitudinal distribution characteristics were analyzed by counting the reservoir numbers and capacities in different elevation ranges (Figure 7). The reservoirs in the elevation range of 500–1500 m occupy the largest proportion, with a number of 550 and a capacity of 16.71 km3, accounting for 68.41% of the total number and 67.98% of the total capacity, respectively. The reservoirs at 1500~2000 m have a smaller proportion, with 11% in number and 4.7% in capacity, respectively. At lower altitudes below 500 m, the reservoirs account for 15.8% of the total number and 8.34% of the capacity, and most of them are concentrated in oases, supplying irrigation water. In comparison, most of the reservoirs in the alpine regions above 2000 m are large reservoirs. There are only 41 reservoirs, accounting for 5.1%, scattering across the branches in the upper reaches of some large rivers, but their total capacity is 4.67 km3, accounting for more than 19%.
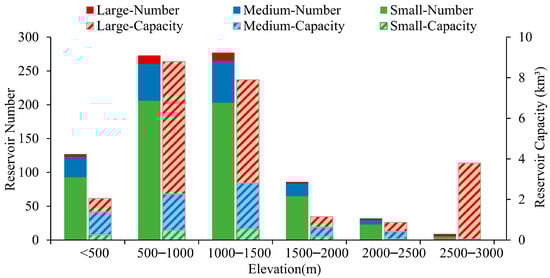
Figure 7.
Distribution of reservoirs at different elevation zones.
When analyzing the altitudinal distribution by reservoir size, the reservoir number and capacities vary with altitude. Small reservoirs account for more than half of every elevation range, but their capacity is of minor proportions. Specifically, at each elevation range of [<500], [500, 1000], [1000, 1500], [1500, 2000], [2000, 2500], and [2500, 3000], the number of small lakes accounts for 73.23%, 75.46%, 73.28%, 75.58%, 71.87%, and 55.56%, respectively, while the capacity accounts for 12.45%, 5.43%, 7.10%, 14.51%, 5.01%, and 0.84%, respectively. Large reservoirs are distributed mainly in the elevation ranges of [500, 1000] and [1000, 1500], whose numbers account for 4.76% and 4.33% and capacities account for 74.21% and 64.50%. It is worth noting that the larger reservoirs above 2500 m contribute a lot to the reservoir capacity. There are nine reservoirs at the elevation range above 2500 m, and three are large reservoirs, accounting for more than 99% capacity.
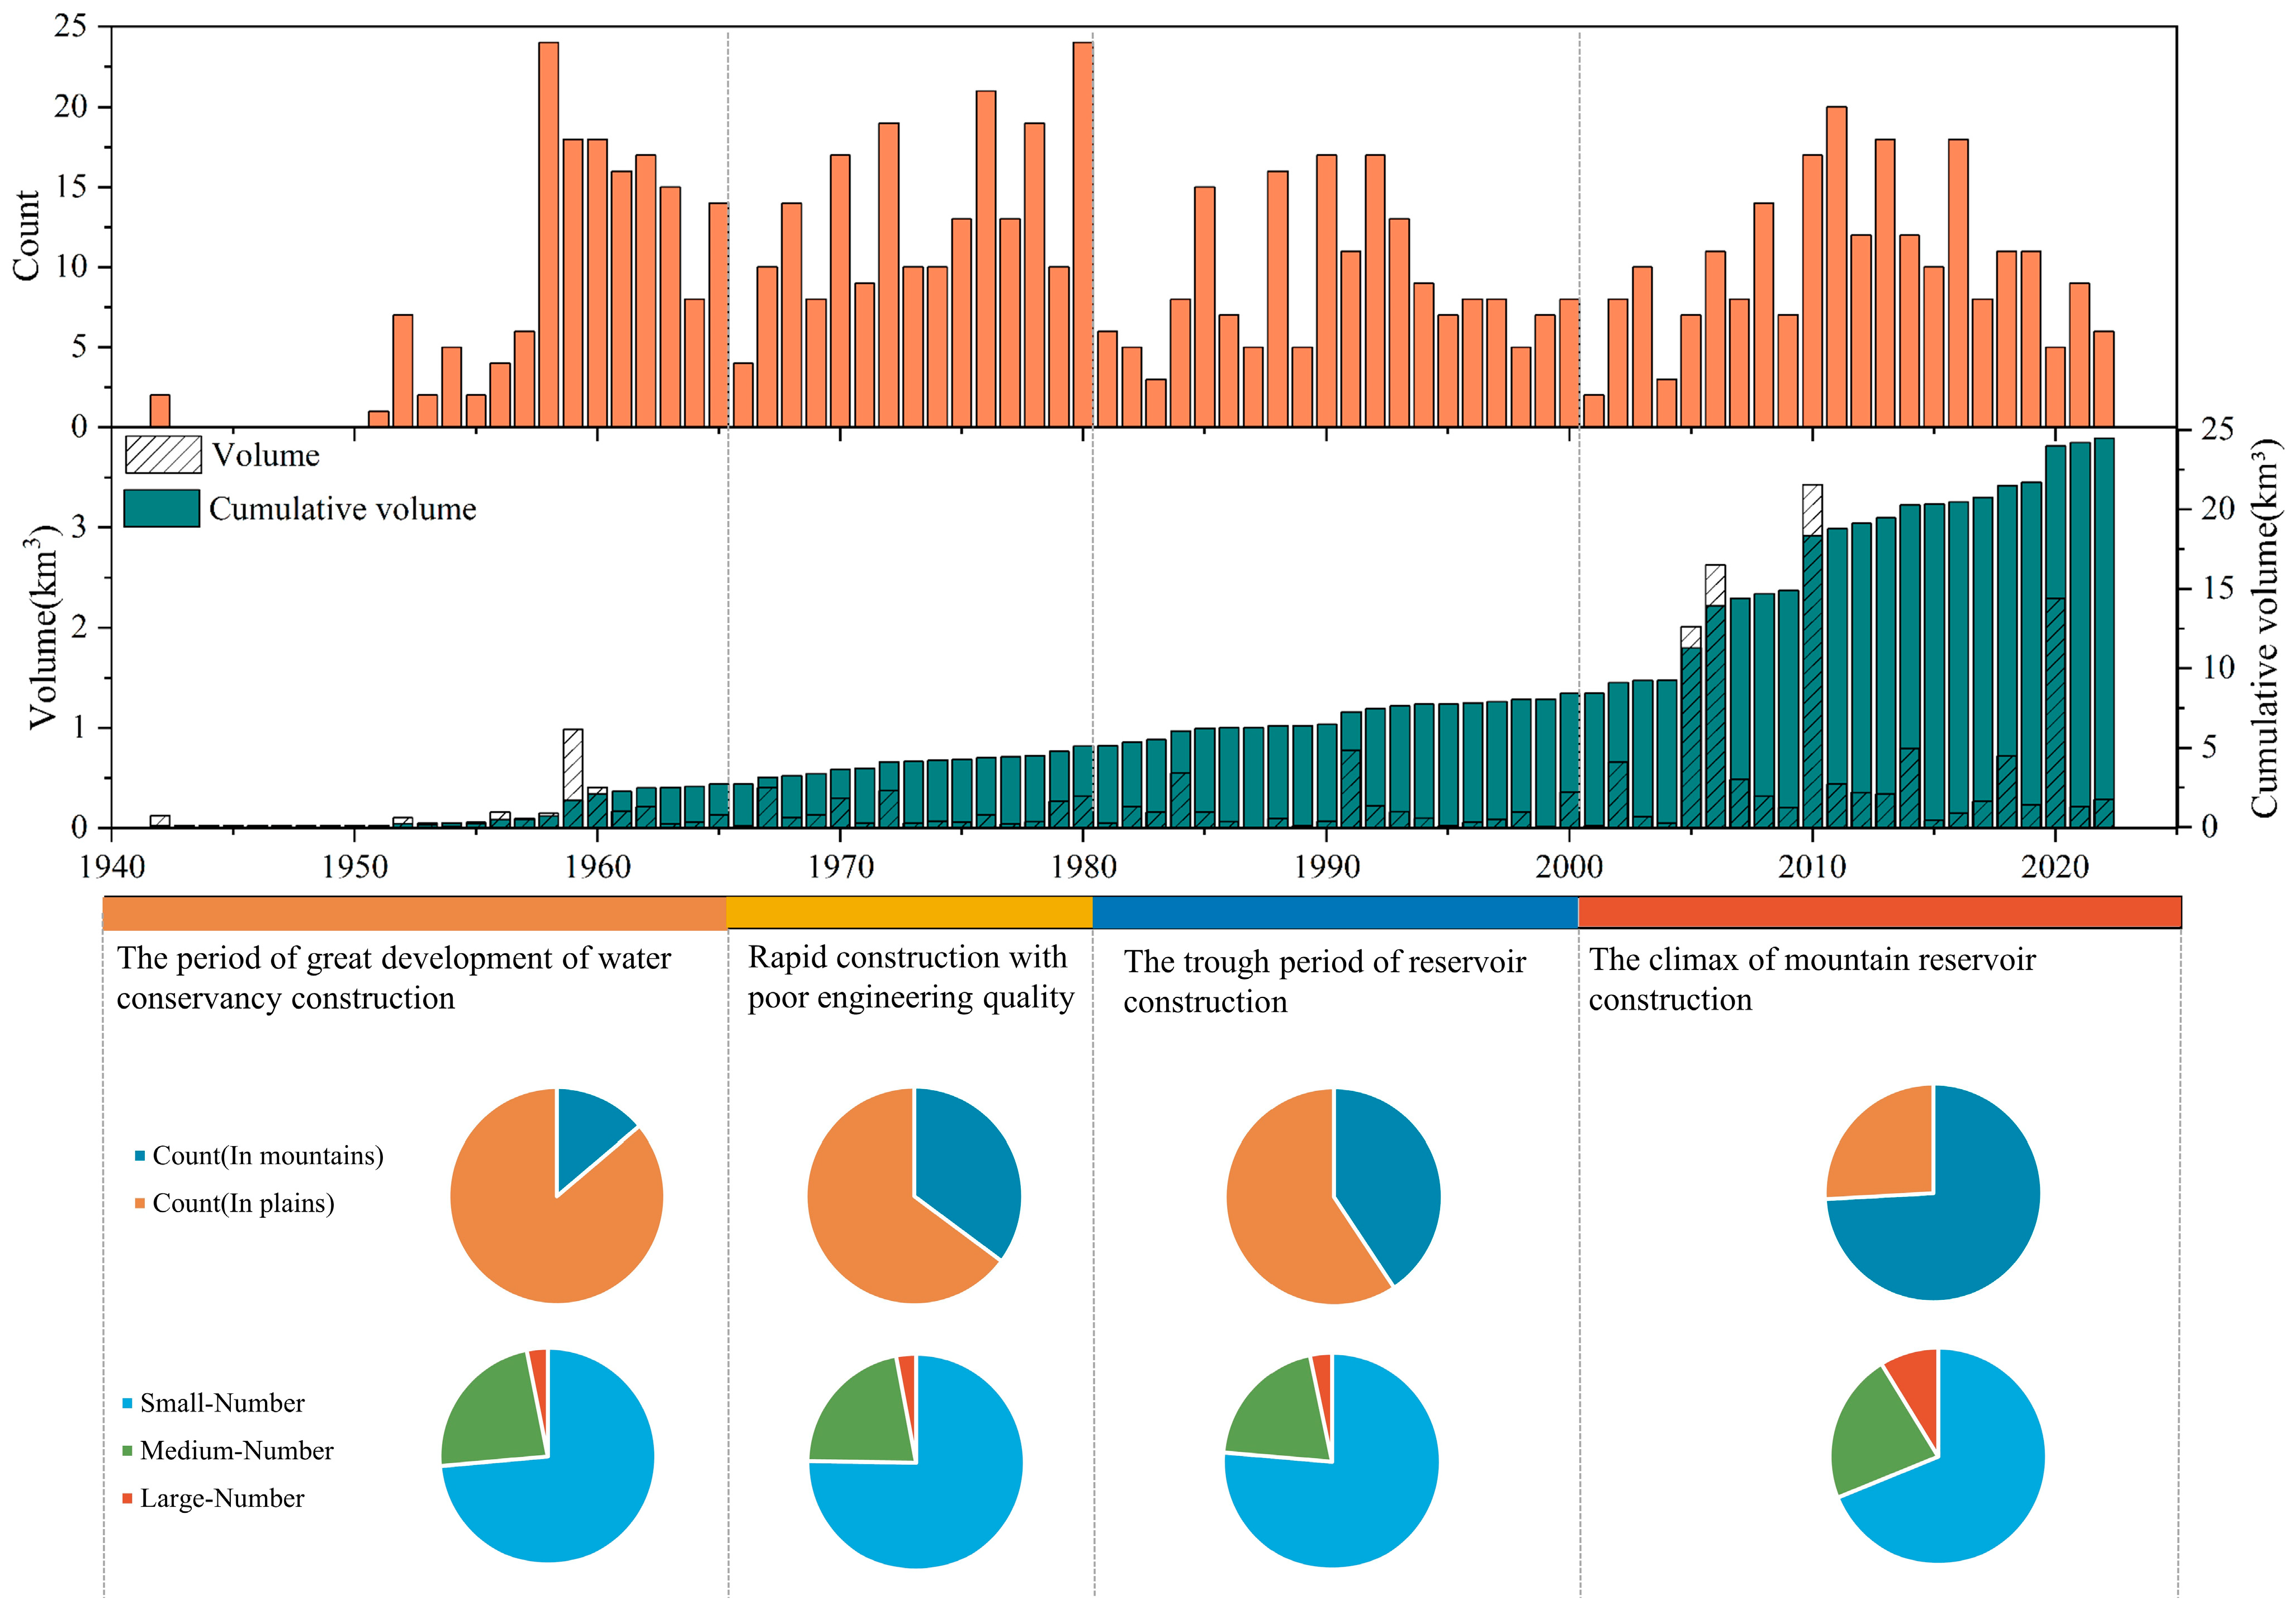
4.3. Temporal Processes of Reservoir Construction
The construction history of reservoirs in Xinjiang has lasted for over 80 years, and we have divided it into four periods: 1940–1965, 1966–1980, 1981–2000, and 2001–2030 (Table 4). In the initial stage of reservoir construction during 1940–1965, 159 reservoirs were built, including 5, 37, and 117 large, medium, and small reservoirs, respectively, with a total capacity of 2.71 km3. The number of reservoirs during 1966–1980 reached 202, with a total capacity of 2.38 km3. Compared with the previous period, the percentage of reservoirs of different sizes was almost the same, but the proportion of reservoirs in the mountainous areas increased significantly, from 14% to 35%. During 1981–2000, 182 reservoirs were built up with a capacity of 3.33 km3. The reservoir number is less than that during 1966–1980, but the capacity has increased significantly. The total capacity of the six large reservoirs built in 1981–2000 was 1.83 km3, while the total capacity of the six large reservoirs built in 1966–1980 was only 0.92 km3. In the 30 years from 2001 to 2030, 228 reservoirs were constructed, with a total capacity value of 16.06 km3, representing a significant increase in capacity. The distinguishing feature of the period is the growth in the number of large reservoirs and reservoirs in the mountainous areas. Many small reservoirs were constructed before 2000, including 408 small reservoirs, with 376 in the plain areas. After 2000, 157 small reservoirs were built, with 59 plain reservoirs.
Table 4.
Number of reservoirs, capacity, and elevation at different periods.
In general, the number of reservoirs has decreased compared to the previous century, but the total reservoir capacity built after 2000 is significantly larger than in the previous century (Figure 8). From 1940 to 2000, 543 reservoirs were built, of which 408 were small reservoirs, accounting for 75%. During this period, 167 mountain reservoirs and 376 plain reservoirs appeared. Since 2001, 228 reservoirs have been built, of which 157 are small, accounting for 69%, while 20 are large reservoirs, accounting for a significant increase. The number of mountain reservoirs is larger than the previous ones combined, reaching 169, while plain reservoirs constitute only 59.
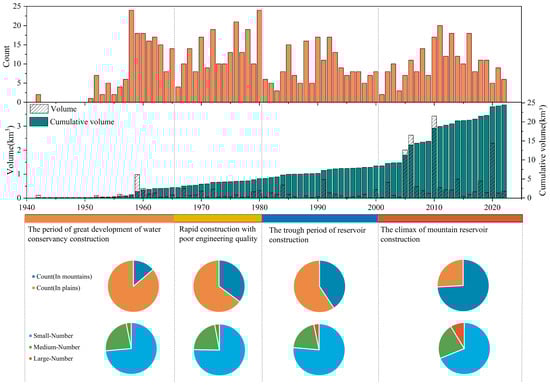
Figure 8.
Statistics of reservoir construction in Xinjiang since the 1940s.
Specifically, from 1950 to 1980, this period involved the most significant increase in reservoir construction, mainly plain reservoirs. The period from 1950 to 1965 was a period of significant development of reservoir construction; the total number of reservoirs built during this period reached 159, and the total reservoir capacity was 2.71 km3. From 1966 to 1979, 177 reservoirs were built with a total reservoir capacity of 2.06 km3. Consequently, the reservoir construction changed from a boom to a slight decline due to leakage rehabilitation during the 1980s and 1990s. The construction of reservoirs slowed down, and a total of 199 reservoirs were built during this period, with a total capacity of 3.29 km3. A significant increase in reservoir capacity has characterized the 21st century due to the increase in large reservoirs from 2000 to 2022. During this period, the total reservoir capacity was 16.42 km3, of which 21 large reservoirs had a total capacity of 9.04 km3, contributing 55% of the reservoir capacity.
5. Discussion
5.1. Improvements in the Dataset of Reservoirs in Xinjiang
XJR provides a comprehensive reservoir dataset of Xinjiang at 10 m resolution with complete attribute information, especially for small reservoirs. The dataset not only maps the extent of the reservoirs from 1940 to 2030 but also attaches properties to the reservoirs, which are critical for estimating the water reserves and spatial distribution patterns in Xinjiang. For example, we can use the attribute “completion year” to retrieve the development stage of reservoir construction in Xinjiang, which is essential to analyze its relation to oasis expansion.
Limit value errors in satellite data provide many sources of uncertainty, including the inability to separate lakes and reservoirs, as it is hard to identify dams from low-resolution satellite images. Although many large reservoirs have large storage capacities in Xinjiang, their area extents are small, making it hard to detect or accurately map them using low-resolution satellite images. Equally, smaller reservoirs are of increasing concern to researchers because their cumulative effects may be considerable, and yet they have remained underemphasized and unexamined. The XJR dataset in this paper was derived from Sentinel-2 MSI data, which have been validated to map the small reservoirs with a relatively high overall accuracy.
Misclassifications and omissions affected by the topography (e.g., mountain shadows) persist, especially for mountain reservoirs. In recent years, more and more reservoirs have been built up in the mountainous areas of Xinjiang, where the water extents usually have long and narrow shapes, and mountains or cloud shadows could be an obstacle for reservoir mapping. A high resolution may reduce these errors.
Besides an improved quantity and spatial detail, another unique value of XJR is its capability to bridge the locations of reservoirs and a broad suite of attributes essential to scientific applications. XJR integrates remote sensing data and documentary records to correlate the spatial location and attributes of the reservoirs, and the spatial features of each reservoir in XJR can be indexed to its attributes, including its capacity, completion time, area, etc. The ancillary attribute information makes the study of the reservoir not only limited to the dynamics of the water surface but also recreates the process of reservoir construction and the change in reservoir size.
5.2. Reservoir Construction with Oasis Expansion and Ecological Protection
Reservoirs are an essential means of regulation and control for developing artificial oases and protecting natural oases. The construction of a reservoir not only ensures water for agricultural irrigation and production and domestic use but also produces ecological benefits (such as ecological water transfer in the lower reaches of the Tarim River). In the past 50 years, economic development activities have led to a significant increase in artificial oases in the arid region of Northwest China, and the economic center of gravity has shifted to the middle and upper reaches. As an essential basis for the economic development in arid areas, the spatial pattern of water resource allocation also shows the same trend. In the XJR dataset, since 1980, the focus of reservoir construction has shifted from plain reservoirs to mountain reservoirs, and the reservoir construction sites have shifted to runoff mountain passes.
Reservoirs in mountainous areas play a role in the transmission and storage of runoff and simultaneously realize the regulation of water resources. They also have different degrees of influence on the impact on downstream artificial oases, natural oases, and the Gobi Desert. A large amount of water is intercepted in artificial oases, and the area of the oases is gradually expanding, while excess agricultural water exceedingly crowds out the ecological water of natural oases. Although Xinjiang has gradually formed a water resource regulation and utilization model supplemented by more than 800 reservoirs in mountainous and plain areas and water diversion across river basins, the carrying capacity of the water resources still faces enormous risks and challenges, and it is still necessary to further improve the capacity of water resource allocation.
5.3. Uncertainty about the Capacity and Quantity of Reservoirs
Some uncertainties exist in this study’s estimation of reservoir capacity due to the multiple data sources. The number of reservoirs in this study is a cumulative value. As both new and abandoned reservoirs are counted, the number is larger than the official data [55]. Meanwhile, we obtained the total reservoir capacity values for 619 reservoirs from county chronicles, municipal chronicles, and hydropower engineering archives, and those for other reservoirs come from news reports, websites, and web maps. Since the reservoir capacity values are collected from historical records, they are outdated due to reservoir sedimentation. Moreover, the chronicles do not contain new and abandoned reservoirs.
We assumed that the reservoirs would go through an operating cycle within a year and then used the maximum extent that occurred in 2022 as the maximum water surface of the reservoirs. However, there is some bias for this reason, and some reservoirs may not have reached their maximum water surface in 2022 based on water allocation planning. Therefore, we will use a longer time series based on remote sensing to capture the maximum extent of the reservoirs in future [57,58].
6. Conclusions
In this study, we established a reservoir dataset in Xinjiang using Sentinel-2 images and a hydraulic engineering archive from 1942 to 2022 to map and recreate their construction process. This work mapped the distribution of reservoirs built in Xinjiang from 1942 to 2022. There are currently 804 reservoirs in Xinjiang (>0.001 km2), mainly distributed in the northern and western catchment areas. The total capacity stored by all the reservoirs in Xinjiang can be estimated at 24.58 km3, with 70% stored in large reservoirs.
Throughout the period, 67% of the reservoirs were built in the last century, dominated by plain reservoirs. The site of reservoir construction gradually shifted from plain reservoirs to mountain reservoirs over time, especially after 2000. The expansion of oases upstream is an important factor in the large-scale shift and location shift seen in the reservoirs, and the number of mountain reservoirs is increasing continuously compared to plain reservoirs.
Inadequately, we did not take into account abandoned reservoirs, which generated some statistical bias in the reservoir construction process. In addition, higher-resolution satellites are needed to monitor reservoir reinforcement or the expansion of volume, as this will lead to changes in the reservoir capacity. Combined with altimetry satellite imagery, high-resolution imagery can help update the capacity of the reservoirs, especially the plain reservoirs built in the last century.
The XJR dataset provide us with a new understanding of human activities in relation to the local hydrologic cycle, which also provides a clear outline of the reservoir construction history in Xinjiang since the 1940s. With the double influences of climate change and human activities, it is urgent to optimize water resource utilization and management in arid regions. As reservoirs are the key factors in water management, a future study will include retrieving their hydrological and operation rules, which requires monitoring the reservoirs using time-series high-resolution imagery and more efficient and intelligent methods, and we will focus on these in future.
Author Contributions
Conceptualization, S.L. (Shuangshuang Li) and J.L.; methodology, S.L. (Shuangshuang Li) and H.W.; validation, S.L. (Shuangshuang Li), S.L. (Shuaiqi Liu), and H.W.; formal analysis, S.L. (Shuangshuang Li) and W.D.; investigation, S.L. (Shuangshuang Li), J.L. and J.J.; resources, J.L. and W.D.; data curation, S.L. (Shuangshuang Li), S.L. (Shuaiqi Liu), and J.J.; writing—original draft preparation, S.L. (Shuangshuang Li) and J.L.; writing—review and editing, S.L. (Shuangshuang Li), J.L., and W.D.; visualization, S.L. (Shuangshuang Li) and J.L.; supervision, J.L. and W.D.; project administration, S.L. (Shuangshuang Li); funding acquisition, J.L. All authors have read and agreed to the published version of the manuscript.
Funding
This research was funded by the Third Integrated Scientific Expedition Project in Xinjiang, grant number 2021xjkk1403; the Natural Science Foundation of Xinjiang Uygur Autonomous Region, grant number 2023D01E18; the Tianshan Talent-Science and Technology Innovation Team, grant number 2022TSYCTD0006; and the National Natural Science Foundation of China, grant number U2003201, 41671034. We would also like to thank the reviewers for their valuable suggestions on this article.
Data Availability Statement
Restrictions apply to the datasets. The data presented in this study will be updated and published in the future. The data that support the findings of this study are available from the corresponding author (J.L), upon reasonable request at present.
Acknowledgments
The authors would like to thank the three anonymous reviewers for their valuable comments and the editor for her help with this article.
Conflicts of Interest
The authors declare no conflicts of interest.
References
- Dams, W.C.O. Dams and development a new framework for decision-making. Proc. Inst. Civ. Eng. Civ. Eng. 2001, 144, 8–9. [Google Scholar]
- Demirbas, A. Global Renewable Energy Projections. Energy Sources Part B Econ. Plan. Policy 2009, 4, 212–224. [Google Scholar] [CrossRef]
- Lehner, B.; Reidy Liermann, C.; Revenga, C.; Vorosmarty, C.; Fekete, B.; Crouzet, P.; Doll, P.; Endejan, M.; Frenken, K.; Magome, J.; et al. High-resolution mapping of the world’s reservoirs and dams for sustainable river-flow management. Front. Ecol. Environ. 2011, 9, 494–502. [Google Scholar] [CrossRef] [PubMed]
- Liu, B.; Yang, G.; He, X. Response of groundwater to the process of reservoirs group regulation and storage in Manas River Basin in Xinjiang. Int. J. Agric. Biol. Eng. 2020, 13, 224–233. [Google Scholar] [CrossRef]
- Haddeland, I.; Skaugen, T.; Lettenmaier, D.P. Anthropogenic impacts on continental surface water fluxes. Geophys. Res. Lett. 2006, 33, 26047. [Google Scholar] [CrossRef]
- Vogl, A.L.; Lopes, V.L. Impacts of water resources development on flow regimes in the Brazos River. Environ. Monit. Assess. 2009, 157, 331–345. [Google Scholar] [CrossRef] [PubMed]
- Kingsford, R.T. Ecological impacts and institutional and economic drivers for water resource development—A case study of the Murrumbidgee River, Australia. Aquat. Ecosyst. Health Manag. 2003, 6, 69–79. [Google Scholar] [CrossRef]
- Kingsford, R.T.; Thomas, R.F. Destruction of Wetlands and Waterbird Populations by Dams and Irrigation on the Murrumbidgee River in Arid Australia. Environ. Manag. 2004, 34, 383–396. [Google Scholar] [CrossRef]
- Grill, G.; Lehner, B.; Thieme, M.; Geenen, B.; Tickner, D.; Antonelli, F.; Babu, S.; Borrelli, P.; Cheng, L.; Crochetiere, H.; et al. Mapping the world’s free-flowing rivers. Nature 2019, 569, 215–221. [Google Scholar] [CrossRef]
- Wang, B.; Zhang, H.; Liang, X.; Li, X.; Wang, F. Cumulative effects of cascade dams on river water cycle: Evidence from hydrogen and oxygen isotopes. J. Hydrol. 2019, 568, 604–610. [Google Scholar] [CrossRef]
- Annys, S.; Ghebreyohannes, T.; Nyssen, J. Impact of Hydropower Dam Operation and Management on Downstream Hydrogeomorphology in Semi-Arid Environments (Tekeze, Northern Ethiopia). Water 2020, 12, 2237. [Google Scholar] [CrossRef]
- Sang, L.; Zhu, G.; Xu, Y.; Sun, Z.; Zhang, Z.; Tong, H. Effects of Agricultural Large-And Medium-Sized Reservoirs on Hydrologic Processes in the Arid Shiyang River Basin, Northwest China. Water Resour. Res. 2023, 59, e2022WR033519. [Google Scholar] [CrossRef]
- Taleb, A.; Belaidi, N.; Gagneur, J. Water quality before and after dam building on a heavily polluted river in semi-arid Algeria. River Res. Appl. 2004, 20, 943–956. [Google Scholar] [CrossRef]
- Ablat, X.; Wang, Q.; Arkin, N.; Guoping, T.; Sawut, R. Spatiotemporal variations and underlying mechanism of the floodplain wetlands in the meandering Yellow River in arid and semi-arid regions. Ecol. Indic. 2022, 136, 108709. [Google Scholar] [CrossRef]
- Yi, Y.; Zhou, Y.; Song, J.; Zhang, S.; Cai, Y.; Yang, W.; Yang, Z. The effects of cascade dam construction and operation on riparian vegetation. Adv. Water Resour. 2019, 131, 103206. [Google Scholar] [CrossRef]
- Tao, H.; Gemmer, M.; Bai, Y.; Su, B.; Mao, W. Trends of streamflow in the Tarim River Basin during the past 50years: Human impact or climate change? J. Hydrol. 2011, 400, 1–9. [Google Scholar] [CrossRef]
- Soesbergen, A.V.; Chu, Z.; Shi, M.; Mulligan, M. Dam Reservoir Extraction From Remote Sensing Imagery Using Tailored Metric Learning Strategies. IEEE Trans. Geosci. Remote Sens. 2022, 60, 4207414. [Google Scholar] [CrossRef]
- Mulligan, M.; van Soesbergen, A.; Sáenz, L. GOODD, a global dataset of more than 38,000 georeferenced dams. Sci. Data 2020, 7, 31. [Google Scholar] [CrossRef]
- Donchyts, G.; Winsemius, H.; Baart, F.; Dahm, R.; Schellekens, J.; Gorelick, N.; Iceland, C.; Schmeier, S. High-resolution surface water dynamics in Earth’s small and medium-sized reservoirs. Sci. Rep. 2022, 12, 13776. [Google Scholar] [CrossRef]
- Khandelwal, A.; Karpatne, A.; Ravirathinam, P.; Ghosh, R.; Wei, Z.; Dugan, H.A.; Hanson, P.C.; Kumar, V. ReaLSAT, a global dataset of reservoir and lake surface area variations. Sci. Data 2022, 9, 356. [Google Scholar] [CrossRef]
- Song, C.; Fan, C.; Zhu, J.; Wang, J.; Sheng, Y.; Liu, K.; Chen, T.; Zhan, P.; Luo, S.; Yuan, C.; et al. A comprehensive geospatial database of nearly 100 000 reservoirs in China. Earth Syst. Sci. Data 2022, 14, 4017–4034. [Google Scholar] [CrossRef]
- Wang, J.; Walter, B.A.; Yao, F.; Song, C.; Ding, M.; Maroof, A.S.; Zhu, J.; Fan, C.; McAlister, J.M.; Sikder, S.; et al. GeoDAR: Georeferenced global dams and reservoirs dataset for bridging attributes and geolocations. Earth Syst. Sci. Data 2022, 14, 1869–1899. [Google Scholar] [CrossRef]
- Zhang, A.T.; Gu, V.X. Global Dam Tracker: A database of more than 35,000 dams with location, catchment, and attribute information. Sci. Data 2023, 10, 111. [Google Scholar] [CrossRef] [PubMed]
- Zhang, B.; Li, J.; Shen, Q.; Wu, Y.; Zhang, F.; Wang, S.; Yao, Y.; Guo, L.; Yin, Z. Recent research progress on long time series and large scale optical remote sensing of inland water. J. Remote Sens. 2021, 25, 37–52. [Google Scholar] [CrossRef]
- Verpoorter, C.; Kutser, T.; Seekell, D.A.; Tranvik, L.J. A global inventory of lakes based on high-resolution satellite imagery. Geophys. Res. Lett. 2014, 41, 6396–6402. [Google Scholar] [CrossRef]
- Feng, M.; Sexton, J.O.; Channan, S.; Townshend, J.R. A global, high-resolution (30-m) inland water body dataset for 2000: First results of a topographic-spectral classification algorithm. Int. J. Digit. Earth 2016, 9, 113–133. [Google Scholar] [CrossRef]
- Pi, X.; Luo, Q.; Feng, L.; Xu, Y.; Tang, J.; Liang, X.; Ma, E.; Cheng, R.; Fensholt, R.; Brandt, M.; et al. Mapping global lake dynamics reveals the emerging roles of small lakes. Nat. Commun. 2022, 13, 5777. [Google Scholar] [CrossRef]
- Hou, J.; Van Dijk, A.I.J.M.; Renzullo, L.J.; Larraondo, P.R. GloLakes: A database of global lake water storage dynamics from 1984 to present derived using laser and radar altimetry and optical remote sensing. Earth Syst. Sci. Data Discuss. 2022, 201–208, in review. [Google Scholar] [CrossRef]
- Pekel, J.F.; Cottam, A.; Gorelick, N.; Belward, A.S. High-resolution mapping of global surface water and its long-term changes. Nature 2016, 540, 418–422. [Google Scholar] [CrossRef]
- Zhao, G.; Gao, H. Automatic Correction of Contaminated Images for Assessment of Reservoir Surface Area Dynamics. Geophys. Res. Lett. 2018, 45, 6092–6099. [Google Scholar] [CrossRef]
- Wang, J. Study on spatiotemporal characteristics of drought in Xinjiang based on Multi-Source Weighted-Ensemble Precipitation multi-source merged precipitation product. Arid Zone Res. 2022, 39, 1398–1409. [Google Scholar] [CrossRef]
- Water Resources Bulletin of Xinjiang Uygur Autonomous Region. Available online: http://slt.xinjiang.gov.cn/ (accessed on 11 September 2023).
- Ghansah, B.; Foster, T.; Higginbottom, T.P.; Adhikari, R.; Zwart, S.J. Monitoring spatial-temporal variations of surface areas of small reservoirs in Ghana’s Upper East Region using Sentinel-2 satellite imagery and machine learning. Phys. Chem. Earth Parts A/B/C 2022, 125, 103082. [Google Scholar] [CrossRef]
- Wang, S. Encyclopaedia of Xinjiang Rivers and Lakes; China Water & Power Press: Beijing, China, 2011. [Google Scholar]
- Li, X.; Hu, Z.; Qin, M. Urumqi River Basin Chronicle; Xinjiang People’s Publishing House: Urumqi, China, 2000. [Google Scholar]
- Wang, Y.; Cui, Z.; Wang, F. Aksu River Basin Chronicles; China Local Records Publishing House: Beijing, China, 2006. [Google Scholar]
- Li, J. Yarkant River Basin Chronicle; Xinjiang People’s Publishing House: Urumqi, China, 2008. [Google Scholar]
- Li, Z.; Demir, I. U-net-based semantic classification for flood extent extraction using SAR imagery and GEE platform: A case study for 2019 central US flooding. Sci. Total Environ. 2023, 869, 161757. [Google Scholar] [CrossRef] [PubMed]
- Zhao, X.; Wang, H.; Liu, L.; Zhang, Y.; Liu, J.; Qu, T.; Tian, H.; Lu, Y. A Method for Extracting Lake Water Using ViTenc-UNet: Taking Typical Lakes on the Qinghai-Tibet Plateau as Examples. Remote Sens. 2023, 15, 4047. [Google Scholar] [CrossRef]
- Ronneberger, O.; Fischer, P.; Brox, T. U-Net: Convolutional Networks for Biomedical Image Segmentation. In Proceedings of the Medical Image Computing and Computer-Assisted Intervention—MICCAI 2015, Cham, Switzerland, 5–9 October 2015; pp. 234–241. [Google Scholar]
- Wang, N.; Cheng, J.; Zhang, H.; Cao, H.; Liu, J. Application of U-net model to water extraction with high resolution remote sensing data. Remote Sens. Land Resour. 2020, 32, 35–42. [Google Scholar]
- Shi, J.; Shen, Q.; Peng, H.; Li, L.; Yao, Y.; Wang, M.; Wang, R. Research on Urban Water Body Extraction based on Transfer Learning of Three High-resolution Image Datasets. Remote Sens. Technol. Appl. 2022, 37, 731–738. [Google Scholar]
- Lin, T.; Goyal, P.; Girshick, R.; He, K.; Dollár, P. Focal Loss for Dense Object Detection. In Proceedings of the 2017 IEEE International Conference on Computer Vision (ICCV), Venice, Italy, 22–29 October 2017; pp. 2999–3007. [Google Scholar]
- Kalinaki, K.; Malik, O.A.; Ching Lai, D.T. FCD-AttResU-Net: An improved forest change detection in Sentinel-2 satellite images using attention residual U-Net. Int. J. Appl. Earth Obs. Geoinf. 2023, 122, 103453. [Google Scholar] [CrossRef]
- Lehner, B.; Grill, G. Global river hydrography and network routing: Baseline data and new approaches to study the world’s large river systems. Hydrol. Process. 2013, 27, 2171–2186. [Google Scholar] [CrossRef]
- Wang, X.; Xiao, X.; Qin, Y.; Dong, J.; Wu, J.; Li, B. Improved maps of surface water bodies, large dams, reservoirs, and lakes in China. Earth Syst. Sci. Data 2022, 14, 3757–3771. [Google Scholar] [CrossRef]
- van Bemmelen, C.W.T.; Mann, M.; de Ridder, M.P.; Rutten, M.M.; van de Giesen, N.C. Determining water reservoir characteristics with global elevation data. Geophys. Res. Lett. 2016, 43, 11278–11286. [Google Scholar] [CrossRef]
- Zhang, F.; Cui, N.; Guo, S.; Yue, Q.; Jiang, S.; Zhu, B.; Yu, X. Irrigation strategy optimization in irrigation districts with seasonal agricultural drought in southwest China: A copula-based stochastic multiobjective approach. Agric. Water Manag. 2023, 282, 108293. [Google Scholar] [CrossRef]
- Nam, W.-H.; Kim, T.; Hong, E.-M.; Choi, J.-Y. Regional Climate Change Impacts on Irrigation Vulnerable Season Shifts in Agricultural Water Availability for South Korea. Water 2017, 9, 735. [Google Scholar] [CrossRef]
- Dinh, H.X.; Hoang, T.T.; Ha, L.T.; Nguyen, T.V.; Pham, T.C.; Nguyen, M.C.; Luong, H.T. Remote Sensing-Based Accounting of Reservoir’s Water Storage for Water Scarcity Mitigation: A Case Study for Small and Medium Irrigation Dams in Vietnam. J. Geosci. Environ. Prot. 2021, 9, 89–97. [Google Scholar] [CrossRef]
- Nan, X.; Li, A.; Deng, W. Data Set of “Digital Mountain Map of China” (2015); A Big Earth Data Platform for Three Poles; National Tibetan Plateau/Third Pole Environment Data Center: Beijing, China, 2022. [Google Scholar] [CrossRef]
- Hanshaw, M.N.; Bookhagen, B. Glacial areas, lake areas, and snow lines from 1975 to 2012: Status of the Cordillera Vilcanota, including the Quelccaya Ice Cap, northern central Andes, Peru. Cryosphere 2014, 8, 359–376. [Google Scholar] [CrossRef]
- Lyons, E.A.; Sheng, Y.; Smith, L.C.; Li, J.; Hinkel, K.M.; Lenters, J.D.; Wang, J. Quantifying sources of error in multitemporal multisensor lake mapping. Int. J. Remote Sens. 2013, 34, 7887–7905. [Google Scholar] [CrossRef]
- Gu, X.; Li, M.; Xu, D.; Zhang, B.; Nie, X.; Wang, S.; Zhang, Z.; Liu, Q.; Li, J.; Huang, W.; et al. Report on Remote Sensing Monitoring of China Sustainable Development (2019); Social Sciences Academic Press: Beijing, China, 2020. [Google Scholar]
- Li, J.; Liu, Y.; Peng, Z.; Yang, Y. Characteristics and construction managementideas of reservoir dams in Xinjiang. China Water Resour. 2023, 16, 41–46. [Google Scholar]
- Standard for Rank Classification and Flood Protection Criteria of Water and Hydropower Projects; China Water&Power Press: Beijing, China, 2017.
- Liu, K.; Song, C.Q.; Wang, J.D.; Ke, L.H.; Zhu, Y.Q.; Zhu, J.Y.; Ma, R.H.; Luo, Z. Remote Sensing-Based Modeling of the Bathymetry and Water Storage for Channel-Type Reservoirs Worldwide. Water Resour. Res. 2020, 56, e2020WR027147. [Google Scholar] [CrossRef]
- Weekley, D.; Li, X.G. Tracking Multidecadal Lake Water Dynamics with Landsat Imagery and Topography/Bathymetry. Water Resour. Res. 2019, 55, 8350–8367. [Google Scholar] [CrossRef]
Disclaimer/Publisher’s Note: The statements, opinions and data contained in all publications are solely those of the individual author(s) and contributor(s) and not of MDPI and/or the editor(s). MDPI and/or the editor(s) disclaim responsibility for any injury to people or property resulting from any ideas, methods, instructions or products referred to in the content. |
© 2024 by the authors. Licensee MDPI, Basel, Switzerland. This article is an open access article distributed under the terms and conditions of the Creative Commons Attribution (CC BY) license (https://creativecommons.org/licenses/by/4.0/).