Article

Investigating Prior-Level Fusion Approaches for Enriched Semantic Segmentation of Urban LiDAR Point Clouds

1
College of Geomatic Sciences and Surveying Engineering, IAV Hassan II, Rabat 6202, Morocco
2
UR SPHERES, Geomatics Unit, University of Liège, 4000 Liège, Belgium
*
Author to whom correspondence should be addressed.
Remote Sens. 2024, 16(2), 329; https://doi.org/10.3390/rs16020329
Submission received: 5 December 2023 / Revised: 31 December 2023 / Accepted: 9 January 2024 / Published: 13 January 2024

Abstract

:
Three-dimensional semantic segmentation is the foundation for automatically creating enriched Digital Twin Cities (DTCs) and their updates. For this task, prior-level fusion approaches show more promising results than other fusion levels. This article proposes a new approach by developing and benchmarking three prior-level fusion scenarios to enhance the outcomes of point cloud-enriched semantic segmentation. The latter were compared with a baseline approach that used the point cloud only. In each scenario, specific prior knowledge (geometric features, classified images, or classified geometric information) and aerial images were fused into the neural network’s learning pipeline with the point cloud data. The goal was to identify the one that most profoundly enhanced the neural network’s knowledge. Two deep learning techniques, “RandLaNet” and “KPConv”, were adopted, and their parameters were modified for different scenarios. Efficient feature engineering and selection for the fusion step facilitated the learning process and improved the semantic segmentation results. Our contribution provides a good solution for addressing some challenges, particularly for more accurate extraction of semantically rich objects from the urban environment. The experimental results have demonstrated that Scenario 1 has higher precision (88%) on the SensatUrban dataset compared to the baseline approach (71%), the Scenario 2 approach (85%), and the Scenario 3 approach (84%). Furthermore, the qualitative results obtained by the first scenario are close to the ground truth. Therefore, it was identified as the efficient fusion approach for point cloud-enriched semantic segmentation, which we have named the efficient prior-level fusion (Efficient-PLF) approach.

1. Introduction

Many cities worldwide are building their Digital Twin Cities (DTCs) [1]. Semantic 3D city models, essentially built from LiDAR point clouds through semantic segmentation, are the foundation for developing these DTCs both for academic and industry research [2,3]. Semantic segmentation allows for the semantic enrichment of 3D city models, their updates, and the performance of multiple spatial and thematic analyses for city management, urban planning, and decision making. Despite challenges in acquisition and processing, LiDAR technology has made significant advancements in capturing highly detailed three-dimensional data with substantial point density, finding versatile applications in urban planning, outdoor navigation, and urban environmental studies [4].
The advancement of computer vision technology and the widespread utilization of deep learning (DL) methods have resulted in the development of more robust and reliable 3D semantic segmentation techniques. Indeed, many DL techniques have been developed recently for 3D semantic segmentation [5,6,7]. DL techniques are proposed to handle complex tasks in various LiDAR applications. Among these techniques, we can cite the deep neural networks (DNNs), which have gained considerable popularity and attention due to their efficiency. The present focus is on developing new DL-based approaches to enhance the quality of semantic segmentation outcomes. Then, it is necessary to compare them with the existing approaches to derive the most suitable one for LiDAR point clouds processing.
In the literature, we observe that achieving the maximum amount of semantic information in the urban environment (i.e., extracting the maximum of urban objects such as Traffic Roads, Cars, etc.) with high precision remains a challenge. Most current approaches to semantic segmentation using LiDAR point clouds demonstrate good accuracy for easily extractable classes such as Buildings and Ground. However, extracting more detail and accurately identifying challenging classes, such as Parking and Street Furniture, remains an important research topic. To address this challenge, fusion approaches show higher accuracy compared to non-fusion approaches [8,9]. Within fusion approaches, prior-level fusion approaches exhibit better precision than point-level, feature-level, and decision-level fusion approaches, as explained later. This is why the objective was to delve into this family of prior-level approaches. To achieve this, we proposed an efficient prior-level fusion approach to enhance the knowledge of deep learning techniques for 3D semantic segmentation by integrating prior knowledge into the learning pipeline. This approach explicitly tackles the challenge of accurately extracting the maximum amount of urban objects (Footpaths, High Vegetation, etc.). It is motivated by the understanding that 3D semantic segmentation can gain advantages from the fusion of point clouds (PCs), aerial images, and prior knowledge, especially in cases where the differentiation between detailed urban objects is challenging. Some initiatives have been proposed in the literature [10], but to the best of our knowledge, no study has systematically developed and evaluated all possible scenarios of injecting prior knowledge and aerial images into point clouds, especially during the training phase of DL techniques. We have not only moved beyond traditional PC attributes but have also adopted advanced DL techniques, “RandLaNet [5]” and “KPConv [8]”, and optimized their parameters. For finding the efficient approach, three distinct scenarios were conceived and investigated. Each scenario involved the fusion of PCs, aerial images, and a specific type of prior knowledge. The efficient scenario that demonstrated the ability to extract the maximum amount of semantic information in an urban environment was identified from the evaluations. This scenario is derived as the “Efficient-PLF approach”. Our research’s potential lies in deploying an automated enriched semantic segmentation pipeline with a high level of detail. While we have highlighted the optimal scenario, presenting all three scenarios not only ensures a comprehensive benchmark but also affirms the robustness and validity of our chosen approach. Each scenario is based on a specific workflow and provides different performances. It worth highlighting that even the two other scenarios that were not chosen as optimal are useful in specific use cases. For example, the second scenario, despite not being the primary choice, was recommended due to its outstanding performance on certain specific classes.
The following are the main contributions of this paper:
  • Designing three prior-level fusion scenarios for 3D semantic segmentation that fuse PCs, aerial images, and prior knowledge into the DL pipeline;
  • Evaluating the performance of each scenario in terms of enhancing DL techniques’ knowledge;
  • Enhancing semantic segmentation richness by detecting a maximum number of urban classes more efficiently and accurately;
The paper is organized as follows: Section 2 showcases the principal advancements made in fusion-based approaches for PC semantic segmentation. A detailed description of the fusion scenarios we developed is presented in Section 3. The experimental methodology and the obtained results are reported in Section 4. The discussion of our findings is in Section 5. Finally, the paper ends with a conclusion.

2. Related Works

The increasing need for automated urban assets extraction has resulted in 3D semantic segmentation of multi-sensor data becoming a rapidly growing and dynamic field of research. Although 3D urban semantic segmentation is based on 3D LiDAR data, other data sources (geometric features, classified images, etc.) can provide supplementary relevant information. The latter can compensate for the limits of 3D PCs; such as the confusion between artificial and natural objects and the fact that PCs are less suitable for delineating object contours. Promising results have been achieved in 3D semantic segmentation through the fusion of 3D PCs with other data sources, as demonstrated by several studies in the literature [9,10]. Furthermore, adding highly informative data is a major boost to semantic segmentation. The DL revolution has demonstrated that many three-dimensional semantic segmentation challenges (the automation of treatments, their speed, the precision of results, etc.) are addressed by DL techniques (PointNet++, SPGraph, etc.). On the other hand, it is well known that more training labelled PCs are required for learning models. Motivated by the high demand for training data, various datasets have been developed recently. The majority of them are freely available online. We can list Toronto-3D, SensatUrban [11], Benchmark Dataset of Semantic Urban Meshes (SUM) [12], and Semantic3D [13]. Despite the efforts made, 3D semantic segmentation remains a delicate and complex task due to the spectral and geometric similarity between different urban classes. Due to the remarkable performance achieved lastly by fusion approaches in semantic segmentation tasks, it would be interesting to advance in this research niche. Fusion-based approaches are applied by fusing data from different sensors at different fusion levels. Fusion-based approaches can be categorized into four families that combine PCs with other sources: (1) Prior-level fusion approaches, (2) Point-level fusion approaches, (3) Feature-level fusion approaches, and (4) Decision-level fusion approaches.

2.1. Prior-Level Fusion Approaches

Fusing at the prior level assigns classified images to 3D PCs, enhancing LiDAR data semantic segmentation. This approach expedites convergence and reduces loss, thanks to direct image classification [14], but has challenges with non-overlapping areas and uncertainties [15]. There is a scarcity of prior-level fusion approach-based studies in the existing literature. Among them, ref. [16] proposed a fusion approach of images and LiDAR PCs for semantic segmentation. The proposed approach was compared with point-level, feature-level, and decision-level fusion approaches. The ISPRS dataset evaluation showed that the proposed approach outperformed all other fusion approaches with a good F1-score (82.79%). Ref. [17] proposes a fusion approach based on 2D images and 3D PCs to segment complex urban environments. The prior knowledge obtained from 2D images was mapped to PCs. Subsequently, the fine features of building objects were precisely and directly extracted from the PCs based on mapping results. Their results showed that the created model is adapted for high-resolution images and large-scale environments. Finally, a recent study [18] presented a new fusion approach for semantic segmentation in urban areas, which operates at the prior level. Their approach utilizes both aerial images and 3D PCs. Achieving an intersection over union of 96%, their results outperform the non-fusion approach, which only achieves 92%.

2.2. Point-Level Fusion Approaches

Point-level fusion assigns optical image spectral data to each point and uses a DL technique for 3D point cloud semantic segmentation. While these methods yield good results, they demand significant memory, computation time, and synchronized data acquisition times. Several point-level fusion processes are available for 3D semantic segmentation. Ref. [19] introduced PMNet, a DL architecture that merges optical images with PC, accounting for the permutation invariance properties of the latter. This approach has proven to be superior to observational- and global feature-level fusion approaches. Meanwhile, ref. [20] developed a CNN-based approach for 3D semantic segmentation by integrating radiometric properties from image data. When tested on the SemanticKITTI dataset, their approach exhibited an 8.7% increased average accuracy in certain categories relative to a separate approach that combines image and PC, and it operated with a faster runtime. In another study, ref. [21] investigated the benefits of blending CASI (Compact Airborne Spectrographic Imager) hyperspectral and airborne LiDAR data for land cover semantic segmentation, employing PCA (Principal Components Analysis) and layer stacking. They used ML (Maximum Likelihood) and SVM (Support Vector Machine) classifiers for data categorization, observing that the fusion approach delivered an accuracy improvement of 9.1% and 19.6%, respectively, over approaches utilizing only LiDAR or CASI data.

2.3. Feature-Level Fusion Approaches

Feature-level fusion combines optical image and 3D point cloud features through neural networks for semantic segmentation. Such fusion delivers robust results, outperforming approaches using only radiometric or geometrical data [18]. However, drawbacks such as orthophoto wrapping and LiDAR’s limitations in capturing occluded objects are notable. The importance of feature fusion in enhancing the quality of semantic segmentation is widely recognized in the literature. Ref. [22] employed spectral, texture, and shape features from hyperspectral images to minimize classification errors, emphasizing that it is challenging to find a singular optimal combination of features suitable for all datasets. They showed that even a basic combinatorial process using complementary features can be effective and highlighted the advantage of incorporating spatial information (shape features, texture, etc.) for improved semantic segmentation. In another study conducted by [23], a feature fusion approach was presented for classification tasks that utilized softmax regression. This approach took into account the likelihood of an object sample belonging to different classes and incorporated object-to-class similarity information. Experiments revealed that their method surpassed other baseline feature fusion methods like SVM and logistic regression, particularly in gauging feature similarity across multiple spaces, underscoring the potential of a softmax regression-based approach.

2.4. Decision-Level Fusion Approaches

Decision-level fusion merges the outcomes of semantic segmentation from individual neural networks, combining results from classifiers focused on either LiDAR space or pixel [24]. This fusion offers advantages like independent training and low complexity, given that each modality employs its own DL technique, capturing distinct feature representations. Yet, its reliance on both classifiers can inherit their limits, and it demands more memory and extra parameters due to its DL structure. The existing literature on decision-level fusion is sparse [15] introduced a fusion approach for classification and object detection, fusing semantic segmentation results from unary classifiers via a CNN. Their approach, tested on the KITTI benchmark, achieved a 77.72% average precision. However, it had real-time application challenges and lower accuracies for “cyclists” and “pedestrians” classes because of sensor-derived incomplete data. Similarly, ref. [25] suggested a fusion approach combining object-based image analysis on multiview very-high-resolution imagery and DSM. Their approach bolstered object recognition accuracy, showing improvements in kappa and overall accuracy metrics for DMC and WorldView-2 benchmarks. Yet, not all DMC benchmark class results were enhanced. Lastly, ref. [26] presented a late fusion approach merging multi-modality information. The approach includes a pairwise CRF (Conditional Random Field) to enhance the spatial consistency of the structured prediction in a post-processing stage. Using the KITTI dataset for evaluation, their approach achieved a class accuracy of 65.4% and a per-pixel accuracy of 89.3%.

2.5. Summary

Previous research has highlighted the effectiveness of semantic segmentation approaches that leverage PCs combined with other data sources, such as satellite or aerial images. It demonstrates precise and high-quality visual outputs. In the literature, the commonly used fusion approaches of 3D LiDAR and image data can be categorized into four main types: prior-level, point-level, feature-level, and decision-level fusion approaches. The prior-level approaches are the new fusion approaches in the literature. They have enhanced the accuracy of semantic segmentation results. Additionally, they demonstrate good performances in semantic segmentation, especially in terms of precision. This precision was improved by the direct use of semantic knowledge from classified images. Moreover, they demonstrated the low-loss function in training and testing steps in comparison to other fusion approaches. Thus, because this approach type integrates semantic information from images, the loss reaches a stable state faster and becomes smaller. However, these processes are a bit long. The point-level fusion approaches are the most dominant, quickest, and simplest in the literature. However, these processes are not able to classify complex urban scenes containing a diversity of urban objects, especially, the geo-objects with geometric and radiometric similarity. The feature-level fusion approaches allow objective data compression. Consequently, they guarantee a certain degree of precision and retain enough important information. Nevertheless, the features extracted sometimes do not reflect the real objects. The decision-level fusion approaches are less complex and flexible. For that reason, the two semantic segmentation processes (one of the images and the other of the PCs) do not interfere. Nonetheless, these approach types can be affected by errors in both processes. In addition, decision-level fusion approaches require more memory since the DL structure fuses feature later. Additionally, layers need extra parameters for convolution and other operations. The performance and limitations of each approach can be accessed in Table 1 and are summarized on the following GitHub link: https://github.com/ZouhairBALLOUCH/Supplementary_Results_Article.git (accessed on 1 December 2023).

3. Materials and Methods

In this research, we adopted the prior fusion approaches that have demonstrated good results compared to the others. Therefore, we proposed and thoroughly evaluated three prior-level fusion scenarios to derive the Efficient-PLF approach, enhancing the DL technique knowledge.

3.1. Dataset

Our developed scenarios were evaluated using the SensatUrban dataset [11], which contains nearly three billion annotated points and was released at CVPR2021. The utilization of this dataset is justified by its high semantic richness compared to other existing airborne datasets. The 3D PCs were obtained by a UAV (Unmanned Aerial Vehicle) which follows a double-grid flight path. Three sites of Birmingham, Cambridge, and York cities were covered. The dataset covers about six square kilometers of an urban area with a diversity of urban objects. The SensatUrban dataset contains 13 semantic classes: Street Furniture, Traffic Road, Water, Bike, Footpath, Car, Rail, Parking, Bridge, Wall, Building, Vegetation, and Ground. Each point contains six attributes: X, Y, Z, and RGB information. The allocation of semantic categories to objects within the dataset is extremely imbalanced, with the Bike and Rail classes collectively accounting for just 0.025% of the overall points present in the dataset. The SensatUrban dataset is freely available online at (https://github.com/QingyongHu/SensatUrban, accessed on 10 March 2023). However, it should be noted that the dataset’s semantic labels for the testing data are not provided. Thus, to evaluate the proposed approach, the training data of SensatUrban were partitioned into new training and testing sets. In our experiments, a part of the training data (18 sets) were used to implement the first parts of the developed scenarios S1 and S3 (Section 3), while the remaining part of the data (16 sets) were used to implement the second steps of scenarios S1 and S3, S2, and the baseline approach (the main part of this work).

3.2. Methodology

Our study aims to create and evaluate three prior-level fusion scenarios to derive the Efficient-PLF one. Counting the baseline, the general work methodology includes four processes, as depicted in Figure 1. The first one consists of injecting classified images and spectral information as attributes into the PCs. The second is based on geometrical features (extracted from PCs), XYZ PCs, and aerial images (S2). The third classifies urban space using classified geometrical information, aerial images, and PCs (S3). The fourth process, known as the baseline approach, directly combines raw PCs and images. Afterwards, the advanced DL techniques “RandLaNet” and “KPConv” were adopted to implement the different four processes. An assessment of the results obtained by the different processes was performed based on metrics computation and visual investigations.
In aerial image fusion, the Red, Green, and Blue bands were averaged into a single attribute for each PC. The aim is to propose a cost-effective scenario with fewer inputs, relying more on the investigation of the prior knowledge to identify the best-performing scenario. In this study, we used both the RandLaNet [5] and KPConv [8] techniques to evaluate the proposed scenarios. RandLaNet, introduced by [5], is a DL technique designed for large-scale PC, offering excellent computational and memory performance through random point sampling [27]. It requires no preprocessing or postprocessing, and incorporates a local feature aggregation module to retain geometric data details. KPConv, on the other hand, directly handles PCs and stands out for its ability to place convolution weights in Euclidean space using kernel points. This technique’s adaptability ensures alignment with the point cloud’s local geometry, offering precise results. Notably, KPConv outperforms traditional techniques, making it suitable for tasks requiring accuracy and resilience against density shifts. These techniques were not selected arbitrarily; their features directly align with our objective, and their efficacy has been empirically validated in numerous studies [28,29,30,31]. The mathematical formulas for the RandLA-Net technique are detailed in Sections 3.2 and 3.3 of [5], while those for the KPConv technique are outlined in Section 3 of [8]. We want to highlight that the objective of this work does not focus on the type of DL technique but rather on finding the right approach for selecting relevant features and the efficient fusion scenario.

3.2.1. Classified Images and PC-Based Scenario (S1)

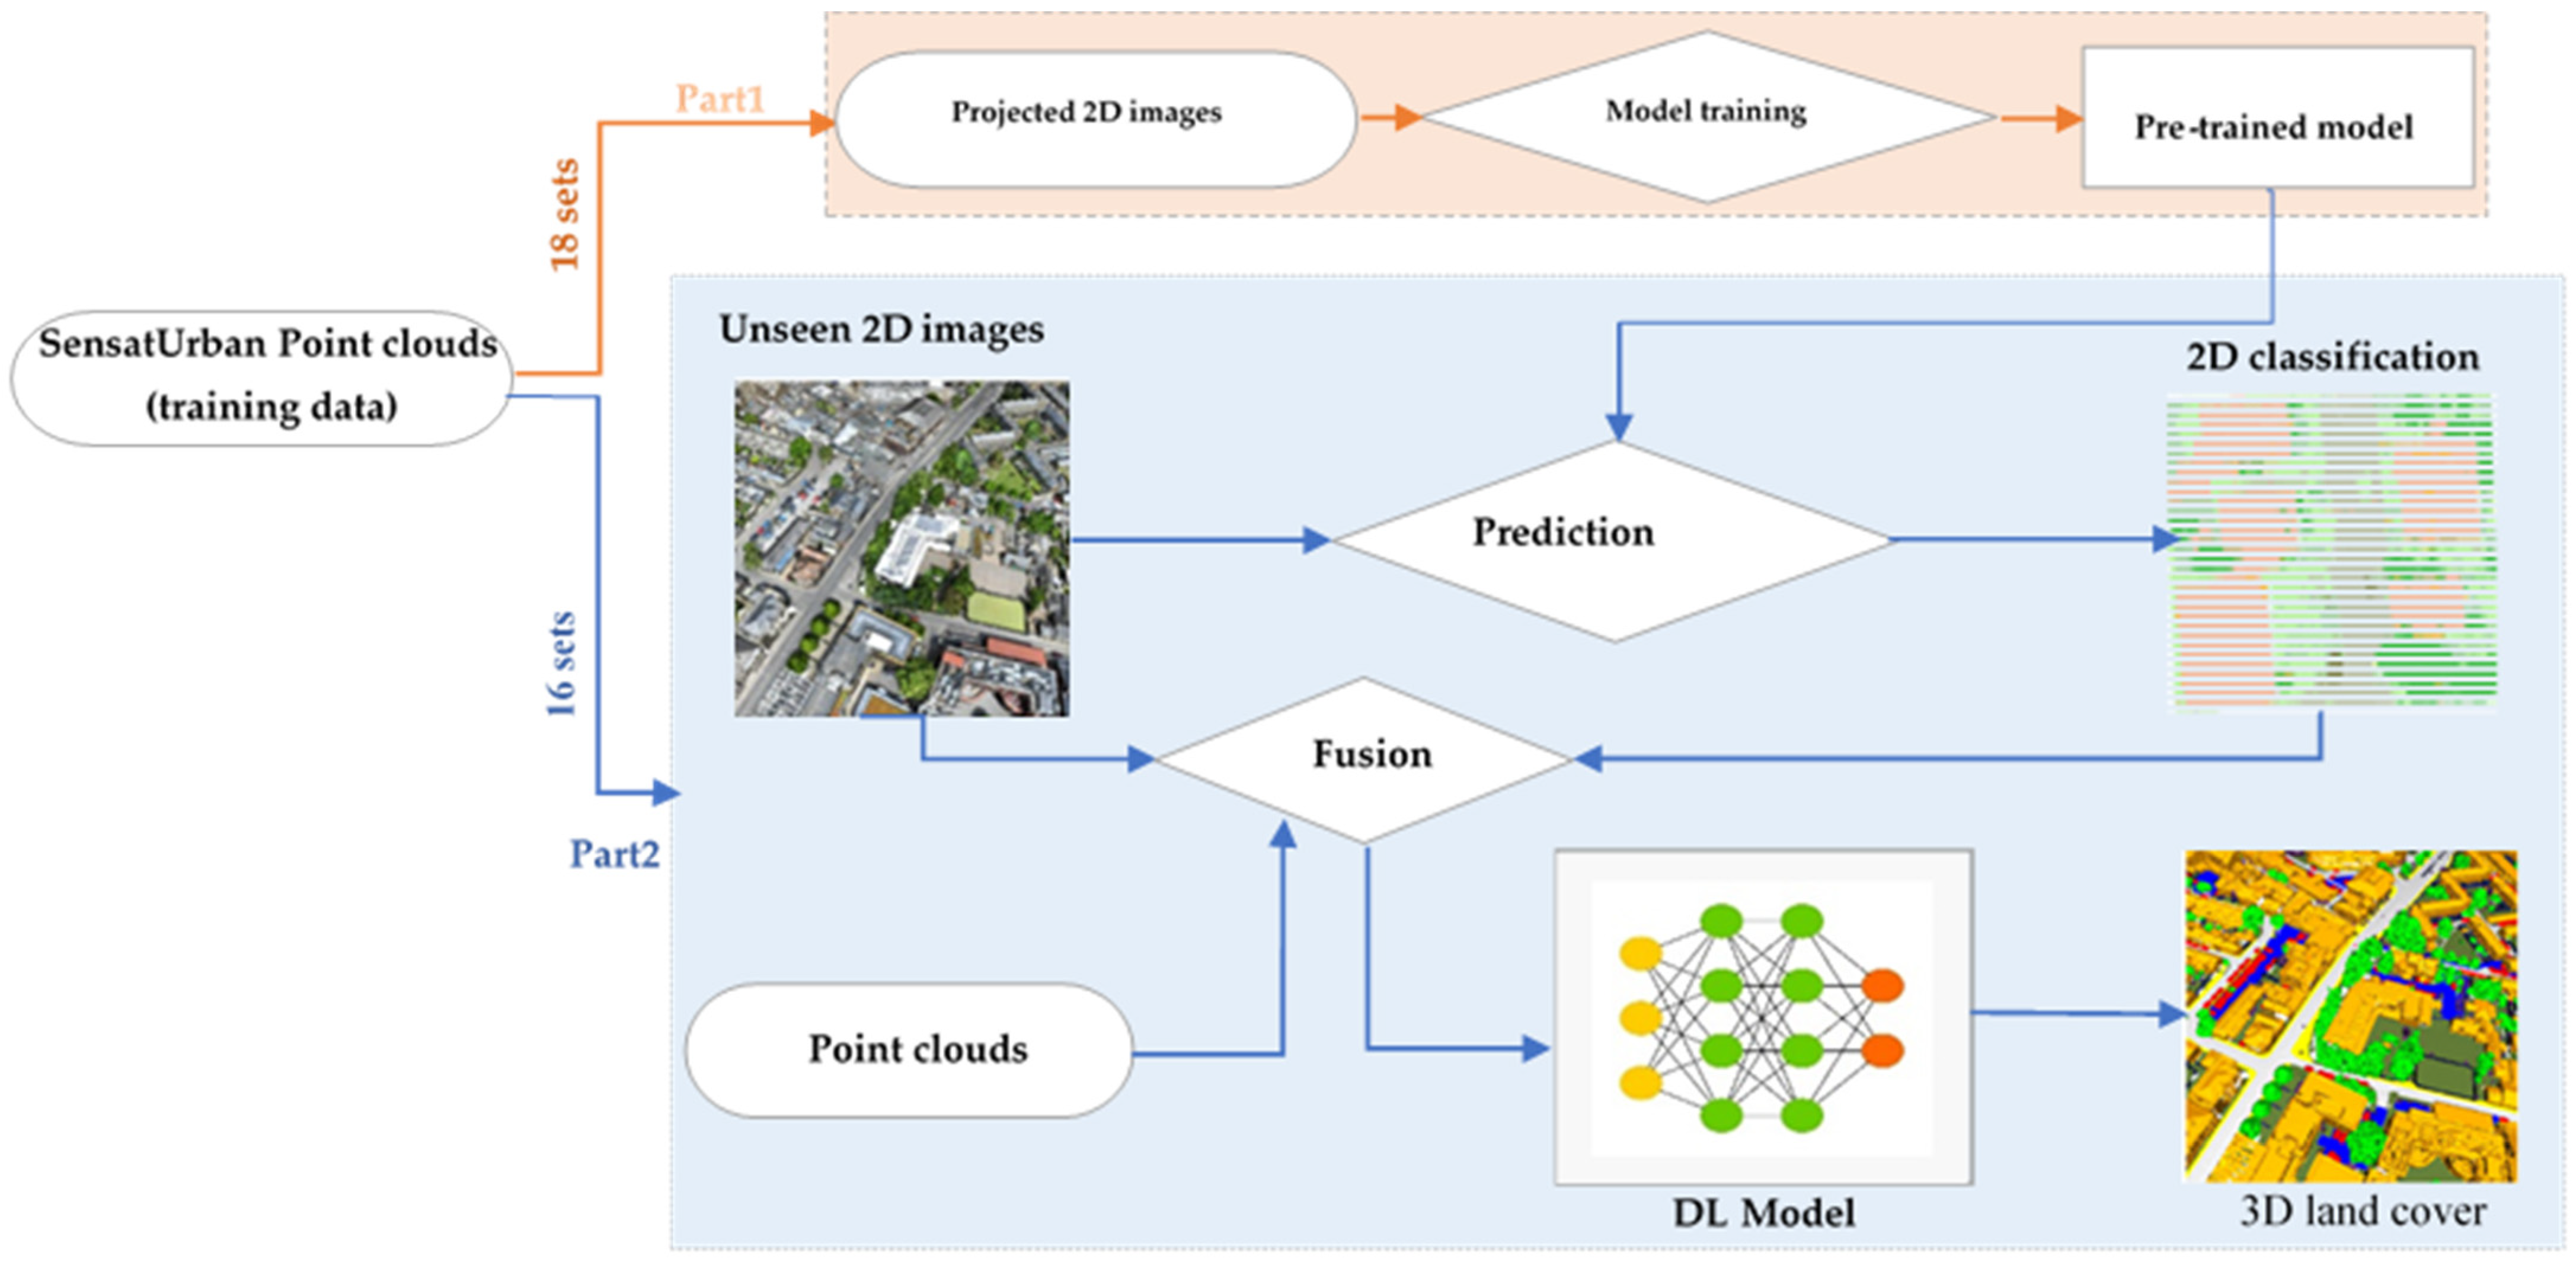
The flowchart depicted in Figure 2 summarizes the first proposed scenario (S1), which uses 3D PC, aerial images, and classified images. In this scenario, the aerial images are extracted from the projection of the 3D point cloud into a 2D representation with colors. The incorporation of aerial images into the point cloud has already been justified. However, the injection of classified images and spectral information as attributes of PCs into the DL technique during its training is justified by several reasons. Integrating classified images brings a semantic dimension to the scenario and provides detailed information about different object categories present in the urban environment. This prior knowledge enhances the neural network’s knowledge during the learning pipeline. Furthermore, it can be valuable in guiding semantic segmentation by reducing false negatives and false positives. By leveraging this semantic information, this scenario can achieve more consistent results in object identification. This accelerates the convergence of this scenario, resulting in enhanced precision in urban object extraction.
To implement this scenario, we randomly divided the SensatUrban dataset into two parts: one containing 18 PCs and the other containing 16. First, the images were extracted from the colors of the 18 PCs of the dataset. The extraction of images was performed automatically using a batch processing script. Then, the technique was trained on these images and integrating them with their attributes (Red, Green, Blue). The use of RandLaNet instead of a 2D image classification technique is justified by the fact that we just multiplied the height by a scale factor of 0. So, our image is just a flattened point cloud, not pixels. After obtaining the trained model, we returned to the dataset containing 16 PCs (part 2) and extracted the images in the same manner. We then classified them using the trained model and merged them with the PCs (XYZ coordinates) and aerial images (RGB). Thus, each point cloud contained the following attributes: X, Y, Z, R, G, B, 2D classification. Finally, these prepared PCs were used to train the techniques (RandLaNet + KPConv). The fundamental hyperparameters of the original versions of the techniques have been adapted, and the techniques were evaluated using the test data.

3.2.2. Geometric Features, PC, and Aerial Images-Based Scenario (S2)

The idea of the second proposed scenario is to combine the geometric features, XYZ PCs, and aerial images. The aim of this scenario is to examine the contribution of geometric properties to improving the knowledge of the DL technique in the semantic segmentation pipeline. As shown in Figure 3, S2 mainly contains two parts: (A) Automatically selecting the appropriate geometric features for semantic segmentation; (B) Injecting selected geometric features with aerial images into PCs to improve knowledge of the techniques (RandLaNet + KPConv).
(A)
Selection of the appropriate geometric features
The use of geometric features can help elucidate the local geometry of PCs and is now commonly employed in 3D PC processing. Extracting these properties at multiple scales instead of a single scale aims to improve precision values. “Geometric features are calculated by the eigenvalues (λ1, λ2, λ3) of the eigenvectors (v1, v2, v3) derived from the covariance matrix of any point p of the point cloud” [32]:
c o v S = 1 S p ϵ S ( p p ¯ ) ( p p ¯ ) T
where p is the centroid of the support S” [32]. Several properties are calculated using eigenvalues: omnivariance, the sum of eigenvalues, eigenentropy, linearity, anisotropy, planarity, surface variation, verticality, and sphericity. A table summarizing the mathematical formulas for geometric features can be accessed via the following link: https://github.com/ZouhairBALLOUCH/Supplementary_Results_Article.git (accessed on 1 December 2023).
Geometric feature extraction is a crucial part of 3D semantic segmentation. Independent of the urban object to be semantically segmented and the data resolution, the geometric properties significantly impact the results. The geometric features have great importance by providing the DL structure with useful information about each urban class. Consequently, it helps the classifier to distinguish between different semantic classes. However, some of these geometric properties may mislead the semantic segmentation process. So, these errors should be considered during the analysis of results.
To select the geometric properties with the most positive impact on semantic segmentation results, all geometric features were initially calculated (anisotropy, planarity, linearity, etc.). Generally, to determine the importance of these features, automatic methods can be employed, such as the feature importance assessment offered by libraries like Scikit-learn. Consequently, planarity and verticality were selected for integration as attributes of PCs based on their importance to separate between classes. The geometric features with the least impact on the model training have been removed. The following are the geometric properties used in this study:
Planarity is a characteristic that is obtained by fitting a plane to neighboring points and computing the average distance between those points and the plane [33].
Verticality: The angle between the XY-plane and the normal vector of each point is calculated using its 3D surface normal values [33].
(B)
Data Training and Semantic Segmentation Using RandLaNet and KPConv Techniques
In this scenario, selected geometric properties (planarity and verticality) and RGB from images were added as attributes to the PCs for the implementation of both the RandLaNet and KPConv techniques. To implement this scenario, we started with the preparation of the training data. As mentioned earlier, we divided our dataset into two parts. One of these parts contains 18 PCs, while the other contains 16. In the case of this specific scenario, we worked only with the set that contains 16 PCs. These are the same PCs that are used to implement the second part of the other scenarios proposed in this work. The generation of training data was performed by calculating the geometric features (planarity and verticality) for each point cloud. The calculations were performed using the Cloud Compare software (version 2.12.4). The geometric features were computed with a 0.4 m radius sphere, representing support obtained with a radius of 4 m. Afterward, these geometric properties were merged with PCs and aerial images. This data preparation methodology was applied to all the PCs in the 16 datasets used.
Afterwards, during the training step, certain configurations and data representations were adjusted for both the original versions of RandLaNet and KPConv, including the format of the input tensor and data types. Some of the hyperparameters (such as the size of the first subsampling grid and the radius of the input sphere) were also modified. Finally, after training and validation of both the RandLaNet and KPConv techniques, the pre-trained models were used to predict the labels of the test data.

3.2.3. Classified XYZ PC, PC, and Optical Images-Based Scenario (S3)

We intend to explore a third scenario that also has not been previously examined in the literature. The proposed scenario (Figure 4) involves injecting classified point cloud (based only on XYZ coordinates) and radiometric information extracted from aerial images as attributes of PCs into the DL technique’s learning pipeline. The use of PCs only in semantic segmentation may be insufficient due to the confusion between some semantic classes. To address this challenge, we decided to incorporate the described prior knowledge. This integration into DL technique’s training would enable it to learn and enhance the delineation of 3D object contours more effectively. As a result, it becomes easier to differentiate between different objects. Furthermore, a rapid convergence was also expected in the training step.
For the implementation of S3, 18 sets of the SensatUrban dataset were used to perform the first part of the scenario and 16 sets to perform its second part (see Figure 4). The proposed process includes two main steps. Firstly, 18 sets of PCs that contain only the three attributes X, Y, and Z from the SensatUrban dataset were used in the training step. After that, the pre-trained model was used to predict all PCs (that contain also only XYZ coordinates) from the rest of the dataset (part 2 of the dataset that contains 16 clouds). The obtained results were considered to be prior knowledge to obtain refined semantic segmentation results. Secondly, this prior knowledge was assigned to PCs (XYZ + aerial image) based on its coordinates. The same process of data preparation was followed to prepare all PCs from 16 sets of the dataset. The merged data were then used to train the DL technique, where the fundamental hyperparameters of the original version were changed. Additionally, the basic input tensor was modified into several channels, including X, Y, Z, R, G, B, and classified geometric information. Finally, the trained model was utilized to predict the test data, which were prepared in the same manner as the training data, in order to evaluate the technique’s performance.

3.2.4. Baseline Approach

The baseline approach [11] is a point-level fusion approach that directly combines aerial images and PC. It involves running both the RandLaNet and KPConv techniques using the following attributes: X, Y, Z, R, G, B. We compared the baseline approach with the developed scenarios to better understand how these scenarios improved the results of PC-enriched semantic segmentation. The benchmark was made with the baseline approach, which employs the most commonly used fusion method in the literature. The baseline approach includes two parts. The first one is the assignment of radiometric information from images to PC, while the second one is the adoption of both RandLaNet and KPConv to perform semantic segmentation. Figure 5 summarizes the general process followed for the implementation of the baseline approach.
To perform the RandLaNet technique, the same methodology of the existing approach [11] was followed with a slight difference. In our case, we used only 16 sets of the SensatUrban dataset to ensure a fair evaluation, similar to the developed scenarios. Additionally, we utilize the average of RGB instead of three separate columns containing the R, G, and B bands. That is, the basic input tensor was modified as follows: X, Y, Z, and average RGB. For the KPConv model, we followed a similar methodology as with RandLaNet, but tailored the input parameters and model configurations. It was crucial to ensure that both techniques were given equal footing for a fair comparison. Hence, we used the same 16 sets from the SensatUrban dataset for KPConv as well.

4. Experiments and Results Analysis

4.1. Implementation

The calculations for the study were carried out using Python programming language version 3.6, with Ubuntu version 20.04.3 as the operating system. Cloud Compare version 2.11.3 was used to calculate geometric properties and average RGB from images. Tensorflow-GPU v 1.14.0 was used as the code framework to implement the RandLaNet algorithm, with CUDA version 11.4 utilized to accelerate deep learning through parallel processing power of GPUs. All experiments were conducted on an NVIDIA GeForce RTX 3090, and a workstation with 256G RAM, a 3.70 GHz processor, and Windows 10 Pro for workstations OS (64-bit) was used for data processing. Furthermore, Scikit-learn, a free Python machine learning library, was employed to implement various processes, where optimized parameters remained unchanged throughout the study.
The RandLaNet technique is publicly available on GitHub at https://github.com/QingyongHu/RandLA-Net (accessed on 10 March 2023). The original version of the code was used to train and test the algorithm. For each scenario, the algorithm was adapted and trained six times using the provided data, and the hyperparameters were kept constant. The Adam optimization algorithm [34] was used for training with an initial learning rate of 0.01, an initial noise parameter of 3.5, and a batch size of 4. The technique was trained for 100 iterations, and all layers were included in the training. Every training process passes through two stages. The first is a forward pass, which deduces the prediction results and compares them with ground truth to generate a loss, while the second is a backward pass, in which the network weights are then updated by stochastic gradient descent. The obtained trained networks were used for the prediction of the blocks selected to test all processes. Consequently, a semantic label was assigned for each cloud point.
For our experimentation with the KPConv technique, which is publicly available on GitHub at https://github.com/HuguesTHOMAS/KPConv-PyTorch (accessed on 1 September 2023), we made specific adjustments to its parameters to optimize memory usage. We set the expected batch size order of magnitude to 10,000. The number of kernel points was designated as 15, and the radius of the input sphere was adjusted to 3.0 for memory efficiency. The size of the first subsampling grid was marked at 0.4, while the convolution radius was established at 2.5. We increased the deformable convolution radius to 5.0 to accommodate the kernel spread. Additionally, each kernel point’s area of influence was defined at 1.2, with the behavior of convolutions was set to linear. Lastly, the aggregation function of KPConv was chosen to operate in sum mode.
In order to assess the efficacy of the developed scenarios, five metrics were adopted: precision, recall, F1 score, intersection over union, and confusion matrix. Precision gauges the percentage of points identified as positive in semantic segmentation. Recall evaluates the proportion of true positives in relation to all actual positive instances. F1 score represents the harmonic mean of precision and recall. Intersection over union (IoU) quantifies the extent of overlap between predicted and actual results. Evaluation of these metrics was conducted on Google Colaboratory.

4.2. Results

To highlight the semantic segmentation outcomes of the four processes, this section offers a dual analysis. In the first part, the results obtained using the RandLaNet technique are detailed. In the subsequent section, the results achieved using the KPConv technique are presented to validate and confirm the initial findings. For a comprehensive evaluation, described metrics are employed, along with a qualitative assessment that involves visually comparing predicted (synthetic) and observed (actual) data. Furthermore, we compare the Efficient-PLF approach with certain DL techniques from the literature in our results analysis.

4.2.1. Primary Semantic Segmentation Results Using RandLaNet

(A)
Quantitative Assessments
In this subsection, we evaluate the scenarios S1, S2, and S3 with the baseline approach using test set data. The comparisons are reported in Table 1. Since several scenarios were evaluated in this work, the same data splits were used for the RandLaNet algorithm’s training, validation, and testing to ensure a fair and consistent evaluation. Four urban scenes (four test sets) were used to evaluate the trained models and did not contribute to the training processes. We can see that all developed scenarios outperform the baseline approach in all evaluation metrics. The experimental results show that S1 delivers the best performance over other scenarios, which was manifested mainly in the higher IoU and highest precision in the obtained results. For example, in scene 1, the IoUs of S1, S2, S3, and the baseline approach were 80%, 77%, 75%, and 63%, respectively. Table 1 displays the achieved semantic segmentation accuracies.
Table 1. Quantitative results for developed scenarios and baseline approach using RandLaNet.
UrbanProcessesF1-ScoreRecallPrecisionIoU
Scene 1Baseline approach0.710.770.710.63
S10.870.870.880.80
S20.850.860.850.77
S30.830.840.840.75
Scene 2Baseline approach0.820.860.790.75
S10.930.920.940.88
S20.920.910.920.86
S30.900.900.910.85
Scene 3Baseline approach0.750.780.740.67
S10.860.850.880.79
S20.840.830.870.77
S30.830.820.860.76
Scene 4Baseline approach0.610.680.580.50
S10.800.780.840.68
S20.790.780.820.67
S30.700.720.760.57
Based on the results from Table 1, S1 has obvious advantages, but the difference between it and S2 is relatively small. From the results of each metric, we can see that S1 achieved 88/80%, 94/88%, 88/79%, and 84/68% semantic segmentation precision/IoU in the four urban scenes. Compared to the baseline approach, S1 increases the semantic segmentation IoU of each scene by 17%, 13%, 12%, and 18%, respectively. Also, S2 increases the semantic segmentation IoU of each scene by 14%, 11%, 10%, and 17%, respectively. Additionally, S3 increases the semantic segmentation IoU of each scene by 12%, 10%, 9%, and 7%, respectively. The poor precision obtained by the baseline approach could be explained by the lack of prior knowledge from images or PC, which could provide useful information related to urban space. Therefore, it is difficult to obtain accurately diversified objects’ semantic segmentation by the direct fusion of PCs and image data. On the other hand, S1 has advantages over both the scenarios with geometric features (S2) and with classified geometrical information (S3). The results obtained by S1 indicated that the integration of prior knowledge from images (image classification) improves the 3D semantic segmentation. It improved the semantic segmentation precision to around 94% in scene 2, for example. Additionally, with the help of prior knowledge from classified images in S1, we achieved about a 17% increase in overall precision compared to the baseline approach. Therefore, based on the evaluation metrics, we can conclude that the overall performance of S1 shows promising potential.
Having discussed the general evaluation metrics for semantic segmentation outcomes, Table 2 provides a comprehensive analysis of the performance for each semantic class obtained from the different scenarios and the baseline approach.
After detailed analysis of the class-specific metrics, clear variations emerged across the scenarios. Using the F1-score as our main evaluation measure, S1 excelled in the “Ground” class with an F1-score of 0.94. For “High Vegetation”, S1, S2, and S3 all reached a similar high precision. In the “Buildings” category, S1 slightly led with an F1-score of 0.97, while for “Walls”, S2 was the best at 0.77. S1 was consistently ahead in “Parking” and “Traffic Roads” with scores of 0.55 and 0.78, respectively. The “Street Furniture” scores were modest but saw S1 and S2 closely matched and outperforming both the baseline and S3. In the “Cars” class, S2 was the leader with 0.93, and for “Footpath”, S1 was the top performer with 0.66. Overall, while S1 showed strong results across multiple classes, S2 was more effective in specific categories like “Walls” and “Cars”.
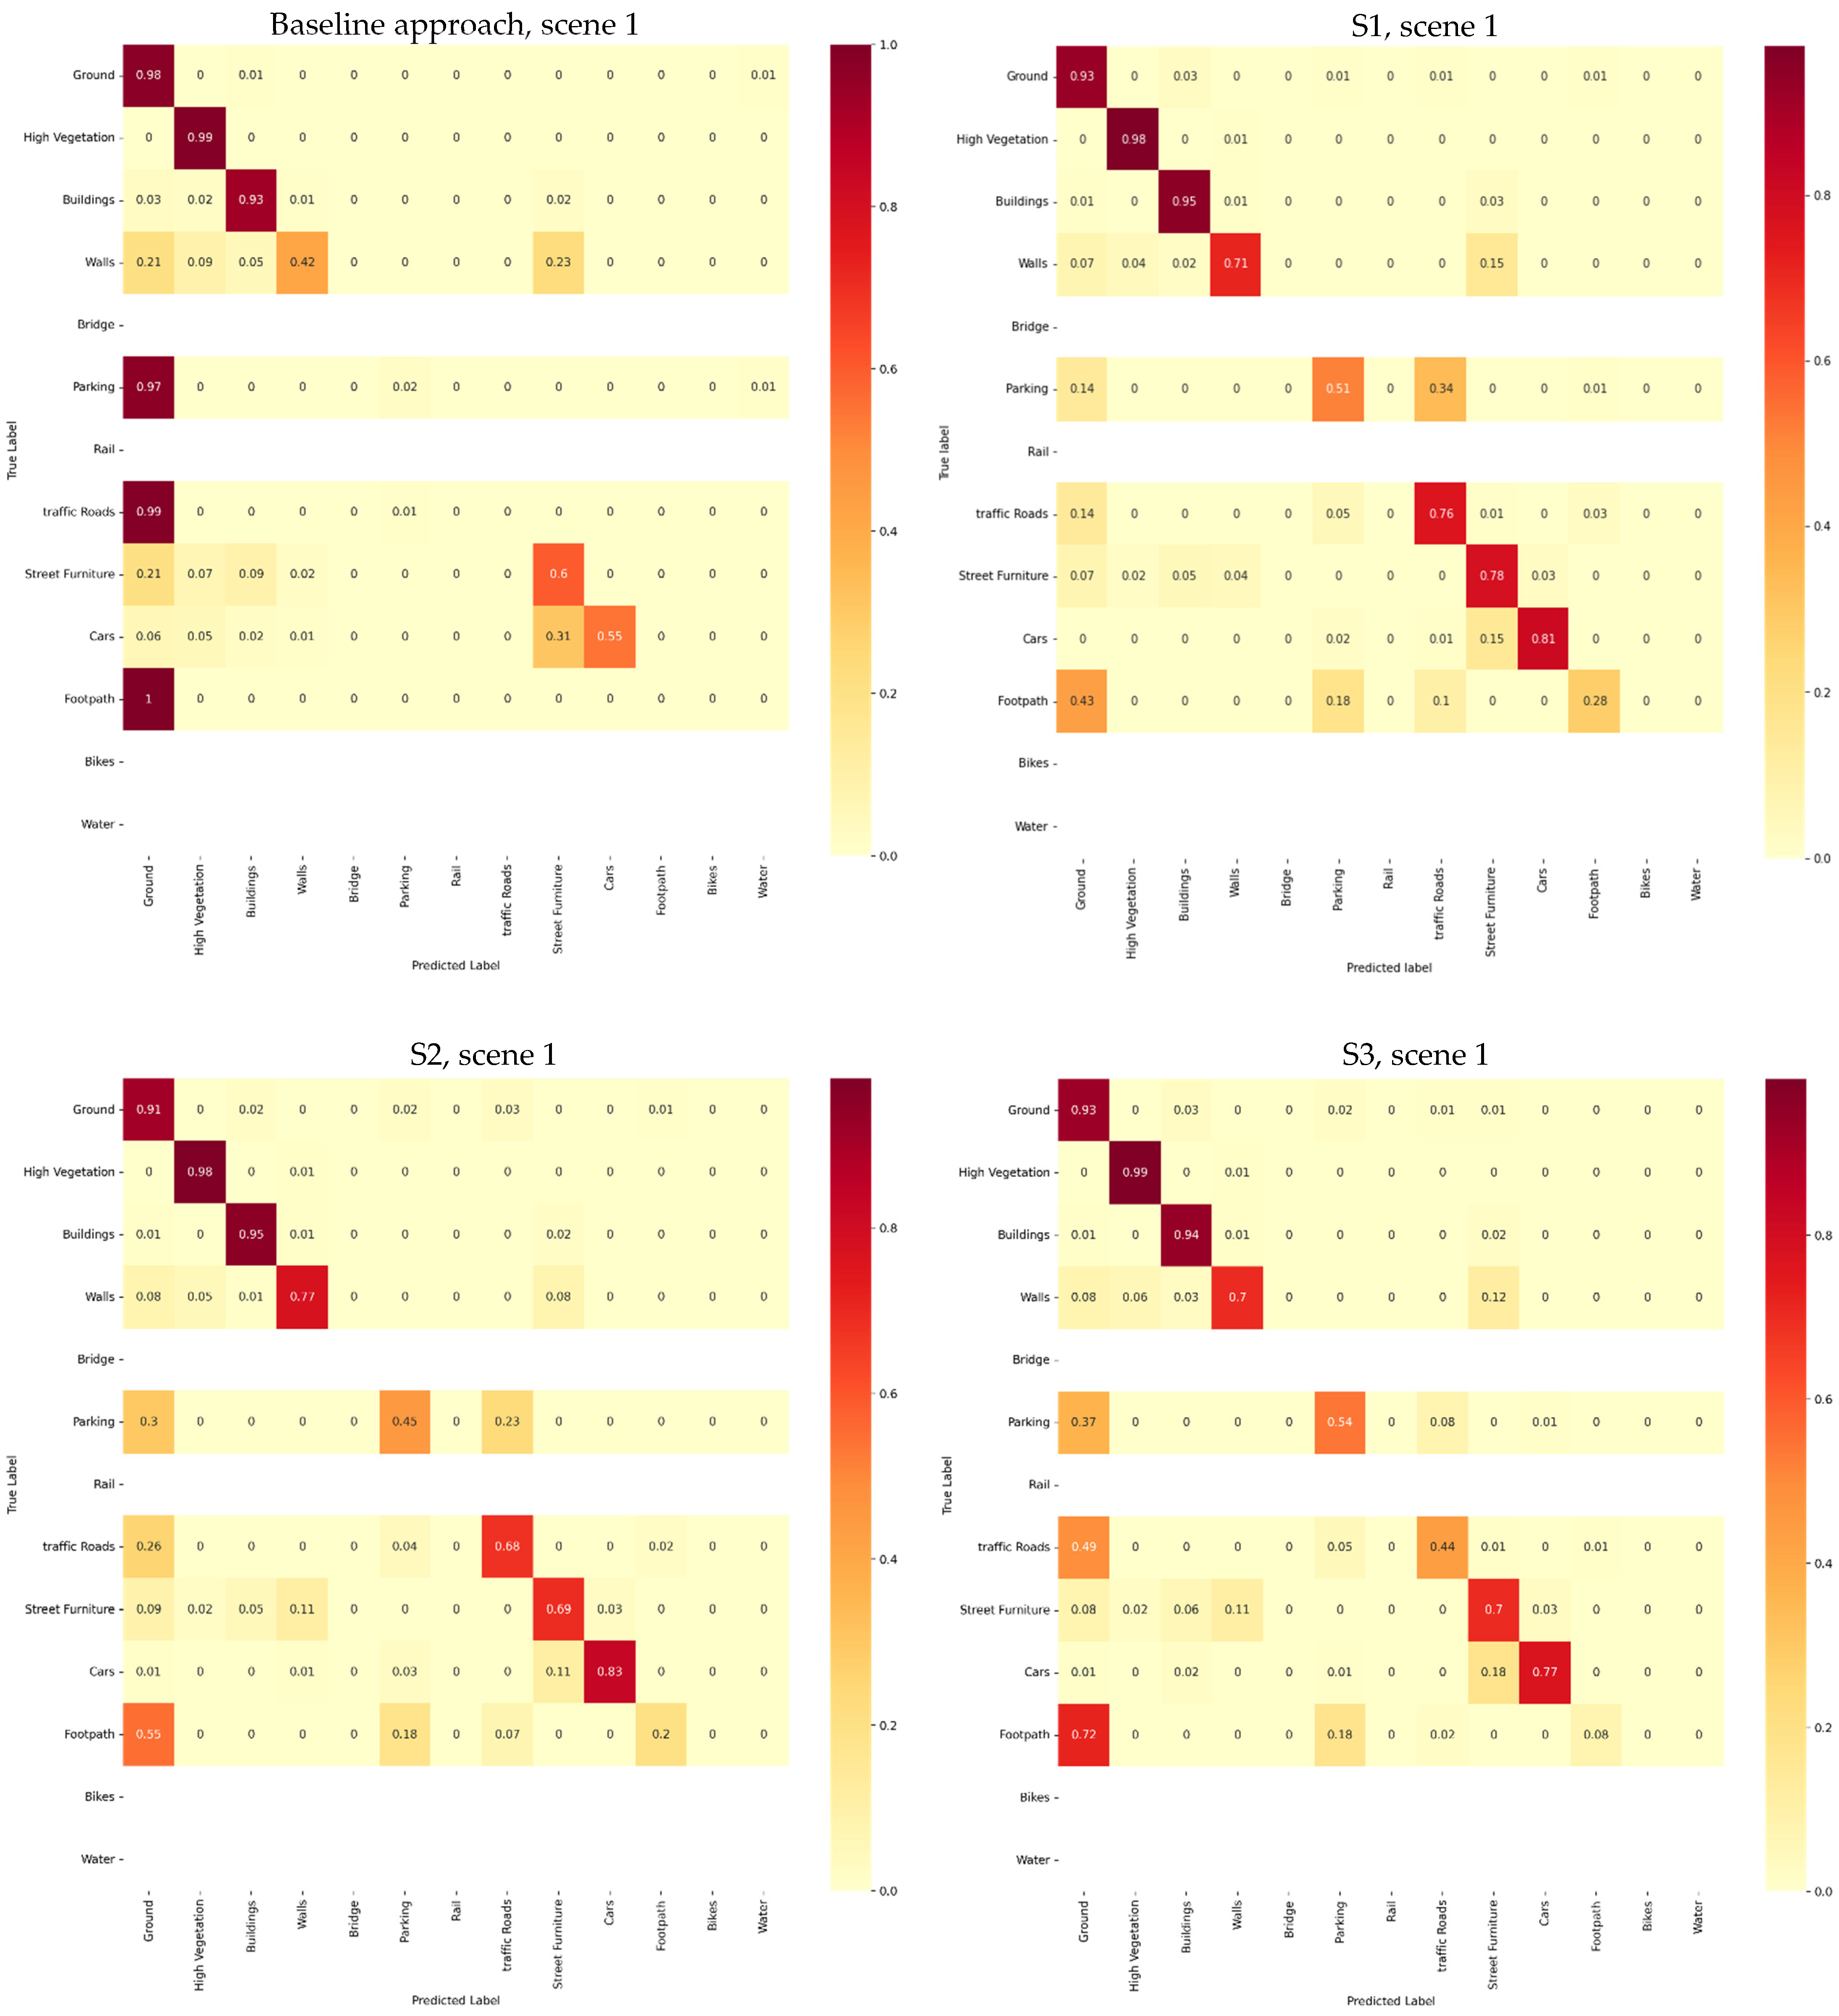
The results obtained with different developed scenarios were studied in detail by computing a percentage-based confusion matrix using ground truth data. “This percentage-based analysis provides an idea about the percentage of consistent and non-consistent points” [18]. The percentage-based confusion matrix obtained by all scenarios for scene 1 is depicted in Figure 6. The corresponding confusion matrices for the other urban scenes (2, 3, and 4) can be found in Figure 1, Figure 2 and Figure 3 on the following GitHub link: https://github.com/ZouhairBALLOUCH/Supplementary_Results_Article.git (accessed on 1 December 2023).
The confusion matrices show that the developed scenarios significantly outperform the baseline approach and reveal the limitations of using only direct image and PC fusion for complex urban scene segmentation.
The following are the detailed results of each semantic class independently:
Firstly, Ground and High Vegetation classes were successfully extracted in all scenes with all evaluated processes. This was due to their geometric and radiometric characteristics which are easy to recognize. That is, they are easily distinguished from other classes. This means that only the PCs and the aerial images fused in the baseline approach are sufficient to correctly segment the two classes. Secondly, the Building class was extracted accurately by S1, but the difference between it and other developed scenarios is relatively small. However, despite its performance, a slight confusion was observed between this class and the Street Furniture object. Thirdly, by observing the four scenes, we can see that S1 has a good performance on the PC scenes containing Rail, Traffic Roads, Street Furniture, Footpath, and Parking objects. The five semantic classes were extracted precisely by this scenario, except for the Footpath class, and the precision of it was low. Additionally, the percentage of consistent points obtained by it surpassed all other developed scenarios and the baseline approach. The baseline approach failed to label these classes. For example, in scene 4, S1 increases the percentage of consistent of each class by 12% (Parking), 2% (Rail), 7% (Traffic Roads), 13% (Street Furniture), and 7% (Footpath), respectively, compared to S2. S1 increases the percentage of consistency of each class by 2% (Parking), 12% (Rail), 47% (Traffic Roads), 8% (Street Furniture), and 9% (Footpath), respectively, compared to S3. However, these semantic classes are often confused with others with similar characteristics. We can list the confusion between the Parking class with the Ground and Traffic Roads classes, as well as the confusion between the Rail with Street Furniture and Water objects. In addition to the confusion between the Traffic Roads class with Ground and Parking geo-objects, there is also confusion with Bridge class in scene 4. Fourthly, by observing the four scenes, we can see that S2 had good performance on the PC scenes containing Cars, Walls, and Bridge objects. The obtained results in these classes indicate that S2 generally performed better than the other scenarios. If we still take the example of scene 4, S2 increases the percentage of consistency of each class by 2% (Cars), 14% (Walls), 12% (Bridge), respectively, compared to S1. Additionally, it increases the percentage of consistency of each class by 5% (Cars), 4% (Walls), and 62% (Bridge), respectively, compared to S3. In addition, S2 increases the percentage of consistency of each class by 22% (Cars), and 42% (Walls), respectively, compared to the baseline approach. The Bridge class was not completely detected by the baseline approach. However, these semantic classes are often confused with other objects with similar characteristics. We can cite the confusion between the classes of Cars and Street Furniture in scenes 1 and 4 in addition to the confusion between the class Wall and Street Furniture. Thus, we noticed a slight confusion between the Wall object and the class Buildings (scene 4) and Ground (scene 1). Finally, we observed a confusion between the class Bridge and building in scene 4. Fifth, S1 was the only one to accurately detect the Water class, as reflected in the confusion matrix results. The Water class was mistaken for the Wall in S2 and for the Ground in S3. Finally, the Bike class was not detected by all scenarios due to the very-low percentage of Bike samples in the dataset.
(B)
Qualitative Assessments
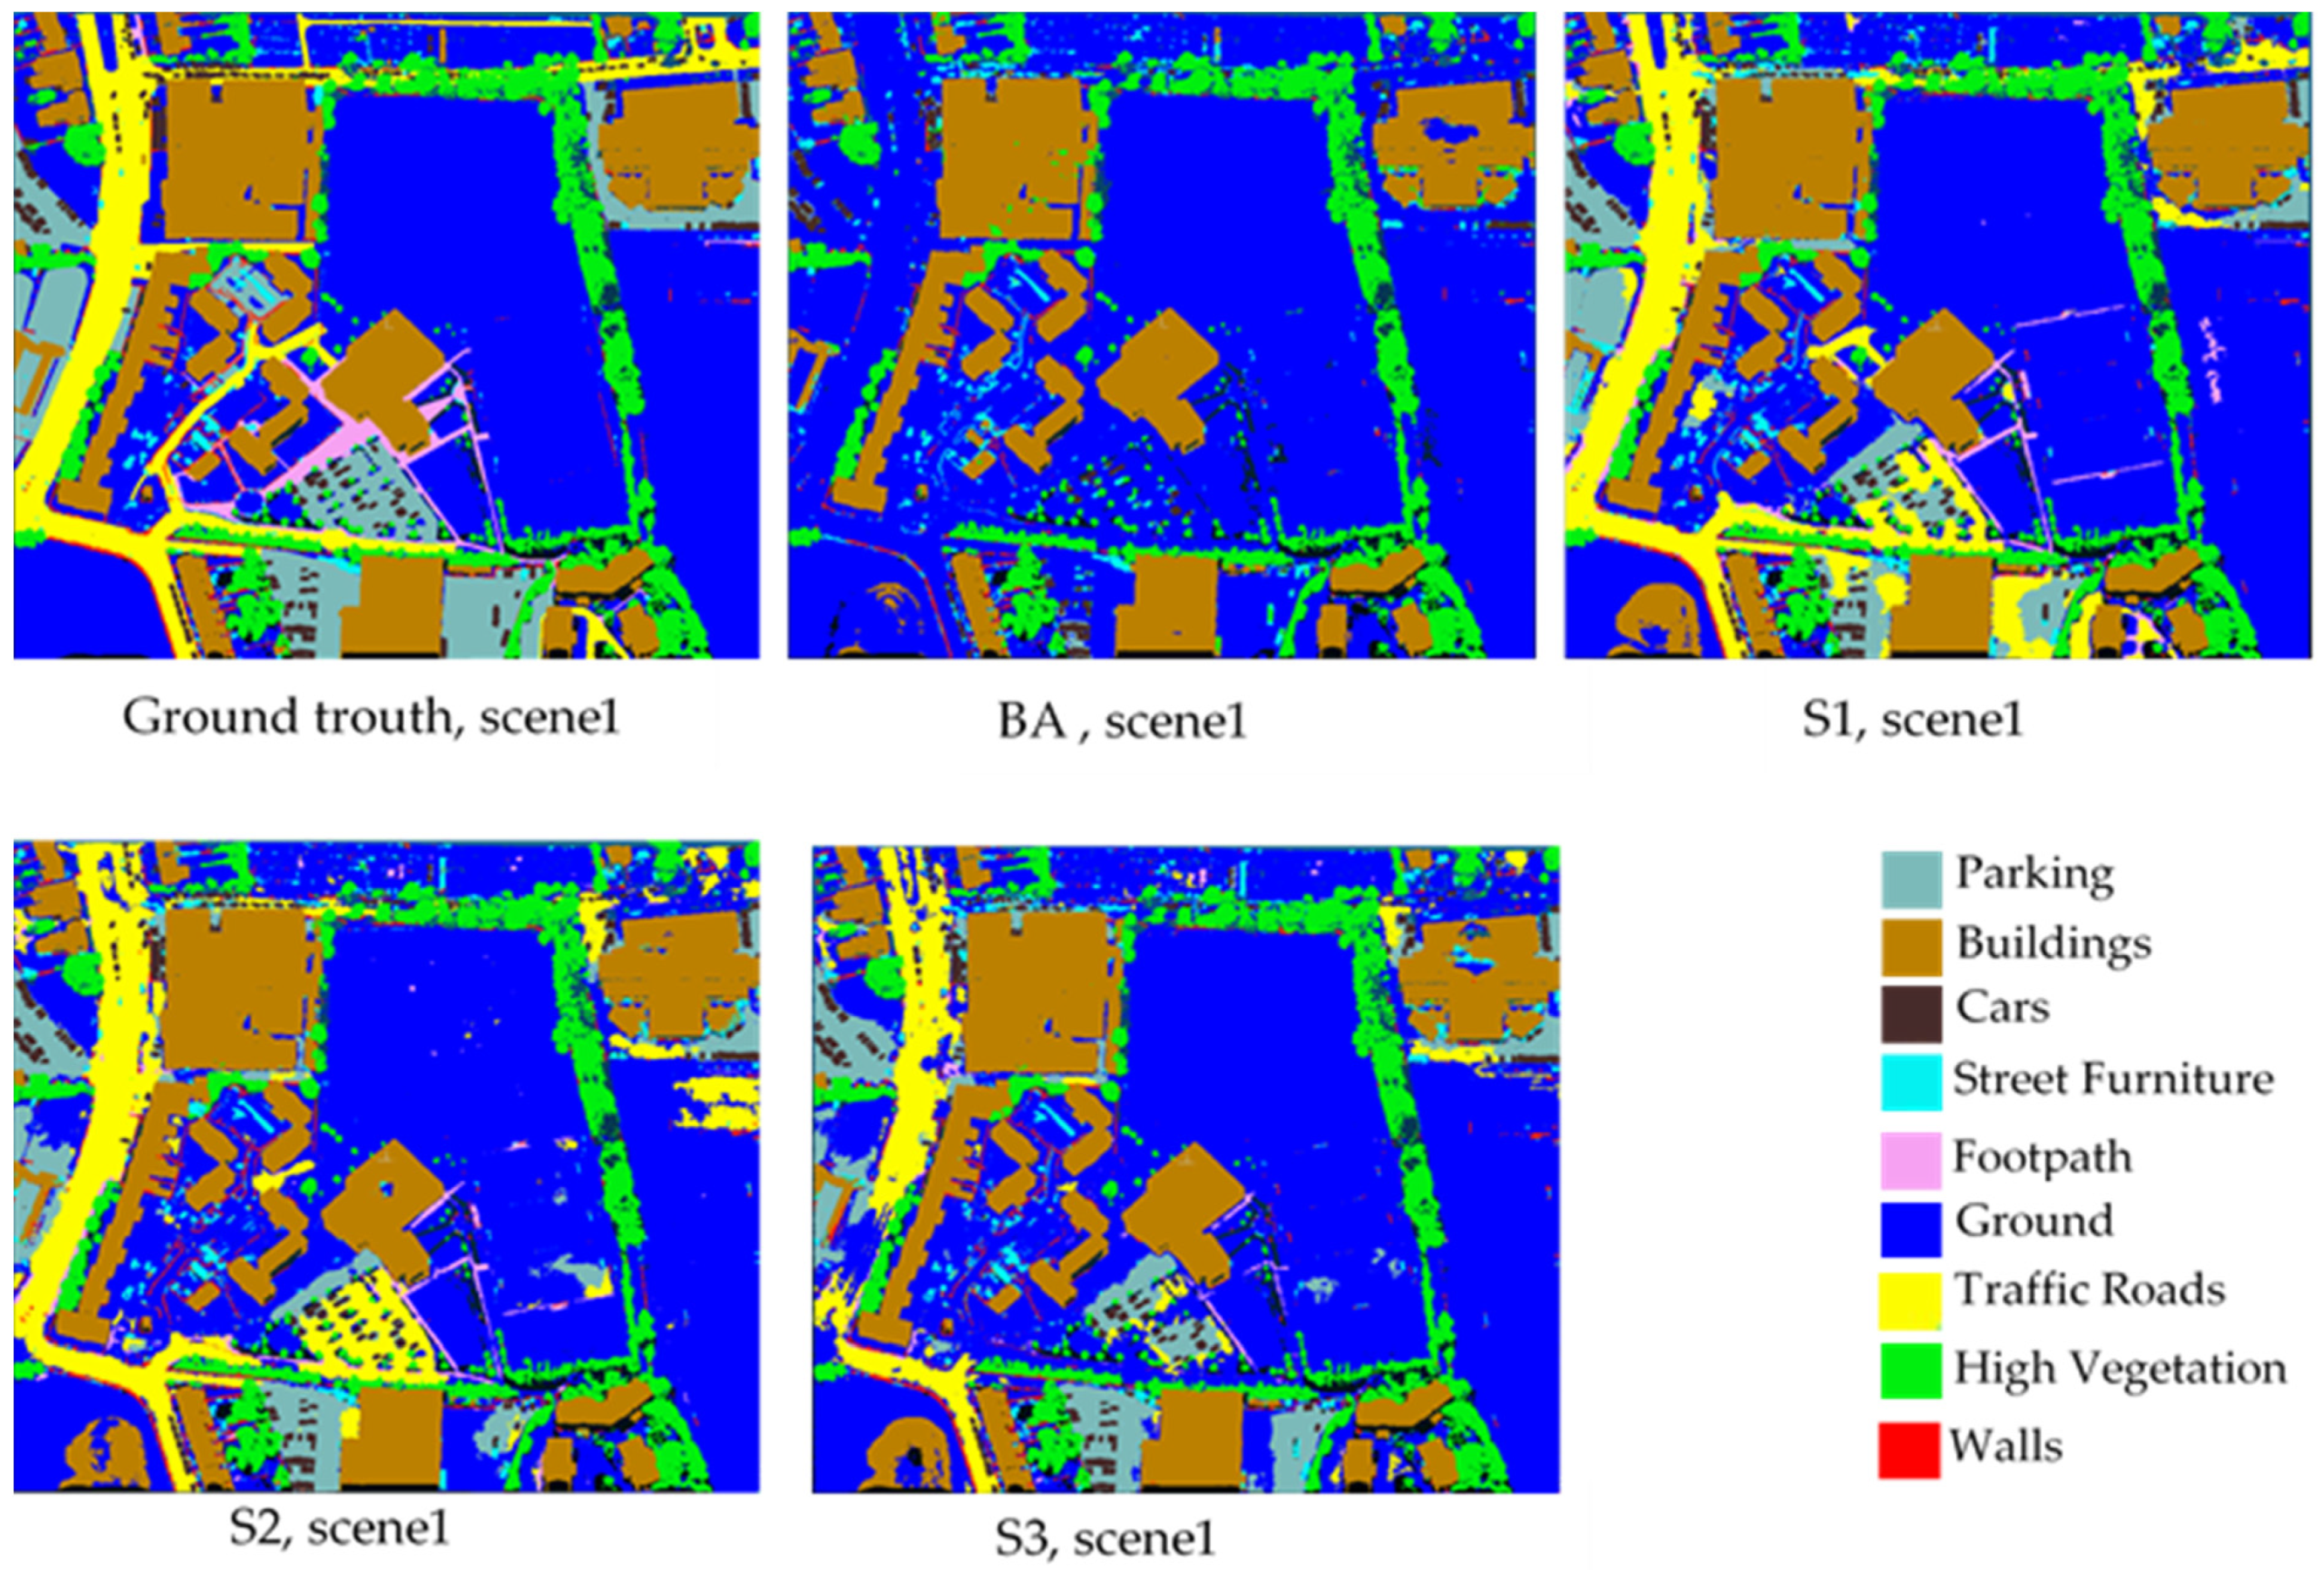
In addition to the quantitative evaluation, a qualitative analysis was performed by visualizing the semantic segmentation results in detail for the test data set. Figure 7 demonstrates the visual comparison of the predicted results obtained by the four processes with the corresponding ground truth. To show the semantic segmentation effect more intuitively, Figure 8 demonstrates some selected regions from 3D semantic segmentation maps of all evaluated processes. It can be observed from the figures that the results of S1 are closest to the ground truth. Additionally, its results are more accurate and coherent compared to the others, and classes were extracted precisely with clear boundaries.
The qualitative results of each class are further explained in the following paragraphs.
At first, the semantic segmentation results indicate that, in general, the Ground and High Vegetation classes were effectively segmented by all four processes. However, we observed that the baseline approach fails to label Rail, Traffic Roads, Street Furniture, and Parking classes effectively. These results were confirmed by the confusion matrix outcomes; for example, see the results for scene 4 at (https://github.com/ZouhairBALLOUCH/Supplementary_Results_Article.git, accessed on 1 December 2023).
Furthermore, as observed in the quantitative results, S1 shows better performance on these classes by producing very few miss-segmented points compared to others scenarios. Its errors in these classes were lower than those delivered by other scenarios for these semantic classes. On the other hand, in the cases of S2, S3, and the baseline approach, several Parking class points were miss-segmented as Ground. This was due to the similarity in their geometric and radiometric properties. Moreover, the three scenarios all confused certain points of Traffic Roads as a Ground class. The Street Furniture class shares a similar color to the Building and Wall classes; in fact, as shown in Figure 7, part of the Street Furniture was labeled as a Building in the semantic segmentation results of S2, S3, and the baseline approach. Finally, the Rail object was not detected by the baseline approach; additionally, S2 and S3 miss-classified it as Water and Street Furniture. Concerning the Building class, the visual evaluation shows that the different developed scenarios correctly extracted this object compared to the baseline approach. In the case of the baseline scenario, we observed a slight confusion between the Building class and those of Ground and High Vegetation. In addition, S1 errors were slightly lower than those delivered by S2 and S3 for the Building class.
Visually, we can observe in Figure 7 and Figure 8 that the Footpath object was difficult to recognize. S1, S2, and baseline scenario failed to label this class correctly, while S1 achieved an acceptable performance on it (scene 2). Concerning the Cars, Wall, and Bridge objects, thanks to the suitable geometric features calculated from PCs in S2, S2 errors were lower than those delivered by the other scenarios. The results indicated that the Bridge class was labeled as Buildings with the baseline approach. Additionally, a part of this class was labeled as Buildings in the segmentation results of S1 and S3. Moreover, as shown in Figure 7, various Car class points were miss-segmented as Street Furniture, especially in scene 4 (see confusion matrix results). In addition, the Wall was confused with several classes, mainly Street Furniture and Building geo-objects.
To conclude, based on visual comparison, the semantic segmentation of developed scenarios showed a very complementary effect compared to the baseline approach. The results also indicated that S1 generally outperformed S2 and S3. Particularly, S2 improved the semantic segmentation results of some classes (Wall, Cars, Bridge) more than the other scenarios.

4.2.2. Results Confirmation with KPConv

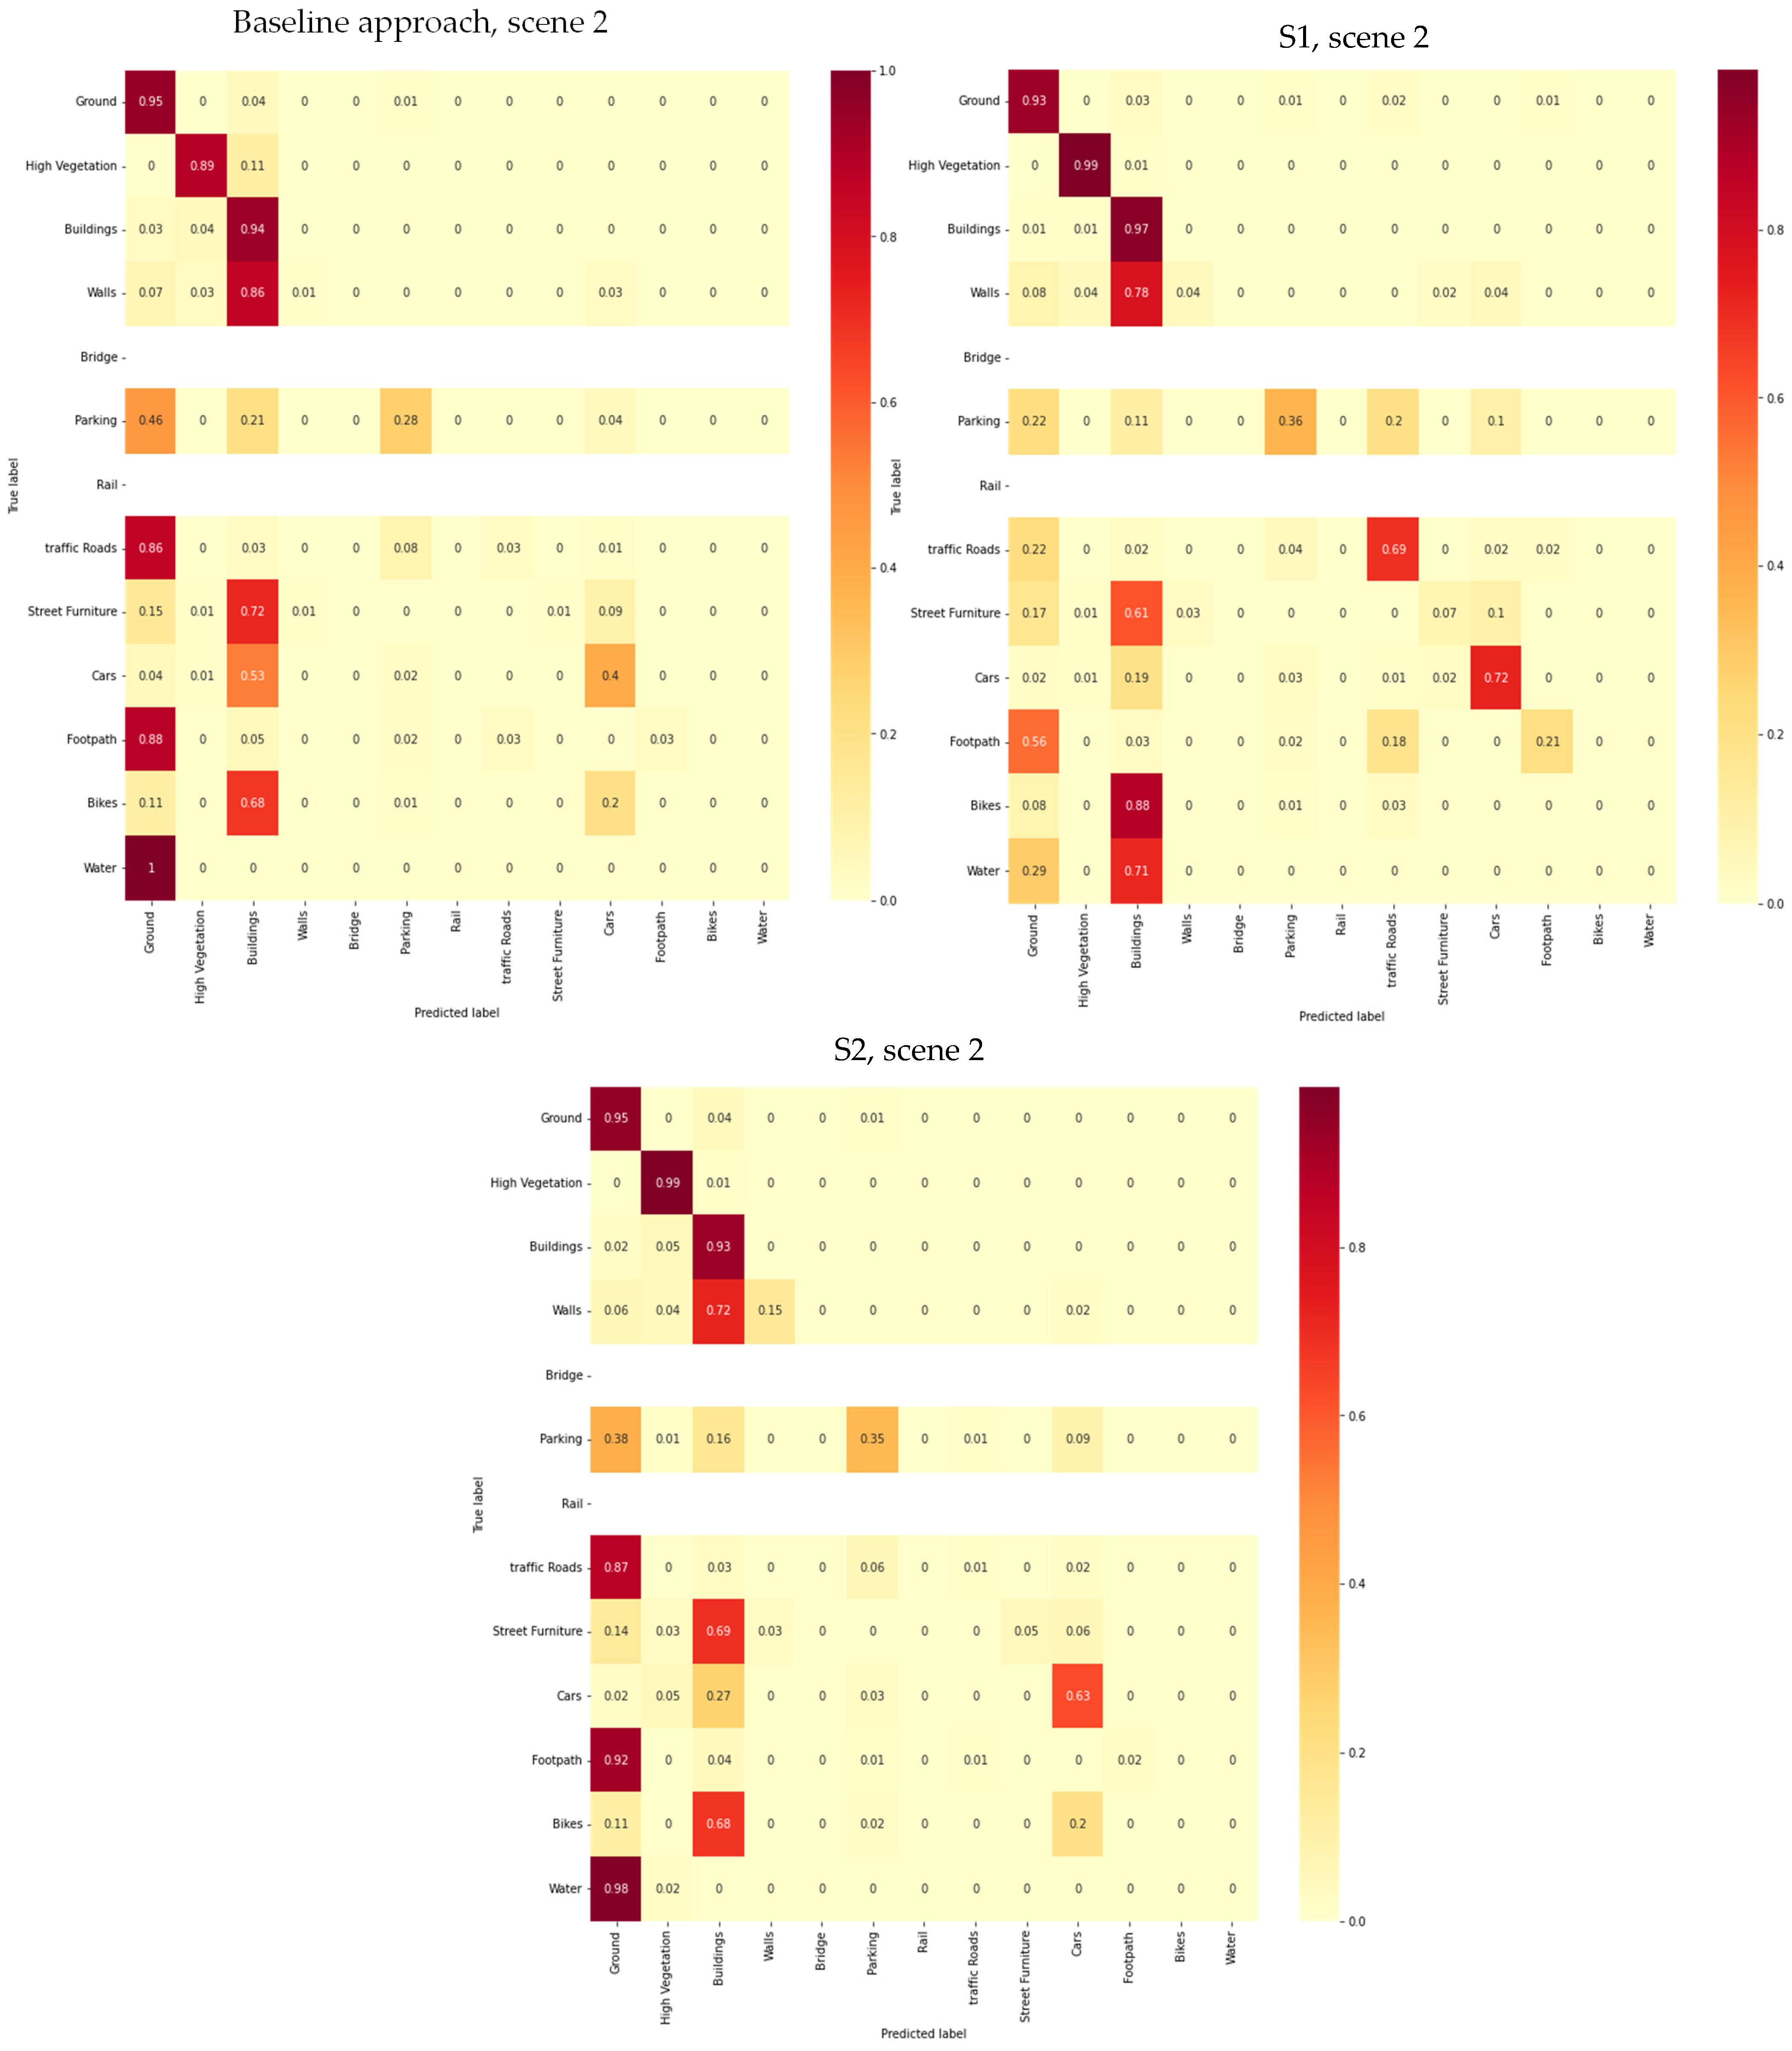
Following previous evaluations using the RandLaNet technique, further testing was conducted using the KPConv technique (Table 3) to validate and potentially reinforce the findings obtained by RandLaNet. The results presented in the Table 3 below were derived from the urban scene 2, which corresponds to the same urban scene studied in the initial tests conducted with RandLaNet (refer to Table 2). Upon reviewing the outcomes across four urban scenes by RandLaNet, Scenario 3’s performance was consistently average when set against scenarios 1 and 2. Consequently, the discussion was primarily centered on the performances of scenarios 1 and 2.
After evaluating the semantic segmentation results obtained by the KPConv model, we found that the results matched the initial observations made by the RandLaNet algorithm. For the “Ground” class, while S1 has an F1-score of 0.90, it is closely followed by both the baseline approach and S2, each around 0.85. The “High Vegetation” category reaffirms previous conclusions with S1 standing out with an F1-score of 0.99, though S2’s 0.97 remains competitive. The “Buildings” semantic class witnesses S1 leading at 0.93, with S2 closely trailing. In “Walls”, despite modest scores overall, S2 shows a relative advantage with 0.26. The “Parking” results show improvements across scenarios compared to the baseline, with S1 achieving the highest score of 0.43. For “Traffic Roads”, S1 dominates with an F1-score of 0.71, a notable improvement over the other scenarios. “Street Furniture” and “Footpath” classes have modest F1-scores, yet some scenarios, especially S1, display improvements over the baseline approach. Finally, in the “Cars” category, S1 and S2 perform similarly well, with S1 slightly ahead at 0.74. In summation, the KPConv model’s results not only confirm the previous findings but also highlight the potential of scenarios in semantic segmentation performance. For an overview of the general metrics achieved by the KPConv technique across two urban scenes, the results are available in Table 2 on this link: https://github.com/ZouhairBALLOUCH/Supplementary_Results_Article.git, accessed on 1 December 2023.
Following these insights, an in-depth analysis using percentage-based confusion matrices was carried out, showcasing advancements in the accuracy of semantic segmentation, especially for complex urban objects, as depicted in Figure 9.

4.2.3. Comparison of Efficient-PLF Approach with DL Techniques from the Literature

The goal of this study does not concentrate on a particular type of DL technique but rather on finding an effective approach for selecting pertinent features and an efficient fusion scenario applicable to any DL technique. Despite using only a subset of the dataset (16 PC), RandLaNet adopted to our Efficient-PLF approach was compared with some DL techniques from the literature [11]. Note that the test data used to assess these DL techniques (PointNet [35], PointNet++ [36], TagentConv [37], and SPGraph [6]) differ from our test data (but data are from the same dataset; only the test samples differ). This difference is justified by the fact that the data they employed lack labels (ground truth) and are not openly accessible. The results can be found in Table 4.

4.3. Discussion

This work develops three prior-level fusion scenarios based on DL for 3D semantic segmentation. To summarize the performance of different developed scenarios, the results were compared to a baseline approach using both qualitative and quantitative assessments. Table 1, Table 2 and Table 3 show that the semantic segmentation of the developed scenarios, especially S1, was significantly better than S2, S3, and the baseline approach across all urban scenes. To assess each semantic class individually, confusion matrices were computed using both the RandLaNet and KPConv techniques. By observing their results, it can be seen that the developed fusion scenarios achieved the best semantic segmentation compared to the baseline approach. Despite the good results of the baseline approach obtained in some classes such as Ground, it failed to label completely some others namely Bridge, Traffic Roads, and Footpath classes. Additionally, its results in Parking classes are not acceptable. Thus, it is quite difficult to detect these objects using only PCs and aerial images. As a first conclusion of this work, we point out that the direct fusion of PCs and aerial images is not sufficient for the semantic segmentation of complex scenes with a diversity of objects. Compared to the baseline approach, S2, and S3, we can see that S1 has the best performance on the PC scenes containing Rail, Traffic Roads, Street Furniture, Footpath, and Parking objects. Despite the choice of the most appropriate geometric properties in S2 and the injection of classified geometric information in S3, these two scenarios did not succeed in obtaining the high accuracies that were obtained by S1. The prior knowledge selected in these scenarios was not enough to further distinguish these types of terrains. This could be due to the geometric similarity in these classes. The confusion matrices calculated have confirmed this situation. We can conclude here that the preliminary results of image classification guided the model to know these different classes and distinguish them precisely. On the other hand, the second scenario, S2, performed well on the Cars, Wall, and Bridge objects. It demonstrated the best precisions compared to S1, S3, and the baseline approach. The low accuracy obtained by S1 compared to those obtained by S2 may be due to the similarity in the radiometric information of these geo-objects. Nevertheless, the description of local geometric properties by selected geometric features has facilitated the distinction of these three classes in S2. The visual results confirm this situation. Figure 7 depicts the results of the four fusion scenarios. Overall, the developed scenarios outperformed the baseline in terms of visual quality and reduced semantic segmentation errors. Specifically, S1 closely mirrored the ground truth and outshined S2, S3, and the baseline for many classes. However, for geo-objects like Walls, Cars, and Bridges, S2 excelled, enhancing visual quality compared to the other scenarios. Additionally, S1 allows for the utilization of classified images from various sources, including drone and satellite images, and can be processed by different neural networks of image classification, making it a practical option. S1 is also not highly data-intensive, as satisfactory results were obtained by training the model with only a portion of the dataset, which reduces the financial resources and hardware required since it relies solely on aerial images and PCs. However, this scenario could be somewhat long, and classification errors in the images could negatively impact the 3D semantic segmentation results. Although S1 has several advantages, the difference between S1 and S2 is relatively small. Specifically, S2 excels at segmenting Walls, Cars, and Bridges, surpassing S1 and S3 based on both qualitative and quantitative findings. In addition, S2 is easier to handle than the other scenarios and does not require any prior knowledge. However, this scenario works best for classes with distinct geometries, but the issue with distinguishing geo-objects with similar geometrical features remains. Additionally, S2 necessitates the selection of features that have a positive impact on semantic segmentation. In regard to S3, it is better suited for geometrically distinct geo-objects. The uniqueness of this scenario lies in its direct use of semantic knowledge from geometric information, which enhances the distinction of such objects. However, a pre-classification step is required, which makes the process somewhat long. Moreover, the accuracy of its 3D semantic segmentation is relatively low, and classification errors in geometric information could have a negative impact on semantic segmentation outcomes. In conclusion, considering the good qualitative and quantitative results in all classes and its superior performance compared to other scenarios, S1 is the Efficient-PLF approach for semantic segmentation of PCs acquired on a large scale. In addition, we suggest considering S2 due to its high performance on certain semantic classes and its ease of handling. Finally, it should be noted that this research work presents certain limitations including the usage of only 16 sets of the SensatUrban dataset, which may not be sufficient to achieve the maximum accuracies of different scenarios. In addition, the developed fusion scenarios should be tested on other datasets that contain other semantic classes. As a perspective, we suggest investigating the derived Efficient-PLF approach in various urban contexts by choosing other urban objects and by also considering other dataset types, especially, the terrestrial PCs. The goal is to evaluate the precisions and errors of the selected Efficient-PLF approach when confronted with other urban environments.

5. Conclusions

This article introduces a new prior-level fusion approach for semantic segmentation based on an in-depth evaluation of three scenarios, which involve fusing aerial images, prior knowledge, and PCs into the DL techniques’ learning pipeline. Three proposed scenarios were evaluated based on their qualitative and quantitative results to identify the one that successfully extracted the maximum urban assets details. The derived scenario was named the “Efficient-PLF approach”. Additionally, another contribution of this work was adopting advanced DL structures and tailoring their parameters to match the specific requirements of our research. Since S1 exhibits good scores in all classes and its performances surpass the other scenarios, we can conclude that S1 is the Efficient-PLF approach for the semantic segmentation of large-scale PC. Therefore, the preference for S1 is motivated by the accuracy of its results and the quality of its visual predictions. We also recommended S2 because of its high performance on some semantic classes and the simplicity of its processing. The experiments show that the derived Efficient-PLF approach can improve the knowledge of the DL techniques. It allows for good metrics, particularly for classes that are difficult to detect using the original DL architecture without prior knowledge. Additionally, it succeeds in reducing the confusion between different semantic classes. Furthermore, the Efficient-PLF approach can potentially be adapted for any 3D semantic segmentation DL techniques. So, we suggest investigating the semantic segmentation Efficient-PLF approach in other complex urban environments to evaluate its efficiency and limits in different urban contexts. Additionally, we recommend experimenting with adapting other DL techniques to the Efficient-PLF approach. Furthermore, regarding the image classification part, we propose testing the use of classified images from alternative sensors such as satellite imagery and drones.

Author Contributions

Conceptualization, Z.B., F.P., R.H., A.K. and R.B.; methodology, Z.B., F.P., R.H., A.K. and R.B.; validation, Z.B., F.P., R.H., A.K. and R.B.; writing—original draft preparation, Z.B., F.P., R.H., A.K. and R.B.; writing—review and editing, Z.B., F.P., R.H., A.K. and R.B.; visualization, Z.B.; supervision, R.H. and R.B. All authors have read and agreed to the published version of the manuscript.

Funding

This research received no external funding.

Data Availability Statement

All the data we utilized is from open sources, and the links for downloading are mentioned in the document.

Conflicts of Interest

The authors declare no conflict of interest.

References

  1. Shahat, E.; Hyun, C.T.; Yeom, C. City Digital Twin Potentials: A Review and Research Agenda. Sustainability 2021, 13, 3386. [Google Scholar] [CrossRef]
  2. Ruohomäki, T.; Airaksinen, E.; Huuska, P.; Kesäniemi, O.; Martikka, M.; Suomisto, J. Smart City Platform Enabling Digital Twin. In Proceedings of the 2018 International Conference on Intelligent Systems (IS), Funchal, Portugal, 25–27 September 2018; pp. 155–161. [Google Scholar]
  3. White, G.; Zink, A.; Codecá, L.; Clarke, S. A Digital Twin Smart City for Citizen Feedback. Cities 2021, 110, 103064. [Google Scholar] [CrossRef]
  4. Zhang, J.; Zhao, X.; Chen, Z.; Lu, Z. A Review of Deep Learning-Based Semantic Segmentation for Point Cloud. IEEE Access 2019, 7, 179118–179133. [Google Scholar] [CrossRef]
  5. Hu, Q.; Yang, B.; Xie, L.; Rosa, S.; Guo, Y.; Wang, Z.; Trigoni, N.; Markham, A. RandLA-Net: Efficient Semantic Segmentation of Large-Scale Point Clouds. In Proceedings of the 2020 IEEE/CVF Conference on Computer Vision and Pattern Recognition (CVPR), Seattle, WA, USA, 13–19 June 2020; pp. 11105–11114. [Google Scholar]
  6. Landrieu, L.; Simonovsky, M. Large-Scale Point Cloud Semantic Segmentation with Superpoint Graphs. In Proceedings of the 2018 IEEE/CVF Conference on Computer Vision and Pattern Recognition, Salt Lake City, UT, USA, 18–23 June 2018; pp. 4558–4567. [Google Scholar]
  7. Zhang, R.; Wu, Y.; Jin, W.; Meng, X. Deep-Learning-Based Point Cloud Semantic Segmentation: A Survey. Electronics 2023, 12, 3642. [Google Scholar] [CrossRef]
  8. Thomas, H.; Qi, C.R.; Deschaud, J.-E.; Marcotegui, B.; Goulette, F.; Guibas, L.J. KPConv: Flexible and Deformable Convolution for Point Clouds. In Proceedings of the 2019 IEEE/CVF International Conference on Computer Vision (ICCV), Seoul, Republic of Korea, 27 October–2 November 2019; pp. 6411–6420. [Google Scholar]
  9. Ballouch, Z.; Hajji, R.; Ettarid, M. Toward a Deep Learning Approach for Automatic Semantic Segmentation of 3D Lidar Point Clouds in Urban Areas. In Geospatial Intelligence: Applications and Future Trends; Barramou, F., El Brirchi, E.H., Mansouri, K., Dehbi, Y., Eds.; Springer International Publishing: Cham, Switzerland, 2022; pp. 67–77. ISBN 978-3-030-80458-9. [Google Scholar]
  10. Weinmann, M.; Weinmann, M. Fusion of hyperspectral, multispectral, color and 3D point cloud information for the semantic interpretation of urban environments. Int. Arch. Photogramm. Remote Sens. Spat. Inf. Sci. 2019, XLII-2/W13, 1899–1906. [Google Scholar] [CrossRef]
  11. Hu, Q.; Yang, B.; Khalid, S.; Xiao, W.; Trigoni, N.; Markham, A. Towards Semantic Segmentation of Urban-Scale 3D Point Clouds: A Dataset, Benchmarks and Challenges. In Proceedings of the 2021 IEEE/CVF Conference on Computer Vision and Pattern Recognition (CVPR), Nashville, TN, USA, 20–25 June 2021; pp. 4977–4987. [Google Scholar]
  12. Gao, W.; Nan, L.; Boom, B.; Ledoux, H. SUM: A Benchmark Dataset of Semantic Urban Meshes. ISPRS J. Photogramm. Remote Sens. 2021, 179, 108–120. [Google Scholar] [CrossRef]
  13. Hackel, T.; Savinov, N.; Ladicky, L.; Wegner, J.D.; Schindler, K.; Pollefeys, M. Semantic3D.Net: A New Large-Scale Point Cloud Classification Benchmark. arXiv 2017, arXiv:1704.03847. [Google Scholar] [CrossRef]
  14. Chen, X.; Jia, D.; Zhang, W. Integrating UAV Photogrammetry and Terrestrial Laser Scanning for Three-Dimensional Geometrical Modeling of Post-Earthquake County of Beichuan. In Proceedings of the 18th International Conference on Computing in Civil and Building Engineering; Toledo Santos, E., Scheer, S., Eds.; Springer International Publishing: Cham, Switzerland, 2021; pp. 1086–1098. [Google Scholar]
  15. Oh, S.-I.; Kang, H.-B. Object Detection and Classification by Decision-Level Fusion for Intelligent Vehicle Systems. Sensors 2017, 17, 207. [Google Scholar] [CrossRef]
  16. Chen, Y.; Liu, X.; Xiao, Y.; Zhao, Q.; Wan, S. Three-Dimensional Urban Land Cover Classification by Prior-Level Fusion of LiDAR Point Cloud and Optical Imagery. Remote Sens. 2021, 13, 4928. [Google Scholar] [CrossRef]
  17. Zhang, R.; Li, G.; Li, M.; Wang, L. Fusion of Images and Point Clouds for the Semantic Segmentation of Large-Scale 3D Scenes Based on Deep Learning. ISPRS J. Photogramm. Remote Sens. 2018, 143, 85–96. [Google Scholar] [CrossRef]
  18. Ballouch, Z.; Hajji, R.; Poux, F.; Kharroubi, A.; Billen, R. A Prior Level Fusion Approach for the Semantic Segmentation of 3D Point Clouds Using Deep Learning. Remote Sens. 2022, 14, 3415. [Google Scholar] [CrossRef]
  19. Poliyapram, V.; Wang, W.; Nakamura, R. A Point-Wise LiDAR and Image Multimodal Fusion Network (PMNet) for Aerial Point Cloud 3D Semantic Segmentation. Remote Sens. 2019, 11, 2961. [Google Scholar] [CrossRef]
  20. Ye, C.; Pan, H.; Yu, X.; Gao, H. A Spatially Enhanced Network with Camera-Lidar Fusion for 3D Semantic Segmentation. Neurocomputing 2022, 484, 59–66. [Google Scholar] [CrossRef]
  21. Luo, S.; Wang, C.; Xi, X.; Zeng, H.; Li, D.; Xia, S.; Wang, P. Fusion of Airborne Discrete-Return LiDAR and Hyperspectral Data for Land Cover Classification. Remote Sens. 2016, 8, 3. [Google Scholar] [CrossRef]
  22. Mirzapour, F.; Ghassemian, H. Improving Hyperspectral Image Classification by Combining Spectral, Texture, and Shape Features. Int. J. Remote Sens. 2015, 36, 1070–1096. [Google Scholar] [CrossRef]
  23. Bai, X.; Liu, C.; Ren, P.; Zhou, J.; Zhao, H.; Su, Y. Object Classification via Feature Fusion Based Marginalized Kernels. IEEE Geosci. Remote Sens. Lett. 2015, 12, 8–12. [Google Scholar] [CrossRef]
  24. Zhang, Y.; Chi, M. Mask-R-FCN: A Deep Fusion Network for Semantic Segmentation. IEEE Access 2020, 8, 155753–155765. [Google Scholar] [CrossRef]
  25. Tabib Mahmoudi, F.; Samadzadegan, F.; Reinartz, P. Object Recognition Based on the Context Aware Decision-Level Fusion in Multiviews Imagery. IEEE J. Sel. Top. Appl. Earth Obs. Remote Sens. 2015, 8, 12–22. [Google Scholar] [CrossRef]
  26. Zhang, R.; Candra, S.A.; Vetter, K.; Zakhor, A. Sensor Fusion for Semantic Segmentation of Urban Scenes. In Proceedings of the 2015 IEEE International Conference on Robotics and Automation (ICRA), Seattle, WA, USA, 26–30 May 2015; pp. 1850–1857. [Google Scholar]
  27. Guo, Y.; Wang, H.; Hu, Q.; Liu, H.; Liu, L.; Bennamoun, M. Deep Learning for 3D Point Clouds: A Survey. IEEE Trans. Pattern Anal. Mach. Intell. 2021, 43, 4338–4364. [Google Scholar] [CrossRef]
  28. Grzeczkowicz, G.; Vallet, B. Semantic Segmentation of Urban Textured Meshes through Point Sampling. arXiv 2023, arXiv:2302.10635. [Google Scholar] [CrossRef]
  29. Li, W.; Zhan, L.; Min, W.; Zou, Y.; Huang, Z.; Wen, C. Semantic Segmentation of Point Cloud With Novel Neural Radiation Field Convolution. IEEE Geosci. Remote Sens. Lett. 2023, 20, 1–5. [Google Scholar] [CrossRef]
  30. Lin, Y.; Vosselman, G.; Cao, Y.; Yang, M.Y. Local and Global Encoder Network for Semantic Segmentation of Airborne Laser Scanning Point Clouds. ISPRS J. Photogramm. Remote Sens. 2021, 176, 151–168. [Google Scholar] [CrossRef]
  31. Song, H.; Jo, K.; Cho, J.; Son, Y.; Kim, C.; Han, K. A Training Dataset for Semantic Segmentation of Urban Point Cloud Map for Intelligent Vehicles. ISPRS J. Photogramm. Remote Sens. 2022, 187, 159–170. [Google Scholar] [CrossRef]
  32. Atik, M.E.; Duran, Z.; Seker, D.Z. Machine Learning-Based Supervised Classification of Point Clouds Using Multiscale Geometric Features. ISPRS Int. J. Geo-Inf. 2021, 10, 187. [Google Scholar] [CrossRef]
  33. Özdemir, E.; Remondino, F. Classification of aerial point clouds with deep learning. Int. Arch. Photogramm. Remote Sens. Spat. Inf. Sci. 2019, XLII-2/W13, 103–110. [Google Scholar] [CrossRef]
  34. Kingma, D.P.; Ba, J. Adam: A Method for Stochastic Optimization. arXiv 2014, arXiv:1412.6980. [Google Scholar]
  35. Qi, C.R.; Su, H.; Mo, K.; Guibas, L.J. PointNet: Deep Learning on Point Sets for 3D Classification and Segmentation. In Proceedings of the 2017 IEEE Conference on Computer Vision and Pattern Recognition (CVPR), Honolulu, HI, USA, 21–26 July 2017; pp. 652–660. [Google Scholar]
  36. Qi, C.R.; Yi, L.; Su, H.; Guibas, L.J. PointNet++: Deep Hierarchical Feature Learning on Point Sets in a Metric Space. In Proceedings of the Advances in Neural Information Processing Systems, Long Beach, CA, USA, 4–9 December 2017; Curran Associates, Inc.: Red Hook, NY, USA, 2017; Volume 30. [Google Scholar]
  37. Tatarchenko, M.; Park, J.; Koltun, V.; Zhou, Q.-Y. Tangent Convolutions for Dense Prediction in 3D. In Proceedings of the 2018 IEEE/CVF Conference on Computer Vision and Pattern Recognition, Salt Lake City, UT, USA, 18–23 June 2018; pp. 3887–3896. [Google Scholar]
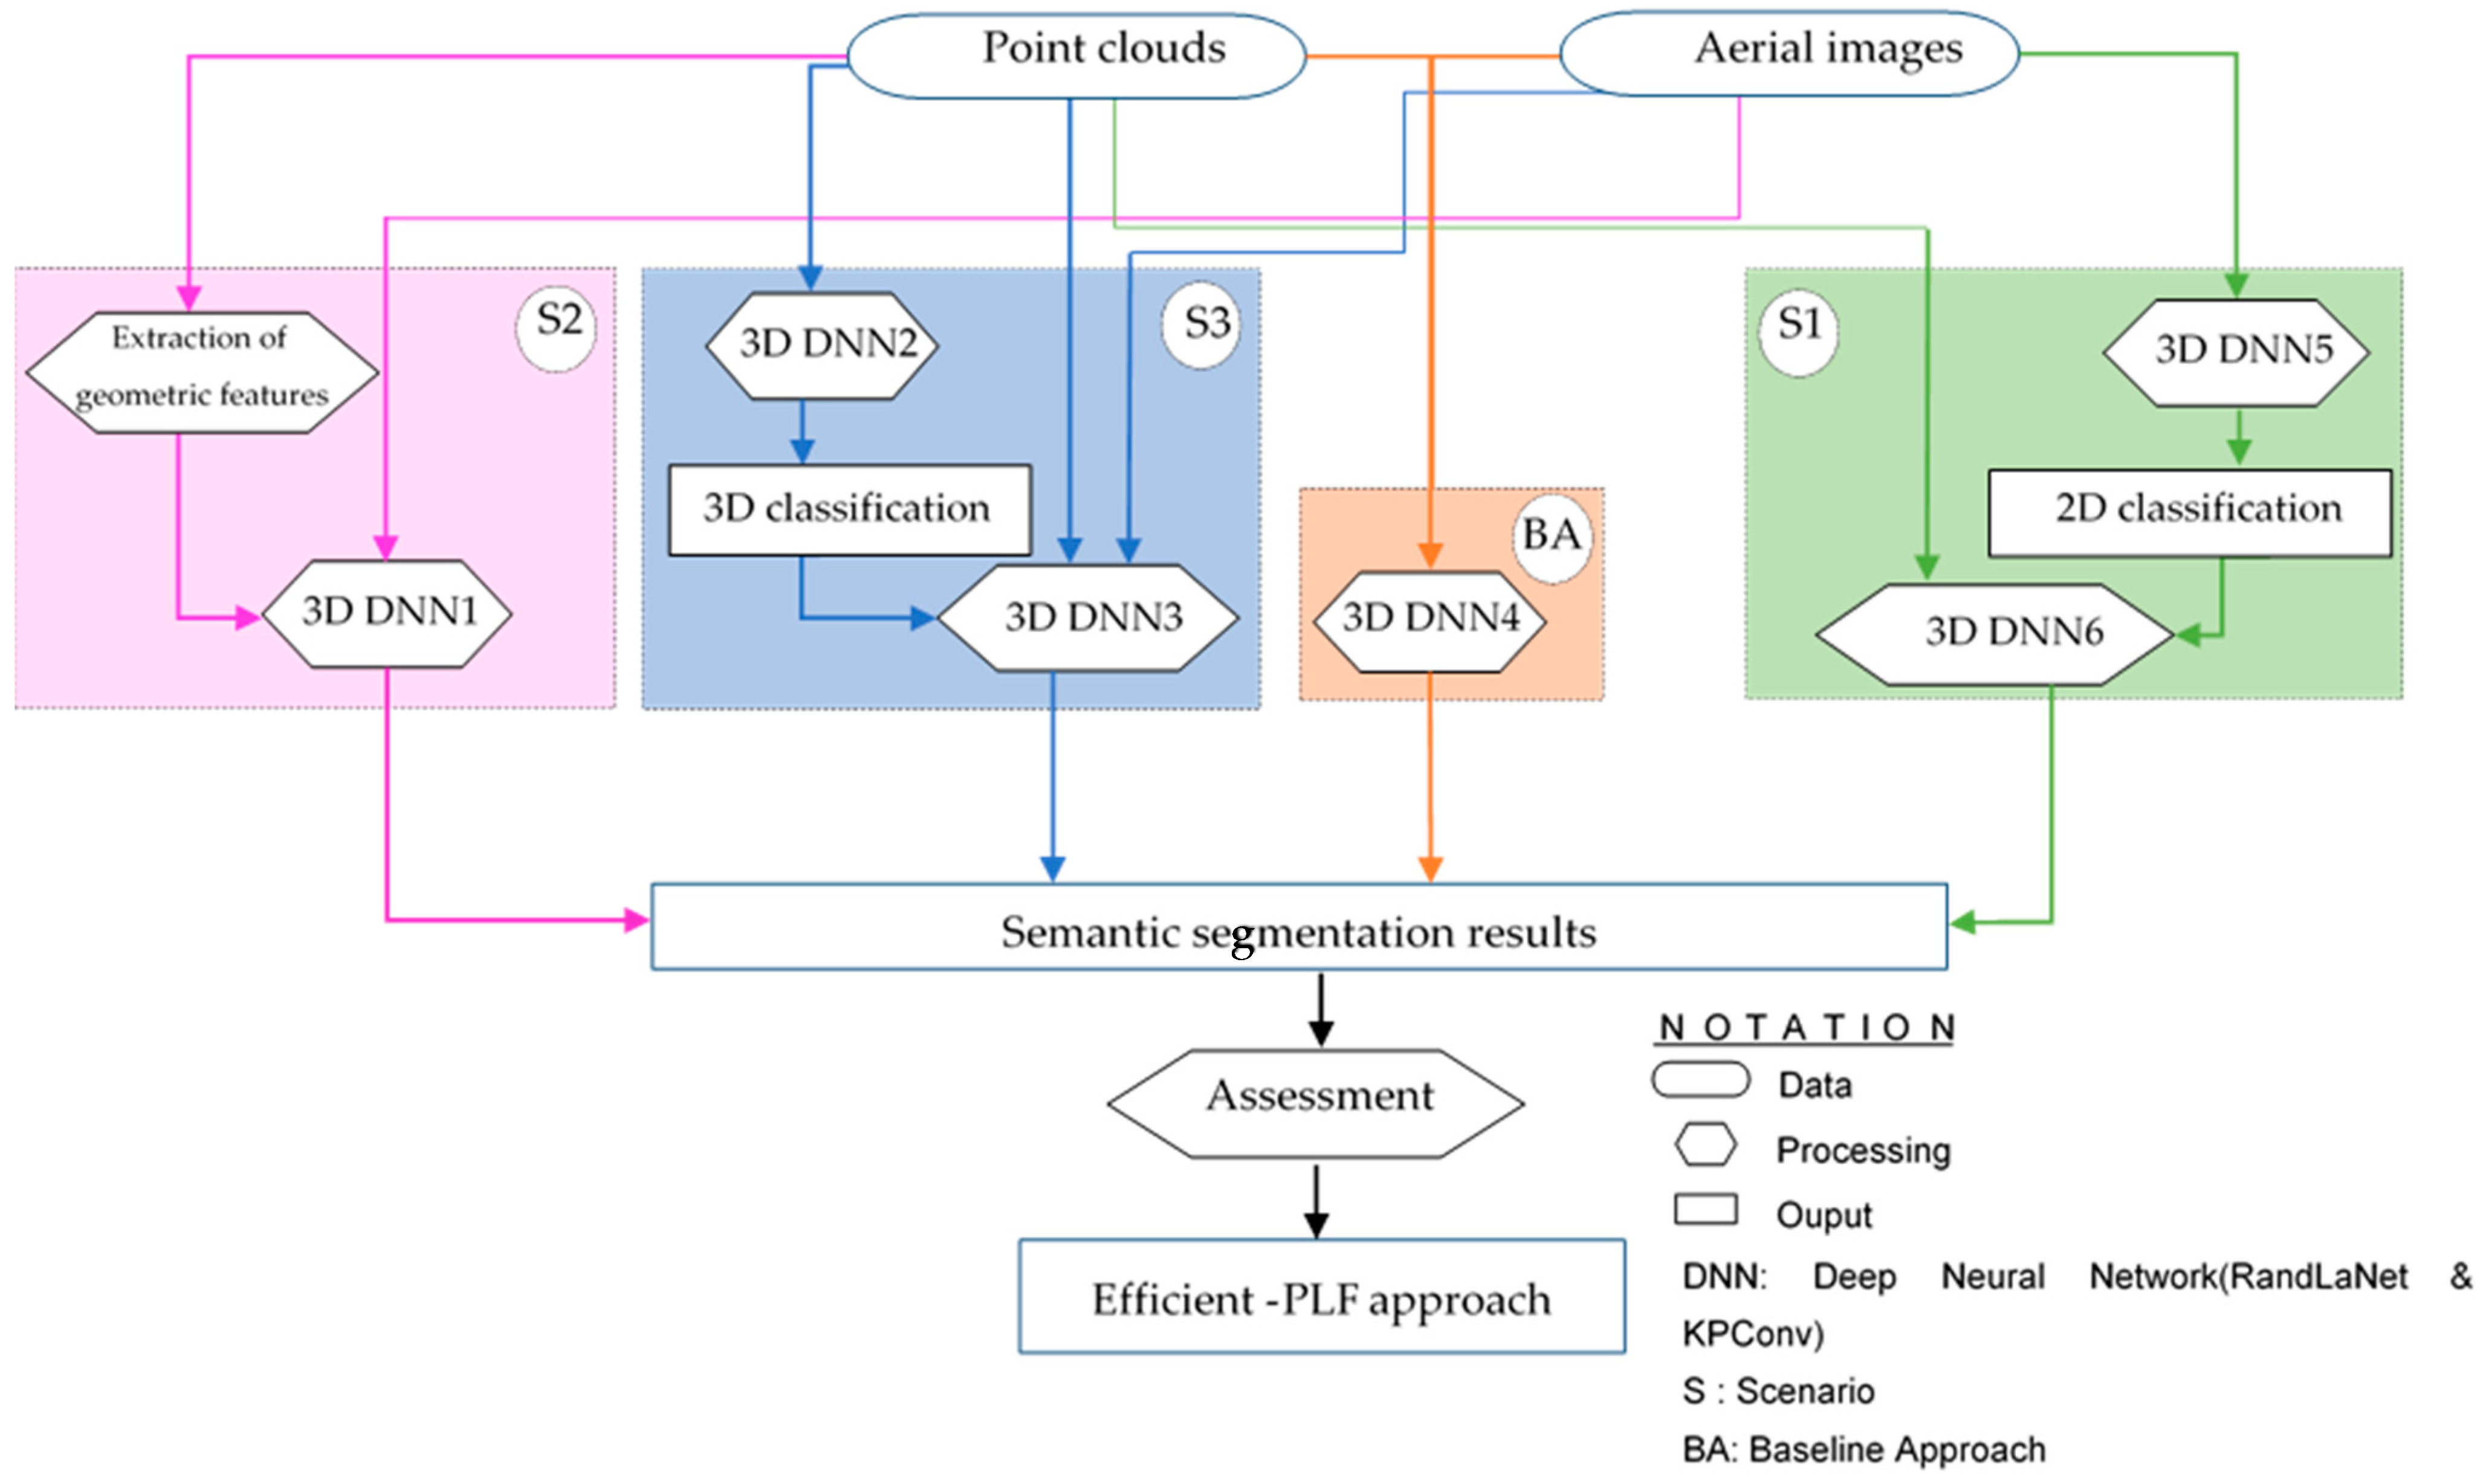
Figure 1. The general workflow.
Remotesensing 16 00329 g001
Figure 2. The first proposed scenario (S1).
Remotesensing 16 00329 g002
Figure 3. The second proposed scenario (S2). (A) Selection of the appropriate geometric features. (B) Data Training and Semantic Segmentation Using RandLaNet and KPConv Techniques.
Remotesensing 16 00329 g003
Figure 4. The third proposed scenario (S3).
Remotesensing 16 00329 g004
Figure 5. The general workflow of the baseline approach.
Remotesensing 16 00329 g005
Figure 6. Normalized confusion matrix for proposed scenarios and the baseline approach in an urban scene using the RandLaNet technique.
Remotesensing 16 00329 g006
Figure 7. The 3D semantic segmentation results of the baseline and the three developed scenarios. Ground truth is also displayed.
Remotesensing 16 00329 g007
Figure 8. Selected regions from 3D semantic segmentation maps of the all evaluated processes.
Remotesensing 16 00329 g008
Figure 9. Normalized confusion matrix for the proposed scenarios and the baseline approach in an urban scene using the KPConv technique.
Remotesensing 16 00329 g009
Table 2. Semantic segmentation performance of the baseline approach and developed scenarios (urban scene 2).
Semantic Segmentation Performance Baseline ApproachS1S2S3
GroundPrecision0.7460.9520.9170.907
Recall0.9900.9210.9270.917
F1-score0.8510.9360.9220.912
High VegetationPrecision0.9370.9970.9950.995
Recall0.9980.9920.9950.993
F1-score0.9670.9940.9950.994
BuildingsPrecision0.9850.9820.9870.976
Recall0.9090.9550.9380.951
F1-score0.9460.9680.9620.963
WallsPrecision0.7900.7690.7660.725
Recall0.6770.6900.7760.639
F1-score0.7290.7270.7710.680
ParkingPrecision0.6050.4280.4170.408
Recall0.1230.7570.7270.722
F1-score0.2050.5470.5300.522
Traffic RoadsPrecision0.0000.8400.8280.803
Recall0.0000.7260.6290.498
F1-score0.0000.7790.7150.614
Street FurniturePrecision0.3250.2500.2590.230
Recall0.5180.8280.7790.698
F1-score0.3990.3840.3890.346
CarsPrecision0.9290.9090.9040.862
Recall0.7210.9370.9560.935
F1-score0.8120.9220.9290.897
FootpathPrecision0.0000.6550.6010.530
Recall0.0000.6640.5570.530
F1-score0.0000.6600.5780.530
Table 3. Results of semantic segmentation achieved using KPConv.
Semantic Segmentation Performance BAS1S2
GroundPrecision0.7620.8800.767
Recall0.9460.9310.949
F1-score0.8440.9050.849
High VegetationPrecision0.9610.9890.948
Recall0.8890.9860.987
F1-score0.9240.9870.967
BuildingsPrecision0.7660.8820.871
Recall0.9360.9750.926
F1-score0.8430.9260.903
WallsPrecision0.4560.5400.760
Recall0.0080.0430.148
F1-score0.0160.0800.257
ParkingPrecision0.3730.5340.462
Recall0.2800.3570.352
F1-score0.3200.4280.400
Traffic RoadsPrecision0.4750.7270.558
Recall0.0250.6910.014
F1-score0.0480.7090.028
Street FurniturePrecision0.3340.3440.606
Recall0.0120.0740.055
F1-score0.0230.1220.093
CarsPrecision0.7350.7610.751
Recall0.3990.7190.634
F1-score0.5170.7390.681
FootpathPrecision0.5120.5740.584
Recall0.0280.2080.023
F1-score0.0530.3050.043
Table 4. RandLaNet adopted to our Efficient-PLF approach vs. DL Techniques [11]: Per-class IoU (%) Comparison.
GroundHigh
Vegetation
BuildingsWallsParkingTraffic RoadsStreet
Furniture
CarsFootpath
PointNet [35]67.9689.5280.050.003.9531.550.0035.140.00
PointNet++ [36]72.4694.2484.772.7225.7931.5411.4238.847.12
TagentConv [37]71.5491.3875.9035.2245.3426.6919.2467.580.01
SPGraph [6]69.9394.5588.8732.8315.7730.6322.9656.420.54
RandLaNet adopted to our Efficient-PLF approach85.4297.3390.8149.2242.0656.0035.0077.9719.86
Disclaimer/Publisher’s Note: The statements, opinions and data contained in all publications are solely those of the individual author(s) and contributor(s) and not of MDPI and/or the editor(s). MDPI and/or the editor(s) disclaim responsibility for any injury to people or property resulting from any ideas, methods, instructions or products referred to in the content.