Abstract
The thermal band of a satellite platform enables the measurement of land surface temperature (LST), which captures the spatial-temporal distribution of energy exchange between the Earth and the atmosphere. LST plays a critical role in simulation models, enhancing our understanding of physical and biochemical processes in nature. However, the limitations in swath width and orbit altitude prevent a single sensor from providing LST data with both high spatial and high temporal resolution. To tackle this challenge, the unmixing-based spatiotemporal fusion model (STFM) offers a promising solution by integrating data from multiple sensors. In these models, the surface reflectance is decomposed from coarse pixels to fine pixels using the linear unmixing function combined with fractional coverage. However, when downsizing LST through STFM, the linear mixing hypothesis fails to adequately represent the nonlinear energy mixing process of LST. Additionally, the original weighting function is sensitive to noise, leading to unreliable predictions of the final LST due to small errors in the unmixing function. To overcome these issues, we selected the U-STFM as the baseline model and introduced an updated version called the nonlinear U-STFM. This new model incorporates two deep learning components: the Dynamic Net (DyNet) and the Chang Ratio Net (RatioNet). The utilization of these components enables easy training with a small dataset while maintaining a high generalization capability over time. The MODIS Terra daytime LST products were employed to downscale from 1000 m to 30 m, in comparison with the Landsat7 LST products. Our results demonstrate that the new model surpasses STARFM, ESTARFM, and the original U-STFM in terms of prediction accuracy and anti-noise capability. To further enhance other STFMs, these two deep-learning components can replace the linear unmixing and weighting functions with minor modifications. As a deep learning-based model, it can be pretrained and deployed for online prediction.
1. Introduction
Land surface temperature (LST) data from satellite-based thermal sensors captures detailed variations in the energy distribution of the Earth’s surface over space and time. These data play an essential role in applications such as evapotranspiration observation and urban heat modeling [1,2,3]. However, owing to the limitations of the satellite orbit and sensor design, there is usually a trade-off between the spatial and temporal resolutions of the thermal band. Daily sensors can only provide data with a lower spatial resolution, such as MODIS LST with a 1 km resolution. Fine-resolution (100 or less) sensors are usually limited to their swath width and orbit altitude and can only provide data within days, such as the Landsat series platform within eight days (combining Landsat7, 8, and 9). Therefore, regarding the boosting of available satellite resources, merging data from multiple satellite sensors is one of the key challenges for obtaining high spatial-temporal resolution observations, which will further benefit many comprehensive applications such as earth surface energy modeling and precision farming [3].
To overcome this limitation, many super-resolution or fusion models have been recently developed to produce daily LST observations with fine spatial resolution in both computer vision and remote sensing fields. These models can be grouped into three categories: (1) learning-based, (2) regression-based, and (3) spatial-temporal fusion-based.
Learning-based models are mainly from the computer vision perspective, with the assumption that the relationship between coarse and fine pixels can be described by a point spread function (PSF), which represents a mixing process that builds low-resolution pixels with high-resolution pixels [4]. The PSF is scale-related but maintains temporal and spatial consistency and can be modeled by a learning system. Before 2015, PSFs were mainly constructed using image reconstruction (RE) models, such as kernel-based methods [5], deconvolution models [6], sparse coding [7,8,9], and SVM-based methods [10]. With the considerable advances of deep learning technologies in semantic segmentation and imaging, deep networks were first introduced in the super-resolution problem to capture PSF with SRCNN [11] and SRGAN [12]. Later, these technologies enhanced the remote sensing field models, including CNN-based: STFDCNN [13], DCSTFN [14], stfNet [15], EDCSTFN [16], and HSRNet [17]; and GAN-based: ISRGAN [18], STFGAN [19], CycleGAN-STF [20], and GAN-STFM [21]. The advantage of a learning-based model is that once it has been trained with sufficient samples, both the accuracy and efficiency of the prediction can be guaranteed. However, considering the rapid changes in both the spatial and temporal variations in daily LST, it may be impossible for a universal PSF to accurately capture the mixing of low-resolution remote sensing images based on a limited number of samples. Furthermore, without the guidance of physical principles, the features, and weights learned by the deep learning-based models are usually difficult for humans to comprehend, which limits error tracing when an unreliable prediction occurs.
In contrast to learning-based models, which focus on learning the relationship only from coarse and fine images, the second category comprises regression-based models. These models are based on the assumption that the thermal band values detected by sensors can be modeled using several ancillary biophysical parameters (e.g., surface reflectance ratio, land use, land cover types, vegetation indices, and other outputs from simulation models) [22]. Disaggregation of radiometric surface temperature (DisTrad) [23] and thermal imagery sharpening (TsHARP) [24] are the first two models to downscale coarse LST based on the vegetation index-radiometric surface temperature relationship (VI-based model). This relationship has been evaluated at global and local scales [25]. Many nonlinear machine learning-based methods have been used to capture this relationship, such as random forest regression [26], random forest area-to-point kriging [27], and Gaussian filtering [22]. Based on vegetation index and slope data, high-level passive microwave (PMW) LST data were downscaled to fill the gap in MODIS LST observations with cumulative distribution function (CDF) matching and multiresolution Kalman filtering (MKF) to produce all-weather LST data [28]. In addition to satellite-based ancillary data, the land surface models can be integrated with MODIS and Landsat LST to generate a gapless LST for diurnal dynamic studies [29]. However, regression-based models assume that the relationship between LST and LST predictors is location-invariant, which may not be applicable when applying local pretrained relationships on a regional scale. Moreover, the performance of these models relies on the spatial resolution and accuracy of ancillary data.
The spatial-temporal fusion-based models (STFM) are based on the spatially and temporally continuous characteristics of land surface dynamics and utilize time-series satellite data to capture the relationships between coarse and fine pixels over space and time [30]. They provide a promising method for merging data from multiple sensors without considering the limitations of the downscaling ratio problem in most learning-based models in the computer vision field. Because both resolution observations are continuously updated by different satellites, the fused high-resolution spatial-temporal data can capture the dynamic changes of the surface, such as phenological and land cover changes [31,32]. Over the last decade, several STFMs have been developed based on these two essential concepts. First images are fused based on a weighting process that assumes that the residual between the coarse and fine pixels at the target time point () can be estimated by a linear weighting function with the number of residuals of available coarse-fine pixel pairs at the time before (). These coarse-fine pixel pair searches can be based on the spectral and temporal similarities at given spatial and temporal searching windows. Therefore, these models have been grouped as weighting-based models such as STARFM [33,34], STAARCH [35], ESTARFM [36], and Fit-FC [37]. Second, images are fused based on an unmixing process that assumes that the coarse pixel changing signal (usually the changing ratio or residual in the time series) can be unmixed based on several endmembers with factional cover, which can then be added to the fine-resolution image with a weighting function. Typical models include the MMT [38], STDFA [39], ESTDFM [40], U-STFM [41], STRUM [42], OB-STVIUM [43], and ISTDFA [44]. In these models, the number of endmembers, or homogeneous change regions (HCRs), is one of the criterion parameters for any unmixing-based model. In recent years, many models have combined these two fundamental ideas (weighting and unmixing) and achieved great success in overcoming the limitations of the weighting-based model when modeling surface changes. They are suitable for capturing changes such as phenological and land cover changes. Typical models include FSDAF [45], FSDAF 2.0 [46], TC-Umixing [47], RASDF [48], and VSDF [49].
When considering the downscaling of land surface temperature (LST), it is important to acknowledge that the diurnal dynamics of LST experience changes influenced by dynamic solar radiation at varying azimuth and zenith angles, as well as factors such as wind speed and surface moisture. This highly dynamic spatial and temporal characteristic presents three significant challenges for the conventional spatial-temporal fusion-based model (detailed analysis is shown in Section 2.1). Firstly, the mixing process of the thermal signal exhibits nonlinearity. For instance, in coarse pixels, the signal can be dominated by subpixel hot or cold spots, which are unrelated to the fractional coverage. Consequently, the current linear system may not be suitable for the spatial-temporal unmixing of LST [50]. Secondly, in the current linear unmixing system, too many endmembers or HCRs with small factional coverage cause the unmixing function to become an ill-posed problem and fail to provide the correct solution. Thirdly, the current weighting function is susceptible to noise, resulting in unreliable predictions of the final LST due to minor errors in the input data. The underlying reason for this is that the theoretical weighting function have a low tolerance for data noise.
To address the three limitations of the current spatiotemporal fusion model (STFM), this study introduces an enhanced U-STFM model that incorporates deep learning components for nonlinear downscaling of land surface temperature (LST). Specifically, we incorporate two deep learning components, namely DyNet and RatioNet, to replace the original unmixing and weighting functions. We selected the U-STFM as the baseline model, which initially focused on downscaling MODIS surface reflectance [41] and later extended its application to predict dynamic parameters by downscaling MODIS ocean chlorophyll concentration products [51]. In this study, we tested and compared the model in Shenzhen, China, a region characterized by rapid land cover changes driven by economic growth.
The primary objectives of this study are as follows:
- Develop a deep learning component (DyNet) for nonlinear unmixing of LST within the U-STFM framework.
- Improve the anti-noise capability of the weighting function by leveraging the data distribution captured by a deep learning component (RatioNet).
- Extend the original U-STFM model from surface reflectance downscaling to accommodate sensors with higher temporal variability, enabling the production of daily LST products at a 30 m scale.
The structure of this study is as follows: Section 2 introduces the study area and the datasets selected for this research. Section 3 discusses the limitations of the original U-STFM and provides detailed information about the nonlinear U-STFM. Section 4 presents the results, while Section 5 highlights the limitations of the nonlinear U-STFM. Finally, the conclusion is presented in Section 6.
2. Study Area and Datasets
2.1. Study Area
With the rapid development of urbanization, the urban heat island effect has a significant impact on the ecological environment of cities and surrounding areas. The urban heat island effect refers to the phenomenon where cities experience higher temperatures compared to their surrounding rural areas. This temperature difference is primarily caused by human activities and urban infrastructure, such as buildings, pavement, and transportation systems, which absorb and retain heat more effectively than natural landscapes. As cities continue to grow and urbanize at a rapid pace, the urban heat island effect becomes more pronounced. The phenomenon can lead to various environmental and ecological consequences. For instance, it can affect the local climate, air quality, energy consumption, and even human health. Therefore, understanding and mitigating the urban heat island effect are crucial for creating sustainable and livable cities, which heavily rely on high-spatiotemporal-resolution surface temperature monitoring data.
The Guangdong-Hong Kong-Macao Greater Bay Area (GBA) is a region in China undergoing rapid urbanization. Within the GBA, the cities of Dongguan and Shenzhen, serving as key urban centers, have witnessed significant transformations in land use and urban growth due to the country’s swift economic development. Extensive areas of wasteland and woodland have been converted into urban areas, leading to a rapid change in the spatial pattern of land surface temperature.
For the purpose of this study, a specific portion of the Guangdong-Hong Kong-Macao Greater Bay Area (GBA) was selected as this study area, covering approximately 1843 km2 (between 113°49′13″E–114°16′10″E and 22°37′17″N–22°59′48″N), as depicted in Figure 1. This selected area features a complex topography and encompasses a wide range of land cover types, providing a comprehensive scenario to assess the capability of the spatiotemporal fusion model (STFM) in handling rapid land cover changes.
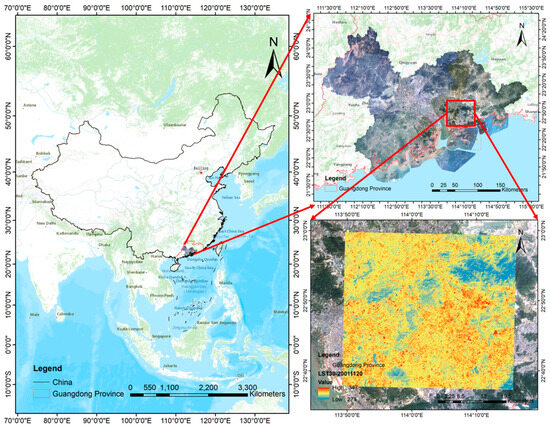
Figure 1.
The study area in Shenzhen and Dongguan within the GBA, China.
2.2. Dataset
The MODIS Terra daytime LST products were employed to downscale from 1000 m to 30 m, in comparison with the Landsat7 LST products. The MODIS Terra satellite was selected due to its close overpass time with Landsat7. In this study, the small difference in Land Surface Temperature (LST) between these two satellites on the same date was regarded as a system error and can be ignored regarding the huge LST difference among different dates. MODIS LST products (MOD11A1.006) and Landsat7 ETM + LST products (Landsat7 ETM Plus Collection 2 Level-2) were obtained from the USGS Earth Explorer (https://earthexplorer.usgs.gov (accessed on 12 April 2022)). The ETM + LST has a spatial resolution of 30 m after USGS processing and a revisit frequency of 16 days. MODIS LST products have a spatial resolution of 1000 m and a return frequency of 1 d. Because of the failure of ETM + SLC after 31 May 2003, and the perennial cloudy and rainy conditions in the study area, this study selected data with a cloud cover threshold of less than 1% from September 2000 to May 2003 and collected eight valid Landsat7 LST and MODIS LST image pairs. The details are presented in Table 1.

Table 1.
List of Landsat7 LST and MODIS LST products used in the study area.
3. Methodology
3.1. The Original U-STFM
In this study, we chose the U-STFM as our baseline model. The U-STFM model was first introduced by Huang and Zhang for surface reflectance data in 2014. This model is a typical unmixing-based STFM model that contains both the linear unmixing and weighting functions. A detailed explanation of U-STFM can be found in the original paper [41]. We provide a brief introduction to U-STFM here.
In U-STFM, to predict more detailed information for each MODIS pixel, a nonlinear unmixing process is used, which assumes that the coarse MODIS LST signal can be mixed with the average LST signal of each HCR. The mixing process is described in Equation (1).
where is the LST of the MODIS pixel on date t; represents the ideal super-resolution MODIS pixels with the same configuration as the MODIS sensor but its spatial resolution is 30 m. is the nonlinear mixing function.
The change ratio between the and periods can be calculated from both Landsat and MODIS images, where is the start date, is the targeted date, is the end date. The fundamental assumption of U-STFM is that the change ratios from Landsat and super-resolution MODIS are identical. Therefore, the change ratio in a Landsat pixel can be defined as
where is the Landsat LST on the end date ; is the Landsat LST on the targeted date ; and is the Landsat LST on the start date . The cannot be solved directly, because the is unknown.
Similarly, the change ratio of super-resolution MODIS images can be defined as:
combining Equations (2) and (3), the on the targeted date can be calculated by the theoretical weighting function as:
the key to solving Equation (4) is to calculate by unmixing the coarse resolution :
where is the unmixing function and is the time change ratio on the 30 m scale. In practice, to ensure that we can obtain a stable solution, we reduce the number of dependent variables in Equation (5) by replacing it with the average time change ratio on the 30 m scale for HCRs .
3.2. Problems with the Original U-STFM
In this study, our primary focus is addressing two key issues associated with the original U-STFM. The first problem pertains to the linear instability of the original unmixing function, while the second problem relates to the error sensitivity of the original weighting function.
The unmixing function plays a crucial role in spatial and temporal data fusion models. The original unmixing function is based on the linear unmixing theory, which assumes that the energy of the coarse pixel can be expressed as a linear combination of the fine-resolution pixels, weighted by their coverage fractions. As depicted in Figure 1, the linear unmixing function allows us to determine the temporal change ratio at the HCR level () by assigning multiple change ratios at the MODIS level () and utilizing the coverage fraction matrix. This function can be solved when the number of images exceeds the number of unknown values. Typically, this condition is satisfied due to the significantly larger number of MODIS pixels in this study area compared to the number of HCRs. However, as illustrated in Figure 2, when the number of HCRs increases, the coverage fraction matrix (highlighted in red) becomes sparse, leading to increased instability in the linear system.

Figure 2.
The problem is the unmixing function. The red region represents the HCRs, and the black square represents the MODIS pixels. The green region in the figure on the left demonstrates the case when HCRs are across multiple MODIS pixels, and the green region in the right figure demonstrates the case when HCRs are only covered by one MODISpixel as the result of making the coverage faction matrix sparser.
The fine-resolution image was predicted by synthesizing the fine images prior to and following the target date () with the LST change ratio at the HCR level (). However, as depicted in Figure 3, the issue with this weighting function is that the LST prediction error exhibits varying sensitivity when α contains an error. More specifically, when falls within the red region, even a slight change can result in a substantial difference in the LST prediction. The error tolerance within this region was comparatively small.

Figure 3.
The problem with the original weighting function. The red region represents the more sensitive region of the error in ; the blue region represents the less sensitive region.
3.3. The Nonlinear U-STFM
The nonlinear U-STFM inherits the scale invariance of the U-STFM model, which is an unmixing-based STFM model assuming that the thermal signal change ratios in both MODIS and Landsat time series are identical. Therefore, the change ratio captured in the MODIS time series can be applied to the Landsat series under the assumption of scale invariance.
The fundamental concept behind this study is that both the instability of the unmixing function and the high sensitivity of the original weighting function to errors can be addressed through data-driven nonlinear modeling. Firstly, the employment of a nonlinear model ensures improved stability, regardless of the sparsity of the coefficient matrix in the original linear unmixing system. Furthermore, the nonlinear projection between fine and coarse thermal signals is more representative of reality, as hot or cold spots can nonlinearly dominate the thermal signals in coarse pixels. Secondly, by considering the actual data distribution in the feature space, the sensitivity of the weighting function to errors can be mitigated. Consequently, a data-driven, nonlinear model offers a viable solution to this problem.
Following this idea, we designed two multilayer perceptrons (DyNet and RatioNet) that form data-driven nonlinear projections in both the unmixing and weighting processes. As depicted in Figure 4, the prediction of the 30 m-level Land Surface Temperature (LST) on the target date involves organizing the MODIS LST data from the previous, target, and subsequent dates into three date pairs. Subsequently, the LST differences among the different dates in the MODIS LST dataset can be calculated. Additionally, the change ratio of MODIS for each pixel can be computed and serves as the input for the DyNet model. The output of DyNet provides the change ratio for each HCR, which in turn serves as the input for RatioNet to obtain the final prediction of LST on the target date.
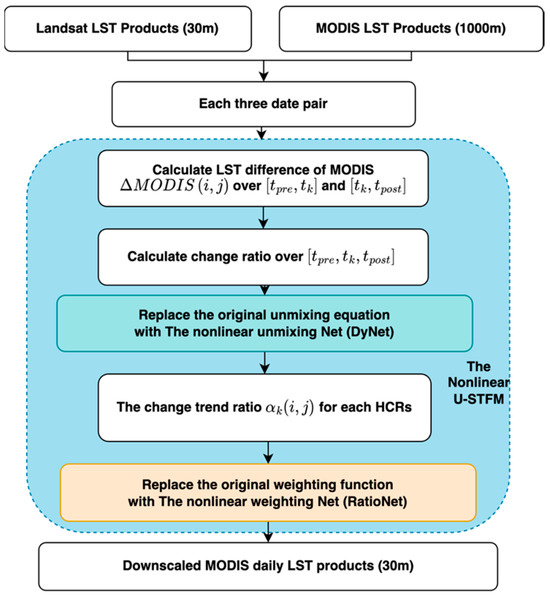
Figure 4.
The basic idea of the nonlinear U-STFM.
In contrast to the original U-STFM, the nonlinear U-STFM is a data-driven model trained using appropriate datasets. The workflow of this study is shown in Figure 5. There are four main steps. Step 1: identify the homogeneous change regions (HCRs). The HCRs were identified as regions that have a similar LST change trend and can share a similar changing ratio for the next step. The time-series high-resolution Landsat data were used to build up the feature space to identify the HCRs and build the datasets for training. Step 2: Train the DyNet and RatioNet. The main task of this step was to train the model to capture the nonlinear relationship of the change ratio between MODIS and sub-pixel HCRs. After training, the nonlinear U-STFM model was used to predict a higher-resolution LST product based on time-series MODIS and Landsat data. In the fourth step, we evaluated the performance of the nonlinear model by comparing it with the original U-STFM and two commonly used downscaling models, STARFM and ESTARFM.
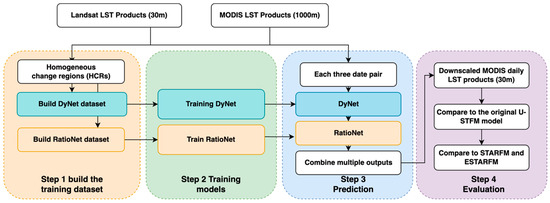
Figure 5.
Overall workflow of this study.
Under unified solar radiation and evaporation conditions, similar surface materials or land cover types showed similar thermal patterns over time. Regions showing similar change patterns were identified as homogeneous change regions. Each HCR shares a similar change rate and can be used as an indicator for the unmixing process. In the U-STFM model, the HCRs were defined by the segmentation process. Considering the model generalization across time, we defined the HCRs based on the clustering method. Specifically, we used k-means clustering to define the HCRs for prediction. Different numbers of classes were compared in this study.
3.3.1. The Nonlinear Unmixing Model (DyNet)
Considering the radiation effect of thermal signals, the traditional linear unmixing model used in U-STFM is not suitable because hot spots (HCRs) may contribute more to the MODIS signal depending on its temperature. The relationship between HCRs and MODIS signals appears to be nonlinear.
To overcome the unstable problem of the unmixing function, a dynamic multilayer perceptron (DyNet) were introduced to capture this nonlinear relationship based on historical datasets. The workflow is illustrated in Figure 6.
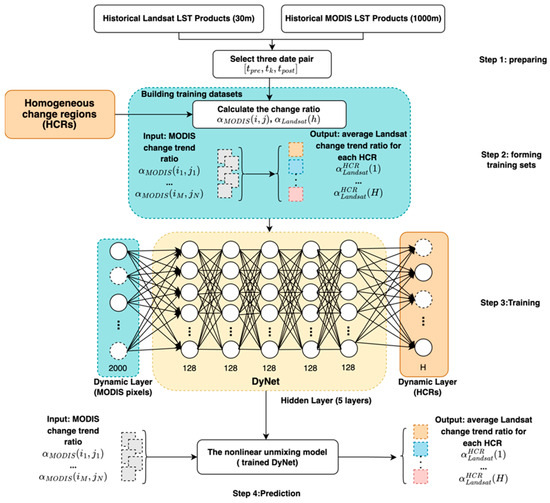
Figure 6.
The workflow for training the unmixing model with DyNet.
The training dataset for DyNet was calculated using historical Landsat and MODIS LST products. The input of the DyNet is the time change ratio of the MODIS LST from three dates , where represent the previous date, the target date, and the post date, representatively. The output of the DyNet is the time change ratio at the HCR level , which is the mean value of the at the 30 m level. The calculations for and follow Equation (2).
DyNet has two dynamic layers as the input and output layers and five hidden layers with 128 neurons in each layer. All seven layers are fully connected to capture the nonlinear relationship. The whole structure can be interpreted as unmixing with a group of MODIS pixels (2000 in this study), where the represents the number of HCRs defined by a cluster or segmentation algorithm. The training process of DyNet is based on a minibatch stochastic gradient descent. As shown in Figure 7, the neurons in the input layers represent the MODIS pixels in total for solving the nonlinear unmixing problem. For example, if 2000 MODIS pixels were selected for unmixing, there would be 2000 neurons. There is no specific requirement for the number of input layers in DyNet, as these MODIS pixels can cover all homogeneous change regions (HCRs). To avoid potential “ill-pose problems,” it is recommended to have a sufficiently large number of MODIS pixels to ensure coverage of all HCRs. This number serves as a hyperparameter of the model. We randomly selected half of the available MODIS pixels (2000) based on the total count of 4000+ MODIS pixels in the area to ensure coverage of all HCRs. The neurons in the output layer represent the change ratio of HCRs. Since each batch encompasses only specific MODIS pixels and HCRs, the input and output layers are activated solely by the MODIS pixels and HCRs within that particular batch. Neurons that are not part of the current batch act as dropouts. Consequently, the input and output layers dynamically change during the training process. As each batch gives the partial prediction of , the final prediction is obtained by combining multiple predictions from each batch using median calculation for each HCR. The median value is utilized to mitigate the impact of outlier predictions, as they have a greater influence on the mean value. The mean square error (MSE) was utilized as a loss function for training purposes. In the case of applying the model from one region to another, if the same cluster or segmentation rule is employed across regions, the model can be reused without the need for retraining.
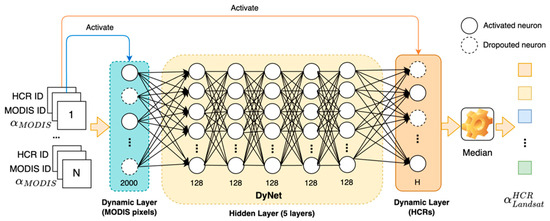
Figure 7.
DyNet training process.
3.3.2. The Nonlinear Weighting Model (RatioNet)
A multilayer perceptron model trained using real data can effectively capture the data distribution and construct a latent feature space that enables accurate predictions based on feature similarity. This model addresses the error-sensitivity issue present in the original weighting function of U-STFM. The establishment of a stable feature space is a crucial prerequisite for training artificial models. However, the original weighting function exhibits two divergent graphs depending on the magnitude of LST at () and LST at (). To train the RatioNet, the data must undergo a transformation process involving three steps, enabling the conversion of these divergent graphs into a stable feature space. Further details can be found in Figure 8.
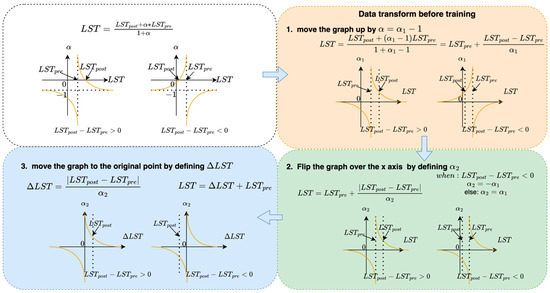
Figure 8.
Data transformation for training the RatioNet.
Step 1: Move the graph up by defining . By defining a new variable , the graph of the relationship between becomes symmetric along the x-axis. The weighting function becomes:
Step 2: Flip the graph over the X-axis by defining .
after step 2, the weighting function becomes:
Step 3: The effect of different magnitudes of was removed by changing the target variable from to .
after data transformation, the input of RatioNet had two components: (1) the absolute difference of LST at LST at and . ; and (2) the transformed change ratio for each HCR . The structure and training process of RatioNet are shown in Figure 9.
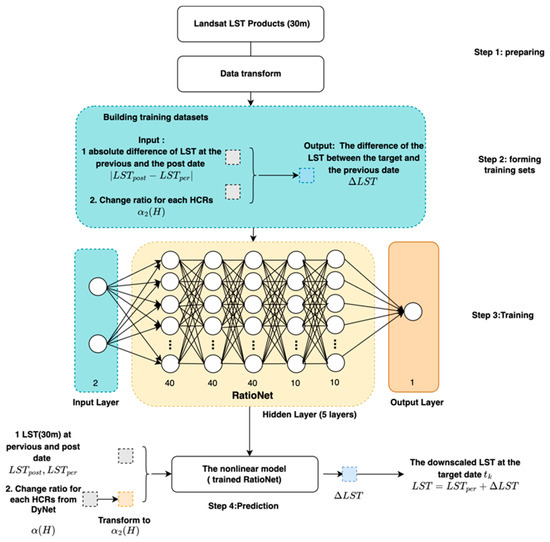
Figure 9.
The training process of the RatioNet.
3.3.3. Predicting Daily Higher Resolution LST with the Nonlinear U-STFM
In the prediction stage, multiple three-date pairs were organized from the time-series MODIS LST products for the target date . In each pair, the MODIS time change ratio was calculated as the DyNet input. The DyNet predicted the as its output. Then, was transformed to based on the data transformation method mentioned in Section 3.3.2 as the input for RatioNet. RatioNet provided the prediction of the and the final LST at fine resolution was then calculated based on . Based on this process, each three-date pair can provide a prediction of LST on the target date. The median value calculated at the pixel level provided the final LST prediction. The prediction process are shown in Figure 10.
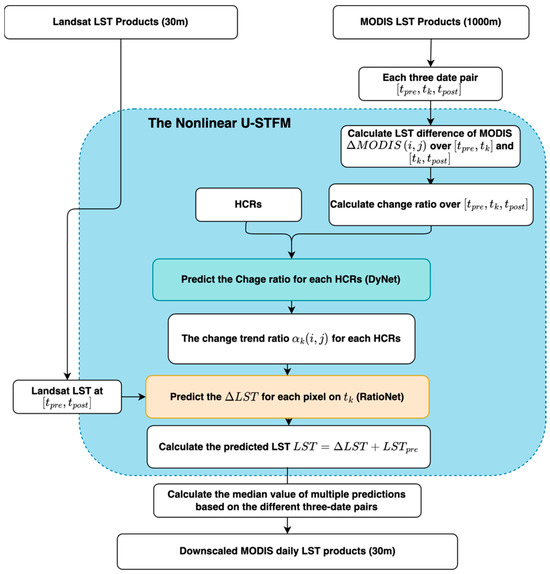
Figure 10.
Nonlinear U-STFM prediction workflow.
3.4. Evaluation
In this study, the effectiveness of the model in forecasting the land surface temperature was assessed using both qualitative and quantitative assessment measures. Landsat LST data at a spatial resolution of 30 m were used as the ground truth for each forecast. There were a total of six trustworthy dates spread over eight dates. Various three-date combination groups were assessed each day; for instance, there were 12 three-date groups available on 20 November 2001. By contrasting and examining the visualization impacts of the expected and actual LST pictures, a qualitative assessment of model fusion was conducted. For a quantitative evaluation, the peak signal-to-noise ratio (PSNR), correlation coefficient (CC), root mean square error (RMSE), and mean absolute error (MAE) were utilized. The PSNR is an image quality evaluation indicator for full-reference images. The effective range of the CC value is between the intervals (−1, 1); a value closer to 1 suggests a better fusion outcome. A better prediction was correlated with a greater PSNR and lower RMSE and MAE values. All quantitative evaluation indicators were calculated using the function in the scikit-learn module. The PSNR, CC, RMSE, and MAE were defined as follows:
where L and P represent the actual observed Landsat pixel and the predicted image pixel , respectively; M and N represent the height and width of the image, respectively; represents the maximum value of the image color; and represent the average value of the observed image and the predicted image, respectively.
4. Results
4.1. DyNet and RatioNet Training Processes
Both DyNet and RatioNet can be easily trained using a minibatch stochastic gradient descent algorithm. Figure 11 shows the loss changes over 500 epochs during the training process. For DyNet, the test loss value flattened after 100 epochs, and no sign of overfitting occurred. The testing loss was higher than the training loss, indicating the difficulty of the fundamental unmixing process. This may be related to the batch size of the training. DyNet uses two dynamic layers (Figure 6) to predict the change ratio for each HCR, and a large batch size is recommended. The mean value for each batch was calculated as the loss. A larger batch size will involve more MODIS pixels to form the unmixing process, and the loss value will be closer to the ground-true loss calculated using the entire validation dataset. The loss plot of RatioNet is smooth, indicating that the learning process of the network is easier after changing the feature space based on the data transformation described in Section 3.3.2.
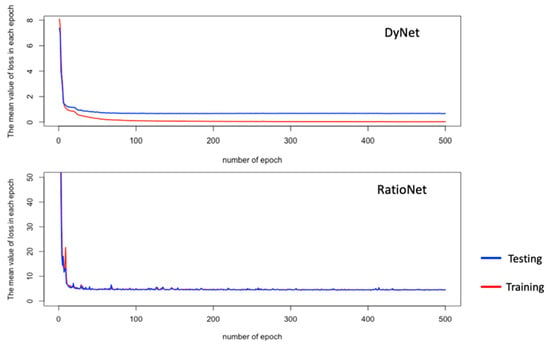
Figure 11.
The loss value during the training process.
4.2. LST Prediction on a Cloud Day
The cloud effect was the major source of noise in the LST product. The cloud temperature was significantly lower than the land surface temperature. In our dataset, the data for 1 November 2000, were partially covered by clouds. Therefore, we evaluated the performance of the model to predict the LST on a date that contains noise (a cloud, in this case).
Figure 12 illustrates the predicted change ratio for each homogeneous change region (HCR) using the DyNet model. A total of six groups of three-date combinations were considered to predict the Land Surface Temperature (LST) on 1 November 2000. The figure showcases the consistent performance of the DyNet model across different target dates while maintaining uniform parameters. It is important to note that the actual range of the change ratio for each HCR can encompass any number, as there is no specific range defined as the ground truth. During the prediction process, the entire image was clipped to a size of 256 × 256 pixels, serving as input to the model. Each batch provided predictions for the change ratio of the HCRs covered within that specific batch. Consequently, the boxplot represents multiple predictions for each HCR, and the median value of these predictions was utilized as the final change ratio. The root mean square error (RMSE) was calculated to assess the difference between the predicted and ground-truth values of the change ratio. Considering the variability of the change ratio across different target dates, the overall performance of the DyNet model is considered satisfactory.
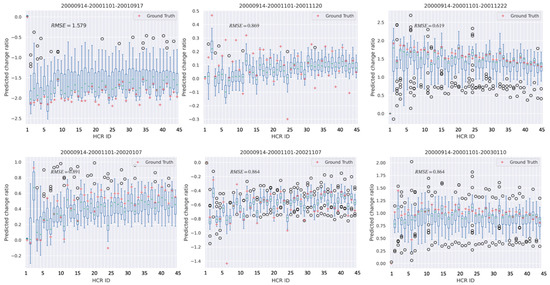
Figure 12.
The change ratio prediction for each HCR by DyNet: The red cross mark represents the ground truth, and the median value of the multiple predictions by the different beaches was used as the final prediction of the change ratio of each HCR.
Table 2 and Figure 13 present the final predictions for each three-date group regarding the LST on 1 November 2000. The prediction error can be primarily attributed to two factors. Firstly, it stems from the accuracy of the DyNet model in predicting the change ratio for each HCR. For instance, in the case of 20000914-20001101-20010917, the root mean square error (RMSE) for the DyNet prediction reached its highest value at 1.579. Consequently, the final RMSE for the LST prediction for this particular date triplet amounted to 3.875. Secondly, the prediction error is influenced by the baseline length, which represents the difference in LST between the previous and subsequent dates. As depicted in Figure 3, a smaller baseline size compresses the data space closer to the value, resulting in a larger prediction error for the RatioNet model. For example, consider the case of 20000914-20001101-20021107. The RMSE for the DyNet prediction was relatively small, at 0.864. However, the baseline length for this case was 3.015, indicating a higher degree of prediction uncertainty for RatioNet.

Table 2.
The prediction of LST at 30 m level based on the nonlinear U-STFM (DyNet+RatioNet) for each date pair.
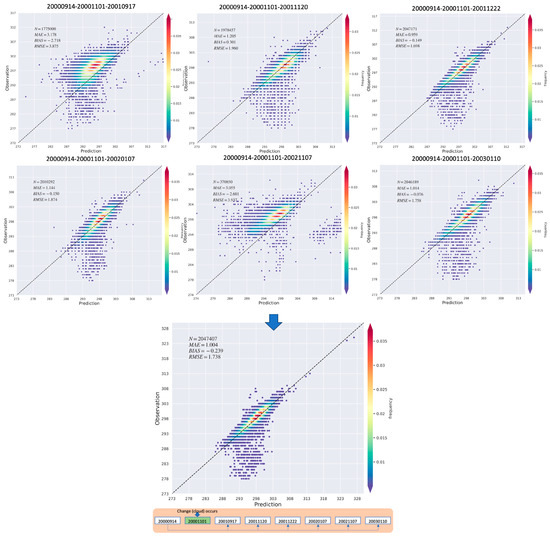
Figure 13.
1:1 plot for predicting LST on 1 November 2000 with different three date pairs (upper) and the final combination prediction (the median value at the pixel level).
Fortunately, the errors accumulated by DyNet and RatioNet due to a short baseline can be mitigated through the pixel-level median combination. Figure 13 demonstrates that the 1:1 plot of the median combination effectively filters out inaccurate predictions, resulting in improved accuracy.
The actual land surface temperature observed by Landsat on 1 November 2000, was partially affected by clouds, as indicated by the red circle in Figure 14c. However, this partial cloud signal was not captured by the MODIS data shown in Figure 14a, resulting in the absence of cloud indications in the prediction made by the nonlinear U-STFM model depicted in Figure 14b. Because the LST values for the cloud-covered area were filled based on the change ratio within the same HCRs that were uncovered by the cloud, the impact of the cloud effect can also be observed in both the 1:1 plot (Figure 14d) and the RMSE image (Figure 14d).
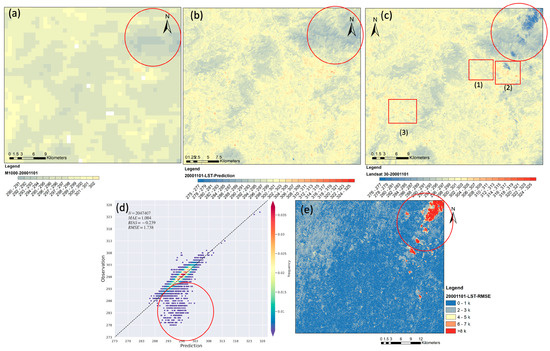
Figure 14.
The final prediction (1 November 2000) based on combining multiple date triplets. (a) the original MODIS LST on 1 November 2000; (b) the prediction of our model; (c) the Landsat LST; (d) the 1:1 plot between our model prediction and the Landsat LST; (e) the RMSE map between our model prediction and the Landsat LST. (1)–(3) are subareas shown in Figure 15.
To assess the model’s ability to detect subtle signals, hot and cold spots were chosen as reference points. Figure 15 demonstrates that the model successfully captured the hot spots, represented by the red spots in regions 1 and 2. Additionally, the model accurately identified the presence of solar panels on the cold roof in Region 3.
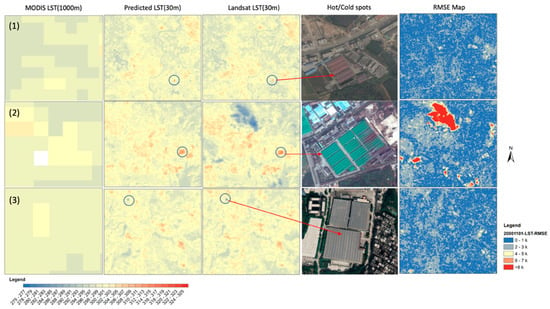
Figure 15.
Subarea of Figure 14.
4.3. The LST Prediction after Land Cover Change
In Section 4.2, our focus is primarily on showcasing the prediction performance in scenarios where cloud effects are present on the target date. In this section, we aim to assess how the model performs when there are land surface temperature changes prior to the target date. To simulate these LST changes, we utilize cloud cover as a proxy for land cover changes in this section.
The LST observed by Landsat on 1 November 2000, exhibited partial cloud coverage. We made the assumption that these areas covered by clouds represented changes in land cover. To assess the impact of these changes on subsequent model predictions, we conducted tests. In this section, we designated the LST prediction for 17 September 2001, as the target date to investigate how the observations from 1 November 2000, influenced the prediction for 17 September 2001.
Figure 16 shows the prediction results for 17 September 2001. As shown in the RMSE map (Figure 16e), the LST change that occurred in 1 November 2000, was captured by the model and reflected in the prediction in 17 September 2001. If the data for 1 November 2000, were removed, the prediction showed no sign of change (Figure 17). The RMSE was much higher when we removed 1 November 2000 from the time series. This is because for the prediction of 17 September 2001, in our case, by removing 1 November 2000, 50% of the date triplets for the final median value combination were removed, which also increased model uncertainty.
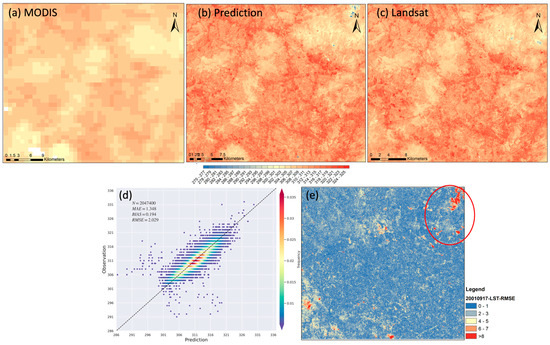
Figure 16.
Prediction for 17 September 2001. (a) the original MODIS LST; (b) the prediction of our model; (c) the Landsat LST; (d) the 1:1 plot between our model prediction and the Landsat LST; (e) the RMSE map between our model prediction and the Landsat LST.
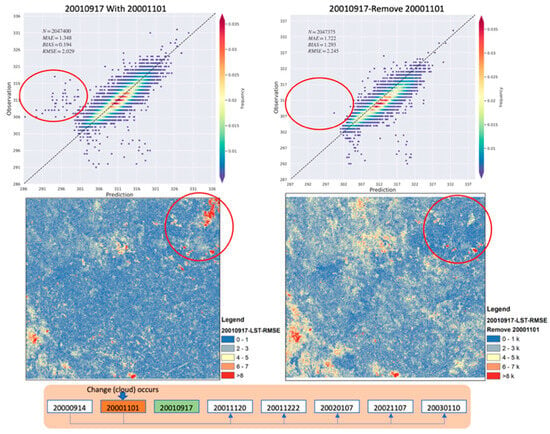
Figure 17.
Comparison of the prediction for 17 September 2001, with or without data for 1 November 2000. Partial cloud coverage marked by the red circle.
4.4. Model Generalization for Multiple Date Prediction
The model’s ability to generalize across different time periods was also evaluated. In contrast to the original U-STFM approach, which developed separate unmixing models for each target date, the nonlinear U-STFM employed a consistent unmixing model irrespective of the date. Figure 18 illustrates a 1:1 plot of the predictions across multiple dates. The overall root mean square error (RMSE) for these six days of LST prediction remains below 2.1 k, indicating the successful generalization of the uniform unmixing model (DyNet) and weighting model (RatioNet) across various dates.
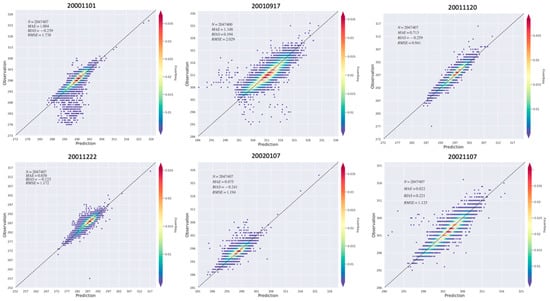
Figure 18.
The 1:1 plot for multiple date predictions.
4.5. The Performance of the Model under Different HCR Levels
As mentioned previously, one of the challenges addressed by the nonlinear U-STFM model is the limitation of the linear unmixing function when dealing with a large number of HCRs. To evaluate the model’s performance under different HCR levels (HCR-45, HCR-145, and HCR-245), we compared it with the original U-STFM utilizing a linear unmixing function.
Figure 19 and Figure 20 present the model comparisons for 1 November 2000, and 17 September 2001, respectively. The 1:1 plot illustrates the results of the median value combination for both the U-STFM and nonlinear U-STFM models. The boxplot showcases the range of root mean square error (RMSE) values for three different data triplets.
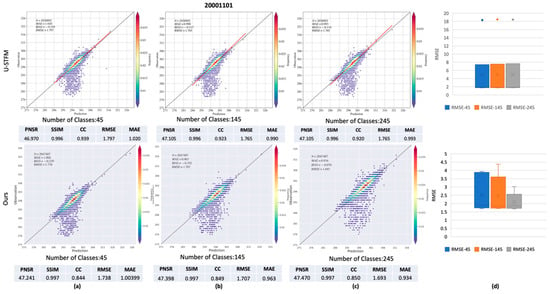
Figure 19.
Comparison with U-STFM on 1 November 2000 with multiple HCR setups; (a) the results under 45 HCRs group; (b) the result under 145 HCRs group; (c) the result under 245 HCRs group; (d) the RMSE boxplot under 45, 145 and 245 HCRs group.
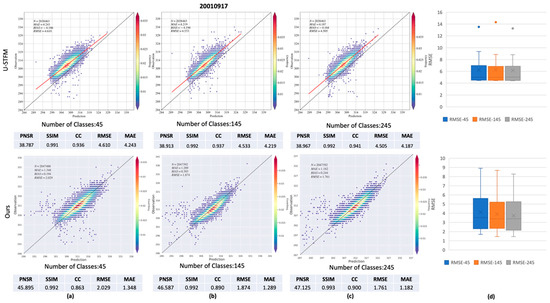
Figure 20.
Comparison with U-STFM on 17 September 2001, with multiple HCR setups. (a) the results under 45 HCRs group; (b) the result under 145 HCRs group; (c) the result under 245 HCRs group; (d) the RMSE boxplot under 45, 145 and 245 HCRs group.
On 1 November 2000 (Figure 19), a noticeable decrease in the RMSE boxplot was observed as the number of HCRs increased when using the nonlinear U-STFM model. However, the original U-STFM model did not exhibit a similar decrease.
Similarly, for 17 September 2001, the RMSE also decreased as the number of HCRs increased. However, the original U-STFM model displayed underestimation with a high RMSE.
4.6. RatioNet Performance
RatioNet aims to mitigate the noise effect by leveraging data distribution and sample similarity instead of relying on the theoretical weighting equation. To assess the performance of RatioNet, Gaussian random noise was introduced to decrease the signal-to-noise ratio (SNR) in the DyNet predictions, specifically the change ratio predictions for each HCR. We conducted a comparison between two setups: one using the DyNet model with the theoretical weighting equation, and the other utilizing DyNet with RatioNet.
The 1:1 plot represents the outcome of the median value combination for both models. The advantage of RatioNet is not particularly significant under SNR50 and SNR30, as the median value combination itself serves as a noise filter, enhancing prediction accuracy even under low noise levels. However, as the SNR decreases further, the model incorporating RatioNet demonstrates superior performance (Figure 21).
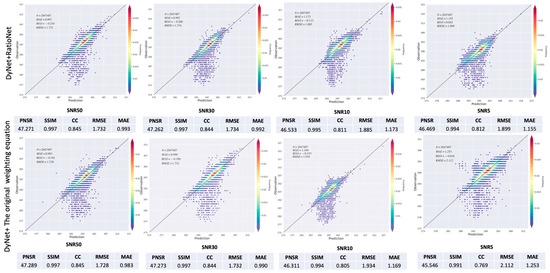
Figure 21.
Prediction with the different SNRs for 1 November 2000.
The boxplot illustrates the performance of RatioNet without the median combination process. It clearly demonstrates that RatioNet can substantially reduce the root mean square error (RMSE) for every prediction across each date triplet, especially when the SNR is low (Figure 22).
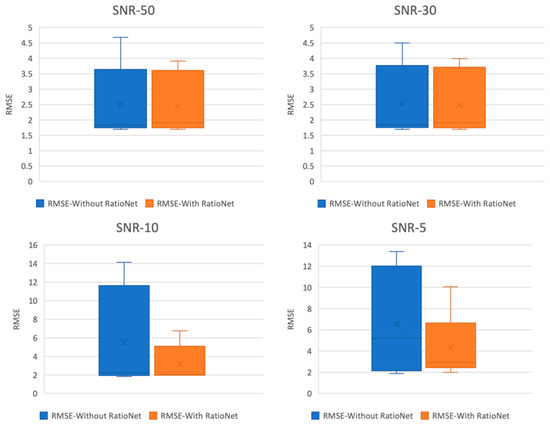
Figure 22.
Boxplot of prediction with the different SNRs.
4.7. Compare with the STARFM, ESTARFM, and the Original U-STFM
In comparison to STARFM, ESTARFM, and the original U-STFM, the nonlinear U-STFM demonstrated superior performance, exhibiting higher peak signal-to-noise ratio (PNSR) values and lower root mean square error (RMSE) values. Detailed results can be found in Table 3. The RMSE map, represented in Figure 23, reveals that no specific land cover type exhibits significantly higher RMSE values. This indicates that the model does not exhibit bias towards particular land cover types. Moreover, Figure 23 illustrates that the nonlinear U-STFM has the capability to automatically fill in cloud gaps resulting from missing MODIS data on the target date. This is achieved by employing a clustering algorithm to define HCRs. Additionally, the change ratio under the cloud area can be estimated using other MODIS pixels belonging to the same HCRs category.

Table 3.
Comparison of the nonlinear U-STFM with the STARFM, ESTARFM, and the original U-STFM, the bold value represents the best-performing model in each group.
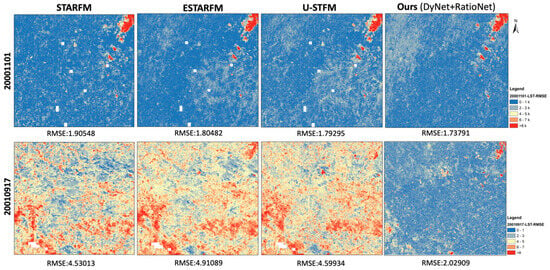
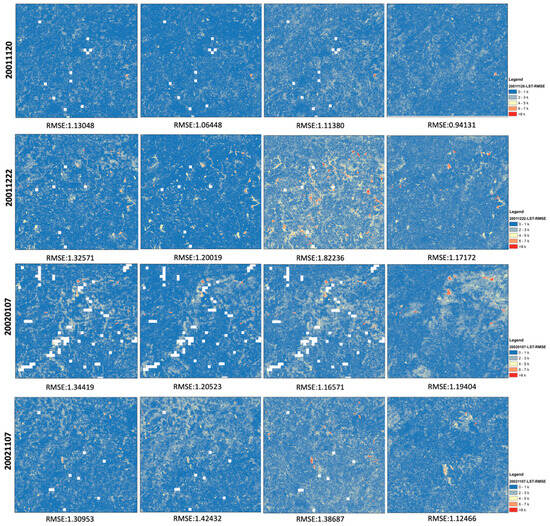
Figure 23.
Comparison with the prediction RMSE with STARFM, ESTARFM, and U-STFM.
The significant difference in RMSE values for STARFM, ESTARFM, and U-STFM on 17 September 2001, may be attributed to the cloud effect on 1 November 2000. Since half of the three-date pairs used for predicting 17 September 2001 contain images from 1 November 2000, it strongly influences the weighting function of STARFM, ESTARFM, and U-STFM. Another contributing factor could be the processing unit employed by each model. STARFM and ESTARFM operate at the pixel level, considering surrounding similar pixels. In contrast, U-STFM utilizes a larger processing unit defined by a segmentation algorithm, resulting in local regions. The nonlinear U-STFM has the largest processing unit, defined by clusters, which helps reduce prediction uncertainty.
5. Discussion
5.1. Truncation Error between the Change Ratio at the HCR and the Pixel Levels
The essential element of the U-STFM is the change ratio, which ideally should accurately predict the change ratio at the pixel level. This would enable precise prediction of high-resolution land surface temperature (LST) on the target date based on the LST values before and after that specific date. However, predicting the change ratio at the pixel level is inherently challenging due to the ill-posed nature of the problem. The number of unknown 30 m spatial resolution Landsat pixels is consistently greater than the number of known MODIS pixels. To address this challenge, endmember extraction methods are employed to reduce the number of unknowns. By reducing the number of endmembers to be determined to a quantity lower than the number of known MODIS pixels, the value of each endmember can be predicted using the unmixing function. In the U-STFM model, these endmembers are referred to as High Change Ratio (HCR) endmembers for spectral unmixing. However, it is important to note that the change ratio of each HCR does not necessarily match the change ratio of the pixels within that HCR. As a result, a truncation error exists between these different levels of analysis.
Figure 24 illustrates the truncation error observed between the change ratios at the High Change Ratio (HCR) and pixel levels. A narrow distribution, characterized by a mean value close to zero and a smaller difference range, indicates that the predicted change ratio in HCRs can effectively represent the change ratio of the majority of pixels within that HCR. The ideal scenario would exhibit a distribution with a mean of zero and a range of zero, indicating that the change ratio predictions of HCRs are identical to the actual change ratios of pixels within those HCRs.
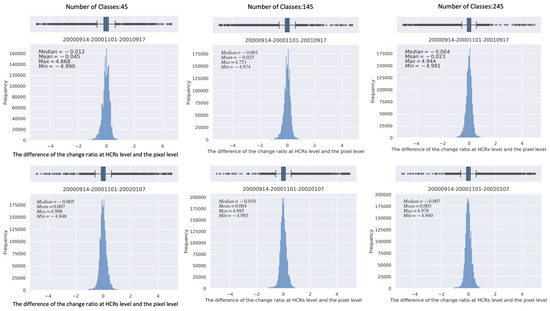
Figure 24.
The truncation error between the change ratio at HCR level and the pixel level.
Examining Figure 24, we can observe that the mean value of the truncation error across different date pairs (various rows) and varying numbers of HCRs (different columns) is consistently close to zero. This suggests that the DyNet model’s prediction of the change ratio in HCRs is unbiased. Moreover, as we compare different HCR numbers (such as HCR-45, HCR-145, and HCR-245), we observe that the mean value of the distribution decreases as the number of HCRs increases. This indicates that smaller HCRs provide a higher level of representation for the actual change ratio at the pixel level. Consequently, to further minimize truncation errors, future research may require a more accurate endmember extraction method.
5.2. Baseline Length Effect
The uncertainty in predicting the weighting function was influenced by a factor, namely the similarity between the land surface temperatures of and . In this study, we refer to this similarity as the “Baseline length,” adopting the definition used in the field of Interferometric Synthetic Aperture Radar (InSAR). A shorter baseline length resulted in greater uncertainty in the weighting function. Figure 25 demonstrates that a short baseline length pushes the graph of the weighting function closer to the progressive line.

Figure 25.
The theoretical graph of the weighting function.
At the pixel level, when considering the scenario of , if the change ratio (α) is smaller than −1, even a slight change in α can lead to a significant change in LST prediction. Consequently, in such cases, the change ratio becomes unreliable for predicting LST.
An actual example showcasing the effect of a short baseline length is the prediction for the period between 20000914-20001101-20021107. Upon examining Table 2 and Figure 13, it is evident that the mean baseline length between LST on 20000914 and 20021107 is 3.015, with a standard deviation of 1.660. This indicates a high degree of similarity in LST between these two dates. In this particular scenario, despite the DyNet model’s prediction error being only 0.864 (as depicted in Figure 12), the weighting function failed to provide accurate predictions (RMSE: 3.937). The issue of a short baseline length essentially stems from the theoretical limitations of the chosen weighting function in the U-STFM. As analyzed earlier, to achieve higher accuracy in the final LST prediction, it is crucial to select divergent LST pairs with longer baseline lengths.
For this reason, in this study, we have observed that the time range between the pre-date and post-date is often over one year. This can be attributed to factors such as cloud cover and the inherent limitations of the weight function. When the range between the dates of the previous and post LST is smaller, there is a higher likelihood of obtaining similar LST values for each pixel. In such cases, the final prediction may have increased uncertainty. Consequently, this model is not suitable for predicting when the observation date ranges from previous to post is too close, as it can result in a small baseline problem.
6. Conclusions
Land surface temperature (LST) plays a crucial role in various geographic physical process simulation models. In recent years, the combination of high-spatial and temporal-resolution LST data from multiple satellite platforms have garnered significant attention. To achieve this objective, spatiotemporal image fusion models have emerged as promising downscaling methods. Previous research has demonstrated the effectiveness of unmixing-based fusion models like U-STFM in capturing land cover changes by extracting features from time series data. These models have achieved notable success in applications such as downscaling land surface reflectance and ocean color products. However, challenges persist in enhancing the accuracy of the original linear unmixing function and theoretical weighting function for small unmixing endmembers, particularly when dealing with rapid changes in LST and anti-noise capability in the downscaling process.
To address these challenges, we introduce an updated version of U-STFM called the nonlinear U-STFM, which incorporates a deep learning model. The original unmixing and weighting functions are replaced with two deep learning components: DyNet and RatioNet. Dynamic layers and feature space transformation techniques are employed to facilitate the training of these networks, even with a relatively small dataset.
For our study, we selected a portion of the Guangdong-Hong Kong-Macao Greater Bay Area (GBA) covering an area of approximately 1843 km2 as the study area. Landsat-7 and Landsat LST 30 m products were utilized to downscale daily MODIS data from 1000 m to 30 m resolution.
Following the training process, the results demonstrate that the uniform unmixing network (DyNet) effectively unmixes MODIS pixels across different target times (as shown in Figure 12) and reduces the root mean square error (RMSE) as the number of High Change Ratio (HCR) endmembers increases (as depicted in Figure 19 and Figure 20). The new weighting network (RatioNet) successfully lowers the RMSE in the presence of noise during the unmixing process (Figure 21 and Figure 22). Compared to the theoretical weighting function, RatioNet enhances the model’s robustness by incorporating more features from real data distribution and sample similarities. We also evaluated the overall performance of the nonlinear U-STFM for cloud-affected dates and LST changes. In our control experiment, the new model outperformed classical approaches like STARFM, ESTARFM, and the original U-STFM, achieving the highest accuracy (as shown in Table 3).
Unlike most end-to-end deep learning networks that combine feature extraction and modeling as a black box, the model developed in this study integrates the network with the original STFM model, allowing for easy interpretation. Additionally, a pretrained network can enhance prediction speed, making it suitable for online real-time applications. To expand on this research, it would be beneficial to train the newly developed model using different sources of data (such as Landsat 8 and 9) from multiple regions and subsequently assess its ability to generalize on a global scale.
Author Contributions
Conceptualization, S.G., Y.L. and H.K.Z.; Methodology, J.W. and R.W.; Validation, S.G. and M.L.; Investigation, Y.L., H.K.Z. and J.W.; Resources, J.C.; Data curation, M.L.; Writing—original draft, S.G.; Writing—review & editing, S.G. and L.S.; Visualization, Y.L. and Y.Y.; Supervision, J.C. All authors have read and agreed to the published version of the manuscript.
Funding
This research was supported by the National Key Research and Development Program of China (Project Nos. 2021YFF0703900, 2023YFF1303605), the Natural Science Foundation of China (41601212), and the Fundamental Research Foundation of Shenzhen Technology and Innovation Council (Project Nos. JCYJ20220818101617037, KCXST20221021111611029, KCXFZ202002011006298, KCXFZ20201221173613035).
Data Availability Statement
The raw data supporting the conclusions of this article will be made available by the authors on request.
Acknowledgments
We thank all the GIS group members at the SIAT, Chinese Academy of Sciences, for their encouragement and discussion of the work presented here. We also thank to the anonymous reviewers for their valuable suggestions on the earlier drafts of this study.
Conflicts of Interest
The authors declare that they have no known competing financial interests or personal relationships that could have appeared to influence the work reported in this paper.
References
- Li, Z.-L.; Tang, B.-H.; Wu, H.; Ren, H.; Yan, G.; Wan, Z.; Trigo, I.F.; Sobrino, J.A. Satellite-derived land surface temperature: Current status and perspectives. Remote Sens. Environ. 2013, 131, 14–37. [Google Scholar] [CrossRef]
- Voogt, J.A.; Oke, T.R. Thermal remote sensing of urban climates. Remote Sens. Environ. 2003, 86, 370–384. [Google Scholar] [CrossRef]
- Zhou, D.; Xiao, J.; Bonafoni, S.; Berger, C.; Deilami, K.; Zhou, Y.; Frolking, S.; Yao, R.; Qiao, Z.; Sobrino, J. Satellite Remote Sensing of Surface Urban Heat Islands: Progress, Challenges, and Perspectives. Remote Sens. 2018, 11, 48. [Google Scholar] [CrossRef]
- Yue, L.; Shen, H.; Li, J.; Yuan, Q.; Zhang, H.; Zhang, L. Image super-resolution: The techniques, applications, and future. Signal Process. 2016, 128, 389–408. [Google Scholar] [CrossRef]
- Takeda, H.; Farsiu, S.; Milanfar, P. Kernel Regression for Image Processing and Reconstruction. IEEE Trans. Image Process. 2007, 16, 349–366. [Google Scholar] [CrossRef] [PubMed]
- Vivone, G.; Simoes, M.; Dalla Mura, M.; Restaino, R.; Bioucas-Dias, J.; Licciardi, G.; Chanussot, J. Pansharpening Based on Semiblind Deconvolution. IEEE Trans. Geosci. Remote Sens. 2015, 53, 1997–2010. [Google Scholar] [CrossRef]
- Huang, B.; Song, H. Spatiotemporal Reflectance Fusion via Sparse Representation. IEEE Trans. Geosci. Remote Sens. 2012, 50, 3707–3716. [Google Scholar] [CrossRef]
- Peng, Y.; Li, W.; Luo, X.; Du, J.; Zhang, X.; Gan, Y.; Gao, X. Spatiotemporal Reflectance Fusion via Tensor Sparse Representation. IEEE Trans. Geosci. Remote Sens. 2022, 60, 1–18. [Google Scholar] [CrossRef]
- Song, H.; Huang, B. Spatiotemporal satellite image fusion through one-pair image learning. IEEE Trans. Geosci. Remote Sens. 2013, 51, 1883–1896. [Google Scholar] [CrossRef]
- Zhang, H.; Huang, B. Support Vector Regression-Based Downscaling for Intercalibration of Multiresolution Satellite Images. IEEE Trans. Geosci. Remote Sens. 2013, 51, 1114–1123. [Google Scholar] [CrossRef]
- Dong, C.; Loy, C.C.; He, K.; Tang, X. Learning a Deep Convolutional Network for Image Super-Resolution. In Computer Vision—ECCV 2014; Fleet, D., Pajdla, T., Schiele, B., Tuytelaars, T., Eds.; Springer International Publishing: Cham, Switzerland, 2014; pp. 184–199. [Google Scholar]
- Ledig, C.; Theis, L.; Huszár, F.; Caballero, J.; Cunningham, A.; Acosta, A.; Aitken, A.; Tejani, A.; Totz, J.; Wang, Z.; et al. Photo-Realistic Single Image Super-Resolution Using a Generative Adversarial Network. In Proceedings of the 2017 IEEE Conference on Computer Vision and Pattern Recognition (CVPR), Honolulu, HI, USA, 21–26 July 2017; pp. 105–114. [Google Scholar] [CrossRef]
- Song, H.; Liu, Q.; Wang, G.; Hang, R.; Huang, B. Spatiotemporal Satellite Image Fusion Using Deep Convolutional Neural Networks. IEEE J. Sel. Top. Appl. Earth Obs. Remote Sens. 2018, 11, 821–829. [Google Scholar] [CrossRef]
- Tan, Z.; Yue, P.; Di, L.; Tang, J. Deriving High Spatiotemporal Remote Sensing Images Using Deep Convolutional Network. Remote Sens. 2018, 10, 1066. [Google Scholar] [CrossRef]
- Liu, X.; Deng, C.; Chanussot, J.; Hong, D.; Zhao, B. StfNet: A Two-Stream Convolutional Neural Network for Spatiotemporal Image Fusion. IEEE Trans. Geosci. Remote Sens. 2019, 57, 6552–6564. [Google Scholar] [CrossRef]
- Tan, Z.; Di, L.; Zhang, M.; Guo, L.; Gao, M. An Enhanced Deep Convolutional Model for Spatiotemporal Image Fusion. Remote Sens. 2019, 11, 2898. [Google Scholar] [CrossRef]
- Hu, J.-F.; Huang, T.-Z.; Deng, L.-J.; Jiang, T.-X.; Vivone, G.; Chanussot, J. Hyperspectral Image Super-Resolution via Deep Spatiospectral Attention Convolutional Neural Networks. IEEE Trans. Neural Netw. Learn. Syst. 2022, 33, 7251–7265. [Google Scholar] [CrossRef]
- Xiong, Y.; Guo, S.; Chen, J.; Deng, X.; Sun, L.; Zheng, X.; Xu, W. Improved SRGAN for Remote Sensing Image Super-Resolution Across Locations and Sensors. Remote Sens. 2020, 12, 1263. [Google Scholar] [CrossRef]
- Zhang, H.; Song, Y.; Han, C.; Zhang, L. Remote Sensing Image Spatiotemporal Fusion Using a Generative Adversarial Network. IEEE Trans. Geosci. Remote Sens. 2021, 59, 4273–4286. [Google Scholar] [CrossRef]
- Chen, J.; Wang, L.; Feng, R.; Liu, P.; Han, W.; Chen, X. CycleGAN-STF: Spatiotemporal Fusion via CycleGAN-Based Image Generation. IEEE Trans. Geosci. Remote Sens. 2021, 59, 5851–5865. [Google Scholar] [CrossRef]
- Tan, Z.; Gao, M.; Li, X.; Jiang, L. A Flexible Reference-Insensitive Spatiotemporal Fusion Model for Remote Sensing Images Using Conditional Generative Adversarial Network. IEEE Trans. Geosci. Remote Sens. 2022, 60, 1–13. [Google Scholar] [CrossRef]
- Guo, F.; Hu, D.; Schlink, U. A new nonlinear method for downscaling land surface temperature by integrating guided and Gaussian filtering. Remote Sens. Environ. 2022, 271, 112915. [Google Scholar] [CrossRef]
- Kustas, W.P.; Norman, J.M.; Anderson, M.C.; French, A.N. Estimating subpixel surface temperatures and energy fluxes from the vegetation index–radiometric temperature relationship. Remote Sens. Environ. 2003, 85, 429–440. [Google Scholar] [CrossRef]
- Agam, N.; Kustas, W.P.; Anderson, M.C.; Li, F.; Neale, C.M.U. A vegetation index based technique for spatial sharpening of thermal imagery. Remote Sens. Environ. 2007, 107, 545–558. [Google Scholar] [CrossRef]
- Jeganathan, C.; Hamm, N.A.S.; Mukherjee, S.; Atkinson, P.M.; Raju, P.L.N.; Dadhwal, V.K. Evaluating a thermal image sharpening model over a mixed agricultural landscape in India. Int. J. Appl. Earth Obs. Geoinf. 2011, 13, 178–191. [Google Scholar] [CrossRef]
- Hutengs, C.; Vohland, M. Downscaling land surface temperatures at regional scales with random forest regression. Remote Sens. Environ. 2016, 178, 127–141. [Google Scholar] [CrossRef]
- Xu, J.; Zhang, F.; Jiang, H.; Hu, H.; Zhong, K.; Jing, W.; Yang, J.; Jia, B. Downscaling Aster Land Surface Temperature over Urban Areas with Machine Learning-Based Area-To-Point Regression Kriging. Remote Sens. 2020, 12, 1082. [Google Scholar] [CrossRef]
- Xu, S.; Cheng, J. A new land surface temperature fusion strategy based on cumulative distribution function matching and multiresolution Kalman filtering. Remote Sens. Environ. 2021, 254, 112256. [Google Scholar] [CrossRef]
- Ma, J.; Shen, H.; Wu, P.; Wu, J.; Gao, M.; Meng, C. Generating gapless land surface temperature with a high spatio-temporal resolution by fusing multi-source satellite-observed and model-simulated data. Remote Sens. Environ. 2022, 278, 113083. [Google Scholar] [CrossRef]
- Chen, B.; Huang, B.; Xu, B. Comparison of Spatiotemporal Fusion Models: A Review. Remote Sens. 2015, 7, 1798–1835. [Google Scholar] [CrossRef]
- Wu, P.; Yin, Z.; Zeng, C.; Duan, S.-B.; Gottsche, F.-M.; Ma, X.; Li, X.; Yang, H.; Shen, H. Spatially Continuous and High-Resolution Land Surface Temperature Product Generation: A review of reconstruction and spatiotemporal fusion techniques. IEEE Geosci. Remote Sens. Mag. 2021, 9, 112–137. [Google Scholar] [CrossRef]
- Zhu, X.; Cai, F.; Tian, J.; Williams, T. Spatiotemporal Fusion of Multisource Remote Sensing Data: Literature Survey, Taxonomy, Principles, Applications, and Future Directions. Remote Sens. 2018, 10, 527. [Google Scholar] [CrossRef]
- Feng, G.; Masek, J.; Schwaller, M.; Hall, F. On the blending of the Landsat and MODIS surface reflectance: Predicting daily Landsat surface reflectance. IEEE Trans. Geosci. Remote Sens. 2006, 44, 2207–2218. [Google Scholar] [CrossRef]
- Weng, Q.; Fu, P.; Gao, F. Generating daily land surface temperature at Landsat resolution by fusing Landsat and MODIS data. Remote Sens. Environ. 2014, 145, 55–67. [Google Scholar] [CrossRef]
- Hilker, T.; Wulder, M.A.; Coops, N.C.; Linke, J.; McDermid, G.; Masek, J.G.; Gao, F.; White, J.C. A new data fusion model for high spatial- and temporal-resolution mapping of forest disturbance based on Landsat and MODIS. Remote Sens. Environ. 2009, 113, 1613–1627. [Google Scholar] [CrossRef]
- Zhu, X.; Chen, J.; Gao, F.; Chen, X.; Masek, J.G. An enhanced spatial and temporal adaptive reflectance fusion model for complex heterogeneous regions. Remote Sens. Environ. 2010, 114, 2610–2623. [Google Scholar] [CrossRef]
- Wang, Q.; Atkinson, P.M. Spatio-temporal fusion for daily Sentinel-2 images. Remote Sens. Environ. 2018, 204, 31–42. [Google Scholar] [CrossRef]
- Zhukov, B.; Oertel, D.; Lanzl, F.; Reinhackel, G. Unmixing-based multisensor multiresolution image fusion. IEEE Trans. Geosci. Remote Sens. 1999, 37, 1212–1226. [Google Scholar] [CrossRef]
- Mingquan, W. Use of MODIS and Landsat time series data to generate high-resolution temporal synthetic Landsat data using a spatial and temporal reflectance fusion model. J. Appl. Remote Sens. 2012, 6, 063507. [Google Scholar] [CrossRef]
- Zhang, W.; Li, A.; Jin, H.; Bian, J.; Zhang, Z.; Lei, G.; Qin, Z.; Huang, C. An Enhanced Spatial and Temporal Data Fusion Model for Fusing Landsat and MODIS Surface Reflectance to Generate High Temporal Landsat-Like Data. Remote Sens. 2013, 5, 5346–5368. [Google Scholar] [CrossRef]
- Huang, B.; Zhang, H. Spatio-temporal reflectance fusion via unmixing: Accounting for both phenological and land-cover changes. Int. J. Remote Sens. 2014, 35, 6213–6233. [Google Scholar] [CrossRef]
- Gevaert, C.M.; García-Haro, F.J. A comparison of STARFM and an unmixing-based algorithm for Landsat and MODIS data fusion. Remote Sens. Environ. 2015, 156, 34–44. [Google Scholar] [CrossRef]
- Lu, M.; Chen, J.; Tang, H.; Rao, Y.; Yang, P.; Wu, W. Land cover change detection by integrating object-based data blending model of Landsat and MODIS. Remote Sens. Environ. 2016, 184, 374–386. [Google Scholar] [CrossRef]
- Wu, M.; Wu, C.; Huang, W.; Niu, Z.; Wang, C.; Li, W.; Hao, P. An improved high spatial and temporal data fusion approach for combining Landsat and MODIS data to generate daily synthetic Landsat imagery. Inf. Fusion 2016, 31, 14–25. [Google Scholar] [CrossRef]
- Zhu, X.; Helmer, E.H.; Gao, F.; Liu, D.; Chen, J.; Lefsky, M.A. A flexible spatiotemporal method for fusing satellite images with different resolutions. Remote Sens. Environ. 2016, 172, 165–177. [Google Scholar] [CrossRef]
- Guo, D.; Shi, W.; Hao, M.; Zhu, X. FSDAF 2.0: Improving the performance of retrieving land cover changes and preserving spatial details. Remote Sens. Environ. 2020, 248, 111973. [Google Scholar] [CrossRef]
- Wang, J.; Schmitz, O.; Lu, M.; Karssenberg, D. Thermal unmixing based downscaling for fine resolution diurnal land surface temperature analysis. ISPRS J. Photogramm. Remote Sens. 2020, 161, 76–89. [Google Scholar] [CrossRef]
- Shi, W.; Guo, D.; Zhang, H. A reliable and adaptive spatiotemporal data fusion method for blending multi-spatiotemporal-resolution satellite images. Remote Sens. Environ. 2022, 268, 112770. [Google Scholar] [CrossRef]
- Xu, C.; Du, X.; Yan, Z.; Zhu, J.; Xu, S.; Fan, X. VSDF: A variation-based spatiotemporal data fusion method. Remote Sens. Environ. 2022, 283, 113309. [Google Scholar] [CrossRef]
- Li, M.; Guo, S.; Chen, J.; Chang, Y.; Sun, L.; Zhao, L.; Li, X.; Yao, H. Stability Analysis of Unmixing-Based Spatiotemporal Fusion Model: A Case of Land Surface Temperature Product Downscaling. Remote Sens. 2023, 15, 901. [Google Scholar] [CrossRef]
- Guo, S.; Sun, B.; Zhang, H.K.; Liu, J.; Chen, J.; Wang, J.; Jiang, X.; Yang, Y. MODIS ocean color product downscaling via spatio-temporal fusion and regression: The case of chlorophyll-a in coastal waters. Int. J. Appl. Earth Obs. Geoinf. 2018, 73, 340–361. [Google Scholar] [CrossRef]
Disclaimer/Publisher’s Note: The statements, opinions and data contained in all publications are solely those of the individual author(s) and contributor(s) and not of MDPI and/or the editor(s). MDPI and/or the editor(s) disclaim responsibility for any injury to people or property resulting from any ideas, methods, instructions or products referred to in the content. |
© 2024 by the authors. Licensee MDPI, Basel, Switzerland. This article is an open access article distributed under the terms and conditions of the Creative Commons Attribution (CC BY) license (https://creativecommons.org/licenses/by/4.0/).