Abstract
Temperature and precipitation are crucial indicators for investigating climate changes, necessitating precise measurements for rigorous scientific inquiry. While the Fifth Generation of European Centre for Medium-Range Weather Forecasts Atmospheric Reanalysis (ERA5), ERA5 of the Land Surface (ERA5-Land), and China Meteorological Forcing Dataset (CMFD) temperature and precipitation products are widely used worldwide, their suitability for the Altay region of arid and semi-arid areas has received limited attention. Here, we used the Altay region as the study area, utilizing meteorological station data and implementing the residual revision method for temperature and the coefficient revision method for precipitation to rectify inaccuracies in monthly temperature and precipitation records from ERA5-Land, ERA5, and CMFD. We evaluate the accuracy of these datasets before and after correction using bias, Taylor diagrams, and root-mean-square error (RMSE) metrics. Additionally, we employ Tropical Rainfall Measuring Mission satellite precipitation data (TRMM) as a benchmark to assess the performance of ERA5-Land, ERA5, and CMFD monthly precipitation before and after correction. The results revealed significant differences in the temperature and precipitation capture capabilities of ERA5-Land, ERA5, and CMFD in the Altay region. Overall, these data exhibit substantial errors and are not directly suitable for scientific research. However, we applied residual and coefficient revision methods. After this revision, ERA5-Land, ERA5, and CMFD showed significantly improved temperature and precipitation capture capabilities, especially for ERA5-Land. In terms of temperature, post-revision-CMFD (CMFDPR) demonstrated better temperature capture capabilities. All three datasets showed weaker performance in mountainous regions compared to plains. Notably, post-revision-ERA5 (ERA5PR) seemed unsuitable for capturing temperature in the Altay region. Concerning rain, CMFDPR, post-revision-ERA5-Land (ERA5-LandPR) and ERA5PR outperformed TRMM in capturing precipitation. CMFDPR and ERA5-LandPR both outperform ERA5PR. In summary, the revision datasets effectively compensated for the sparse distribution of meteorological stations in the Altay region, providing reliable data support for studying climate change in arid and semi-arid areas.
1. Introduction
Temperature and precipitation are essential components of the hydrothermal cycle, contributing significantly to matter and energy exchange [1]. The Intergovernmental Panel on Climate Change (IPCC) reported a significant increase in global surface temperature since the preindustrial period of 1850–1900, and the last few decades have been successively warmer than any earlier decade since 1850 [2]. Studies suggest that extreme weather event waves of heat and cold, floods, landslides, droughts and others caused by changes in temperature and precipitation have significant implications for human society and ecological environment [3,4,5].
The Altay region is characterized by vast geographical expanse, encompassing diverse terrains such as high mountains, hills, rivers, lakes, deserts, and Gobi. The complex topography of this region leads to pronounced spatial variations in climate. Precipitation in the lower altitudes ranges from 200 to 300 mm, while the high-altitude mountainous areas receive over 600 mm of rainfall [6]. Precipitation increases with elevation, while temperatures decrease, resulting in significant vertical gradient changes. As global climate change continues to intensify, the Altay region situated in northwest China has been significantly impacted, resulting in numerous studies on its climate change [7,8,9,10]. However, the meteorological data used in these studies were derived from sparsely distributed and unevenly spaced meteorological stations within the region. Although the number of automatic stations in the region has gradually increased in recent years, their time series are still relatively short, while the national meteorological stations, which have longer time series, are few and discontinuous due to relocation. Moreover, most of the meteorological stations are in plain areas, where temperatures are generally higher and precipitation is lower than in mountainous regions. This leads to an overestimation of temperature and an underestimation of precipitation when the meteorological data are averaged across stations. These issues create significant uncertainties in climate change studies.
Reanalysis products, characterized by their extensive spatial coverage and long time series, have gained popularity in climate change studies due to their ability to fully compensate for the lack of meteorological observation stations [11,12,13,14]. Nevertheless, caution must be exercised when utilizing reanalysis data, such as Fifth Generation of European Centre for Medium-Range Weather Forecasts Atmospheric Reanalysis (ERA5) and ERA5 of the Land Surface (ERA5-Land), as biases may exist between these datasets and observational data. In particular, in regions with complex terrain, the assimilation models used in reanalysis data have been known to yield significant errors due to the limited consideration of the impact of complex terrain on temperature and precipitation [15]. Additionally, calibration of the reanalysis assimilation models may not be supported by sufficient observational data in such regions, resulting in high uncertainty in reanalysis meteorological data. Previous studies have demonstrated that the ERA5-Land temperature product is substantially underestimated in mountainous areas, while the ERA5-Land precipitation product is considerably overestimated in comparison to weather station observations [16]. Hence, assessing the accuracy of reanalysed temperature and precipitation data in complex terrain areas is critical for regional climate change. The variability in the spatial data of reanalysis necessitates a revision of the data in areas where substantial errors exist prior to utilization [16,17,18]. Past research has demonstrated significant improvement in the performance of revised data in comparison to prerevision periods [19,20]. For the Altay region, which is characterized by complex and diverse terrain, as well as sparse spatial distribution of meteorological stations, how does reanalysis data perform in this area? Is there a need for error correction before using this data? Currently, limited research has been conducted on this topic thus far.
This study aims to (1) evaluate the accuracy of the ERA5-Land, ERA5, and China Meteorological Forcing Dataset (CMFD) monthly temperature and precipitation data for the Altay region, (2) correct errors in the ERA5-Land, ERA5 and CMFD monthly temperature and precipitation data, and (3) assess the accuracy of the corrected data. The study will provide accurate temperature and precipitation data for future climate change studies in the Altay region. It will also serve as a reference for regional adaptation assessment and error correction for other grid data products.
2. Materials and Methods
2.1. Study Area
The Altay region is situated in the arid and semi-arid region of northwestern China, covering a total area of approximately 118,000 km2, which borders Kazakhstan, Russia, and Mongolia. The terrain is low in the west and south and high in the east and north, creating a complex landscape (Figure 1). As the area is far from the sea, this region experiences a medium temperate continental arid and semi-arid climate with shorter, cooler summers and severely cold winters, with a mean annual temperature ranging from 0.7 °C to 4.9 °C [21]. Precipitation is mainly caused by the forced uplift of Atlantic water vapour carried by the westerly circulation; the annual precipitation ranges from 200 to 600 mm [6,22]. Moreover, Altay serves as a crucial ecological barrier in Xinjiang and even across Central Asia. However, with the intensification of global changes and human activities, the ecological risks in this region have increased, rendering the environment increasingly fragile [23]. Currently, the spatial distribution of meteorological stations in Altay is sparse and uneven, with most of them distributed in low-elevation areas and fewer in mountainous areas. In addition, the time series data from automatic meteorological stations are relatively short, and there are limited data from national meteorological stations, making it insufficient to meet the research demands in the Altay region. There is an urgent need for alternative meteorological data sources with higher spatiotemporal resolution to support scientific research in this expansive and geographically diverse region. Given the wide geographical extent, complex terrain, diverse landscapes, significant seasonal climate variations, sparse weather stations and critical ecological significance of the Altay region, it serves as an ideal representative of meteorologically scarce arid and semi-arid areas for the evaluation and correction of monthly temperature and precipitation data in ERA5-Land, ERA5, and CMFD.
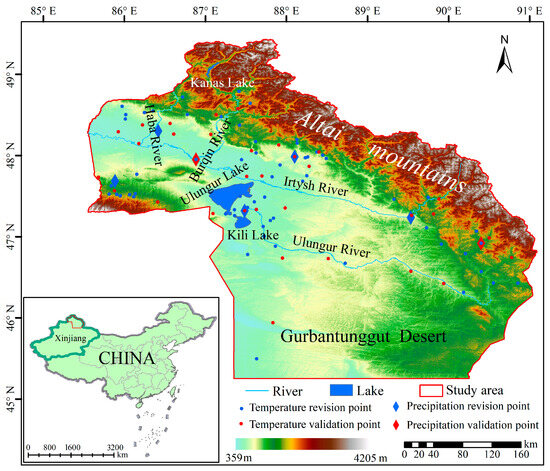
Figure 1.
Geographical distribution of the study area and spatial distribution of temperature and precipitation validation and revision points at meteorological observation sites (The standard map number is: GS (2019) 1823).
2.2. Dataset
2.2.1. ERA5 and ERA5-Land Temperature and Precipitation Data
The 0.25° ERA5, and 0.1° ERA5-Land monthly temperature and precipitation data were downloaded from the Copernicus Climate Data Store (CDS) (https://cds.climate.copernicus.eu/#!/home, accessed on 22 February 2023). The ERA5 dataset, which is the European Centre for Medium-Range Weather Forecasts (ECMWF) reanalysis data, is a comprehensive database of global atmospheric, land surface, and ocean wave information [24]. On the other hand, the ERA5-Land dataset, which was released in July 2019, is an upgraded version of ERA5 that focused on land applications by incorporating the terrestrial component of ERA5 reanalysis from 1950 to the present [25]. Notably, the ERA5-Land dataset has a higher spatial resolution compared to the ERA-Interim and ERA5 datasets, representing an improvement over these datasets [18,26,27]. The ERA5 and ERA5-Land temperature and precipitation data, which offer long-term time series and spatial coverage over the entire Altay region, can compensate for the limitations of sparse meteorological station distribution and limited temporal data in arid and semi-arid areas. Previous studies have indicated that in arid and semi-arid regions, ERA5 and ERA5-Land demonstrate a better ability to capture lower precipitation magnitudes compared to higher magnitudes [28,29,30]. Moreover, these datasets exhibit good performance in capturing temperature trends [31]. However, there has been no previous research specifically focusing on the performance of ERA5 and ERA5-Land in the Altay region. Therefore, this study aims to evaluate the ability of ERA5 and ERA5-Land to capture temperature and precipitation variations in the Altay region. In this study, to maintain consistency with the CMFD time series, the correction of monthly temperature and precipitation errors in ERA5 and ERA5-Land, as well as the assessment of errors before and after correction, were conducted using precipitation data from 1979 to 2018 and temperature data from 2016 to 2018.
2.2.2. CMFD Temperature and Precipitation Data
This study utilized CMFD monthly temperature and precipitation data with a spatial resolution of 0.1° obtained from the National Tibetan Plateau Data Center (https://data.tpdc.ac.cn/zh-hans/data/8028b944-daaa-4511-8769-965612652c49, accessed on 25 August 2023). The time series of this dataset was from 1979 to 2018. The CMFD dataset was developed by merging conventional meteorological observation data from the China Meteorological Administration with background information from existing international sources such as Princeton reanalysis data, GLDAS data, GEWEX-SRB radiation data, and TRMM satellite precipitation data [32]. Research has shown that CMFD exhibits strong capabilities in capturing temperature and precipitation, although it tends to underestimate them in arid and semi-arid regions [33,34]. With long-term time series and spatial coverage over the entire Altay region, CMFD meets the meteorological data requirements of the Altay region. However, there is limited research on the accuracy of CMFD temperature and precipitation data specifically in the Altay region. Therefore, this study aims to assess the suitability of CMFD temperature and precipitation data in the Altay region and compare its performance with ERA5 and ERA5-Land. In this study, error correction was applied to the CMFD monthly precipitation data from 1979 to 2018 and CMFD monthly temperature data from 2016 to 2018.
2.2.3. TRMM Satellite Precipitation Data
The monthly Tropical Rainfall Measuring Mission satellite precipitation data (TRMM) with a spatial resolution of 0.25° for the Altay region from 1998 to 2018 were downloaded from the Google Earth Engine platform (https://code.earthengine.google.com/, accessed on 26 August 2023). The TRMM satellite was the first satellite mission dedicated to increasing the understanding of the distribution and variability of precipitation. Numerous studies have validated the acceptable accuracy of TRMM precipitation products [35,36,37]. In the Central Asian arid and semi-arid region, TRMM precipitation performs better than reanalysis data [38]. Therefore, for this study, TRMM satellite precipitation data were selected for comparative analysis to assess the capability of pre- and post-correction ERA5-Land, ERA5, and CMFD data in capturing precipitation in the Altay region. This was done to evaluate the suitability of coefficient correction methods for ERA5-Land, ERA5, and CMFD precipitation data in the Altay region. Since the time series of TRMM precipitation data from 1998 to 2019, while CMFD data is available only up to 2018, the comparative analysis was conducted for the period from 1998 to 2018.
2.2.4. Temperature and Precipitation Observation Data at Meteorological Stations
This study focuses on the revision of errors and the assessment of accuracy for monthly temperature and precipitation data of ERA5-Land, ERA5, and CMFD, using temperature and precipitation observation data from meteorological stations. The temperature and precipitation data were obtained from the Xinjiang Climate Center in China. To ensure data quality, 88 regional automatic meteorological stations and 8 national meteorological stations were selected in the Altay region after thorough screening. To maintain consistency across the time series of each meteorological station, 96 stations’ monthly temperature data from 2016 to 2018 were selected for error revision and accuracy assessment of ERA5-Land, ERA5, and CMFD monthly temperature data, with 64 stations used for error revision and 32 stations used for accuracy assessment. Considering that precipitation data from the regional automatic stations are not continuous due to missing data and the absence of winter observations, the precipitation observation data from 1979 to 2018 were selected for ERA5-Land, ERA5, and CMFD error revision and accuracy assessment from national stations. Through careful data screening, 7 national meteorological stations were selected, with 5 used for error revision and 2 used for accuracy assessment.
2.3. Methods
2.3.1. Residual Revision Method
By analysing the bias of the measured temperature data at each meteorological station and the corresponding grid points of ERA5-Land, ERA5, and CMFD monthly temperature data, the bias of the value of the same grid is relatively similar in the same month during different years (Table 1). Based on this observation, the spatial residual revision method was applied to qualify the temperature data. The residual revision method relies on the error characteristics of ERA5-Land, ERA5, and CMFD monthly temperature data relative to the meteorological station observations. It directly corrects the errors in the corresponding grid points of the reanalysis data using the meteorological station observations. This method is concise, involves fewer intermediate steps, and helps avoid the accumulation of errors that can arise from multiple steps. Additionally, this method allows for the differentiated correction of errors in different grid units. Moreover, the residual revision method requires reliable ground-based observation data as reference data for correcting reanalysis data. In this study, 64 meteorological stations with quality-controlled monthly temperature observations were selected as the reference data. These meteorological stations, in terms of quantity and quality, met the requirements of the residual correction method. The correction steps are as follows: First, the temperature bias for ERA5-Land, ERA5, and CMFD from January to December, corresponding to the 64 meteorological stations, was calculated (Formula (1)). Then, the bias data for each month from January to December was subjected to spatial interpolation using the co-kriging method (CK) that takes into account the elevation factor (Figure 2). Finally, we subtracted the spatially interpolated bias corresponding to each month from the monthly ERA5-Land, ERA5, and CMFD temperature data (Formula (2)), that is, the revised ERA5-Land, ERA5, and CMFD, temperature data were obtained. The specific formula is derived as follows:
where represents the test data, denotes the measured data at the meteorological station, refers to the bias between the test data and the measured data at the meteorological station, represents the revised temperature data, and denotes the interpolated temperature residuals.

Table 1.
The bias of CMFD, ERA5-Land, and ERA5 at each validation point relative to meteorological observation sites in June from 2016 to 2018.
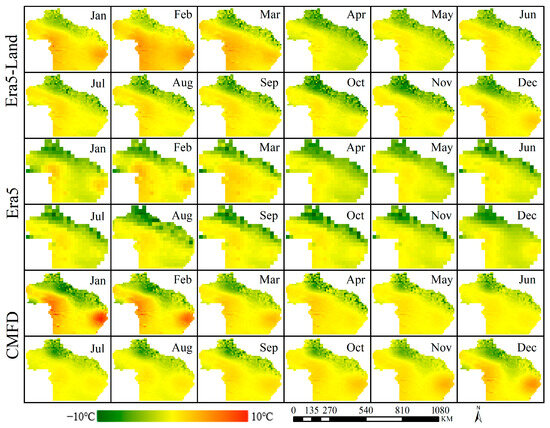
Figure 2.
Distribution of residuals for monthly temperature data of ERA5-Land, ERA5, and CMFD.
2.3.2. Coefficient Revision Method
As precipitation is highly localized and uncertain, the spatial error distributions of ERA5-Land, ERA5, and CMFD monthly precipitation data are complex and lack regularity. This study employs the coefficient revision method with monthly precipitation data from 5 meteorological stations from 1979 to 2018 to revise ERA5-Land, ERA5, and CMFD monthly precipitation data. The coefficient correction method establishes a relationship between the correction values and the observed values, deriving correction coefficients. These coefficients are then used to revise the monthly precipitation data in the study area. This method is simple, involves fewer intermediate steps, and helps avoid the accumulation of errors that can arise from multiple correction steps. Additionally, the coefficient correction method effectively eliminates systematic biases caused by multiple factors. To correct grid data using this method, it is necessary to match the corresponding meteorological observation data; each set of correction data will have a corresponding correction coefficient, resulting in a large number of correction coefficients. However, this also improves the accuracy of the grid data after correction. The correction steps are as follows: First, by using data from 5 meteorological stations, we established correction coefficients for annual and monthly precipitation data for ERA5-Land, ERA5, and CMFD using Formula (3). Subsequently, the revision coefficients from the 5 meteorological stations were averaged to obtain a single revision coefficient for each month and year. In total, 480 revised coefficients were calculated for the period of January to December from 1979 to 2018 (see Appendix A). On this basis, the ERA5-Land, ERA5 and CMFD precipitation data for January to December from 1979 to 2018 were revised by the revised coefficients using Formula (4). The specific formula is derived as follows:
where L denotes the revised coefficient, represents the precipitation data at the meteorological station, refers to the ERA5-Land, ERA5 and CMFD precipitation data, and denotes corrected ERA5-Land, ERA5 and CMFD monthly precipitation data.
2.3.3. Accuracy Assessment
In this study, a spatial random sampling method was used to select a total of 32 temperature verification points and 2 precipitation verification points. Based on the actual number and spatial distribution of meteorological stations, these selected points are representative and exhibit a reasonable and even spatial distribution, as shown in Figure 1. By using the temperature and precipitation verification points, the errors of ERA5-Land, ERA5, and CMFD temperature and precipitation data before and after correction were evaluated in this study. The values at verification points for the data to be evaluated were extracted using bilinear interpolation. Meteorological station data for temperature and precipitation were employed, and error assessment of the pre- and post-correction ERA5-Land, ERA5, and CMFD temperature and precipitation data was conducted using error indicators including Taylor diagrams [39], bias, and RMSE.
The Taylor diagram uses three primary indices: the correlation coefficient, normalized standard deviation, and normalized root-mean-square error [27]. The higher the correlation coefficient is, the closer the normalized standard deviation is to 1, and the smaller the normalized root-mean-square error is, which indicates that the evaluation data are closer to the observed values. Additionally, bias was used to detect whether the evaluation data were overestimated (bias > 0) or underestimated (bias < 0) compared to the measurement of the meteorological observation stations. The RMSE denotes the precision of the evaluation data error, with the error magnitude ranging from zero to ∞; the closer to zero the error is, the better the evaluation data are [40].
3. Results
3.1. Accuracy Assessment for the ERA5-Land, ERA5 and CMFD Monthly Temperature Data
The ability of ERA5-Land, ERA5, and CMFD datasets to capture temperature in the Altay region was evaluated using bias, Taylor diagrams, and RMSE error metrics. The bias analysis revealed differences in the temperature capturing abilities of the three datasets across different months. ERA5-Land consistently underestimated temperature, except for the months of January to March. The largest underestimation occurred in April, reaching 1.9 °C, while the largest overestimation was observed in February, reaching 2.1 °C. ERA5 consistently underestimated temperature in all months, with the highest underestimation occurring in April at 2.1 °C. On the other hand, CMFD exhibited overestimation during the cold season (January to March and October to December), with overestimation values ranging from 0.1 °C to 0.6 °C. However, it showed underestimation during the warm season (April to September), with underestimation values ranging from 0.2 °C to 0.9 °C (Figure 3). Spatial distribution of residuals (Figure 2) indicated that elevation influenced the spatial pattern of residuals for all three datasets. Overall, the datasets consistently underestimated temperature in high-altitude mountainous regions, with underestimation values exceeding 5.0 °C. In contrast, overestimation was predominant in low-altitude plain areas, with a more pronounced overestimation during the cold season. Although some regions in the cold season exhibited overestimation exceeding 1.0 °C, the majority of months and regions showed overestimation below 1.0 °C. The residual may be attributed to the elevation differences between the reanalysis data and ground-based meteorological stations or the low simulation skills of climate models in complex terrains [41]. The Taylor diagram (Figure 4) revealed that the correlation coefficients of CMFD and meteorological station observations were larger than those of ERA5-Land and ERA5, but mostly lower than 0.75, especially for ERAT, which were mostly below 0.5. Moreover, all three data types showed more dispersion in the standardized standard deviation, particularly for ERAT, which had a standardized standard deviation that was far from 1. The standardized RMSE of CMFD were smaller than those of ERA5-Land and ERA5. Furthermore, the RMSE of CMFD was lower than that of ERA5-Land and ERA5. Spatially, RMSE exhibited significant heterogeneity, with CMFD performing the best. Most of the regions with larger errors in all three datasets were concentrated in the complex terrain of the southeast-northeast mountainous areas (Figure 5). Overall, in the Altay region, the order of the three datasets in terms of temperature capture capability was: CMFD > ERA5-Land > ERA5. Although there are differences in the ability of ERA5-Land, ERA5, and CMFD to capture temperature in the Altay region, overall, their ability to capture temperature is poor.
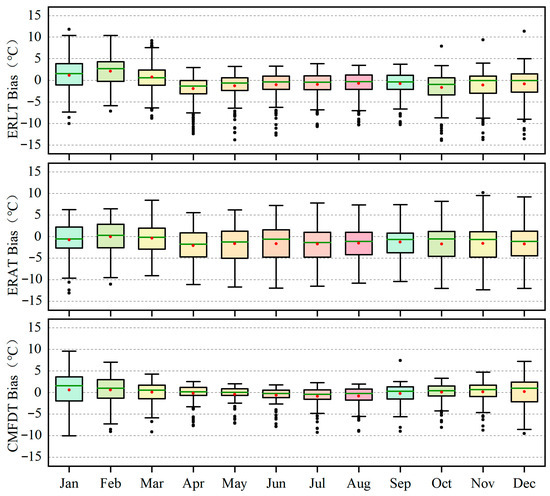
Figure 3.
Bottom box plot of bias for ERA5-Land, ERA5, and CMFD temperature (red dots: mean bias, green horizontal line: median bias, black dots: outliers; ERLT represents the ERA5-Land temperature data, ERAT represents the ERA5 temperature data, and CMFDT represents the CMFD temperature data).
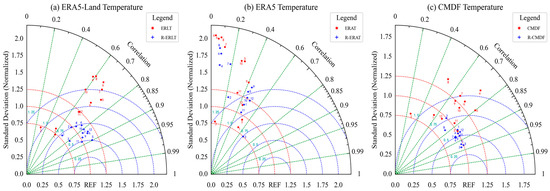
Figure 4.
Taylor diagram of temperature data assessment compared with meteorological observations in the Altay region ((a) represents the ERA5-Land temperature before and after correction; (b) represents the ERA5 temperature before and after correction; (c) represents the CMFD temperature before and after correction. The numbers in the diagram are the corresponding months; i.e., “1” is January; REF represents the observed state).
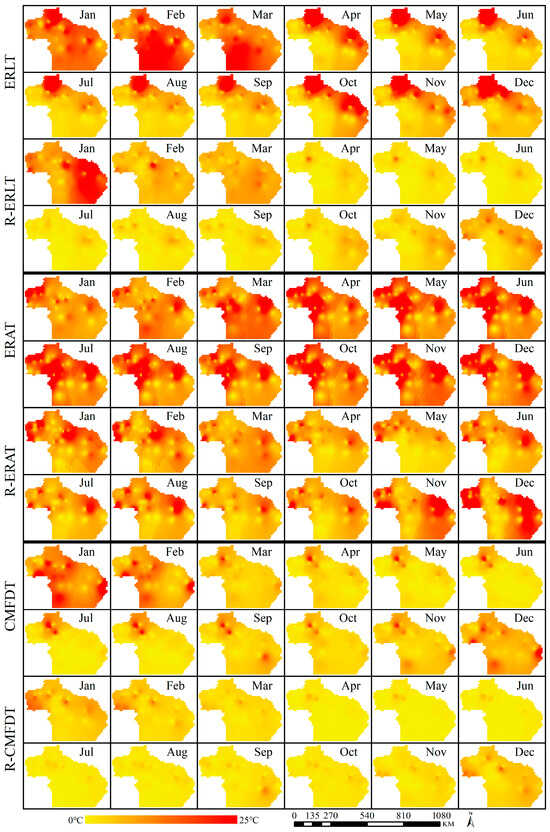
Figure 5.
Spatial distribution of RMSE for ERA5-Land, ERA5, and CMFD temperature before and after correction (Using the 32 meteorological observation verification stations as benchmarks, calculating the RMSE for ERA5-Land, ERA5, and CMFD temperatures before and after the correction, employing the inverse distance weighting interpolation method to interpolate the RMSE for the 32 stations, resulting in spatial distribution of RMSE; R-ERLT represents post-revision-ERA5-Land temperature data, R-ERAT represents post-revision-ERA5 temperature data, R-CMFDT represents post-revision-CMFD temperature data).
3.2. Accuracy Assessment for the ERA5-LandPR, ERA5PR, and CMFDPR Monthly Temperature Data
By utilizing the residual revision method, we obtained the post-revision-ERA5-Land (ERA5-LandPR), post-revision-ERA5 (ERA5PR), and post-revision-CMFD (CMFDPR) monthly temperature data for the Altay region (Figure 6). From the temporal distribution within the year, Altay experiences higher temperatures during the summer months of June to August, while December and the months of January to February represent the colder winter temperatures in Altay. From a spatial perspective, all three datasets consistently demonstrate lower temperatures in mountainous regions compared to plain areas. The temporal–spatial differences observed in the three datasets are primarily influenced by variations in atmospheric circulation driven and differences in terrain and topography. The bias analysis indicates that although all three datasets still exhibited overestimations, the absolute bias was mostly confined within 0.5 °C, a significant improvement over the pre-revisions, particularly for CMFDPR, which was controlled within 0.25 °C (Figure 7). The Taylor diagrams demonstrate that ERA5-LandPR, ERA5PR, and CMFDPR are closer to the meteorological observations REF than the pre-revisions, with the CMFDPR being the closest to the meteorological observations when compared to the corrected ERA5-Land and ERA5 (Figure 4). Compared to the pre-revision versions, the rate of improvement in RMSE for the CMFDPR and ERA5-LandPR temperature was fairly similar, but both were greater than that of the ERA5PR. Additionally, it is worth noting that the rate of improvement in RMSE for the CMFDPR and ERA5-LandPR during warmer months was higher than during colder months (Table 2). It can be concluded that the application of the residual revision method significantly improved the ability of ERA5-Land, ERA5, and CMFD to capture temperature in the Altay region.
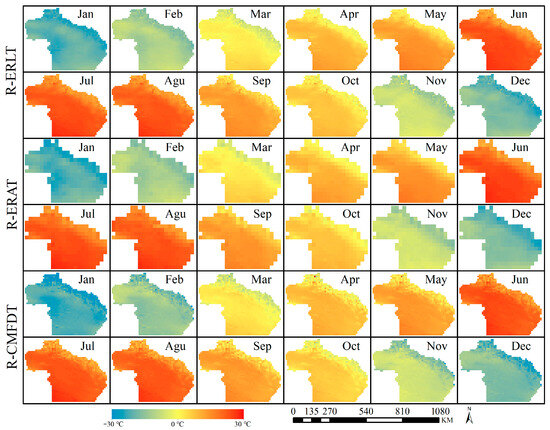
Figure 6.
Spatial distribution of CMFDPR, ERA5-LandPR, and ERA5PR temperature in 2018.
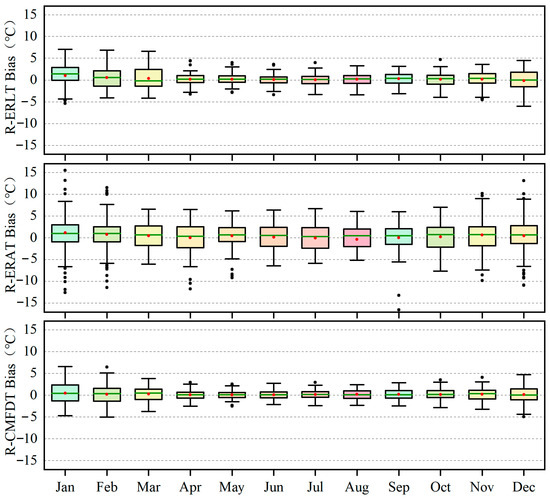
Figure 7.
Bottom box plot of bias for the ERA5-LandPR, ERA5PR, and CMFDPR temperature (red dots: mean bias, green horizontal line: median bias, black dots: outliers).
Table 2.
Summary of the RMSE error and improvement rate statistics of the temperature data assessment.
We further conducted a comparative analysis of the performance of ERA5-LandPR, ERA5PR, and CMFDPR in capturing temperature in the Altay region. The CMFDPR, ERA5-LandPR, and ERA5PR exhibit differences in their temperature-capturing abilities. CMFDPR and ERA5-LandPR demonstrate strong performance in capturing temperatures during April to July in the Altay region, with RMSE ranging from 0.95 °C to 1.08 °C and 1.21 °C to 1.32 °C, respectively. Corrected ERA5 shows relatively good temperature capture abilities in March, May, and October, but the RMSE values exceed 3.0 °C (Table 2). Despite the strong performance of ERA5-LandPR and ERA5PR in certain months, an evaluation based on RMSE, bias, and Taylor diagrams reveals that CMFDPR outperforms ERA5-LandPR and ERA5PR in capturing temperature across all months. Spatial distribution of RMSE indicates that, although errors in mountainous areas remain relatively high for all three datasets, there is a significant improvement compared to the pre-revision data, with CMFDPR exhibiting the best temperature capture ability while ERA5PR still exhibits relatively large errors (Figure 5). Therefore, the temperature capture hierarchy among the corrected datasets remains as follows: CMFDPR > ERA5-LandPR > ERA5PR. CMFDPR and ERA5-LandPR demonstrate strong temperature capture abilities, while ERA5PR still exhibits significant errors.
3.3. Accuracy Assessment for the ERA5-Land, ERA5, and CMFD Monthly Precipitation Data
Using bias indicators, Taylor diagrams, and RMSE error metrics, we evaluated the ability of ERA5-Land, ERA5, and CMFD to capture precipitation in the Altay region. The bias indicators reveal that ERA5-Land, ERA5 tend to overestimate precipitation compared to the meteorological stations in various months, especially in April–May, October–November, with biases exceeding 10 mm. CMFD exhibits underestimation only in January–February and June, while it shows overestimation in other months. The absolute bias of CMFD is generally smaller than that of ERA5-Land and ERA5. Overall, the three datasets show larger biases in months with higher precipitation (Figure 8). The Taylor diagrams (Figure 9) illustrate that the correlation coefficients of ERA5-Land and ERA5 with meteorological stations were not significantly different across various months, and they were mostly greater than 0.7. however, the correlation coefficients of ERA5-Land and ERA5 were mostly lower than that of CMFD. The standard deviation of ERA5-Land and ERA5 was more varied than that of CMFD. The RMSE indicators suggest that the precipitation data of ERA5-Land, ERA5 and CMFD are not capable of capturing months with high precipitation. In June, ERA5-Land reaches an RMSE of 15.15 mm, ERA5 reaches 16.34 mm in May, and CMFD reaches 9.75 mm in July (Table 3). The ability of the three datasets to capture precipitation in the Altay region is ranked as follows: CMFD > ERA5-Land > ERA5. Similarly to temperature, although there are differences in the ability of ERA5-Land, ERA5, and CMFD to capture precipitation in the Altay region, overall, their ability to capture precipitation is poor.
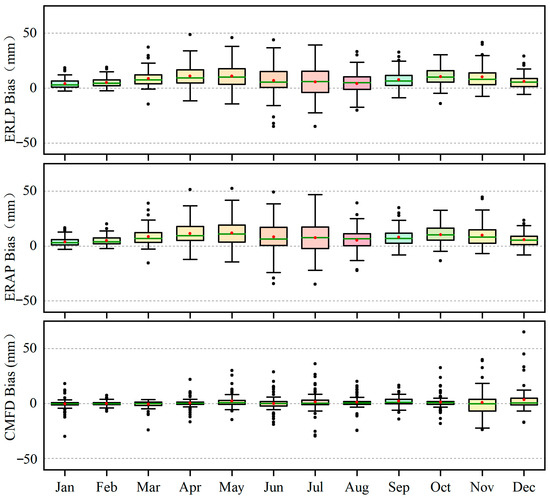
Figure 8.
Bottom box plot of bias for ERA5-Land, ERA5, and CMFD precipitation from 1979 to 2018 (red dots: mean bias, green horizontal line: median bias, black dots: outliers; ERLP represents ERA5-Land precipitation, ERAP represents ERA5 precipitation, and CMFDP represents CMFD precipitation).
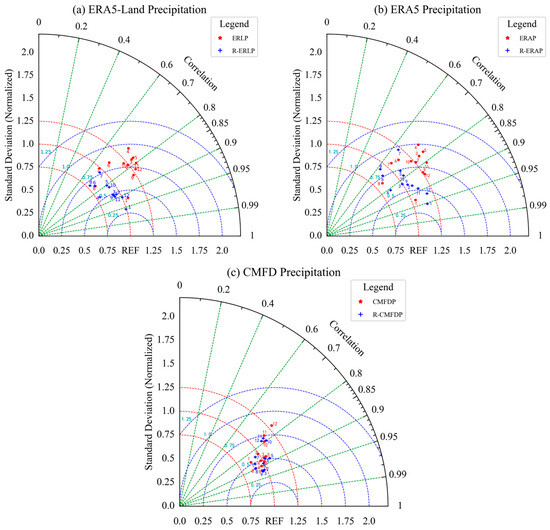
Figure 9.
Taylor diagram of precipitation data assessment compared with meteorological observations in the Altay region from 1979 to 2018 ((a) represents the ERA5-Land precipitation before and after correction; (b) represents the ERA5 precipitation before and after correction; and (c) represents the CMFD precipitation before and after correction. The numbers in the diagram are the corresponding months; i.e., “1” is January; R-ERLP represents post-revision-ERA5-Land precipitation, R-ERAP represents post-revision-ERA5 precipitation, and R-CMFDP represents post-revision-CMFD precipitation).
Table 3.
Summary of the RMSE error and improvement rate statistics of the precipitation data assessment from 1979 to 2018.
3.4. Accuracy Assessment for the ERA5-LandPR, ERA5PR, and CMFDPR Monthly Precipitation
The corrected precipitation data for ERA5-Land, ERA5, and CMFD were obtained through the coefficient revision method. Spatially, all three datasets displayed higher precipitation in mountainous areas compared to plain areas, with a decreasing trend from northwest to southeast (Figure 10). This pattern is attributed to the moisture from the Atlantic Ocean, coming from the west, being obstructed and lifted by the Altai Mountains, leading to increased precipitation in the mountainous regions and foothills [6,22]. The bias analysis revealed that, although ERA5-LandPR, ERA5PR, and CMFDPR still showed overestimations compared to the meteorological station observations in various months, most of the absolute bias values were significantly reduced after revision, and the bias of CMFDPR was smaller than that of ERA5-LandPR and ERA5PR. Overall, the three datasets still showed larger biases in months with higher precipitation (Figure 11). The Taylor diagram (Figure 9) showed that the ERA5-LandPR, ERA5PR, and CMFDPR were closer to the meteorological observations REF after revision. With ERA5-LandPR precipitation having the greatest improvement in accuracy compared to pre-revision, the monthly RMSE accuracy improvement for the ERA5-LandPR ranged from 2.0% to 63.0%, with an average increase of 44.6%. The improvement in the RMSE of ERA5-LandPR was higher than that of ERA5PR and CMFDPR; ERA5PR performed better than CMFD in various months (Table 3). Therefore, the effectiveness of the coefficient method in revising the three types of precipitation data in the Altay region is ranked as follows: ERA5-LandPR > ERA5PR > CMFDPR. In conclusion, the coefficient revision method significantly improved the ability of ERA5-Land, ERA5, and CMFD to capture precipitation in the Altay region, especially for ERA5-LandPR.
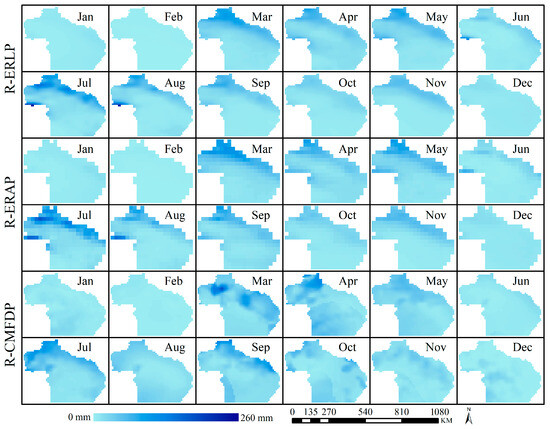
Figure 10.
Spatial distribution of monthly precipitation for the ERA5-LandPR, ERA5PR, and CMFDPR in 2018.
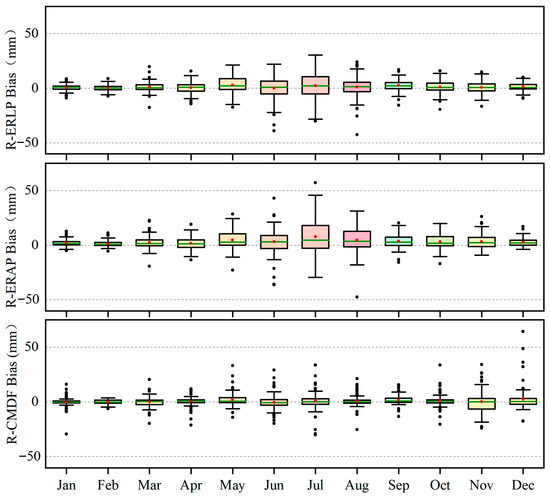
Figure 11.
Bottom box plot of bias for the ERA5-LandPR, ERA5PR, and CMFDPR precipitation from 1979 to 2018 (red dots: mean bias, green horizontal line: median bias, black dots: outliers).
We further compared the precipitation capture performance of ERA5-LandPR, ERA5PR, and CMFDPR in the Altay region. The results indicate that all three corrected datasets exhibit weaker precipitation capture ability in months with high precipitation compared to months with lower precipitation. There are differences in the ability of the three datasets to capture precipitation within each month. In the months of October to December and January, ERA5-LandPR demonstrates better precipitation capture ability than CMFDPR, while in other months, CMFDPR outperforms ERA5-LandPR. Additionally, both ERA5-LandPR and CMFDPR exhibit better capture ability than ERA5PR in all months (Table 3). Overall, the precipitation capture ability of ERA5-LandPR, ERA5PR, and CMFDPR is better in months with lower precipitation compared to months with higher precipitation. Each dataset has its advantages in capturing precipitation in different months. However, in terms of average precipitation capture ability, CMFDPR > ERA5-LandPR > ERA5PR.
3.5. Comparison Analysis between TRMM Satellite Precipitation Data and Pre- and Post-Correction ERA5-Land, ERA5, and CMFD Precipitation Data
Studies have shown that satellite-derived precipitation data often exhibit better accuracy than reanalysis data [34]. Therefore, in this study, TRMM precipitation data were selected to compare and analyse the capturing capabilities of precipitation by pre- and post-correction ERA5-Land, ERA5, and CMFD. The results indicate that when compared to meteorological station precipitation measurements, TRMM, as well as pre- and post-correction ERA5-Land, ERA5, and CMFD consistently exhibited overestimation. Overall, pre-correction ERA5-Land and ERA5 had larger biases than TRMM in all months. However, both pre- and post-correction CMFD and post-correction ERA5-Land and ERA5 exhibited smaller biases than TRMM (Figure 12). The Taylor diagram (Figure 13) indicated that TRMM was closer to meteorological observation values (REF) than pre-correction ERA5-Land and ERA5. However, both pre- and post-correction CMFD and post-correction ERA5-Land and ERA5 were even closer to meteorological observation values (REFs) than TRMM. Similarly, RMSE values showed that pre-correction ERA5-Land and ERA5 had larger errors than TRMM, while the other datasets had errors smaller than TRMM (Table 4). In general, the precipitation capturing ability of pre-correction ERA5-Land and ERA5 was weaker than that of TRMM. However, both pre- and post-correction CMFD and post-correction ERA5-Land and ERA5 demonstrated superior precipitation capturing capabilities compared to TRMM.
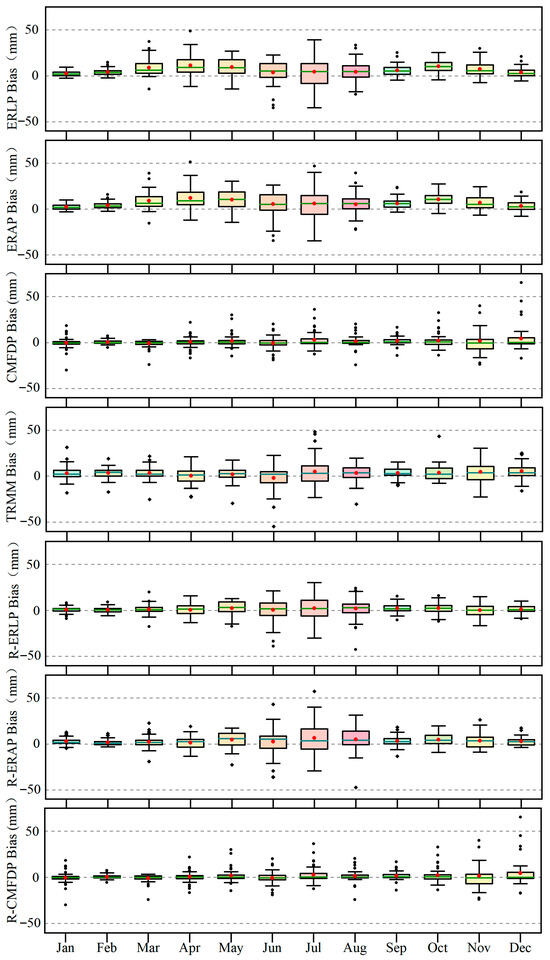
Figure 12.
Bottom box plot of bias for the pre- and post-correction ERA5-Land, ERA5, CMFD and TRRM precipitation from 1998 to 2018 (red dots: mean bias, green horizontal line: median bias, black dots: outliers).
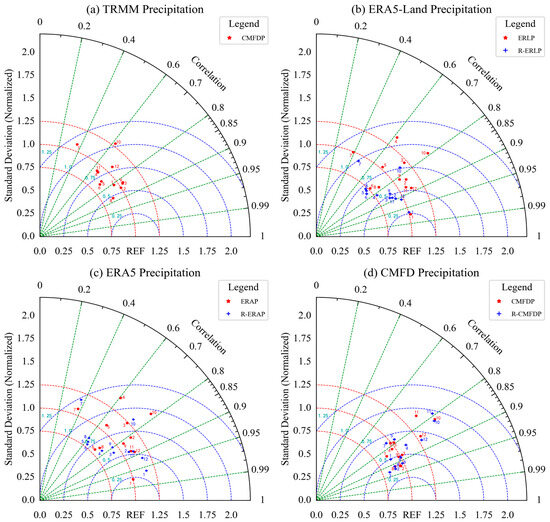
Figure 13.
Taylor diagram of precipitation data assessment compared with meteorological observations in the Altay region from 1998 to 2018 ((a) represents the TRMM precipitation; (b) represents the ERA5-Land precipitation before and after correction; (c) represents the ERA5 precipitation before and after correction; and (d) represents the CMFD precipitation before and after correction. The numbers in the diagram are the corresponding months, i.e., “1” is January).
Table 4.
Summary of the RMSE error statistics of the precipitation data assessment from 1998 to 2018.
4. Discussion
Overall, ERA5-Land, ERA5, and CMFD demonstrate weak capabilities in capturing temperature and precipitation in the Altay region. Regarding temperature, various error metrics indicate significant errors in ERA5-Land, ERA5, and CMFD temperature data in the Altay region, with weaker performance compared to other regions [17,42,43]. As for precipitation, CMFD outperforms TRMM data. This can be attributed to the integration of background data from Princeton reanalysis, GLDAS data, GEWEX-SRB radiation data, TRMM precipitation data, and meteorological observational data in constructing CMFD precipitation data [32,44]. On the other hand, ERA5-Land and ERA5 exhibited weaker capabilities in capturing precipitation in the Altay region compared to the TRMM dataset, as well as in other regions [45,46]. Based on the above analysis, It can be concluded that except for CMFD precipitation data, error correction should be carried out for other datasets before their usage, which aligns with previous findings in Iran and the Qilian Mountains [16,18,47].
The residual and coefficient revision methods significantly enhance the temperature and precipitation capture capabilities of ERA5-Land, ERA5, and CMFD in the Altay region. In terms of temperature, CMFDPR, ERA5-LandPR, and ERA5PR demonstrate substantial improvements in error accuracy. Specifically, CMFDPR outperforms ERA5-LandPR and ERA5PR, while ERA5-LandPR performs better than ERA5PR. However, it is important to note that despite ERA5PR’s improved temperature capturing ability compared to its pre-revision state, it still falls short of pre-revision ERA5-Land and CMFD in terms of temperature capture. This indicates that ERA5PR struggles to accurately represent temperatures in the Altay region, rendering it unsuitable for scientific research in this area. Regarding precipitation, the coefficient revision method exhibits the most significant improvement in accuracy for ERA5-Land compared to other datasets. On the other hand, CMFDPR shows relatively minor improvement due to its already proficient precipitation capture capabilities prior to correction. Although the improvement in RMSE for CMFDPR is not substantial, it outperforms ERA5-Land and ERA5 in capturing precipitation in most months. Comparative analysis with TRMM precipitation data confirms that ERA5-LandPR, ERA5PR, and CMFDPR demonstrate superior precipitation capture capabilities. In conclusion, it is evident that, except for ERA5 temperature, the residual revision method and coefficient revision method are suitable for correcting errors in other data in the Altay region.
The varying performances of ERA5-Land, ERA5, and CMFD monthly temperature and precipitation data before and after revision in the Altay region may be attributed to several reasons. Firstly, variations in spatial representation between meteorological station observations and temperature/precipitation data from ERA5-Land, ERA5, and CMFD could introduce errors in the assessment outcomes [48]. Horizontally, meteorological stations capture data at a point or small-area scale, whereas ERA5-Land, ERA5, and CMFD employ grid coverages of 0.1°, 0.25°, and 0.1°, respectively, potentially leading to evaluation discrepancies [46]. Vertically, ERA5-Land and ERA5 depict temperature data at 2 m above ground, while ground observations represent it at 1.5 m. Inconsistencies in elevation may contribute to errors in the verification results [18,49]. Secondly, variations in spatial resolution and the inversion process of the data model contribute to inconsistent results. The higher spatial resolution and improved physical/process representations may elucidate the superior performance of ERA5-Land and CMFD over ERA5, and CMFD over ERA5-Land [50]. Thirdly, the accuracy of meteorological station observations introduces significant uncertainties in the assessment outcomes. Measurement errors affecting rain gauges, such as wind field deformation, wetting losses, evaporation, sublimation, and splashing, lead to ground precipitation being generally higher than rain gauge measurements [51,52]. Rain gauges can underestimate precipitation by 25% to 30% in heavy rain and windy conditions [53]. This discrepancy explains the overestimation of precipitation in the Altay region for ERA5-Land, ERA5, and CMFD before and after correction. Additionally, differences and errors in temperature and precipitation between ERA5-Land, ERA5, and CMFD before and after revision may also be attributed to data assimilation methods, prediction models, initial conditions, model systems, and interpolation [54]. Based on the findings mentioned above, future research should aim to enhance the objectivity of precipitation observations at meteorological stations by incorporating the precipitation amount missed by these stations due to natural factors into the total precipitation calculation. Furthermore, it is crucial to establish additional meteorological observation stations in areas with complex terrain to improve the accuracy of reanalysis data simulations.
5. Conclusions
This study utilized the residual and coefficient revision method to revise the ERA5-Land, ERA5, and CMFD monthly temperature and precipitation data in the Altay region. The evaluation of these datasets’ ability to capture temperature and precipitation was conducted based on meteorological station observational data. Additionally, a comparative analysis with TRMM satellite precipitation data was performed to assess the ability of ERA5-Land, ERA5, and CMFD in capturing precipitation. The conclusions are described as follows:
- (1)
- ERA5-Land, ERA5, and CMFD exhibit significant differences in their ability to capture temperature and precipitation in the Altay region. In general, ERA5-Land, ERA5, and CMFD temperature and precipitation data underperformed in the Altay region and required error correction before scientific research could be conducted, especially for ERA5-Land and ERA5 temperature and precipitation data.
- (2)
- Residual and coefficient revision method significantly improved the ability of ERA5-Land, ERA5, and CMFD to capture temperature and precipitation. With the exception of ERA5PR temperature data, all other datasets meet the accuracy requirements for temperature and precipitation in the Altay region and can provide reliable data support for studying climate and ecological change in arid and semi-arid areas.
- (3)
- There are differences in the ability of ERA5-LandPR, ERA5PR, and CMFDPR to capture temperature and precipitation. Overall, CMFDPR demonstrates better temperature capture capabilities than both ERA5-LandPR and ERA5PR. Additionally, all three datasets exhibit weaker temperature capture abilities in mountainous regions compared to plains. Furthermore, ERA5-LandPR, ERA5PR, and CMFDPR exhibit weaker precipitation capture abilities during months with high precipitation compared to months with lower precipitation. CMFDPR and ERA5-LandPR exhibit varying abilities in capturing precipitation in different months, but both outperform ERA5PR.
Author Contributions
G.J. designed and supervised the research, and L.Z. processed the data, analysed the results and wrote the manuscript. P.D.M. and T.V.d.V. recommended the methodology and reviewed the manuscript. T.Y., J.U., H.T., B.C., H.L., K.L. and T.J. offered technical support. Each contributor edited and provided suggestions for improvements to the final version of the manuscript. All authors have read and agreed to the published version of the manuscript.
Funding
This research was funded by the Third Xinjiang Scientific Expedition Program (Grant No. 2021xjkk0701), Natural Science Foundation of Xinjiang Uygur Autonomous Region (Grant No. 2021D01B83), Xinjiang Meteorological Science and Technology Innovation Development Fund Project (Grant No. MS202207), Anhui Meteorological Bureau Innovation Development Special Project (Grant No. CXM202110), and Chinese Academy of Sciences President’s International Fellowship Initiative (Grant No. 2024PVB0064).
Data Availability Statement
Data are available within the article.
Acknowledgments
We would like to express our gratitude to the Climate Data Store (CDS), the National Tibetan Plateau Data Center, the Google Earth Engine platform and Xinjiang Climate Center for making the data available.
Conflicts of Interest
The authors declare that they have no known competing financial interests or personal relationships that could have appeared to influence the work reported in this paper.
Appendix A
Table A1.
The correction coefficients for ERA5-Land, ERA5, and CMFD precipitation for each month from 1979 to 2018.
Table A1.
The correction coefficients for ERA5-Land, ERA5, and CMFD precipitation for each month from 1979 to 2018.
| Year | Month | ERALP | ERAP | CMFDP |
|---|---|---|---|---|
| 1979 | 1 | 0.47 | 0.53 | 1.49 |
| 1979 | 2 | 0.47 | 0.53 | 1.37 |
| 1979 | 3 | 0.41 | 0.42 | 1.22 |
| 1979 | 4 | 0.54 | 0.62 | 0.97 |
| 1979 | 5 | 0.67 | 0.64 | 0.98 |
| 1979 | 6 | 0.81 | 0.96 | 0.95 |
| 1979 | 7 | 0.68 | 1.33 | 0.98 |
| 1979 | 8 | 0.26 | 0.39 | 0.85 |
| 1979 | 9 | 0.73 | 0.98 | 0.99 |
| 1979 | 10 | 0.44 | 0.45 | 0.95 |
| 1979 | 11 | 0.70 | 0.78 | 0.98 |
| 1979 | 12 | 0.59 | 0.71 | 1.69 |
| 1980 | 1 | 0.62 | 0.69 | 0.97 |
| 1980 | 2 | 0.41 | 0.73 | 1.21 |
| 1980 | 3 | 0.46 | 0.56 | 1.13 |
| 1980 | 4 | 0.44 | 0.45 | 0.98 |
| 1980 | 5 | 0.98 | 1.02 | 0.94 |
| 1980 | 6 | 0.60 | 0.75 | 0.97 |
| 1980 | 7 | 1.07 | 1.18 | 0.97 |
| 1980 | 8 | 0.80 | 1.00 | 0.95 |
| 1980 | 9 | 0.89 | 0.90 | 0.97 |
| 1980 | 10 | 0.51 | 0.74 | 0.91 |
| 1980 | 11 | 0.55 | 0.57 | 0.97 |
| 1980 | 12 | 0.54 | 0.54 | 1.11 |
| 1981 | 1 | 0.88 | 0.93 | 1.15 |
| 1981 | 2 | 0.34 | 0.54 | 1.07 |
| 1981 | 3 | 0.56 | 0.66 | 0.93 |
| 1981 | 4 | 0.65 | 0.67 | 1.02 |
| 1981 | 5 | 0.60 | 0.62 | 1.00 |
| 1981 | 6 | 0.59 | 0.58 | 0.90 |
| 1981 | 7 | 0.78 | 0.70 | 1.00 |
| 1981 | 8 | 0.73 | 0.92 | 0.88 |
| 1981 | 9 | 0.93 | 0.97 | 0.99 |
| 1981 | 10 | 0.52 | 0.68 | 0.99 |
| 1981 | 11 | 0.49 | 0.51 | 0.97 |
| 1981 | 12 | 0.50 | 0.46 | 1.41 |
| 1982 | 1 | 0.32 | 0.48 | 1.07 |
| 1982 | 2 | 0.27 | 0.40 | 1.14 |
| 1982 | 3 | 0.46 | 0.59 | 0.92 |
| 1982 | 4 | 0.33 | 0.39 | 0.57 |
| 1982 | 5 | 0.94 | 1.09 | 0.95 |
| 1982 | 6 | 0.43 | 0.55 | 0.98 |
| 1982 | 7 | 1.14 | 0.73 | 0.88 |
| 1982 | 8 | 0.63 | 1.14 | 0.95 |
| 1982 | 9 | 0.69 | 0.51 | 0.90 |
| 1982 | 10 | 0.48 | 0.46 | 0.88 |
| 1982 | 11 | 0.42 | 0.52 | 0.89 |
| 1982 | 12 | 0.58 | 0.63 | 1.51 |
| 1983 | 1 | 0.55 | 0.62 | 0.90 |
| 1983 | 2 | 0.34 | 0.37 | 1.36 |
| 1983 | 3 | 0.50 | 0.76 | 0.92 |
| 1983 | 4 | 0.35 | 0.65 | 0.78 |
| 1983 | 5 | 0.67 | 0.80 | 0.99 |
| 1983 | 6 | 0.88 | 1.01 | 1.01 |
| 1983 | 7 | 0.82 | 0.86 | 0.97 |
| 1983 | 8 | 1.58 | 1.73 | 0.99 |
| 1983 | 9 | 0.59 | 0.57 | 0.98 |
| 1983 | 10 | 0.55 | 0.47 | 0.96 |
| 1983 | 11 | 0.36 | 0.33 | 0.93 |
| 1983 | 12 | 0.86 | 0.91 | 1.65 |
| 1984 | 1 | 0.63 | 0.57 | 1.27 |
| 1984 | 2 | 0.43 | 0.56 | 1.04 |
| 1984 | 3 | 0.61 | 0.84 | 1.02 |
| 1984 | 4 | 0.50 | 0.46 | 0.90 |
| 1984 | 5 | 0.54 | 0.64 | 0.99 |
| 1984 | 6 | 0.66 | 0.62 | 0.99 |
| 1984 | 7 | 1.05 | 1.22 | 0.99 |
| 1984 | 8 | 0.60 | 0.58 | 0.88 |
| 1984 | 9 | 0.73 | 0.70 | 1.00 |
| 1984 | 10 | 0.45 | 0.58 | 0.92 |
| 1984 | 11 | 0.56 | 0.58 | 1.25 |
| 1984 | 12 | 1.14 | 1.28 | 1.87 |
| 1985 | 1 | 0.60 | 0.63 | 0.88 |
| 1985 | 2 | 0.39 | 0.39 | 1.18 |
| 1985 | 3 | 0.35 | 0.41 | 2.04 |
| 1985 | 4 | 0.44 | 0.43 | 0.88 |
| 1985 | 5 | 0.41 | 0.40 | 0.97 |
| 1985 | 6 | 1.05 | 1.13 | 0.98 |
| 1985 | 7 | 0.62 | 0.80 | 0.96 |
| 1985 | 8 | 0.64 | 0.73 | 0.97 |
| 1985 | 9 | 0.81 | 0.67 | 1.00 |
| 1985 | 10 | 0.45 | 0.47 | 0.97 |
| 1985 | 11 | 0.55 | 0.63 | 1.13 |
| 1985 | 12 | 0.67 | 0.78 | 1.29 |
| 1986 | 1 | 0.40 | 0.37 | 0.91 |
| 1986 | 2 | 0.48 | 0.49 | 1.00 |
| 1986 | 3 | 0.32 | 0.31 | 1.41 |
| 1986 | 4 | 0.65 | 0.67 | 0.99 |
| 1986 | 5 | 0.60 | 0.49 | 0.96 |
| 1986 | 6 | 0.39 | 0.43 | 0.94 |
| 1986 | 7 | 0.62 | 0.95 | 0.98 |
| 1986 | 8 | 0.80 | 0.74 | 0.97 |
| 1986 | 9 | 0.70 | 0.74 | 0.96 |
| 1986 | 10 | 0.54 | 0.45 | 1.03 |
| 1986 | 11 | 0.99 | 1.08 | 1.00 |
| 1986 | 12 | 0.59 | 0.78 | 1.48 |
| 1987 | 1 | 0.68 | 0.77 | 1.50 |
| 1987 | 2 | 0.44 | 0.45 | 1.65 |
| 1987 | 3 | 0.61 | 0.60 | 1.33 |
| 1987 | 4 | 0.49 | 0.60 | 0.95 |
| 1987 | 5 | 0.67 | 0.72 | 1.01 |
| 1987 | 6 | 0.56 | 0.66 | 0.99 |
| 1987 | 7 | 0.66 | 0.69 | 0.98 |
| 1987 | 8 | 0.96 | 1.10 | 0.96 |
| 1987 | 9 | 0.49 | 0.48 | 1.00 |
| 1987 | 10 | 0.66 | 0.82 | 0.99 |
| 1987 | 11 | 0.43 | 0.51 | 1.16 |
| 1987 | 12 | 0.59 | 0.66 | 1.52 |
| 1988 | 1 | 0.48 | 0.57 | 0.96 |
| 1988 | 2 | 0.71 | 0.79 | 0.95 |
| 1988 | 3 | 0.44 | 0.57 | 1.12 |
| 1988 | 4 | 0.61 | 0.68 | 0.96 |
| 1988 | 5 | 0.76 | 0.79 | 1.00 |
| 1988 | 6 | 0.62 | 0.74 | 0.96 |
| 1988 | 7 | 0.94 | 1.09 | 0.98 |
| 1988 | 8 | 0.52 | 0.43 | 0.97 |
| 1988 | 9 | 0.55 | 0.55 | 0.95 |
| 1988 | 10 | 0.62 | 0.69 | 0.97 |
| 1988 | 11 | 0.78 | 0.90 | 0.94 |
| 1988 | 12 | 0.51 | 0.47 | 0.93 |
| 1989 | 1 | 0.57 | 0.65 | 0.95 |
| 1989 | 2 | 0.29 | 0.40 | 1.12 |
| 1989 | 3 | 0.64 | 1.23 | 0.78 |
| 1989 | 4 | 0.31 | 0.47 | 0.92 |
| 1989 | 5 | 0.24 | 0.32 | 0.59 |
| 1989 | 6 | 0.50 | 0.58 | 0.95 |
| 1989 | 7 | 0.87 | 0.82 | 0.98 |
| 1989 | 8 | 0.62 | 0.73 | 0.85 |
| 1989 | 9 | 0.69 | 0.77 | 0.97 |
| 1989 | 10 | 0.55 | 0.65 | 0.98 |
| 1989 | 11 | 0.68 | 0.80 | 1.54 |
| 1989 | 12 | 0.38 | 0.48 | 1.01 |
| 1990 | 1 | 0.67 | 0.72 | 1.06 |
| 1990 | 2 | 0.35 | 0.41 | 1.42 |
| 1990 | 3 | 0.72 | 0.86 | 1.02 |
| 1990 | 4 | 0.63 | 0.66 | 0.97 |
| 1990 | 5 | 0.38 | 0.42 | 0.95 |
| 1990 | 6 | 1.08 | 0.73 | 0.91 |
| 1990 | 7 | 1.06 | 1.22 | 1.00 |
| 1990 | 8 | 0.53 | 0.55 | 0.96 |
| 1990 | 9 | 1.34 | 1.76 | 0.86 |
| 1990 | 10 | 0.50 | 0.53 | 1.01 |
| 1990 | 11 | 0.63 | 0.69 | 1.03 |
| 1990 | 12 | 0.54 | 0.53 | 1.10 |
| 1991 | 1 | 0.56 | 0.74 | 0.92 |
| 1991 | 2 | 0.48 | 0.59 | 1.15 |
| 1991 | 3 | 0.44 | 0.54 | 1.02 |
| 1991 | 4 | 0.68 | 0.96 | 0.44 |
| 1991 | 5 | 0.76 | 0.88 | 0.97 |
| 1991 | 6 | 1.04 | 1.14 | 0.94 |
| 1991 | 7 | 0.72 | 0.78 | 0.97 |
| 1991 | 8 | 0.94 | 0.78 | 0.93 |
| 1991 | 9 | 0.70 | 0.86 | 0.96 |
| 1991 | 10 | 0.74 | 0.80 | 0.94 |
| 1991 | 11 | 0.52 | 0.60 | 1.16 |
| 1991 | 12 | 0.75 | 0.82 | 1.24 |
| 1992 | 1 | 0.53 | 0.73 | 1.10 |
| 1992 | 2 | 0.47 | 0.51 | 1.08 |
| 1992 | 3 | 0.63 | 0.63 | 1.28 |
| 1992 | 4 | 0.64 | 0.74 | 0.99 |
| 1992 | 5 | 0.73 | 0.63 | 0.95 |
| 1992 | 6 | 1.50 | 1.93 | 0.96 |
| 1992 | 7 | 0.93 | 0.90 | 0.97 |
| 1992 | 8 | 1.01 | 1.26 | 0.99 |
| 1992 | 9 | 0.74 | 0.83 | 0.99 |
| 1992 | 10 | 0.59 | 0.56 | 0.93 |
| 1992 | 11 | 0.70 | 0.64 | 1.01 |
| 1992 | 12 | 0.64 | 0.77 | 1.75 |
| 1993 | 1 | 0.75 | 0.82 | 0.92 |
| 1993 | 2 | 0.54 | 0.61 | 1.42 |
| 1993 | 3 | 0.45 | 0.49 | 1.01 |
| 1993 | 4 | 0.57 | 0.60 | 0.94 |
| 1993 | 5 | 1.01 | 1.00 | 0.95 |
| 1993 | 6 | 0.60 | 0.68 | 0.97 |
| 1993 | 7 | 0.88 | 1.26 | 0.99 |
| 1993 | 8 | 0.83 | 0.89 | 1.01 |
| 1993 | 9 | 0.73 | 0.64 | 1.00 |
| 1993 | 10 | 0.40 | 0.42 | 0.87 |
| 1993 | 11 | 0.95 | 1.02 | 0.98 |
| 1993 | 12 | 0.73 | 0.77 | 0.90 |
| 1994 | 1 | 0.72 | 0.84 | 0.97 |
| 1994 | 2 | 0.45 | 0.59 | 0.97 |
| 1994 | 3 | 0.48 | 0.55 | 1.40 |
| 1994 | 4 | 0.53 | 0.59 | 0.98 |
| 1994 | 5 | 0.46 | 0.51 | 0.96 |
| 1994 | 6 | 0.41 | 0.77 | 0.82 |
| 1994 | 7 | 0.88 | 1.11 | 1.00 |
| 1994 | 8 | 1.01 | 0.88 | 0.98 |
| 1994 | 9 | 0.69 | 0.64 | 0.91 |
| 1994 | 10 | 0.45 | 0.49 | 0.91 |
| 1994 | 11 | 0.59 | 0.59 | 0.98 |
| 1994 | 12 | 0.45 | 0.64 | 1.56 |
| 1995 | 1 | 0.54 | 0.67 | 1.00 |
| 1995 | 2 | 0.48 | 0.49 | 1.27 |
| 1995 | 3 | 0.31 | 0.44 | 0.87 |
| 1995 | 4 | 0.28 | 0.41 | 0.84 |
| 1995 | 5 | 0.65 | 0.64 | 0.98 |
| 1995 | 6 | 0.56 | 0.68 | 0.98 |
| 1995 | 7 | 0.71 | 0.93 | 0.98 |
| 1995 | 8 | 0.68 | 0.85 | 0.97 |
| 1995 | 9 | 0.66 | 0.68 | 1.00 |
| 1995 | 10 | 0.61 | 0.72 | 0.98 |
| 1995 | 11 | 0.68 | 0.58 | 0.93 |
| 1995 | 12 | 0.52 | 0.54 | 0.95 |
| 1996 | 1 | 0.52 | 0.59 | 0.93 |
| 1996 | 2 | 0.42 | 0.80 | 0.88 |
| 1996 | 3 | 0.48 | 0.46 | 0.98 |
| 1996 | 4 | 0.56 | 0.69 | 0.83 |
| 1996 | 5 | 0.83 | 0.78 | 0.84 |
| 1996 | 6 | 0.72 | 1.17 | 0.91 |
| 1996 | 7 | 0.85 | 1.26 | 0.89 |
| 1996 | 8 | 0.83 | 0.99 | 0.82 |
| 1996 | 9 | 0.49 | 0.54 | 0.92 |
| 1996 | 10 | 0.87 | 0.92 | 0.93 |
| 1996 | 11 | 0.81 | 0.90 | 0.93 |
| 1996 | 12 | 0.56 | 0.63 | 0.92 |
| 1997 | 1 | 0.77 | 0.84 | 0.96 |
| 1997 | 2 | 0.49 | 0.54 | 1.27 |
| 1997 | 3 | 0.29 | 0.41 | 0.89 |
| 1997 | 4 | 0.36 | 0.30 | 0.83 |
| 1997 | 5 | 0.51 | 0.28 | 0.63 |
| 1997 | 6 | 0.49 | 0.47 | 0.94 |
| 1997 | 7 | 1.13 | 0.62 | 0.88 |
| 1997 | 8 | 0.47 | 1.69 | 0.89 |
| 1997 | 9 | 0.86 | 0.85 | 0.85 |
| 1997 | 10 | 2.06 | 1.54 | 0.49 |
| 1997 | 11 | 0.96 | 1.00 | 1.65 |
| 1997 | 12 | 0.73 | 0.86 | 0.93 |
| 1998 | 1 | 0.71 | 0.75 | 1.03 |
| 1998 | 2 | 0.51 | 0.54 | 1.48 |
| 1998 | 3 | 0.59 | 0.63 | 1.12 |
| 1998 | 4 | 0.43 | 0.47 | 0.98 |
| 1998 | 5 | 0.68 | 0.66 | 0.95 |
| 1998 | 6 | 1.06 | 1.23 | 0.98 |
| 1998 | 7 | 0.69 | 1.17 | 0.98 |
| 1998 | 8 | 0.98 | 1.77 | 0.97 |
| 1998 | 9 | 0.73 | 0.59 | 1.01 |
| 1998 | 10 | 0.23 | 0.22 | 0.65 |
| 1998 | 11 | 0.79 | 0.95 | 0.98 |
| 1998 | 12 | 0.65 | 0.73 | 0.95 |
| 1999 | 1 | 0.77 | 0.95 | 1.02 |
| 1999 | 2 | 0.47 | 0.64 | 1.47 |
| 1999 | 3 | 0.60 | 0.82 | 1.55 |
| 1999 | 4 | 0.49 | 0.51 | 0.97 |
| 1999 | 5 | 0.45 | 0.44 | 0.96 |
| 1999 | 6 | 0.50 | 0.45 | 0.99 |
| 1999 | 7 | 0.60 | 0.70 | 1.02 |
| 1999 | 8 | 0.53 | 0.60 | 0.99 |
| 1999 | 9 | 0.48 | 0.50 | 0.97 |
| 1999 | 10 | 0.68 | 0.84 | 1.01 |
| 1999 | 11 | 0.62 | 0.72 | 0.96 |
| 1999 | 12 | 1.03 | 1.15 | 1.41 |
| 2000 | 1 | 0.75 | 0.86 | 0.99 |
| 2000 | 2 | 0.29 | 0.35 | 0.89 |
| 2000 | 3 | 0.39 | 0.59 | 0.97 |
| 2000 | 4 | 0.32 | 0.34 | 0.97 |
| 2000 | 5 | 0.74 | 0.87 | 1.21 |
| 2000 | 6 | 0.81 | 0.87 | 1.17 |
| 2000 | 7 | 0.77 | 0.95 | 0.99 |
| 2000 | 8 | 0.46 | 0.31 | 1.04 |
| 2000 | 9 | 0.51 | 0.51 | 1.16 |
| 2000 | 10 | 0.67 | 0.82 | 1.30 |
| 2000 | 11 | 0.83 | 0.97 | 1.25 |
| 2000 | 12 | 0.91 | 1.14 | 1.01 |
| 2001 | 1 | 0.74 | 0.92 | 1.27 |
| 2001 | 2 | 0.50 | 0.61 | 0.87 |
| 2001 | 3 | 0.72 | 0.63 | 1.05 |
| 2001 | 4 | 0.42 | 0.48 | 1.34 |
| 2001 | 5 | 0.72 | 0.83 | 1.05 |
| 2001 | 6 | 0.66 | 0.92 | 1.03 |
| 2001 | 7 | 0.64 | 0.74 | 1.01 |
| 2001 | 8 | 1.19 | 1.34 | 1.02 |
| 2001 | 9 | 0.57 | 0.62 | 1.00 |
| 2001 | 10 | 0.58 | 0.64 | 0.87 |
| 2001 | 11 | 0.64 | 0.66 | 1.24 |
| 2001 | 12 | 1.53 | 1.60 | 1.02 |
| 2002 | 1 | 0.81 | 1.00 | 0.94 |
| 2002 | 2 | 0.98 | 1.00 | 0.88 |
| 2002 | 3 | 0.46 | 0.52 | 1.04 |
| 2002 | 4 | 0.48 | 0.51 | 0.98 |
| 2002 | 5 | 0.77 | 0.79 | 1.03 |
| 2002 | 6 | 0.90 | 0.95 | 0.98 |
| 2002 | 7 | 0.67 | 0.64 | 0.97 |
| 2002 | 8 | 0.53 | 0.51 | 1.06 |
| 2002 | 9 | 0.49 | 0.44 | 0.94 |
| 2002 | 10 | 0.83 | 0.98 | 0.99 |
| 2002 | 11 | 0.81 | 0.85 | 1.27 |
| 2002 | 12 | 0.67 | 0.70 | 1.00 |
| 2003 | 1 | 0.81 | 0.90 | 0.94 |
| 2003 | 2 | 0.54 | 0.68 | 0.92 |
| 2003 | 3 | 0.33 | 0.38 | 0.94 |
| 2003 | 4 | 0.57 | 0.66 | 1.05 |
| 2003 | 5 | 0.92 | 0.77 | 0.89 |
| 2003 | 6 | 0.61 | 0.51 | 1.01 |
| 2003 | 7 | 0.82 | 0.91 | 1.01 |
| 2003 | 8 | 0.95 | 1.09 | 1.03 |
| 2003 | 9 | 0.73 | 0.71 | 0.99 |
| 2003 | 10 | 0.44 | 0.47 | 1.03 |
| 2003 | 11 | 0.85 | 1.07 | 0.92 |
| 2003 | 12 | 1.00 | 1.01 | 0.91 |
| 2004 | 1 | 0.71 | 0.94 | 1.01 |
| 2004 | 2 | 0.74 | 0.88 | 0.90 |
| 2004 | 3 | 0.61 | 0.67 | 1.26 |
| 2004 | 4 | 0.55 | 0.43 | 0.90 |
| 2004 | 5 | 0.80 | 0.91 | 1.08 |
| 2004 | 6 | 0.60 | 1.31 | 1.13 |
| 2004 | 7 | 0.58 | 0.56 | 1.00 |
| 2004 | 8 | 1.01 | 0.91 | 0.99 |
| 2004 | 9 | 0.86 | 0.92 | 0.96 |
| 2004 | 10 | 0.26 | 0.27 | 0.82 |
| 2004 | 11 | 0.77 | 0.86 | 1.21 |
| 2004 | 12 | 1.02 | 1.15 | 0.98 |
| 2005 | 1 | 1.28 | 1.31 | 0.95 |
| 2005 | 2 | 0.93 | 1.32 | 0.90 |
| 2005 | 3 | 0.32 | 0.32 | 0.87 |
| 2005 | 4 | 0.53 | 0.56 | 1.10 |
| 2005 | 5 | 0.86 | 0.84 | 0.94 |
| 2005 | 6 | 1.08 | 1.09 | 0.98 |
| 2005 | 7 | 0.47 | 0.42 | 0.89 |
| 2005 | 8 | 0.71 | 0.67 | 0.99 |
| 2005 | 9 | 0.71 | 0.84 | 0.86 |
| 2005 | 10 | 0.46 | 0.58 | 0.90 |
| 2005 | 11 | 0.90 | 1.10 | 1.00 |
| 2005 | 12 | 0.65 | 0.74 | 0.85 |
| 2006 | 1 | 0.87 | 1.30 | 0.91 |
| 2006 | 2 | 0.82 | 0.95 | 0.95 |
| 2006 | 3 | 0.72 | 0.78 | 1.14 |
| 2006 | 4 | 0.70 | 0.71 | 1.22 |
| 2006 | 5 | 0.63 | 0.73 | 0.93 |
| 2006 | 6 | 1.06 | 1.56 | 1.01 |
| 2006 | 7 | 0.73 | 0.93 | 0.93 |
| 2006 | 8 | 1.08 | 1.15 | 0.99 |
| 2006 | 9 | 0.34 | 0.50 | 0.73 |
| 2006 | 10 | 0.58 | 0.60 | 0.90 |
| 2006 | 11 | 0.84 | 0.92 | 0.84 |
| 2006 | 12 | 0.66 | 0.78 | 0.96 |
| 2007 | 1 | 0.77 | 0.80 | 0.90 |
| 2007 | 2 | 0.65 | 0.74 | 0.97 |
| 2007 | 3 | 0.75 | 0.79 | 1.24 |
| 2007 | 4 | 1.30 | 1.00 | 0.93 |
| 2007 | 5 | 0.54 | 0.56 | 0.87 |
| 2007 | 6 | 1.25 | 1.13 | 0.96 |
| 2007 | 7 | 1.12 | 1.13 | 0.97 |
| 2007 | 8 | 1.85 | 1.83 | 0.94 |
| 2007 | 9 | 0.81 | 0.70 | 0.91 |
| 2007 | 10 | 1.13 | 1.33 | 1.06 |
| 2007 | 11 | 0.84 | 0.87 | 1.10 |
| 2007 | 12 | 0.55 | 0.51 | 0.91 |
| 2008 | 1 | 0.86 | 0.88 | 1.02 |
| 2008 | 2 | 0.51 | 0.56 | 0.89 |
| 2008 | 3 | 0.53 | 0.68 | 0.97 |
| 2008 | 4 | 0.68 | 0.66 | 0.98 |
| 2008 | 5 | 0.31 | 0.25 | 0.82 |
| 2008 | 6 | 0.97 | 2.24 | 0.95 |
| 2008 | 7 | 1.36 | 1.41 | 0.97 |
| 2008 | 8 | 0.72 | 0.90 | 0.97 |
| 2008 | 9 | 0.81 | 0.79 | 0.97 |
| 2008 | 10 | 0.52 | 0.70 | 1.30 |
| 2008 | 11 | 0.68 | 0.79 | 0.90 |
| 2008 | 12 | 0.91 | 1.23 | 1.05 |
| 2009 | 1 | 0.89 | 1.01 | 0.90 |
| 2009 | 2 | 0.64 | 0.77 | 1.09 |
| 2009 | 3 | 0.63 | 0.64 | 0.86 |
| 2009 | 4 | 0.52 | 0.47 | 1.01 |
| 2009 | 5 | 0.83 | 0.84 | 0.94 |
| 2009 | 6 | 0.50 | 0.43 | 1.00 |
| 2009 | 7 | 0.71 | 0.60 | 0.96 |
| 2009 | 8 | 1.02 | 0.89 | 0.87 |
| 2009 | 9 | 0.89 | 1.03 | 1.00 |
| 2009 | 10 | 0.69 | 0.72 | 0.98 |
| 2009 | 11 | 0.73 | 0.84 | 0.80 |
| 2009 | 12 | 0.85 | 0.98 | 1.04 |
| 2010 | 1 | 1.03 | 1.19 | 1.02 |
| 2010 | 2 | 0.80 | 0.85 | 0.89 |
| 2010 | 3 | 0.93 | 0.91 | 0.89 |
| 2010 | 4 | 0.71 | 0.69 | 0.90 |
| 2010 | 5 | 0.69 | 0.75 | 0.96 |
| 2010 | 6 | 1.22 | 1.04 | 0.97 |
| 2010 | 7 | 1.90 | 2.21 | 0.88 |
| 2010 | 8 | 0.78 | 1.02 | 0.99 |
| 2010 | 9 | 0.60 | 0.55 | 0.95 |
| 2010 | 10 | 1.08 | 1.13 | 1.02 |
| 2010 | 11 | 0.75 | 0.90 | 0.93 |
| 2010 | 12 | 0.76 | 0.97 | 0.97 |
| 2011 | 1 | 1.01 | 1.20 | 1.04 |
| 2011 | 2 | 1.05 | 1.04 | 0.91 |
| 2011 | 3 | 1.06 | 1.15 | 1.31 |
| 2011 | 4 | 0.68 | 0.87 | 1.02 |
| 2011 | 5 | 1.03 | 1.11 | 0.96 |
| 2011 | 6 | 1.13 | 0.69 | 0.90 |
| 2011 | 7 | 1.22 | 1.46 | 0.92 |
| 2011 | 8 | 1.20 | 1.38 | 1.04 |
| 2011 | 9 | 0.94 | 1.04 | 0.85 |
| 2011 | 10 | 0.56 | 0.70 | 1.01 |
| 2011 | 11 | 0.90 | 1.08 | 1.06 |
| 2011 | 12 | 0.91 | 1.13 | 0.94 |
| 2012 | 1 | 1.14 | 1.48 | 0.90 |
| 2012 | 2 | 1.02 | 0.68 | 1.01 |
| 2012 | 3 | 0.41 | 0.36 | 0.88 |
| 2012 | 4 | 0.72 | 0.82 | 1.05 |
| 2012 | 5 | 0.56 | 0.63 | 1.06 |
| 2012 | 6 | 1.17 | 1.79 | 1.04 |
| 2012 | 7 | 1.12 | 1.17 | 0.97 |
| 2012 | 8 | 0.97 | 1.33 | 0.96 |
| 2012 | 9 | 1.16 | 1.28 | 0.91 |
| 2012 | 10 | 0.74 | 0.82 | 1.01 |
| 2012 | 11 | 0.69 | 0.86 | 0.97 |
| 2012 | 12 | 0.94 | 1.05 | 0.94 |
| 2013 | 1 | 0.63 | 0.64 | 0.77 |
| 2013 | 2 | 0.73 | 0.84 | 0.98 |
| 2013 | 3 | 0.49 | 0.56 | 1.39 |
| 2013 | 4 | 0.46 | 0.69 | 0.89 |
| 2013 | 5 | 0.93 | 1.18 | 0.98 |
| 2013 | 6 | 0.97 | 0.87 | 1.04 |
| 2013 | 7 | 1.16 | 1.28 | 1.00 |
| 2013 | 8 | 1.07 | 0.95 | 0.91 |
| 2013 | 9 | 1.08 | 1.27 | 0.99 |
| 2013 | 10 | 0.74 | 0.86 | 0.96 |
| 2013 | 11 | 0.58 | 0.62 | 1.01 |
| 2013 | 12 | 1.10 | 1.17 | 1.13 |
| 2014 | 1 | 0.91 | 1.08 | 0.99 |
| 2014 | 2 | 0.79 | 1.05 | 1.00 |
| 2014 | 3 | 0.64 | 0.78 | 1.06 |
| 2014 | 4 | 0.52 | 0.52 | 0.96 |
| 2014 | 5 | 0.77 | 0.85 | 1.04 |
| 2014 | 6 | 0.68 | 0.40 | 0.76 |
| 2014 | 7 | 1.61 | 1.27 | 1.22 |
| 2014 | 8 | 0.45 | 0.47 | 0.83 |
| 2014 | 9 | 0.89 | 1.06 | 1.11 |
| 2014 | 10 | 0.74 | 0.96 | 0.88 |
| 2014 | 11 | 0.79 | 0.90 | 0.98 |
| 2014 | 12 | 0.62 | 0.62 | 0.97 |
| 2015 | 1 | 0.83 | 1.23 | 1.00 |
| 2015 | 2 | 0.60 | 0.80 | 1.01 |
| 2015 | 3 | 0.50 | 0.53 | 1.00 |
| 2015 | 4 | 0.68 | 0.51 | 0.72 |
| 2015 | 5 | 0.80 | 1.00 | 1.09 |
| 2015 | 6 | 0.67 | 0.56 | 1.00 |
| 2015 | 7 | 1.49 | 1.06 | 0.94 |
| 2015 | 8 | 0.92 | 0.88 | 0.90 |
| 2015 | 9 | 0.66 | 0.69 | 1.06 |
| 2015 | 10 | 0.55 | 0.71 | 1.00 |
| 2015 | 11 | 0.67 | 0.75 | 1.15 |
| 2015 | 12 | 0.78 | 0.85 | 0.95 |
| 2016 | 1 | 1.14 | 1.12 | 0.99 |
| 2016 | 2 | 0.41 | 0.48 | 0.92 |
| 2016 | 3 | 0.54 | 0.60 | 1.37 |
| 2016 | 4 | 0.82 | 0.78 | 1.00 |
| 2016 | 5 | 0.61 | 0.77 | 1.35 |
| 2016 | 6 | 0.99 | 0.94 | 1.00 |
| 2016 | 7 | 0.71 | 0.78 | 0.97 |
| 2016 | 8 | 1.00 | 1.20 | 1.22 |
| 2016 | 9 | 0.93 | 1.41 | 0.95 |
| 2016 | 10 | 0.71 | 0.82 | 1.33 |
| 2016 | 11 | 0.77 | 0.93 | 0.98 |
| 2016 | 12 | 0.85 | 0.93 | 1.32 |
| 2017 | 1 | 0.63 | 0.75 | 1.02 |
| 2017 | 2 | 1.10 | 1.18 | 0.90 |
| 2017 | 3 | 0.71 | 0.74 | 0.91 |
| 2017 | 4 | 0.48 | 0.59 | 0.94 |
| 2017 | 5 | 1.02 | 1.07 | 1.15 |
| 2017 | 6 | 0.92 | 1.02 | 1.07 |
| 2017 | 7 | 1.29 | 1.52 | 1.21 |
| 2017 | 8 | 0.80 | 1.77 | 1.06 |
| 2017 | 9 | 1.04 | 1.11 | 1.02 |
| 2017 | 10 | 0.65 | 0.78 | 1.02 |
| 2017 | 11 | 0.58 | 0.71 | 1.35 |
| 2017 | 12 | 0.70 | 0.89 | 0.93 |
| 2018 | 1 | 1.13 | 1.28 | 0.94 |
| 2018 | 2 | 0.16 | 0.20 | 0.79 |
| 2018 | 3 | 0.53 | 0.59 | 1.33 |
| 2018 | 4 | 0.91 | 0.92 | 1.25 |
| 2018 | 5 | 0.67 | 0.70 | 1.12 |
| 2018 | 6 | 0.71 | 0.64 | 0.99 |
| 2018 | 7 | 0.89 | 0.99 | 0.95 |
| 2018 | 8 | 0.90 | 0.87 | 0.91 |
| 2018 | 9 | 1.06 | 0.96 | 1.03 |
| 2018 | 10 | 0.41 | 0.45 | 0.85 |
| 2018 | 11 | 0.44 | 0.49 | 0.76 |
| 2018 | 12 | 0.98 | 1.08 | 0.71 |
References
- Xu, J.T.; Zhu, S.Y.; Ma, Z.Q.; Liu, H.; Shangguan, Y.L.; Yang, Y.J. Calibrating GPM IMERG Late-Run product using ground-based CPC daily precipitation data: A case study in the Beijing-Tianjin-Hebei urban agglomeration. Remote Sens. Lett. 2021, 12, 848–858. [Google Scholar] [CrossRef]
- IPCC. Summary for Policymakers. Climate Change 2021: The Physical Science Basis; Contribution of Working Group to the Sixth Assessment Report of the Intergovernmental Panel on Climate Change; Cambridge University Press: Cambridge, UK; New York, NY, USA, 2021. [Google Scholar]
- Min, S.K.; Zhang, X.; Zwiers, F.W.; Hegerl, G.C. Human contribution to more-intense precipitation extremes. Nature 2011, 470, 378–381. [Google Scholar] [CrossRef]
- Rodrigues, D.T.; Gonçalves, W.A.; Spyrides, M.H.C.; Santos e Silva, C.M.; Souza, D.O. Spatial distribution of the level of return of extreme precipitation events in Northeast Brazil. Int. J. Climatol. 2020, 40, 5098–5113. [Google Scholar] [CrossRef]
- Dong, S.Y.; Sun, Y.; Li, C.; Zhang, X.B.; Min, S.K.; Kim, Y.H. Attribution of Extreme Precipitation with Updated Observations and CMIP6 Simulations. J. Clim. 2021, 34, 871–881. [Google Scholar] [CrossRef]
- Lang, T.; Pan, L.; Liu, B.; Guo, T.; Hou, X. Vegetation Characteristics and Response to the Soil Properties of Three Medicinal Plant Communities in Altay Prefecture, China. Sustainability 2020, 12, 10306. [Google Scholar] [CrossRef]
- Li, S.; Li, X.; He, Q.; Yi, L. Study on Climate Change in Altay Prefecture since Recent 40 Years. Arid Zone Res. 2006, 23, 637–643. [Google Scholar]
- Gulzat, H.; Zhao, J. Analysis on Climate Change in Recent 50 Years in Altay Prefecture, Xinjiang. Arid Zone Res. 2011, 28, 268–274. [Google Scholar]
- Gulzat, H.; Jingbo, Z. Changes of extreme temperature and precipitation in Altay Region, Xinjiang in recent 50 years. J. Arid Land Resour. Environ. 2011, 25, 112–116. [Google Scholar]
- He, Y.; Xiong, J.; Abhayatihali, A.; Chen, W.; Ye, C.; He, W.; Yong, Z.; Tian, J. Spatiotemporal Pattern and Driving Force Analysis of Vegetation Variation in Altay Prefecture based on Google Earth Engine. J. Resour. Ecol. 2021, 12, 729–742. [Google Scholar]
- Gao, L.; Wei, J.H.; Wang, L.X.; Bernhardt, M.; Schulz, K.; Chen, X.W. A high-resolution air temperature data set for the Chinese Tian Shan in 1979–2016. Earth Syst. Sci. Data 2018, 10, 2097–2114. [Google Scholar] [CrossRef]
- Zhang, C.; Mou, N.X.; Niu, J.Q.; Zhang, L.X.; Liu, F. Spatio-Temporal Variation Characteristics of Snow Depth and Snow Cover Days over the Tibetan Plateau. Water 2021, 13, 307. [Google Scholar] [CrossRef]
- Bağçaci, S.Ç.; Yucel, I.; Duzenli, E.; Yilmaz, M.T. Intercomparison of the expected change in the temperature and the precipitation retrieved from CMIP6 and CMIP5 climate projections: A Mediterranean hot spot case, Turkey. Atmos. Res. 2021, 256, 105576. [Google Scholar] [CrossRef]
- Yu, T.; Jiapaer, G.; Bao, A.; Zhang, J.; Tu, H.; Chen, B.; De Maeyer, P.; Van de Voorde, T. Evaluating surface soil moisture characteristics and the performance of remote sensing and analytical products in Central Asia. J. Hydrol. 2023, 617, 128921. [Google Scholar] [CrossRef]
- Jiao, D.; Xu, N.; Yang, F.; Xu, K. Evaluation of spatial-temporal variation performance of ERA5 precipitation data in China. Sci. Rep. 2021, 11, 17956. [Google Scholar] [CrossRef]
- Li, Y.; Qin, X.; Liu, Y.; Jin, Z.; Liu, J.; Wang, L.; Chen, J. Evaluation of Long-Term and High-Resolution Gridded Precipitation and Temperature Products in the Qilian Mountains, Qinghai–Tibet Plateau. Front. Environ. Sci. 2022, 10, 906821. [Google Scholar] [CrossRef]
- Araujo, C.S.P.; Silva, I.; Ippolito, M.; Almeida, C. Evaluation of air temperature estimated by ERA5-Land reanalysis using surface data in Pernambuco, Brazil. Environ. Monit. Assess. 2022, 194, 381. [Google Scholar] [CrossRef] [PubMed]
- Zhao, P.; He, Z. A First Evaluation of ERA5-Land Reanalysis Temperature Product Over the Chinese Qilian Mountains. Front. Earth Sci. 2022, 10, 907730. [Google Scholar] [CrossRef]
- Ma, M.; Chen, Y.; Kang, G.; Zhao, Z.; Huang, W.; Tan, C.; Ding, F. Deviation analysis of reanalysis data in boundary layer in summer over Tibetan Plateau and its simulation correction. J. Arid Meteorol. 2022, 40, 95–107. [Google Scholar]
- Wang, X.; Shi, G.; Zhou, Z.; Zhen, Y. Revision of solar radiation product ERA5 based on random forest algorithm. Remote Sens. Nat. Resour. 2022, 34, 105–111. [Google Scholar]
- Fu, Q.; Li, B.; Hou, Y.; Bi, X.; Zhang, X.S. Effects of land use and climate change on ecosystem services in Central Asia’s arid regions: A case study in Altay Prefecture, China. Sci. Total Environ. 2017, 607, 633–646. [Google Scholar] [CrossRef]
- Zhao, J.; Zhuang, X.; Zhang, Y. Spatial and temporal distribution characteristics of short-term heavy rainfall in Altay area of Xinjiang in summer. Meteorol. Disaster Reduct. Res. 2022, 45, 31–37. [Google Scholar]
- Hanchu, L.; Jie, F.; Baoyin, L.; Li, W.; Qin, Q. Practical Exploration of Ecological Restoration and Management of the Mountains-Rivers-Forests-Farmlands-Lakes-Grasslands System in the Irtysh River Basin in Altay, Xinjiang. J. Resour. Ecol. 2021, 12, 766–776. [Google Scholar] [CrossRef]
- Lavers, D.A.; Simmons, A.; Vamborg, F.; Rodwell, M.J. An evaluation of ERA5 precipitation for climate monitoring. Q. J. R. Meteorol. Soc. 2022, 148, 3152–3165. [Google Scholar] [CrossRef]
- Muñoz-Sabater, J.; Dutra, E.; Agustí-Panareda, A.; Albergel, C.; Arduini, G.; Balsamo, G.; Boussetta, S.; Choulga, M.; Harrigan, S.; Hersbach, H.; et al. ERA5-Land: A state-of-the-art global reanalysis dataset for land applications. Earth Syst. Sci. Data 2021, 13, 4349–4383. [Google Scholar] [CrossRef]
- Mihalevich, B.A.; Neilson, B.T.; Buahin, C.A. Evaluation of the ERA5-Land Reanalysis Data Set for Process-Based River Temperature Modeling Over Data Sparse and Topographically Complex Regions. Water Resour. Res. 2022, 58, e2021WR031294. [Google Scholar] [CrossRef]
- Pelosi, A.; Chirico, G.B. Regional assessment of daily reference evapotranspiration: Can ground observations be replaced by blending ERA5-Land meteorological reanalysis and CM-SAF satellite-based radiation data? Agric. Water Manag. 2021, 258, 107169. [Google Scholar] [CrossRef]
- Xin, Y.; Yang, Y.; Chen, X.; Yue, X.; Liu, Y.; Yin, C. Evaluation of IMERG and ERA5 precipitation products over the Mongolian Plateau. Sci. Rep. 2022, 12, 21776. [Google Scholar] [CrossRef] [PubMed]
- Ou, T.H.; Chen, D.L.; Tang, J.P.; Lin, C.G.; Wang, X.J.; Kukulies, J.; Lai, H.W. Wet bias of summer precipitation in the northwestern Tibetan Plateau in ERA5 is linked to overestimated lower-level southerly wind over the plateau. Clim. Dyn. 2023, 61, 2139–2153. [Google Scholar] [CrossRef]
- Song, L.L.; Xu, C.C.; Long, Y.X.; Lei, X.N.; Suo, N.J.; Cao, L.L. Performance of Seven Gridded Precipitation Products over Arid Central Asia and Subregions. Remote Sens. 2022, 14, 6039. [Google Scholar] [CrossRef]
- Gao, L.; Zhang, L.; Shen, Y.; Zhang, Y.; Zhang, B. Evaluation of applicability of ERA-Interim and CMFD meteorological forcing data in the Irtysh River basin, Xinjiang. J. Glaciol. Geocryol. 2022, 44, 179–187. [Google Scholar]
- He, J.; Yang, K.; Tang, W.J.; Lu, H.; Qin, J.; Chen, Y.Y.; Li, X. The first high-resolution meteorological forcing dataset for land process studies over China. Sci. Data 2020, 7, 25. [Google Scholar] [CrossRef] [PubMed]
- Du, Y.; Wang, D.G.; Zhu, J.X.; Lin, Z.Q.; Zhong, Y.X. Intercomparison of multiple high-resolution precipitation products over China: Climatology and extremes. Atmos. Res. 2022, 278, 106342. [Google Scholar] [CrossRef]
- Chen, C.; Zheng, J.; Liu, Y.; Xu, Z. The response of glacial lakes in the Altay Mountains of China to climate change during 1992–2013. Geogr. Res. 2015, 34, 270–284. [Google Scholar]
- Michot, V.; Vila, D.; Arvor, D.; Corpetti, T.; Ronchail, J.; Funatsu, B.M.; Dubreuil, V. Performance of TRMM TMPA 3B42 V7 in Replicating Daily Rainfall and Regional Rainfall Regimes in the Amazon Basin (1998–2013). Remote Sens. 2018, 10, 1879. [Google Scholar] [CrossRef]
- Kumar, D.; Pandey, A.; Sharma, N.; Flugel, W.A. Evaluation of TRMM-Precipitation with Rain-Gauge Observation Using Hydrological Model J2000. J. Hydrol. Eng. 2017, 22, E5015007. [Google Scholar] [CrossRef]
- Cao, Y.Q.; Zhang, W.; Wang, W.J. Evaluation of TRMM 3B43 data over the Yangtze River Delta of China. Sci. Rep. 2018, 8, 5290. [Google Scholar] [CrossRef] [PubMed]
- Shi, W. Assessment of Multi-Source Precipitation Products and Characterization of Daily Changes in Extreme Precipitation in Central Asia. Master’s Thesis, Nanjing University of Information Engineering, Nanjing, China, 2021. [Google Scholar]
- Taylor, K.E. Summarizing multiple aspects of model performance in a single diagram. J. Geophys. Res.-Atmos. 2001, 106, 7183–7192. [Google Scholar] [CrossRef]
- Janssen, P.H.M.; Heuberger, P.S.C. Calibration of process-oriented models. Ecol. Model. 1995, 83, 55–66. [Google Scholar] [CrossRef]
- Wang, S.J.; Zhang, M.J.; Sun, M.P.; Wang, B.L.; Huang, X.Y.; Wang, Q.; Feng, F. Comparison of surface air temperature derived from NCEP/DOE R2, ERA-Interim, and observations in the arid northwestern China: A consideration of altitude errors. Theor. Appl. Climatol. 2015, 119, 99–111. [Google Scholar] [CrossRef]
- Zou, J.; Lu, N.; Jiang, H.; Qin, J.; Yao, L.; Xin, Y.; Su, F. Performance of air temperature from ERA5-Land reanalysis in coastal urban agglomeration of Southeast China. Sci Total Env. 2022, 828, 154459. [Google Scholar] [CrossRef]
- Hou, C.; Huang, D.; Xu, H.; Xu, Z. Evaluation of ERA5 reanalysis over the deserts in northern China. Theor. Appl. Climatol. 2022, 151, 801–816. [Google Scholar] [CrossRef]
- Yan, W.; Zhao, J.; Yang, Y. Comparative evaluation of the ability of GHCN-CAMS and CMFD reanalysis data to reflect regional temperature in Ningxia. Prog. Geogr. 2021, 40, 2061–2072. [Google Scholar] [CrossRef]
- Chen, Y.; Sharma, S.; Zhou, X.; Yang, K.; Li, X.; Niu, X.; Hu, X.; Khadka, N. Spatial performance of multiple reanalysis precipitation datasets on the southern slope of central Himalaya. Atmos. Res. 2021, 250, 105365. [Google Scholar] [CrossRef]
- Xu, J.; Ma, Z.; Yan, S.; Peng, J. Do ERA5 and ERA5-land precipitation estimates outperform satellite-based precipitation products? A comprehensive comparison between state-of-the-art model-based and satellite-based precipitation products over mainland China. J. Hydrol. 2022, 605, 127353. [Google Scholar] [CrossRef]
- Izadi, N.; Karakani, E.G.; Saadatabadi, A.R.; Shamsipour, A.; Fattahi, E.; Habibi, M. Evaluation of ERA5 Precipitation Accuracy Based on Various Time Scales over Iran during 2000–2018. Water 2021, 13, 2538. [Google Scholar] [CrossRef]
- Tang, G.Q.; Behrangi, A.; Long, D.; Li, C.M.; Hong, Y. Accounting for spatiotemporal errors of gauges: A critical step to evaluate gridded precipitation products. J. Hydrol. 2018, 559, 294–306. [Google Scholar] [CrossRef]
- Wang, X.J.; Pang, G.J.; Yang, M.X.; Zhao, G.H. Evaluation of climate on the Tibetan Plateau using ERA-Interim reanalysis and gridded observations during the period 1979–2012. Quat. Int. 2017, 444, 76–86. [Google Scholar] [CrossRef]
- Tarek, M.; Brissette, F.P.; Arsenault, R. Evaluation of the ERA5 reanalysis as a potential reference dataset for hydrological modelling over North America. Hydrol. Earth Syst. Sci. 2020, 24, 2527–2544. [Google Scholar] [CrossRef]
- Dahri, Z.H.; Moors, E.; Ludwig, F.; Ahmad, S.; Khan, A.; Ali, I.; Kabat, P. Adjustment of measurement errors to reconcile precipitation distribution in the high-altitude Indus basin. Int. J. Climatol. 2018, 38, 3842–3860. [Google Scholar] [CrossRef]
- Song, Y.; Broxton, P.D.; Ehsani, M.R.; Behrangi, A. Assessment of Snowfall Accumulation from Satellite and Reanalysis Products Using SNOTEL Observations in Alaska. Remote Sens. 2021, 13, 2922. [Google Scholar] [CrossRef]
- Schleiss, M.; Olsson, J.; Berg, P.; Niemi, T.; Kokkonen, T.; Thorndahl, S.; Nielsen, R.; Ellerbæk Nielsen, J.; Bozhinova, D.; Pulkkinen, S. The accuracy of weather radar in heavy rain: A comparative study for Denmark, the Netherlands, Finland and Sweden. Hydrol. Earth Syst. Sci. 2020, 24, 3157–3188. [Google Scholar] [CrossRef]
- Zhao, P.; Gao, L.; Wei, J.; Ma, M.; Deng, H.; Gao, J.; Chen, X. Evaluation of ERA-Interim Air Temperature Data over the Qilian Mountains of China. Adv. Meteorol. 2020, 2020, 7353482. [Google Scholar] [CrossRef]
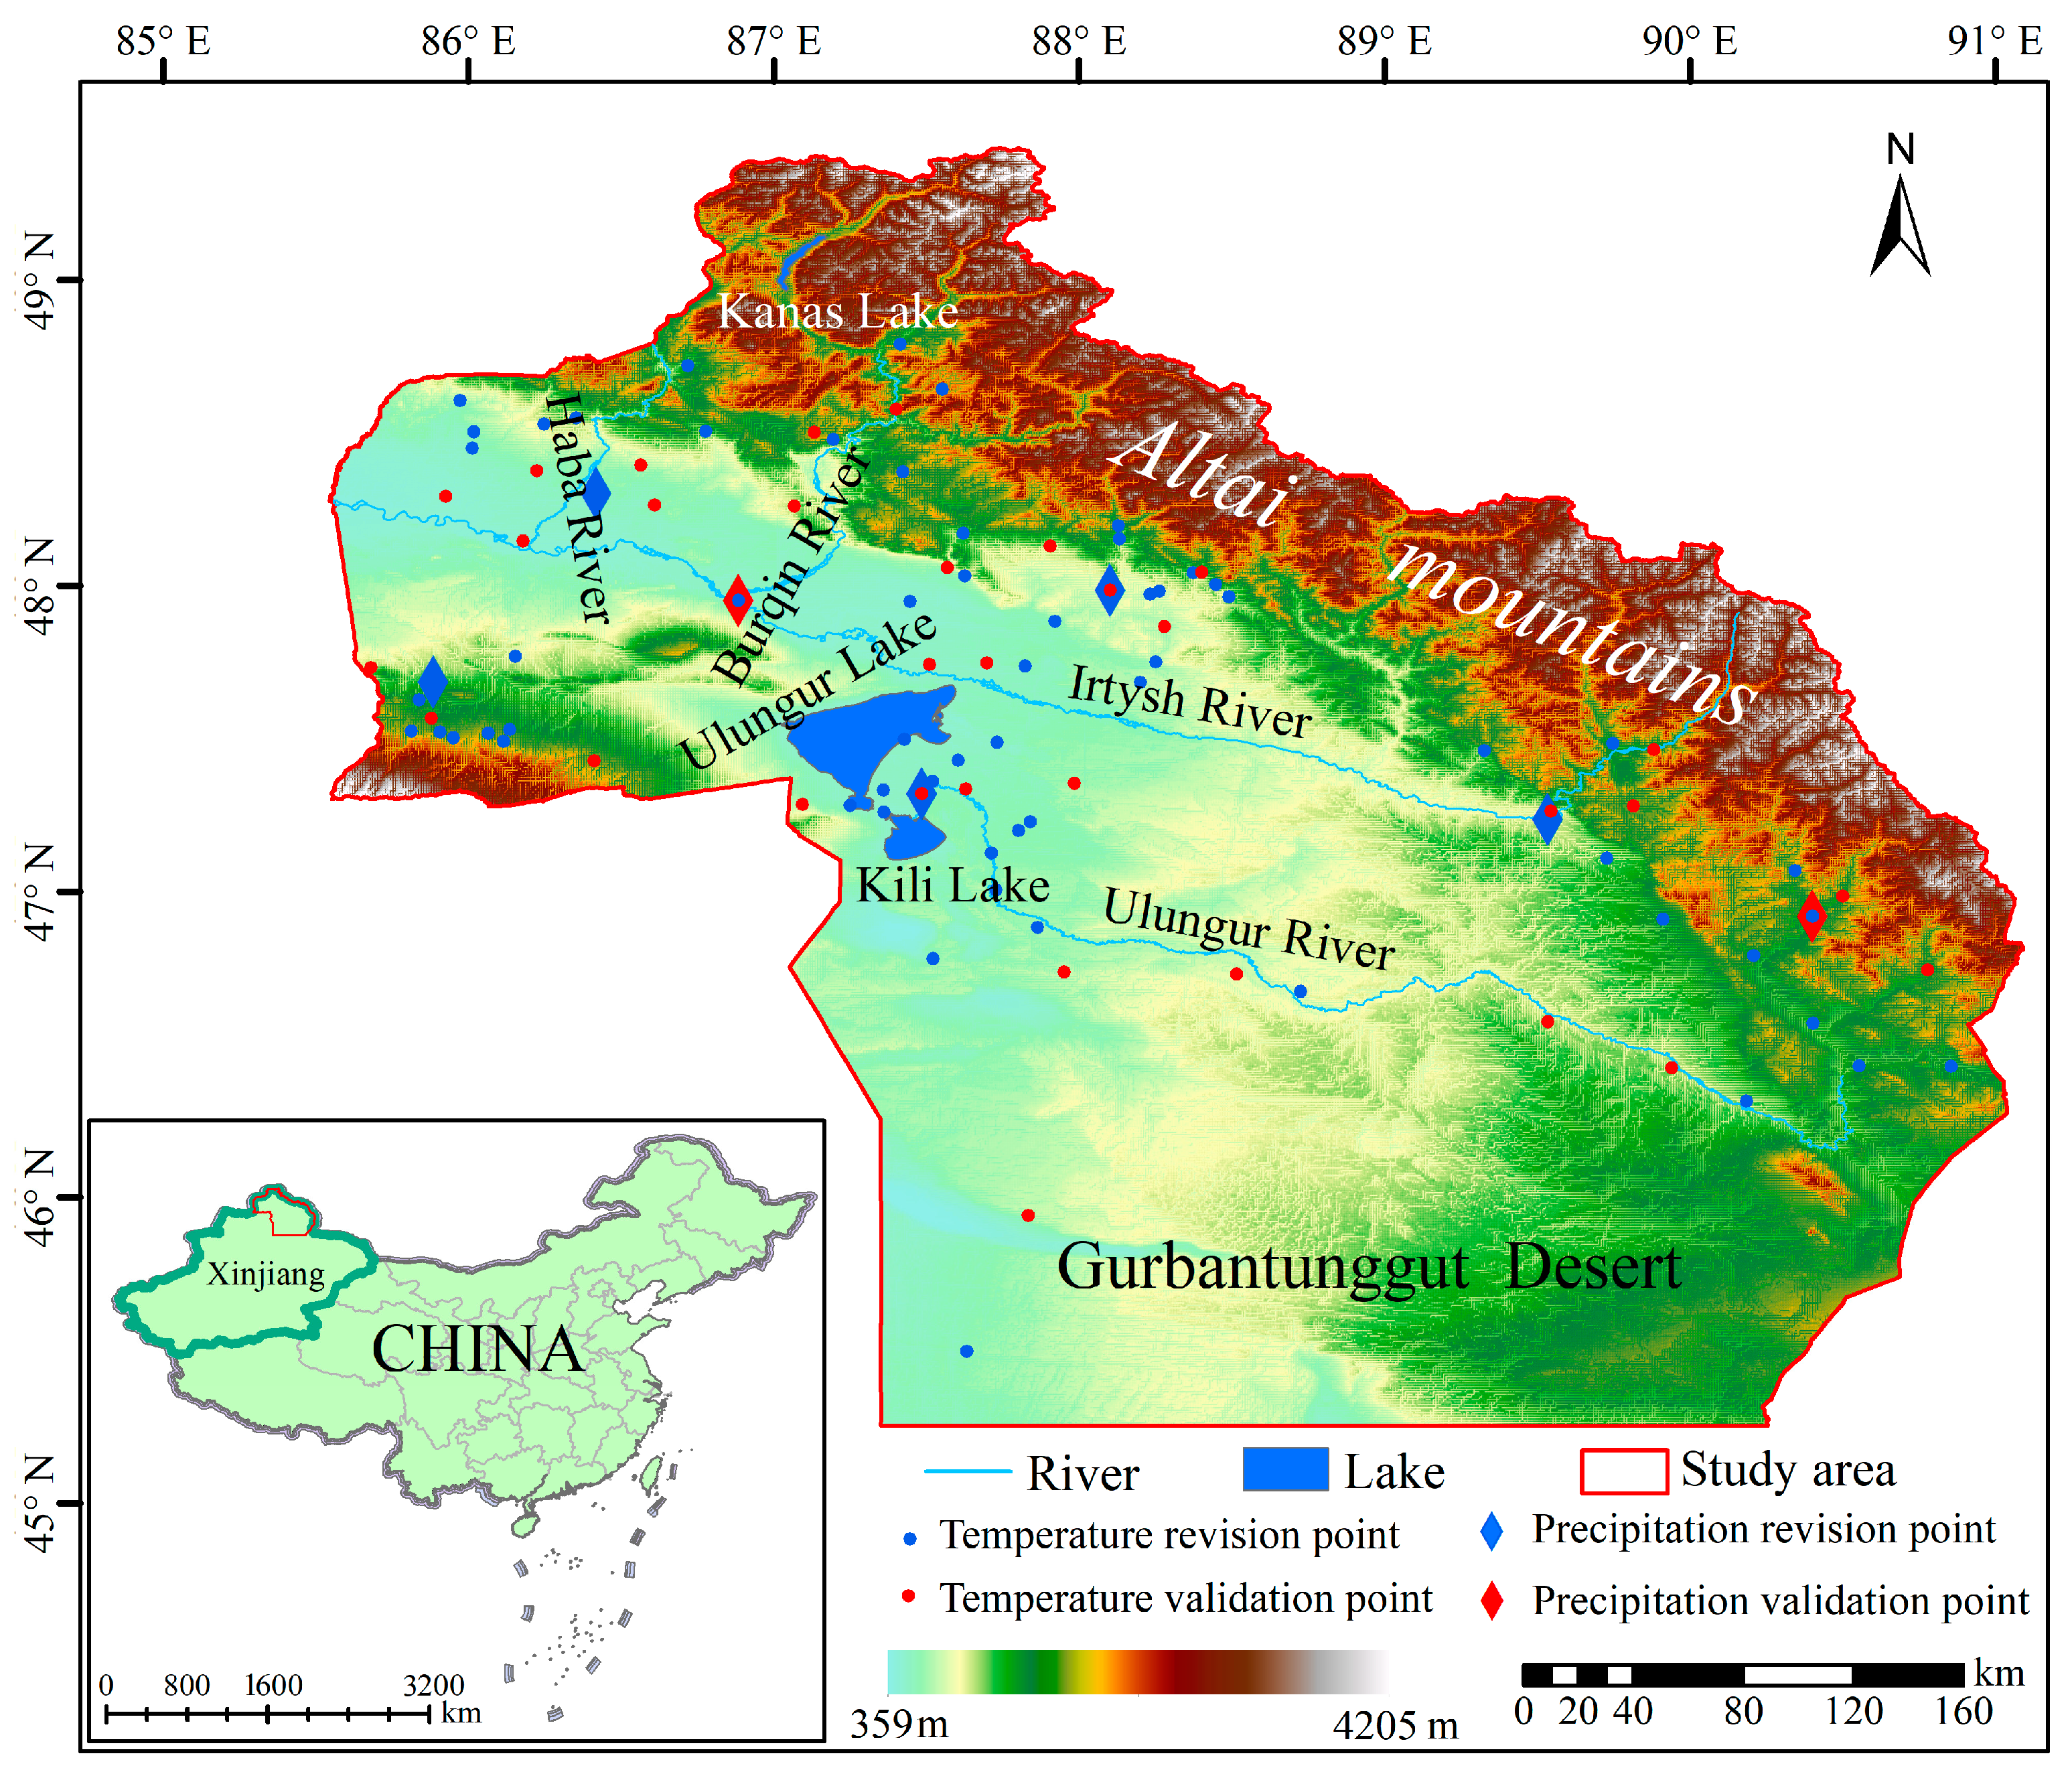
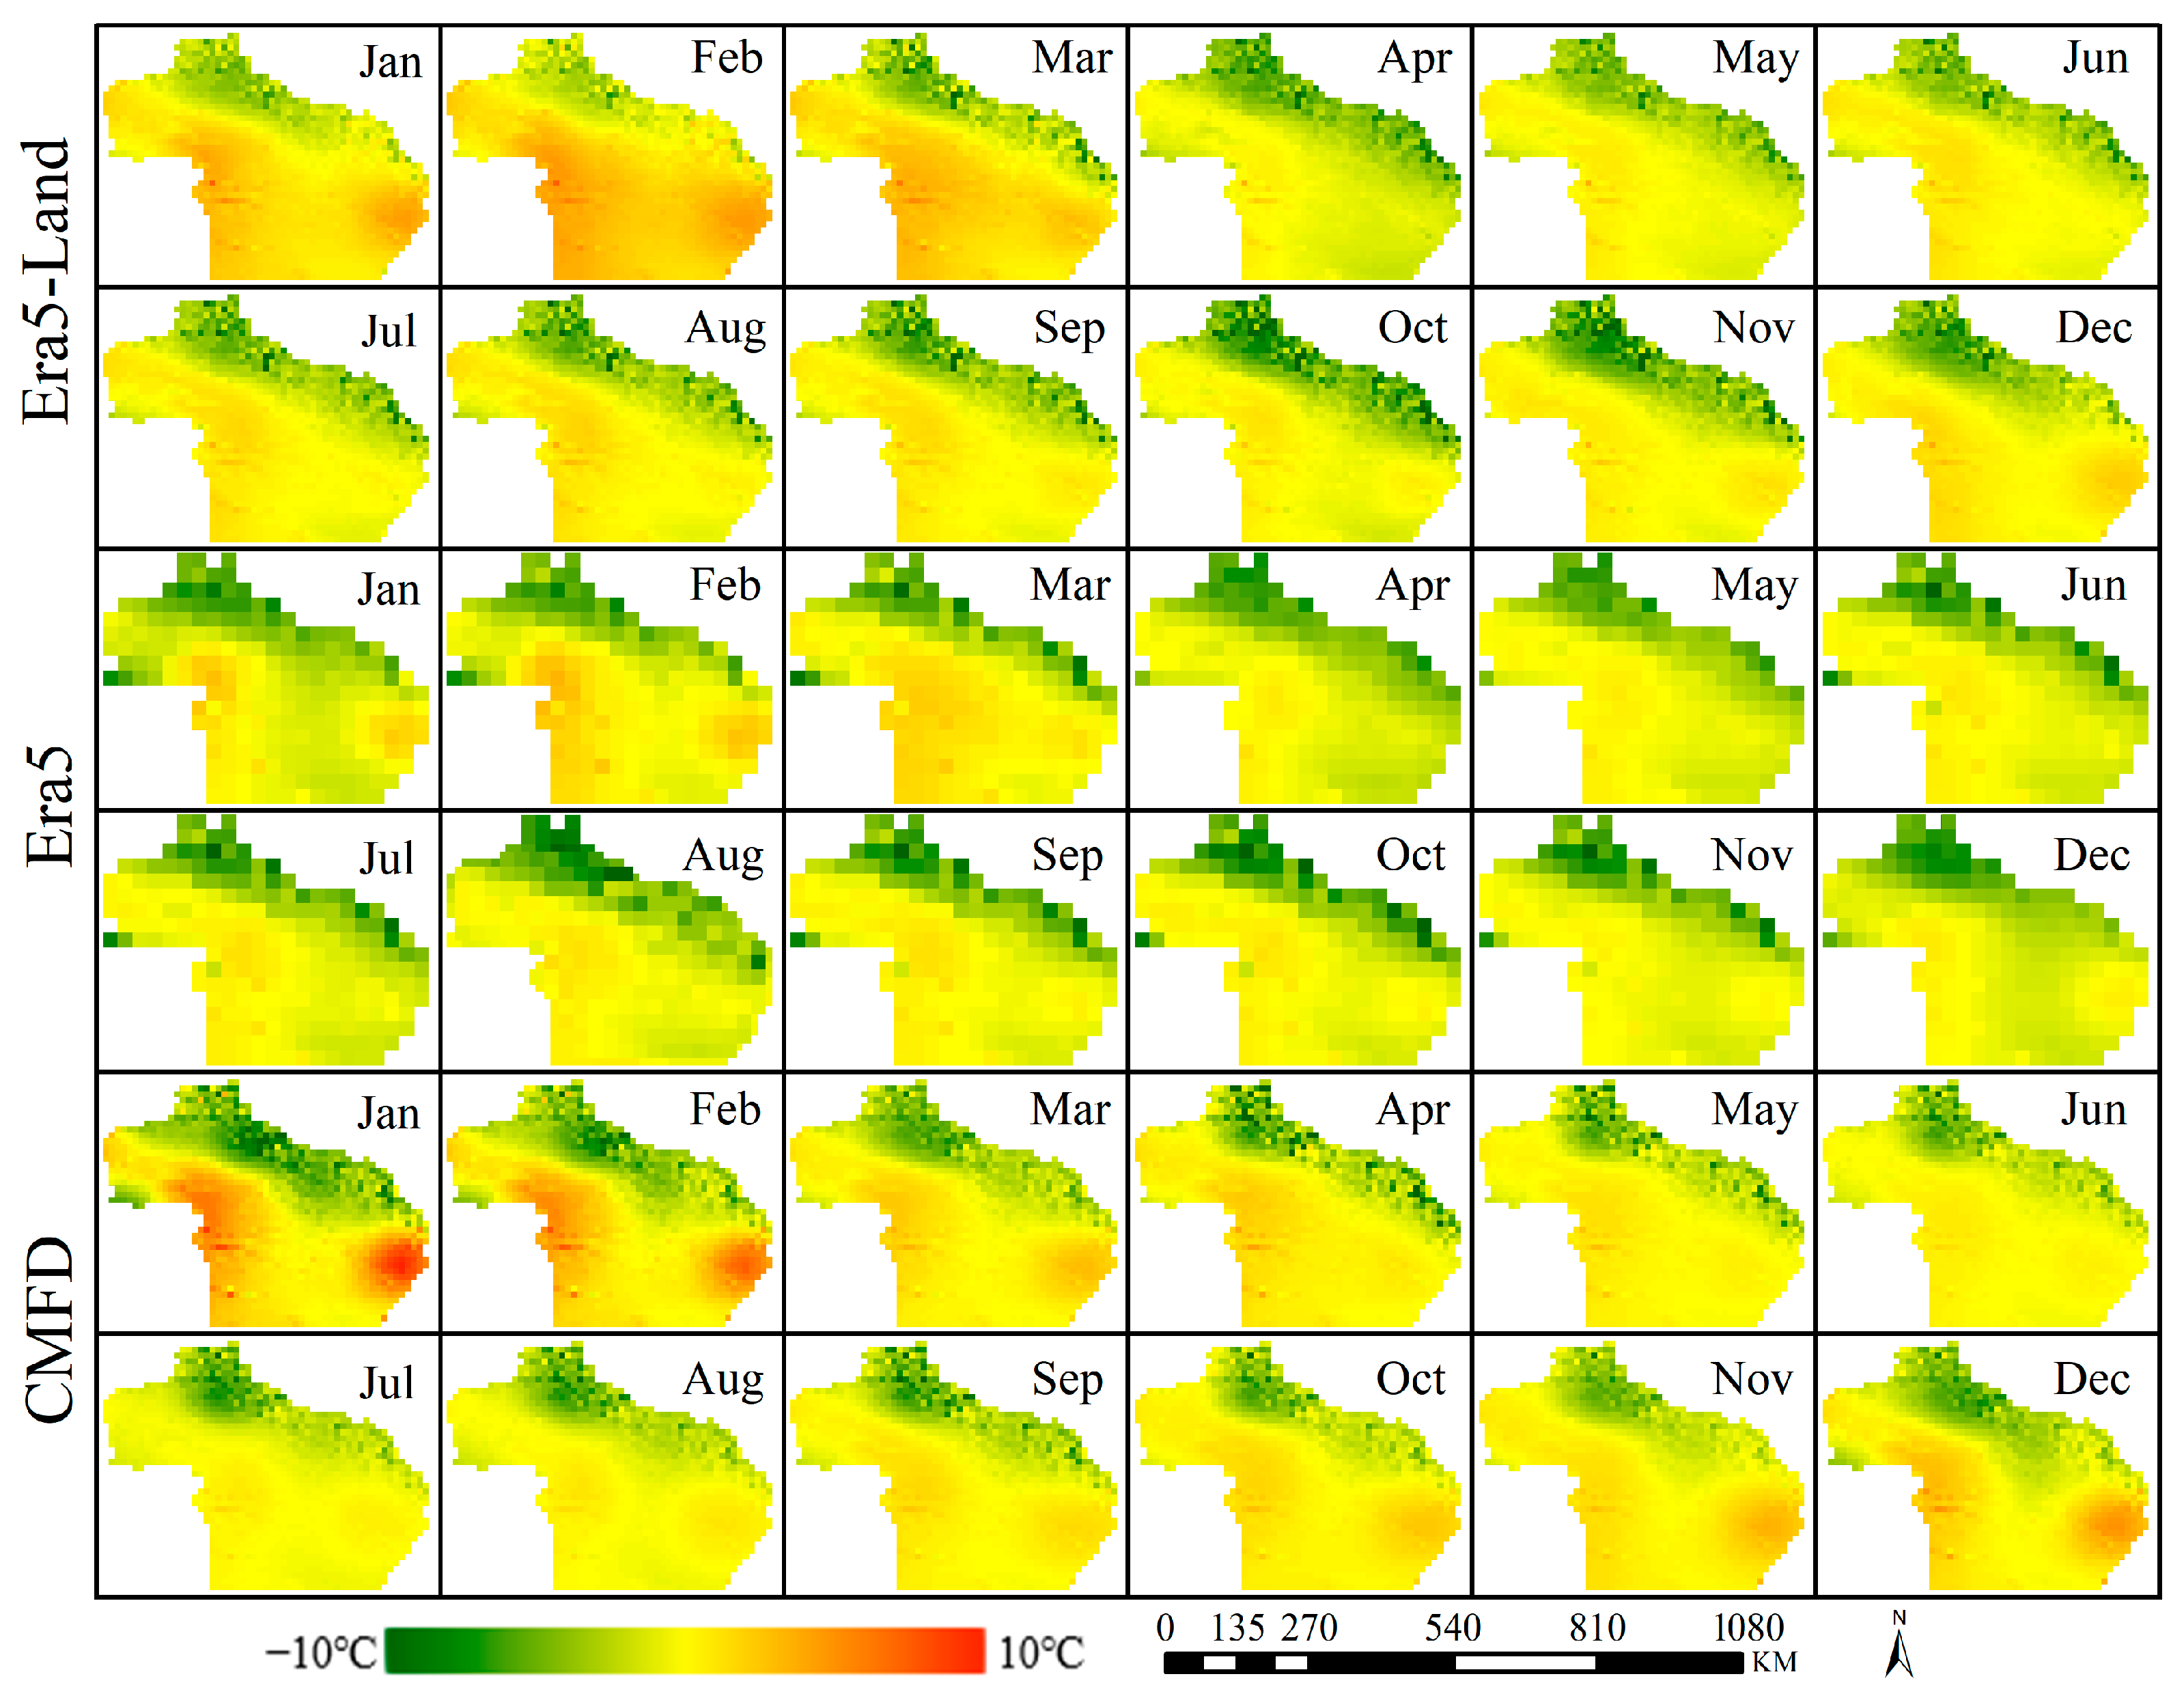
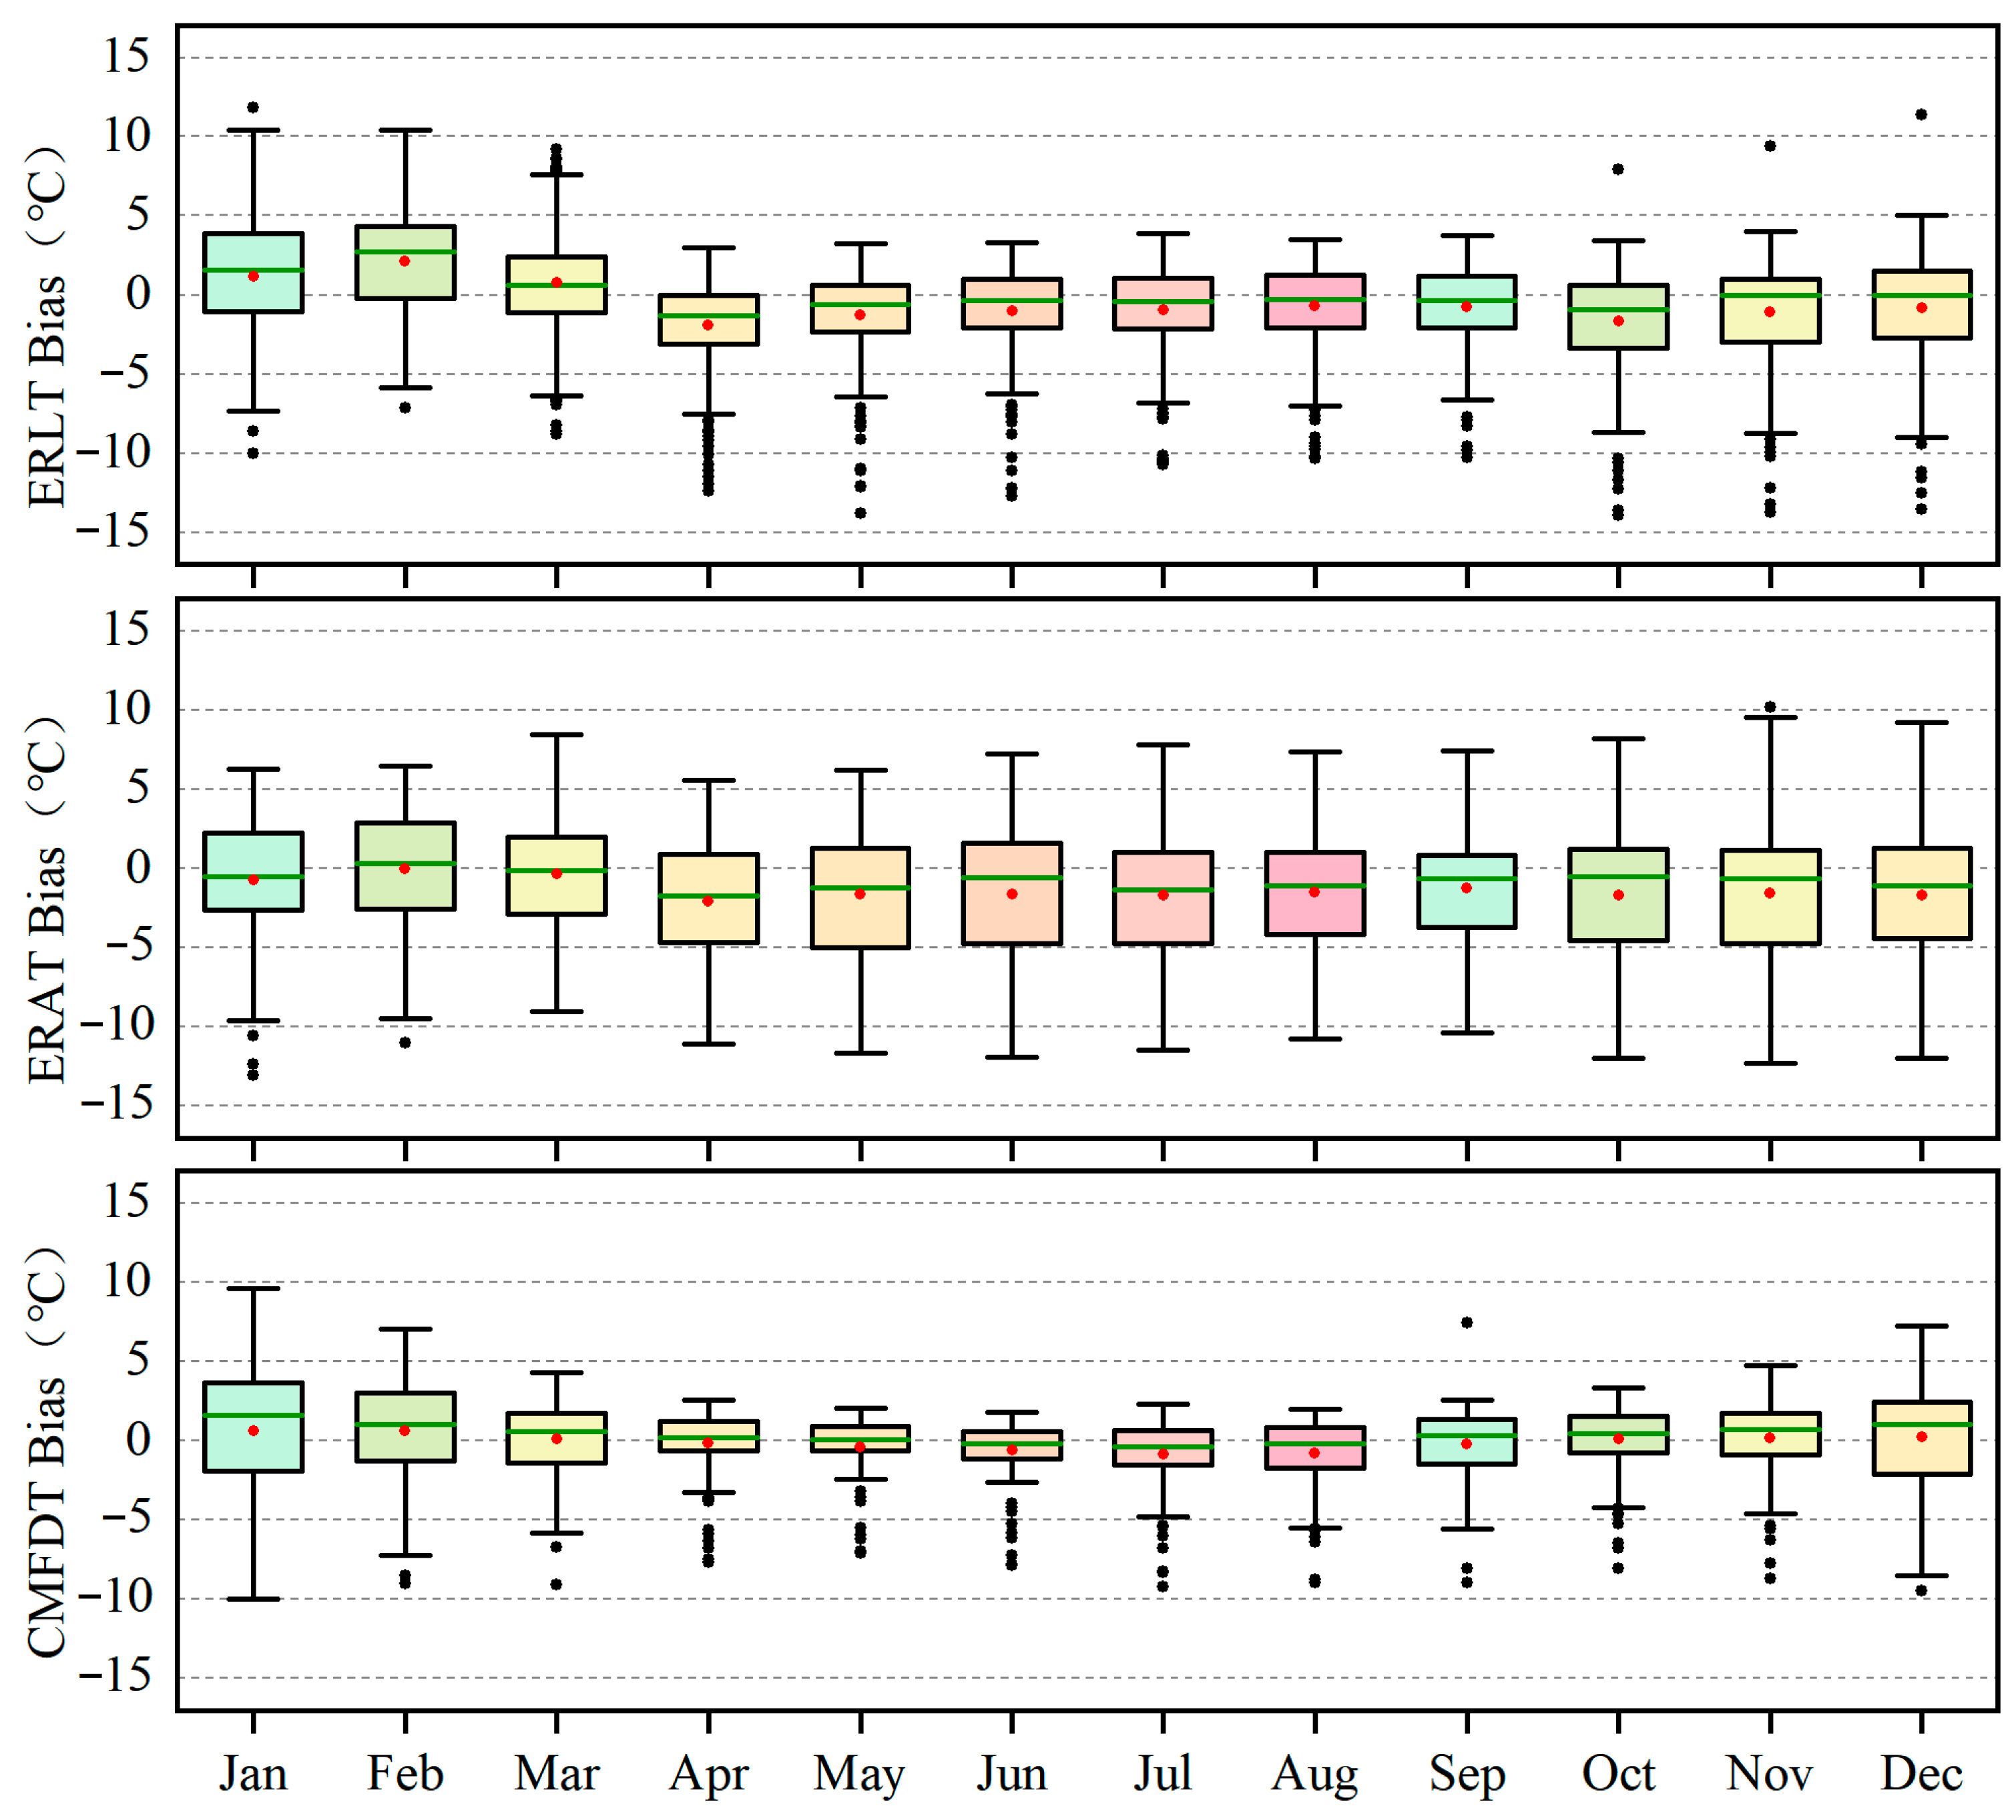
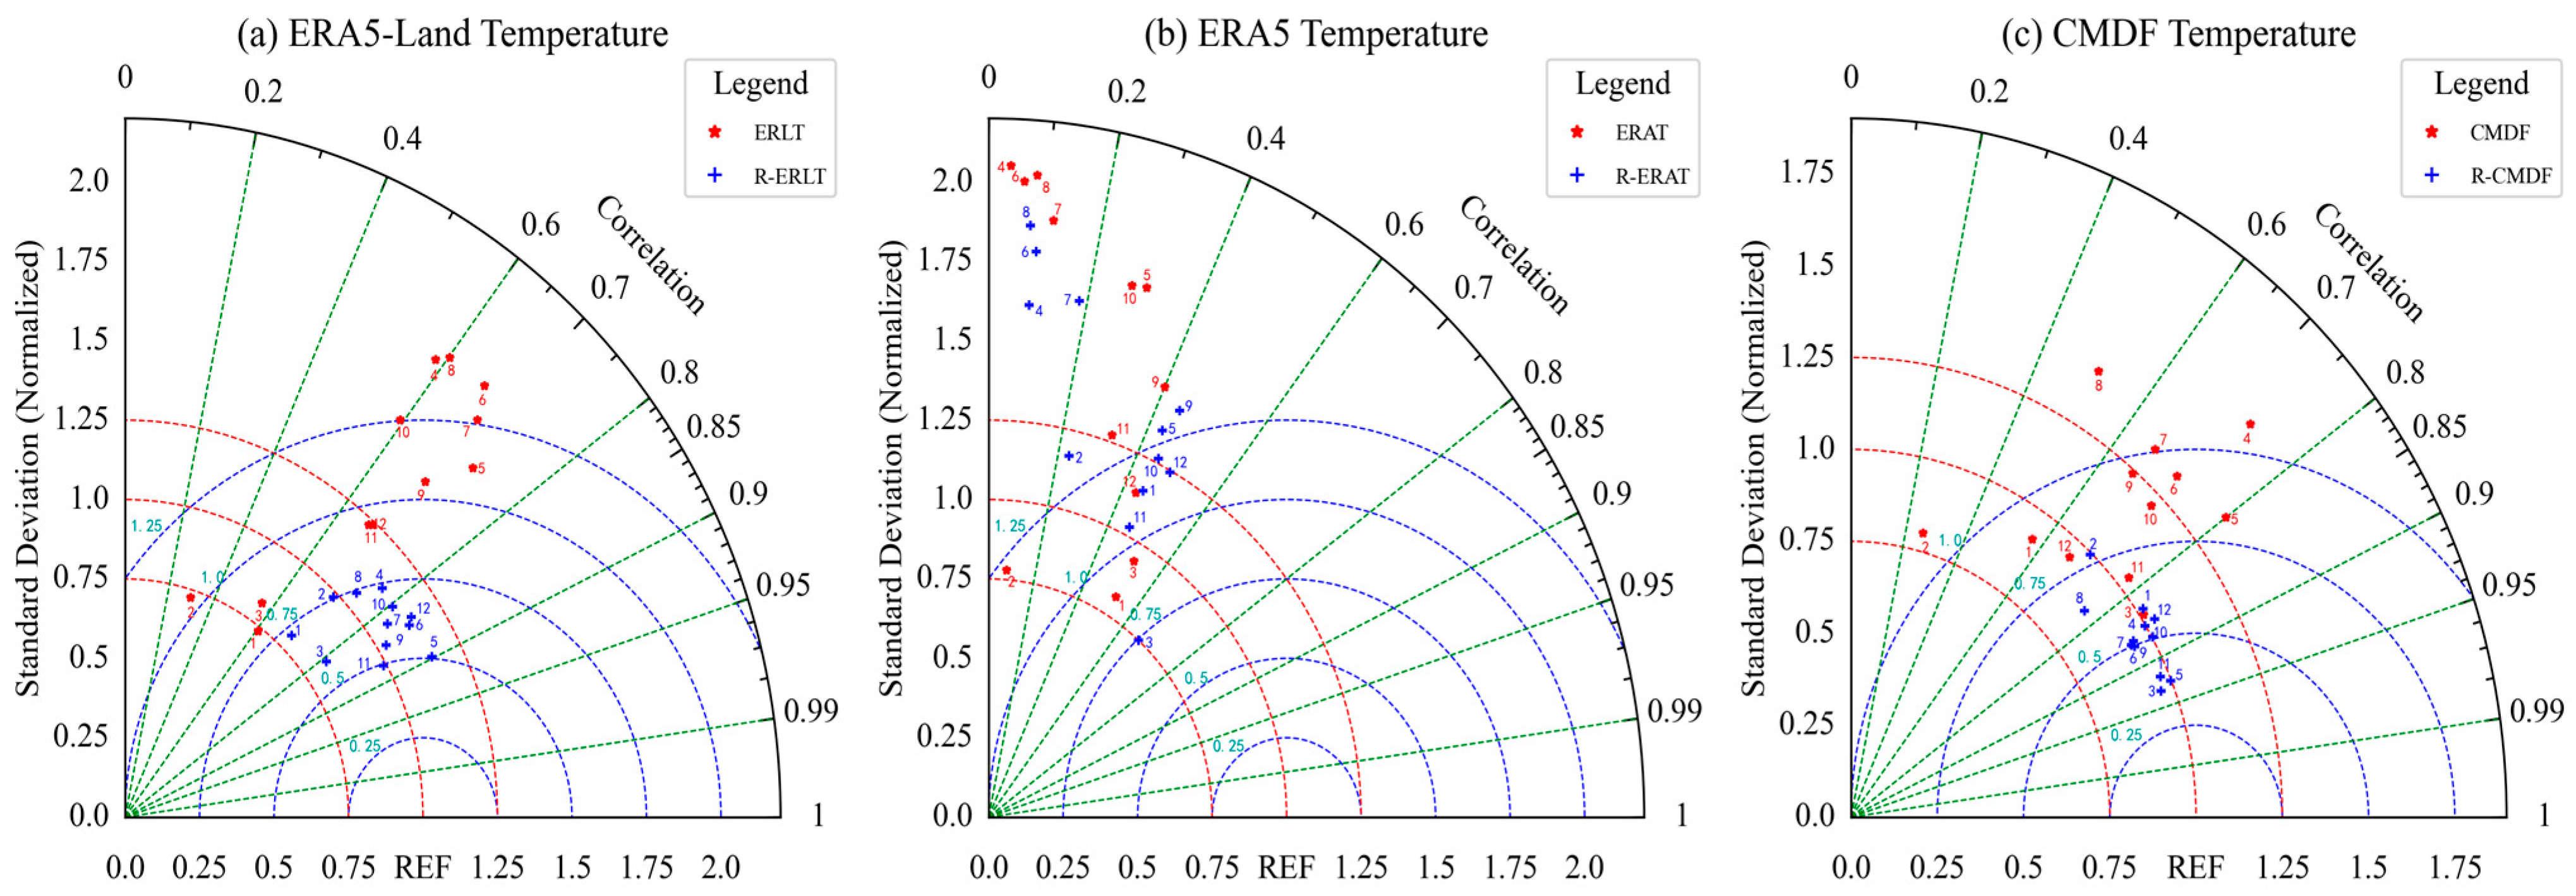
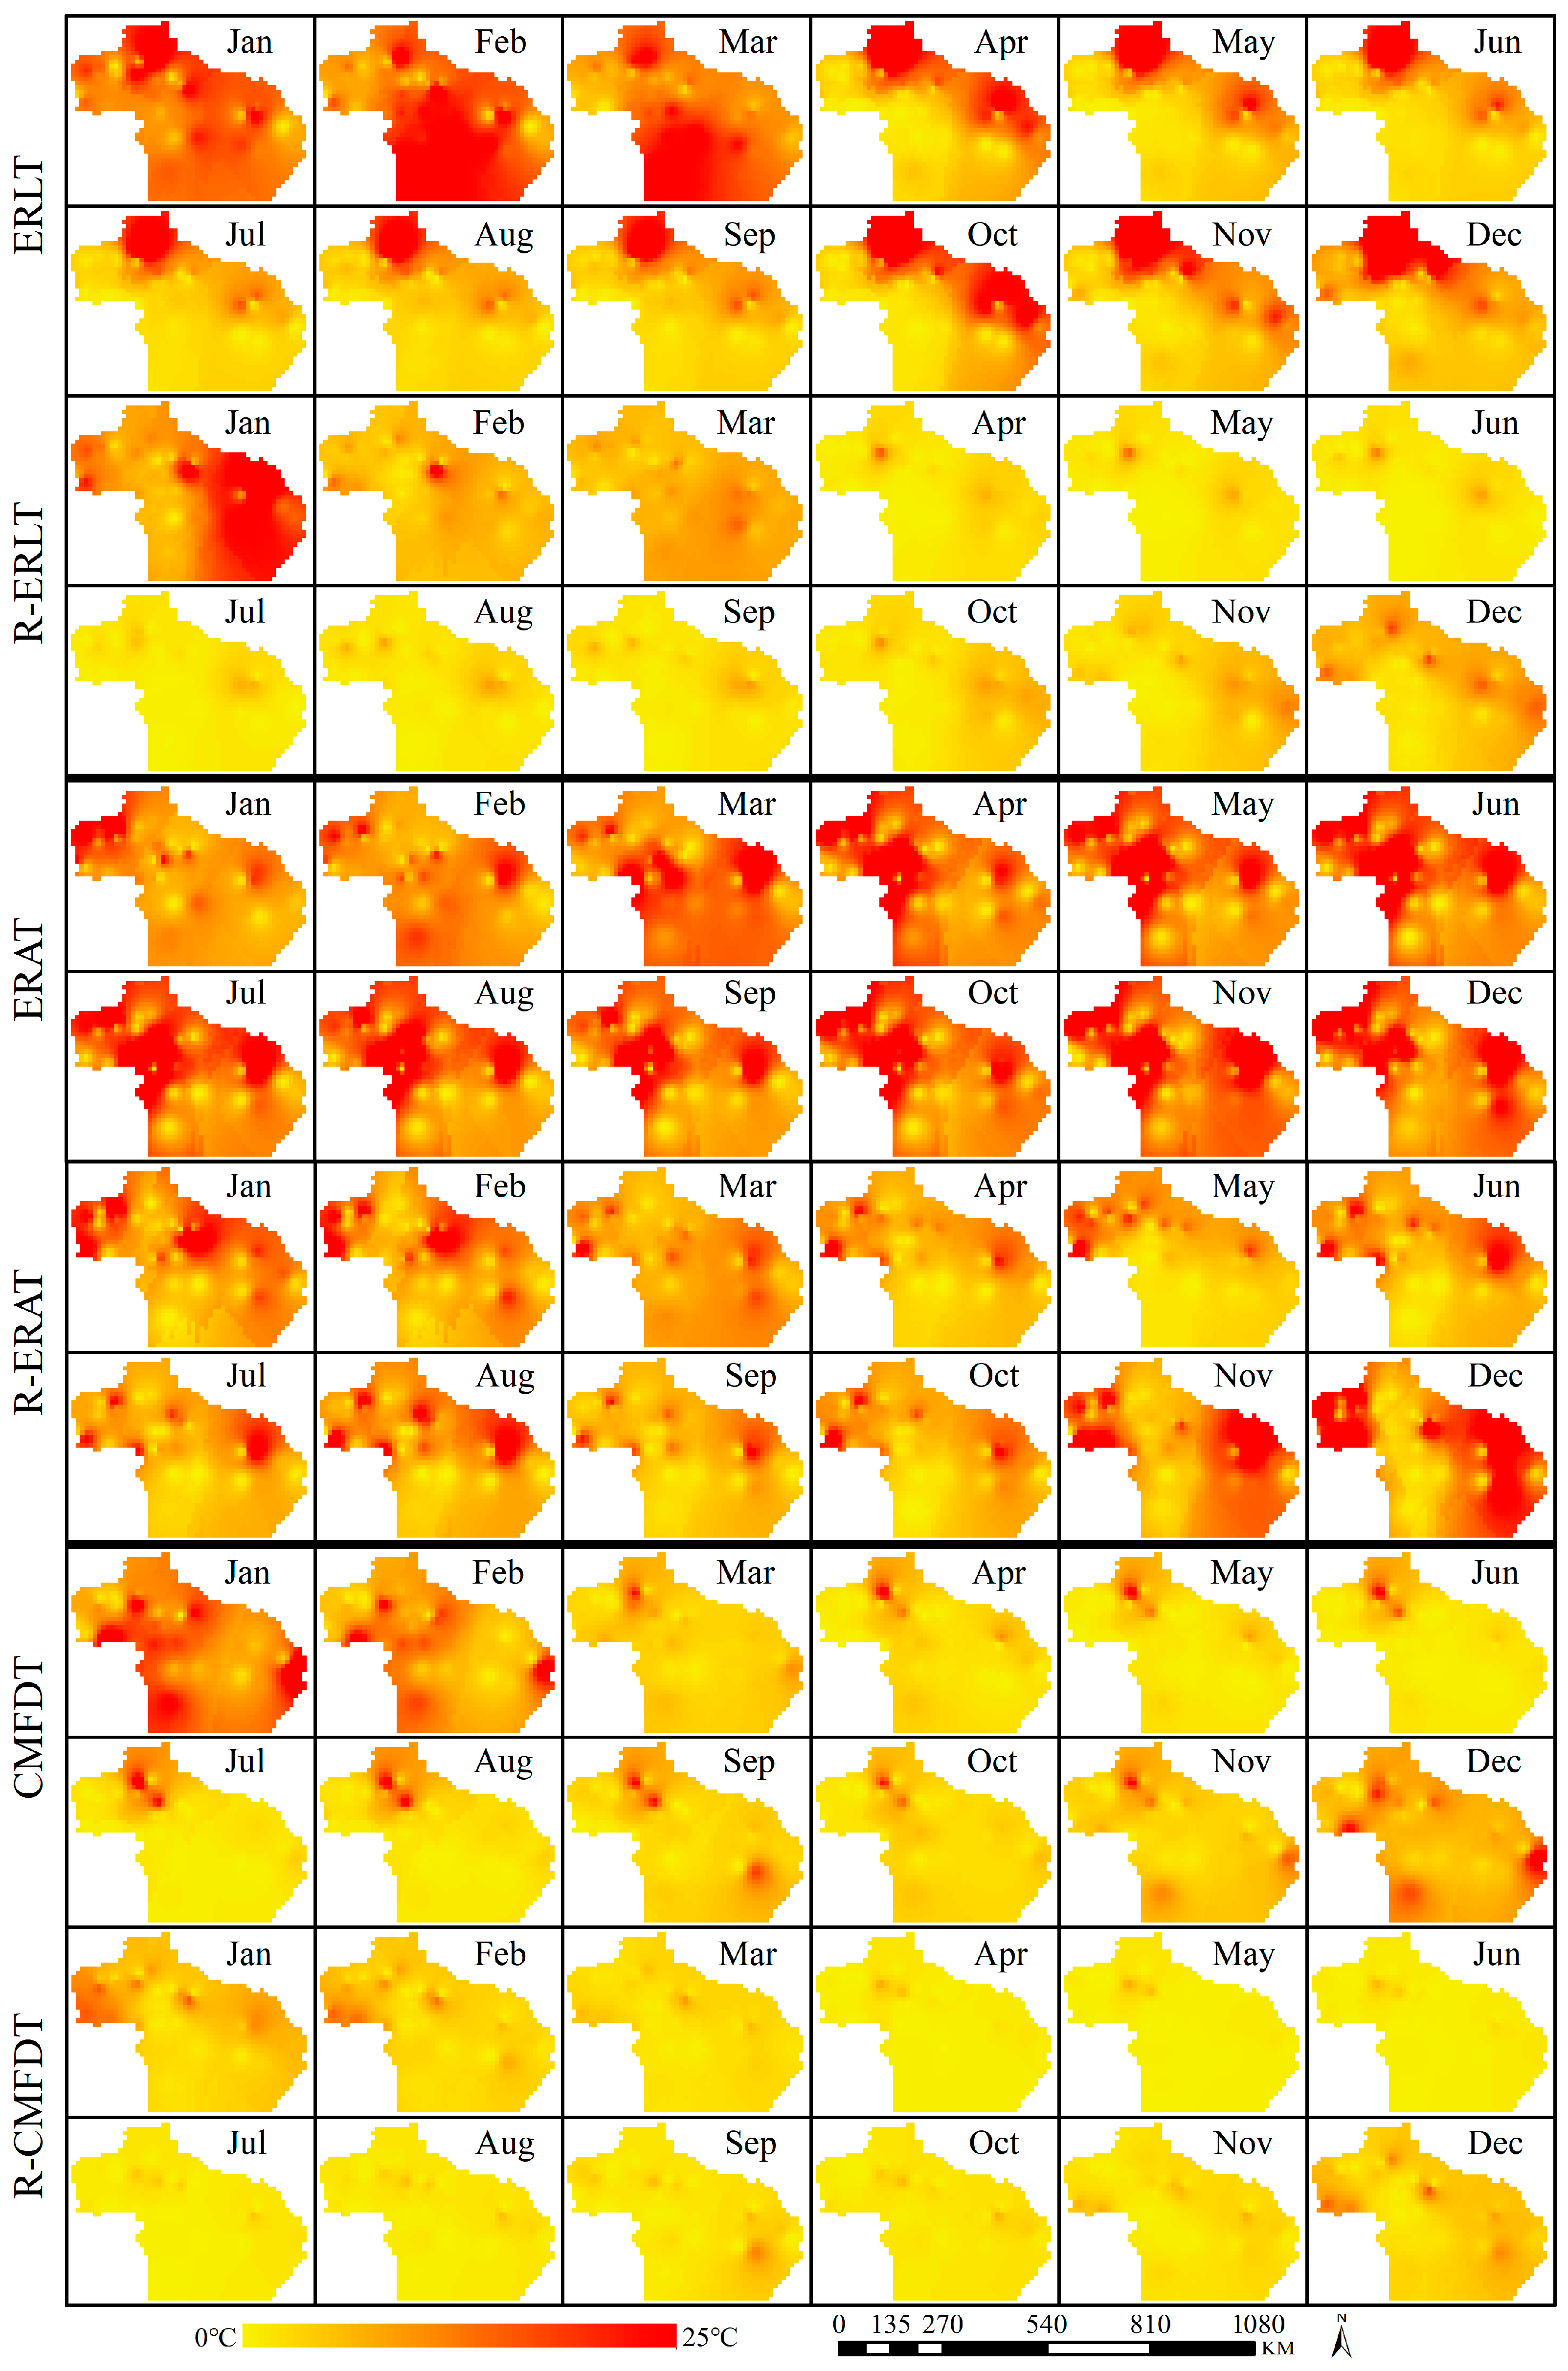
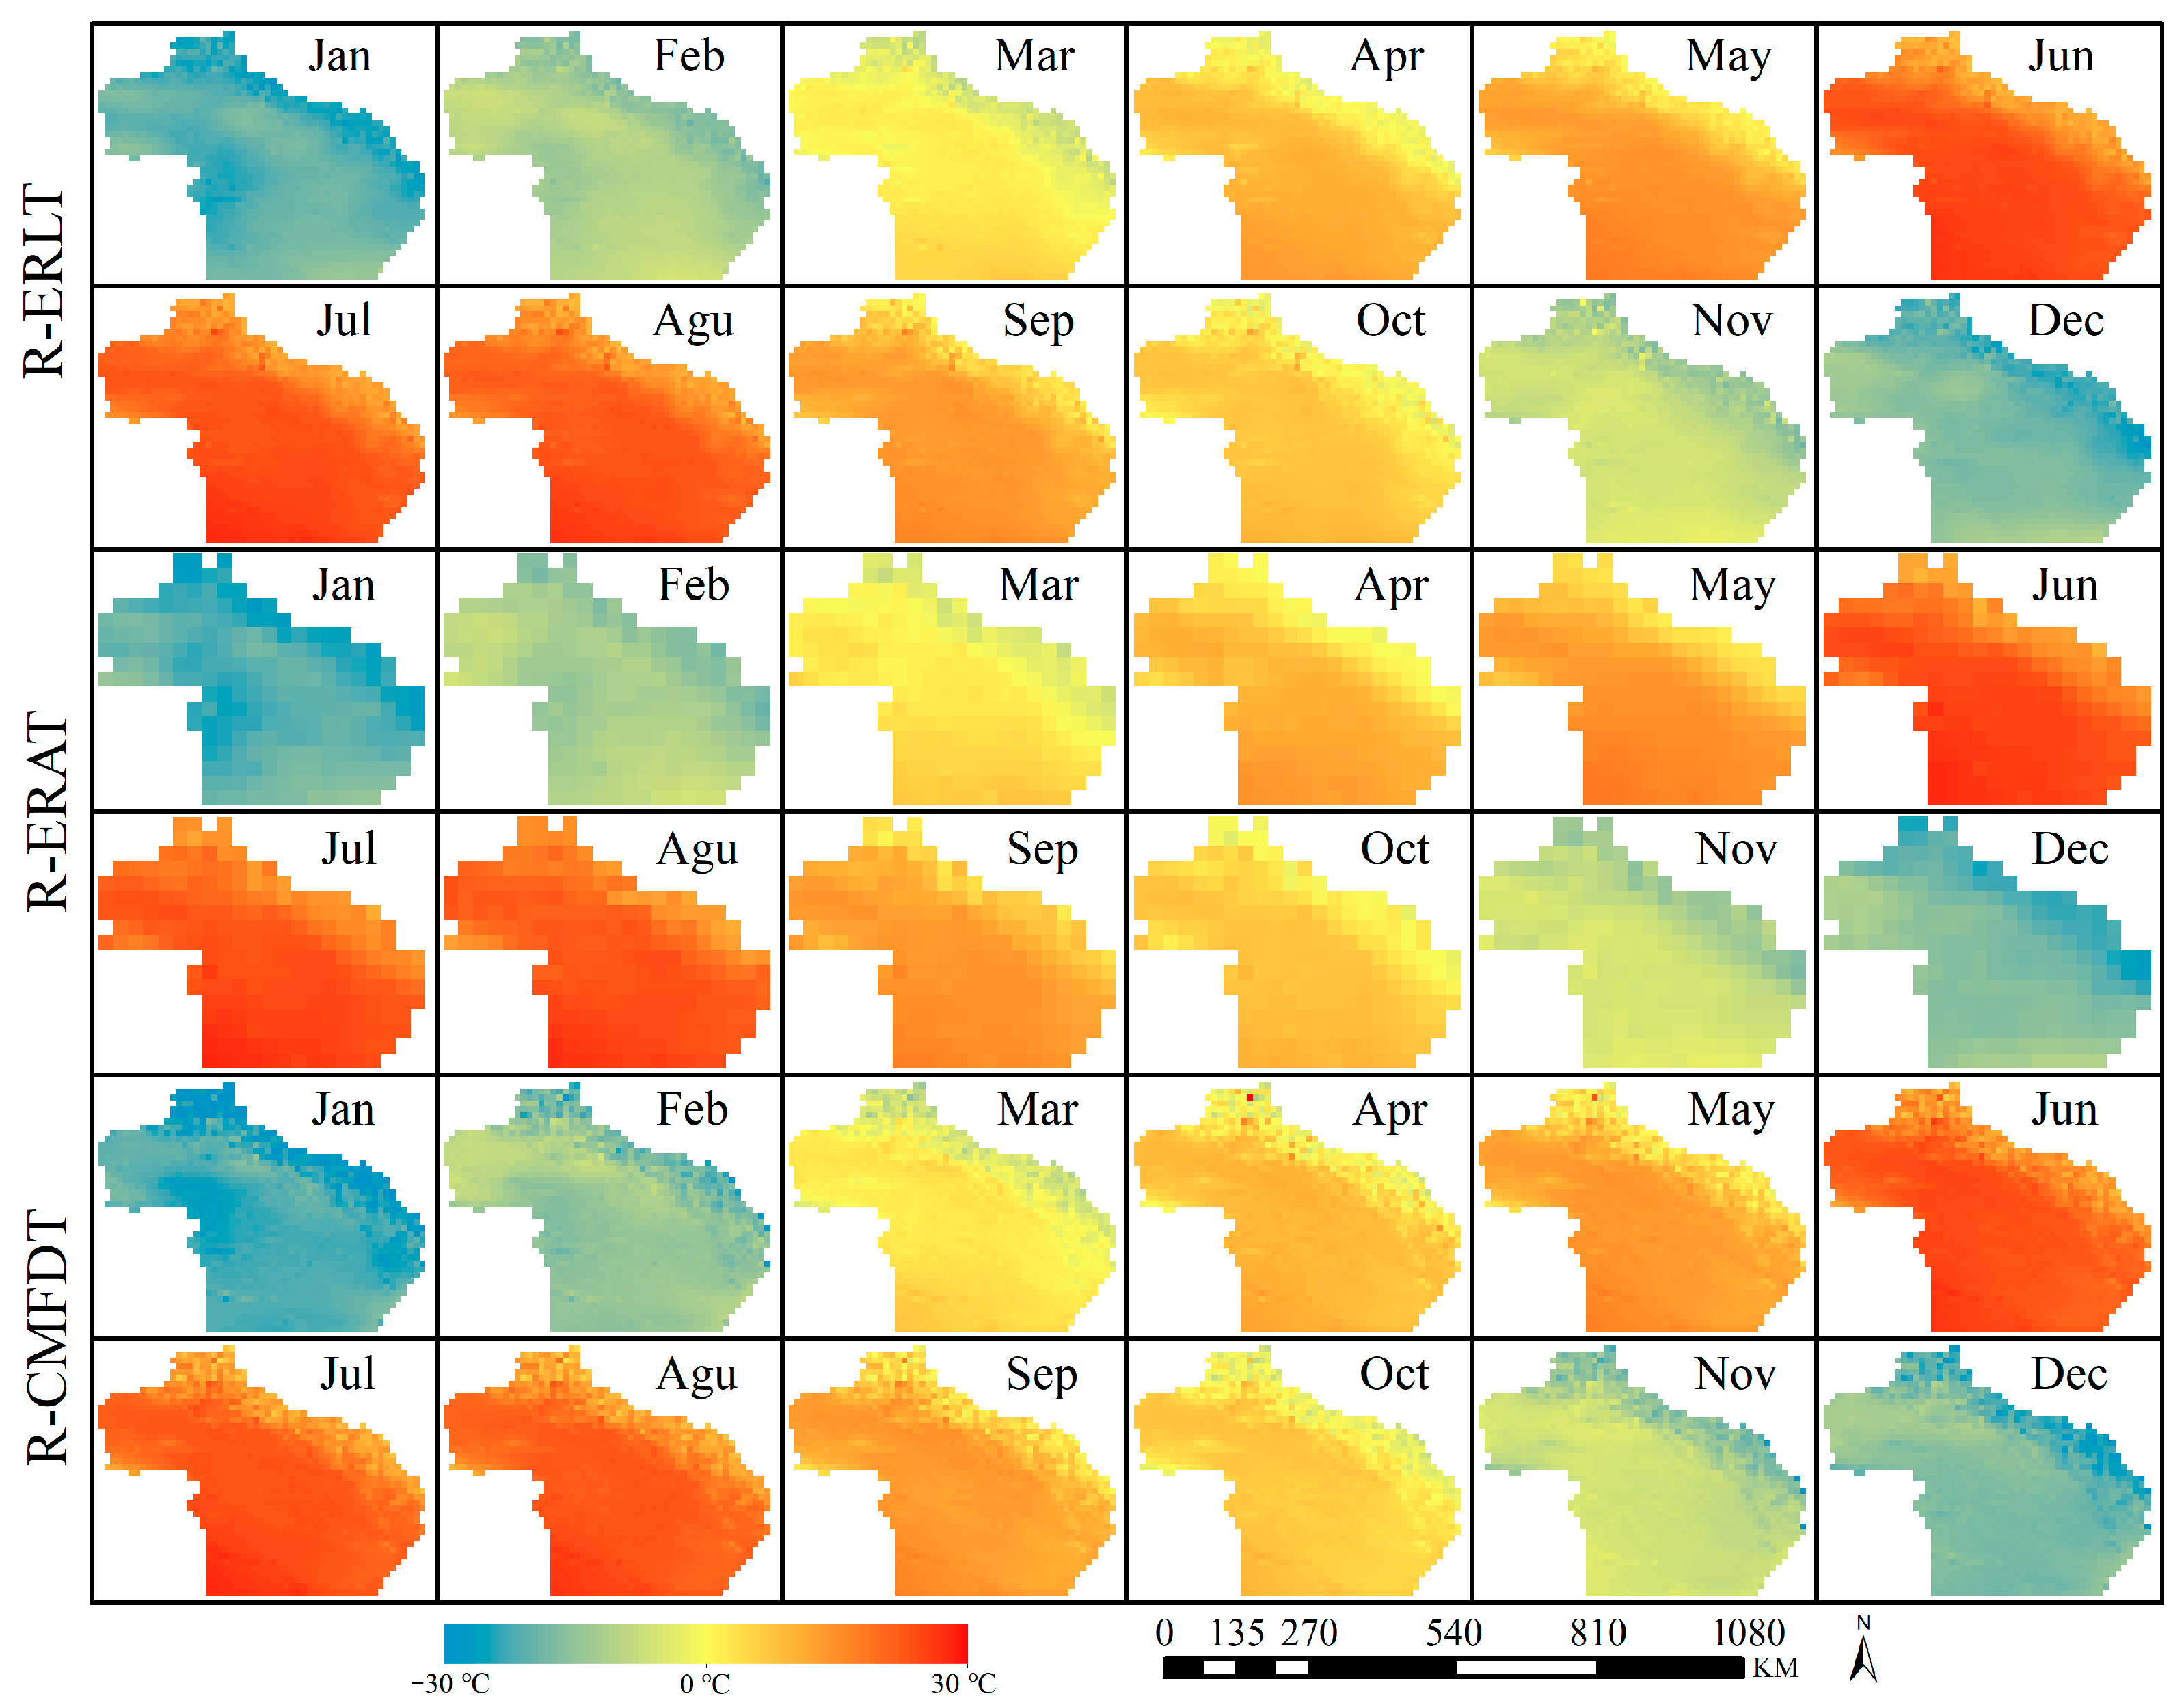
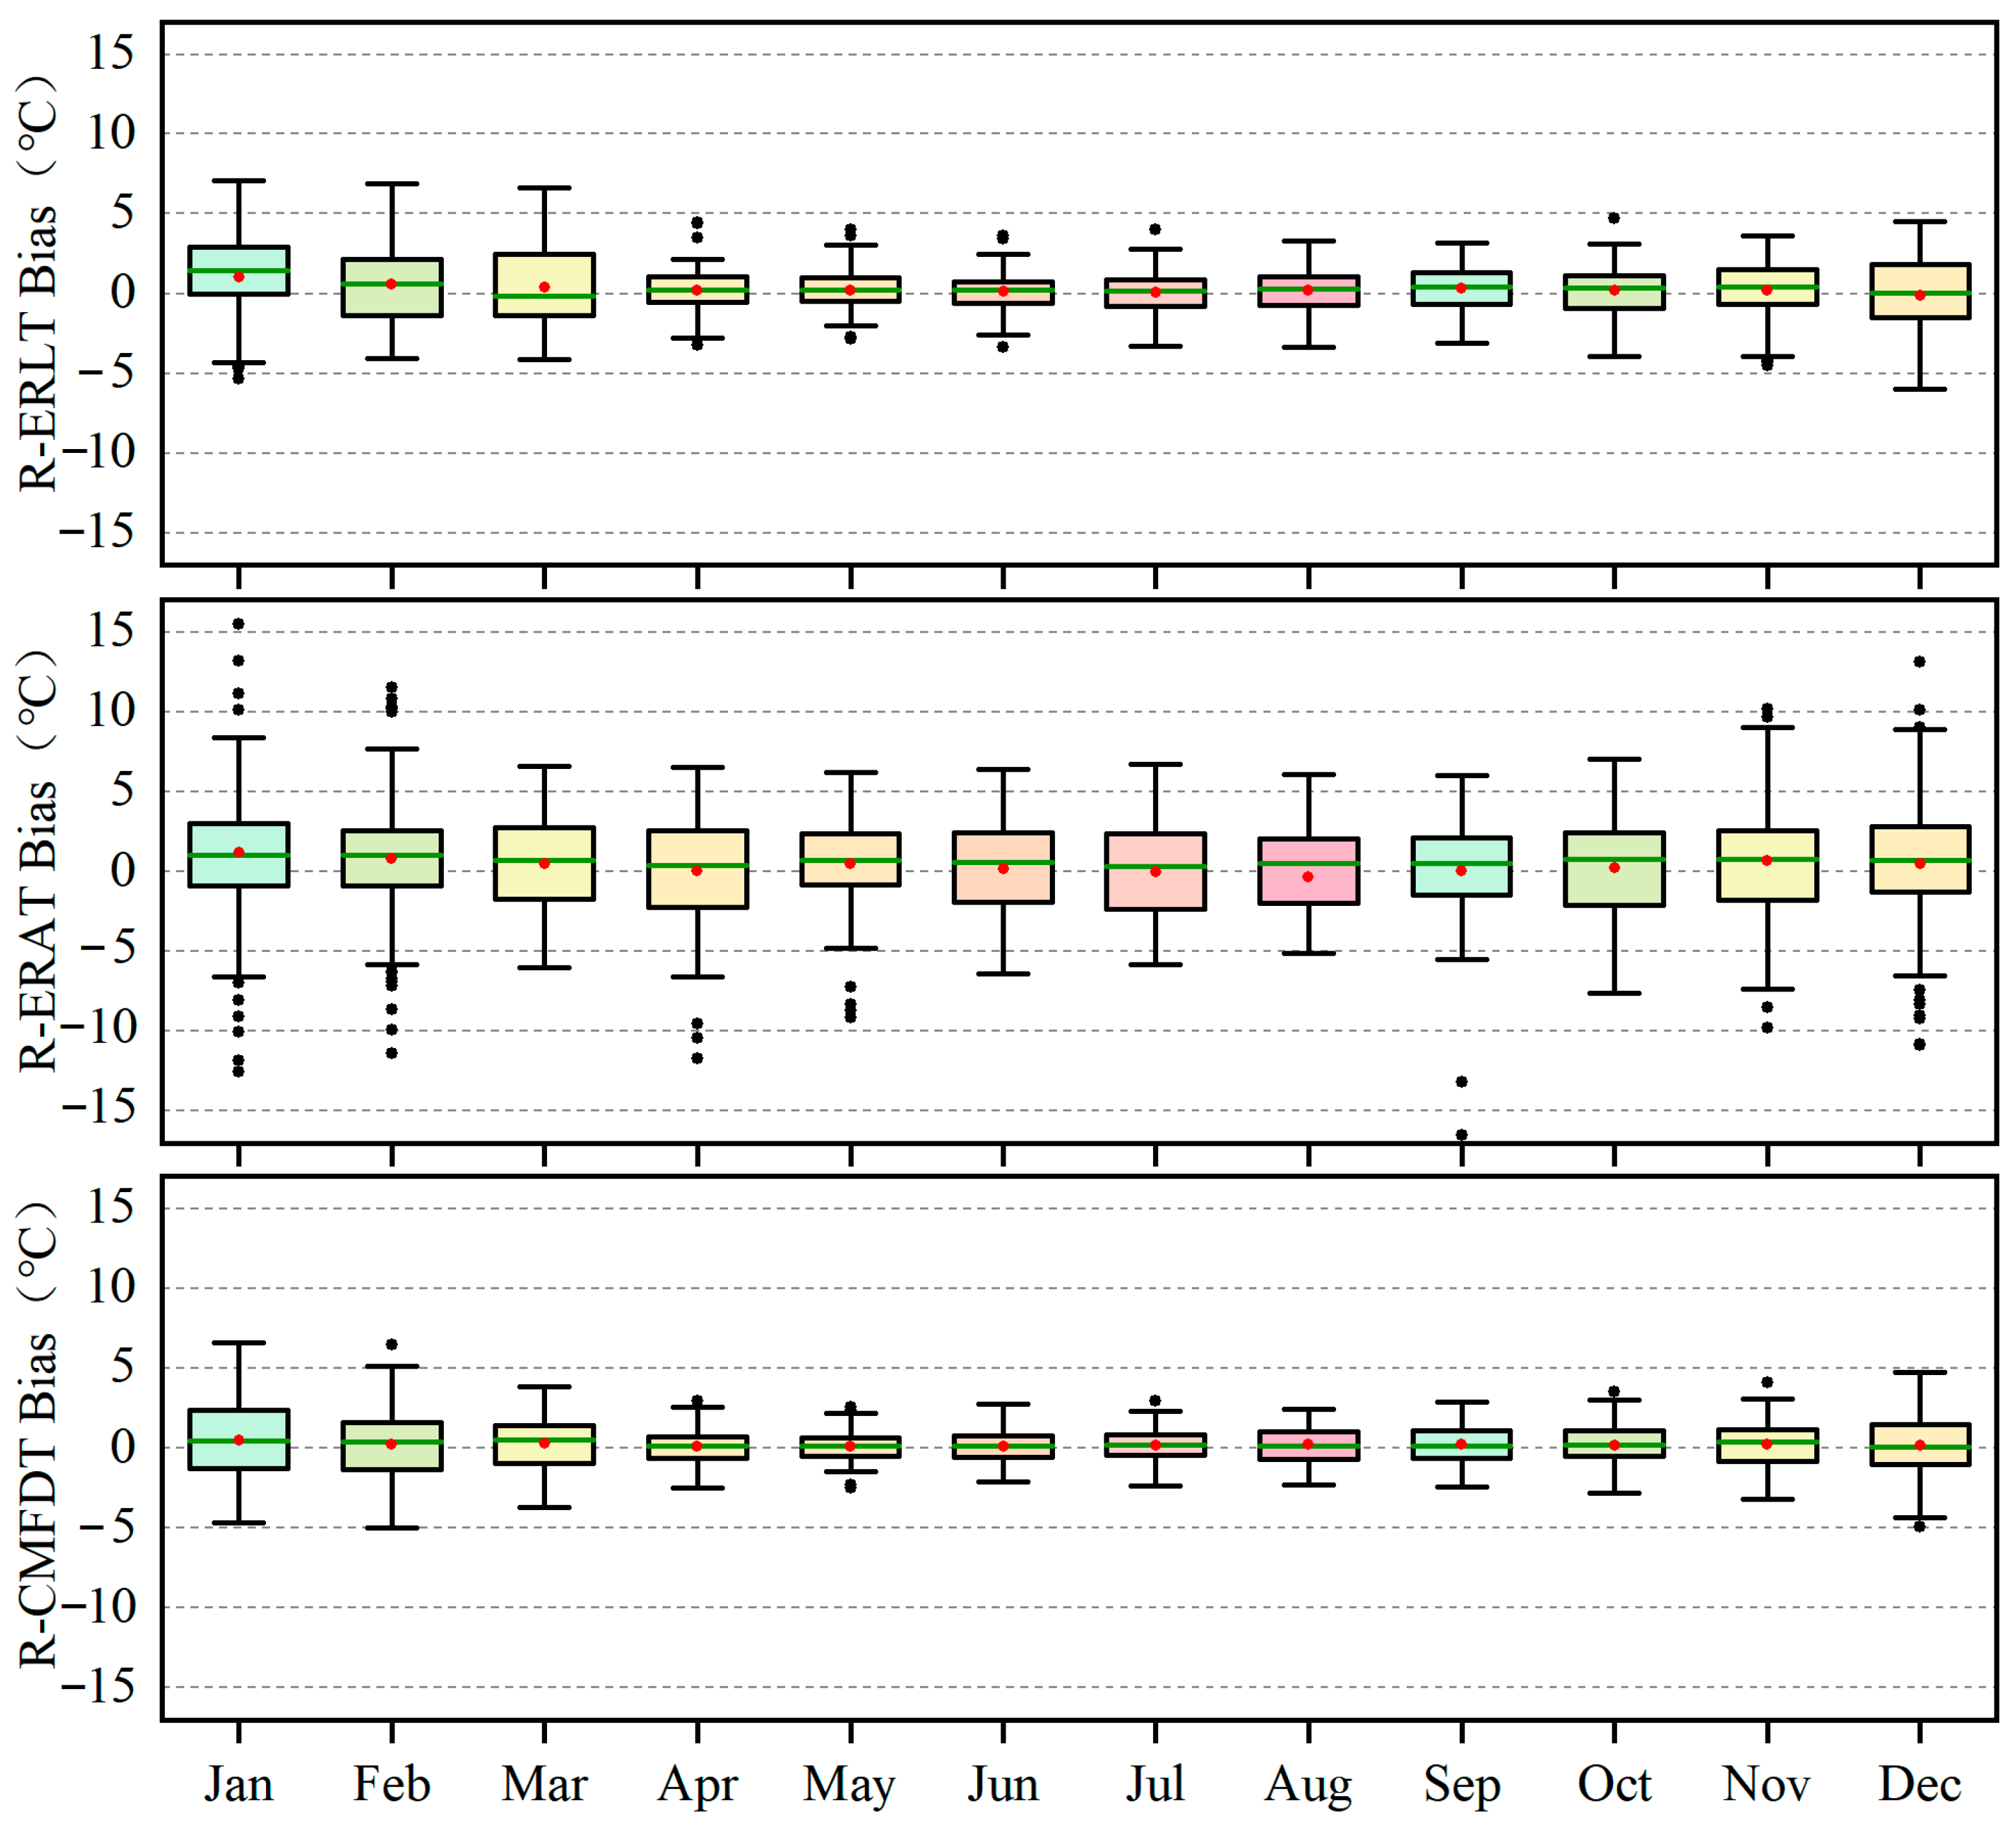
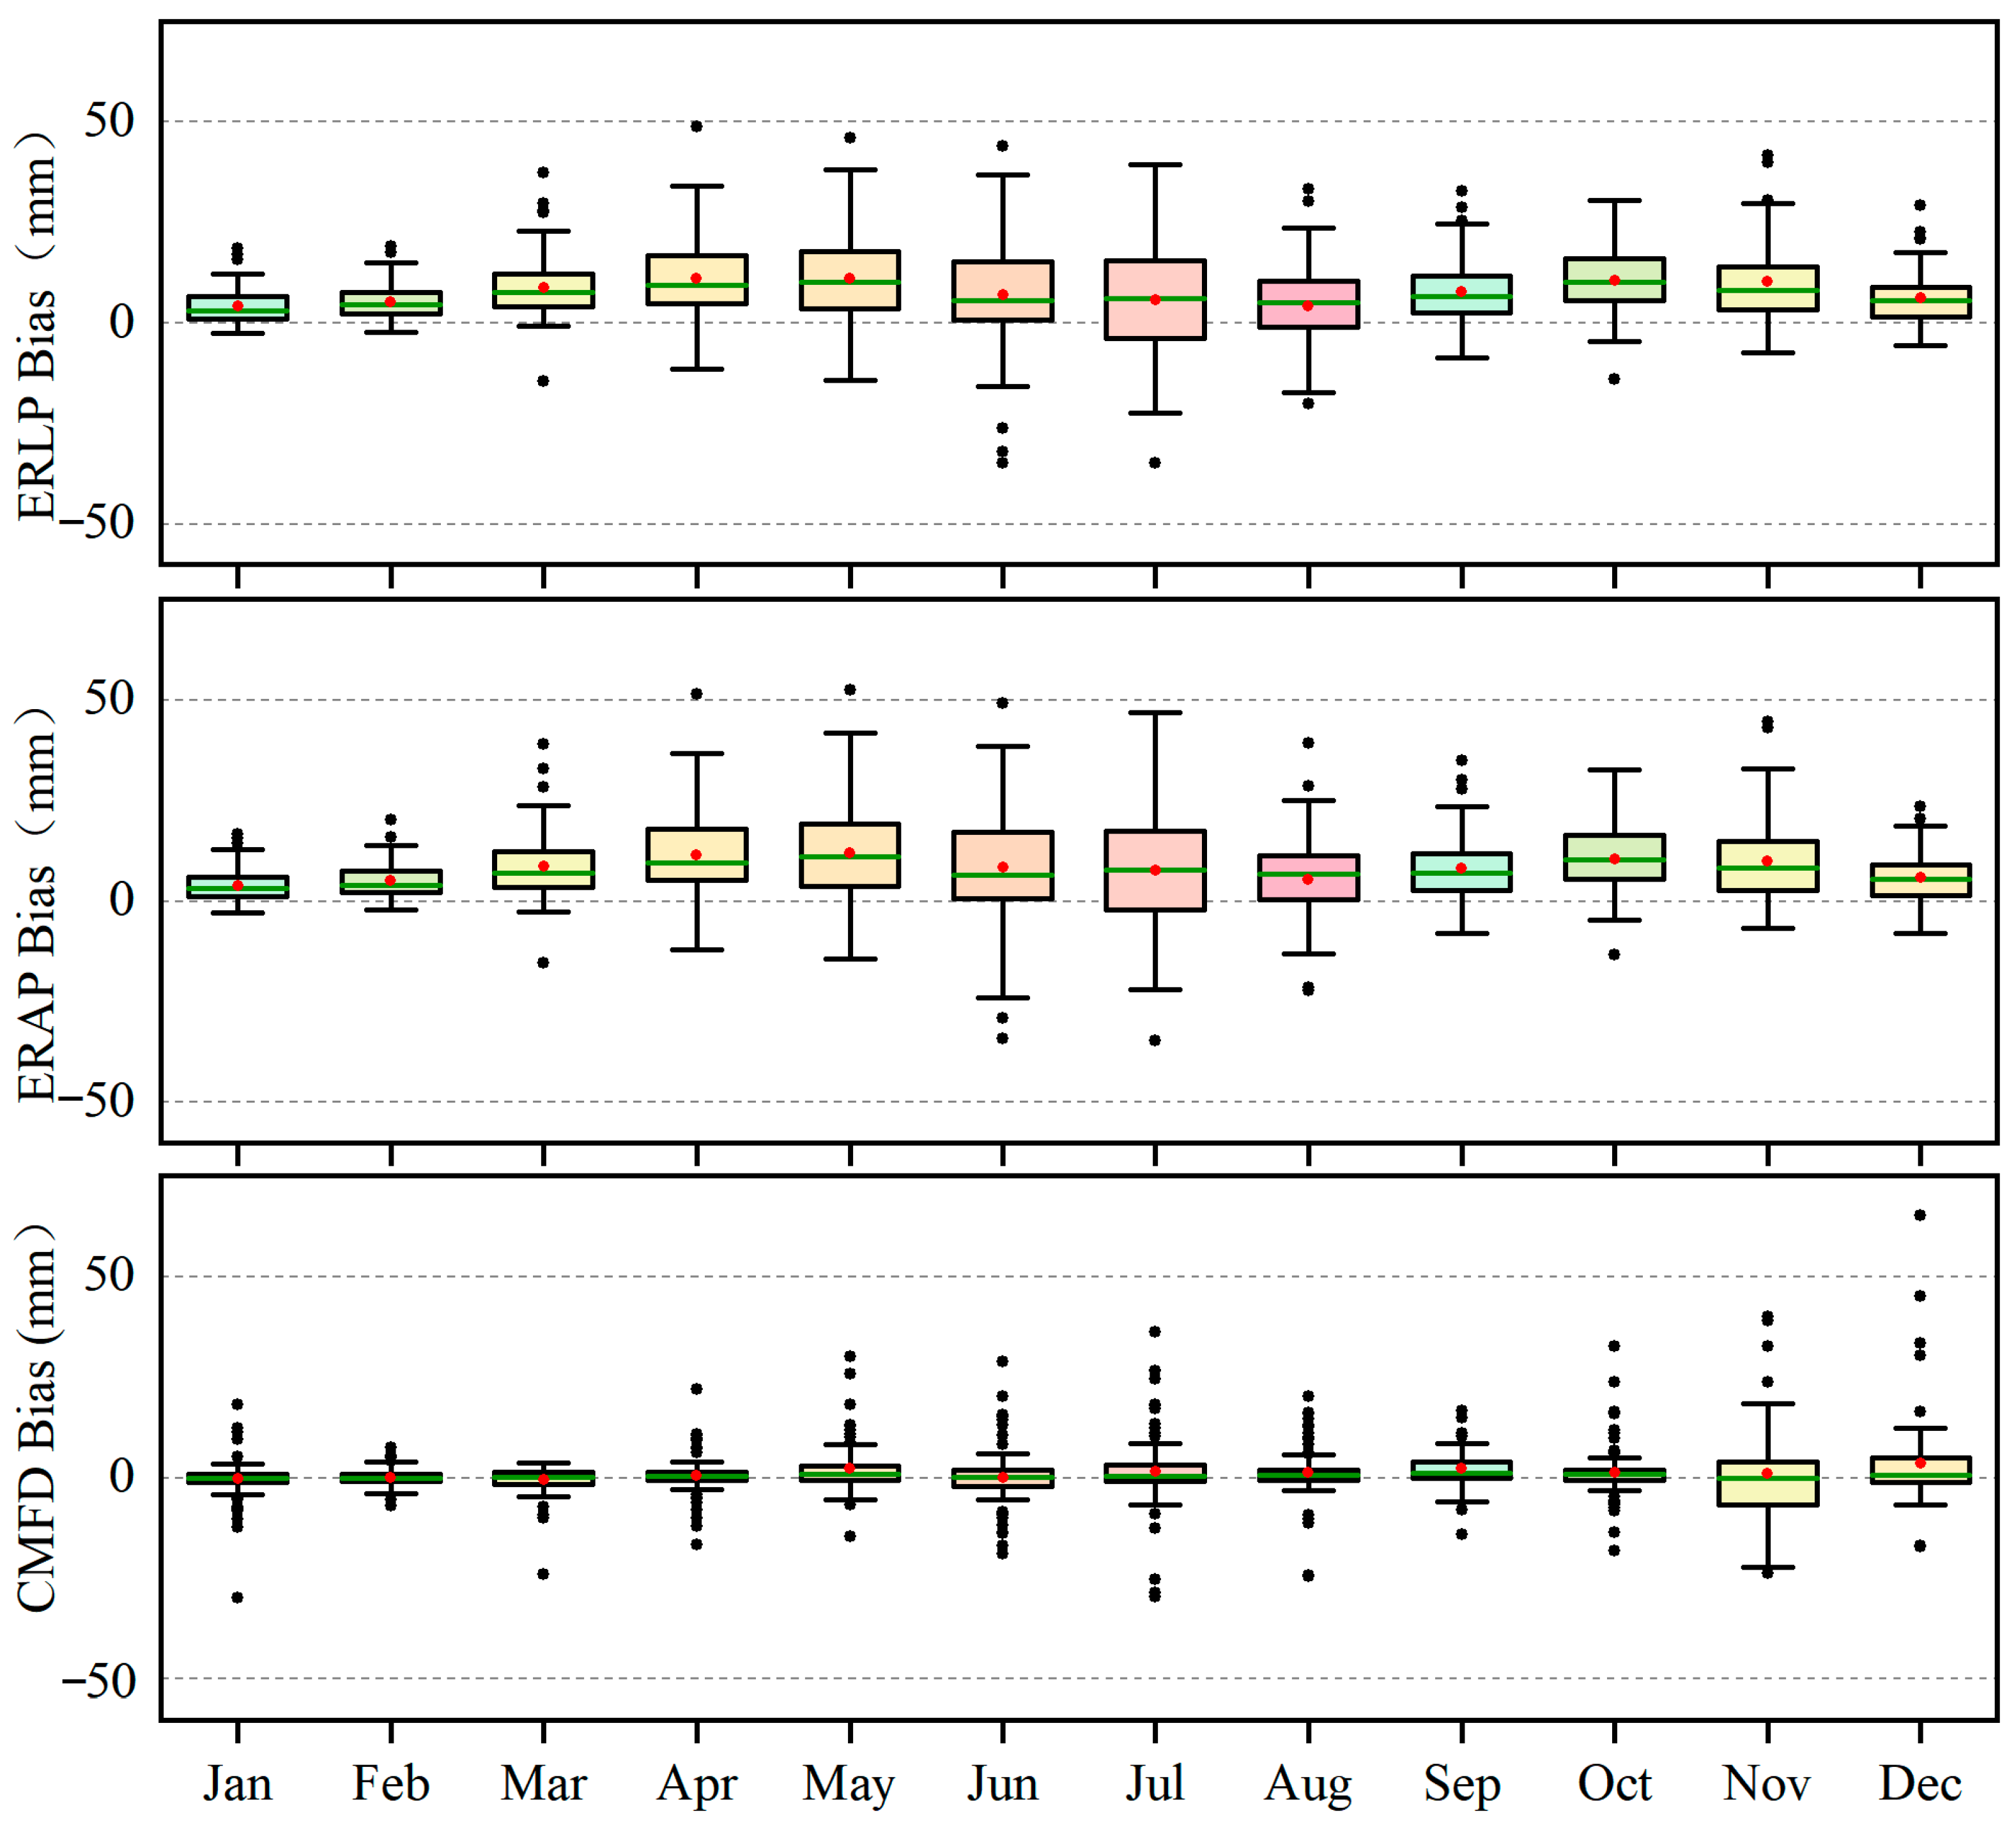
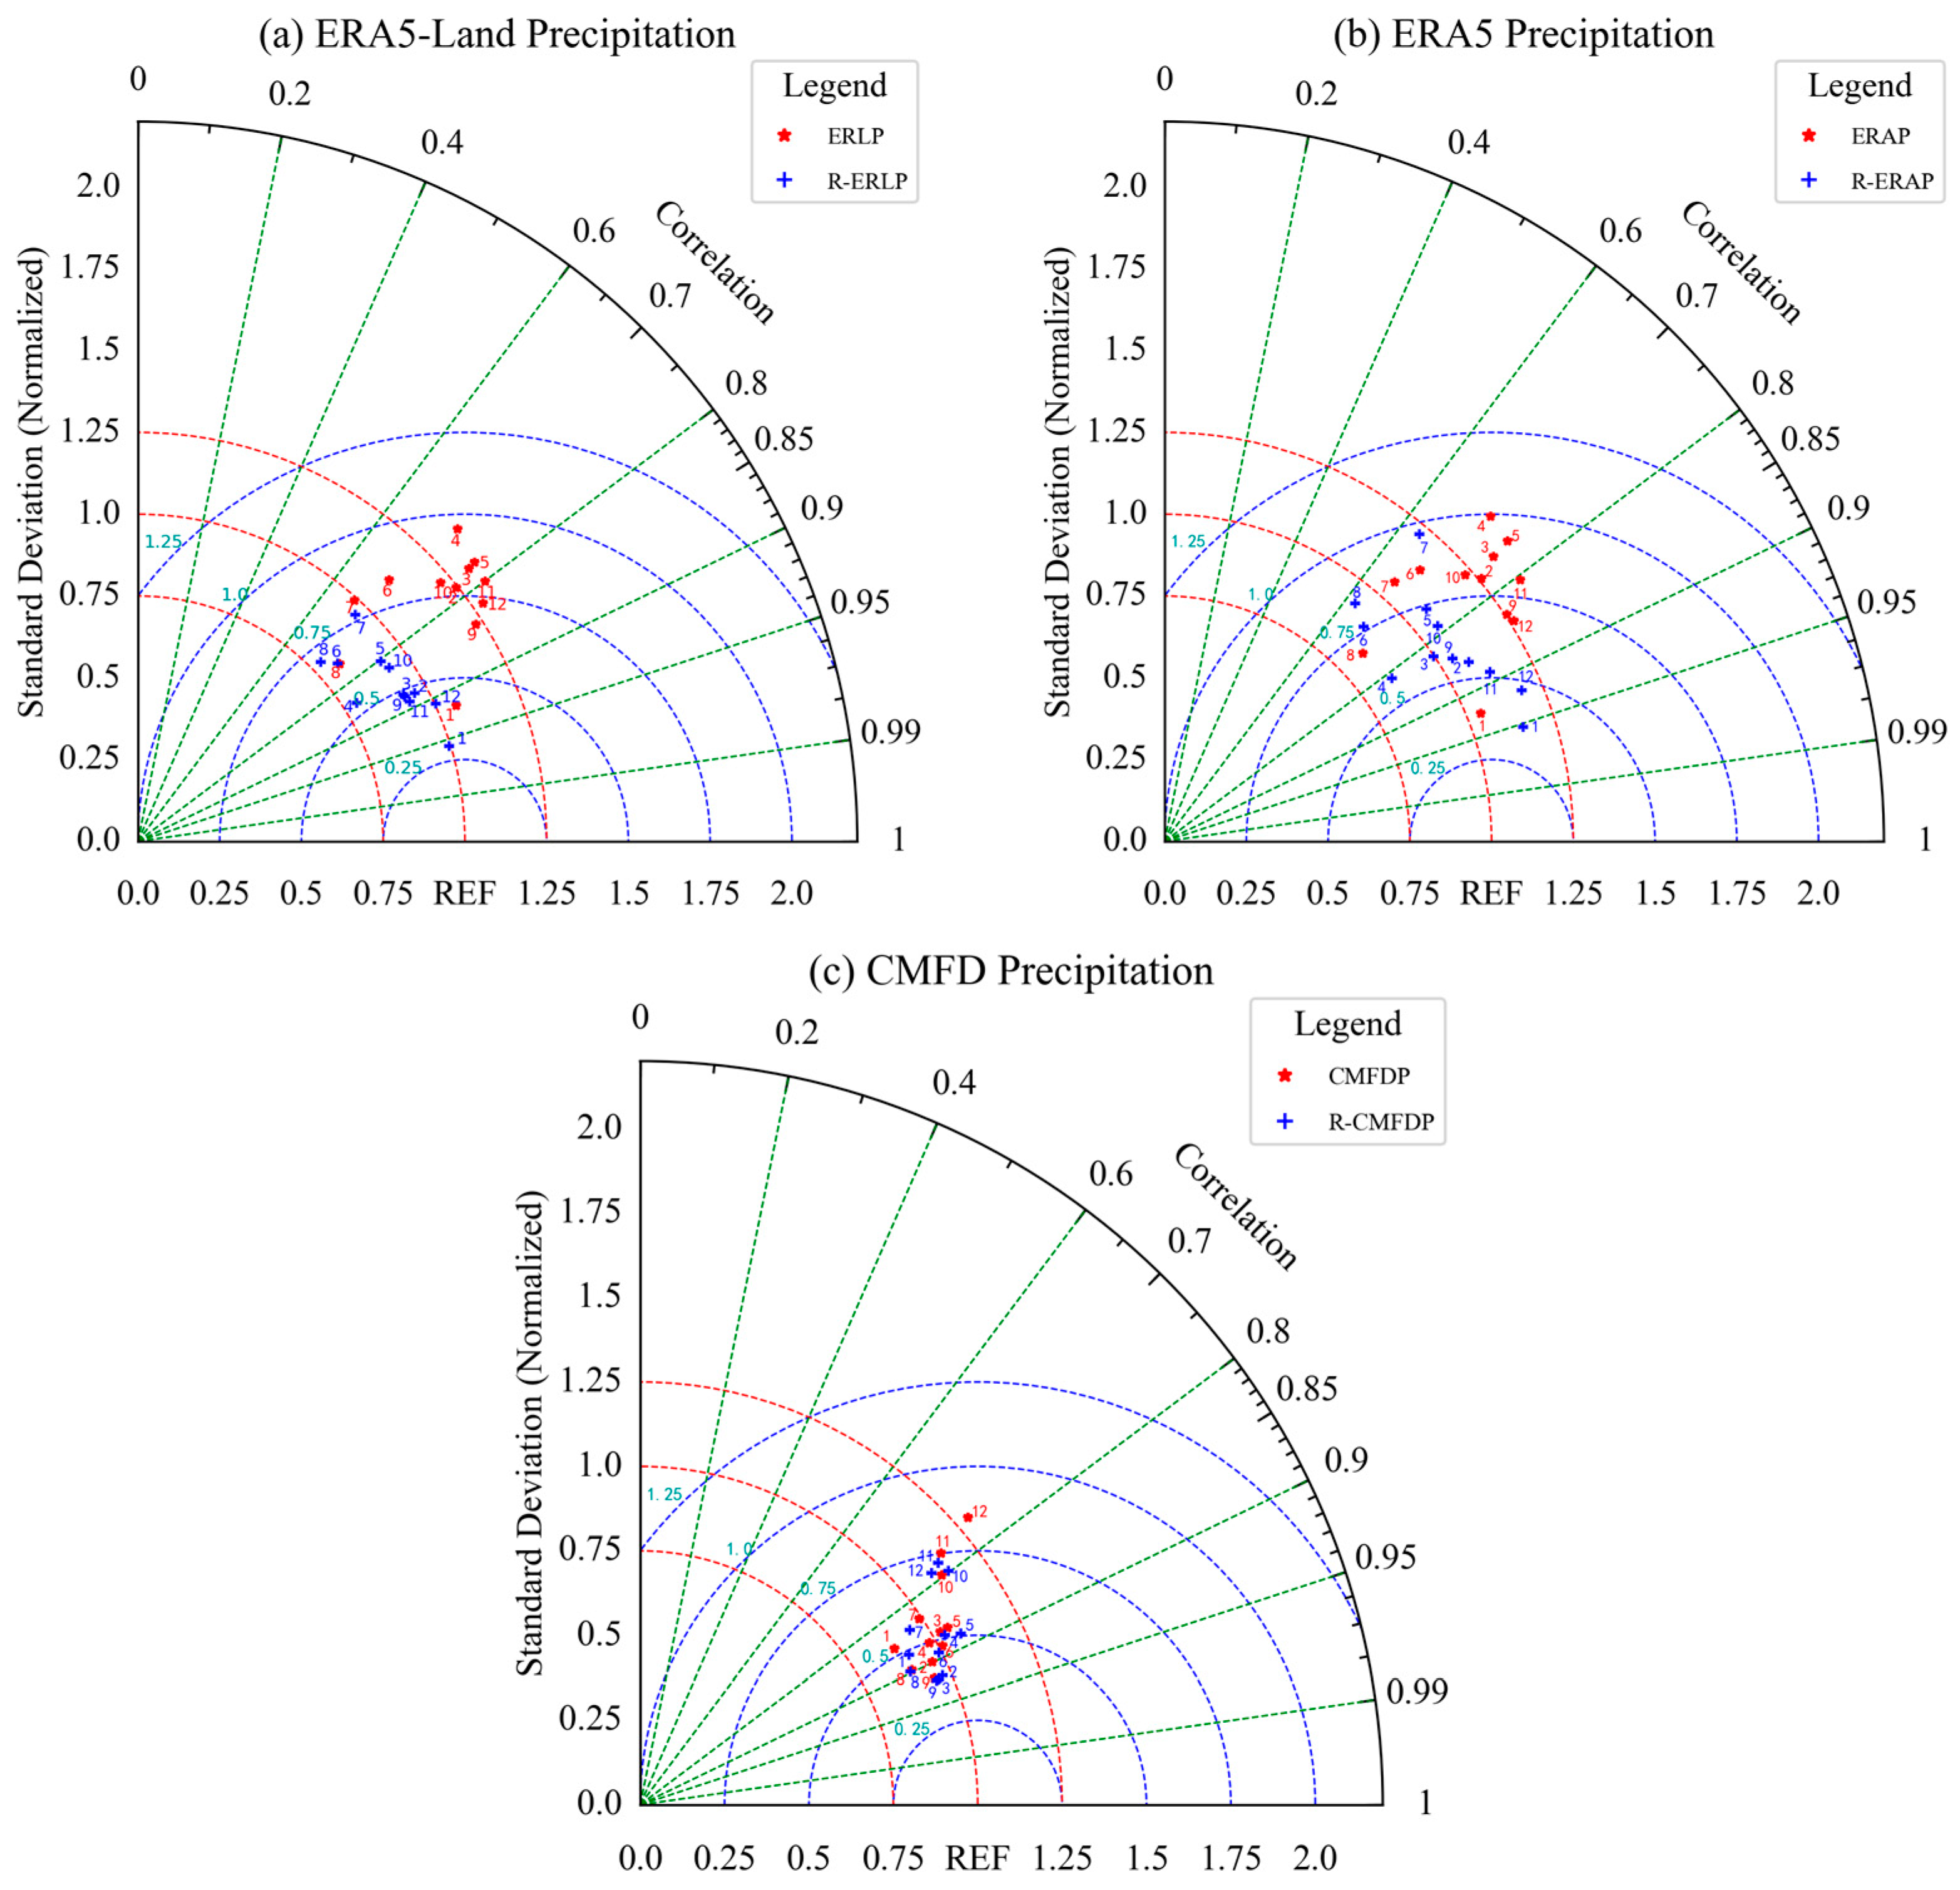
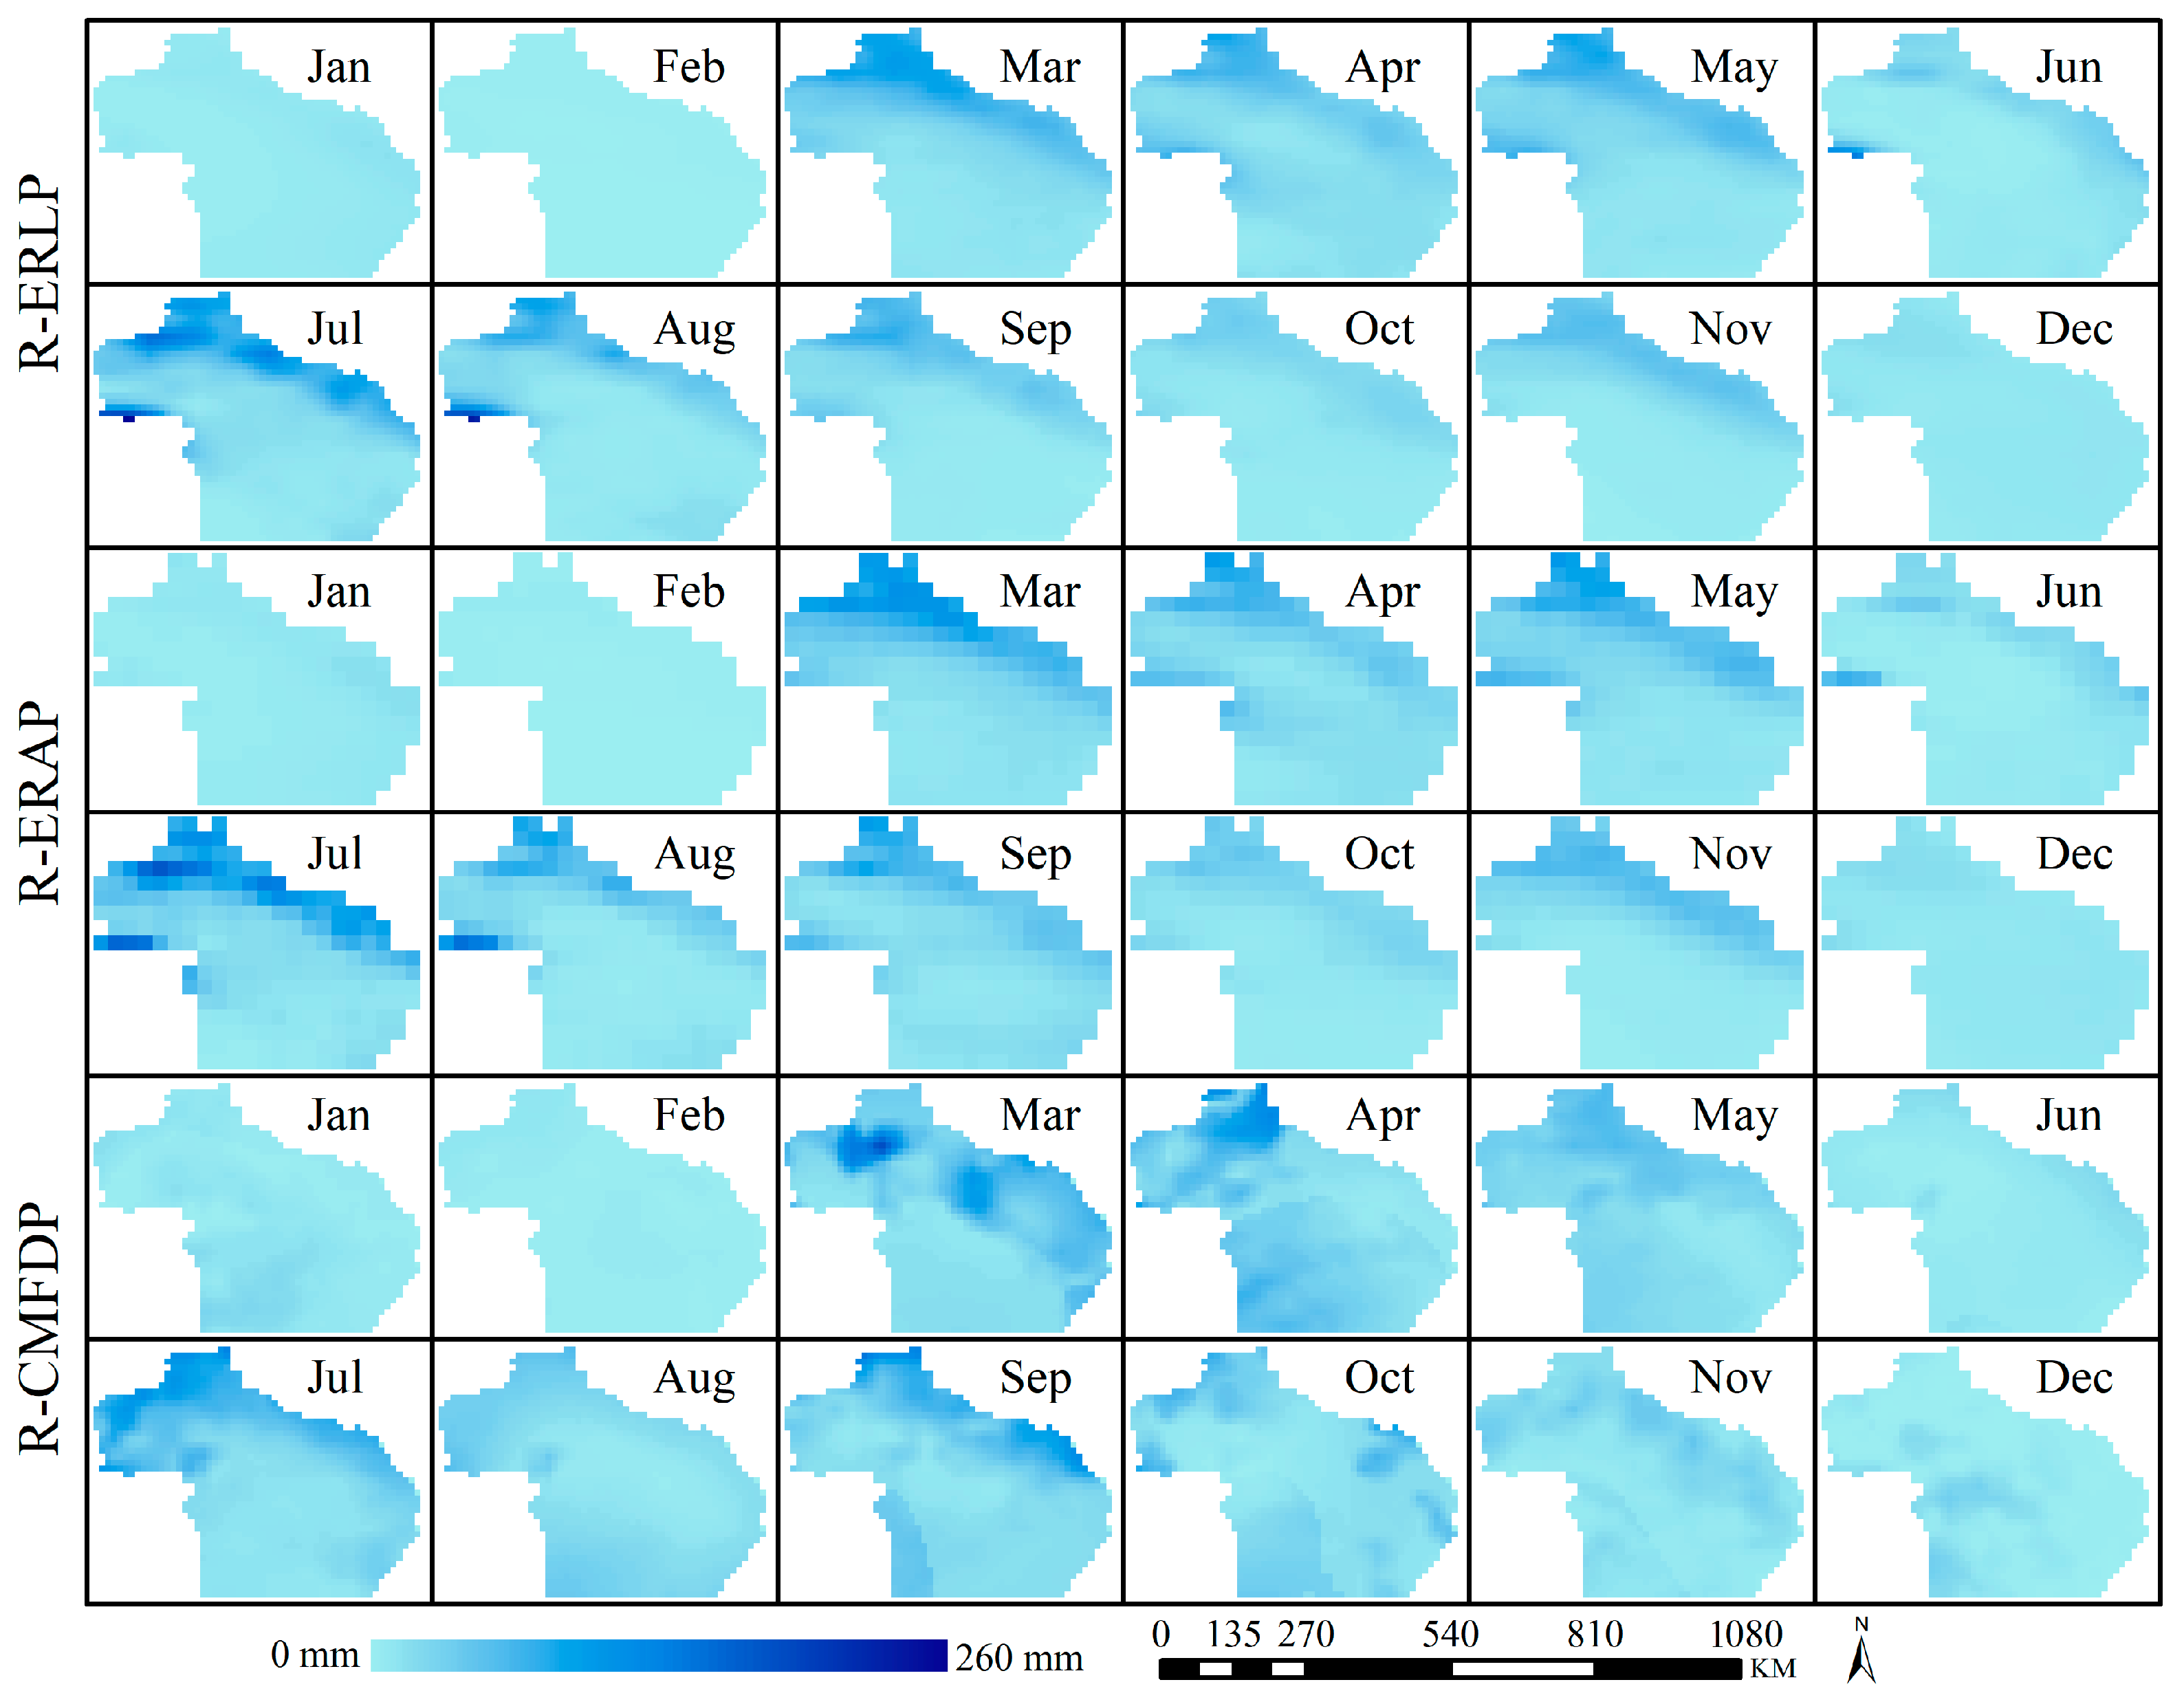
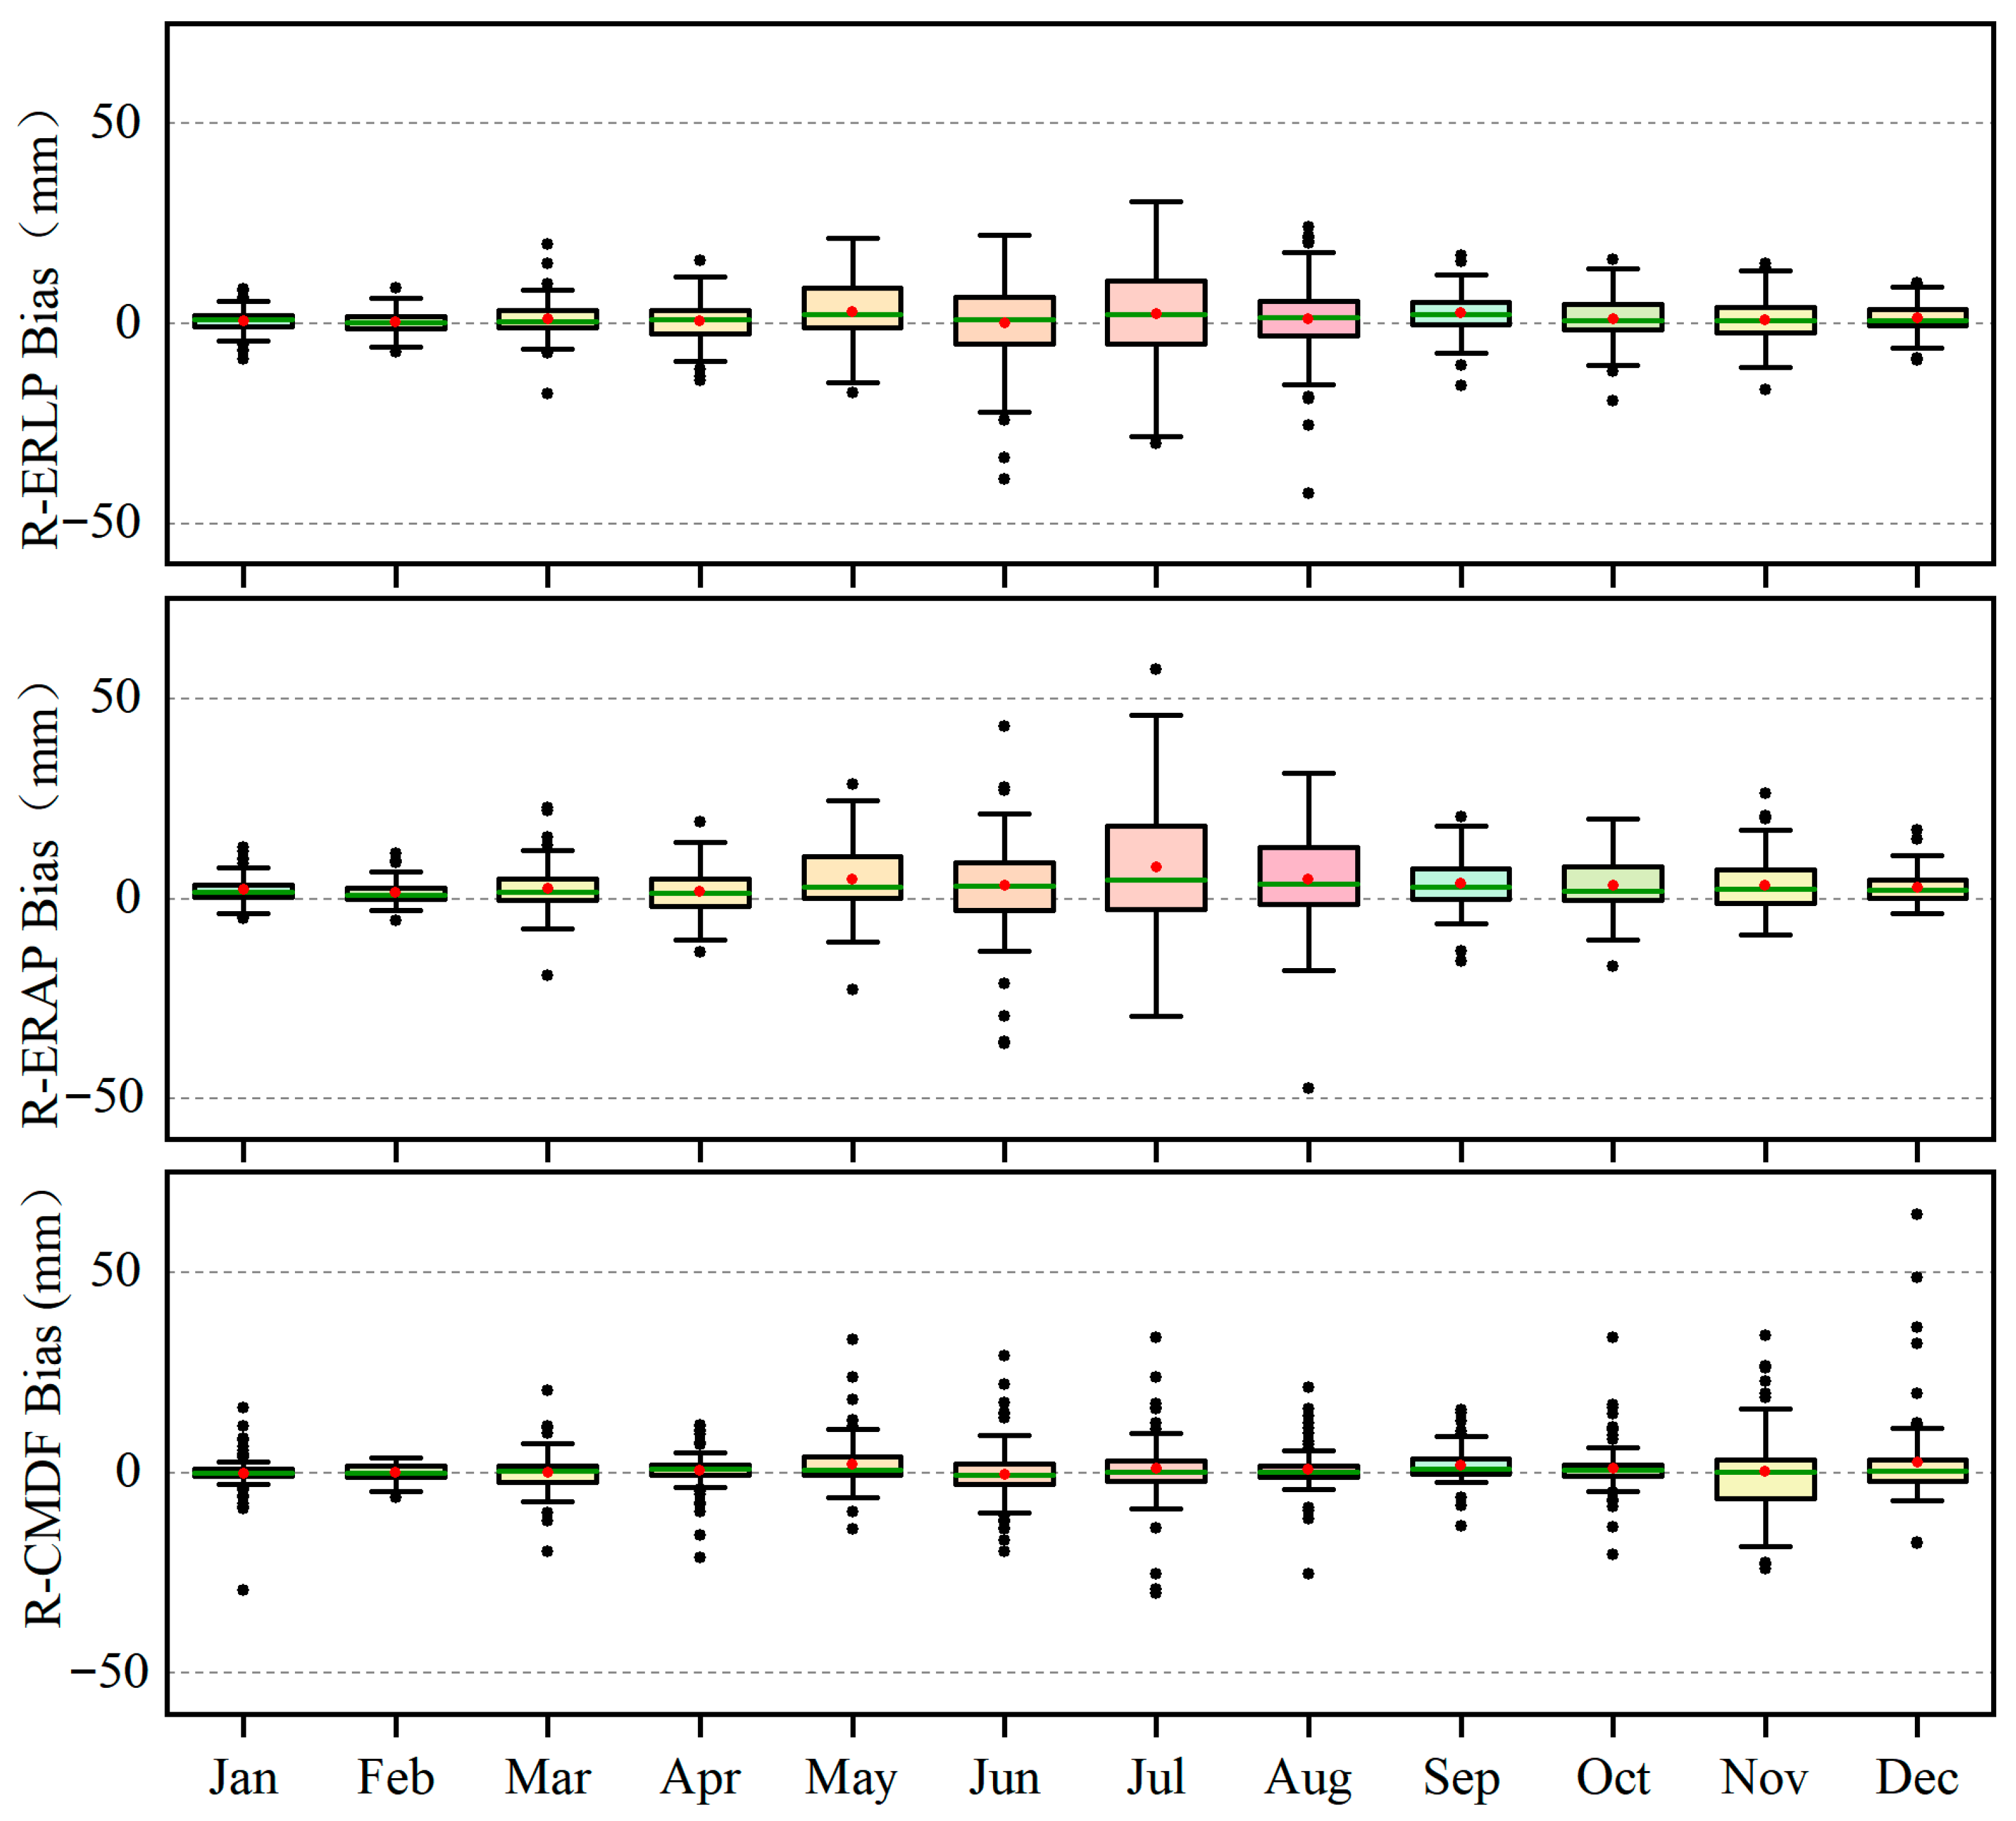
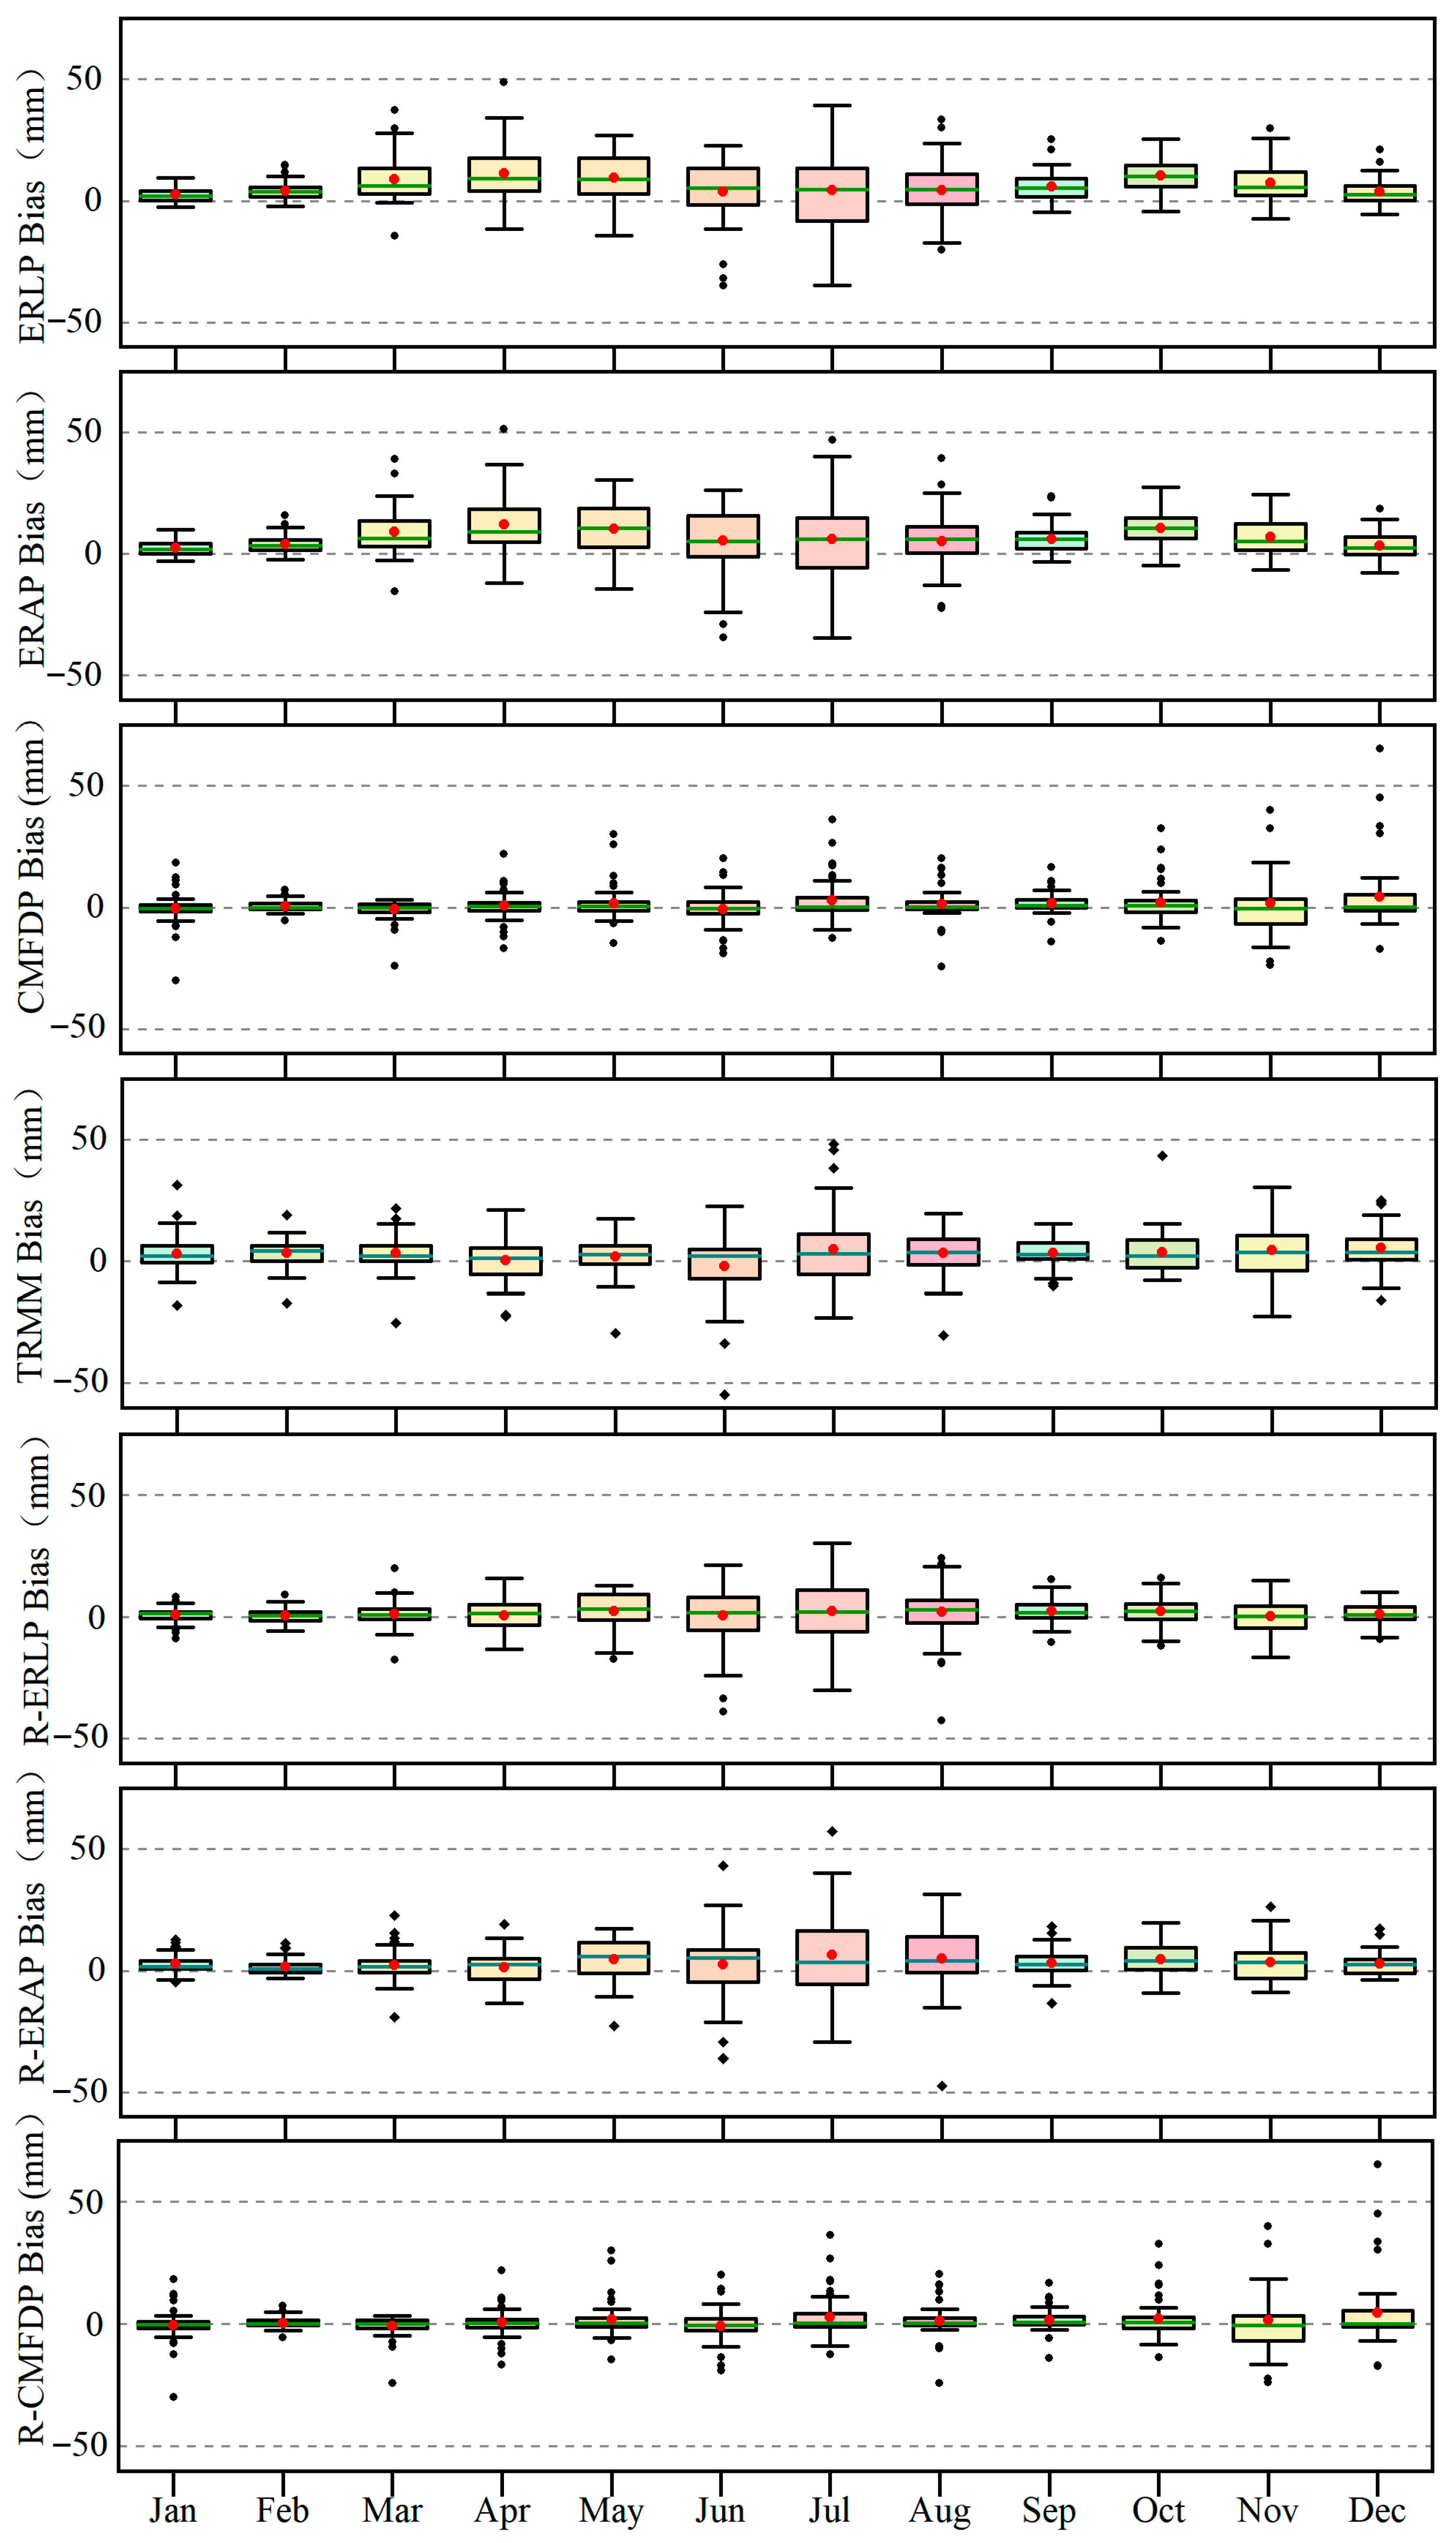
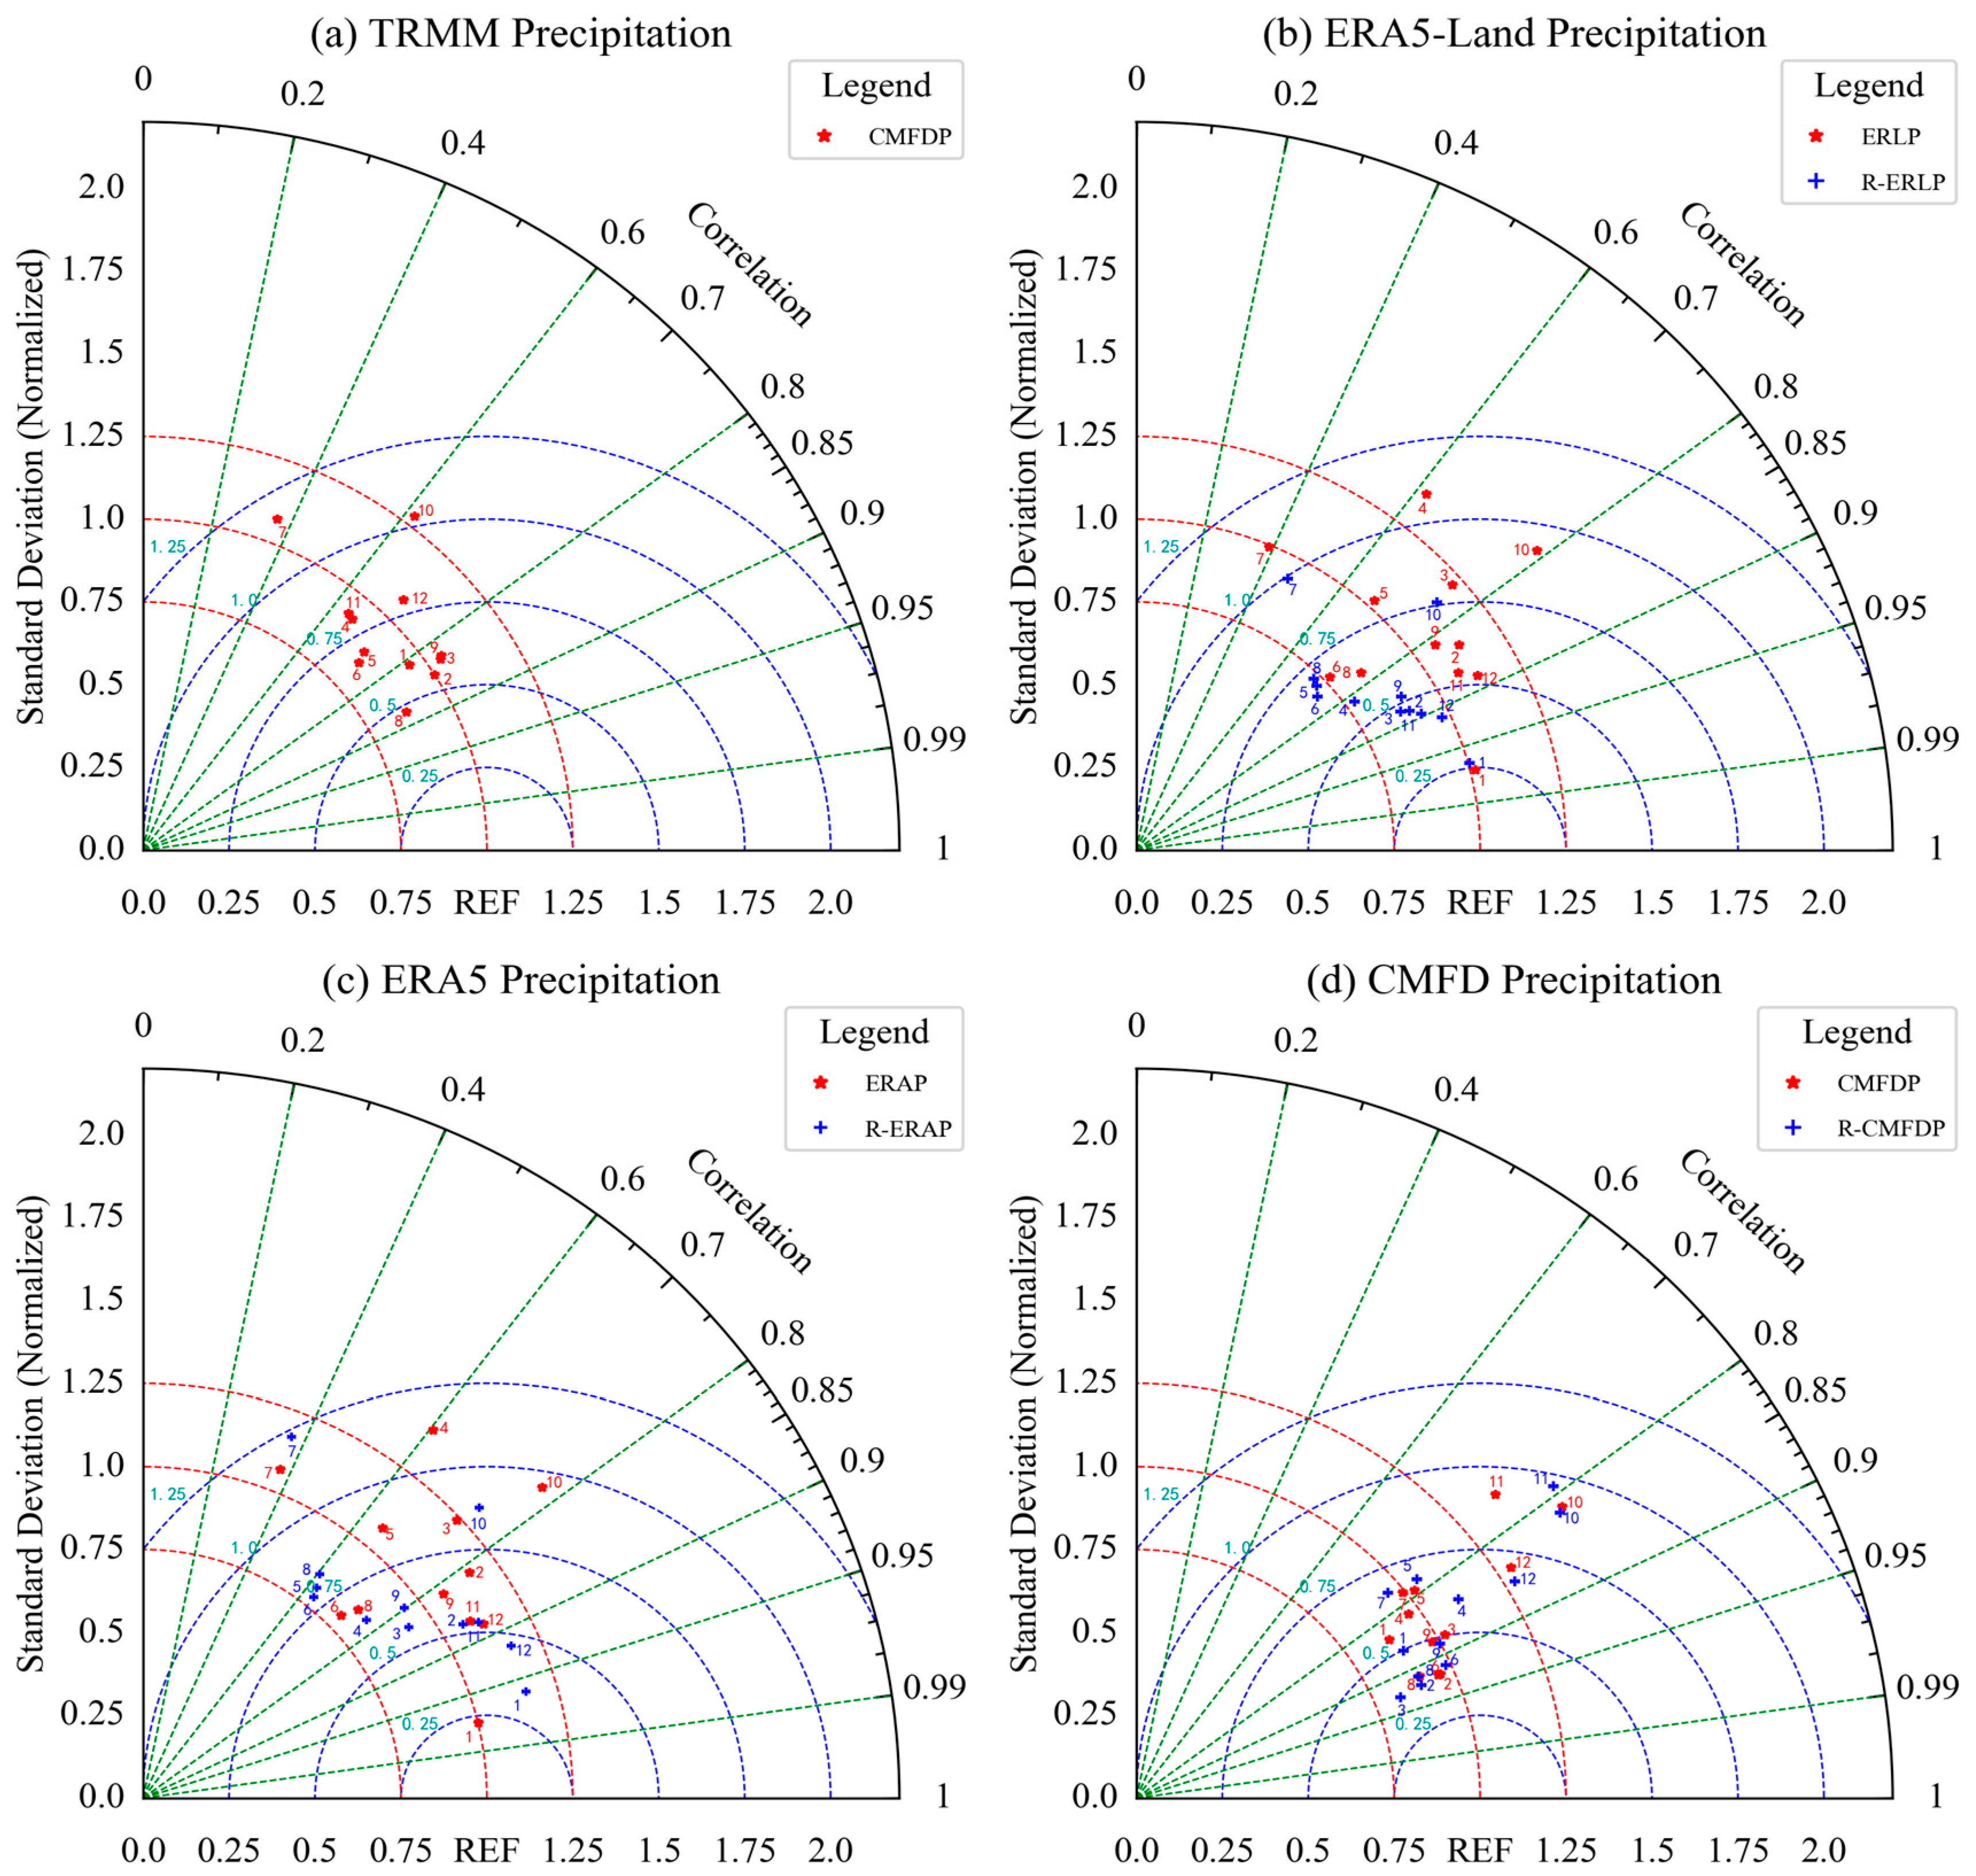
Disclaimer/Publisher’s Note: The statements, opinions and data contained in all publications are solely those of the individual author(s) and contributor(s) and not of MDPI and/or the editor(s). MDPI and/or the editor(s) disclaim responsibility for any injury to people or property resulting from any ideas, methods, instructions or products referred to in the content. |
© 2024 by the authors. Licensee MDPI, Basel, Switzerland. This article is an open access article distributed under the terms and conditions of the Creative Commons Attribution (CC BY) license (https://creativecommons.org/licenses/by/4.0/).