Abstract
From 17 to 22 July 2021, the “21·7” extreme rainfall event (“21·7” ERE) hit Henan Province, breaking the record for mainland China with a maximum hourly rainfall of 201.9 mm at the Zhengzhou station. The long-lived (20 h) mesoscale Huang-Huai vortex (HHV) was an important system that directly affected the major rainfall stage, including the extreme hourly rainfall. This study investigates the formation and development mechanism of the HHV, as well as its association with the simulation of extreme hourly rainfall through numerical simulations. The simulated rainfall and radar composite reflectivity were in good agreement with the observations, thus effectively reproducing the generation and developmental process of the HHV. The analysis results showed that the HHV initially formed at 850 hPa on 19 July at 1800 UTC and eventually developed to 550 hPa. The positive feedback formed by the horizontal convergence and vertical vorticity transport was the main mechanism leading to the generation and deepening of the HHV. The stretching effect (STR) term played an absolutely dominant role in the increase in the vorticity tendency, and it primarily originated from the coupling effect of boundary layer jets (BLJs) and synoptic-weather-system-related low-level jets (SLLJs). The accurate simulation of the HHV allowed the early rainfall to reasonably reproduce the surface cold pool near the Zhengzhou station, and then the cooperation of the SLLJs, the BLJs, and the cold pool made the simulated extreme hourly rainfall exactly close to the Zhengzhou station, but with a weaker intensity, due to the fact that the HHV moved northeastward after its formation, resulting in a narrow range of southerly flow in southern Henan, which is not conducive to convective triggering in the southerly flow.
1. Introduction
An extreme rainfall event (referred to as the “21·7” ERE) hit Henan Province from 17 to 22 July 2021, during which the 6-day cumulative rainfall in some cities exceeded 700 mm, with the maximum hourly rainfall in Zhengzhou reaching 201.9 mm on July 20, breaking the record in mainland China. Therefore, many works have dissected the “21·7” ERE from different perspectives, such as through diagnostic analyses [,,,,], data assimilation [,], or numerical simulations [,,].
Previous work noted that the development and movement of the mesoscale vortices in central east China, especially the long-lived ones, are vital triggers for persistent heavy rainfall [,,]. These vortices are meso-α-scale systems with a horizontal radius of approximately 200–500 km, covering the lower and middle troposphere. Su et al. (2012) and Zhang et al. (2013) found that two heavy rainfall processes that occurred in Henan from 16 to 19 July 2010 were caused by such mesoscale vortices [,]. The formation and development of mesoscale vortices are influenced by many factors. Sun et al. found that mesoscale vortex formations are dominated by vorticity production due to convergence and vorticity transport []. Some studies have suggested that the ambient vertical wind shear, the strength of the system-generated cold pool, and the scale of the convective line segments are factors that affect the intensity and scale of mesoscale vortices []. Several studies have reconfirmed that this “21·7” ERE in Henan was directly influenced by the long-lived mesoscale Huang-Huai vortex (HHV) [,,,]. Fu et al. (2022) analyzed the structure of the long-lived mesoscale convective vortex (MCV) at 475–800 hPa during 19–20 July 2021 using the European Centre for Medium-Range Weather Forecasts (ECMWF) reanalysis version 5 (ERA5) data and found that the MCV’s interaction with its parent mesoscale convective system (MCS) was crucial to producing the extreme rainfall in Zhengzhou [,]. Li et al. (2022) also used ERA5 data to study the development and maintenance mechanisms of the HHV [], but unlike Fu et al. (2022) [], they focused on an earlier stage. Some other studies have found that the eastward movement of the vortex coupled with a strong low-level southwesterly jet can bring adequate water vapor from the Bay of Bengal and trigger a strong ascending motion in Henan []. Low-level jets (LLJs), usually defined as a maximum wind speed exceeding 10 m·s−1 below 700 hPa, can be divided into two types: synoptic-weather-system-related low-level jets (SLLJs) at 1–4 km and boundary-layer jets (BLJs) below 1 km []. Studies have found that LLJs provide favorable conditions for the generation and development of mesoscale vortices due to strengthening horizontal convergence [,]. ERA5-based studies found that the coupling of the SLLJs at 700–850 hPa and BLJs at ~950 hPa provided strong mid-level divergence and mid- and low-level convergence, leading to a maximum rainfall rate in this “21·7” ERE [,].
Due to the extreme nature of this rainfall, the resolution of the ECMWF forecasts tended to underestimate the intensity of the rainfall, and the predicted rainfall center was more westward relative to the observation (Figure A1). In addition, since the temporal resolution of the reanalysis data was hour-by-hour, the possible temporal misalignment may have missed the mesoscale vortex located in the lower troposphere of western Henan, which is evident in the radiosonde data (Figure A1). Numerical simulations are an effective tool to obtain a quantitative understanding of the processes associated with the weather system. Xu et al. (2022) found that high-resolution numerical sensitivity experiments were essential to understanding the close relationship between tropical cyclones and the “21·7” ERE []. Yin et al. (2022) emphasized the importance of a quasi-stationary, well-organized meso-γ-scale convective system based on a nested WRF model with a maximum resolution of 1 km, and they concluded that this “21·7” ERE was a joint product of cloud microphysical processes and dynamical processes in the convective system []. The effects of the direct assimilation of the Chinese Fengyun (FY)-4A Advanced Geostationary Radiation Imager (AGRI) on the “21·7” ERE were also analyzed [].
In this study, based on high-resolution remote sensing data such as FY-4A satellite and radar data, we performed numerical simulations using weather research and forecasting (WRF) to analyze the formation mechanism of the “21·7” ERE from the perspective of the mesoscale vortex. Whether the dominant factor, the HHV, was simulated reasonably in the numerical simulation was checked, and in turn, the formation and development process of the HHV was further analyzed based on this high-temporal-resolution simulation. Also, the possible reason for why the extreme hourly rainfall happened to occur at the Zhengzhou station, but the intensity was underestimated under the effect of the HHV is further discussed in conjunction with the LLJs, cold pool, and convective merging processes.
The data and methods used are described in Section 2, and the basic validation of the model simulation capability, an analysis of the mechanisms of HHV formation, and the influence of the HHV on the extreme hourly rainfall are presented in Section 3. Section 4 and Section 5 provide a discussion and conclusion, respectively.
2. Materials and Methods
2.1. Data
Five types of data were used in this study: (a) The hourly rainfall observations from national meteorological stations of the China Meteorological Administration were used. (b) The assimilation analysis fields from Xu et al. (2022) were used as the initial values []. They assimilated full-disk L1-level raw radiance data from the FY-4A satellite AGRI sensor and conventional observations, including radiosondes, ships, surface synop observations, and airport reports from the China Meteorological Administration. The background fields, as well as the lateral boundary conditions, were taken from global forecast system (GFS) forecast data provided by the National Centers for Environmental Prediction (NCEP) (https://rda.ucar.edu/datasets/ds084.1/ (accessed on 7 September 2023)), featuring a spatial resolution of 0.25° and a temporal resolution of a 6 h interval. (c) The blackbody temperature (TBB) from an FY-4A satellite AGRI sensor with a temporal resolution of 1 h and a spatial resolution of 4 km at the nadir (http://satellite.nsmc.org.cn (accessed on 7 September 2023)) was used for the analysis of MCSs. (d) The 6 min interval radar composite reflectivity from the China Meteorological Administration was used for verification. (e) The European Centre for Medium-Range Weather Forecasts (ECMWF) forecast and ERA5 data (https://www.ecmwf.int/ (accessed on 7 September 2023)) were used.
2.2. Model
This study used the advanced research version of the weather research and forecasting (WRF-ARW) model, version 3.9. The experiment used a nested grid setup for two domains, with a grid spacing of 9 km for the outer domain (D01) and 3 km for the inner domain (D02) (Figure 1), which is a common model configuration used in operational forecasting. The vertical grid contained 51 levels, of which levels 1–14 were below 700 hPa and affected by terrain height, and the pressure at the top of the model was 50 hPa. The physical parameterizations were as follows: the new Thompson microphysics scheme [], the rapid radiative transfer model for GCMs (RRTMG) longwave and shortwave radiance schemes [,,], the Yonsei University planetary boundary layer scheme [], the Noah land surface model [], and the new Tiedtke cumulus scheme [] for D01.
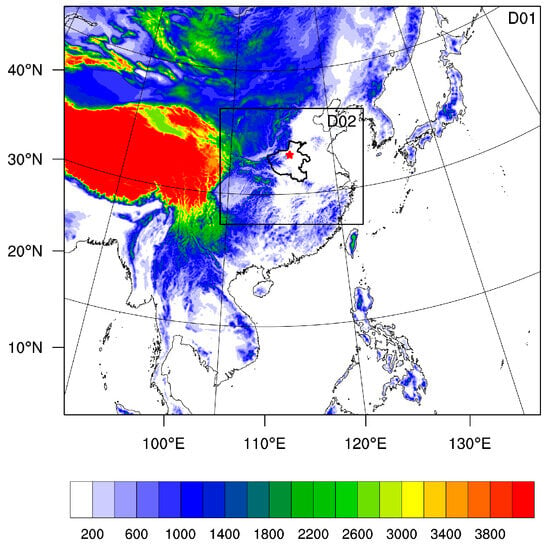
Figure 1.
The terrain height (shading; m) of the simulated area in ARW-WRF; the area shown in the Figure is D01, and the area outlined by the black box is D02. The thick black line represents the boundary of Henan Province. The red star represents the Zhengzhou station.
In this study, the simulation was started from 0600 UTC on 19 July and followed by a 6 h spin-up, while two assimilations were conducted at 0600 UTC and 1200 UTC. The lateral boundary conditions were taken from the forecast field of NCEP GFS at 6 h intervals starting from 0600 UTC on 19 July. The assimilated analysis field at 1200 UTC was chosen as the initial value of the warm start, from which the model was forecasted for 24 h from 1200 UTC on 19 July to 1200 UTC on 20 July.
2.3. Method
To analyze the evolution of the HHV, the vortex structure was defined in this paper as a closed vortex center in the stream field coupled with a significant positive relative vorticity center (≥10−4 s−1), referring to previous studies [,,]. The vertical thickness of the vortex was determined based on whether there were notable vortex structures in the continuous levels of the 50 hPa interval. The vortex’s bottom (top) level was determined by the maximum (minimum) pressure.
The vorticity equation was used to quantify the evolution of the vortex, which describes the changes in the vorticity of a fluid in its motion. Without considering friction, the formula in the pressure coordinate is as follows []:
where u, v, and ω are the zonal, meridional, and vertical winds in the pressure coordinate, respectively. is the relative vorticity in the direction and is the Coriolis parameter. The term on the left side of Equation (1) is the local time derivative of the relative vorticity. The terms on the right side of Equation (1) are the four budget terms of the local tendency of the relative vorticity: the horizontal advection of absolute vorticity (HAV); the vertical advection of relative vorticity (VAV); the tilting effect (TIL), reflecting the transfer of vorticity between the horizontal and vertical components; and the stretching effect (STR), reflecting the effect of the horizontal velocity divergence on the absolute vorticity.
3. Results
3.1. Verification
Before analyzing the simulations of the mesoscale vortex, the forecast results of the model were examined in terms of three aspects: synoptic-scale circulation, rainfall, and radar composite reflectivity.
The stable and persistent coexistence of the western Pacific subtropical high (WPSH) in Northeast Asia, the Tibetan high in Western China, and Tropical Cyclone (TC) In-Fa over the East China Sea, as well as TC Cempaka over the South China Sea, are important background environments playing a dominant role in the occurrence and location of rainfall [,]. Figure 2 shows the temporal average of the WRF outputs and ECMWF forecasts from 1200 UTC on 19 July to 1200 UTC on 20 July. Henan is located ahead of the 200 hPa shortwave trough (Figure 2a,d) and the 500 hPa inversion trough (Figure 2b,e), which are governed by the warm advection and the southerly and southeasterly winds at 850 hPa (Figure 2c,f) at the same time. The simulated background environment in this study was consistent with that of the ECMWF forecasts. However, from the contour line at 5880 gpm, the simulated WPSH in this study was more northeastward and weaker than that of the ECMWF forecast, which Xu et al. (2022) suggested helps to correct the westward center of rainfall in the ECMWF forecast [].
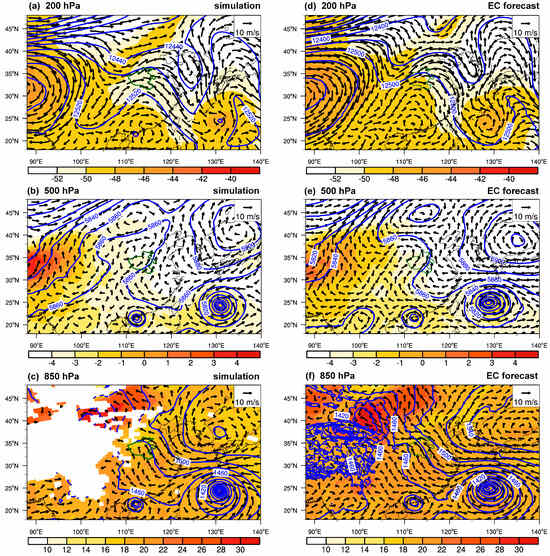
Figure 2.
Temporal average (from 1200 UTC on 19 July to 1200 UTC on 20 July) of geopotential height (contours; gpm), wind (vectors; m·s−1), and temperature (shading; °C) at (a) 200 hPa, (b) 500 hPa, and (c) 850 hPa, derived from WRF simulation. (d–f) are the same as (a–c), but derived from ECMWF forecasts. The green lines represent the boundary of Henan Province.
Second, Figure 3 shows the results of the rainfall forecast. The spatial distribution of the simulated 24 h cumulative rainfall in the Henan region agreed well with the observations, and the intensity was also comparable (Figure 3a,b). The location of the simulated largest hourly rainfall center (34.76N, 113.74E, Figure A2) from 0800 UTC to 0900 UTC on 20 July was close to the Zhengzhou station (34.71N, 113.66E). From 1800 UTC on 19 July to 1100 UTC on 20 July, the evolution of simulated rainfall at the largest hourly rainfall grid with time was consistent with that of the observation at the Zhengzhou station (Figure 3c). Although the intensity of the simulated maximum rainfall was weak, the simulation had a good performance in capturing the trend and location (Figure 3c and Figure A2). The threat score (TS) is often used to assess the quality of rainfall simulations. The TS above 250 mm (500 mm) of the simulation was 0.3889 (0.5).
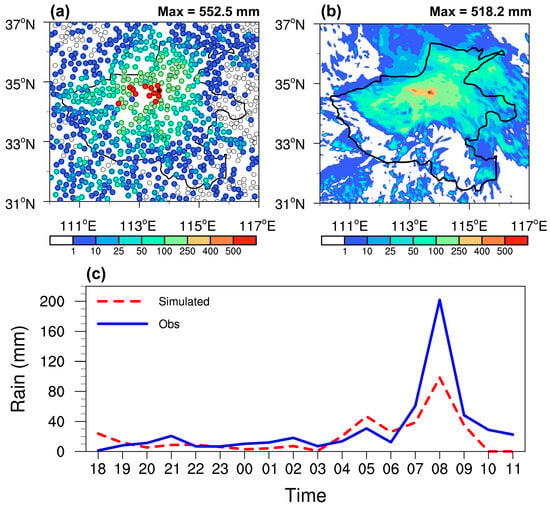
Figure 3.
The spatial distribution of (a) observed and (b) WRF-simulated 24 h cumulative rainfall (mm) from 12 UTC on 19 July to 12 UTC on 20 July. (c) The hourly rainfall (mm) from observation and WRF simulation from 1800 UTC on 19 July to 1100 UTC on 20 July 2021 at the Zhengzhou station and the simulated largest hourly rainfall grid. The black lines in (a,b) represent the boundary of Henan Province. The black stars in (a,b) represent the Zhengzhou station.
Further, the simulated composite radar reflectivity (the combination of the maximum simulated equivalent radar reflectivity calculated from the WRF model output) was compared with observations derived from operational weather radars. There was a northwest–southeast band echo east of Henan at 1200 UTC on 19 July; the simulation reproduced the location and development of radar echoes consistently with that of the observation, but the intensity was slightly weaker than that of the observation. By 0830 UTC on 20 July, the observed and simulated location and intensity of the primary MCS in northern Henan matched well, but the simulated results failed to capture the newborn convective cells in southern Henan (Figure 4c,d).
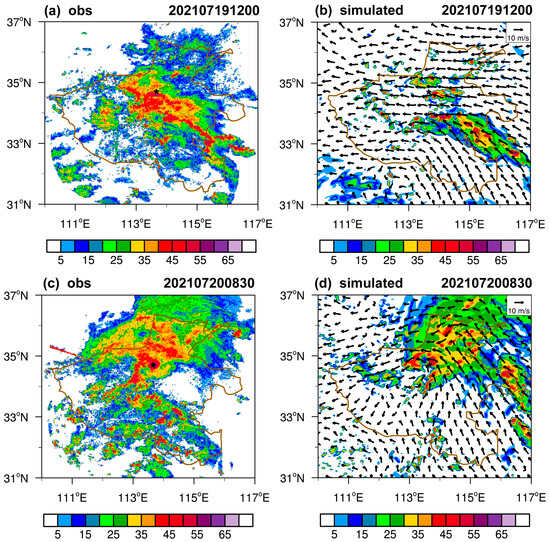
Figure 4.
Radar composite reflectivity (shading; dBZ) derived from (a,c) operational weather radars and (b,d) WRF simulations. Distribution of WRF-simulated wind field (vectors; units: m·s−1) in (b,d) at 850 hPa. The brown lines represent the boundary of Henan Province. The black stars represent the Zhengzhou station.
Based on the above evaluation, and despite the fact that the extreme hourly rainfall intensity remained weaker compared to the observations, the WRF simulation captured well the persistent rainfall during 19–20 July 2021, with an improvement in the location and intensity of rainfall compared to that of the ECMWF forecast (Figure A1). On the other hand, the simulation also reproduced the occurrence and development of the main MCSs affecting the “21·7” ERE in radar reflectivity. Therefore, the simulation results could be used to analyze the mesoscale vortex affecting the “21·7” ERE.
3.2. Simulation Analysis
The key region (1.5° × 1.5°) of the HHV (red dashed box in Figure 5) was determined by covering the closed vortex structure and a vorticity center ≥ 10−4 s−1 to show the overall features of the HHV.
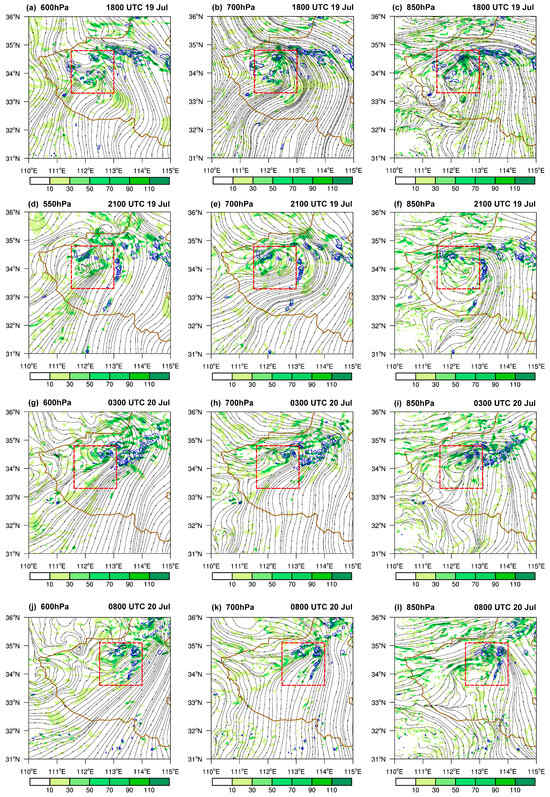
Figure 5.
Relative vorticity (shading; 10−5 s−1) and stream field (black lines with arrows) at 550 hPa, 600 hPa, 700 hPa, and 850 hPa; the blue contours represent 1 h cumulative rainfall (10, 25, and 50 mm), and the red boxes mark the mesoscale convective vortex’s key regions.
The HHV affecting this rainstorm was a meso-α-scale vortex exceeding 150 km in the horizontal direction, which had a long life history (lasting about 20 h) and could be divided into three stages. The relative vorticity and stream field at 50 hPa intervals between the top and bottom of the HHV were analyzed, and the results of representative layers are shown in Figure 5. The first stage occurred at 1500–2100 UTC on 19 July, during which a meso-α-scale closed vortex structure was first generated at 850 hPa in the key region (above the Funiu Mountain) at 1800 UTC on 19 July, and then extended to 550 hPa about 3 h later (Figure 5a–f), indicating that the HHV became deeper. The mean vorticity in the key region was also seen to increase rapidly at 1500–2100 UTC (Figure 6, an increase of about 4 × 10⁻⁵ s−1). The simulated average vorticity decreased slightly (Figure 6) in the second stage (from 2100 UTC on 19 July to 0400 UTC on 20 July), and the simulated HHV moved slowly to the northwest (Figure 5) during the third stage (from 0400 UTC to 0900 UTC on 20 July). The 1 h cumulated rainfall above 10 mm was always in the northeast of the HHV center (Figure 5), where the cyclonic convergence was stronger. Also, when the maximum relative vorticity was larger during the second and third stages, the maximum 1 h cumulative rainfall tended to be larger (Figure 6).
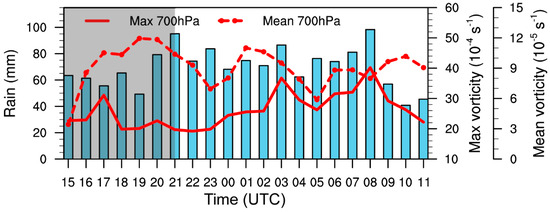
Figure 6.
Simulated maximum 1 h cumulative rainfall (blue bar; mm), maximum relative vorticity (solid line; 10−4 s−1), and key-region-averaged relative vorticity (dotted line; 10−5 s−1) at 700 hPa in the key region. The grey shading covers the first stage.
Is there a direct correlation between the HHV and heavy rainfall? Furthermore, Figure 7 shows the distribution of the simulated radar composite reflectivity and the wind vector at 850 hPa. Before the formation of the HHV (before 1800 UTC on 19 July), a southeast–northwest banded convective system appeared in Henan, with a peak radar reflectivity over 50 dBZ (Figure 4b and Figure 7a,b). Subsequently, the band-shaped echo gradually developed into a spiral echo in the northeast of the HHV, but at this time, the convective cells above 40 dBZ were still scattered. With the development of the HHV, the convective cells gradually merged and blocked at Zhengzhou, with the peak radar reflectivity exceeding 55 dBZ, resulting in persistent heavy rainfall. Therefore, the HHV was closely associated with the MCS that was blocked at Zhengzhou.
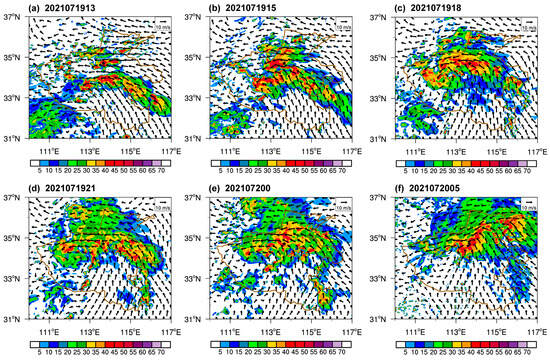
Figure 7.
The same as Figure 4b,d, but for different simulated times. The black stars represent the Zhengzhou station.
3.2.1. Generation Mechanism of the Huang-Huai Vortex
Compared with the results of the ERA5 reanalysis data, the vortex position simulated in this paper was consistent with that of the ERA5 reanalysis data (Figure A3) at the first and second stages. In addition, Fu et al. (2022) found that the HHV in the ERA5 reanalysis data was located in the 475–800 hPa layer [], while the closed vortex was also present below 850 hPa in the numerical experiment, which could also be observed from the radiosonde data (Figure A1). Therefore, numerical simulations that reproduce the evolution of the HHV are beneficial for studying its generation mechanism. Based on this result, the vorticity budget equation in Section 2.3 was used to diagnose the generation mechanism of the HHV. As shown in Figure 8a, the distribution of the relative vorticity source–sink term () was similar to that of the sum of four relative vorticity budget terms (HAV, VAV, TIL, and STR), which means that the values on the left and right sides of Equation (1) were balanced.
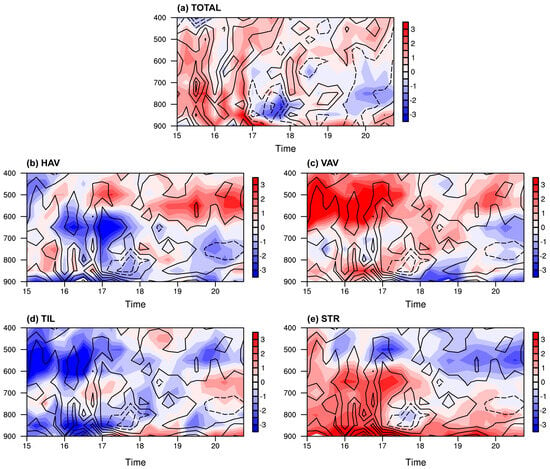
Figure 8.
Key-region-averaged (a) left-hand-side term (i.e., the time derivative) (contour; 10−5 s−1 every 15 min) and the total of four relative vorticity budget terms (shading; 10−8 s−1). (b) HAV, (c) VAV, (d) TIL, and (e) STR terms (shading; 10−8 s−1) and a total of four relative vorticity budget terms (contour; 10−8 s−1) from 900 hPa to 400 hPa.
As shown earlier in Figure 5, the HHV first formed at 850 hPa on 19 July at 1800 UTC. Why did the closed vortex structure first generate from the low level? Figure 8 provides a diagnosis of the mean vorticity in the key region between 900 and 400 hPa between 1500 UTC and 2100 UTC on 19 July. During the generation phase of the HHV, the STR term and VAV term provided the main positive contributions (Figure 8c,e). Among them, the STR term played a major role in the increase in the vorticity tendency, which was about twice as much as the simultaneous VAV term. In contrast, the HAV term below 600 hPa and the TIL term in the middle troposphere and boundary layers mainly decelerated the formation of the HHV above 700 hPa during this period (Figure 8b,d). It can thus be concluded that the HHV was initially generated mainly by the convergence in lower levels. Subsequently, the horizontal convergence of vorticity was further strengthened by the 850 hPa vorticity center lift (vortex rise), and so forth, and after 3 h (from 1800 UTC to 2100 UTC on 19 July), while the HHV developed into a deep system above 600 hPa due to the net-import HAV term between 600 and 500 hPa. This horizontal convergence and vertical vorticity transport formed positive feedback as the main mechanism leading to the generation and deepening of the HHV.
The STR term was mainly affected by the LLJs, and their coupling played an important role in HHV formation. The wind field distribution at 700 hPa and 950 hPa in Henan is given in Figure 9, and the blue contour line highlights the area where the wind speed exceeded 14 m·s−1. The HHV was located on the left side of the BLJs and SLLJs cores, which favored the occurrence of convergence (Figure 9c–f). The period of HHV formation (between 1500 UTC and 1800 UTC on 19 July) was the local nighttime, a time that favors the strengthening of the jets at the low level [,]. The BLJs kept strengthening (Figure 9d,f), the maximum wind speed at the center of the jets exceeded 20 m·s−1 at 950 hPa by 1800 UTC (Figure 9f), and the SLLJs were maintained, which promoted the formation of the HHV.
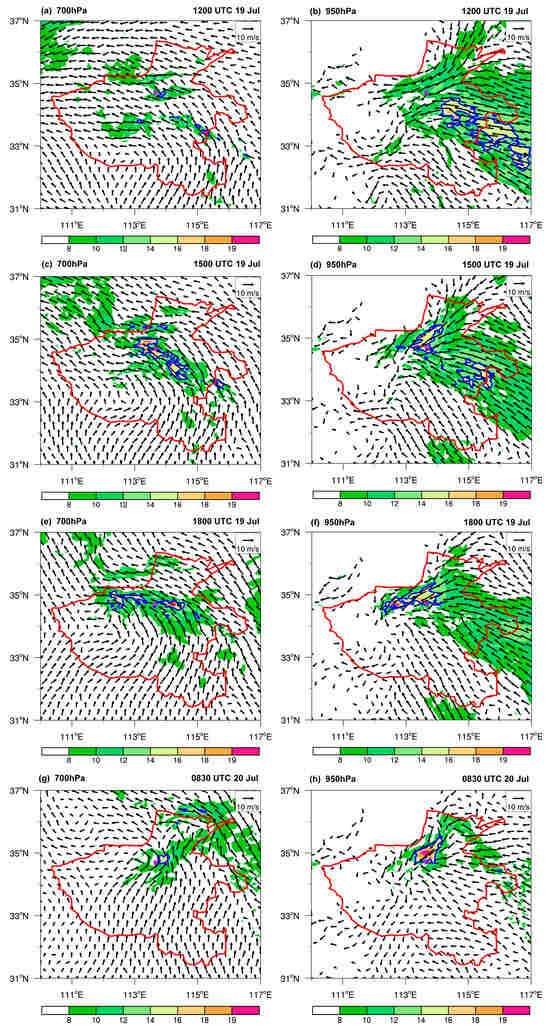
Figure 9.
Distribution of WRF-simulated wind speed (shading, m·s−1) and wind field (vectors; units: m·s−1) at 700 hPa and 950 hPa. The blue contours indicate the great wind speed (above 14 m·s−1). The red line represents the boundary of Henan Province. The purple stars represent the location of the Zhengzhou station.
3.2.2. The Impact of the Huang-Huai Vortex on Extreme Hourly Rainfall
Based on the model’s better control of the HHV generation and developmental stages, the early rainfall reasonably reproduced the formation process of the cold pool. Figure 10a–c show that the evaporation cooling caused the cold pool to gradually extend to the Zhengzhou station after 0600 UTC, and the cold pool developed more deeply to 925 hPa at 0830 UTC on 20 July 2021; the Zhengzhou station was located at the boundary of the cold pool. The distribution of the surface temperature and wind field was similar to the synop observations (Figure 10e,f). The northwest outflow around the Zhengzhou station was obvious at the surface (Figure 10e). The outflow enhanced the convergence at the surface and triggered vertical motion and convection. The increase in the temperature gradient in the direction of northeast and southwest in the cold pool made the BLJs increase (highlighted by yellow boxes in Figure 10a–c). The BLJs and the SLLJs jointly contributed to the generation of the HHV in the first stage, but they played different roles during 0700–0900 UTC on 20 July. The mesoscale convergence (Figure 11a) and ascending motion (Figure 11b) were greatly strengthened at low levels above the Zhengzhou station due to its position at the left side of the strongest BLJ core and the confluence of southeasterly, easterly, and northeasterly winds at 0830 UTC on 20 July (Figure 9h). Meanwhile, the Zhengzhou station is located at the entrance of the SLLJ core (Figure 9g), which favors the occurrence of divergence at 700 hPa (Figure 11a). The vertical shear of horizontal wind between 700 hPa and 950 hPa and the coexistence of divergence at 700 hPa and convergence at 950 hPa were the triggers to produce vertical lifting. Luo and Du (2022) also confirmed the effect of double jets on low-level convergence and divergence on July 20 []. It was due to the cooperation of the SLLJs, the BLJs, and the cold pool that the simulated extreme hourly rainfall location was exactly near the Zhengzhou station, only with a weak intensity.
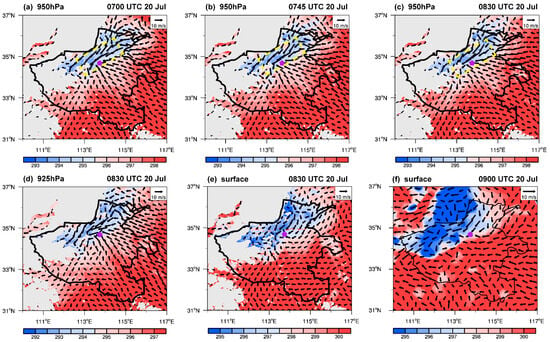
Figure 10.
Distribution of (a–e) WRF-simulated and (f) observed temperature (shading, K) and wind field (vectors; units: m·s−1) at 925 hPa, 950 hPa, and surface. The grey shading represents the terrain above 500 m. The purple stars represent the location of the Zhengzhou station.
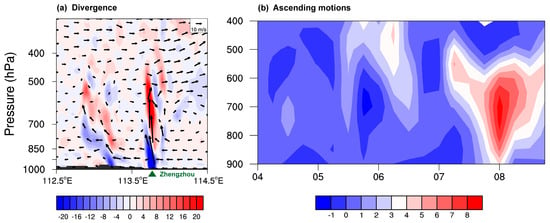
Figure 11.
(a) Longitude–pressure cross sections of divergence (shading; units: 10−4 s−1) and zonal circulation (vectors: zonal wind, units: m s−1; vertical wind, units: 10−1 m s−1) along 34.76°N at 0830 UTC on 20 July 2021. (b) The ascending motions (shading; m s−1) at the Zhengzhou station.
4. Discussion
As described in the above section, the numerical simulation reproduced the generation process of the HHV and the location of the extreme hourly rainfall. Then, why was the simulated extreme hourly rainfall at Zhengzhou station weak? This was mainly related to the evolution of the HHV in the third stage. After 0400 UTC on 20 July, the simulated HHV in this paper continued to move to the northeast (Figure 5), while the HHV in ERA5 moved to the west and the vorticity remained unchanged (Figure A3). As shown in Figure 12, the southerly airflow above 6 m/s at 700 hPa in the southeast of the HHV in ERA5 was much wider and greater than that of the simulated HHV in this paper at 0500 UTC on 20 July.
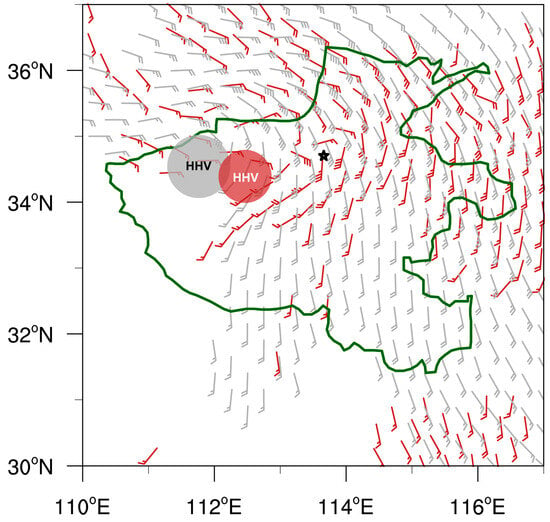
Figure 12.
Wind above 6 m s−1 (a full bar is 4 m s−1) at 700 hPa in ERA5 reanalysis data (grey wind barb) and simulation (red wind barb). The grey and red circles represent the location of the HHV in ERA5 and the simulation, respectively. The black star represents the location of the Zhengzhou station.
Mai et al. (2020) [] defined an MCS as (1) the scale of cloud areas with the temperature of the blackbody (TBB) ≤ −52 °C exceeding 5000 km2 in the horizontal direction, and (2) cloud areas satisfying (1) that last at least 3 h. Referring to previous work, this study used the TBB of the FY-4A AGRI to analyze the evolution of MCSs (Figure 13). Byers and Braham (1949) put forward the concept of a convective cloud merger, and some subsequent studies have pointed out that a convective cloud merger could not only increase the size and intensity of convective clouds, but also improve rainfall efficiency and cause heavy rainfall on the ground [,,,]. From the TBB (Figure 13), several small cloud clusters were continuously generated in Hubei and Anhui in the southerly airflow and were guided by the southwesterly flow to the northeast; they then merged into the meso-α-scale MCSs stagnated in the north of Henan after 0500 UTC on 20 July due to the blockage of the Taihang Mountain []. However, due to the narrower range of southerly airflow in the south of Henan in this simulation, the windspeed and the variation in the wind with the height were smaller, which was not conducive to the triggering of convection in the south, as is also clear from the simulated radar reflectivity in Figure 4d. This may be the main reason for the weak extreme hourly rainfall at the Zhengzhou station in the numerical simulation. This is a direction that can be focused on in future model improvements.
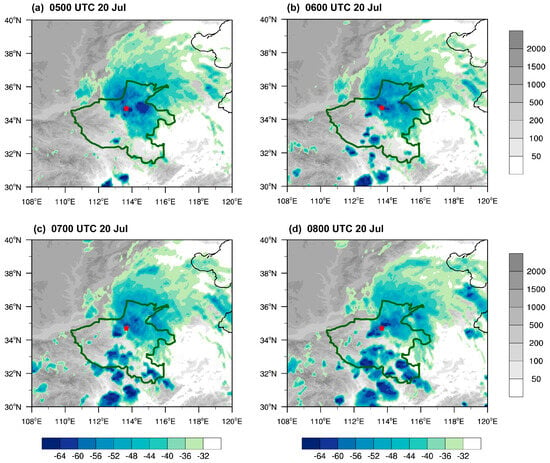
Figure 13.
Distribution of FY-4A TBB (less than −32 °C, colorful shading; °C) and terrain height (grey shading; m). The green line represents the boundary of Henan Province. The red stars represent the location of the Zhengzhou station.
5. Conclusions
The HHV affecting “21·7” ERE was a meso-α-scale vortex over 150 km horizontally, which first produced a closed vortex structure at the 850 hPa level at 1800 UTC on 19 July and developed into a deep system at 550 hPa about 3 h later. The STR term and the VAV term of vorticity provided a major positive contribution in the generation of the HHV. In contrast, the HAV term below 600 hPa and the TIL term in the middle troposphere and boundary layer mainly decelerated the formation of the HHV above 700 hPa during this period. The vertical upward motion and vertical vorticity transport brought by the convergence made the vortex in the boundary layer rise, further enhancing the horizontal convergence of vorticity. This horizontal convergence and vertical vorticity transport formed positive feedback, which was the main mechanism leading to the generation and deepening of the HVV. The evolution of LLJs, especially the BLJs, played an important role in the generation of the HHV. The STR term was mainly influenced by the BLJs and SLLJs; therefore, the enhanced BLJs and maintained SLLJs during the night (between 1500 UTC and 1800 UTC on 19 July) promoted the formation of the HHV.
The location of the simulated extreme hourly rainfall at the Zhengzhou station was accurate, but the intensity was underestimated because the generation and development of the HHV were better reproduced, but after that, the HHV moved northeastward. The extreme hourly rainfall that happened to occur at the Zhengzhou station was mainly caused by the simulated cold pool, the BLJs, and the SLLJs’ high- and low-level configurations. The early rainfall benefitted from the control of the HHV and reasonably reproduced the development of the cold pool around the Zhengzhou station, which strengthened the surface convergence and promoted the vertical motion during 0700–0900 UTC on 20 July. In addition, the warm and moist air in southern Henan Province rose after encountering the cold pool, which was favorable for triggering convection. The increase in the temperature gradient in the northeast and southwest directions in the north of Henan made the BLJs increase. The mesoscale convergence and upward motion at 950 hPa over the Zhengzhou station were greatly enhanced, and at the same time, the Zhengzhou station is located at the entrance of the SLLJ core, which was favorable for the occurrence of divergence at 700 hPa. The coexistence of such divergence and low-level convergence also promoted the vertical upward motion. These configurations are illustrated in a conceptual model given in Figure 14. However, the HHV of the numerical simulation was to the northeast at the time of the extreme hourly rainfall, resulting in a narrow range of southerly airflow in southern Henan, which was not conducive to the triggering of convection in the south. This may have been the main reason for the weak extreme hourly rainfall at the Zhengzhou station in the numerical simulation.
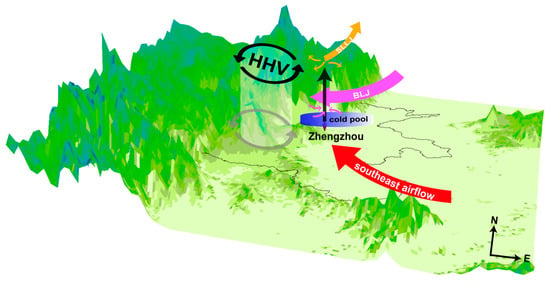
Figure 14.
Schematic diagram illustrating the configurations of BLJ (thick pink arrow), SLLJ (thick yellow arrow), HHV (black, grey circles, and white shading imply the deep HHV), and cold pool (blue cylinder; gradients represent temperature gradients) of the mesoscale system responsible for the simulated extreme rainfall that happened to occur at Zhengzhou. The thin pink (yellow) arrows denote convergence (divergence) at the left side (entrance) of the strongest BLJ (SLLJ) core. The black arrow denotes the vertical upward motion at Zhengzhou.
Author Contributions
Conceptualization, T.C. and J.L.; methodology, L.X., W.C., H.L., T.C. and S.F.; software, L.X.; formal analysis, L.X., T.C. and J.L.; investigation, L.X., Y.H. and S.Z.; data curation, B.L.; writing—original draft preparation, L.X.; writing—review and editing, T.C. and J.L.; validation, Y.L. and X.S.; visualization, L.X.; supervision, B.W. All authors have read and agreed to the published version of the manuscript.
Funding
This research is supported by the National Key Research and Development Program of China (Grant Nos. 2022YFB2403002).
Data Availability Statement
The FY-4A AGRI radiance and TBB data were freely downloaded from http://satellite.nsmc.org.cn and accessed on 7 September 2023, along with the conventional observations and the hourly rainfall observations at national meteorological stations from the China Meteorological Administration. Part of the software was associated with the National Center for Atmospheric Research (NCAR) using version 3.9 of the WRF and WRF-3DVar system. The initial data were provided by the NCEP Global Forecast System products of the 0.25° × 0.25° GFS datasets, available at https://rda.ucar.edu/datasets/ds084.1/, accessed on 7 September 2023.
Conflicts of Interest
The authors declare no conflicts of interest.
Appendix A
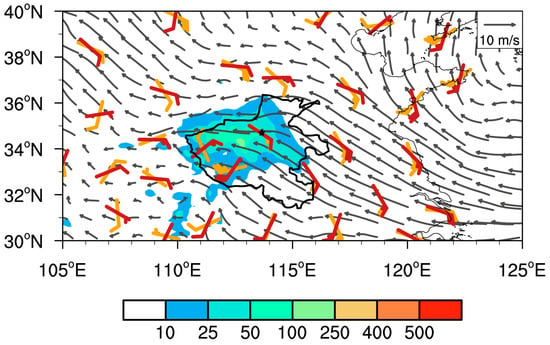
Figure A1.
The 24 h cumulative rainfall (shading; mm) from 1200 UTC on 19 July to 1200 UTC on 20 July, horizontal wind at 850 hPa (vectors; m·s−1) at 0000 UTC on 20 July from ECMWF forecasts, and horizontal distribution of wind field at 700 hPa (orange wind barb, units: m·s−1) and 850 hPa (red wind barb, units: m·s−1) at 0000 UTC on 20 July from radiosonde data. The black star represents the Zhengzhou station.
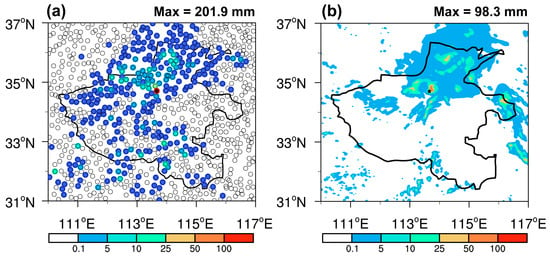
Figure A2.
The spatial distribution of observed (a) and WRF-simulated (b) 1 h cumulative rainfall (mm) from 08 UTC to 09 UTC on 20 July. The black lines in (a,b) represent the boundary of Henan Province. The black stars represent the Zhengzhou station.
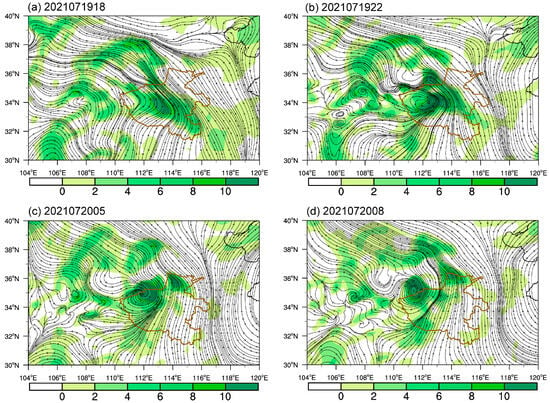
Figure A3.
Relative vorticity (shading; 10−5 s−1) and stream field (black lines with arrows) at 600 hPa from ERA5 reanalysis data.
References
- Luo, Y.; Du, Y. The Roles of Low-level Jets in “21·7” Henan Extremely Persistent Heavy Rainfall Event. Adv. Atmos. Sci. 2023, 40, 350–373. [Google Scholar] [CrossRef]
- Fu, S.; Zhang, Y.; Wang, H.; Tang, H.; Li, W.; Sun, J. On the evolution of a long-lived mesoscale convective vortex that acted as a crucial condition for the extremely strong hourly precipitation in Zhengzhou. J. Geophys. Res. Atmos. 2022, 127, e2021JD036233. [Google Scholar] [CrossRef]
- Li, W.; Ma, H.; Fu, R.; Han, H.; Wang, X. Development and maintenance mechanisms of a long-lived mesoscale vortex which governed the earlier stage of the “21.7” Henan torrential rainfall event. Front. Earth Sci. 2022, 10, 909662. [Google Scholar] [CrossRef]
- Xu, H.; Duan, Y.; Li, Y.; Wang, H. Indirect effects of binary typhoons on an extreme rainfall event in Henan Province, China From 19 to 21 July 2021: 1. Ensemble-based analysis. J. Geophys. Res. Atmos. 2022, 127, e2021JD036265. [Google Scholar] [CrossRef]
- Kong, Q.; Fu, J.L.; Chen, Y.; Zhang, F.; Hu, N. Evolution Characteristics and Formation Analysis of Mesoscale Low- level Jet and Vortex in Henan Province During the July 2021 Severe Torrential Rain. Meteorol. Mon. 2022, 48, 1512–1524. (In Chinese) [Google Scholar] [CrossRef]
- Xu, L.; Cheng, W.; Deng, Z.; Liu, J.; Wang, B.; Lu, B.; Wang, S.; Dong, L. Assimilation of the FY-4A AGRI clear-sky radiance data in a regional numerical model and its impact on the forecast of the “21·7” Henan extremely persistent heavy rainfall. Adv. Atmos. Sci. 2023, 40, 920–936. [Google Scholar] [CrossRef]
- Yin, R.; Han, W.; Wang, H.; Wang, J. Impacts of FY-4A GIIRS water vapor channels data assimilation on the forecast of “21·7” extreme rainstorm in Henan, China with CMA-MESO. Remote Sens. 2022, 14, 5710. [Google Scholar] [CrossRef]
- Deng, L.; Feng, J.; Zhao, Y.; Bao, X.; Huang, W.; Hu, H.; Duan, Y. The remote effect of binary Typhoon Infa and Cempaka on the “21.7” heavy rainfall in Henan Province, China. J. Geophys. Res. Atmos. 2022, 127, e2021JD036260. [Google Scholar] [CrossRef]
- Xu, H.; Duan, Y.; Li, Y.; Wang, H. Indirect effects of binary typhoons on an extreme rainfall event in Henan Province, China from 19 to 21 July 2021: 2. Numerical study. J. Geophys. Res. Atmos. 2022, 127, e2021JD036083. [Google Scholar] [CrossRef]
- Yin, J.; Gu, H.; Liang, X.; Yu, M.; Sun, J.; Xie, Y.; Li, F.; Wu, C. A possible dynamic mechanism for rapid production of the extreme hourly rainfall in Zhengzhou City on 20 July 2021. J. Meteorol. Res. 2022, 36, 1–20. [Google Scholar] [CrossRef]
- Wang, S.; Yu, E.; Wang, H. A simulation study of a heavy rainfall process over the Yangtze River valley using the two-way nesting approach. Adv. Atmos. Sci. 2012, 29, 731–743. [Google Scholar] [CrossRef]
- Fu, S.; Li, W.; Ling, J. On the evolution of a long-lived mesoscale vortex over the Yangtze River Basin: Geometric features and interactions among systems of different scales. J. Geophys. Res. Atmos. 2015, 120, 11889–11917. [Google Scholar] [CrossRef]
- Zhang, Y.; Zhang, F.; Davis, C.A.; Sun, J. Diurnal evolution and structure of long-lived mesoscale convective vortices along the mei-yu front over the East China plains. J. Atmos. Sci. 2018, 75, 1005–1025. [Google Scholar] [CrossRef]
- Su, A.; Cui, L.; Xu, W.; Lin, L. Comparative analysis on low vortex characteristics in two extra heavy rain processes over Henan in July 2010. Torrential Rain Disasters 2012, 31, 328–335. (In Chinese) [Google Scholar]
- Zhang, Y.; Wang, X.; Liang, J.; Li, Z.; Wang, H. Analysis on mesoscale characteristics of two vortex rainstorms in the Huanghe-Huaihe regions. Torrential Rain Disasters 2013, 32, 303–313. (In Chinese) [Google Scholar] [CrossRef]
- Sun, J.; Zhao, S.; Xu, G.; Meng, Q. Study on a mesoscale convective vortex causing heavy rainfall during the Mei-yu season in 2003. Adv. Atmos. Sci. 2010, 27, 1193–1209. [Google Scholar] [CrossRef]
- Weisman, M.L.; Davis, C.A. Mechanisms for the generation of mesoscale vortices within quasi-linear convective systems. J. Atmos. Sci. 1998, 55, 2603–2622. [Google Scholar] [CrossRef][Green Version]
- Hersbach, H.; Bell, B.; Berrisford, P.; Hirahara, S.; Horanyi, A.; Muñoz-Sabater, J.; Nicolas, J.; Peubey, C.; Radu, R.; Schepers, D. The ERA5 global reanalysis. Q. J. R. Meteorol. Soc. 2020, 146, 1999–2049. [Google Scholar] [CrossRef]
- Wang, X.; Liu, Y. Causes of extreme rainfall in May 2013 over Henan Province: The role of the southwest vortex and low-level jet. Theor. Appl. Climatol. 2017, 129, 701–709. [Google Scholar] [CrossRef]
- Du, Y.; Zhang, Q.; Chen, Y. Numerical simulations of spatial distributions and diurnal variations of low-level jets in China during early summer. J. Clim. 2014, 27, 5747–5767. [Google Scholar] [CrossRef]
- Dong, P.M.; Zhao, S.X. A diagnostic study of mesoscale lows (disturbances) on Meiyu front and associated heavy rainfall. Chin. J. Atmos. Sci. 2004, 28, 876–891. (In Chinese) [Google Scholar] [CrossRef]
- Chen, S.; Frank, W.M. A numerical study of the genesis of extratropical convective mesovortices. Part I: Evolution and dynamics. J. Atmos. Sci. 1993, 50, 2401–2426. [Google Scholar] [CrossRef]
- Yin, J.; Gu, H.; Yu, M.; Bao, X.; Xie, Y.; Liang, X.D. Synergetic roles of dynamic and cloud microphysical processes in extreme short-term rainfall: A case-study. Q. J. R. Meteorol. Soc. 2022, 148, 3660–3676. [Google Scholar] [CrossRef]
- Thompson, G.; Rasmussen, R.M.; Manning, K. Explicit forecasts of winter precipitation using an improved bulk microphysics scheme. Part I: Description and sensitivity analysis. Mon. Weather Rev. 2004, 132, 519–542. [Google Scholar] [CrossRef]
- Iacono, M.J.; Delamere, J.S.; Mlawer, E.J.; Clough, S.A. Development and evaluation of RRTMG_SW, a shortwave radiative transfer model for general circulation model applications. In Proceedings of the 14th Atmos Radiation Measurement (ARM) Science Team Meeting, Albuquerque, NM, USA, 22–26 March 2004. [Google Scholar]
- Iacono, M.J.; Mlawer, E.J.; Clough, S.A.; Morcrette, J.J. Impact of an improved longwave radiation model, RRTM, on the energy budget and thermodynamic properties of the NCAR community climate model, CCM3. J. Geophys. Res. Atmos. 2000, 105, 14873–14890. [Google Scholar] [CrossRef]
- Clough, S.A.; Shephard, M.W.; Mlawer, E.J.; Delamere, J.S.; Iacono, M.J.; Cady-Pereira, K.; Boukabara, S.; Brown, P.D. Atmospheric radiative transfer modeling: A summary of the AER codes. J. Quant. Spectrosc. Radiat. Transf. 2005, 91, 233–244. [Google Scholar] [CrossRef]
- Hong, S.; Lim, J.O.J. The WRF single-moment 6-class microphysics scheme (WSM6). Asia-Pac. J. Atmos. Sci. 2006, 42, 129–151. [Google Scholar]
- Tewari, M.; Chen, F.; Wang, W.; Dudhia, J.; Lemone, M.A.; Mitchell, K.; Ek, M.; Gayno, G.; Wegiel, J.; Cuenca, R. Implementation and verification of the Unified NOAH land surface model in the WRF model. In Proceedings of the 20th Conference on Weather Analysis and Forecasting/16th Conf. on Numerical Weather Prediction, Seattle, WA, USA, 14 January 2004. [Google Scholar]
- Tiedtke, M. A comprehensive mass flux scheme for cumulus parameterization in large-scale models. Mon. Weather Rev. 1989, 117, 1779–1800. [Google Scholar] [CrossRef]
- Yang, Y.; Gu, W.; Zhao, R.; Liu, J. The statistical analysis of low vortex during Meiyu season in the lower reaches of the Yangtze. J. Appl. Meteorol. Sci. 2010, 21, 11–18. (In Chinese) [Google Scholar] [CrossRef][Green Version]
- Kirk, J.R. Comparing the dynamical development of two mesoscale convective vortices. Mon. Weather Rev. 2003, 131, 862–890. [Google Scholar] [CrossRef]
- Ran, L.; Li, S.; Zhou, Y.; Yang, S.; Ma, S.; Zhou, K.; Shen, D.; Jiao, B.; Li, N. Observational analysis of the dynamic, thermal, and water vapor characteristics of the “7.20” extreme rainstorm event in Henan Province. Chinese J. Atmos. Sci. 2021, 45, 1366–1383. (In Chinese) [Google Scholar]
- Blackadar, A.K. Boundary layer wind maxima and their significance for the growth of nocturnal inversions. Bull. Am. Meteorol. Soc. 1957, 38, 283–290. [Google Scholar] [CrossRef]
- Du, Y.; Chen, G. Heavy rainfall associated with double low-level jets over southern China. Part I: Ensemble-Based Analysis. Mon. Weather Rev. 2018, 146, 3827–3844. [Google Scholar] [CrossRef]
- Mai, Z.; Fu, S.; Sun, J.; Hu, L.; Wang, X. Key statistical characteristics of the mesoscale convective systems generated over the Tibetan Plateau and their relationship to precipitation and southwest vortices. Int. J. Climatol 2020, 36, 3148–3160. [Google Scholar] [CrossRef]
- Byers, H.R.; Battan, L.J. Some Effects of Vertical Wind Shear on Thunderstorm Structure. Bull. Am. Meteorol. Soc. 1949, 30, 168–175. [Google Scholar] [CrossRef]
- Bennetts, D.; Bader, M.; Marles, R. Convective cloud merging and its effect on rainfall. Nature 1982, 300, 42–45. [Google Scholar] [CrossRef]
- Wescott, N.E. A historical perspective on cloud mergers. Bull. Am. Meteorol. Soc. 1984, 5, 219–226. [Google Scholar] [CrossRef][Green Version]
- Tian, S. Effect of merging of the convective cloud clusters on occurrence of heavy rainfall. Adv. Atmos. Sci. 1991, 8, 499–504. [Google Scholar] [CrossRef]
- Peng, W.; Xu, X.; Xue, M.; Zhang, C.; Wang, Y.; Zhao, K.; Zhou, A.; Zhang, S.; Zhu, K. On key dynamical processes supporting the 21.7 Zhengzhou record-breaking hourly rainfall in China. Adv. Atmos. Sci. 2023, 40, 337–349. [Google Scholar] [CrossRef]
Disclaimer/Publisher’s Note: The statements, opinions and data contained in all publications are solely those of the individual author(s) and contributor(s) and not of MDPI and/or the editor(s). MDPI and/or the editor(s) disclaim responsibility for any injury to people or property resulting from any ideas, methods, instructions or products referred to in the content. |
© 2024 by the authors. Licensee MDPI, Basel, Switzerland. This article is an open access article distributed under the terms and conditions of the Creative Commons Attribution (CC BY) license (https://creativecommons.org/licenses/by/4.0/).