Article

A Focusing Method of Buildings for Airborne Circular SAR

College of Electronic Science and Technology, National University of Defense Technology, Changsha 410073, China
*
Author to whom correspondence should be addressed.
Remote Sens. 2024, 16(2), 253; https://doi.org/10.3390/rs16020253
Submission received: 30 November 2023 / Revised: 30 December 2023 / Accepted: 3 January 2024 / Published: 9 January 2024
(This article belongs to the Topic Radar Signal and Data Processing with Applications)

Abstract

:
Airborne circular synthetic aperture radar (CSAR) can realize high-resolution imaging of the scene over 360 degrees azimuth angle variation. Aiming at the problem of focusing of buildings for the airborne CSAR, this paper first analyzes the phase errors of CSAR buildings focusing in detail, and the analytic relationship between the scatterer height and azimuth focusing quality is deduced. Then, a focusing method of CSAR buildings based on the back projection algorithm is proposed. This method adopts the processing strategy of multi-layers imaging, and it is able to improve azimuth focusing quality of the buildings which have large height dimension. The proposed method is especially suitable for the high-resolution imaging and monitoring of the urban site with high-rise buildings in the airborne CSAR scenario. The correctness of the theoretical analysis and the validity of the proposed method are verified by using both simulation results and Ku-band airborne CSAR real data processing results.

1. Introduction

Synthetic aperture radar (SAR) is an active microwave remote sensing system [1,2]. Compared with other imaging sensors, SAR has the advantage of being able to provide day-and-night, weather-independent and high-resolution images of the observed scene, so it has become one of the most important techniques in a multitude of applications such as remote sensing, geosciences, reconnaissance, surveillance and so on [3,4].
Stripmap SAR is the most mature monostatic linear SAR (LSAR) mode. Its characteristic is the radar moves along a linear trajectory, so a linear synthetic aperture is formed. Different from the LSAR mode, circular SAR (CSAR) is carried out by flying a circular trajectory while the antenna always illuminating the same spot, so a circular synthetic aperture is formed [5,6,7]. Some unique advantages are brought out for CSAR due to its special configuration. First of all, multi-angle imaging and observation over 360 degrees azimuth angle variation can be achieved in the CSAR mode, and more abundant backscattering information can be obtained [8,9]. In addition, CSAR has the potential of achieving sub-wavelength horizontal resolutions for isotropic scatterers [10]. Finally, 3-D reconstruction results can be obtained by using CSAR mode [11,12,13,14]. Due to the abovementioned advantages, CSAR has attracted more and more attentions recently, and becomes a promising SAR imaging mode.
The approaches to deal with CSAR data mainly include two categories, i.e., coherent imaging of the full circular synthetic aperture [10,15], and incoherent imaging [11,12,13,14]. Coherent imaging of the full circular synthetic aperture is mainly to achieve sub-wavelength horizontal resolutions and 3-D reconstructions for isotropic scatterers. However, for anisotropic scatterers, coherent imaging approach may actually deteriorate the image quality conversely [16]. Incoherent imaging is another important approach. It is especially suitable for real scenario consisting of large number of anisotropic scatterers. In this approach, the full circular synthetic aperture is firstly divided into multiple arc-shaped apertures with different azimuthal angels. Then, multiple images under different perspectives are obtained by processing different arc-shaped synthetic aperture data. The multi-angle images can be noncoherent added to produce the final CSAR image, or be processed by the generalized likelihood ratio test method to analyze the scattering properties of the targets, or be arranged in chronological order to form a video. For the incoherent imaging of CSAR, the key step is to achieve high-quality multi-angle images by using the arc-shaped synthetic aperture data.
SAR image formation algorithms can be divided into the frequency domain algorithms, the time domain algorithms, and the hybrid-domain algorithms. The frequency domain algorithms, such as the range-Doppler algorithm, the chirp scaling algorithm, and the Omega-k algorithm and so on, are developed from the LSAR mode [17]. The main advantage of the frequency domain algorithms is the high processing efficiency. However, their adaptations to the complex imaging geometry is poor, and they can only be applied to LSAR mode or CSAR mode with small arc-shaped synthetic aperture. When dealing with large arc-shaped synthetic aperture data, the frequency domain algorithms are difficult to obtain accurate imaging results [18]. Therefore, the time domain algorithms are mostly adopted in the CSAR imaging [10,15]. Back projection (BP) algorithm is one of the time domain algorithms, which can be regarded as a linear transformation from the radar echo to the SAR image.BP algorithm can work with almost all SAR configurations to achieve accurate imaging results. However, it has huge computational burden. To improve the imaging efficiency, fast factorization back projection (FFBP) algorithm is proposed to deal with the CSAR data [10,15]. FFBP algorithm can greatly improve the imaging efficiency while achieving almost the same perfect image quality with the BP algorithm [19,20]. The computational burden analysis in [21] shows that the imaging efficiency of FFBP algorithm can reach the same level as that of the frequency domain algorithms. Meanwhile, due to the inherent processing architecture of the BP algorithm and the FFBP algorithm, their imaging efficiency can be further improved through parallel processing. Therefore, the time domain BP and FFBP are the mainly adopted algorithms in CSAR imaging at present.
Buildings are the main targets in the urban scene. For the imaging of buildings, the average height plane is usually adopted to form the imaging grids. However, different from the traditional LSAR mode, the azimuth focusing quality is more sensitive to the height of the scatterer in CSAR mode. For LSAR imaging, if the true height of the scatterer is not equal to that of the imaging plane, i.e., the scatterers are not on the imaging grids, the geometric distortion phenomenon such as foreshortening and layover may appear in the imaging results, but the azimuth focusing quality is almost not affected [22].
This is not the case for the CSAR mode. When the scatterers are not on the imaging grid, both geometric distortion and azimuth defocusing can occur for the CSAR imaging [23]. For the focusing of buildings in CSAR, when BP or FFBP algorithm is adopted with average height plane, the scatterers that out of the imaging grids will always exist. In this case, the CSAR imaging results of these scatterers will appear azimuth defocusing and smearing phenomenon, and thus the detection and recognition of the buildings from the CSAR image will be affected.
Among the current CSAR literature, most of them only consider the imaging of scenes with small height [10,24,25], such as parking lot, square, forest, etc. In these scenarios, the imaging grids are usually constructed by using the digital elevation model (DEM) data or average height of the scene. According to the subsequent analysis in this paper, when the true height of the scatterer is not much different from the height of imaging plane, the resulting phase error is not enough to cause azimuth defocusing. Therefore, it is valid to adopt the above way to deal with CSAR scenes with small height. However, the accurate focusing of the buildings with large height were not fully considered. Only few literature such as [9,23] presented and analyzed the defocusing phenomenon in the imaging of the aircraft, but no specific and detailed solutions were given.
To improve the focusing quality of the buildings in the CSAR imaging, a novel method is proposed in this paper. Firstly, the range errors that lead to azimuth defocusing for CSAR buildings imaging by using BP algorithms are analyzed in detail, and the relationship between the azimuth focusing quality and the height of the scatterer away from the imaging plane is deduced. Then, on a basis of this deduced relationship, an imaging method based on the BP algorithm is proposed to achieve high-quality image of CSAR buildings. The proposed method adopts the strategy of multi-layers imaging. It first performs BP imaging on multiple horizontal planes with different heights. Then a reference horizontal plane is selected, and the offsets of the scatterer relative to the grid of this plane are estimated by using the images with multiple heights. Finally, the imaging is performed again on the reference plane, and then the filtered offsets estimations are used to compensate the slant range in the BP process, so as to achieve improved CSAR buildings imaging results. The correctness of the theoretical analysis and the validity of the proposed method are verified by the simulation results and the airborne CSAR real data processing results.
The main contributions of this article can be summarized as follows:
  • A detailed analysis about the range errors that lead to azimuth defocusing for CSAR buildings imaging, and an analytical relationship between the azimuth focusing quality and the height of the scatterer away from the imaging plane are given for the first time. This analytical relationship can be independently used as a criterion to judge whether a good focusing CSAR image can be achieved by using BP algorithm on a certain height plane or not.
  • An focusing method based on BP algorithm is proposed for CSAR buildings imaging. The proposed method can improve the focusing quality of the buildings with large height in the CSAR mode.
  • The proposed method is used to process the airborne CSAR real data, and the improved imaging results of high-rise buildings are achieved. It is a good reference for the subsequent real data processing under similar scenarios.
The rest of this paper is organized as follows. In Section 2, the geometric configuration and signal model of CSAR imaging are described, and the range errors of the buildings imaging are analyzed in detail. Section 3 presents the proposed focusing method of the buildings. Experimental results with the simulated data and the airborne CSAR real data are presented in Section 4. Finally, the conclusion of the paper is provided in Section 5.

2. Problem Statement

2.1. Imaging Geometry and Signal Model

Figure 1 gives the imaging geometry of the airborne CSAR. The airborne radar platform moves along a circular trajectory around the observed scene. Within a certain range of azimuth perspectives, the motion trajectory is an arc, and an arc-shaped synthetic aperture is formed, as denoted by the red curve in Figure 1. O is the center of the arc-shaped synthetic aperture, and θ denotes the elevation angle of the antenna. ϕ n represents the arc angle between the synthetic aperture center O and the position of the airborne radar platform at slow time n. The variables Δ x n , Δ y n , and Δ z n represent the antenna displacements from the center O at slow time n along the x, y, and z directions, respectively. x ¯ , y ¯ , and z ¯ are the ranges from the center O to the scatterer in their respective directions. r n is the instantaneous distance from the radar to the scatterer at slow time n, and r ¯ is the distance from the center O to the scatterer, i.e., r ¯ = x ¯ 2 + y ¯ 2 + z ¯ 2 .
Assuming that a linear frequency modulation (LFM) signal is transmitted from the radar, and its mathematical expression is
s ( t ) = w ( t ) exp ( j 2 π f 0 t + j π K r t 2 ) ,
where w ( t ) denotes the envelope of the LFM signal, t denotes the fast time, f 0 denotes the center frequency of the signal and K r denotes the chirp rate. Then, the signal reflected by the scatterer will be received by the radar. After demodulation and range compression, the received signal can be represented as
g n ( t ) = G ( t 2 r n c ) · exp ( j 4 π f 0 r n c ) ,
where c denotes the speed of the wave. G ( · ) represents the envelope of the range-compressed signal, and it has the form of sinc function.

2.2. Analysis on the Range Errors in Buildings Focusing

The time domain BP algorithm is mainly adopted in the CSAR imaging at present. As the BP algorithm itself can be seen as an accurate linear transformation process, this section will analyze the range errors of the buildings imaging in CSAR mode based on the BP algorithm.
Assuming that the imaging grids are generated by using the horizontal plane with a certain height. The instantaneous distance from a grid to the radar at slow time n is assumed to be r n , then the value of this grid after BP imaging can be represented as [26]:
I = n N g n 2 r n c exp j 4 π f 0 r n c = n N G 2 r n r n c exp j 4 π f 0 r n r n c = n N G 2 Δ r n c exp j 4 π f 0 Δ r n c ,
where Δ r n = r n r n . If Δ r n = 0 , i.e., the scatterer is on the imaging grid, then (3) is an exact coherent accumulation, and accurate focusing results will be obtained. If Δ r n 0 , then the existence of Δ r n will result in residual phase errors in (3), and thus affect the coherent accumulation, leading to the azimuth defocusing phenomenon.
According to the geometric relationship shown in Figure 1, r n and r n can be respectively represented as:
r n = ( x ¯ + Δ x n ) 2 + ( y ¯ + Δ y n ) 2 + ( z ¯ + Δ z n ) 2 r n = ( x ¯ + Δ x n + δ x ) 2 + ( y ¯ + Δ y n + δ y ) 2 + ( z ¯ + Δ z n + δ z ) 2
where δ x , δ y , and δ z respectively denote the offsets between the coordinates of the scatterer and the imaging grid in their respective directions. Therefore, except for the residual motion error of the platform, the offsets between the scatterer and the imaging grid are the other nonnegligible factor that may affect the BP imaging results. These offsets are mainly caused by the fact that scatterers are not on the imaging grid.
For the ideal linear trajectory, Δ y n = 0 , and Δ z n = 0 . In addition, δ x can also be assumed to be 0 if the imaging grids are dense enough. At this time, r n and r n respectively become:
r n = ( x ¯ + Δ x n ) 2 + y ¯ 2 + z ¯ 2 r n = ( x ¯ + Δ x n ) 2 + ( y ¯ + δ y ) 2 + ( z ¯ + δ z ) 2
Figure 2 gives the imaging geometry in the zero-doppler plane. It is known from the geometry illustrated in Figure 2 that
y ¯ 2 + z ¯ 2 = y ¯ + δ y 2 + z ¯ + δ z 2 .
Therefore, it is seen that Δ r n is always going to be approximately zero for ideal linear trajectory. That is the reason why the azimuth defocusing phenomenon scarcely appear in traditional LSAR mode.
However, for CSAR mode, the cylindrical symmetric geometry no longer holds. At this time, the existence of δ y and δ z in (4) will result in residual range errors, which is equivalent to the residual motion errors added to each instantaneous radar position for each grid. If the residual range errors are too large, the azimuth focusing performance may be affected [27].
By performing the first-order Taylor series approximation for r n and r n in (4) respectively, we can get the expressions shown in (7).
r n r ¯ + Δ x n 2 + Δ y n 2 + Δ z n 2 + 2 x ¯ Δ x n + 2 y ¯ Δ y n + 2 z ¯ Δ z n 2 r ¯ r n r ¯ + Δ x n 2 + δ x 2 + 2 x ¯ Δ x n x ¯ δ x Δ x n δ x 2 r ¯ + Δ y n 2 + δ y 2 + 2 y ¯ Δ y n y ¯ δ y Δ y n δ y 2 r ¯ + Δ z n 2 + δ z 2 + 2 z ¯ Δ z n z ¯ δ z Δ z n δ z 2 r ¯
Therefore, the residual range error Δ r n for each grid can be represented as:
Δ r n = δ x Δ x n + δ y Δ y n + δ z Δ z n r ¯ + 2 δ x x ¯ + 2 δ y y ¯ + 2 δ z z ¯ δ x 2 δ y 2 δ z 2 2 r ¯ .
The second fraction term in (8) is independent of the slow time n, and thus it has no effect on the azimuth focusing. However, the first fraction term in (8) is the function of the slow time n, and it is the main factor that affects azimuth focusing performance. If it is a linear function about the arc angle ϕ n , the resulting impulse response will be shifted along the azimuth direction. If it is a quadratic or higher order function about the arc angle ϕ n , azimuth defocusing will occur in the resulting image. This effect is the same as that caused by the residual motion errors [26,27].
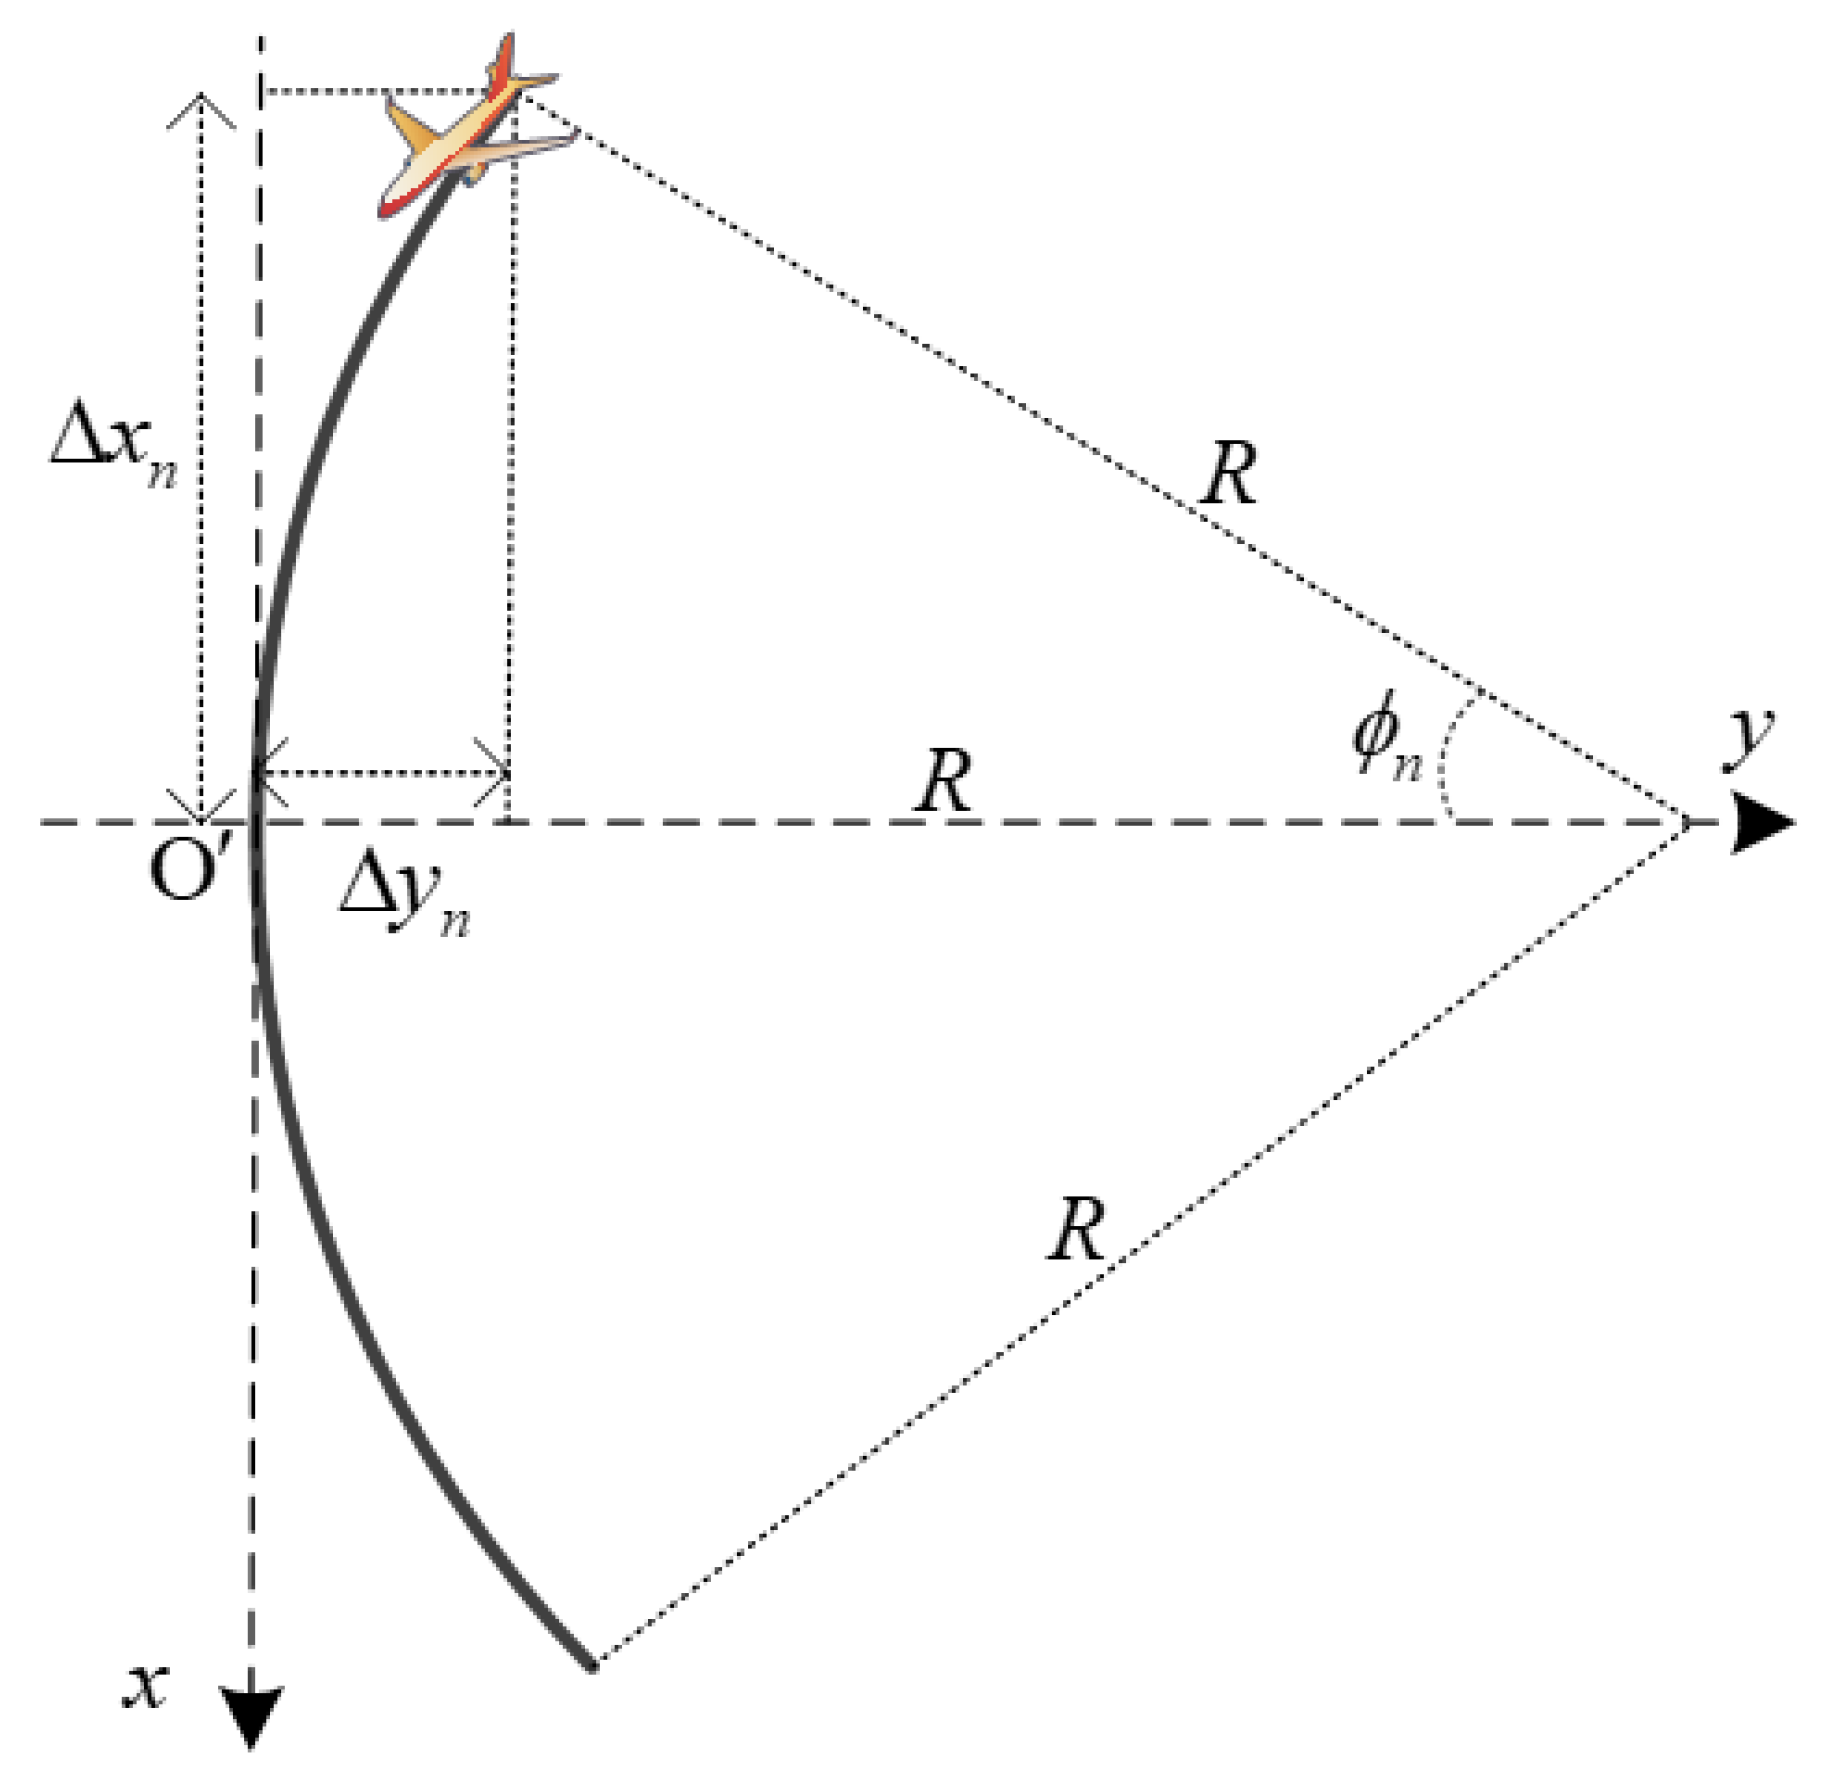
Suppose that the arc-shaped trajectory is parallel to the horizontal plane, i.e., Δ z n = 0 . The top view of the arc-shaped trajectory is shown in Figure 3, where R denotes the radius of the corresponding circle.
Ignoring the constant terms in (8) that are independent of the slow time n, and supposing δ x = 0 , then the range error Δ r n can be simplified to
Δ r n = δ x Δ x n + δ y Δ y n + δ z Δ z n r ¯ = δ y Δ y n r ¯ .
It is seen from the geometric relationship in Figure 3 that
Δ y n = R 1 cos ϕ n = 2 R sin 2 ϕ n / 2 0.5 R ϕ n 2 .
Meanwhile, the side-looking geometry of the airborne SAR tells us that δ y = δ z / tan ( θ ) and sin ( θ ) = R / r ¯ . Substituting the above relationships into (9), we have
Δ r n 0.5 R ϕ n 2 δ z / tan ( θ ) r ¯ = cos ( θ ) · δ z · ϕ n 2 2 .
It can be seen from (11) that, the range error Δ r n is the quadratic function of ϕ n . It is found that when the maximum phase error caused by this range error is larger than π / 2 , the azimuth focusing performance will be deteriorated. Therefore, according to the constraint 4 π Δ r n / λ π / 2 , the following inequalities should be obeyed in order to ensure the azimuth focusing performance:
δ z λ 4 cos θ ϕ n , max 2 ,
or
ϕ n , max λ 4 cos θ δ z ,
where ϕ n , max denotes the maximum value of ϕ n along the arc-shaped synthetic aperture.
It can be seen from (12) and (13) that, in order to ensure the azimuth focusing performance of the scatterer by using BP algorithm on a imaging plane, the maximum height difference between the scatterer and the imaging plane should be smaller than λ / 4 cos ( θ ) ϕ n , max 2 under a deterministic arc-shaped trajectory configuration, or the maximum arc angle of the trajectory should be smaller than λ / δ z cos ( θ ) under the case that the height difference between the scatterer and the imaging plane is known.

3. Method

It is seen from the analysis in Section 2.2 that, only if the height difference between the scatterer and the imaging plane satisfy (12), good focusing of the scatterer can be obtained under a deterministic CSAR acquisition configuration. However, this condition would not be always satisfied for the imaging of buildings with large height. In order to realize accurate focusing of the buildings, a novel method based on BP algorithm is proposed in this Section.
The proposed method adopts the strategy of multi-layers imaging. It first performs BP imaging on multiple horizontal planes with different heights. Then a reference horizontal plane is selected, and the offsets of the scatterer relative to the grid of this plane are estimated by using the images with multiple heights. Finally, the imaging is performed again on the reference plane, and the filtered offsets estimations are used to compensate the slant range of the grids in the BP process, so as to achieve improved CSAR buildings imaging results.

3.1. Position Tracking of the Scatterer on Different Planes

Due to the side-looking geometry of SAR, a fixed scatterer has different imaging positions on the planes with different heights. Tracking the positions of the scatterer on the imaging planes with different heights can help us to estimate the coordinates offsets of the scatterer relative to the imaging grids.
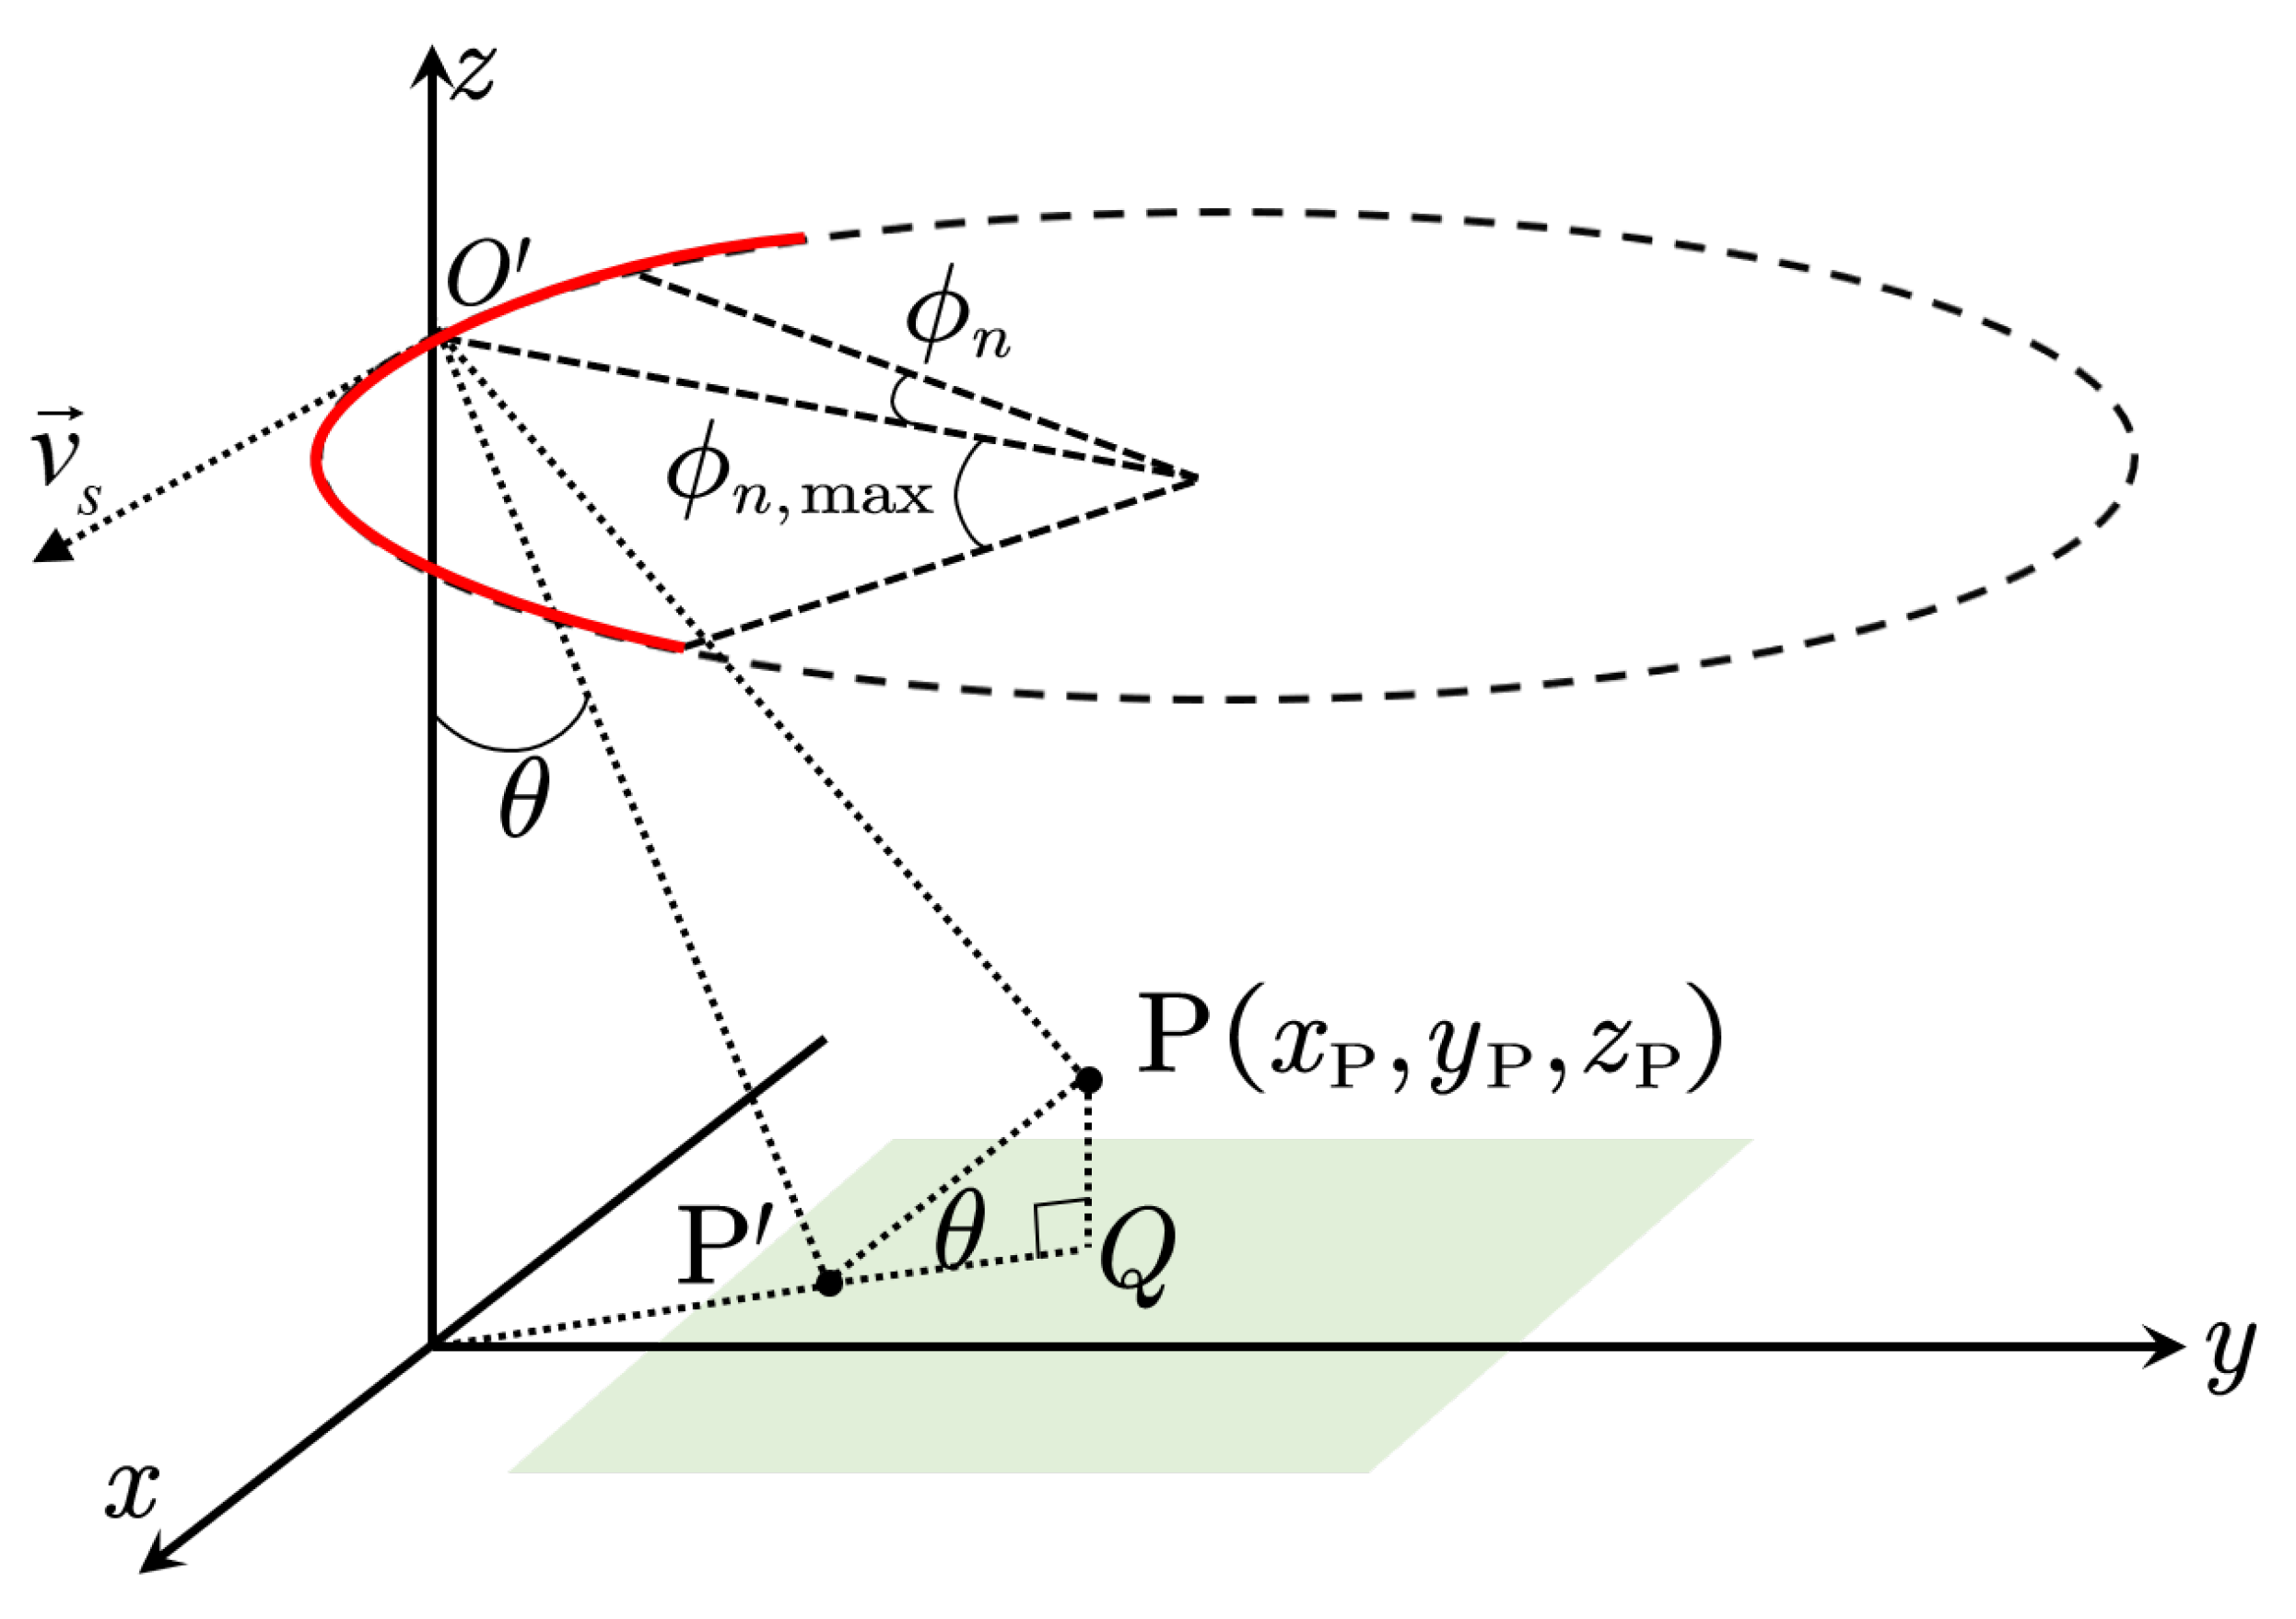
As shown in Figure 4, the height of the imaging plane is assumed to be 0 m, and there is a fixed scatterer P located at x P , y P , z P m. The mean velocity vector of the airborne radar platform is v s , and the angle between v s and the positive x-axis is φ . According to the range-Doppler model [28], it is known that P will be projected to on the imaging plane, and they are on the same zero-Doppler plane. It is known from the geometric relationship in Figure 4 that, the length of P′Q can be represented as l P Q = z P / tan ( θ ) . Therefore, the coordinates x P , y P of P′ on the imaging plane can be represented as:
x P = x P l P Q cos ( φ ) = x P z P cos ( φ ) / tan ( θ ) y P = y P l P Q sin ( φ ) = y P z P sin ( φ ) / tan ( θ )
The above projection geometry can help to determine the positions of the scatterer on the imaging planes of different heights. And it means that the correspondence relationship of the imaging grids between the flat planes of different heights can also be determined by this projection geometry.
For the grid position ( x grid _ 0 , y grid _ 0 ) on the flat plane with height z 0 , the corresponding grid position ( x grid _ m , y grid _ m ) on another plane with height z m should be:
x grid _ m = x grid _ 0 + ( z m z 0 ) cos ( φ ) / tan ( θ ) y grid _ m = y grid _ 0 + ( z m z 0 ) sin ( φ ) / tan ( θ )
Based on the above correspondence relationship of the grids between different planes, the local azimuth focusing evaluation can be utilized to estimate the coordinates offsets of the scatterer relative to the grids in Section 3.2. Since perfect azimuth focusing of the scatterer can only be achieved at its correct height, and azimuth defocusing phenomenon will happen more or less at other heights.

3.2. Offsets Estimation Based on Local Focusing Evaluation

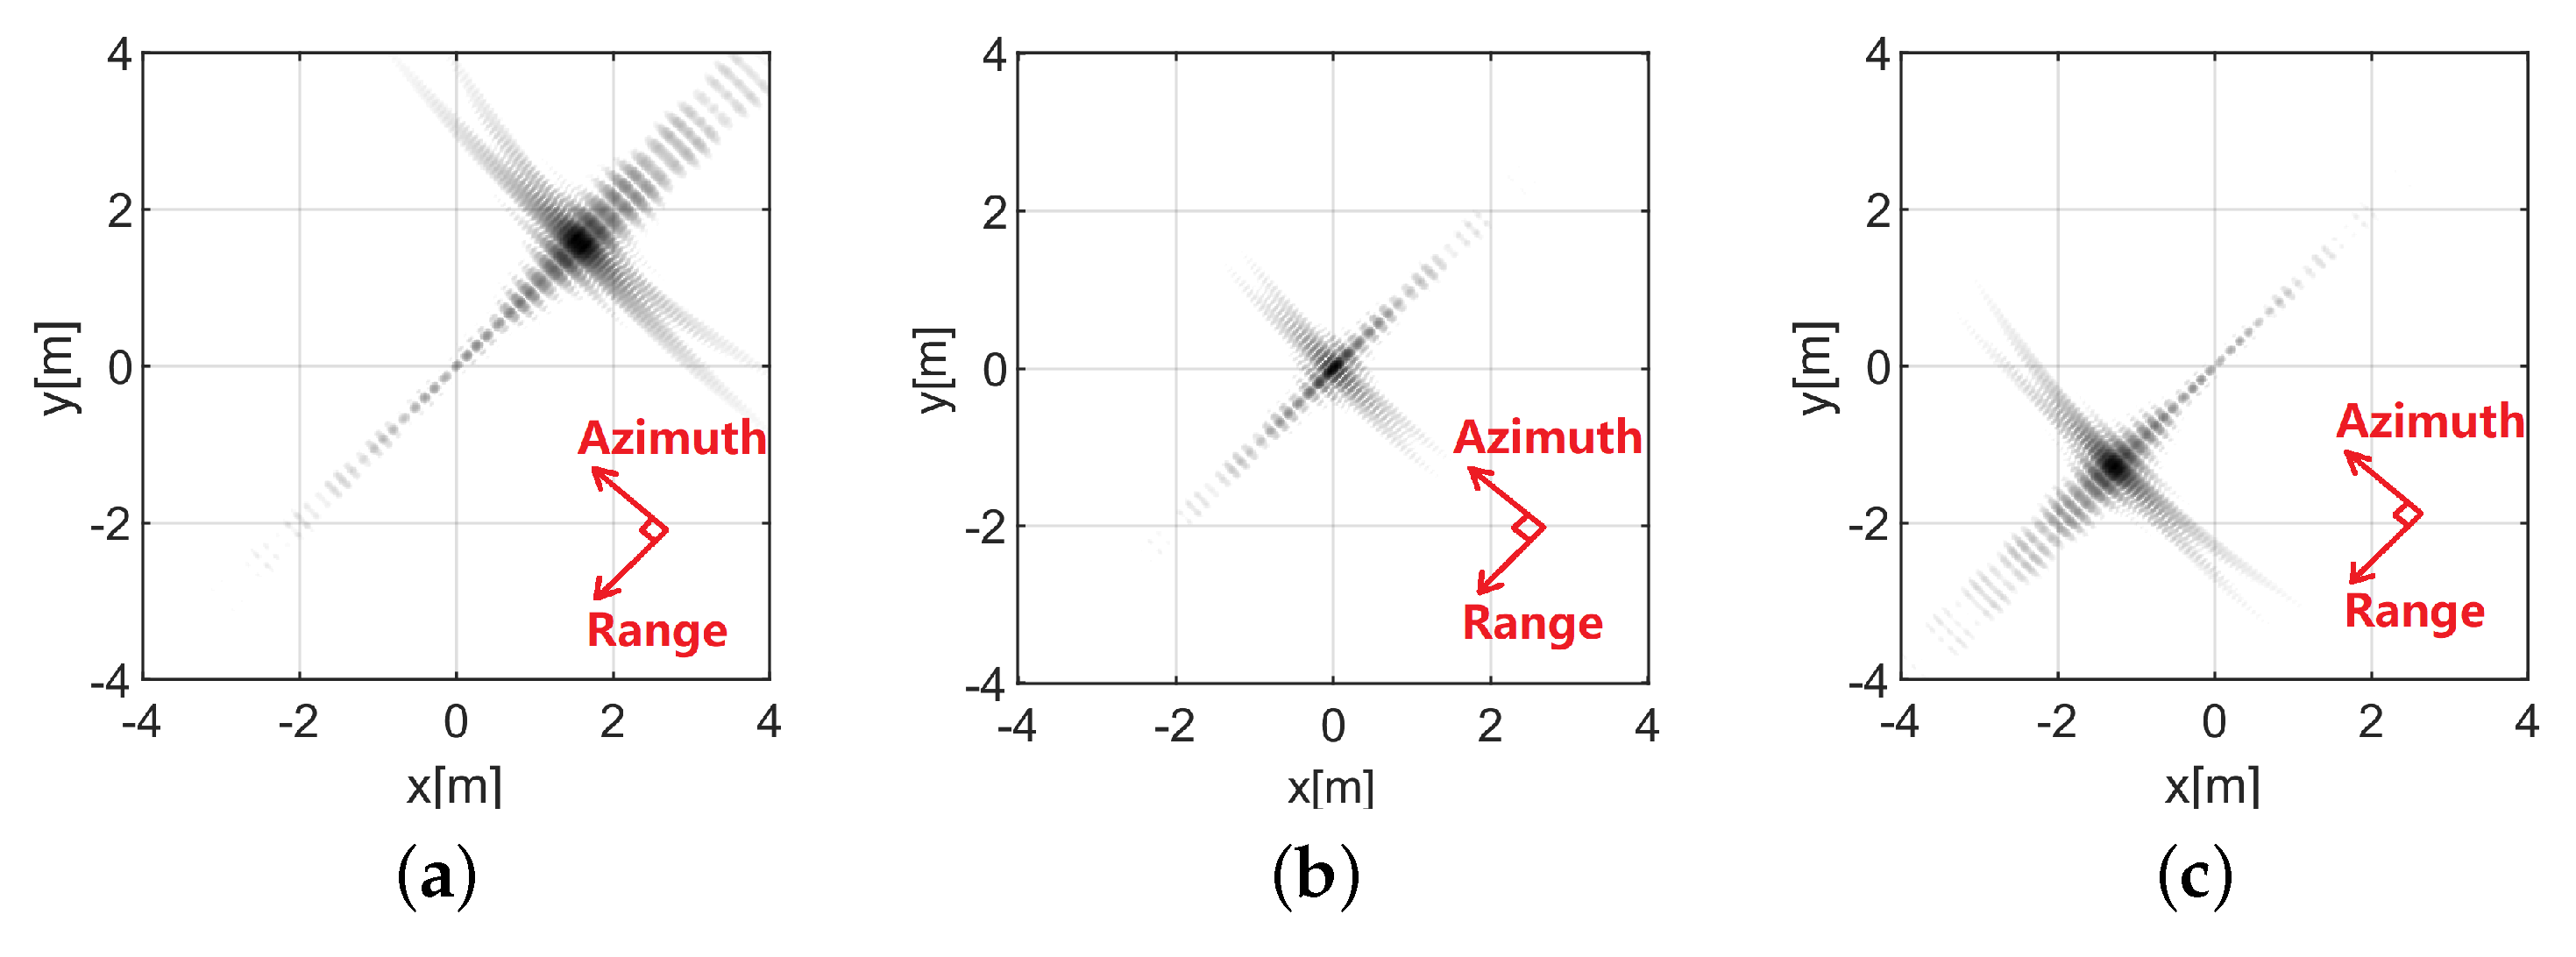
Figure 5 gives the schematic diagram of the imaging results of one scatterer on the flat planes with different heights. We can see from Figure 5 that, when the height of the imaging plane is equal to the true height of the scatterer, perfect focusing result and correct horizontal positions are obtained. If the height of the imaging plane is not equal to the true height of the scatterer, horizontal offsets exist and focusing quality decreases. This phenomenon inspires us to estimate the offsets of the scatterer relative to the grid by evaluating the focusing quality.
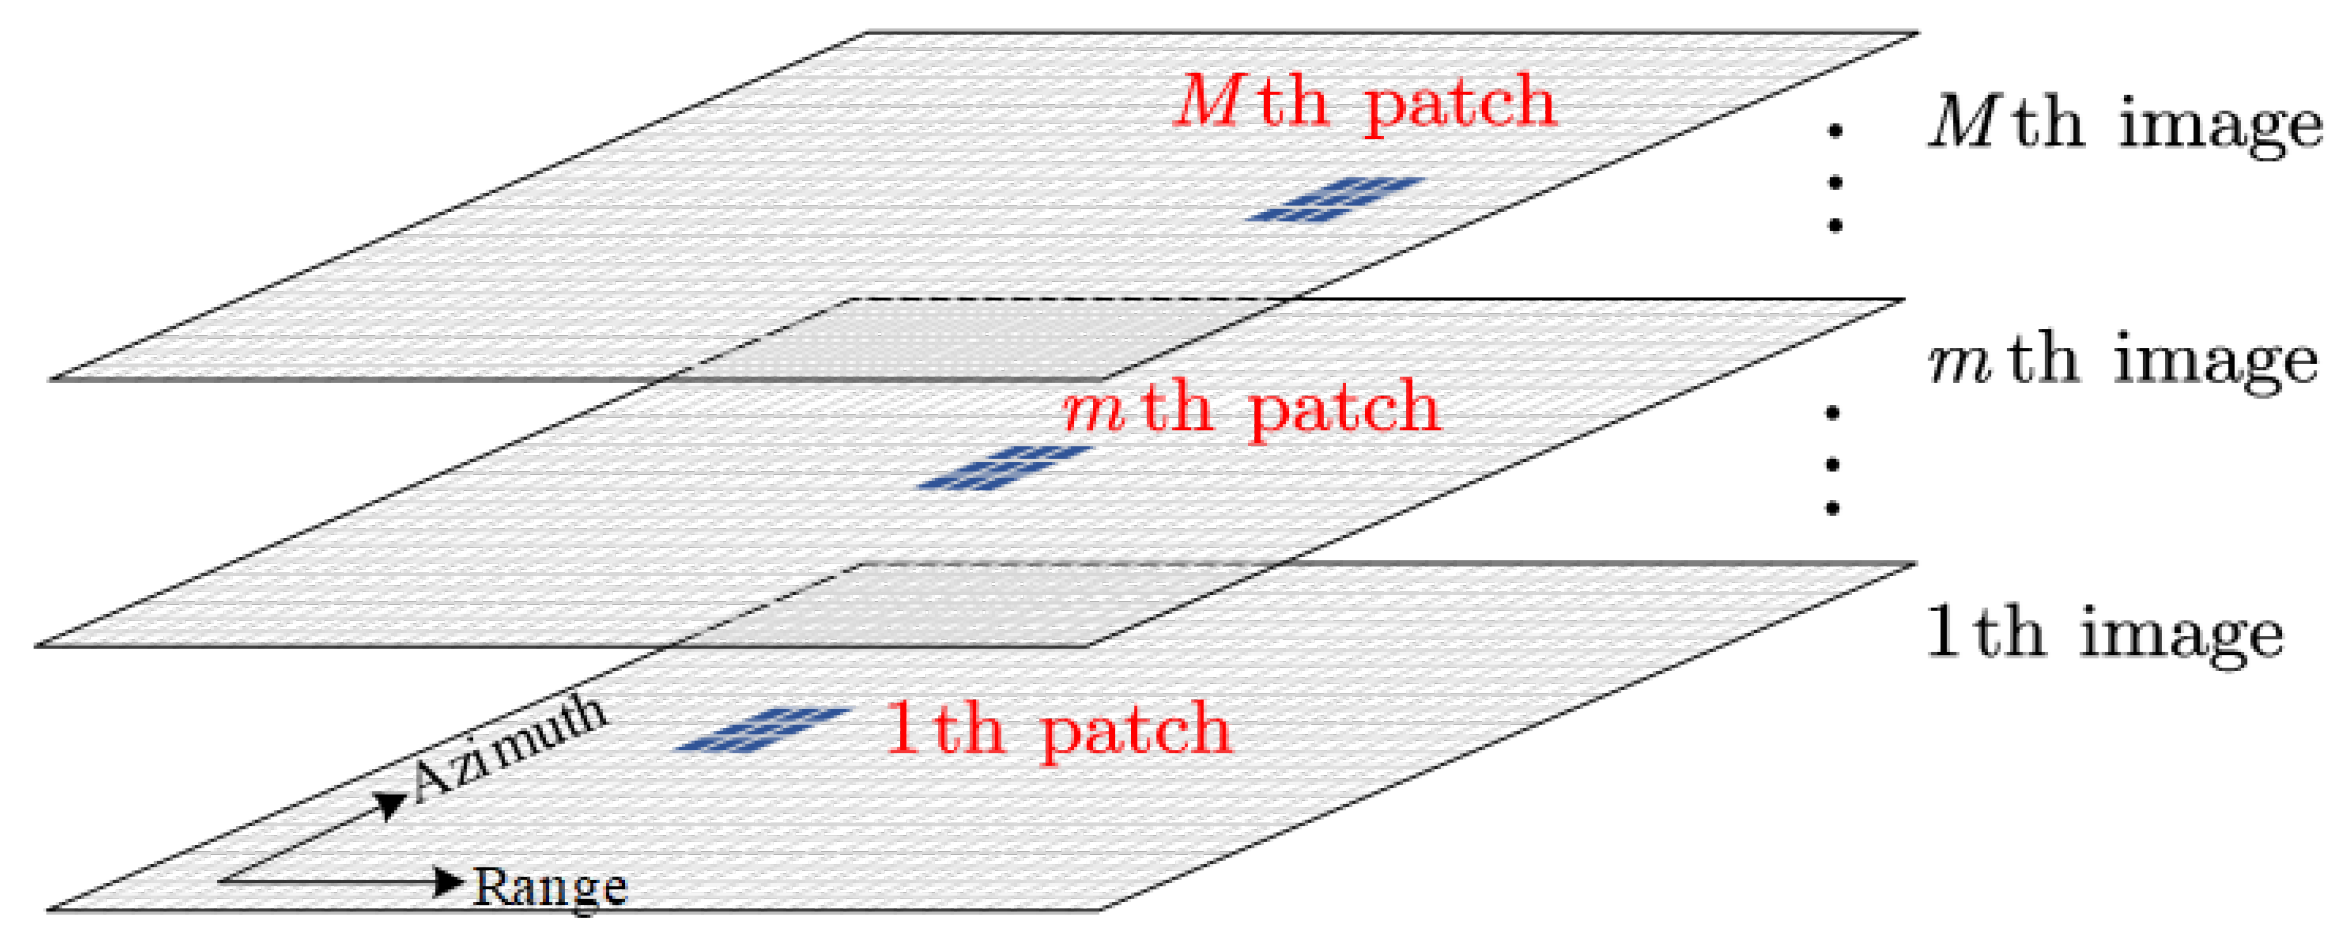
Supposing that the height of the reference plane is z 0 , and M images are obtained by performing the BP algorithm on the flat plane with different heights. Then, to estimate the offsets of a scatterer relative to the grid ( x grid _ 0 , y grid _ 0 ) on the reference plane, M patches are extracted from the M images, and the center of the mth ( 1 m M ) patch is ( x grid _ m , y grid _ m ) , as shown in Figure 6. The size of each patch is W x × W y , and the corresponding relationship between ( x grid _ m , y grid _ m ) and ( x grid _ 0 , y grid _ 0 ) is given in (15).
For convenience of the local azimuth focusing evaluation, the extracted patches should be firstly rotated to make the azimuth go along the y or x direction. Then, the azimuth focusing quality of each patch can be evaluated by using a specific metric. Several metrics can be considered for the evaluation, and one of them is the contrast maximization that is usually adopted in the SAR autofocus processing [29,30]. Therefore, the metric used for azimuth focusing evaluation in this paper can be expressed as follows:
C ( z m ) = 1 J j = 1 J 1 K k = 1 K f z m ( x j , y k ) 1 K k = 1 K f z m ( x j , y k ) 2 1 K k = 1 K f z m ( x j , y k ) ,
where f z m ( x j , y k ) represents the value of the jth range bin and kth azimuth bin in the mth patch, and z m is the height of the mth patch. J = W x / d x and K = W y / d y , where d x and d y are the grid spacings in x and y directions, respectively.
The height offset of the scatterer relative to the reference plane is estimated by searching the maximum of C ( z m ) , i.e.,
δ z e s t = argmax z m [ C ( z m ) ] z 0 .
Then, the horizontal offsets δ x e s t and δ y e s t of the scatterer relative to the grid ( x grid _ 0 , y grid _ 0 ) can be obtained by the relationship shown in (15), i.e.,
δ x e s t = δ z e s t cos ( φ ) / tan ( θ ) δ y e s t = δ z e s t sin ( φ ) / tan ( θ ) .
The estimated offsets δ x e s t , δ y e s t , and δ z e s t are used to compensate the instantaneous distance r n , i.e., the distance after compensation can be expressed as
r n = ( x ¯ + Δ x n + δ x δ x e s t ) 2 + ( y ¯ + δ y δ y e s t ) 2 + ( z ¯ + δ z δ z e s t ) 2 .
If the estimated offsets δ x e s t , δ y e s t , and δ z e s t are accurate enough, the range errors analyzed in Section 2.2 can be completely eliminated. However, absolutely accurate estimation cannot be achieved in practice, which may result in residual errors after compensation. Nevertheless, as long as the residual height offset satisfy (12), the maximum residual phase error will be less than π / 2 , so that the influence of residual offsets on azimuth focusing performance can be ignored.

3.3. Processing Flow of the Proposed Method and Computational Complexity Analysis

The proposed method can be divided into 3 stages: BP algorithm imaging on multiple planes with different heights, offsets estimation of the grids on reference plane, and final BP imaging on the reference plane. Figure 7 gives the flowchart of the proposed method.
In stage 1, the observed scene is firstly divided into several imaging planes with different heights according to the prior knowledge of the minimum and maximum heights of the targets in the scene. The height difference between the adjacent planes should be less than the upper limit specified in (12), i.e.,
Δ z λ 4 cos ( θ ) ϕ n , max 2 .
Imaging grids with spacings d x and d y for the imaging planes are constructed according to the horizontal resolutions. Then, BP algorithm is performed in each plane, and multiple images at different heights are obtained. Suppose that the number of the azimuth aperture positions is N, and the dimensions of each image is N × N , then the computational burden of this stage is proportional to M N 3 for adopting the BP algorithm.
In stage 2, a reference plane with height z 0 is determined, and the offsets relative to the grids on the reference plane are estimated according to method described in Section 3.1 and Section 3.2. The corresponding computational burden of this stage is proportional to M N 2 .
In stage 3, to reduce the outliers, the median filter is first carried out for the estimated offsets δ x e s t , δ y e s t , and δ z e s t . Then, the instantaneous distances r n from the grids on the reference plane to the radar are compensated by using the filtered offsets estimations, as shown in (19). Finally, the BP algorithm is performed on the reference plane, and the improved CSAR buildings imaging results will be achieved. As only one image on the reference plane needs to be formed, the computational burden of this stage is proportional to N 3 for adopting the BP algorithm.
Therefore, the total computational burden of the proposed method is proportional to N 2 ( M + N + M N ) for adopting BP algorithm.

4. Experimental Results

In order to verify the correctness of the theoretical analysis and the validity of the proposed method, the simulated data and the airborne CSAR real data are respectively used for experimental verification in this section.

4.1. Simulated Data

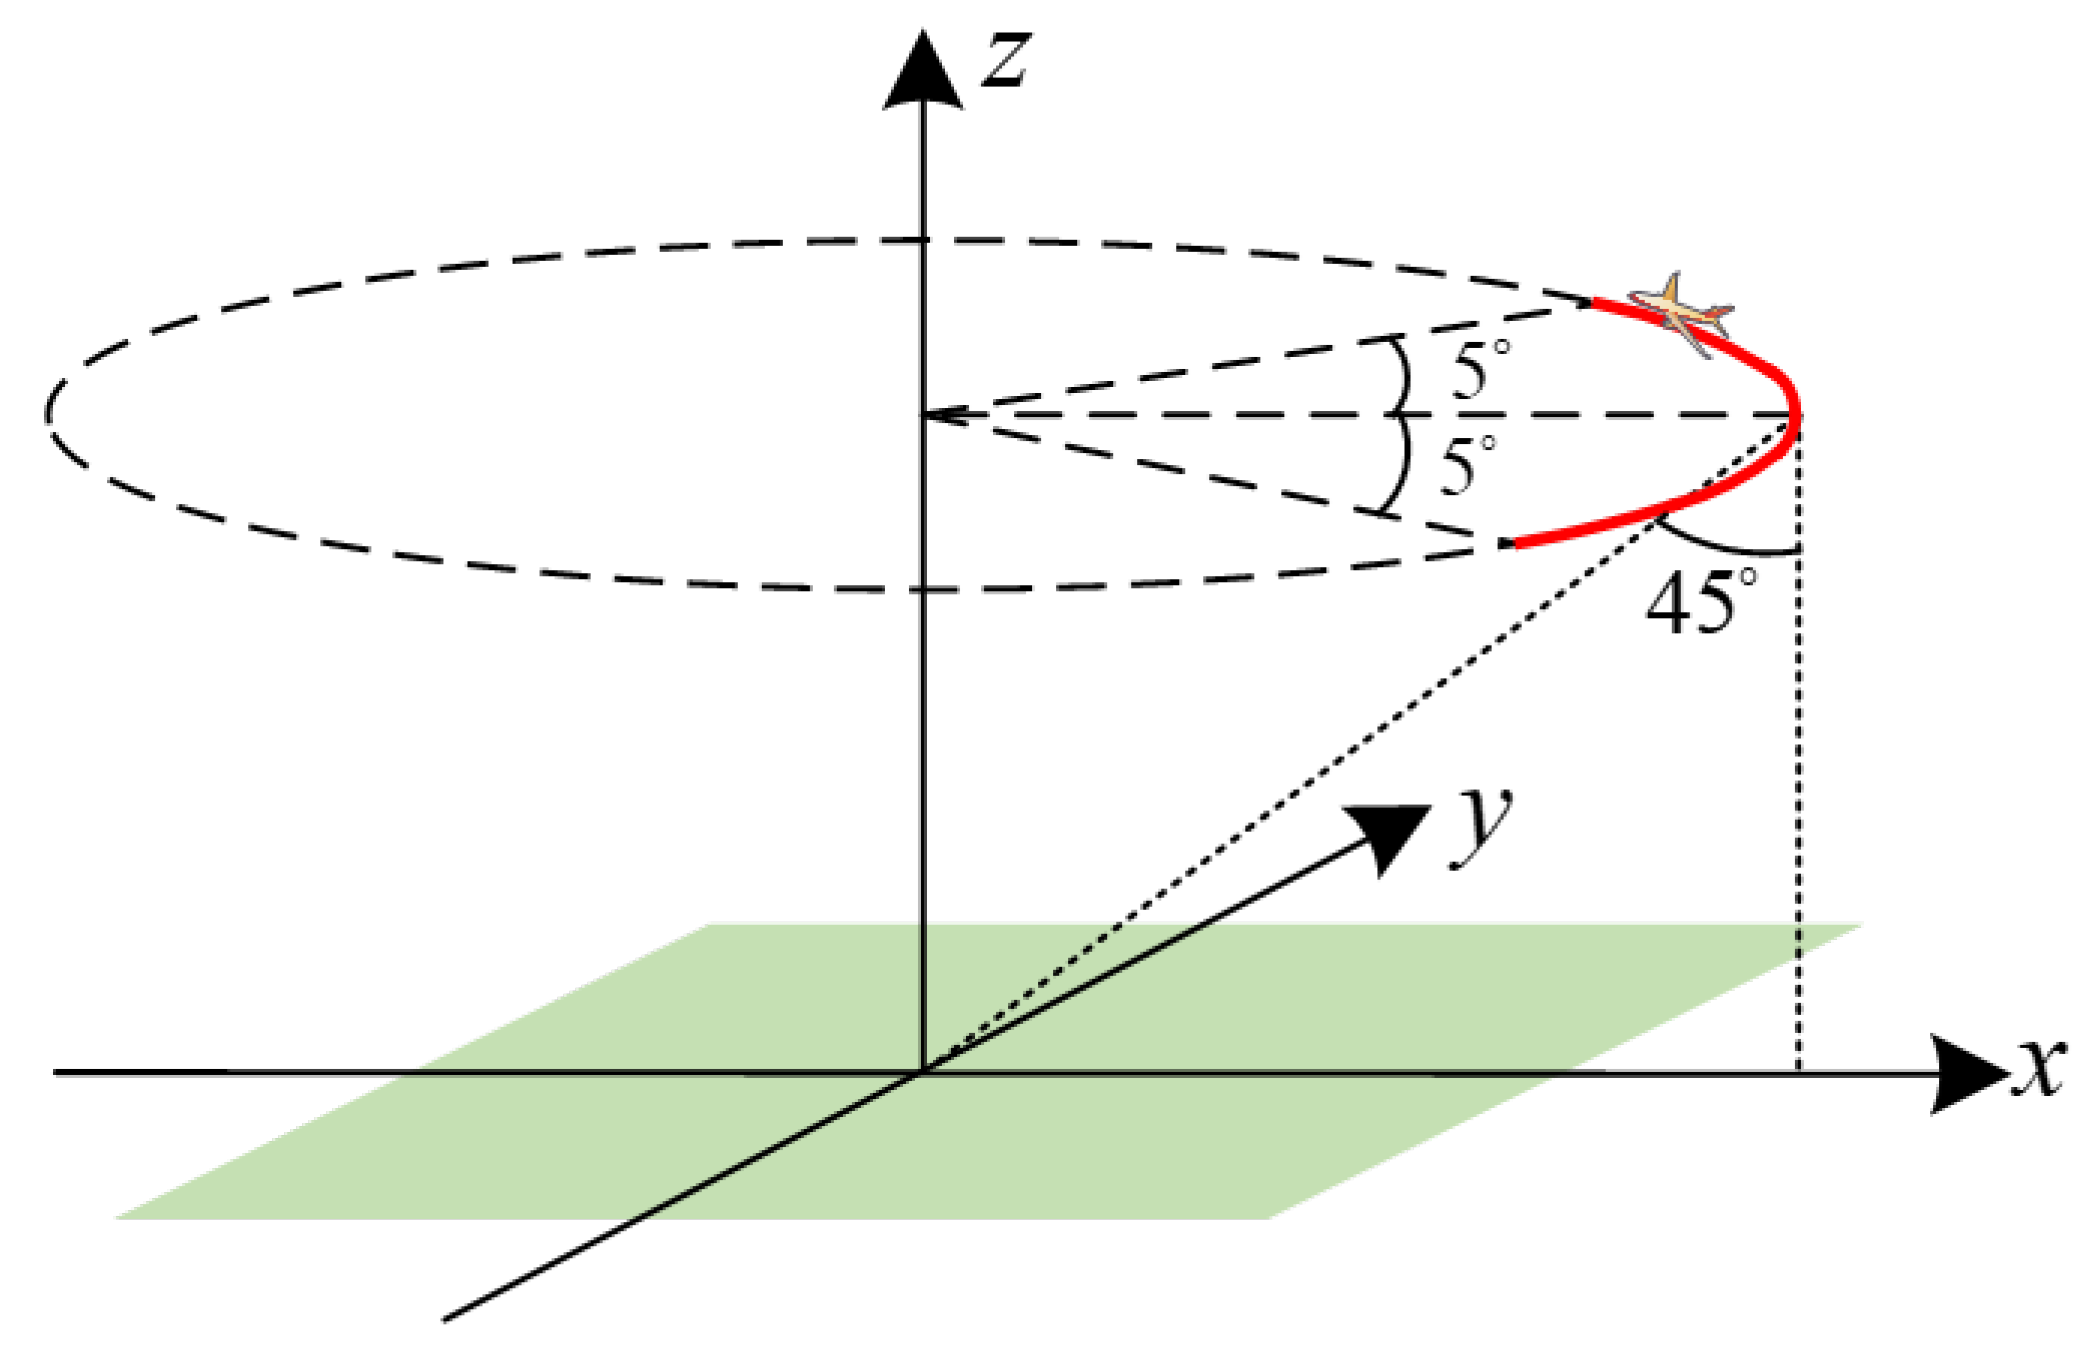
In the simulation, the elevation angle of the radar antenna is set to be 45 degrees, and the azimuth perspectives from −5 degrees to 5 degrees of the CSAR geometry is used to form the arc-shaped synthetic aperture data. Figure 8 gives the imaging geometry in the simulation, and the main simulation parameters are shown in Table 1. According to (12), if well focused results of all scatterers are desired to be achieved, the maximum height difference between the scatterers and the reference plane should be smaller than 1.39 m under these simulation parameters.
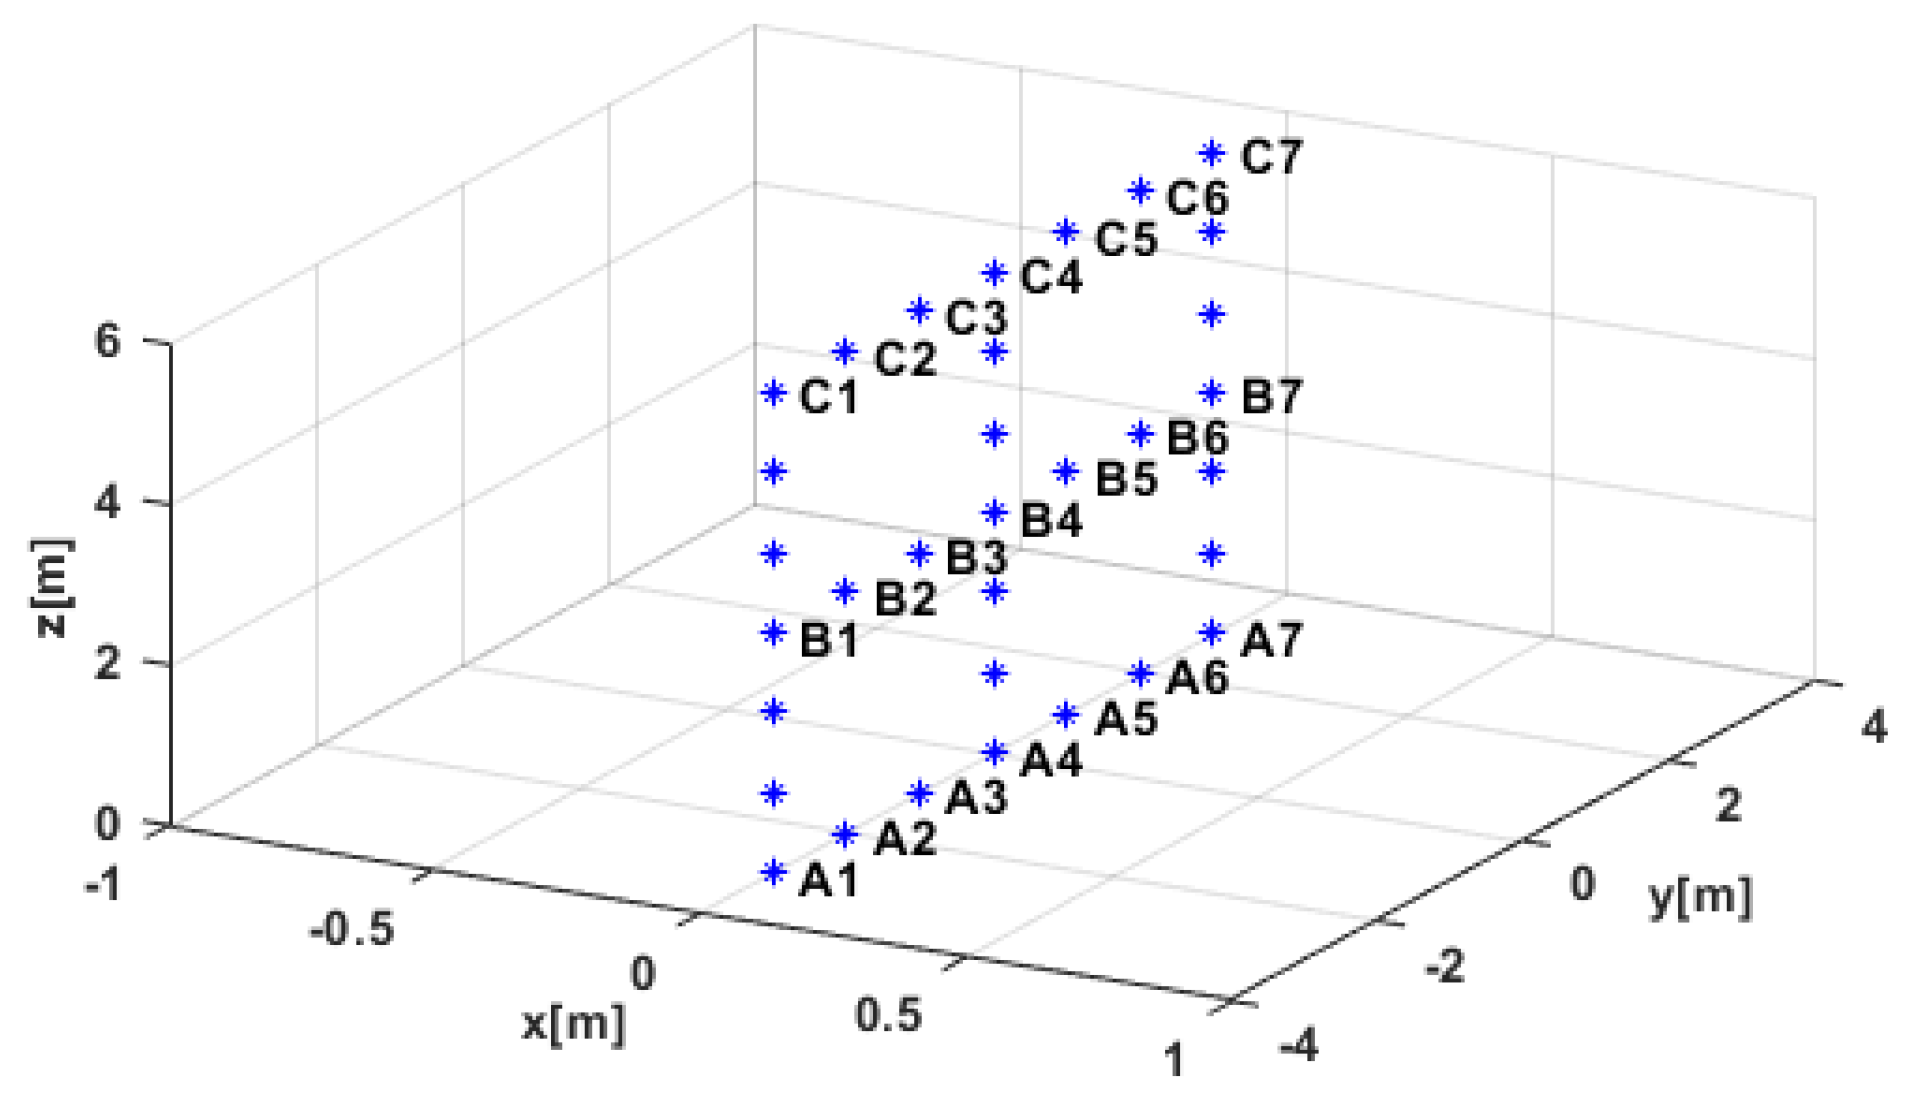
There are 34 scatterers located in the observed scene, and the positions of them are shown in Figure 9. The x coordinates of these scatterers are all 0 m. The y coordinates vary from −3 m to 3 m, and the z coordinates vary from 0 m to 6 m. The minimum intervals of all scatterers in both x and y directions are 1 m, and the radar cross sections of all scatterers are assumed to be 1 m2 for simplification.
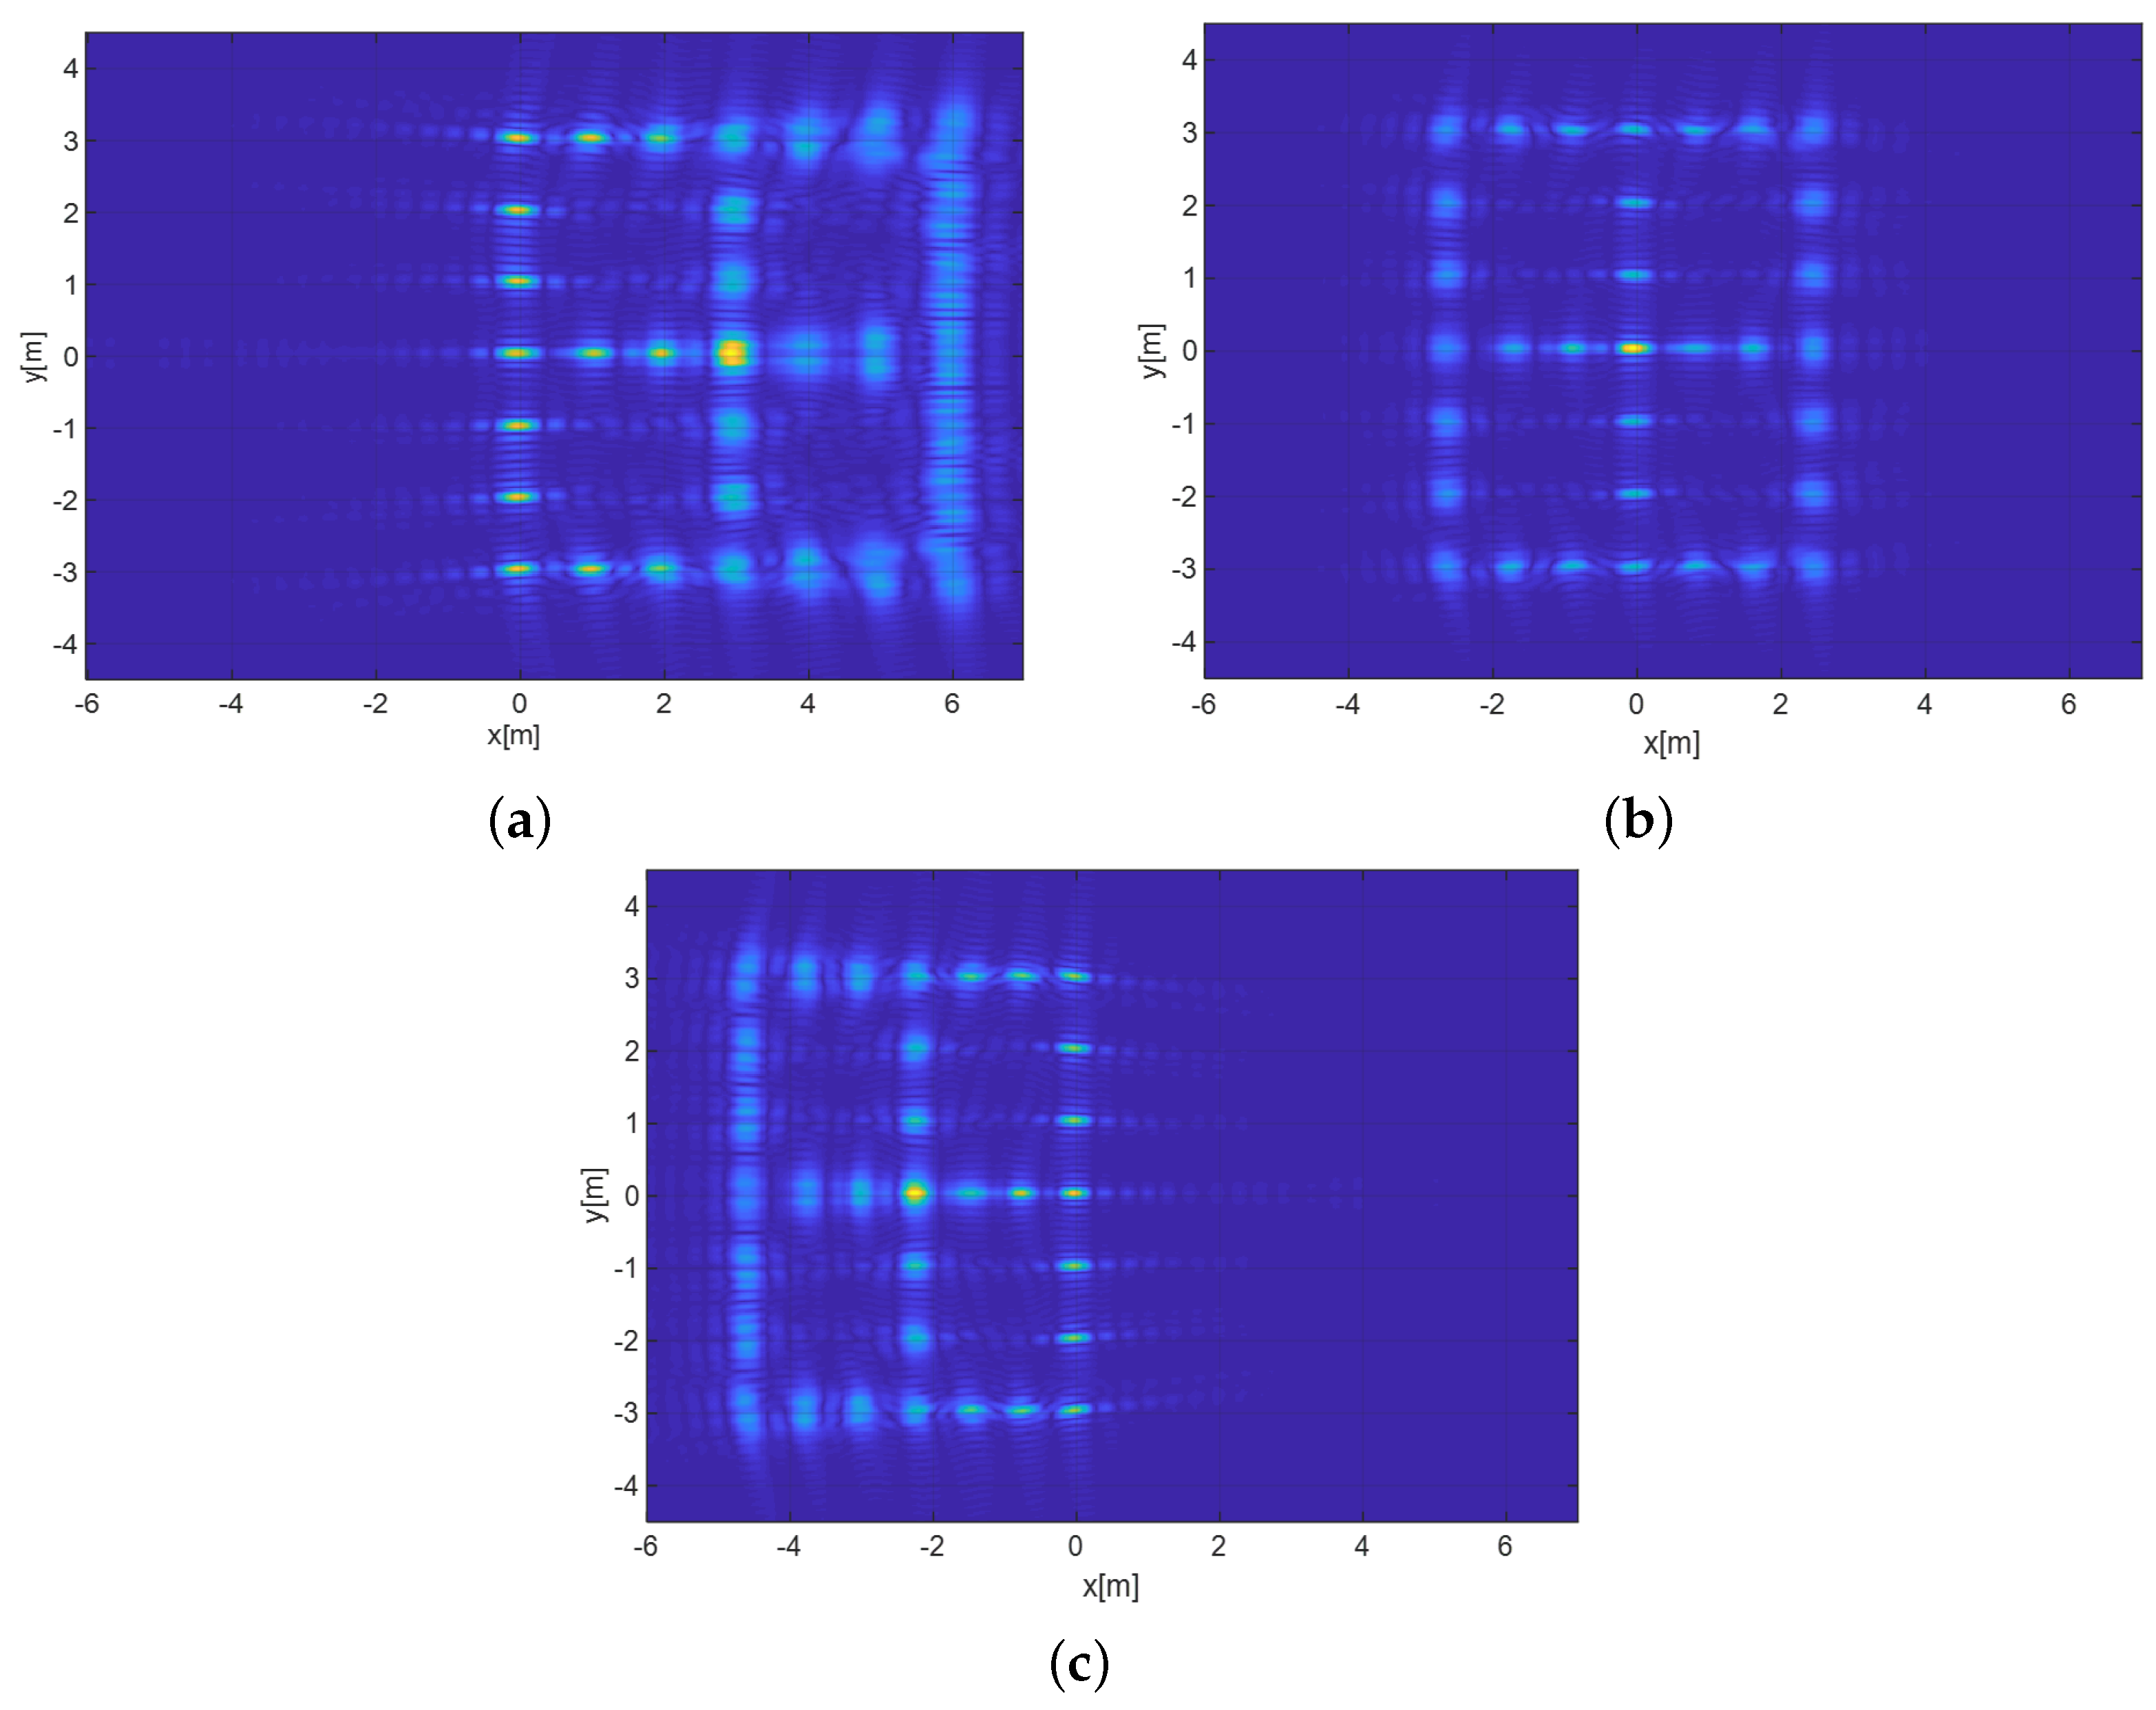
In traditional imaging method, a reference plane with certain height is selected to construct the imaging grids, and then BP algorithm is performed on these grids to acquire imaging result. Figure 10 shows the imaging results obtained by using the traditional method when the heights of the reference planes are 0 m, 3 m, and 6 m, respectively. Since the scatterers are distributed at different height positions, the scatterers that are not on the imaging reference plane always exist whichever height is selected. When the height difference between the scatterer and the reference plane is larger than 1.39 m, azimuth defocusing will occur in the imaging results. It can be seen from Figure 10 that, whichever height of the reference plane is selected, only those scatterers whose relative height to the reference plane smaller than 1.39 m can be well focused, and the others show azimuth defocusing. The father away from the reference plane, the more serious the azimuth defocusing. In addition, the imaging positions of the scatterers are different for the reference planes with different heights, and this is decided by the SAR side-looking geometry.
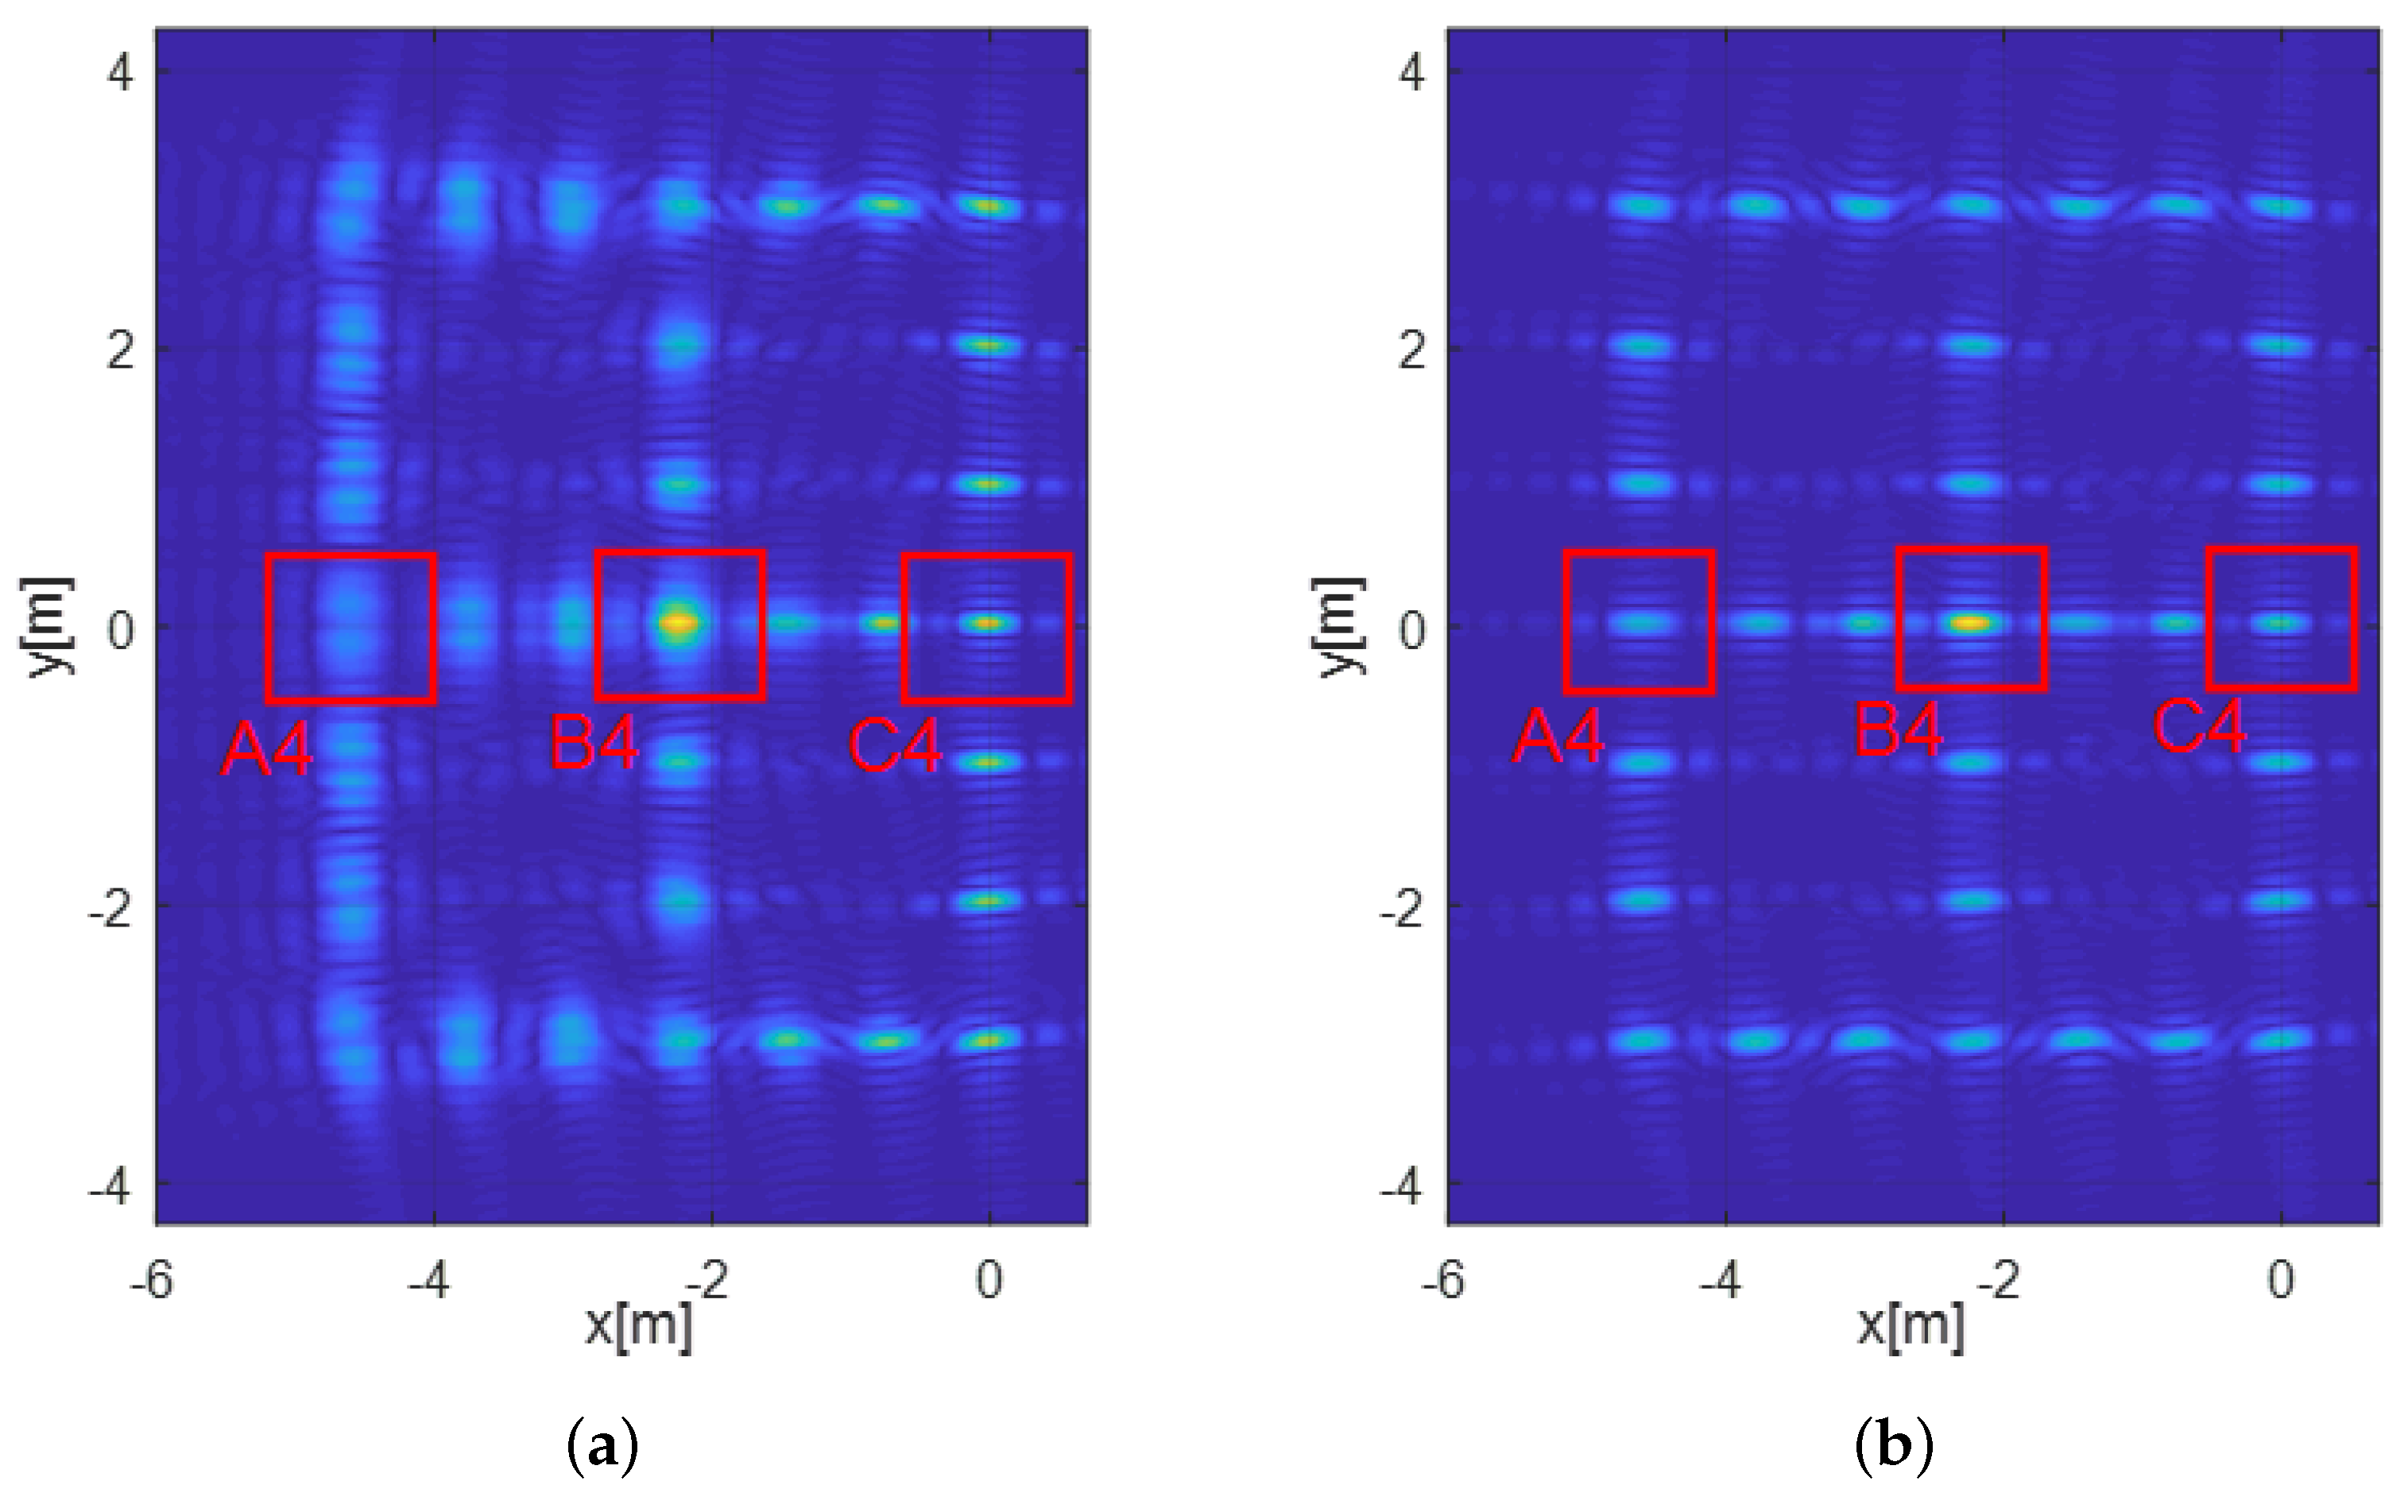
In our proposed method, the observed scene is firstly divided into several imaging planes with heights varying from 0 m to 6 m. The height difference between the adjacent planes is set to be 1 m, which is smaller than 1.39 m. After performing BP algorithm on these planes, 7 images are obtained. The plane at the height of 6 m is selected as the final imaging reference plane, and then the offsets estimation is performed. In the offsets estimation, the size of each patch is set to be 65 × 65 pixels (corresponding to 1.28 m × 1.28 m). Figure 11 gives the comparison of the imaging results between the traditional and the proposed method. It can be seen from Figure 11 that, the proposed method can realize perfect focusing of all scatterers, but the traditional method can only focus well the scatterers whose relative heights to the imaging plane are smaller than 1.39 m.
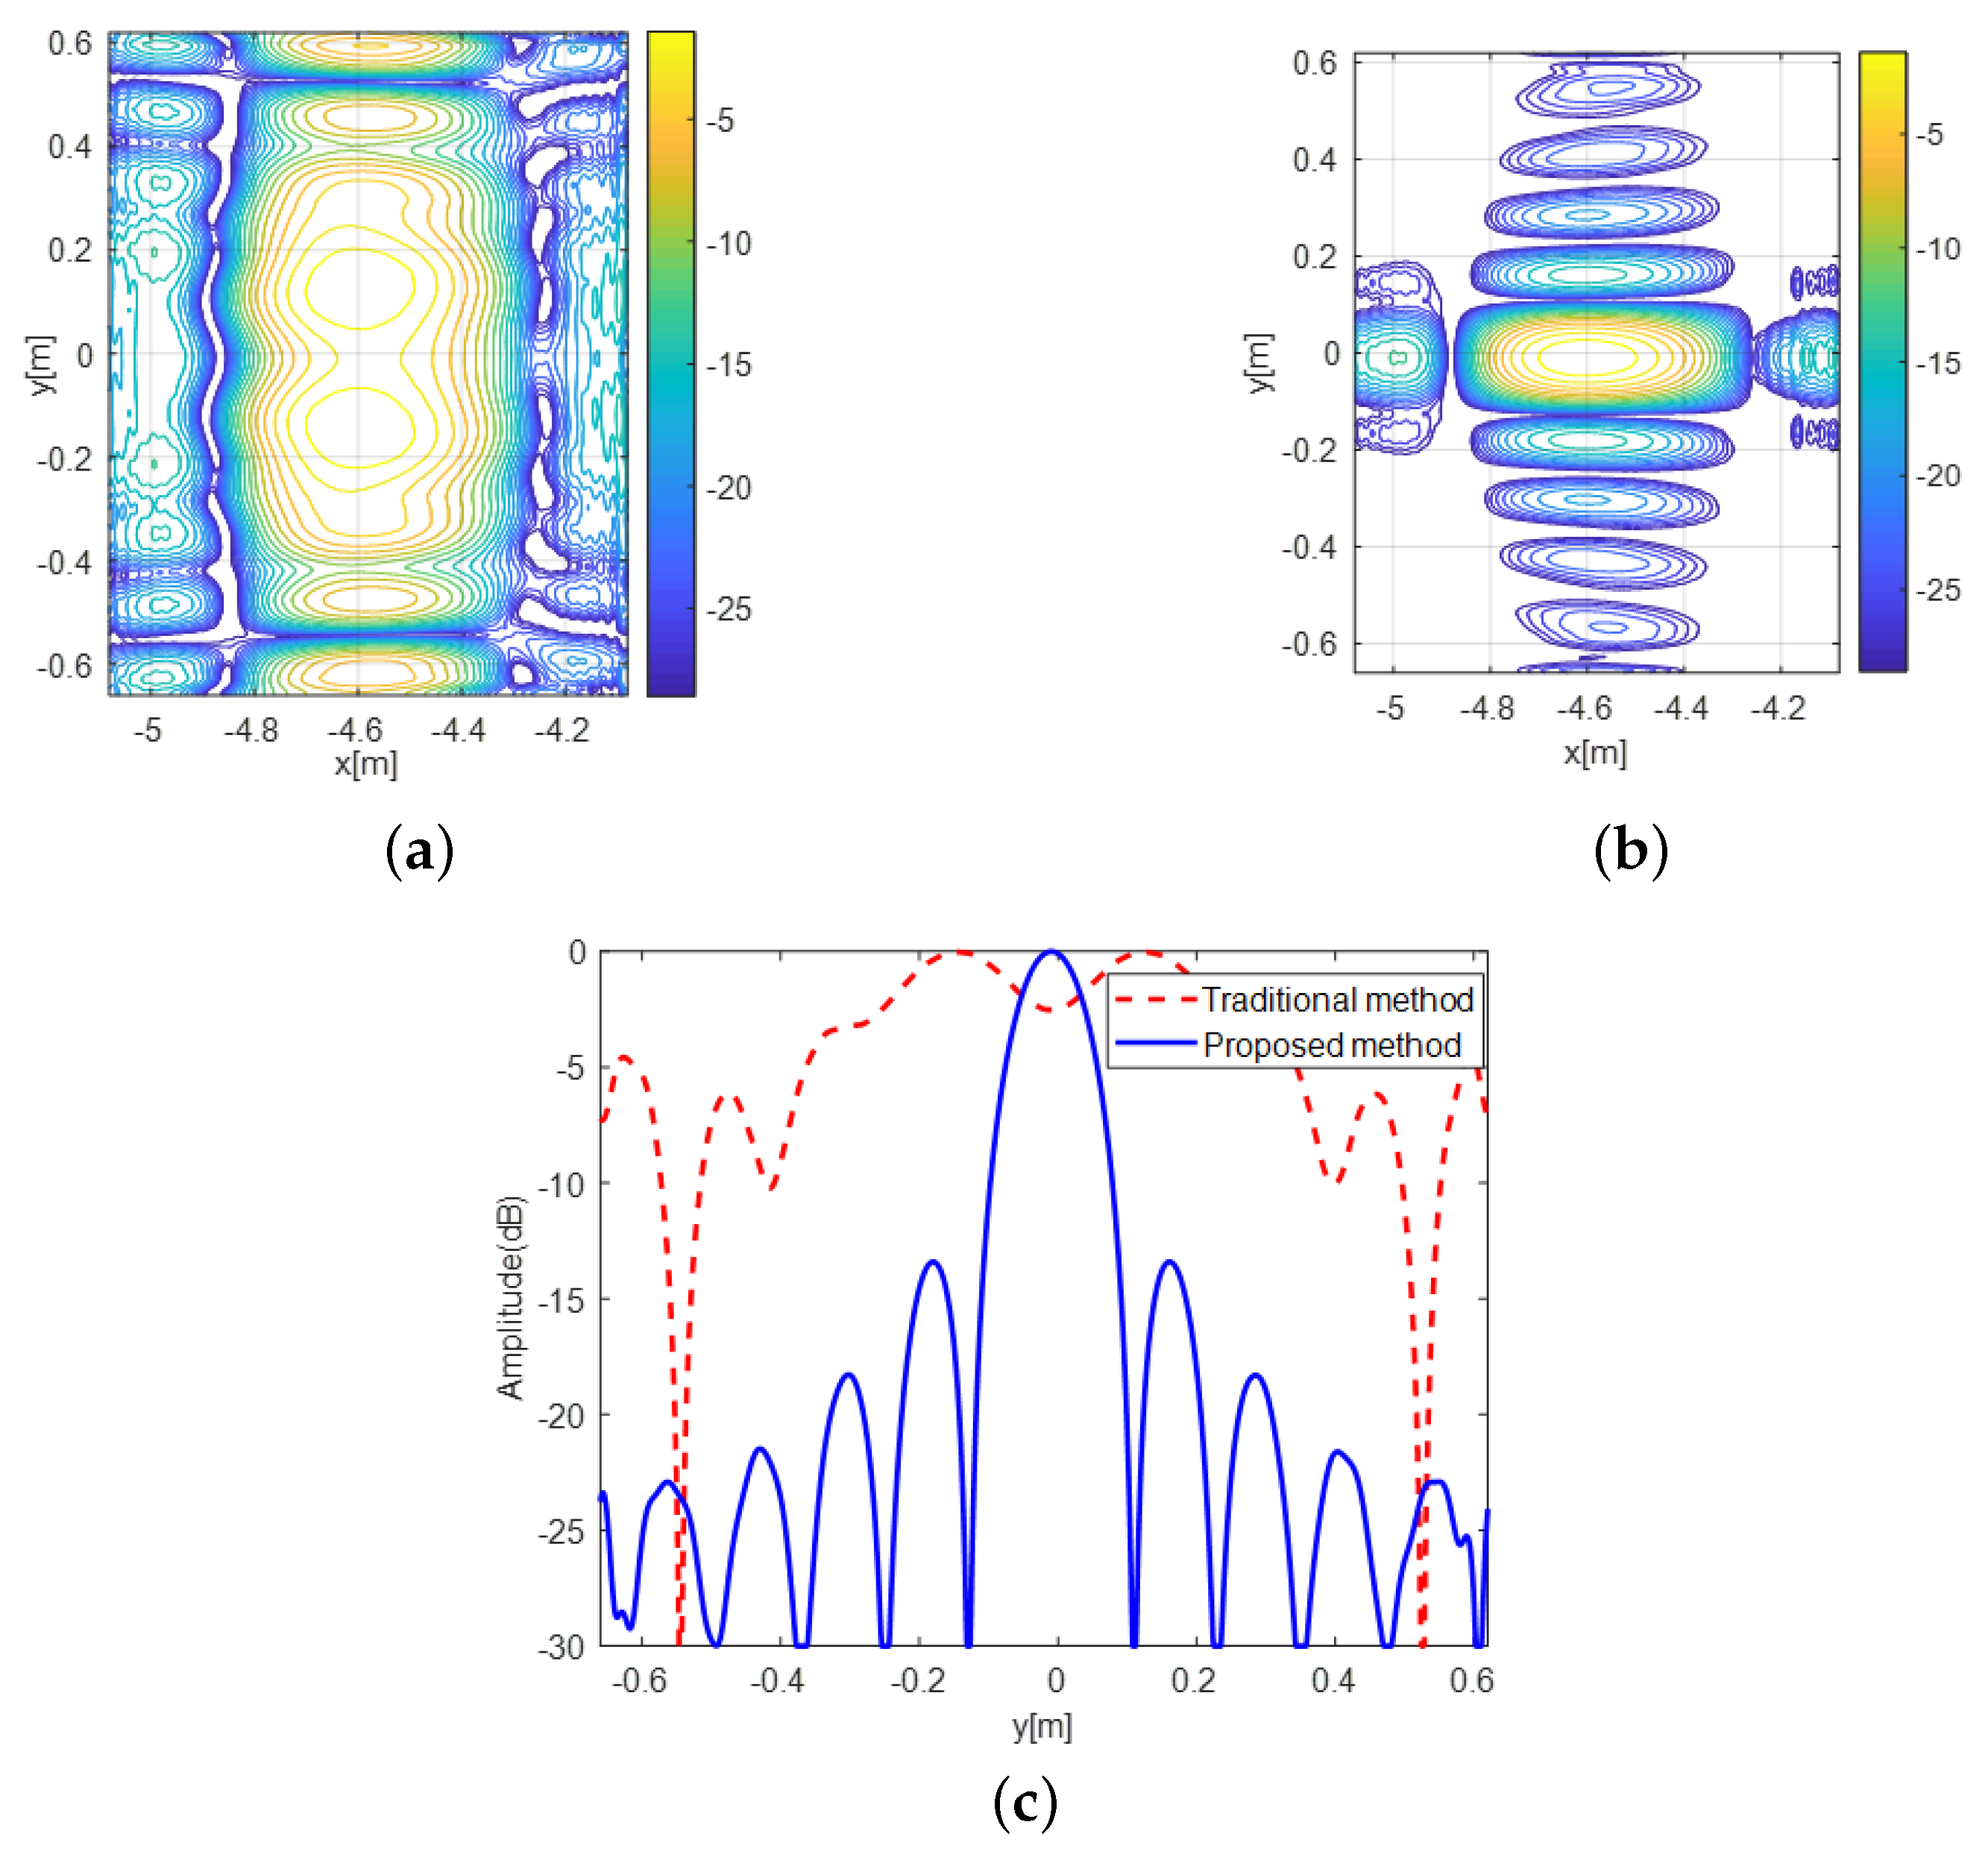
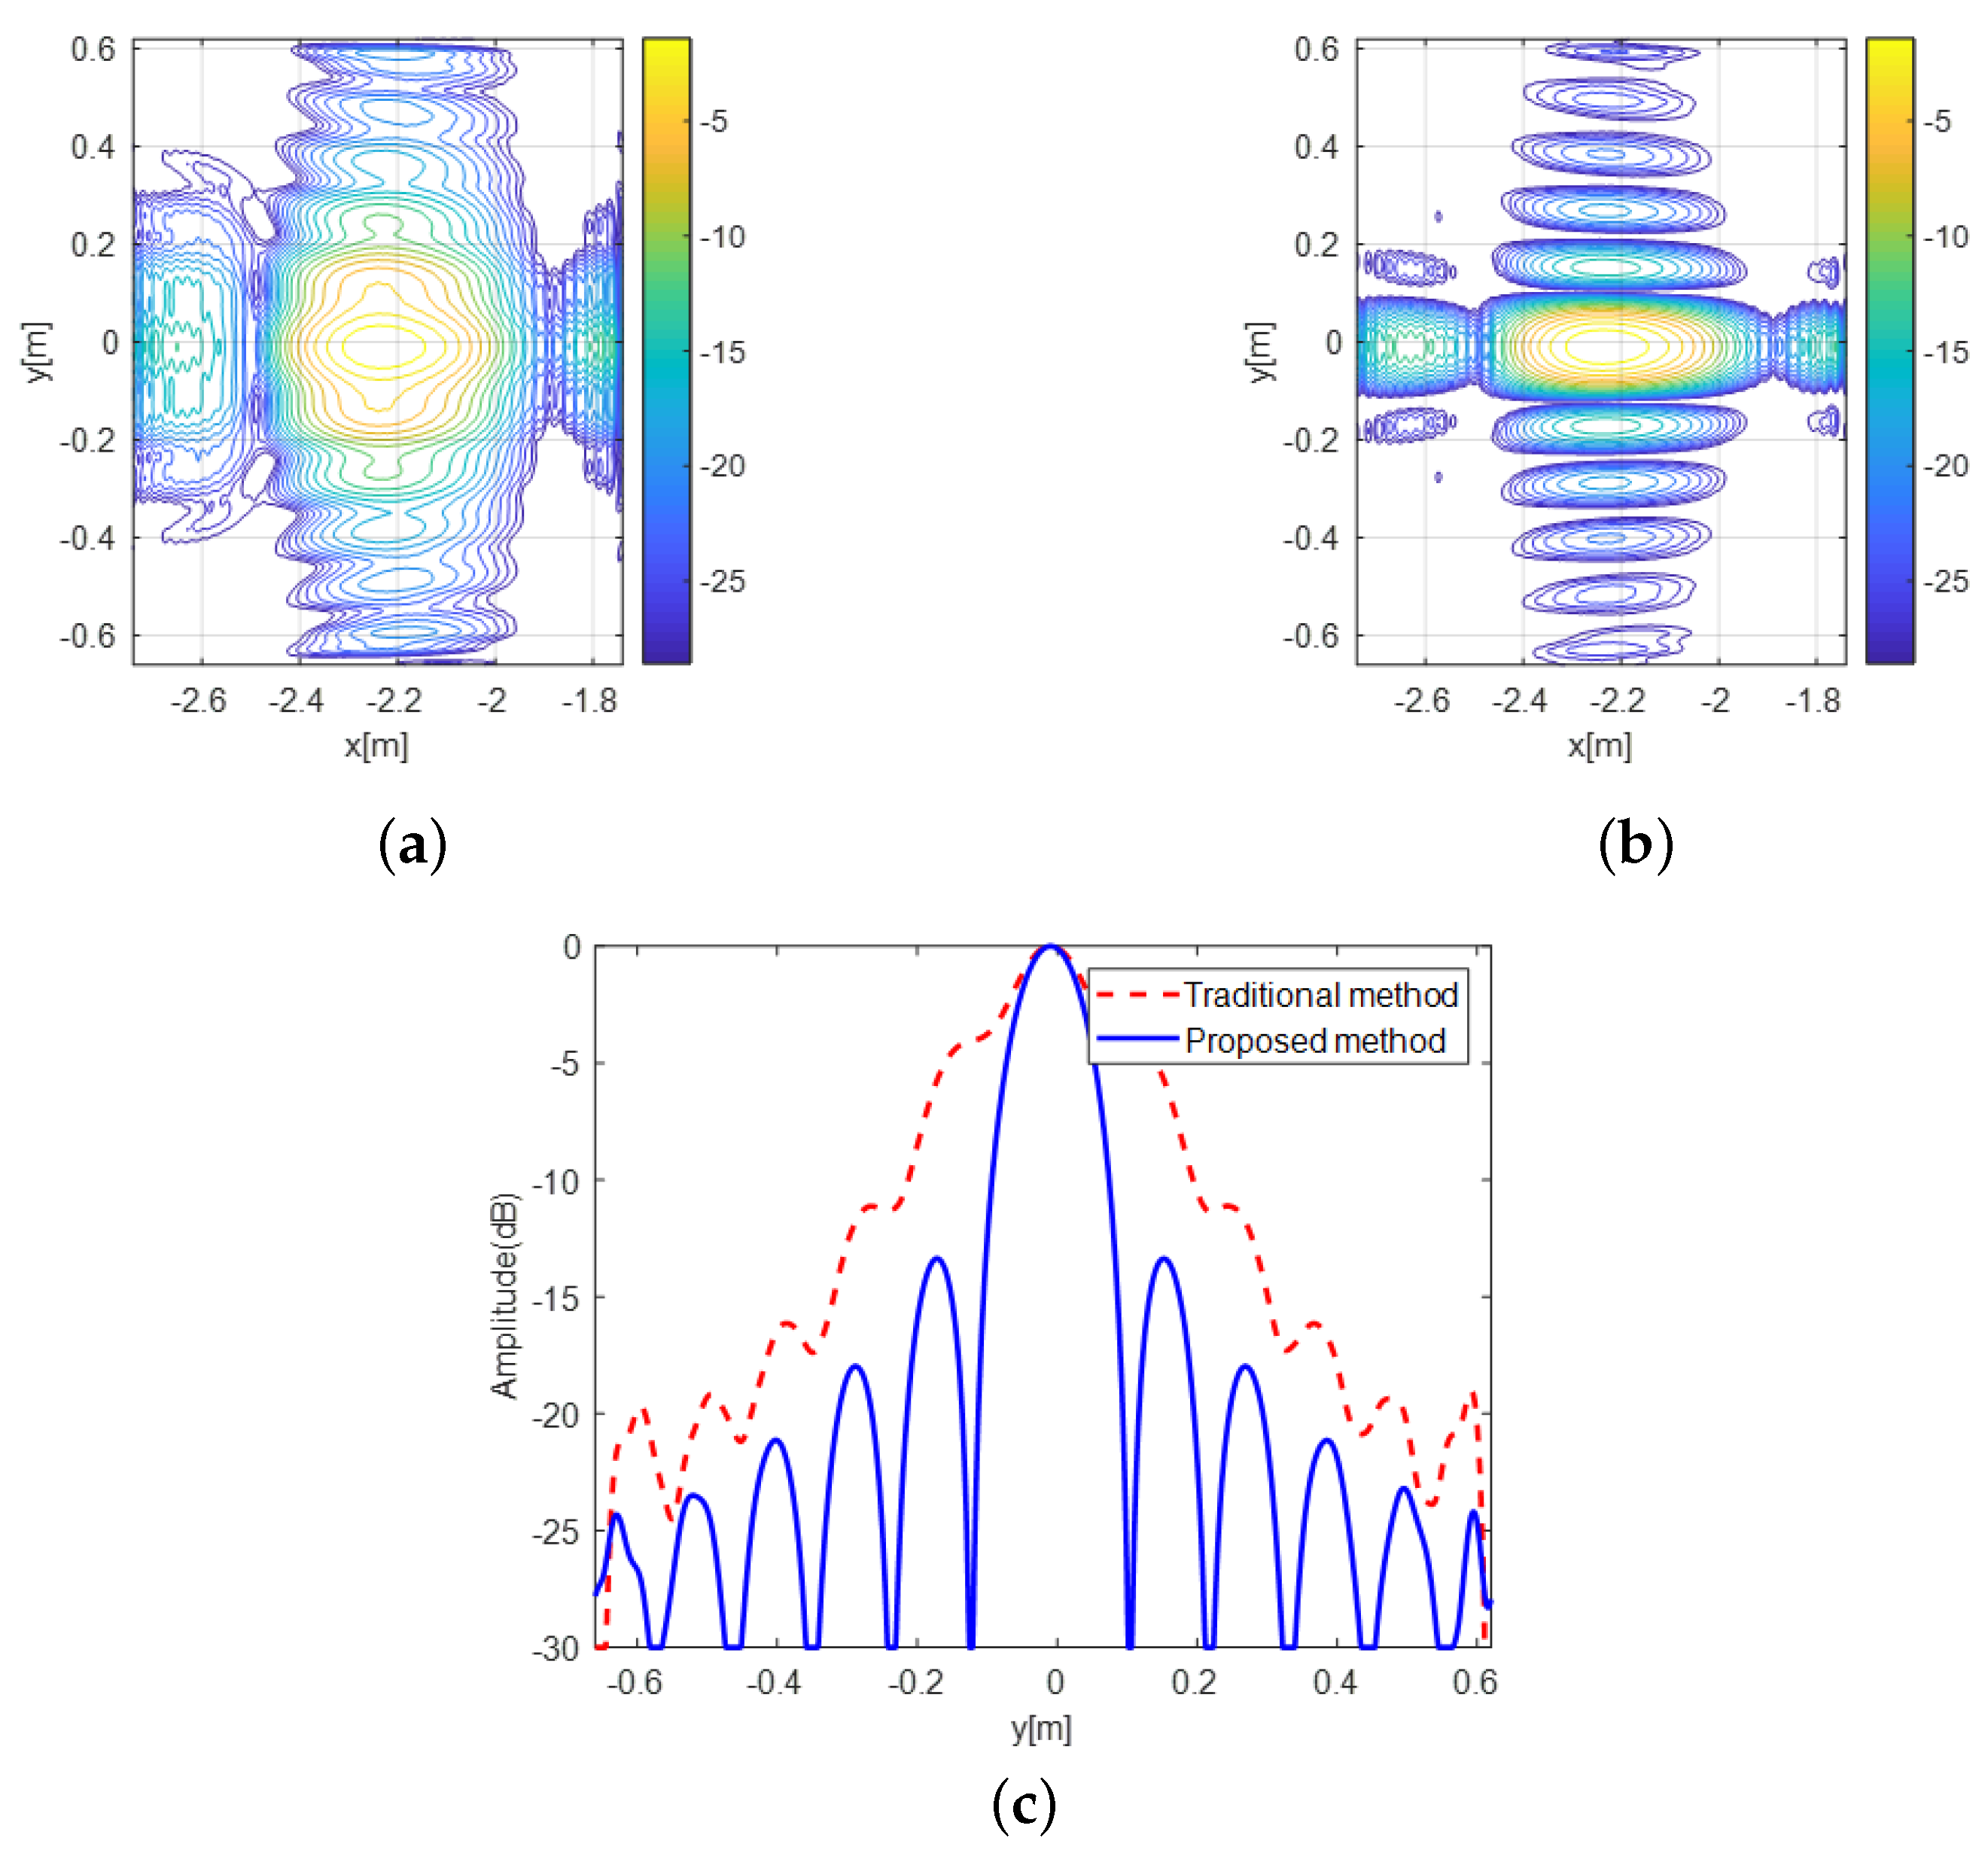
To further evaluate the performance of the proposed method, the scatterers labeled as A4, B4, and C4 are selected and extracted from the imaging results shown in Figure 11. Similar performance can be achieved for the rest of the scatterers. The contour plots of these selected scatterers are shown in Figure 12, Figure 13 and Figure 14. Besides, the azimuth slices are also shown to evaluate and compare the performance of the proposed and the traditional method. It can be clearly seen that, the traditional method can only realize accurate imaging of scatterer C4, whose height is equal to the height of imaging plane. The imaging results of scatterers A4 and B4 are both defocused in azimuth by using the traditional method. However, the proposed method can realize perfect focusing of all scatterers, no matter whether the height of the scatterer is equal to the height of the reference plane or not.
To make a quantitative evaluation and comparison, the azimuth resolutions, peak sidelobe ratios (PSLR), and integrated sidelobe ratios (ISLR) of the selected scatterers are measured and shown in Table 2. In Table 2, the theoretical values of the azimuth resolutions are computed by using the formula derived in [10]. The results in Table 2 show that, compared to the traditional method, the proposed method can acquire better azimuth focusing quality, and the azimuth resolutions obtained by the proposed method are close to the theoretical values, which indicates the validity of the proposed method.

4.2. Real Data

The validity and feasibility of the proposed method are further verified by using the airborne CSAR real data. The real data were recorded in November 2020 by using the airborne Ku-band CSAR system that was developed by the National University of Defense Technology. The main experimental parameters are shown in Table 3. The complete circular trajectory of the airborne radar platform is shown by the blue dotted line in Figure 15, and the arc-shaped synthetic aperture data corresponding to the red solid line are selected for the verification.
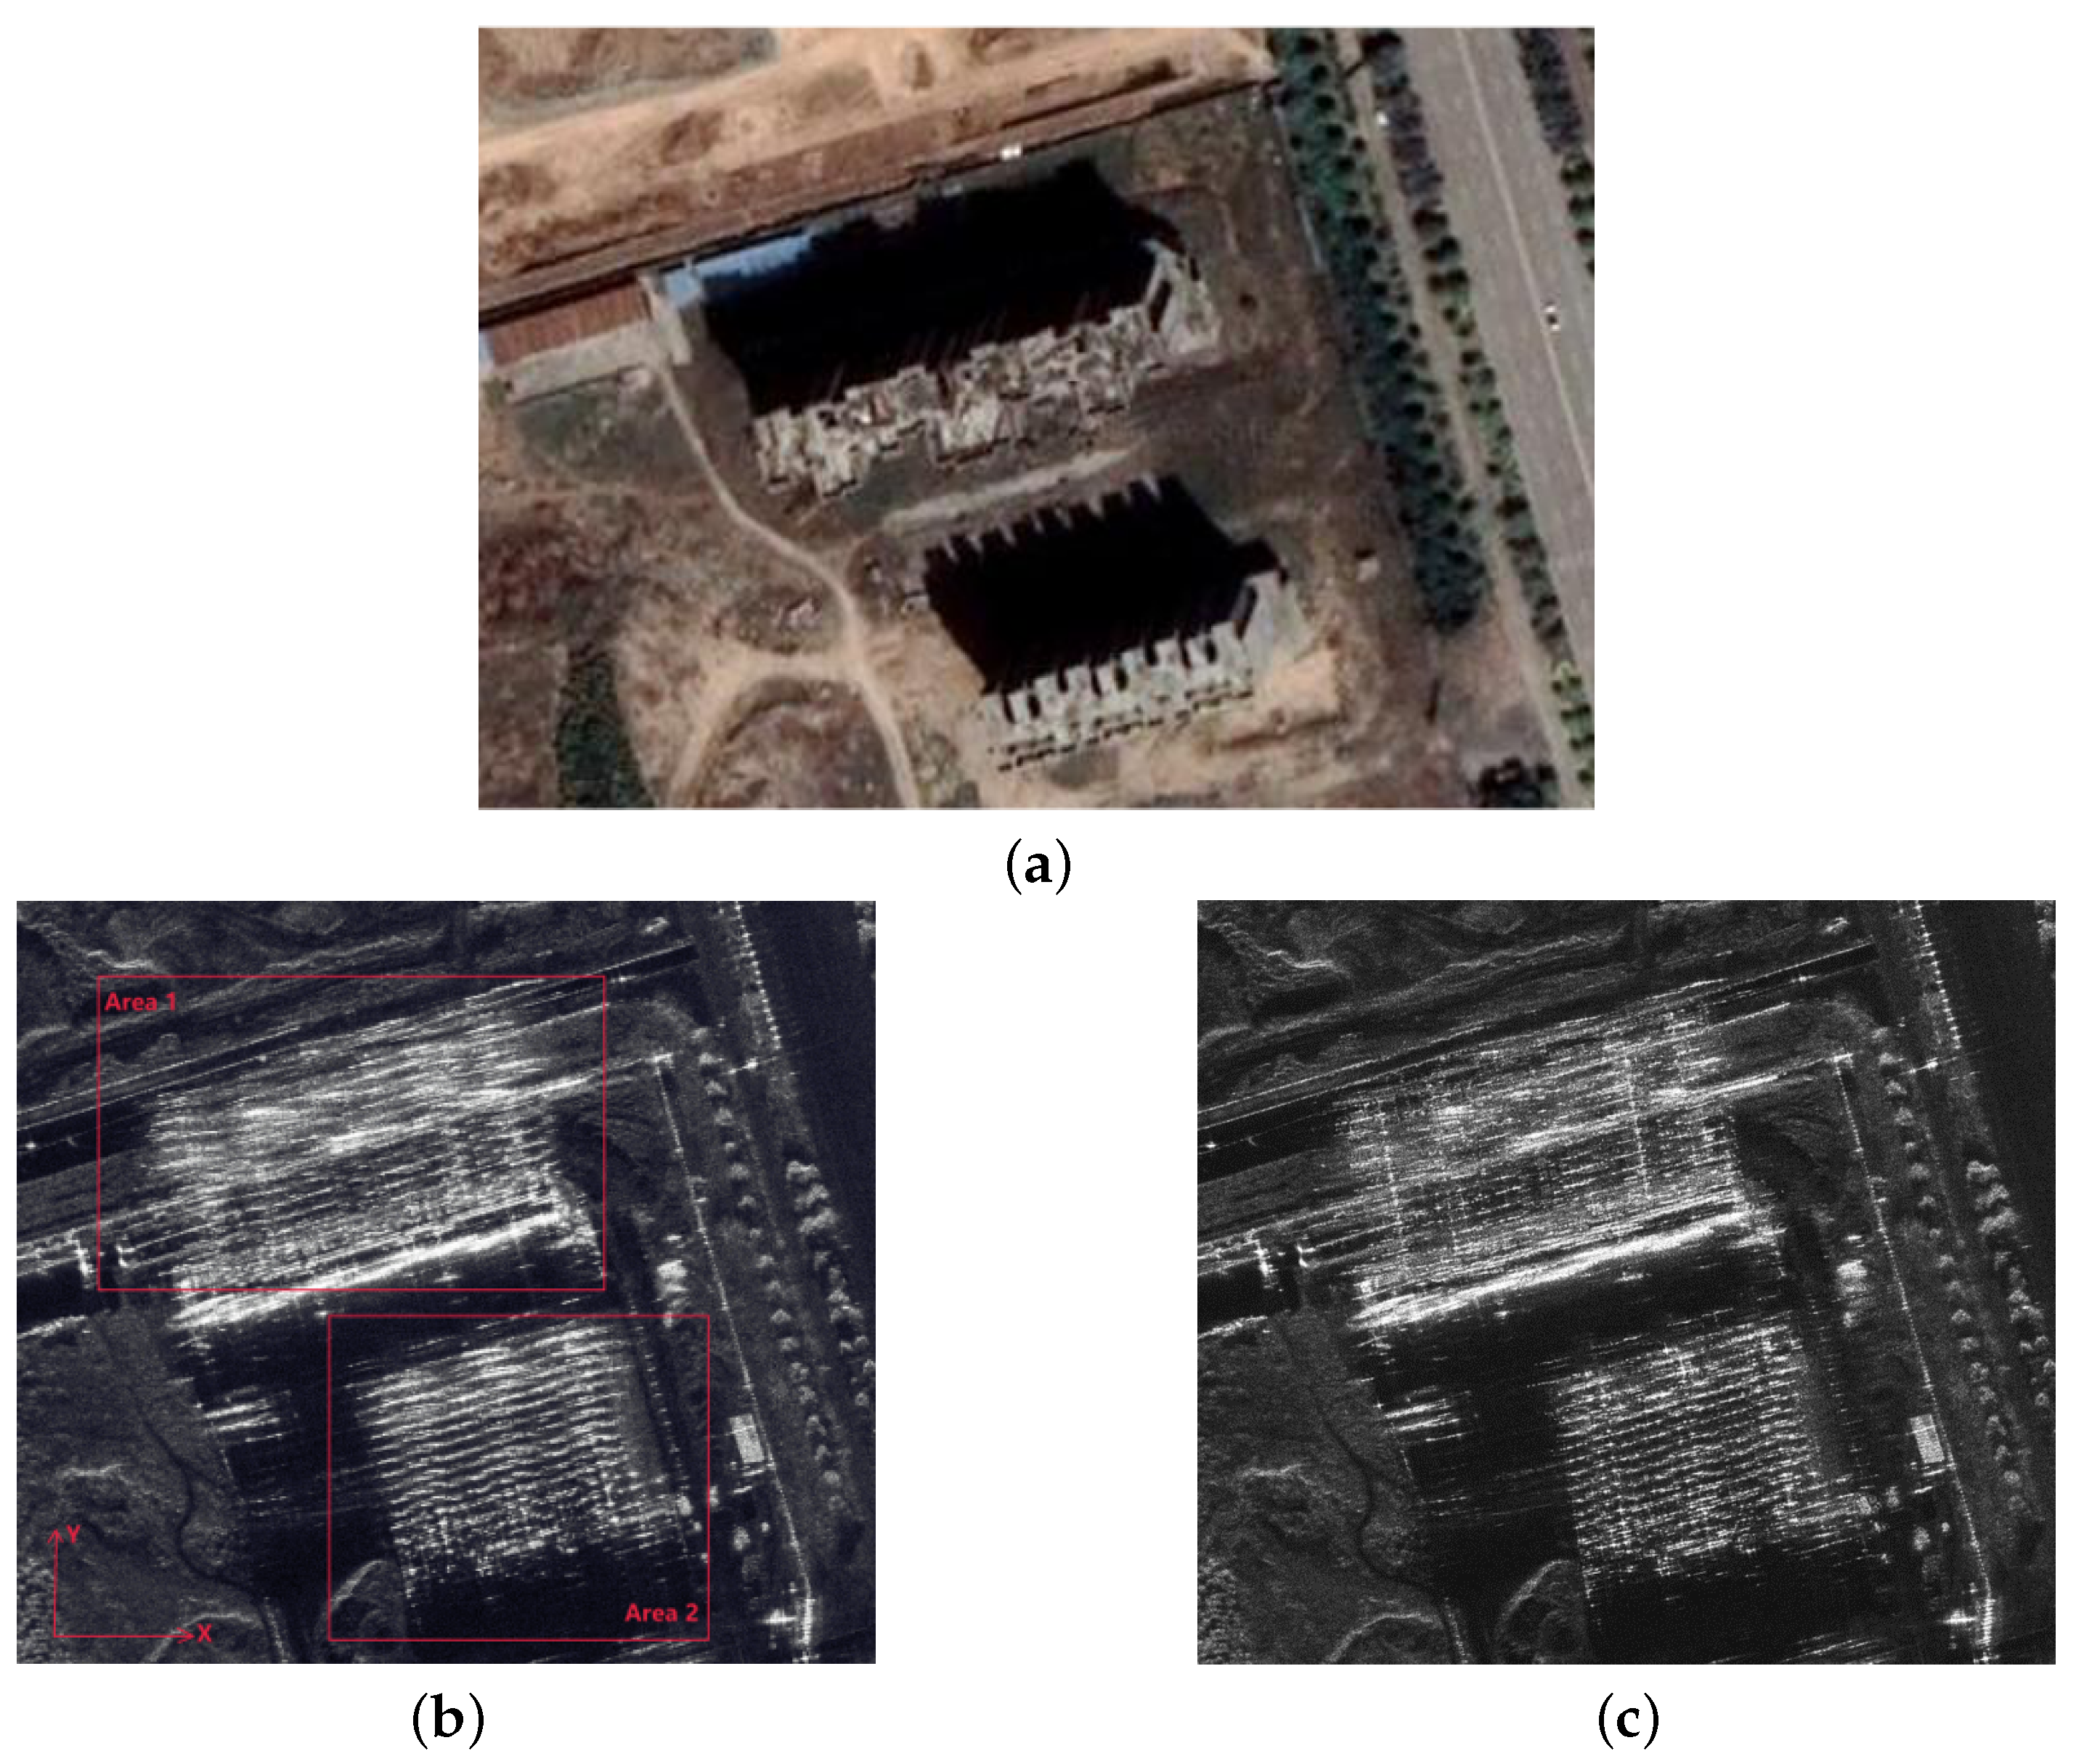
The illuminated area is the urban scene, containing several types of man-made targets, such as high-rise buildings, roads, and so on. The high-rise buildings are the typical nonplanar targets with large height size, which is composed of a number of scatterers distributed along different heights. The optical image of the scene is shown in Figure 16a.
Since there are no DSM data can be used, the traditional method usually performs BP algorithm on a reference plane with certain height. Considering most of the targets (such as roads, trees, and so on.) are approximately planar close to the ground, the height of the reference plane is selected to be 0 m. The imaging results of the scene obtained by the traditional method is shown in Figure 16b. It can be seen that, except for the high-rise buildings labeled by the red rectangles, other targets can be well focused in the scene. However, this is not the case for the high-rise buildings. Due to the large height size, the imaging results of the high-rise buildings show defocusing, and the top parts are more serious than the bottom parts of the buildings.
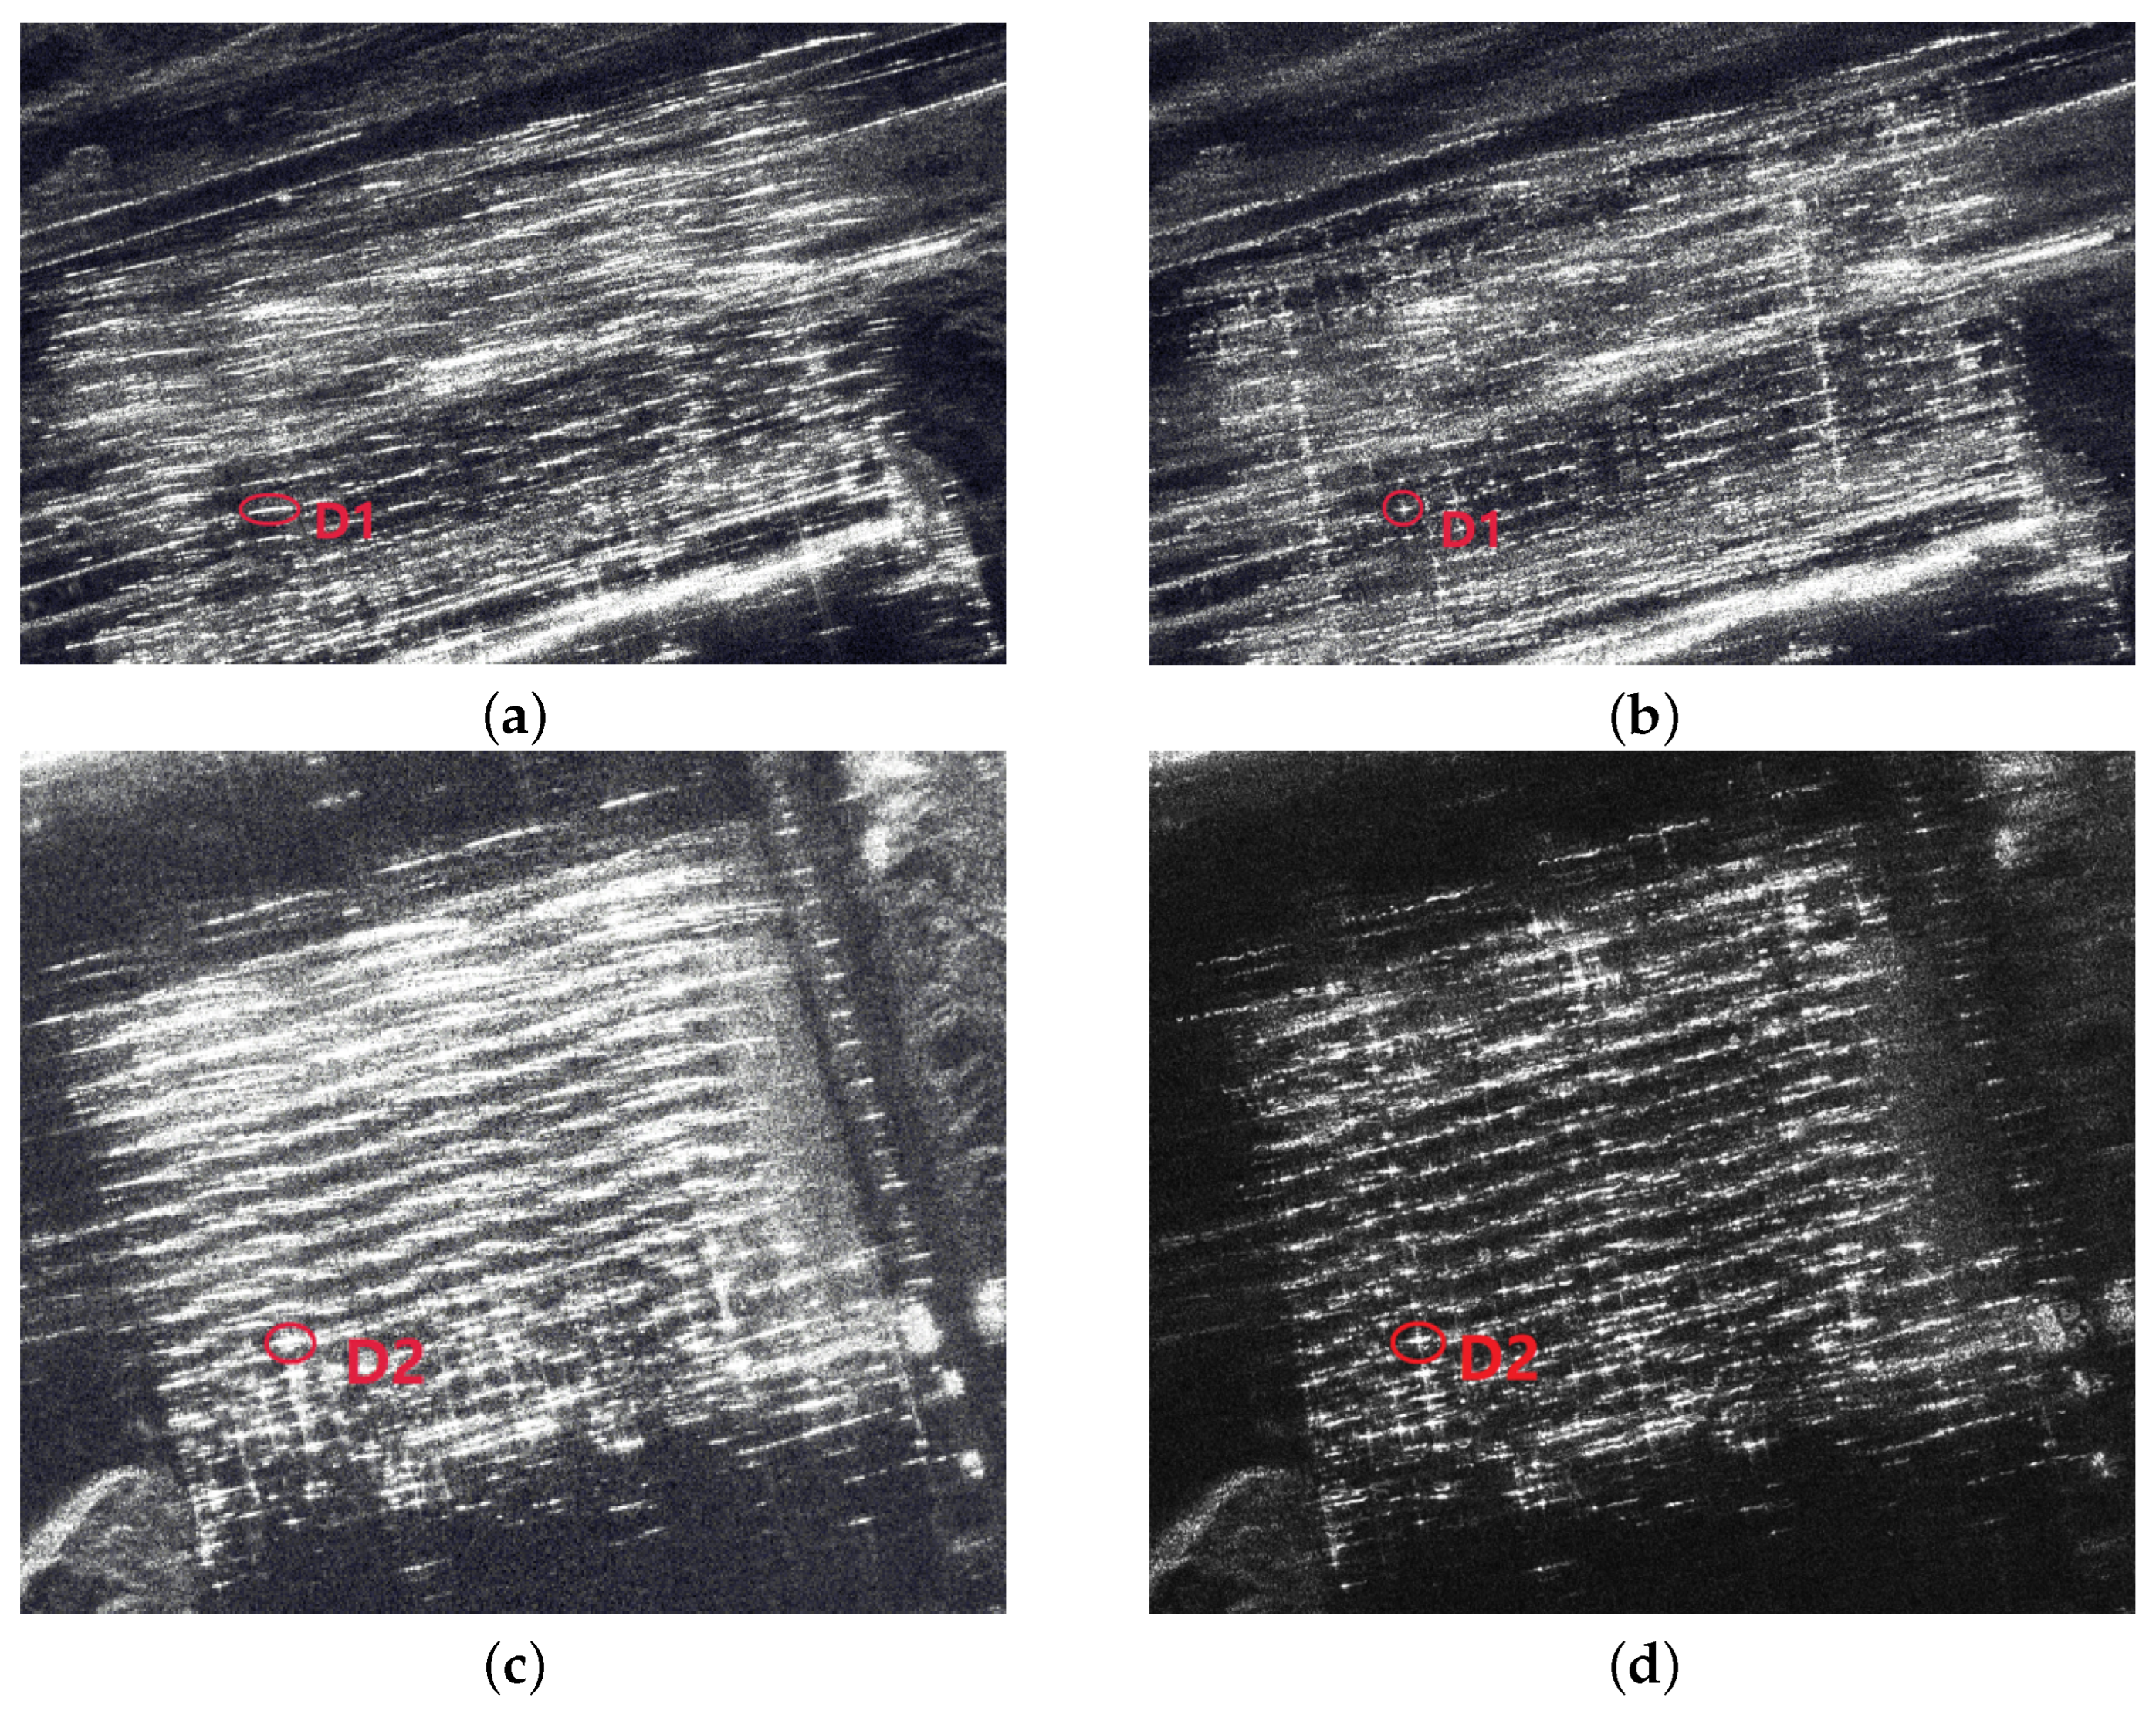
Figure 16c gives the imaging results obtained by the proposed method for the same observed scene. To obtain the results, the observed scene is firstly divided into several planes with heights varying from 0 m to 50 m with 1 m step, and the BP algorithm is performed on these planes. The size of each patch is set to be 9 × 9 pixels (corresponding to 0.4 m × 0.4 m) to obtain the offsets estimations relative to the reference plane. The imaging results of Area 1 and Area 2 labeled by the red rectangles in Figure 16b are extracted and compared in Figure 17. Compared to the traditional method, the obviously improved imaging quality of the buildings can be achieved by our proposed method.
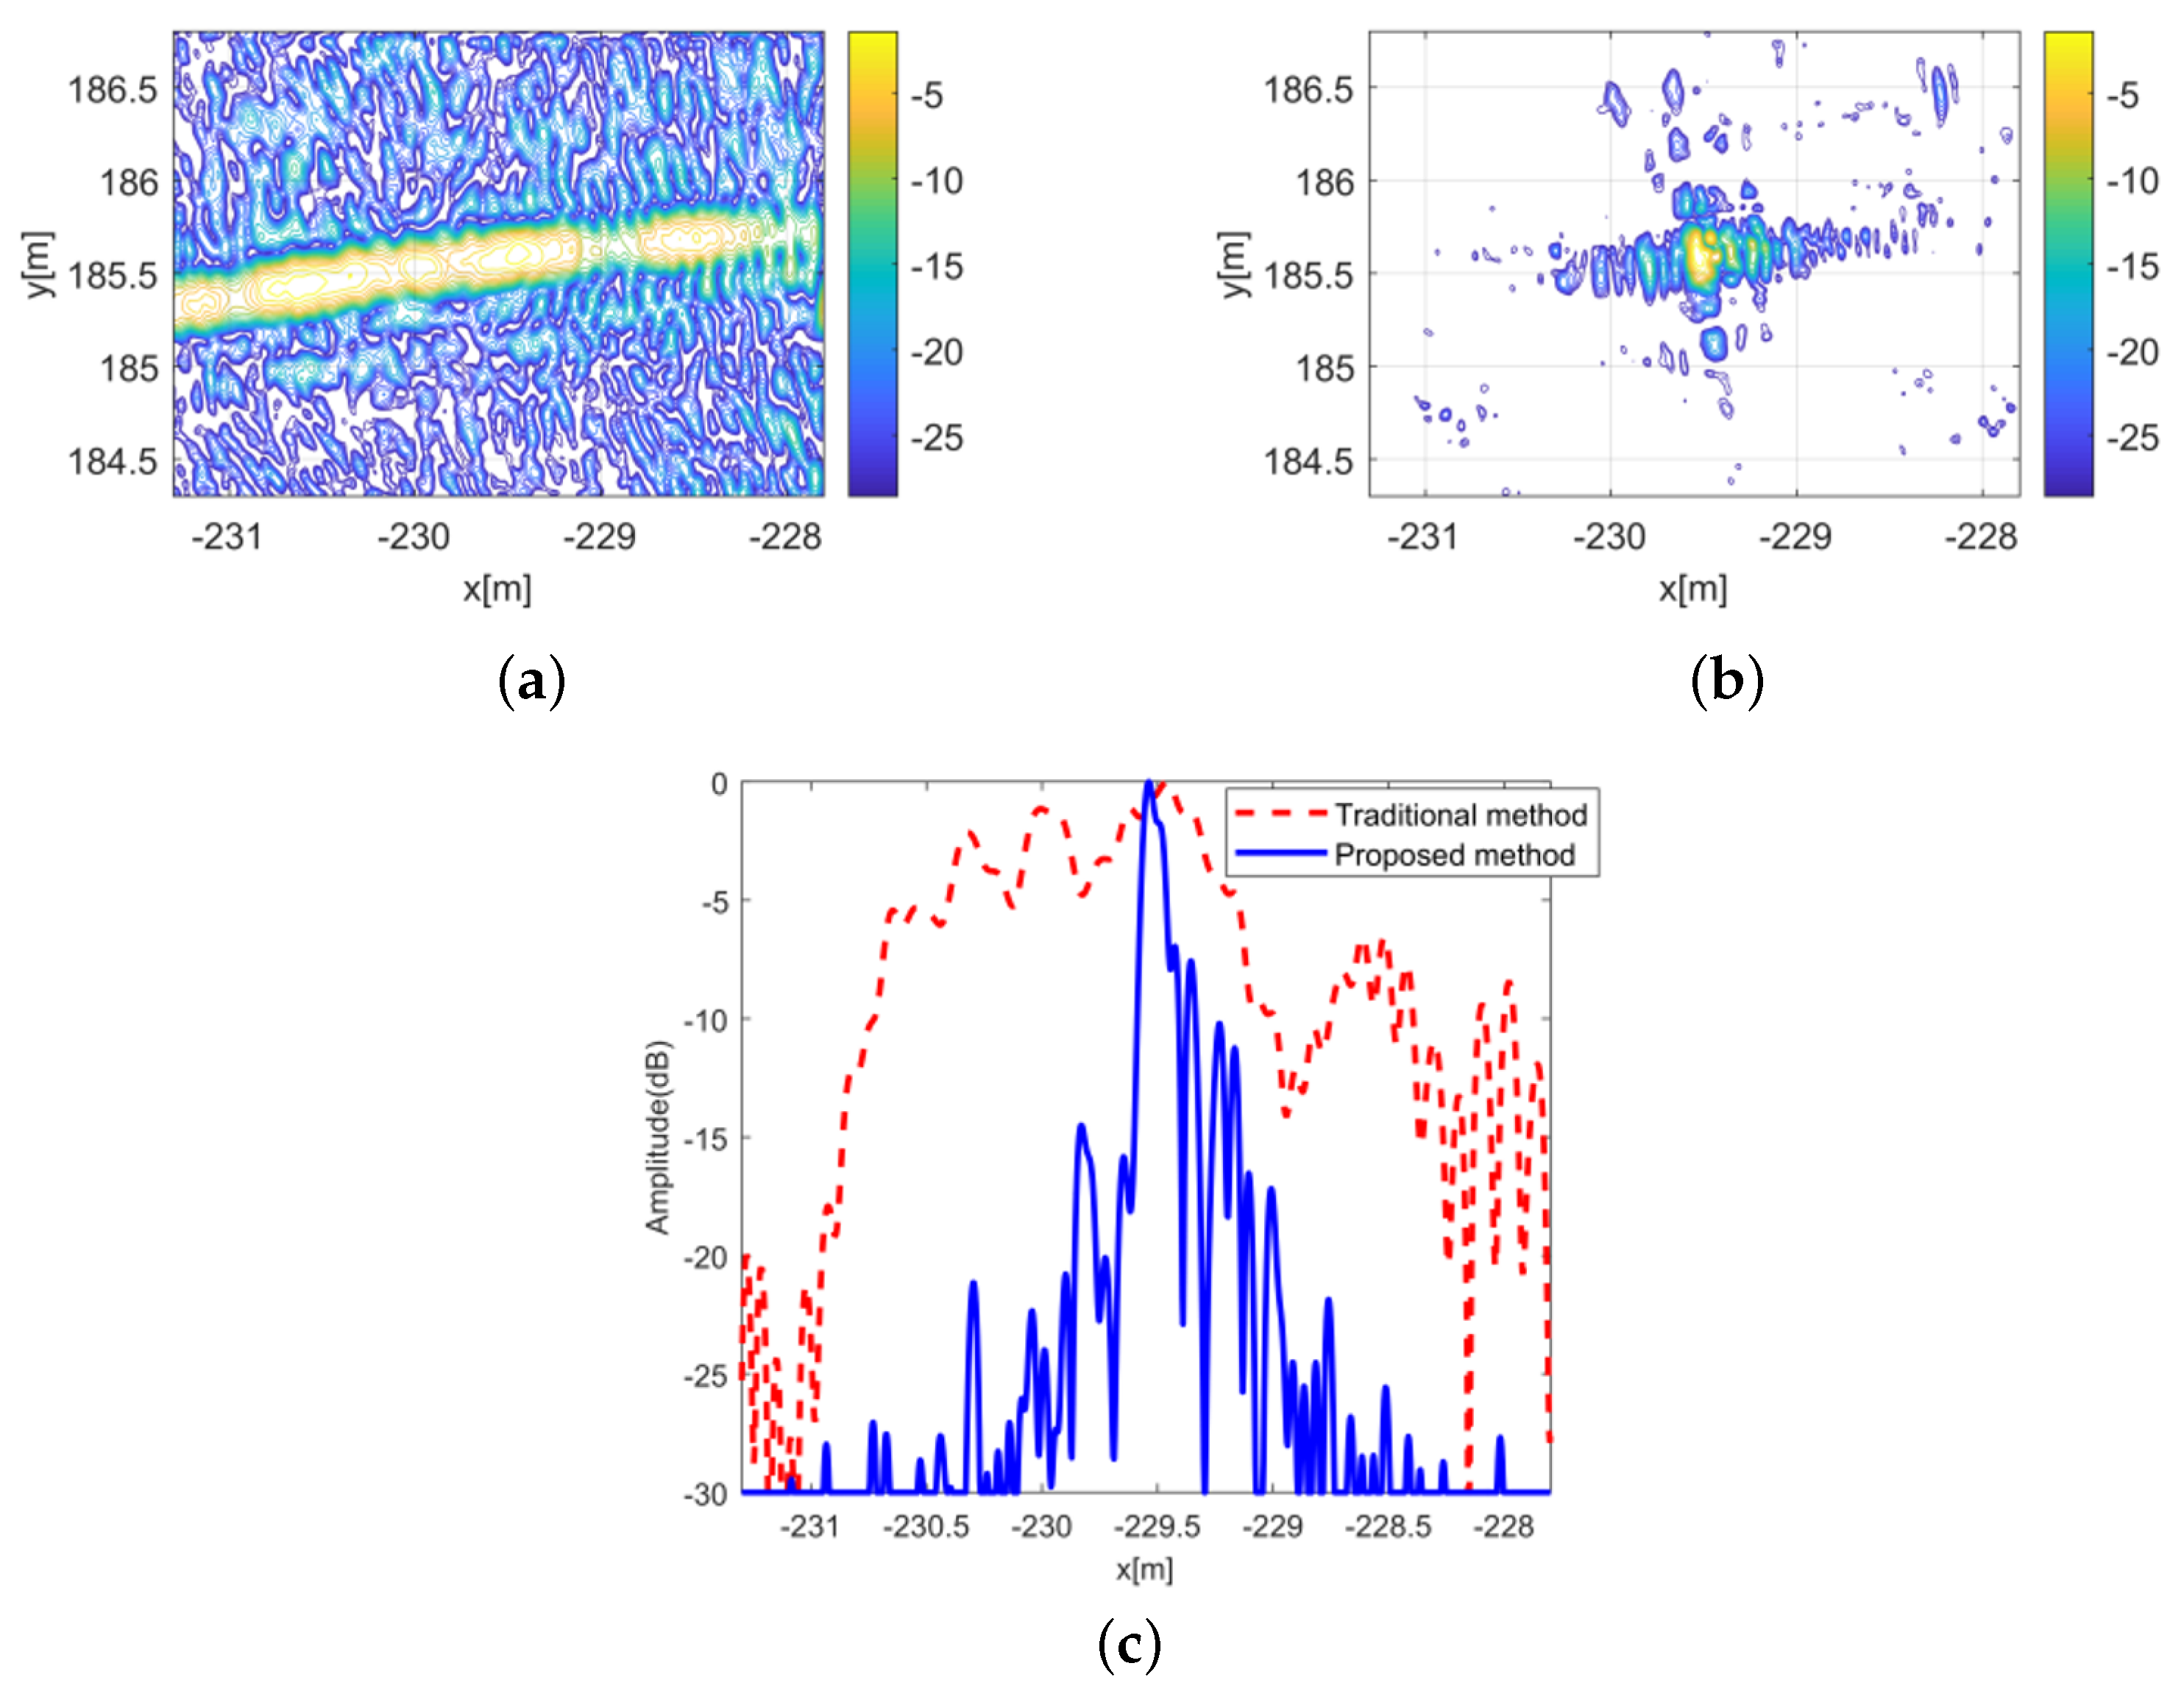
The contour plots and azimuth slices of the point-like targets D1 and D2 labeled by the red circle in Figure 17 are shown in Figure 18 and Figure 19, respectively. Besides, the azimuth resolutions, PSLR, and ISLR of the selected D1 and D2 are measured and shown in Table 4 to make a quantitative evaluation and comparison between the traditional method and the proposed method. Similar conclusion with the simulation can be drawn for the real data verification that, the proposed method can effectively improve the focusing quality of the buildings in CSAR compared to the traditional method.

5. Conclusions

Airborne CSAR has the ability to realize high-resolution imaging of the scene over 360 degrees azimuth angle variation. This paper investigates the focusing of the buildings in airborne CSAR. The relationship between the scatterer height and azimuth focusing quality is firstly analyzed and deduced, and then a novel method based on the BP algorithm is proposed to acquire high-quality CSAR image. The proposed method can improve the focusing quality of the buildsings in the CSAR imaging, and it is especially suitable for the high-resolution imaging and monitoring of the urban site with high-rise buildings in the airborne CSAR scenario. The validity and feasibility of the proposed method are verified by using both simulated and real data.
Besides, the proposed method can be also used to estimate the height information of the buildings roughly, which means the potential to realize 3-D reconstruction in the single-pass CSAR configuration. However, the accuracy of the height estimation is not enough until now, and it can only satisfy the high-resolution 2-D imaging. Therefore, future work will focus on improving the estimation accuracy of the positions of the scatterer, to achieve multi-dimensional information with higher accuracy of the stereoscopic scene in the CSAR configuration.

Author Contributions

Conceptualization, D.F. and L.C.; methodology, D.F.; software, J.W.; validation, D.A., D.F. and L.C.; formal analysis, X.H.; investigation, D.F.; resources, D.A.; data curation, D.F. and D.A.; writing—original draft preparation, D.F.; writing—review and editing, D.A. and J.W.; visualization, L.C.; supervision, X.H. All authors have read and agreed to the published version of the manuscript.

Funding

This work was supported in part by the National Natural Science Foundation of China under Grant 62101562, Grant 62271492, and Grant 62101566; and in part by the Natural Science Foundation for Distinguished Young Scholars of Hunan Province under Grant 2022JJ10062.

Data Availability Statement

Data is unavailable due to privacy restrictions.

Conflicts of Interest

The authors declare no conflict of interest.

References

  1. Moreira, A.; Prats-Iraola, P.; Younis, M.; Krieger, G.; Hajnsek, I.; Papathanassiou, K.P. A tutorial on synthetic aperture radar. IEEE Geosci. Remote Sens. Mag. 2013, 1, 6–43. [Google Scholar] [CrossRef]
  2. Chen, J.; Li, M.; Yu, H.; Xing, M. Full-aperture processing of airborne microwave photonic SAR raw data. IEEE Trans. Geosci. Remote Sens. 2023, 61, 5218812. [Google Scholar] [CrossRef]
  3. Rambour, C.; Budillon, A.; Johnsy, A.C.; Denis, L.; Tupin, F.; Schirinzi, G. From interferometric to tomographic SAR: A review of synthetic aperture radar tomography-processing techniques for scatterer unmixing in urban areas. IEEE Geosci. Remote Sens. Mag. 2020, 8, 6–29. [Google Scholar] [CrossRef]
  4. Kechagias-Stamatis, O.; Aouf, N. Automatic target recognition on synthetic aperture radar imagery: A survey. IEEE Aerosp. Electron. Syst. Mag. 2021, 36, 56–81. [Google Scholar] [CrossRef]
  5. Soumekh, M. Reconnaissance with slant plane circular SAR imaging. IEEE Trans. Image Process. 1996, 5, 1252–1265. [Google Scholar] [CrossRef] [PubMed]
  6. Ishimaru, A.; Chan, T.; Kuga, Y. An imaging technique using confocal circular synthetic aperture radar. IEEE Trans. Geosci. Remote Sens. 1998, 36, 1524–1530. [Google Scholar] [CrossRef]
  7. Cantalloube, H.; Koeniguer, E.C. Assessment of physical limitations of high resolution on targets at X band from circular SAR experiments. In Proceedings of the 7th European Conference on Synthetic Aperture Radar, Friedrichshafen, Germany, 2–5 June 2008; pp. 1–4. [Google Scholar]
  8. Austin, C.D.; Ertin, E.; Moses, R.L. Sparse signal methods for 3-D radar imaging. IEEE J. Sel. Topics Signal Process. 2011, 5, 408–423. [Google Scholar] [CrossRef]
  9. Palm, S.; Sommer, R.; Janssen, D.; Tessmann, A.; Stilla, U. Airborne circular W-band SAR for multiple aspect urban site monitoring. IEEE Trans. Geosci. Remote Sens. 2019, 57, 6996–7016. [Google Scholar] [CrossRef]
  10. Ponce, O.; Prats-Iraola, P.; Pinheiro, M.; Rodrigues-Cassola, M.; Scheiber, R.; Reigber, A.; Moreira, A. Fully polarimetric high resolution 3-D imaging with circular SAR at L-band. IEEE Trans. Geosci. Remote Sens. 2014, 52, 3074–3090. [Google Scholar] [CrossRef]
  11. Palm, S.; Stilla, U. 3-D point cloud generation from airborne single-pass and single-channel circular SAR data. IEEE Trans. Geosci. Remote Sens. 2021, 59, 8398–8417. [Google Scholar] [CrossRef]
  12. Lin, Y.; Hong, W.; Tan, W.; Wang, Y.; Wu, Y. Interferometric circular SAR method for three-dimensional imaging. IEEE Geosci. Remote Sens. Lett. 2011, 8, 1026–1030. [Google Scholar] [CrossRef]
  13. Bao, Q.; Lin, Y.; Hong, W.; Shen, W.; Zhao, Y.; Peng, X. Holographic SAR tomography image reconstruction by combination of adaptive imaging and sparse Bayesian inference. IEEE Geosci. Remote Sens. Lett. 2017, 14, 1248–1252. [Google Scholar] [CrossRef]
  14. Feng, D.; An, D.; Chen, L.; Huang, X. Holographic SAR tomography 3-D reconstruction based on iterative adaptive approach and generalized likelihood ratio test. IEEE Trans. Geosci. Remote Sens. 2021, 59, 305–315. [Google Scholar] [CrossRef]
  15. Ponce, O.; Prats-Iraola, P.; Scheiber, R.; Reigber, A.; Moreira, A. First airborne demonstration of holographic SAR tomography with fully polarimetric multicircular acquisitions at L-band. IEEE Trans. Geosci. Remote Sens. 2016, 54, 6170–6196. [Google Scholar] [CrossRef]
  16. Ertin, E.; Moses, R.L.; Potter, L.C. Interferometric methods for three-dimensional target reconstruction with multipass circular SAR. IET Radar Sonar Navigat. 2010, 4, 464–473. [Google Scholar] [CrossRef]
  17. An, D.; Huang, X.; Jin, T.; Zhou, Z. Extended nonlinear chirp scaling algorithm for high-resolution highly squint SAR data focusing. IEEE Trans. Geosci. Remote Sens. 2012, 50, 3595–3609. [Google Scholar] [CrossRef]
  18. Jia, G.; Buchroithner, M.F.; Chang, W.; Liu, Z. Fourier-based 2-D imaging algorithm for circular synthetic aperture radar: Analysis and application. IEEE J. Sel. Topics Appl. Earth Observ. Remote Sens. 2016, 9, 475–489. [Google Scholar] [CrossRef]
  19. Feng, D.; An, D.; Huang, X. An extended fast factorized back projection algorithm for missile-borne bistatic forward-looking SAR imaging. IEEE Trans. Aerosp. Electron. Syst. 2018, 54, 2724–2734. [Google Scholar] [CrossRef]
  20. Hu, X.; Xie, H.; Zhang, L.; Hu, J.; He, J.; Yi, S.; Jiang, H.; Xie, K. Fast factorized backprojection algorithm in orthogonal elliptical coordinate system for ocean scenes imaging using geosynchronous spaceborne-airborne VHF UWB bistatic SAR. Remote Sens. 2023, 15, 2215. [Google Scholar] [CrossRef]
  21. Ulander, L.M.H.; Hellsten, H.; Stenstrom, G. Synthetic aperture radar processing using fast factorized back-projection. IEEE Trans. Aerosp. Electron. Syst. 2003, 39, 760–776. [Google Scholar] [CrossRef]
  22. Duersch, M.I.; Long, D.G. Analysis of time-domain back-projection for stripmap SAR. Int. J. Remote Sens. 2015, 36, 2010–2036. [Google Scholar] [CrossRef]
  23. Cantalloube, H.M.-J. Circular SAR imaging of not planar targets. Limitations of the “height from focus” paradigm. In Proceedings of the IEEE International Symposium on Geoscience and Remote Sensing (IGARSS), Valencia, Spain, 22–27 July 2018; pp. 3671–3674. [Google Scholar]
  24. Ertin, E.; Austin, C.D.; Sharma, S.; Moses, R.L.; Potter, L.C. GOTCHA experience report: Three-dimensional SAR imaging with complete circular apertures. Proc. SPIE 2007, 6568, 656802. [Google Scholar]
  25. Ponce, O.; Prats-Iraola, P.; Scheiber, R.; Reigber, A.; Moreira, A.; Aguilera, E. Polarimetric 3-D reconstruction from multicircular SAR at P-band. IEEE Geosci. Remote Sens. Lett. 2014, 11, 803–807. [Google Scholar] [CrossRef]
  26. Cao, N.; Lee, H.; Zaugg, E.; Shrestha, R.; Carter, W.E.; Glennie, C.; Lu, Z.; Yu, H. Estimation of residual motion errors in airborne SAR interferometry based on time-domain backprojection and multisquint techniques. IEEE Trans. Geosci. Remote Sens. 2018, 56, 2397–2407. [Google Scholar] [CrossRef]
  27. Chen, J.; Xing, M.; Yu, H.; Liang, B.; Peng, J.; Sun, G.C. Motion compensation/autofocus in airborne synthetic aperture radar: A review. IEEE Geosci. Remote Sens. Mag. 2022, 10, 185–206. [Google Scholar] [CrossRef]
  28. Luo, Y.; Qiu, X.; Dong, Q.; Fu, K. A robust stereo positioning solution for multiview spaceborne SAR images based on the range-doppler model. IEEE Geosci. Remote Sens. Lett. 2022, 19, 4008705. [Google Scholar] [CrossRef]
  29. Aghababaee, H.; Fornaro, G.; Schirinzi, G. Phase calibration based on phase derivative constrained optimization in multibaseline SAR tomography. IEEE Trans. Geosci. Remote Sens. 2018, 56, 6779–6791. [Google Scholar] [CrossRef]
  30. Ash, J.N. An autofocus method for backprojection imagery in synthetic aperture radar. IEEE Geosci. Remote Sens. Lett. 2012, 9, 104–108. [Google Scholar] [CrossRef]
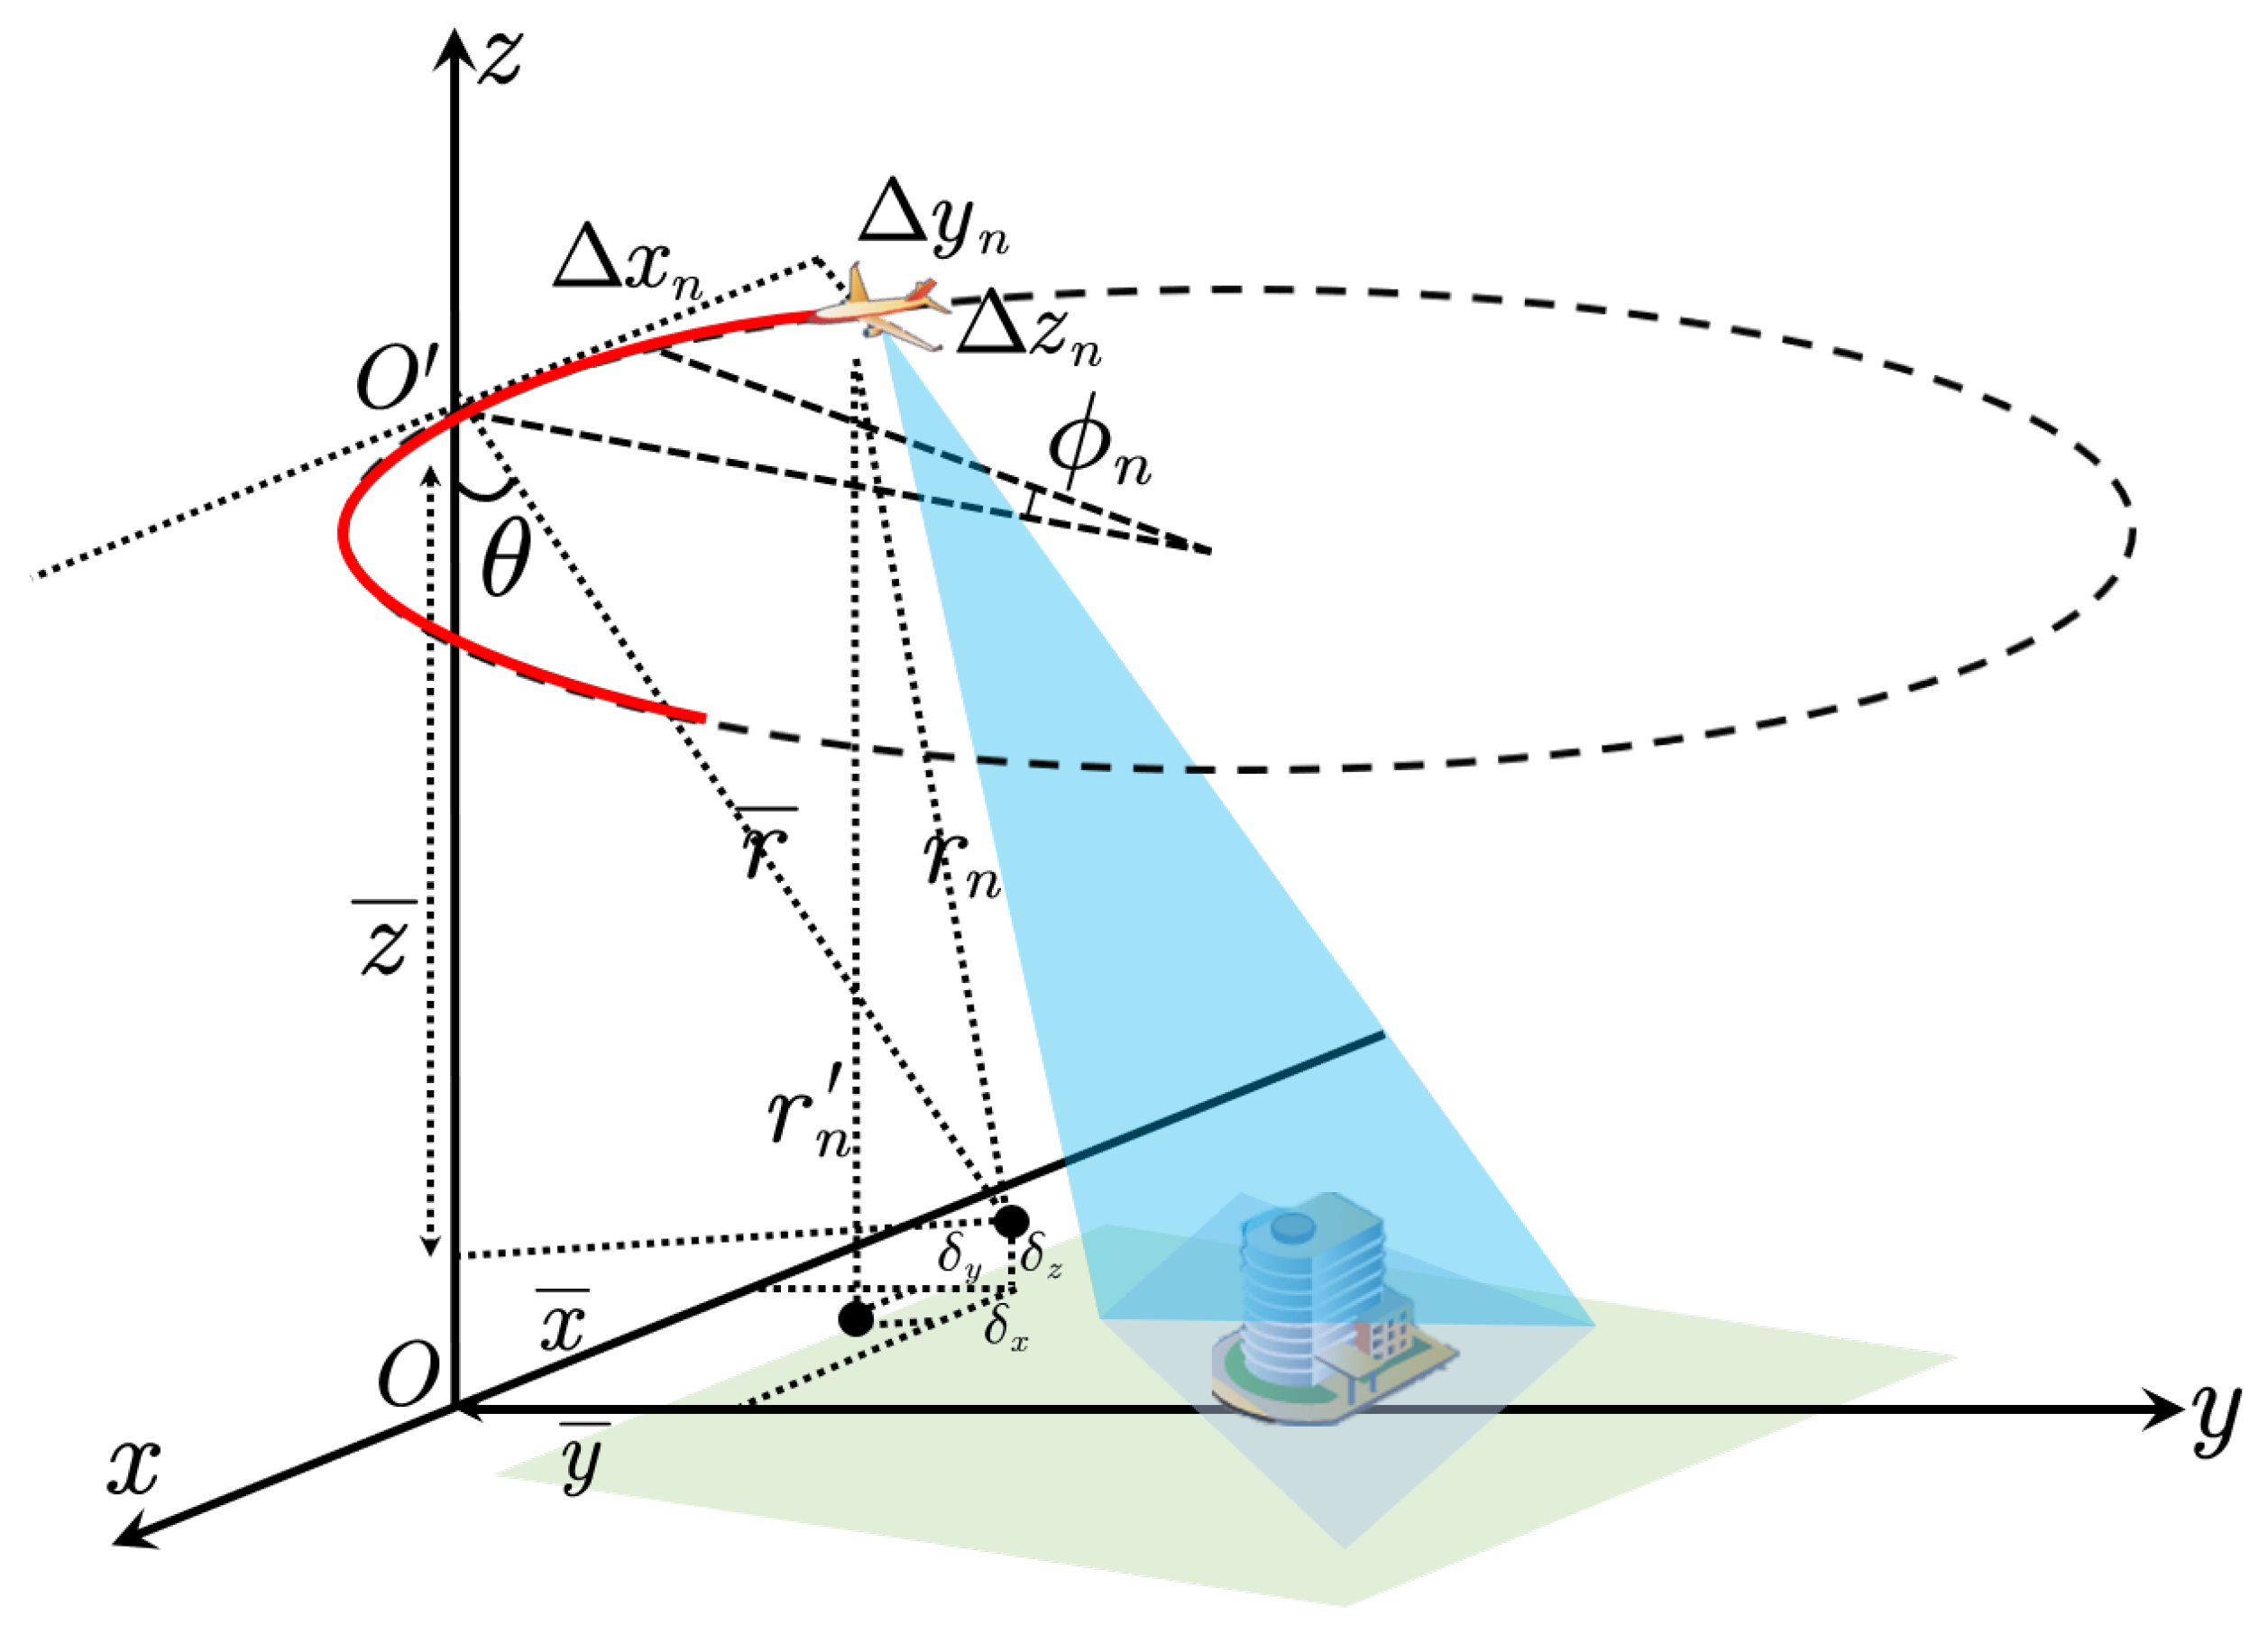
Figure 1. Schematic diagram of the airborne CSAR imaging geometry. Red curve denotes an arc-shaped synthetic aperture, and black circular dotted line denotes the circular trajectory.
Remotesensing 16 00253 g001
Figure 2. Illustrationof the symmetric geometry. Point A and Point B have the same distance from the radar.
Remotesensing 16 00253 g002
Figure 3. Top view of the arc-shaped trajectory.
Remotesensing 16 00253 g003
Figure 4. Projection of the scatterer on a flat plane for CSAR geometry. Red curve denotes an arc-shaped synthetic aperture, and black circular dotted line denotes the circular trajectory.
Remotesensing 16 00253 g004
Figure 5. Schematic diagram of the imaging result of one scatterer which is at (0, 0, 0) m when (a) the height of the imaging plane is −2 m, (b) the height of the imaging plane is 0 m, and (c) the height of the imaging plane is 2 m.
Remotesensing 16 00253 g005
Figure 6. Schematic diagram of the selection of the M patches.
Remotesensing 16 00253 g006
Figure 7. Flowchart of the proposed method.
Remotesensing 16 00253 g007
Figure 8. Schematic diagram of the imaging geometry in the simulation. Red curve denotes the arc-shaped synthetic aperture used to generate the simulated data.
Remotesensing 16 00253 g008
Figure 9. Scatterers distribution in the observed scene.
Remotesensing 16 00253 g009
Figure 10. Imaging results obtained by the traditional method when the heights of the reference planes are (a) 0 m, (b) 3 m, and (c) 6 m, respectively.
Remotesensing 16 00253 g010
Figure 11. Comparison of the imaging results between the traditional and the proposed method. (a) Imaging results obtained by the traditional method. (b) Imaging results obtained by the proposed method. The height of the reference plane is 6 m.
Remotesensing 16 00253 g011
Figure 12. Contour plots of scatterer A4. (a) Obtained by the traditional method. (b) Obtained by the proposed method. (c) Comparison of the azimuth slices.
Remotesensing 16 00253 g012
Figure 13. Contour plots of scatterer B4. (a) Obtained by the traditional method. (b) Obtained by the proposed method. (c) Comparison of the azimuth slices.
Remotesensing 16 00253 g013
Figure 14. Contour plots of scatterer C4. (a) Obtained by the traditional method. (b) Obtained by the proposed method. (c) Comparison of the azimuth slices.
Remotesensing 16 00253 g014
Figure 15. Actual flight trajectory of the airborne radar platform. (a) 3-D display. (b) Top view.
Remotesensing 16 00253 g015
Figure 16. Optical image and radar images. (a) Optical image from the Google Earth. (b) Imaging results obtained by the traditional method. (c) Imaging results obtained by the proposed method.
Remotesensing 16 00253 g016
Figure 17. Imaging results of Area 1 and Area 2 obtained by different methods. (a) Imaging results of Area 1 obtained by the traditional method. (b) Imaging results of Area 1 obtained by the proposed method. (c) Imaging results of Area 2 obtained by the traditional method. (d) Imaging results of Area 2 obtained by the proposed method.
Remotesensing 16 00253 g017
Figure 18. Contour plots of point-like target D1. (a) Obtained by the traditional method. (b) Obtained by the proposed method. (c) Comparison of the azimuth slices.
Remotesensing 16 00253 g018
Figure 19. Contour plots of point-like target D2. (a) Obtained by the traditional method. (b) Obtained by the proposed method. (c) Comparison of the azimuth slices.
Remotesensing 16 00253 g019
Table 1. Simulation parameters of the CSAR Imaging.
ParametersValues
Center frequency10 GHz
Signal bandwidth600 MHz
Chirp Duration1 us
Azimuth accumulation angel10 degrees
Elevation angle45 degrees
Scene size20 m × 20 m ( x × y )
Table 2. Measured azimuth resolutions, PSLR, and ISLR of the selected scatterers.
Measured ParametersMethodsA4B4C4
Resolutions (in meters)Traditional0.5280.1400.088
Proposed0.1040.1000.088
Theoretical0.1050.0970.090
PSLR (in dB)Traditional−0.016−11.115−13.285
Proposed−13.404−13.360−13.235
ISLR (in dB)Tradional1.920−10.481−10.600
Proposed−10.723−10.743−10.546
Table 3. Exprimental parameters of the airborne CSAR.
ParametersValues
Radar operating bandKu-band
Signal bandwidth1200 MHz
Chirp duration200 us
Elevation angle48 degrees
Mean flight height1975 m
Mean flight radius2192 m
Table 4. Measured azimuth resolutions, PSLR, and ISLR of the selected point-like targets D1 and D2.
Measured ParametersMethodsD1D2
Resolutions (in meters)Traditional1.0650.609
Proposed0.0900.075
PSLR (in dB)Traditional−4.677−3.948
Proposed−7.568−8.273
ISLR (in dB)Tradional1.7422.113
Proposed−5.487−5.359
Disclaimer/Publisher’s Note: The statements, opinions and data contained in all publications are solely those of the individual author(s) and contributor(s) and not of MDPI and/or the editor(s). MDPI and/or the editor(s) disclaim responsibility for any injury to people or property resulting from any ideas, methods, instructions or products referred to in the content.