Article

Estimation of Dissolved Organic Carbon Using Sentinel-2 in the Eutrophic Lake Ebinur, China

1
College of Geography and Remote Sensing Sciences, Xinjiang University, Urumqi 830046, China
2
College of Geography and Environmental Sciences, Zhejiang Normal University, Jinhua 321004, China
3
College of Geographic Science and Tourism, Xinjiang Normal University, Urumqi 830054, China
4
GeoInformatic Unit, Geography Section, School of Humanities, Universiti Sains Malaysia, Penang 11800, Malaysia
5
Departments of Earth Sciences, The University of Memphis, Memphis, TN 38152, USA
6
Department of Social Sciences and Policy Studies, Education University of Hong Kong, Lo Ping Road, Tai Po, Hong Kong, China
*
Author to whom correspondence should be addressed.
These authors contributed equally to this work.
Remote Sens. 2024, 16(2), 252; https://doi.org/10.3390/rs16020252
Submission received: 17 November 2023 / Revised: 1 January 2024 / Accepted: 4 January 2024 / Published: 9 January 2024
(This article belongs to the Section Ecological Remote Sensing)

Abstract

:
Dissolved organic carbon (DOC) in lakes, as a regulatory agent and light-absorbing compound, is a key component of the global carbon cycling in lacustrine ecosystems. Hence, continuous monitoring of the DOC concentration in arid regions is extremely important. This study utilizes the QAA-CDOM semi-analytical model, which has good accuracy in retrieving the CDOM (colored dissolved organic matter) concentration of Lake Ebinur. We chose to invert the CDOM time-series data from May to October during the 2018–2022 period. A DOC estimation model was then established using the linear regression approach based on the CDOM inversion data and the field DOC measurements. In general, the DOC concentration in Lake Ebinur exhibited an increasing trend from 2018 to 2022, typically lower in May and higher in June. When comparing the average values of DOC in Lake Ebinur for the same months across different years, it can be observed that the month of September exhibits the greatest variability, whereas June shows the least variability. In sum, this study successfully retrieved CDOM concentrations for a saline lake within an arid region and developed a DOC estimation model, thereby providing a reference for investigating carbon cycling in typical lakes of arid areas.

Graphical Abstract

1. Introduction

Inland aquatic ecosystems, including streams, rivers, and lakes, are important freshwater resources and provide a wide array of ecosystem services. These water bodies enable the substantial transfer and conversion of carbon elements from terrestrial ecosystems into aquatic environments [1]. Even though they occupy only 3% of the Earth’s surface, recent studies have highlighted the crucial role of inland lakes in the global carbon cycle (Harkort et al., 2023) as they emit greenhouse gases equivalent to nearly 20% of global fossil fuel emissions [2]. Dissolved organic carbon (DOC) in lakes serves as a substrate for heterotrophic bacterial growth, acting as a regulatory factor and light-absorbing agent in the global carbon cycle [3]. While colored dissolved organic matter (CDOM) constitutes the optically active fraction of dissolved organic matter (DOM), DOC serves as an effective water quality parameter in assessing carbon concentrations and spatial distribution characteristics in aquatic environments [4,5].
Scholars have pointed out that CDOM can serve as an alternative in estimating the carbon in inland lakes [6,7]. Currently, there are three major categories of established CDOM retrieval algorithms: empirical models, semi-analytical models, and analytical models. Empirical models are primarily built upon statistical relationships between in situ CDOM measurements and water surface remote sensing reflectance. For instance, spectral index algorithms [8], band ratio algorithms [9], and matrix inversion algorithms [10] were developed to retrieve CDOM concentrations in lakes. Empirical models offer advantages, such as straightforward computation and ease of implementation. However, the development of empirical models lacks theoretical support and cannot exhibit stable statistical relationships, which necessitate a substantial amount of measured data. This limitation constrains the widespread applicability and dissemination of these models [11] (Morel et al., 1977). Semi-analytical models, grounded in radiative transfer principles, utilize simplified model parameters derived from empirical models. This approach ensures a higher level of generality and reliability for the models [12]. The Quasi-Analytical Algorithm for Colored Dissolved Organic Matter (QAA-CDOM) separates the absorption coefficients of suspended particulate matter (SPM) and CDOM, enabling the reliable retrieval of CDOM concentrations in lakes [1,13]. Previous studies have already demonstrated the strong applicability of the QAA model in Lake Ebinur [14]. Considering that the Lake Ebinur basin falls within a data-scarce region and that there has been limited research on remote-sensing-based CDOM concentration retrieval in lakes, this study contributes to enriching the body of knowledge related to water quality monitoring in arid region lakes significantly. Analytical methods theoretically offer high monitoring accuracy and generality. Furthermore, they do not necessarily rely on extensive measured SPM concentration data. However, these methods are based on the known inherent spectral characteristics of pure water and of various components of lake water. The inherent spectral characteristics of these components often require field observations, and the operational complexity of the observation equipment means these analytical methods are uncommon in practical applications [14]. In this study, empirical models and the semi-analytical QAA model were chosen to retrieve CDOM concentrations from Lake Ebinur, with us selecting CDOM retrieval models that are well-suited to the lake’s conditions.
As satellite technology has advanced in recent years, CDOM remote sensing retrieval algorithms have been continuously refined, leading to their improved inversion accuracy [15]. Many scholars have made an initial research progress into quantitative retrieval models for surface-level DOC concentrations in inland lakes [3,16]. Currently, two main techniques are employed to estimate the DOC concentrations in inland lakes and marine bodies by using remote sensing methods. The first approach is to establish direct empirical models by correlating in situ measured reflectance spectral data with DOC measurements, enabling the long-term analysis of DOC concentrations in a specific region [17]. The second approach involves an indirect estimation of DOC through the relationship between water color parameters and DOC concentrations, thereby achieving remote sensing estimation of DOC [12]. In recent years, studies have indicated that there is a significant correlation between CDOM and DOC concentrations, suggesting that utilizing CDOM in estimating DOC holds a certain level of reliability [18,19]. Scholars have explored the relationship between DOC and CDOM in different lakes, and the results show that there is a significant correlation between the two water quality indices [16]. However, given the uncertainty in the relationship between DOC and CDOM in lakes across different regions, further exploration is warranted.
Lake Ebinur, a typical saline lake in an arid region, has experienced a continuous reduction in its surface area in recent years. Investigating the lake’s DOC concentration is of paramount significance in seeking to understand its dynamics. Accordingly, this study develops a DOC estimation model for long-term DOC concentration monitoring in Lake Ebinur. To achieve that goal, in this study, we set out (1) to determine the inherent optical properties and reference wavelengths for the QAA algorithm’s establishment; (2) to assess the applicability of multiple CDOM retrieval models to Lake Ebinur; (3) to evaluate the accuracy of different empirical models in establishing the relationship between CDOM and DOC; and (4) to analyze the spatial–temporal changes in DOC over Lake Ebinur from 2018 to 2022 using the best DOC model. This research could provide a reference framework for future DOC concentration retrieval in arid saline lakes and lays a solid foundation for investigating carbon cycling in such arid lake ecosystems.

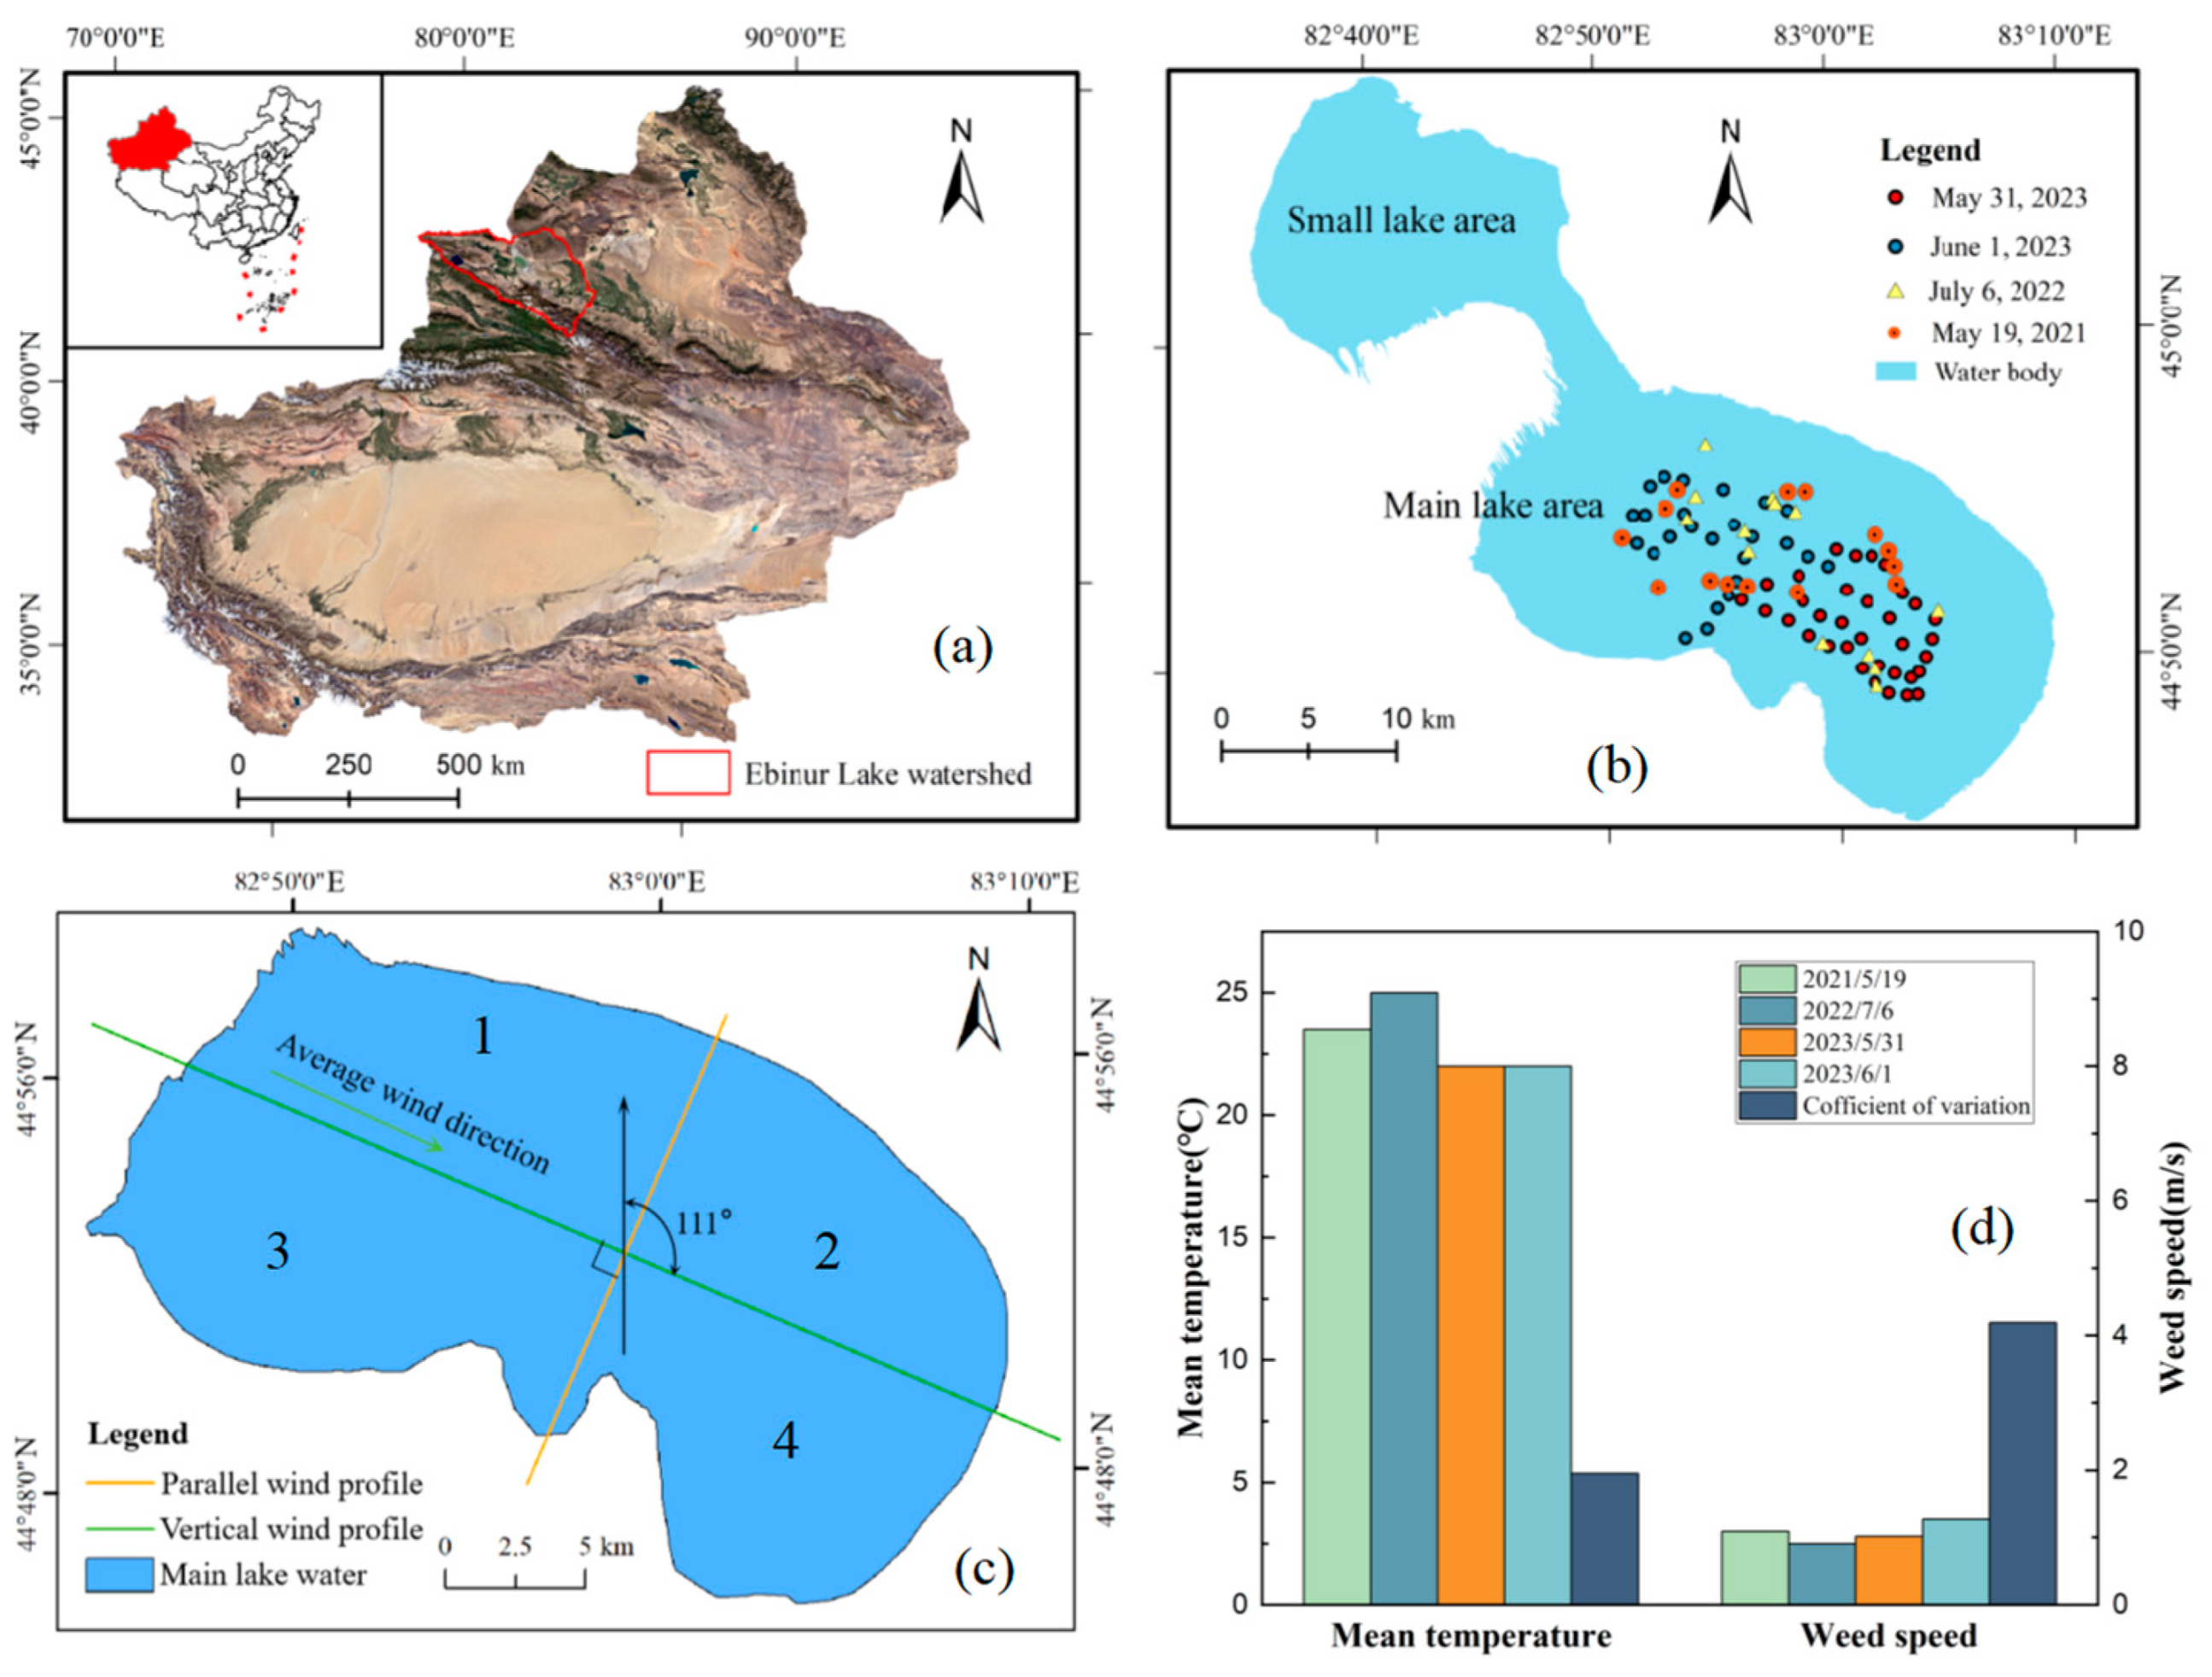
2. Research Area Overview

Lake Ebinur is situated in the northwestern part of Xinjiang, China, as shown in Figure 1. The region has few surface water quality monitoring stations, and the issue of missing values is severe. Lake Ebinur is situated 35 km north of Jinghe County. It is adjacent to the Jinghe-to-Alashankou section of the Lanxin Railway to the west. To the east lies the Ganjiahu Saltbush Forest Nature Reserve. The region receives about 292.31 mm/year precipitation on average, which primarily comes from snow. Around 2457 mm/year of evapotranspiration is distributed unevenly over a year on average. Within the lake area, evapotranspiration can reach up to 3600 mm/year. The water of Lake Ebinur is cloudy, and the average water depth is relatively shallow, at about 1.2 m. The average salinity is about 169.3 g/L [20]. As depicted in Figure 1c, the sampling dates were 19 May 2021, 6 July 2022, 31 May 2023, and 1 June 2023. A total of 60 sampling points were included in this study. Before field sampling, the water quality sampling bottle should be cleaned to avoid affecting the water quality. During the sampling period, the sky was clear and the wind was not very strong. The air temperature and wind speed of the three days before and after sampling were recorded, and the coefficient of variation was calculated, as shown in Figure 1d. The results showed that the weather conditions during different data collection periods were similar, so the collected samples could be used for the inversion of water quality parameters by means of remote sensing.

3. Data and Methods

The CDOM inversion model was established using Sentinel-2 imagery acquired on 31 May 2023, and the field measurements were conducted on 31 May and 1 June 2023. This study is focused on the estimation of DOC concentration from CDOM concentration; hence, the estimation of DOC concentration depends critically on the retrieval accuracy of the CDOM concentration at various time scales. Therefore, the data collected on 19 May 2021 were chosen as an independent validation sample (14 points), to assess the accuracy of QAA-CDOM concentration retrieval. To verify the stability of the statistical relationship between CDOM and DOC, 70% of the 2023 DOC concentration measured data (42 points) was used as the training dataset for the model, and 30% of the data (18 points) was used as the validation sample. The data collected on 6 July 2022 were used as an independent validation sample (12 points), to assess the accuracy of the DOC estimation model. The development of statistical relationships between DOC and CDOM made it possible to retrieve the DOC concentrations over Lake Ebinur for the period of 2018–2022 during non-iced seasons from May to October. The 10 m spatial resolution images could serve as a representative demonstration for the DOC estimation in this arid and data-scarce region of northwestern China. In this study, the water quality of Lake Ebinur was sampled, with the samples collected from the water surface (0–30 cm). After sampling, the collected water was preserved at a low temperature and brought back to the laboratory for the determination of water quality parameters, including water absorption coefficient, CDOM concentration, DOC concentration, etc.

3.1. Data Sources

This study used Sentinel-2 L1-level data for the study area. To achieve the temporal inversion of CDOM concentrations in Lake Ebinur, monthly satellite imagery from 2018 to 2022 for Lake Ebinur was collected (https://Sentinel.esa.int/web/Sentinel/home, accessed on 1 July 2023). The collection protocol necessitates the selection of satellite images with cloud cover of less than 10% over Lake Ebinur for each month’s early, middle, and late portions. It is crucial to ensure a minimum of two satellite images within a month, separated by at least ten days, to estimate DOC concentrations at image acquisition times. This process generates a monthly dataset representing the DOC concentration for the respective month. In this study, an image captured on 31 May 2023 is selected as the modeling datum. The weather on that day was clear, with low wind speed and minimal cloud cover, making it suitable for constructing the inversion model using remote sensing imagery. The Dark Spectrum Fitting model was employed for atmospheric correction of the satellite image, as outlined by Liu et al. [20], to acquire remote sensing reflectance from Lake Ebinur’s water body.

3.2. Inherent Optical Characteristics of the Water Body

The inherent optical characteristics of a water body refer to the quantitative features of its absorption and scattering by various components. Changes in the distribution and intensity of incident light have no effects on the inherent optical characteristics, but they are mainly reliant on the composition of the water. Hence, the absorption coefficient of water is a key component used to differentiate the inherent optical properties. In this study, laboratory measurements of water samples collected from field trips were used to evaluate the absorption coefficients of different water color components. Differences in water absorption characteristics directly influence the choice of the reference wavelength (λ0) in the QAA algorithm calculation. Therefore, it was important to analyze the water’s absorption properties in Lake Ebinur.
The total absorption coefficient of the water (a(λ)) is the sum of the absorption coefficients of SPM, CDOM, and pure water [21], as shown in Equation (1):
a ( λ ) = a p ( λ ) + a g ( λ ) + a w ( λ )
where aw(λ) represents the absorption coefficient of pure water; ag(λ) is the CDOM absorption coefficient; and ap(λ) represents the particle absorption coefficient. The absorption and back-scattering coefficients of pure water were obtained based on the research findings of Buiteveld et al. [22].
In the measurement of the SPM absorption coefficient, the GF/F filtration membrane type should be selected first. The object of this study was an inland lake. So, a Whatman GF/F filtration membrane with a diameter of 47 mm and an aperture of 0.7 μm [23] was used to carry out the experiment. The volume of the filtered water sample was 200 mL. The absorbance was measured every 1 nm between 380 nm and 800 nm by using a UV-3600 ultraviolet spectrometer. The absorbance of each band minus absorbance at the reference wavelength (750 nm) was used to perform scatter correction based on the formula proposed by Cleveland et al. [24], as follows:
OD spm = 0.378 OD f + 0.523 OD f 2    OD f 0.4
where ODspm is the absorbance of SPM on the corrected filter membrane, and ODf is the absorbance of SPM measured on the instrument and corrected by scattering.
The absorption coefficient of SPM on the filter membrane can be calculated according to Formula (3) [24]:
a p = 2.303   × s v OD spm ( λ )  
where V represents the volume of the filtered water sample. In this paper, V = 2 × 10⁻⁴ m3. S is the effective area of suspended matter deposited on the filter membrane. The diameter of the filter membrane adopted was 47 mm, and the diameter of the part with filter matter on the filter membrane was measured at 42 mm using a vernier caliper. Therefore, the effective area was S = π × (0.021)2 with the unit of m2.
In this study, the CDOM absorption coefficient of Lake Ebinur was measured using the quantitative filter technique at the sampling points, as shown in Figure 1. The filtrate was obtained with a polycarbonate Millipore filter membrane with a diameter of 50 mm and an aperture of 0.22 μm. The filtrate was loaded into a colorimetric dish, and its absorbance was measured using a UV-3600 ultraviolet spectrometer. Then, the absorption coefficients at each wavelength were calculated according to Formula (4) [25]:
a g ( λ )   = 2.303 D ( λ ) / r
where ag(λ’) is the uncorrected absorption coefficient at wavelength λ; D(λ) is the absorbance at wavelength λ; and r is the optical path. An optical path of 0.01–0.05 m is acceptable, and the specific needs are determined according to the concentration of the research target CDOM. The higher the concentration of CDOM, the smaller the optical path. The optical path that was selected in this study was 0.012 m.
The filtrate will inevitably retain fine particles, which will be scattered when measuring its absorbance. Therefore, scattering correction was performed according to Formula (5) [25]:
a g ( λ ) = a g ( λ )   a g ( 700 ) λ / 700
where ag(λ) is the absorption coefficient at wavelength λ, and 700 nm is selected as the reference wavelength to correct the absorption coefficient of CDOM.
DOC samples were stored at 4 °C in the dark during transportation. The concentration of DOC was measured using high-temperature catalytic oxidation (TOC-VCPH, Shimadzu for Japan, Nishinokyo Kuwabara-cho) [16].

3.3. CDOM Inversion Model

QAA-CDOM Model

In this study, the QAA-CDOM algorithm was employed to extract the absorption coefficient of CDOM at 440 nm (ag440) from remote sensing reflectance (Rrs) data. This extracted coefficient was then utilized for the inversion of CDOM concentrations in Lake Ebinur [15]. QAA-CDOM is an enhancement of the QAA algorithm [26], as illustrated in Figure 2. The QAA-CDOM model for CDOM concentration inversion primarily comprises two components. As shown in Table 1, steps (1)–(7) encompass the foundational QAA algorithm. This section involves the calculation of absorption coefficients at characteristic wavelengths, deduction of the water back-scattering coefficient at characteristic wavelengths, and computation of the water back-scattering coefficient at various wavelengths. Ultimately, it extrapolates the water absorption coefficient at 440 nm.
As shown in Table 1, steps (8)–(9), building upon the outcomes of part one, involve substituting the remote sensing reflectance at 440 nm and 555 nm with the nearest bands. Specifically, the reflectance at 443 nm and 560 nm is used as a replacement for the remote sensing reflectance at 440 nm and 555 nm, respectively [1]. By utilizing the SPM absorption coefficient at 443 nm, total absorption coefficient, and back-scattering coefficient (bbp) at 555 nm, the absorption coefficient of CDOM at 440 nm can be calculated [15,26]. The QAA algorithm requires the remote sensing reflectance levels at four wavelengths (440 nm, 483 nm, 561 nm, and 865 nm) as input data to infer the absorption and back-scattering coefficients of lakes. The second part involves deriving the absorption coefficient of phytoplankton and non-algal particles (ap440) using the back-scattering coefficient, as outlined by [15]. As shown in step (8), this ultimately leads to the computation of ag443. This process is mainly aimed at separating the absorption coefficients of SPM and CDOM and using the measured data for regression analysis to determine j1 and j2. In this step, j1 and j2 are two parameters estimated from field data, with values of j1 = 1.1 and j2 = 0.72.

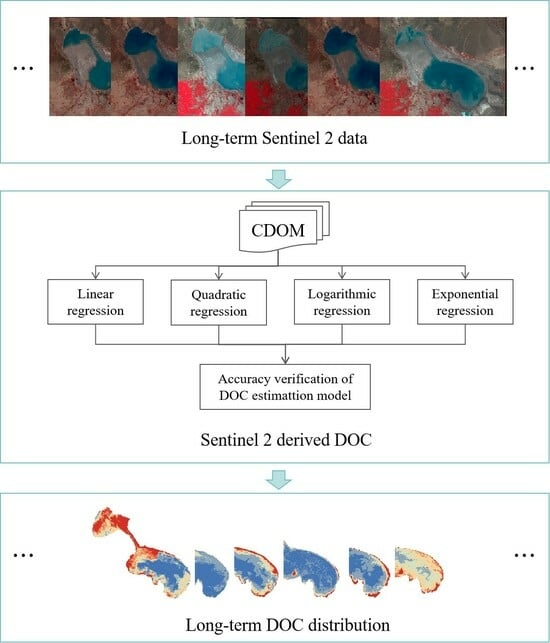
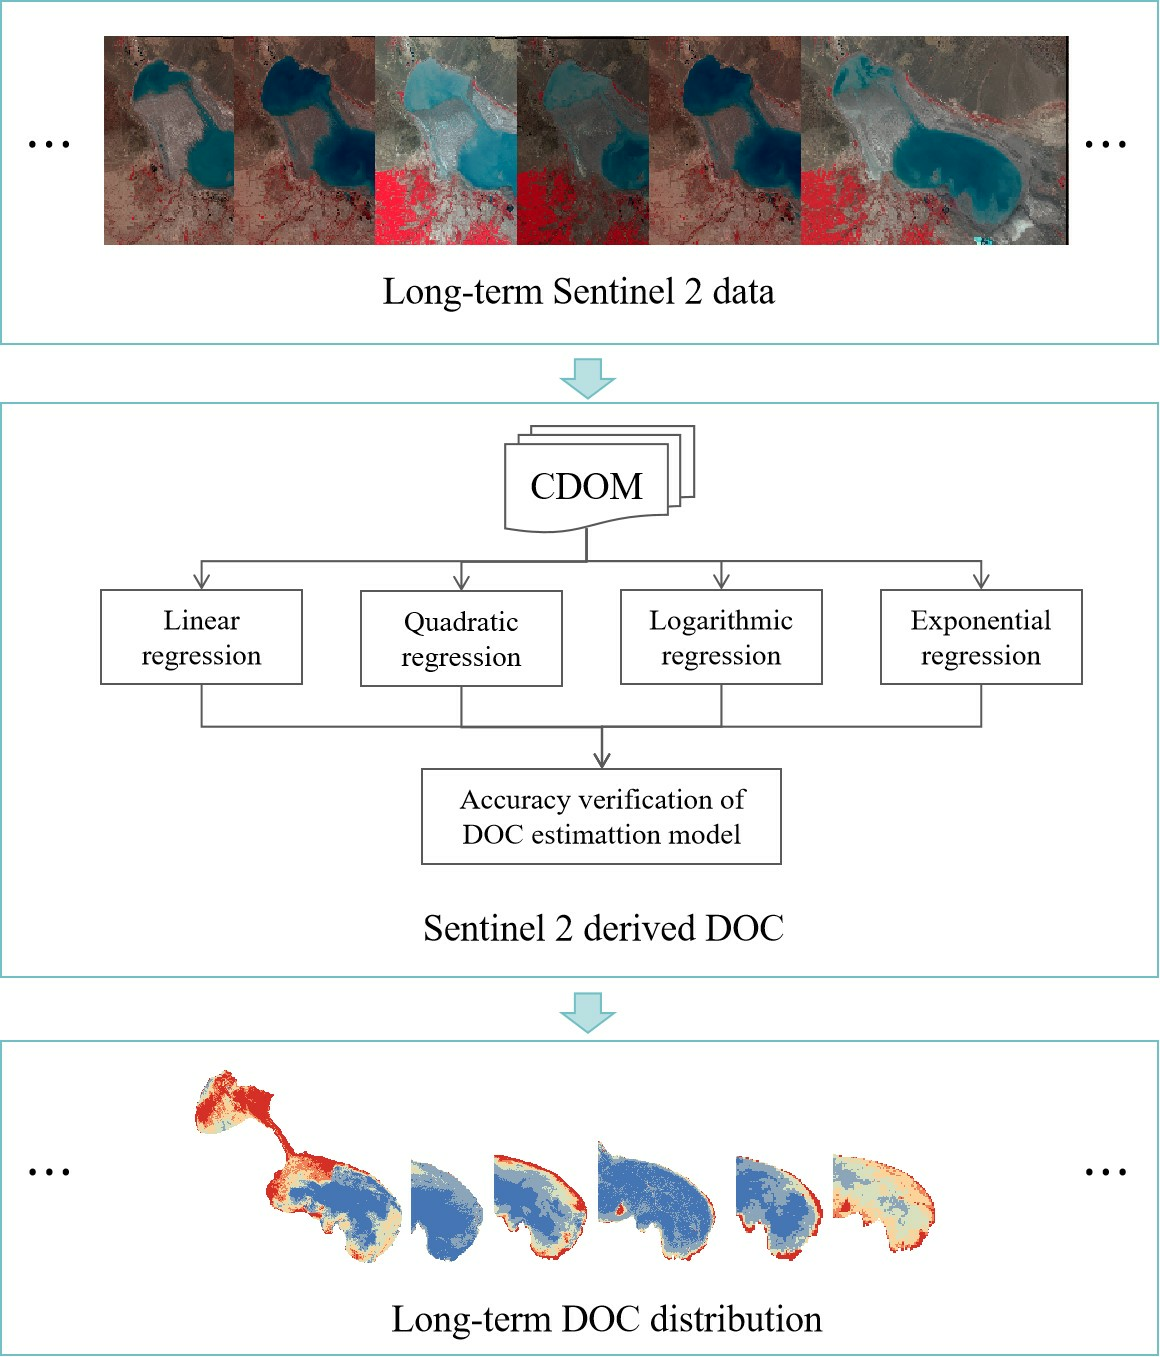
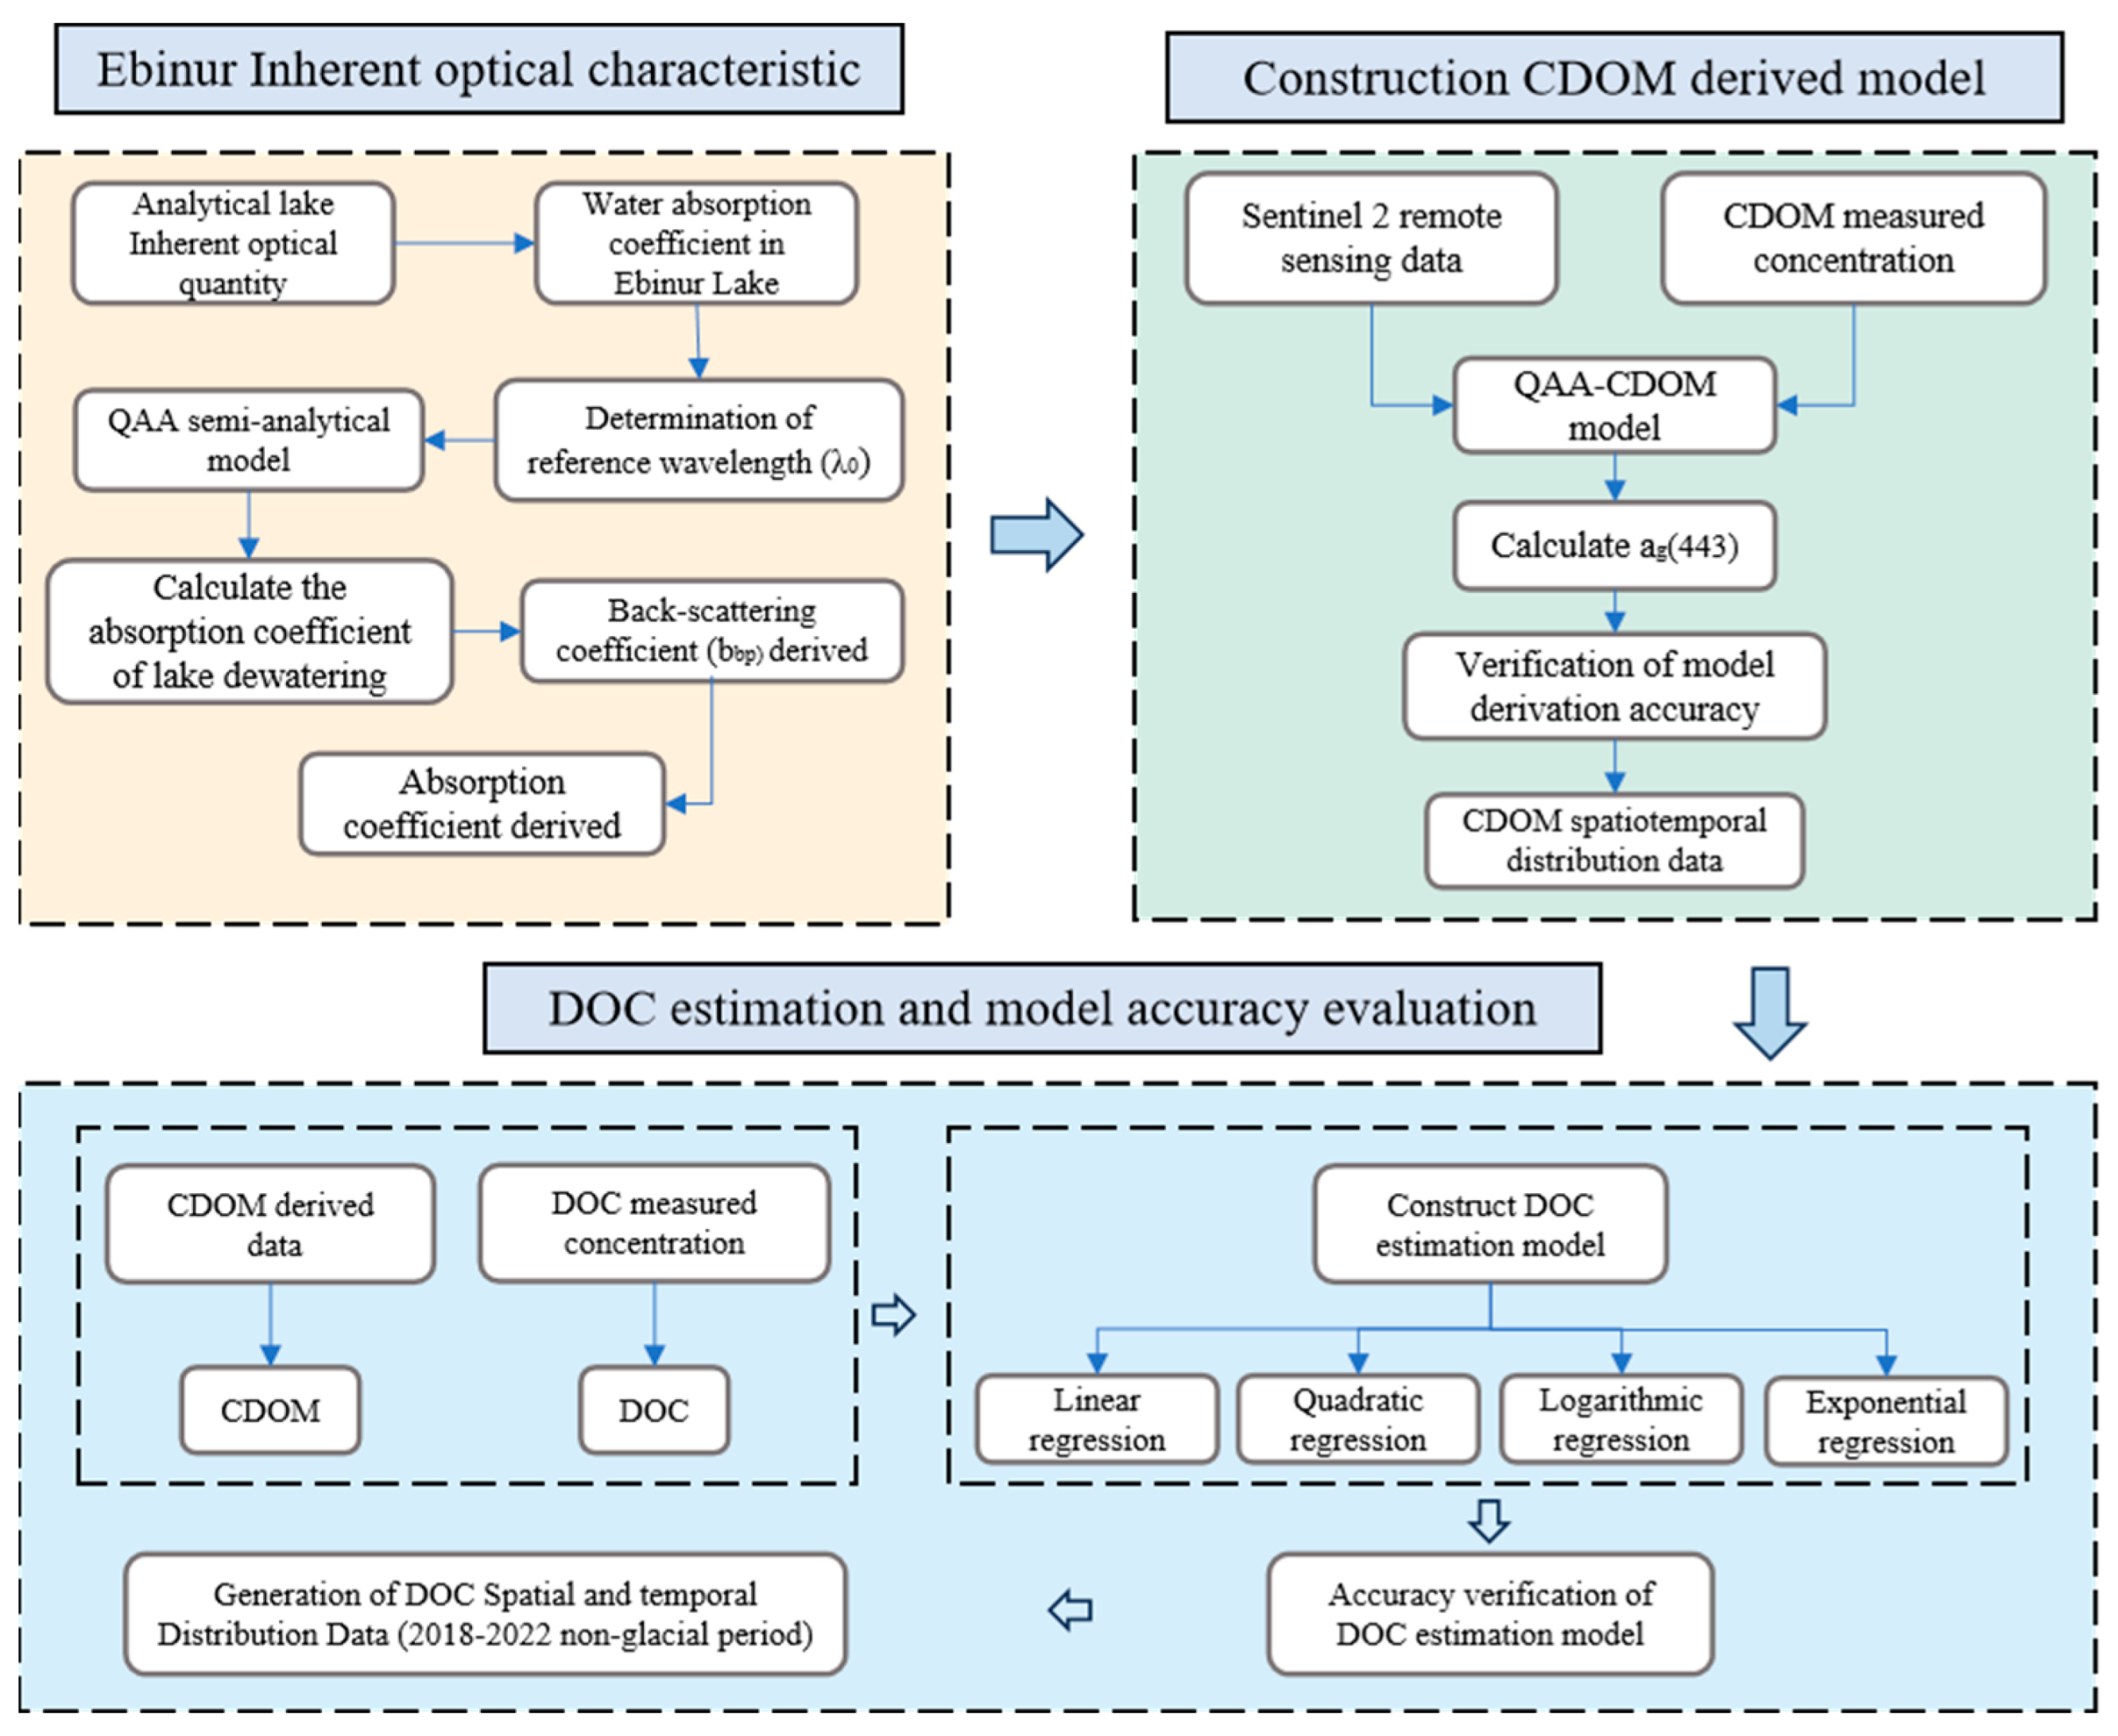
3.4. Technical Approach

The first part of this study involved investigating the inherent optical characteristics of Lake Ebinur. This was accomplished by measuring the absorption coefficients of Lake Ebinur’s water, based on which we determined the reference wavelength to be 833 nm. Based on the semi-analytical QAA model, in this study, we inverted the absorption coefficients and back-scattering coefficients of Lake Ebinur’s water. The second part of this study was focused on constructing a CDOM inversion model, where we used the QAA-CDOM semi-analytical model to retrieve the CDOM concentration of Lake Ebinur. The third part of this study involved constructing a Lake Ebinur DOC estimation model based on CDOM inversion data. Various regression models were employed, including linear, exponential, logarithmic, and quadratic models. The goal was to select the most suitable DOC estimation model for Lake Ebinur and to use it to estimate the changes in DOC concentration from 2018 to 2022. This part of the study also included an analysis of the inter-monthly and inter-annual variations in Lake Ebinur’s DOC concentration.

4. Results

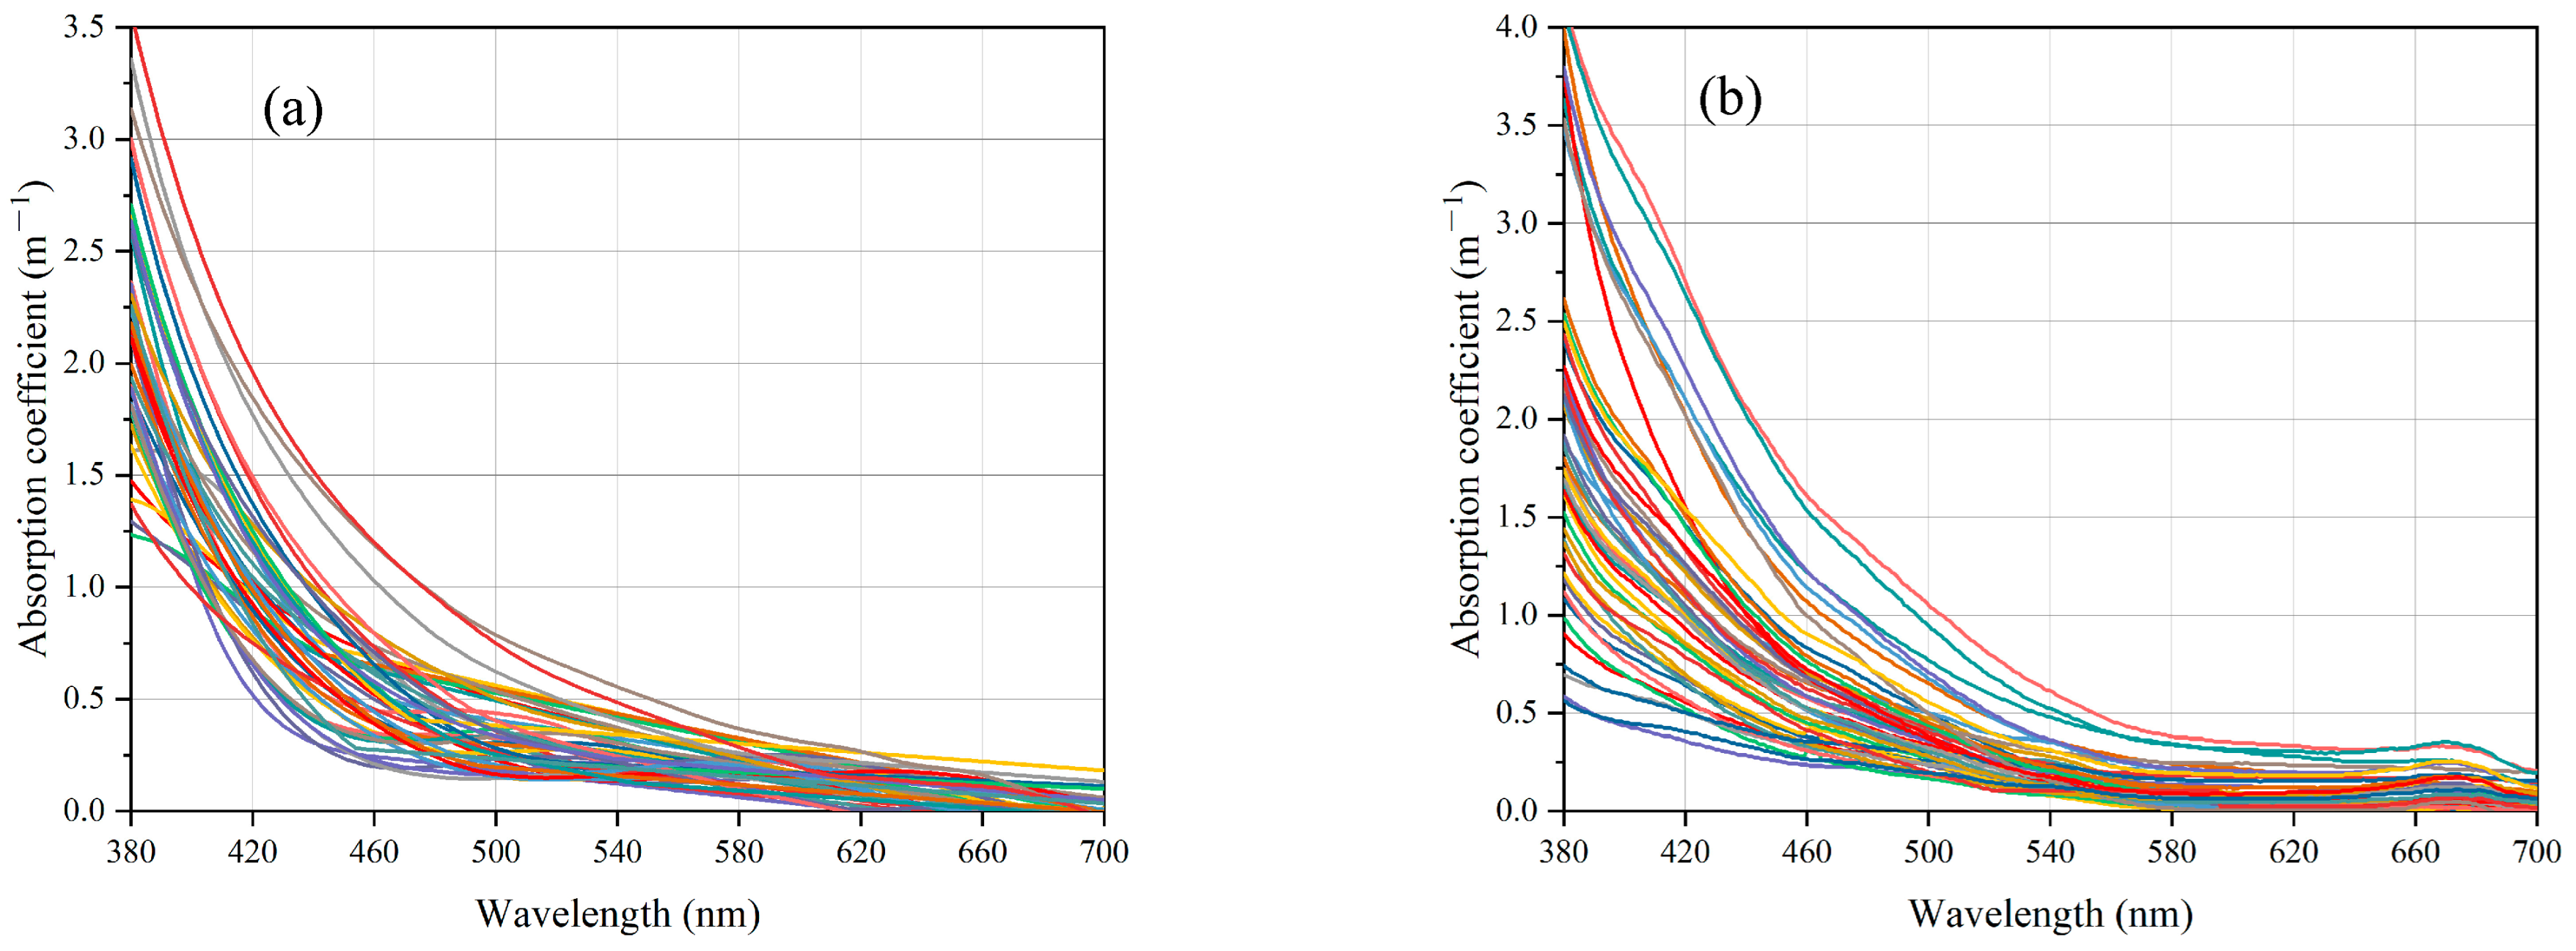
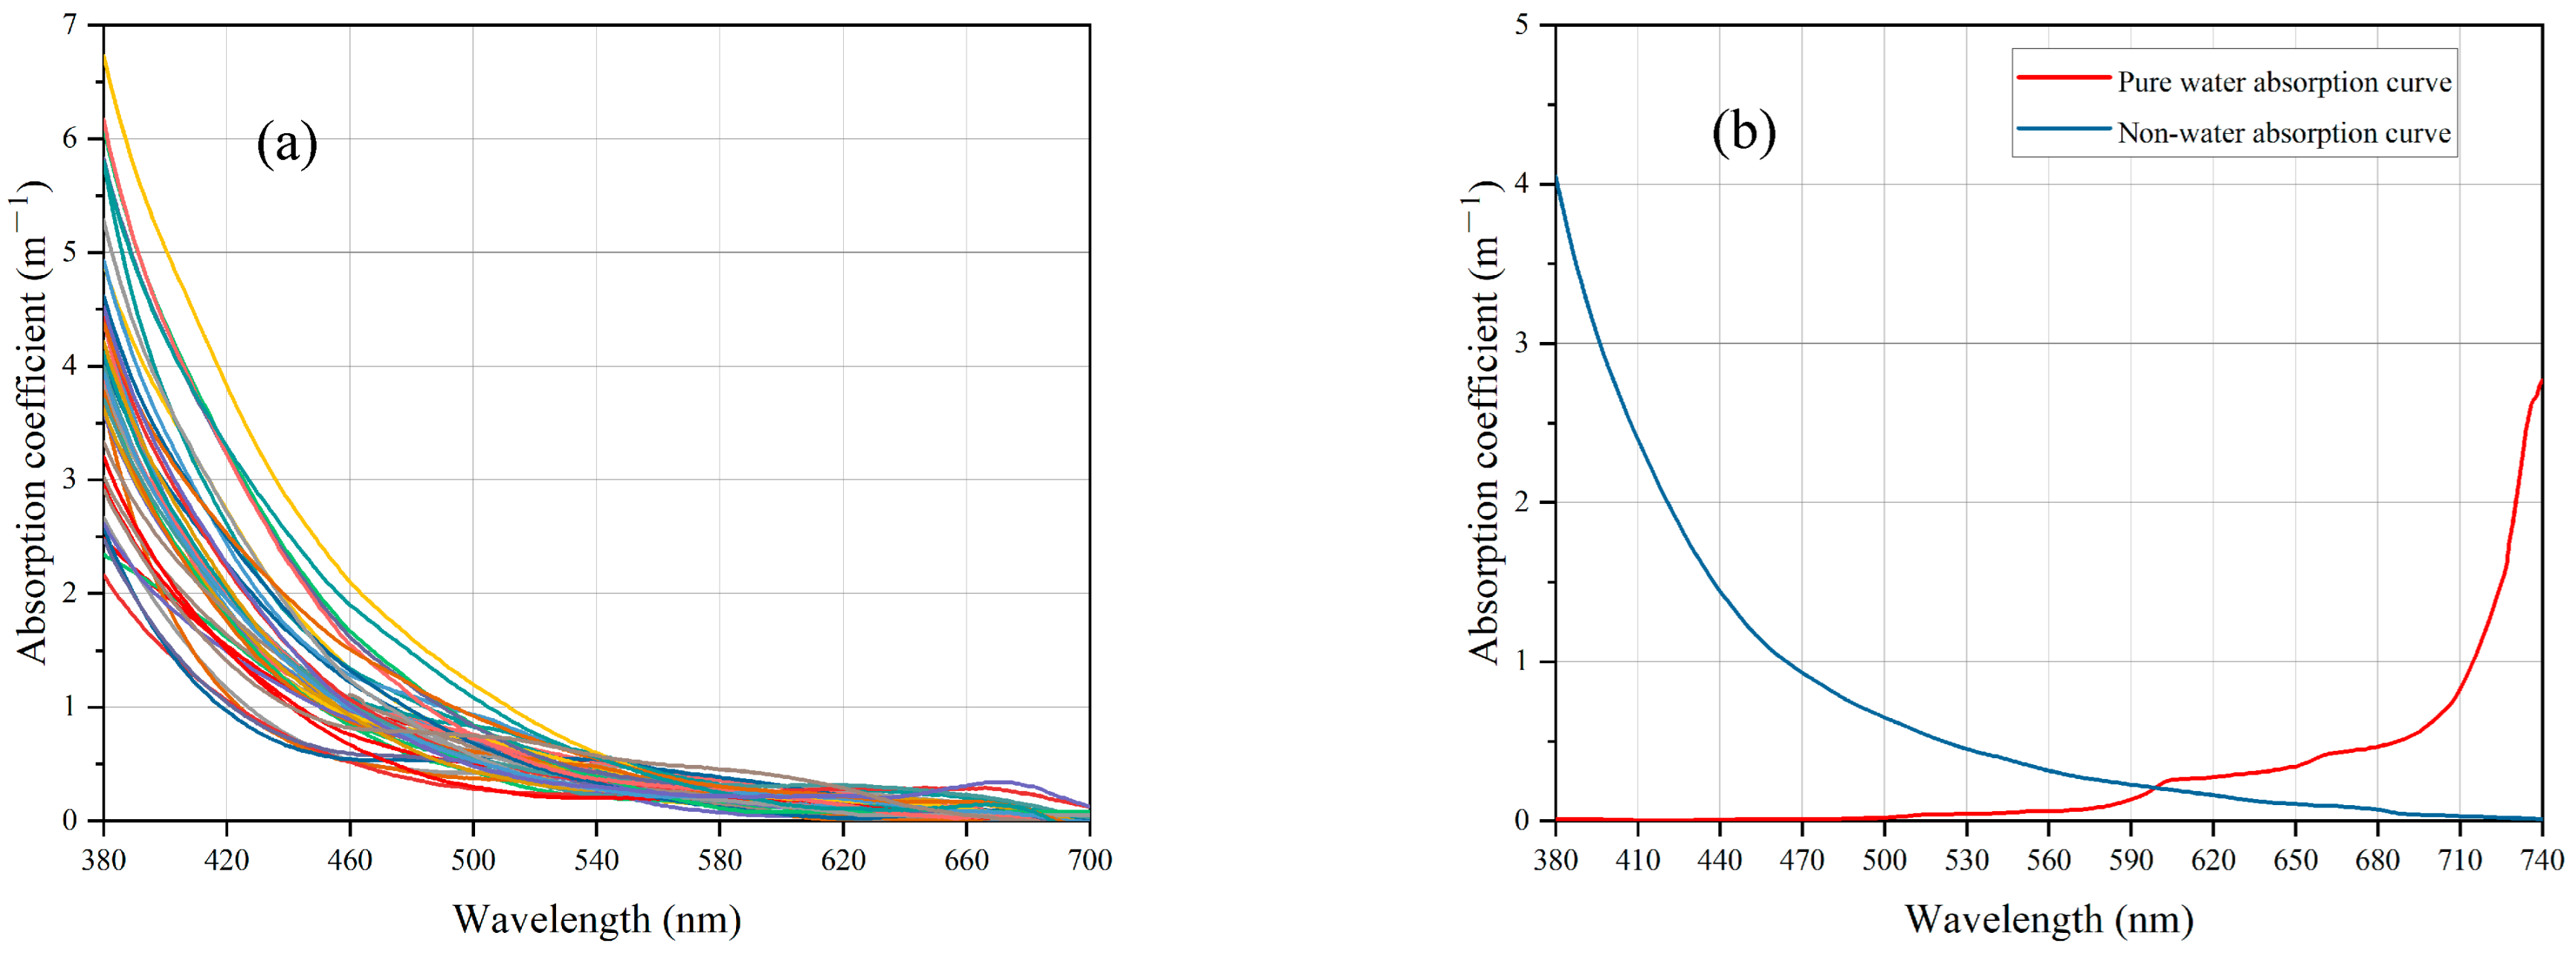
4.1. Analysis of Inherent Optical Characteristics of Lake Ebinur

The spectral curves of SPM, CDOM, and the dewatering absorption coefficient are shown in Figure 3 and Figure 4. Figure 4a depicts that the CDOM absorption coefficients are remarkable similar. The coefficients exhibit an exponential decrease pattern and greater discrepancies in the short-wave region compared to the long-wave region. There is no prominent absorption peak that can be observed. At a wavelength of 380 nm, the CDOM spectral absorption coefficient of Lake Ebinur varies between 1.0 and 3 m−1, gradually approaching 0 towards the 700 nm wavelength. As depicted in Figure 4b, the SPM absorption coefficient curves are largely consistent, exhibiting an exponential decrease trend. The coefficients decrease with increasing wavelength, indicating a diminishing light absorption capability of SPM as the wavelength increases. The SPM absorption coefficient varies between 1.0 and 4.0 m−1 at a wavelength of 380 nm. Similar to CDOM, the SPM absorption coefficient also approaches 0 after 720 nm, showcasing similarity in absorption coefficient variations.
The non-water absorption coefficient, obtained by subtracting the pure water absorption coefficient from the total absorption coefficient, represents the sum of CDOM and SPM absorption coefficients. Consequently, its curve characteristics exhibit similarities with those depicted in Figure 3a,b. Figure 4a illustrates that the measured total non-water of absorption coefficients also exhibits an exponential decay trend, where at around 700 nm, the absorption coefficient approaches 0. Additionally, it approximately demonstrates the characteristic of greater disparity in short-wave absorption coefficients compared to long-wave coefficients. The deionized water absorption coefficient shows a range of variation between 2.4 and 6.5 m−1 at the wavelength of 380 nm. This implies that at a wavelength of 700 nm, the total absorption coefficient of Lake Ebinur’s aquatic body is approximately equal to that of pure water, given the extremely low chlorophyll content in Lake Ebinur.
The selection of a reference wavelength (λ0) is an important step in the computation of the QAA algorithm. The inversion effect of the whole absorption coefficient is directly impacted by the estimation accuracy of the absorption coefficient at λ0. When λ is selected, the condition that the absorption coefficient or characteristic of pure water dominates at this wavelength should be met [26] (Lee et al., 2002). To invert the absorption coefficient of Lake Ebinur using remote sensing images, the appropriate band must be chosen as the reference wavelength according to the band setting of the sensor. Hence, the current study primarily focused on assessing the influence of two water color parameters, namely SPM and CDOM, on the absorption coefficient of the water body. As depicted in Figure 4b, the absorption coefficient of pure water surpasses that of non-water beyond 590 nm. The measured average value of the non-water absorption coefficient tends to approach zero after 700 nm. Based on the aforementioned analysis, it is advisable to opt for a wavelength where the dominance of the pure water absorption coefficient is evident when selecting the characteristic wavelength (λ0) for Lake Ebinur. For Sentinel-2 data, 833 nm (B7 band center wavelength) was selected as the reference wavelength to calculate the total absorption coefficient and back-scattering coefficient according to the measured absorption spectral characteristics, the relative error distribution of atmospheric correction in each band, and the sensor band setting.

4.2. Validation of CDOM Inversion Models

The accuracy of the QAA inversion model is illustrated in Figure 5. The QAA-CDOM inversion model’s coefficient of determination (r2) is 0.72, and the root mean square error (RMSE) is 0.13 m−1, as shown in Figure 5. The validation points are predominantly concentrated within the 30% error boundary, with only a small number of validation points falling outside this range. Overall, the model exhibits inversion accuracy. This study selected the measured data from 19 May 2021 as an independent sample to validate the accuracy of the QAA-CDOM model. The validation results showed an r-squared value of 0.51 and an RMSE of 0.12 m−1. Previous research demonstrated that, unlike empirical models such as machine learning, the semi-analytical model, like QAA-CDOM, incorporates a significant amount of fundamental theory in its calculation process, making it more versatile. Accordingly, the QAA-CDOM model can be used for long-term CDOM concentration retrieval in Lake Ebinur.

4.3. Estimation Model for DOC and Accuracy Verification

This study employed regression models such as linear, quadratic, exponential, and logarithmic functions to construct an estimation model for DOC based on the measured CDOM and DOC concentrations. The correlation values of the linear and quadratic regression models were better than the logarithmic and exponential regression models, as depicted in Figure 6. Additionally, the linear model slightly surpassed the quadratic model in terms of goodness of fit. Consequently, this study opted for the linear regression approach, which was used to construct the estimation model for DOC. Prior research has demonstrated a linear relationship between lake CDOM and DOC concentrations, and the results of this study further substantiate this viewpoint. Overall, the evaluation results of the model were good, indicating that the linear regression model could be used to estimate the DOC concentration. Therefore, this study estimated the temporal and spatial variation characteristics of DOC in Lake Ebinur based on the linear regression model, with the expression Y = 59.1x.

4.4. Spatial Variability Characteristics of DOC

In Figure 7, the monthly distribution of DOC in Lake Ebinur during the non-iced periods (May to October) from 2018 to 2022 is presented. In 2018, the DOC concentrations are primarily situated between 30 and 90 mg/L. In particular, the DOC concentration is notably elevated in June, with the central region of the main lake area and the smaller lake areas exhibiting DOC concentrations exceeding 150 mg/L. In 2019, there is a noticeably higher DOC concentration in June, exceeding 150 mg/L in both the smaller lake areas and the northwestern part of the main lake area, compared to other months. In October, the southern region of the smaller lake areas in Lake Ebinur exhibits DOC concentrations that surpass 150 mg/L. In 2020, the DOC concentrations are notably higher compared to the same period in 2019. Specifically, the DOC concentrations in May, August, and September of 2020 are significantly higher than those in June, July, and October. Furthermore, in both June and September, there is an elevated DOC concentration in the northern part of the main lake area, surpassing 150 mg/L. In 2021, both June and July exhibit elevated DOC concentrations. In June, a large portion of Lake Ebinur experiences DOC concentrations exceeding 60 mg/L. During July, the northern region of the main lake area records DOC concentrations surpassing 90 mg/L. In 2022, the lake area experiences a significant reduction. During June and July, Lake Ebinur’s DOC concentrations are relatively high. Notably, in June, the coastal regions of Lake Ebinur display DOC concentrations exceeding 150 mg/L.
In summary, from 2018 to 2022, there was a progressive reduction in the lake area, while the DOC concentrations consistently increased over time. In each year, the months of June and July exhibited generally higher DOC concentrations compared to the other months of the same year. In recent years, Lake Ebinur has experienced a gradual decrease in water volume, with the lake essentially drying up in August and September 2022. Consequently, it was impossible to retrieve the lake’s DOC concentrations for these months.
Figure 8 shows that the annual average DOC concentrations in Lake Ebinur increased from 2018 to 2021. Considering the significant reduction in lake surface area in 2022, the DOC concentration in that year is not included. In 2018 and 2019, the DOC concentrations were relatively low, ranging between 0 and 60 mg/L. However, in 2020 and 2021, the DOC concentrations were notably higher compared to 2018 and 2019, with concentrations predominantly falling within the range of 30 to 90 mg/L. Over the years 2018 to 2021, there were relatively few areas with DOC concentrations exceeding 9 mg/L, and most of the lake areas exhibited DOC concentrations ranging from 0 to 90 mg/L.
Figure 9 presents the spatial–temporal variation characteristics of the monthly mean DOC of Lake Ebinur during 2018–2021. When exploring the spatial distribution characteristics of DOC concentrations from June to October, it can be observed that the months of June, July, and September generally have higher DOC concentrations compared to the other months. The DOC concentrations typically range between 30 and 120 mg/L during these months. Conversely, during May, August, and October, the DOC concentrations fall within the range of 0 to 60 mg/L. In May, the southeastern part of the main lake area exhibits lower DOC concentrations (less than 30 mg/L), while the northwestern part of the main lake area has higher concentrations (greater than 60 mg/L). In June, the DOC concentrations are notably higher compared to May, with most of the main lake area showing DOC concentrations within the range of 60 to 90 mg/L. During July, the central part of the main lake area experiences lower DOC concentrations (below 60 mg/L). The spatial variability of DOC concentrations in August is relatively small, with concentrations ranging from 0 to 60 mg/L. In September, the lake area undergoes significant shrinkage, and the western region of the lake registers higher DOC concentrations compared to the eastern region. In October, the DOC concentrations are generally lower, with concentrations ranging between 0 and 60 mg/L.

4.5. Temporal Variation Characteristics of DOC

In order to study the monthly mean change trend of DOC in Lake Ebinur from 2018 to 2022, the mean and standard deviation of DOC for 4 years (24 months) were calculated. As shown in Figure 10a, the change in the average DOC concentration presents an obvious fluctuating trend, with an overall upward trend over time. In September 2020, the lake had the highest average DOC concentration at more than 130 mg/L. In contrast, the average DOC concentration was lowest in May 2018, indicating that DOC levels were generally low in Lake Ebinur during that period. The standard deviation of DOC concentration changes in Lake Ebinur in different months ranged from 15 to 60 mg/L, with the lowest standard deviation in July 2018 and the highest in October 2020. In Figure 10b, the boxplot illustrates the monthly average values of DOC. The month with the highest average DOC concentration is June (80 mg/L). The relatively consistent DOC concentrations in Lake Ebinur during June of each year suggest a general trend of higher DOC concentrations during this particular month. The month with the lowest average DOC concentration is May (48 mg/L). Of these months, September exhibits the greatest inter-annual variation in DOC concentration. Notably, in September 2020, the DOC concentration reaches a high of 130 mg/L. Conversely, the inter-annual variation in DOC concentration for June is relatively small, with DOC concentrations generally maintaining a higher level. The average DOC concentration for July is similar to that of September, with a comparable inter-annual variation range, while the variation in DOC concentration for August is similar to that of September.
As shown in Figure 1c, this study divided the main lake area of Lake Ebinur into four regions according to parallel and vertical wind directions, based on statistics of the average wind direction of Lake Ebinur during the 2018–2022 period. Five sampling points were randomly selected in different regions. As shown in Figure 10c,d, the average values and coefficient of variation for sampling points in different regions were calculated. Figure 10c shows that the DOC concentrations in 2020 and 2021 were generally higher than those in 2018 and 2019 in different regions. From 2018 to 2021, the coefficient of variation in region 4 was the highest, indicating a large difference in the DOC concentration in this region. In contrast, the coefficient of variation in region 1 was the smallest, indicating a small change in DOC concentration in this region. Figure 10d shows the DOC concentrations in four regions in different months. The results show that the DOC concentrations were greatest in June and July in different regions. Region 2 had the largest coefficient of variation from May to October, indicating a large difference in the DOC concentration in this region. Meanwhile, there was slight variance in the DOC concentrations in other regions, with the coefficients of variation closer to each other.

5. Discussion

5.1. Applicability of Data and Models

Considering that the sampling time of in situ measured data is different from that of satellite imagery, the inversion result is uncertain to some extent [27]. To ensure an alignment between the measured data and the satellite images, this study chose sampling times that were within a 30 h window around the passage time of the images. This approach aimed to minimize the temporal discrepancy between the in situ data collection and the satellite image acquisition, enhancing the accuracy of the data. In addition, the performance of different atmospheric correction models also affects the inversion results of water quality parameters to a certain extent [27]. Scholars have proven that the dark pixel method has the best correction effect on the applicability of different atmospheric correction models in Lake Ebinur [14]. Therefore, this study selected the dark pixel method for atmospheric correction of remote sensing images.
This study solely considered a single water quality index (CDOM), used to estimate the DOC concentration. Scholars have proven that DOC is highly correlated with CDOM in saline lakes [16], and considering that Lake Ebinur is a typical saltwater lake, it is of great significance to explore the relationship between DOC and salinity in Lake Ebinur [7]. Previous studies have reported a positive correlation between river DOC and SPM [28,29,30]; hence, future studies should consider further exploring these parameters in lakes. Additionally, more studies should be conducted to explore the relationship between DOC and other water quality indicators, to improve the accuracy of the lake DOC estimation model. When discussing the relationship between CDOM and DOC, some studies have proven that there is a linear relationship between the two, which is consistent with the results of this study [7,16]. The DOC estimation models employed in this study—linear, quadratic, exponential, and logarithmic regression models—are relatively simple methods. It is worth noting that some researchers have utilized a variety of machine learning approaches to construct DOC estimation models [16]. These machine learning techniques can offer more complexity and flexibility in capturing intricate relationships within the data, potentially enhancing the accuracy of DOC estimation [16]. The choice between simple regression models and complex machine learning methods depends on the data availability, research objectives, and desired levels of accuracy and interpretability [3]. Future studies should consider exploring a wider range of methods to estimate DOC in representative lakes within arid regions. This will enable the development of more accurate DOC estimation models, especially suited to lakes in arid areas.
In this study, CDOM and DOC inversion models were constructed using the measured data from the first phase. Although scholars have used such methods to invert lake water quality data [14], there may be a problem of large seasonal differences in lake water quality, resulting in differences in the applicability of inversion models in different seasons. In a follow-up study, the authors will further accumulate measured data to reduce the uncertainty of the estimated results. In this study, DOC concentration was estimated based on lake CDOM concentration; the accuracy of the DOC estimation model could be improved to some extent by improving the accuracy of the CDOM inversion model. However, there are certain challenges involved. For example, the calculation steps of the QAA-CDOM estimation model are massive, meaning that errors can be generated in the calculation process of different parameters and then propagated in the next calculation process [27]. So, it is very important to optimize the model parameters. In addition, the center band of the image provided by Sentinel-2 data does not completely match the center wavelength of the QAA algorithm, which may also affect the accuracy of the CDOM inversion model. The authors will solve this problem in future studies to further improve the accuracy of the CDOM inversion model and thus enhance the applicability of the DOC estimation model.

5.2. Uncertainties in DOC Estimate

As depicted in Figure 11, an estimation model was created by using 70% of the measured DOC data that were randomly selected, and the model’s accuracy was checked using the remaining 30% of the data. The linear regression model has the highest degree of fit during the training stage, with r2 and RMSE values of 0.74 and 7.6 mg/L, respectively. Meanwhile, the r2 and RMSE values of the validation set of data were 0.68 and 7.9 mg/L, respectively. In addition, this study used the measured DOC concentration data from 6 July 2022 to validate the applicability of the model. As shown in Figure 11, the independent validation sample had an r2 value of 0.6 and an RMSE of 11.4 mg/L, indicating that the DOC estimation model is suitable for estimating the DOC concentration in Lake Ebinur.
Coastal waters are important habitats for a variety of animals and play a crucial role in the stability of ecosystems [31]. Coastal water ecosystems are often affected by various human activities, resulting in a diversity of coastal water problems [32]. The complexity of lake boundaries, the presence of bottom reflectance in optically shallow areas, and the abundance of vegetation in nearshore regions pose challenges for optical sensors in monitoring nearshore water bodies [32]. When considering the specific conditions of Lake Ebinur, the reasons for the occurrence of land adjacency effects could include the following: (1) Mixed Pixel Interpretation: During the process of delineating lake boundaries, mixed pixels may arise where individual pixels contain both land and water. This mixing of water and land reflectance leads to higher overall reflectance values, thereby affecting the accuracy of remote sensing derivations. The reflected light from both water and land components can be combined, causing uncertainties in the interpretation of the true water characteristics. (2) Shallow Water Bottom Reflection: In the shallow water areas along the lake, the shallow depth allows light to penetrate through the water to reach the lake bottom. This phenomenon leads to bottom reflection, where the lake’s floor contributes to the overall reflectance. Consequently, the water surface exhibits higher reflectance values than expected, introducing errors in remote sensing results. Therefore, eliminating the influence of mixed pixels and bottom reflectance is crucial to addressing land adjacency effects in Lake Ebinur. In future research, the authors will make strides toward understanding the impact of land adjacency effects on the lake and work toward enhancing the precision of model inversions.
The reasons for the great variation in DOC in Lake Ebinur may hinge upon many factors, including the water quality, water quantity, and human agricultural activities in the upper reaches of the rivers flowing into the lake, as well as the natural climate conditions (temperature, wind speed, precipitation) in the study area [3,33]. Scholars have previously found that the concentrations of DOC in the lakes under study were high from June to September and reached their peak in June, which is similar to the results of this study [16]. However, the concentration of monthly DOC in this study was low, though similar to the results of a previous investigation [7]. That study showed that the low DOC concentration in Lake Ebinur in May might have resulted from the large amount of glacial meltwater entering the lake in spring, resulting in a low DOC concentration in the lake. Then, we found in this study that the lake water volume gradually decreased from June to August, which may have caused the decrease in DOC concentration month by month in the water body, along with the rising temperature, and the subsequent decrease in DOC concentration in September.

5.3. Applications and Limitations of this Study

The “2030 Agenda for Sustainable Development” introduced 17 global goals, among which goal 6 is to “Ensure availability and sustainable management of water and sanitation for all” [34]. As a result, water quality safety has emerged as a worldwide concern, impacting future generations’ ability to sustain economic and social development. Investigating the changes in DOC in lakes contributes to improving our understanding of lake ecosystems and their eutrophication status, and it serves as a reference for the cycling of dissolved organic matter within lake ecosystems [35,36].
This study utilized single-source Sentinel-2 remote sensing imagery. However, future research could consider incorporating multiple data sources through spatio-temporal fusion techniques to invert long-term DOC concentration data for Lake Ebinur. This approach will provide us with a comprehensive understanding of prolonged variations in DOC concentration. In the context of the QAA semi-analytical model, differences in band settings and central wavelengths among different data sources can lead to increased uncertainty in the derived results [1]. In follow-up research, the band matching problem should be improved to further raise the inversion accuracy of the model. In addition, in this study, a remote sensing image and a phase of measured data were used to build a DOC estimation model [37]. Considering the seasonal differences in DOC concentration in Lake Ebinur, we will accumulate measured data in different seasons in subsequent studies and build a DOC estimation model using multi-source remote sensing data to explore the variation characteristics of DOC in different seasons in Lake Ebinur. Nonetheless, this study may provide a reference for subsequent inversions of the water color parameters of the arid saltwater lake and also lay a solid foundation for the in-depth exploration of the change law of the water color parameters of Lake Ebinur.

6. Conclusions

First and foremost, this study launched an in-depth exploration of the inherent optical characteristics of Lake Ebinur, thereby establishing reference wavelengths specific to Lake Ebinur. Subsequently, an assessment was conducted to evaluate the precision of various CDOM inversion models, leading to the identification of a suitable CDOM inversion model tailored to Lake Ebinur. Lastly, an investigation was conducted into the correlation between CDOM and DOC in Lake Ebinur. Additionally, by leveraging CDOM estimations, the temporal variations in DOC within the period of 2018–2022 were characterized for Lake Ebinur. The outcomes of this study provide a robust foundation for forthcoming endeavors in the field of inverting aquatic optical properties and exploring the carbon cycling processes within Lake Ebinur. The key contributions here are summarized as follows.
(1)
By measuring the absorption coefficients of Lake Ebinur’s water body, the intrinsic optical characteristics of Lake Ebinur were investigated. Through this examination, it was observed that the absorption coefficients of SPM and CDOM approach zero at around 700 nm, where the dominance of pure water absorption coefficients in the total absorption of water becomes evident. In conjunction with the band configuration of Sentinel-2 remote sensing imagery, the wavelength of 833 nm was selected as the reference wavelength for Lake Ebinur.
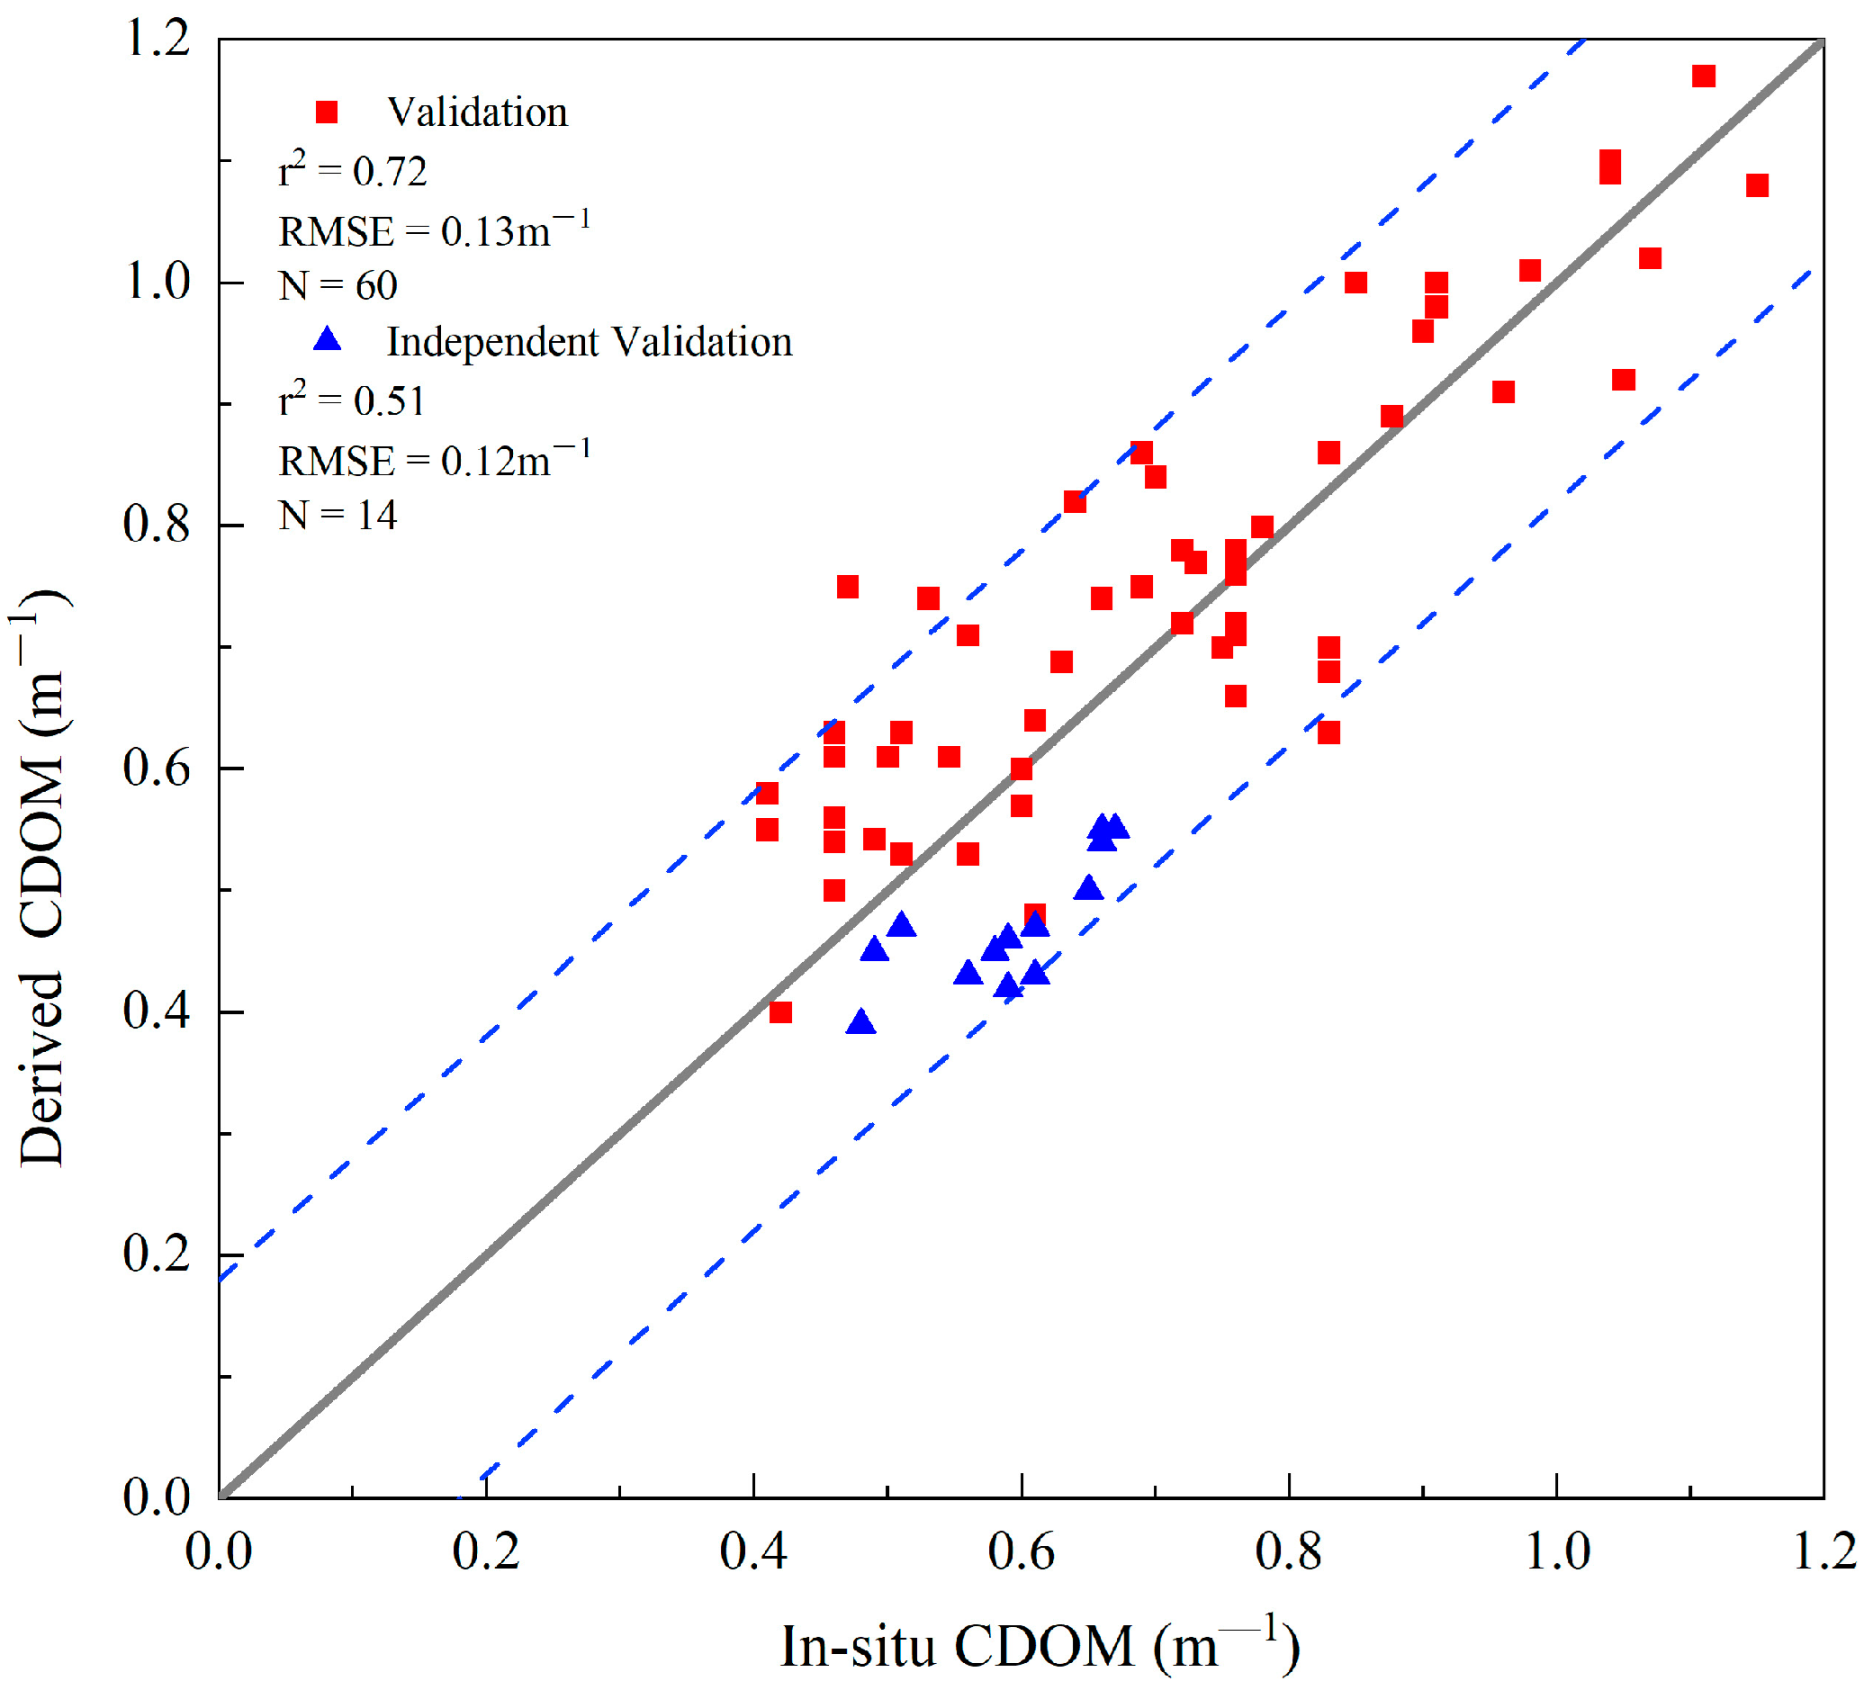
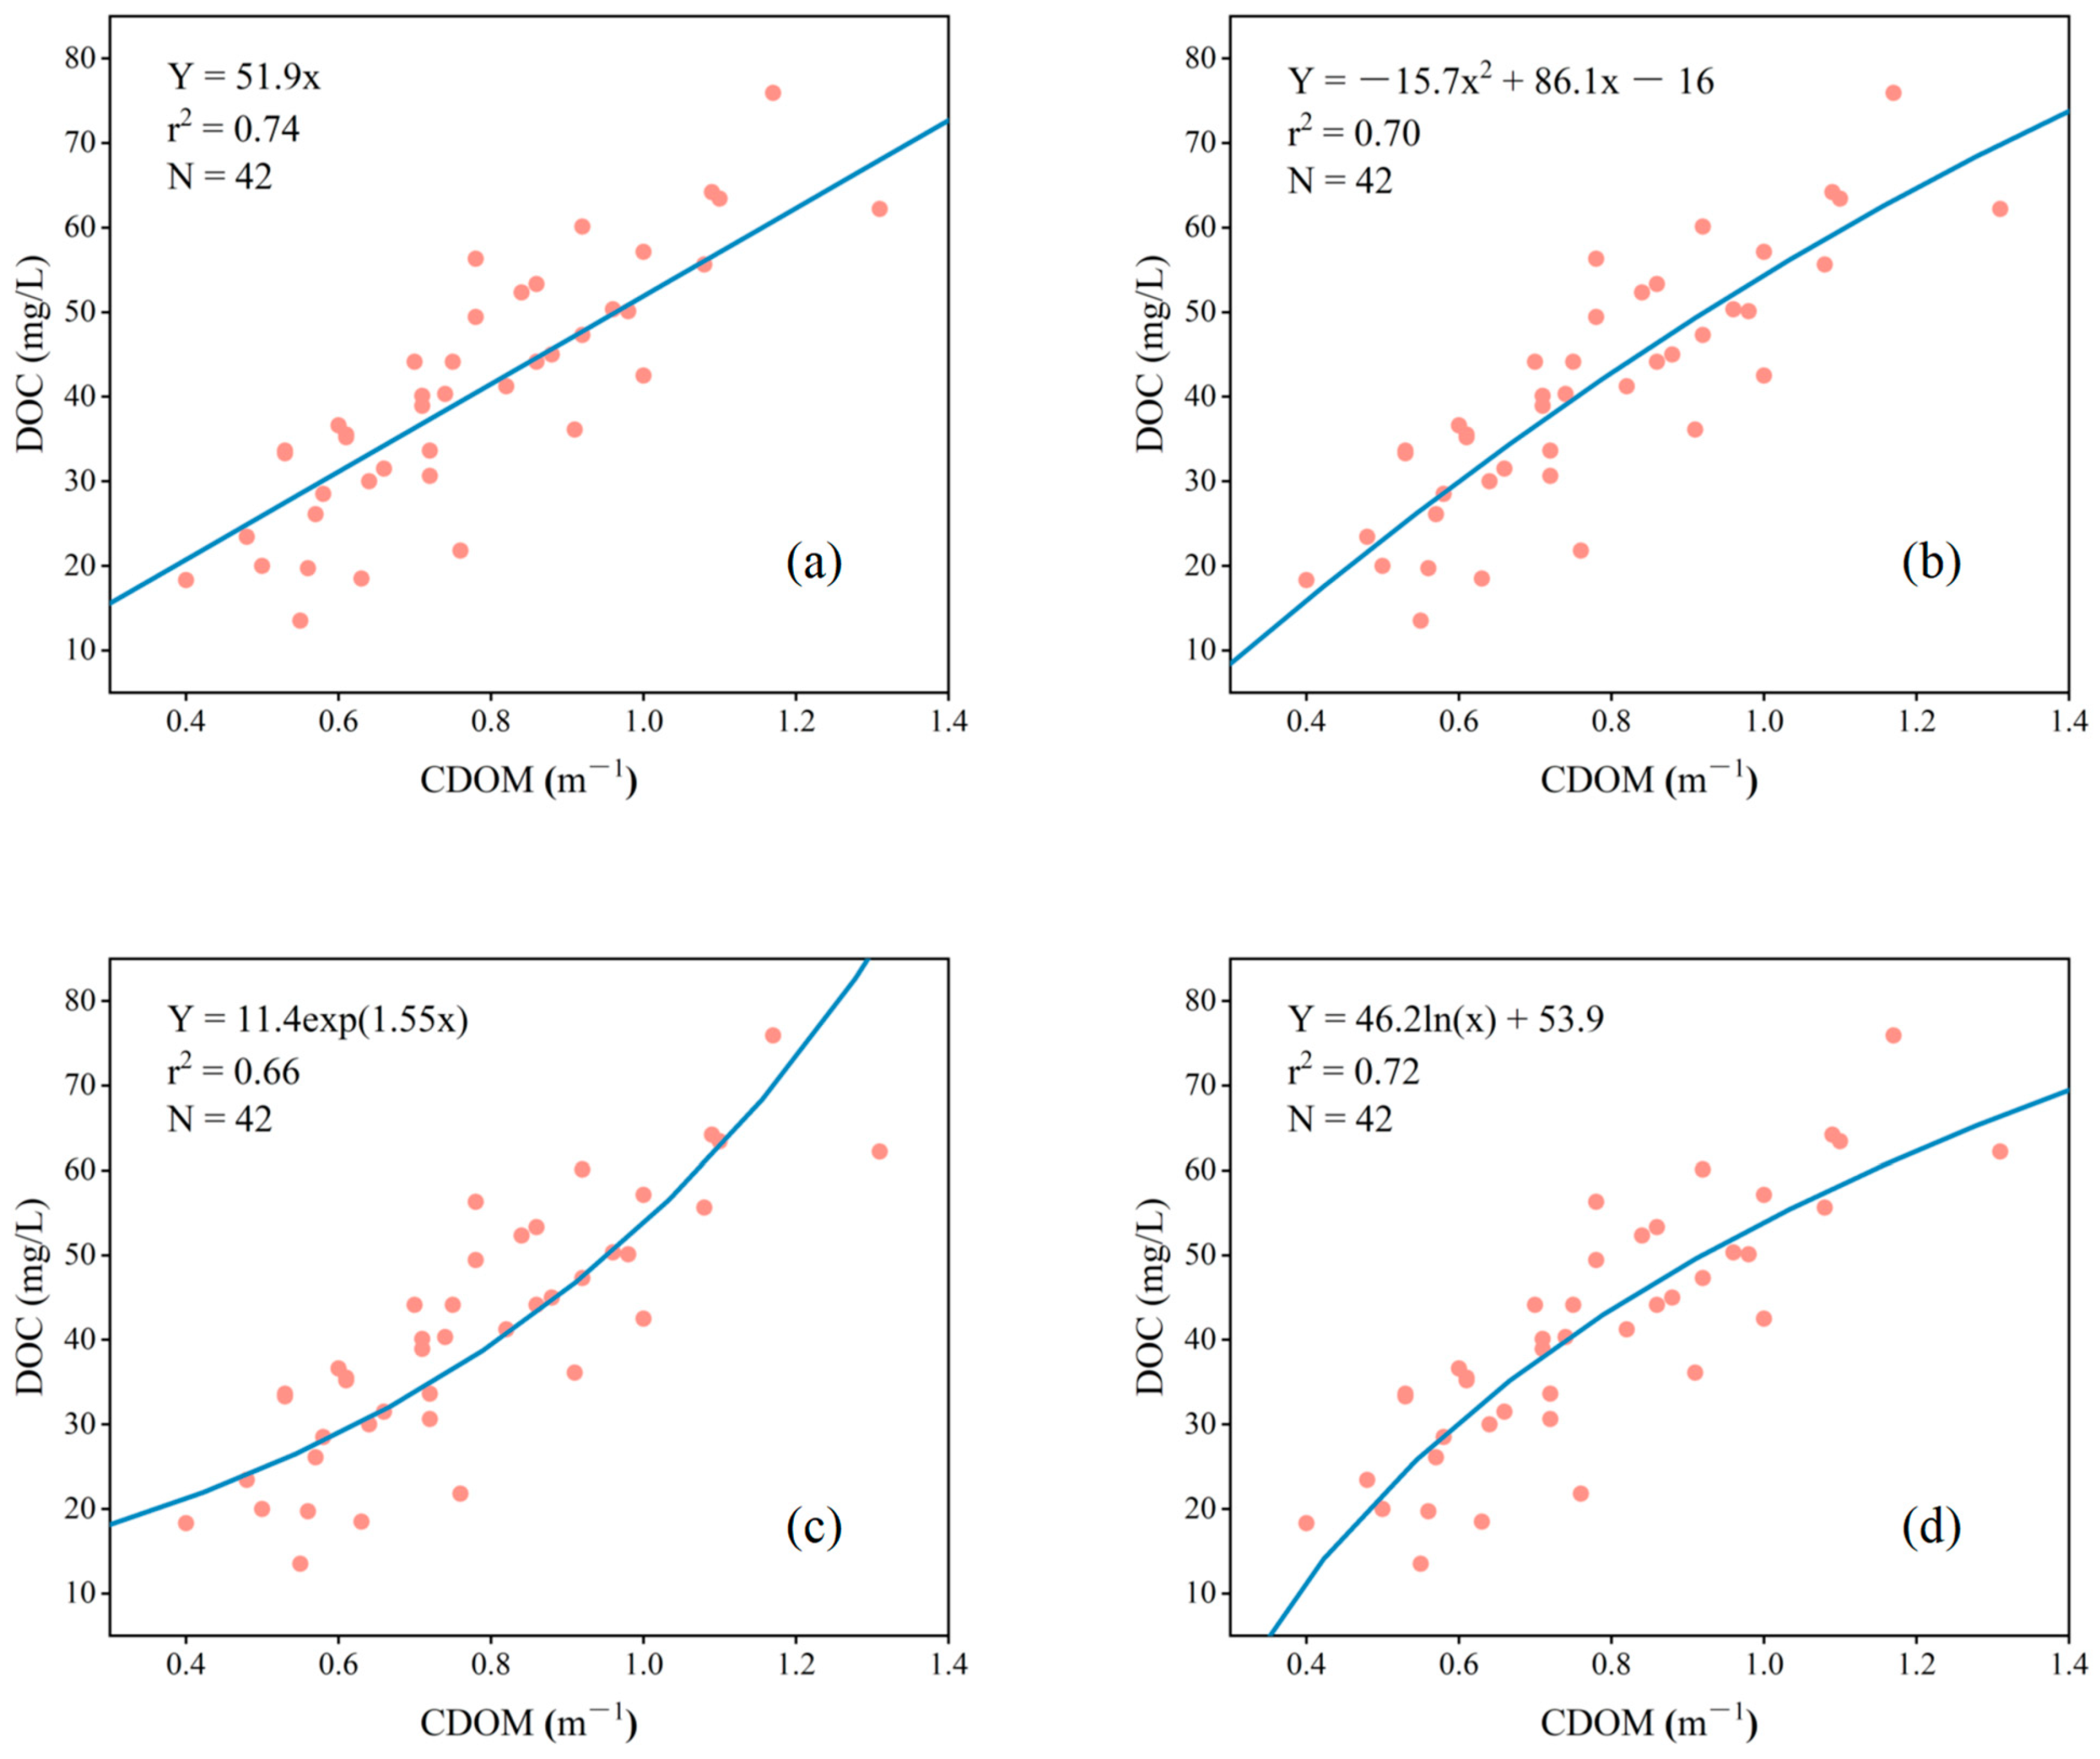
(2)
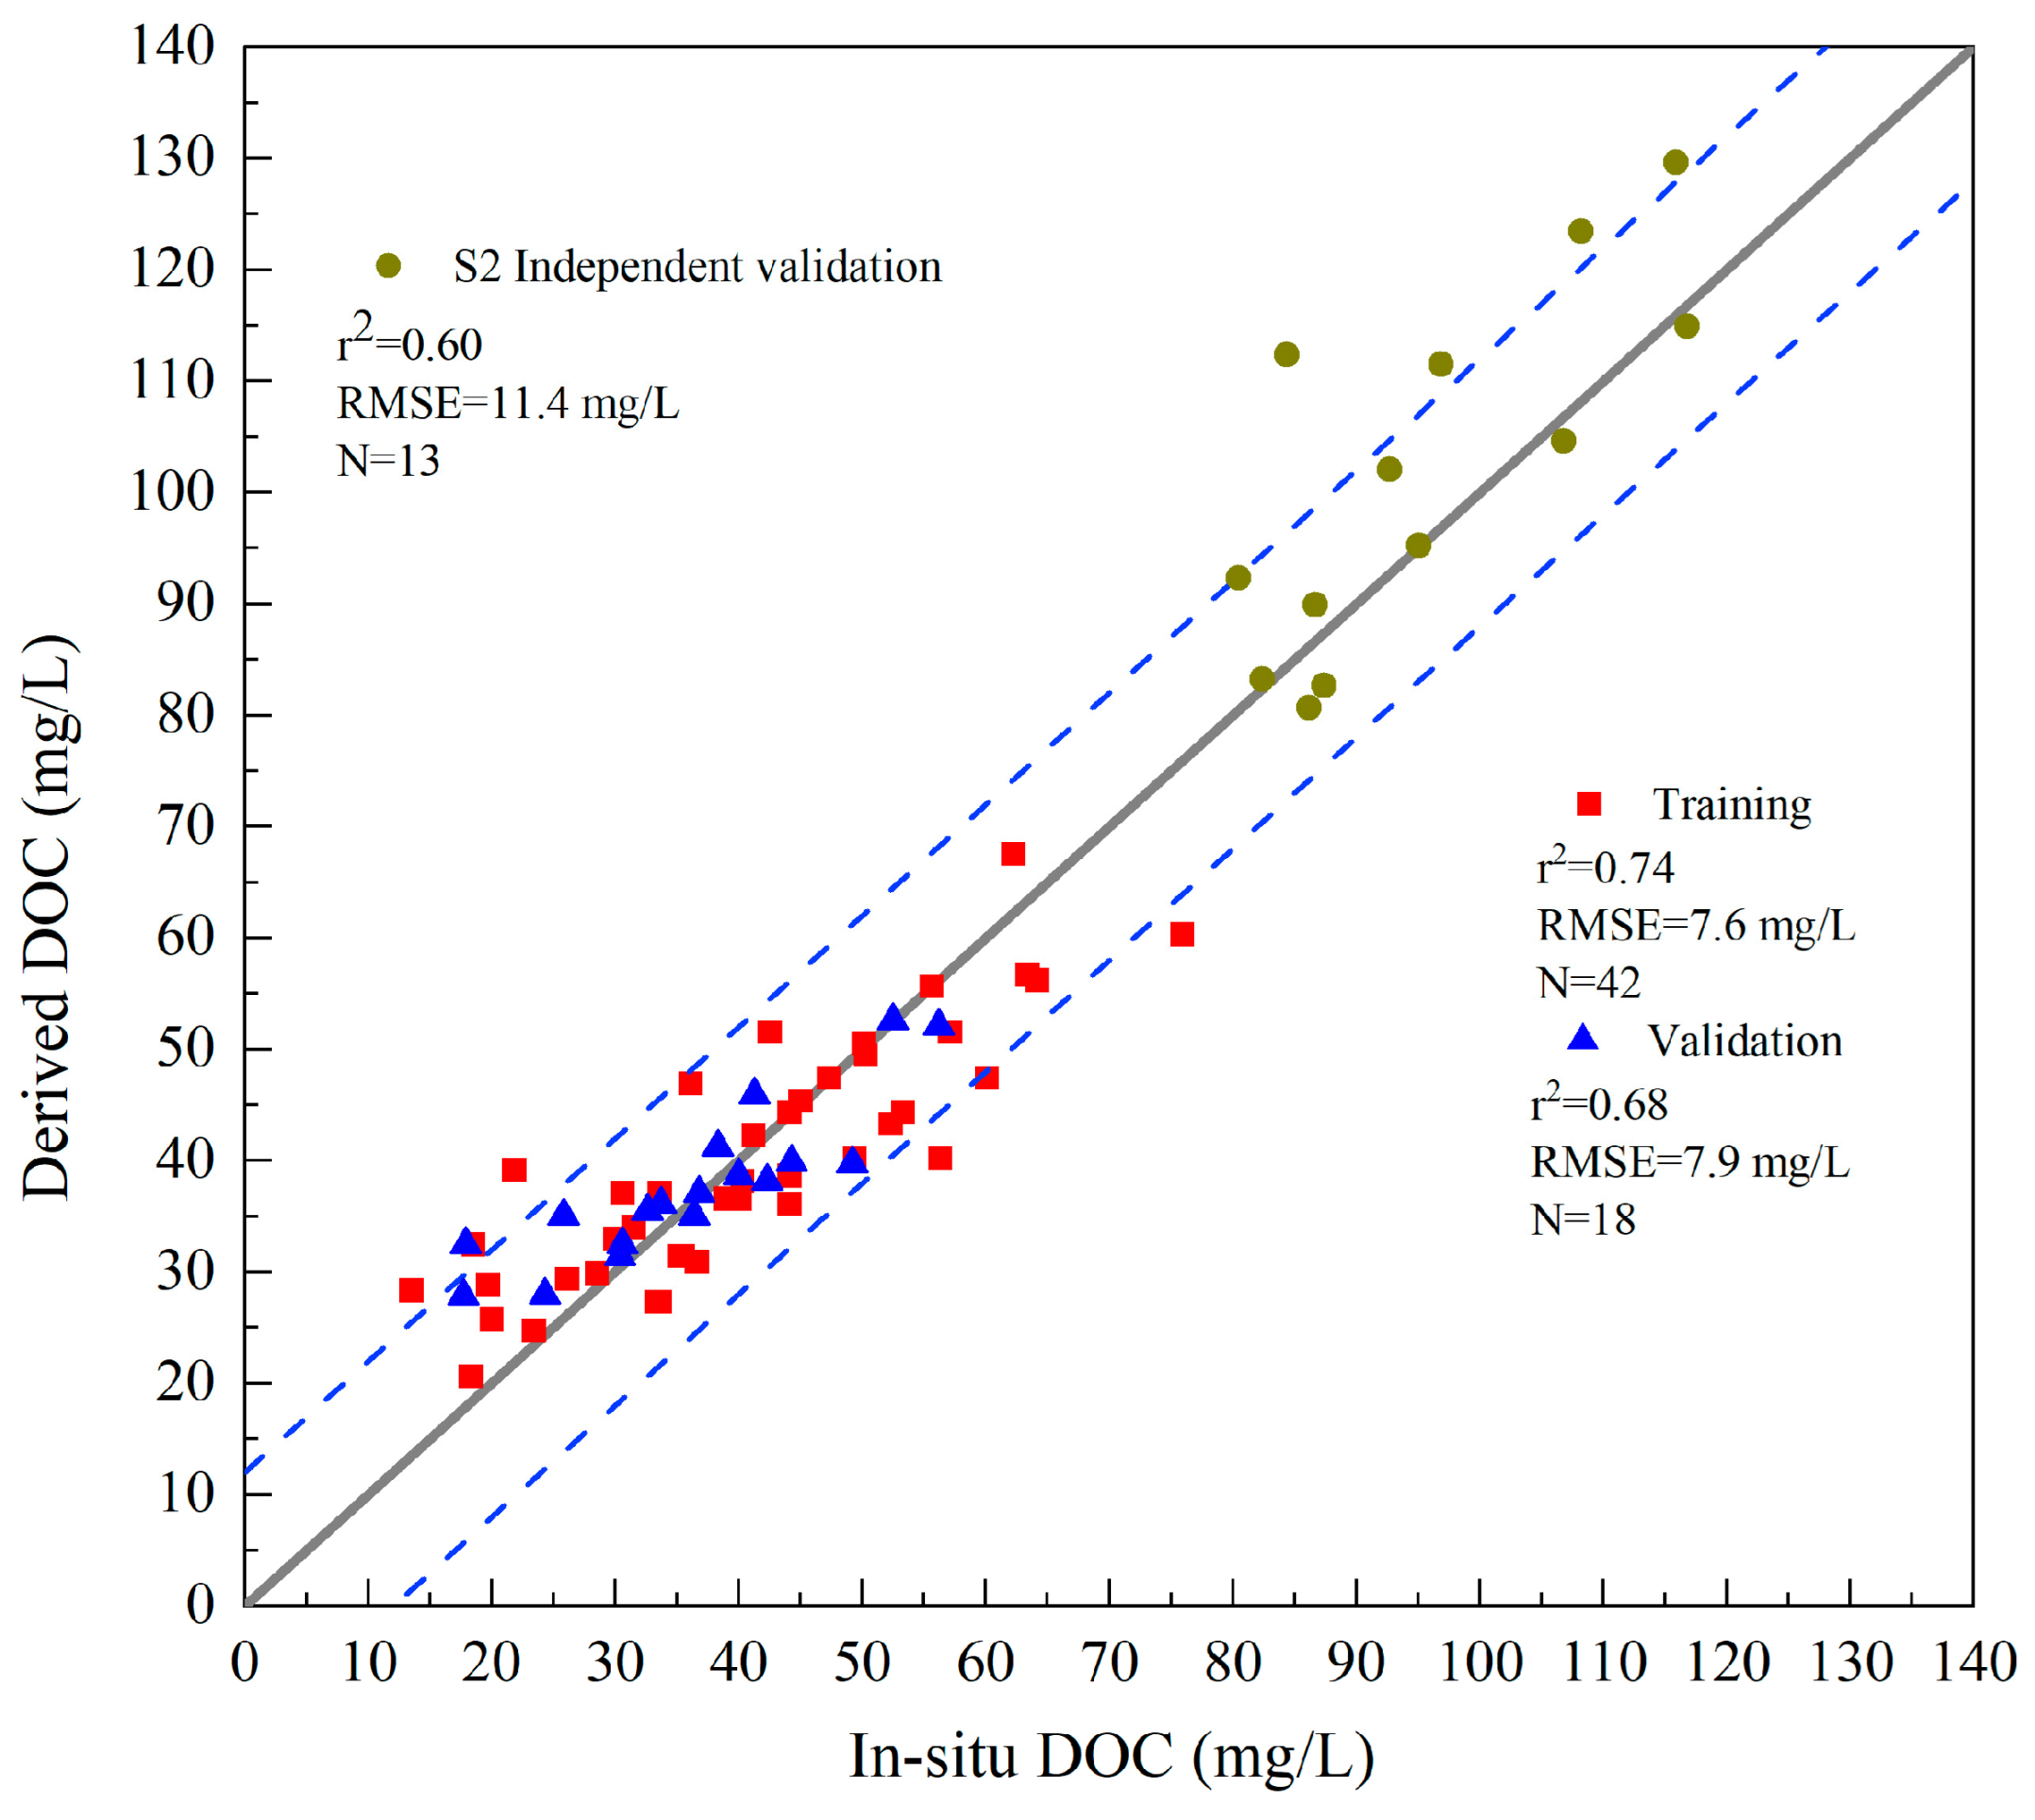
In this study, observation data during 2021 and 2023 were used to verify the applicability of the QAA-CDOM model in Lake Ebinur, in which the validation set r2 value was 0.72 and the RMSE value was 0.13 m−1. Meanwhile, the independent verification sample r2 value was 0.51 and the RMSE value was 0.12 m−1. The above verification results show that the QAA-CDOM model is suitable for the inversion of the CDOM concentration in a long Lake Ebinur time series. In comparison with multiple DOC estimation models, the linear regression model demonstrated the most favorable performance, yielding an r2 value of 0.72. The measured data in 2022 were used as independent verification samples, and the verification results (r2 = 0.6 and RMSE = 11.4 mg/L) showed that the DOC estimation model could be used to estimate the long-term DOC concentration in Lake Ebinur.
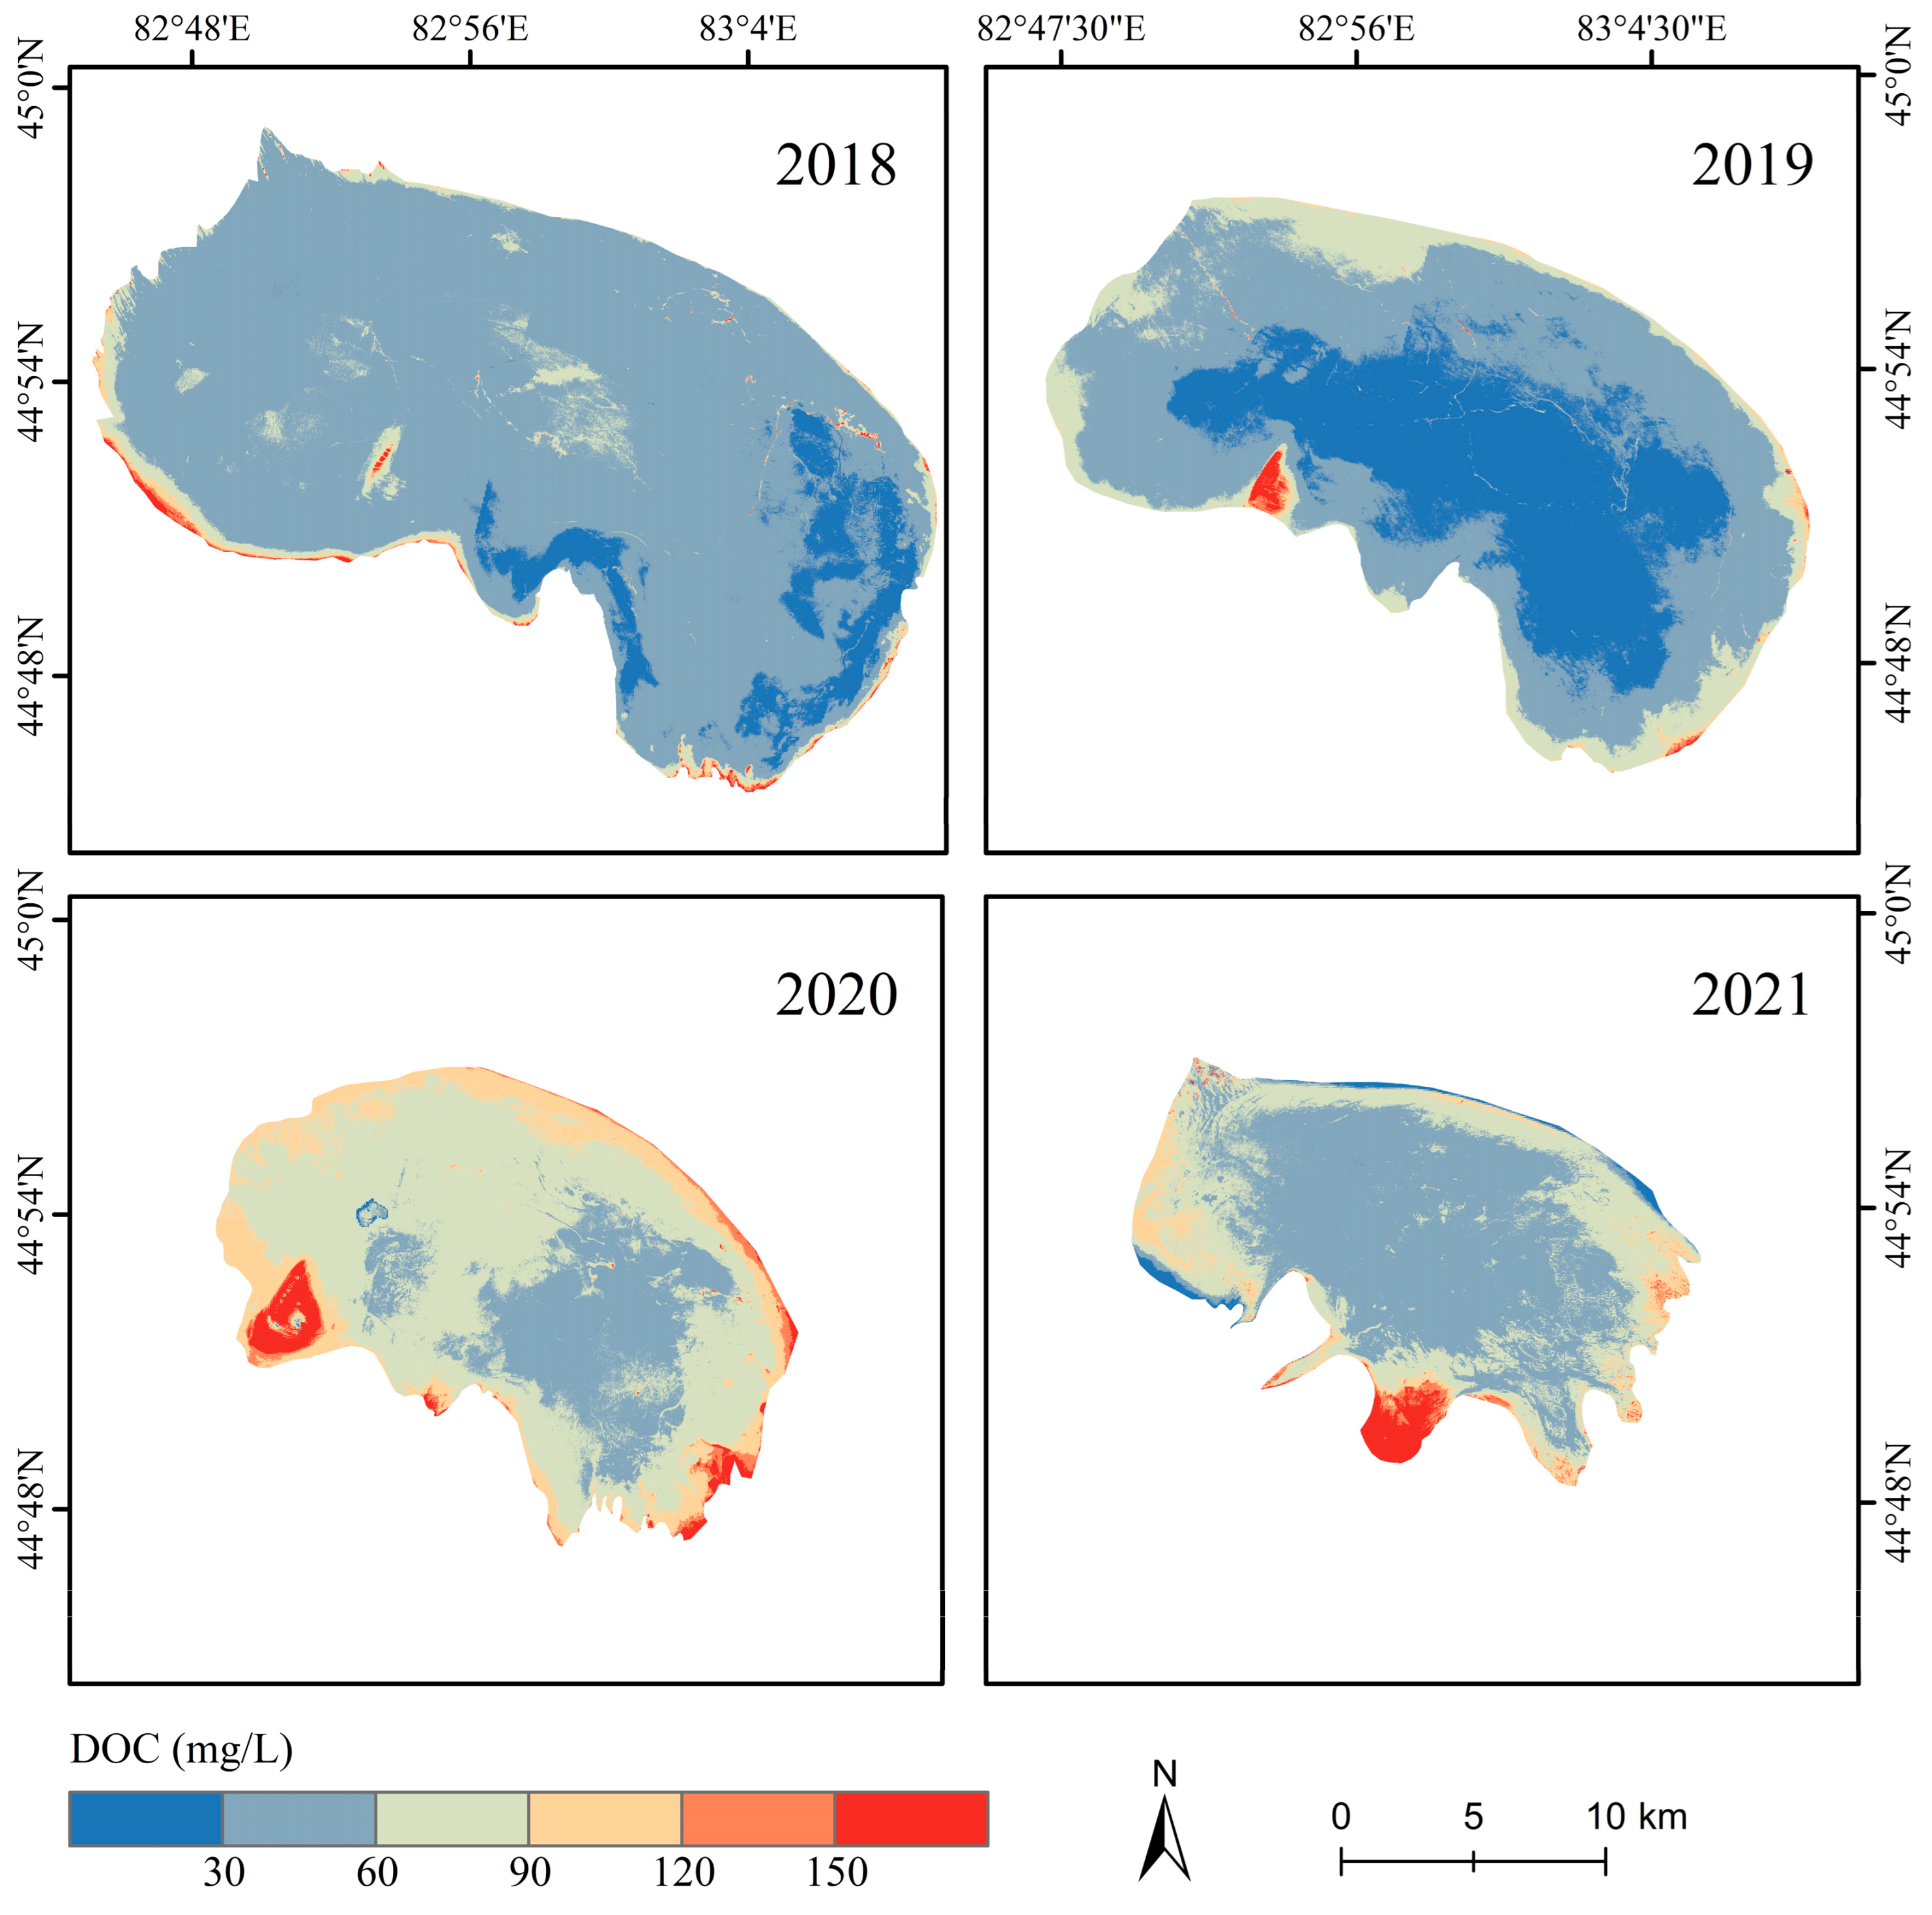
(3)
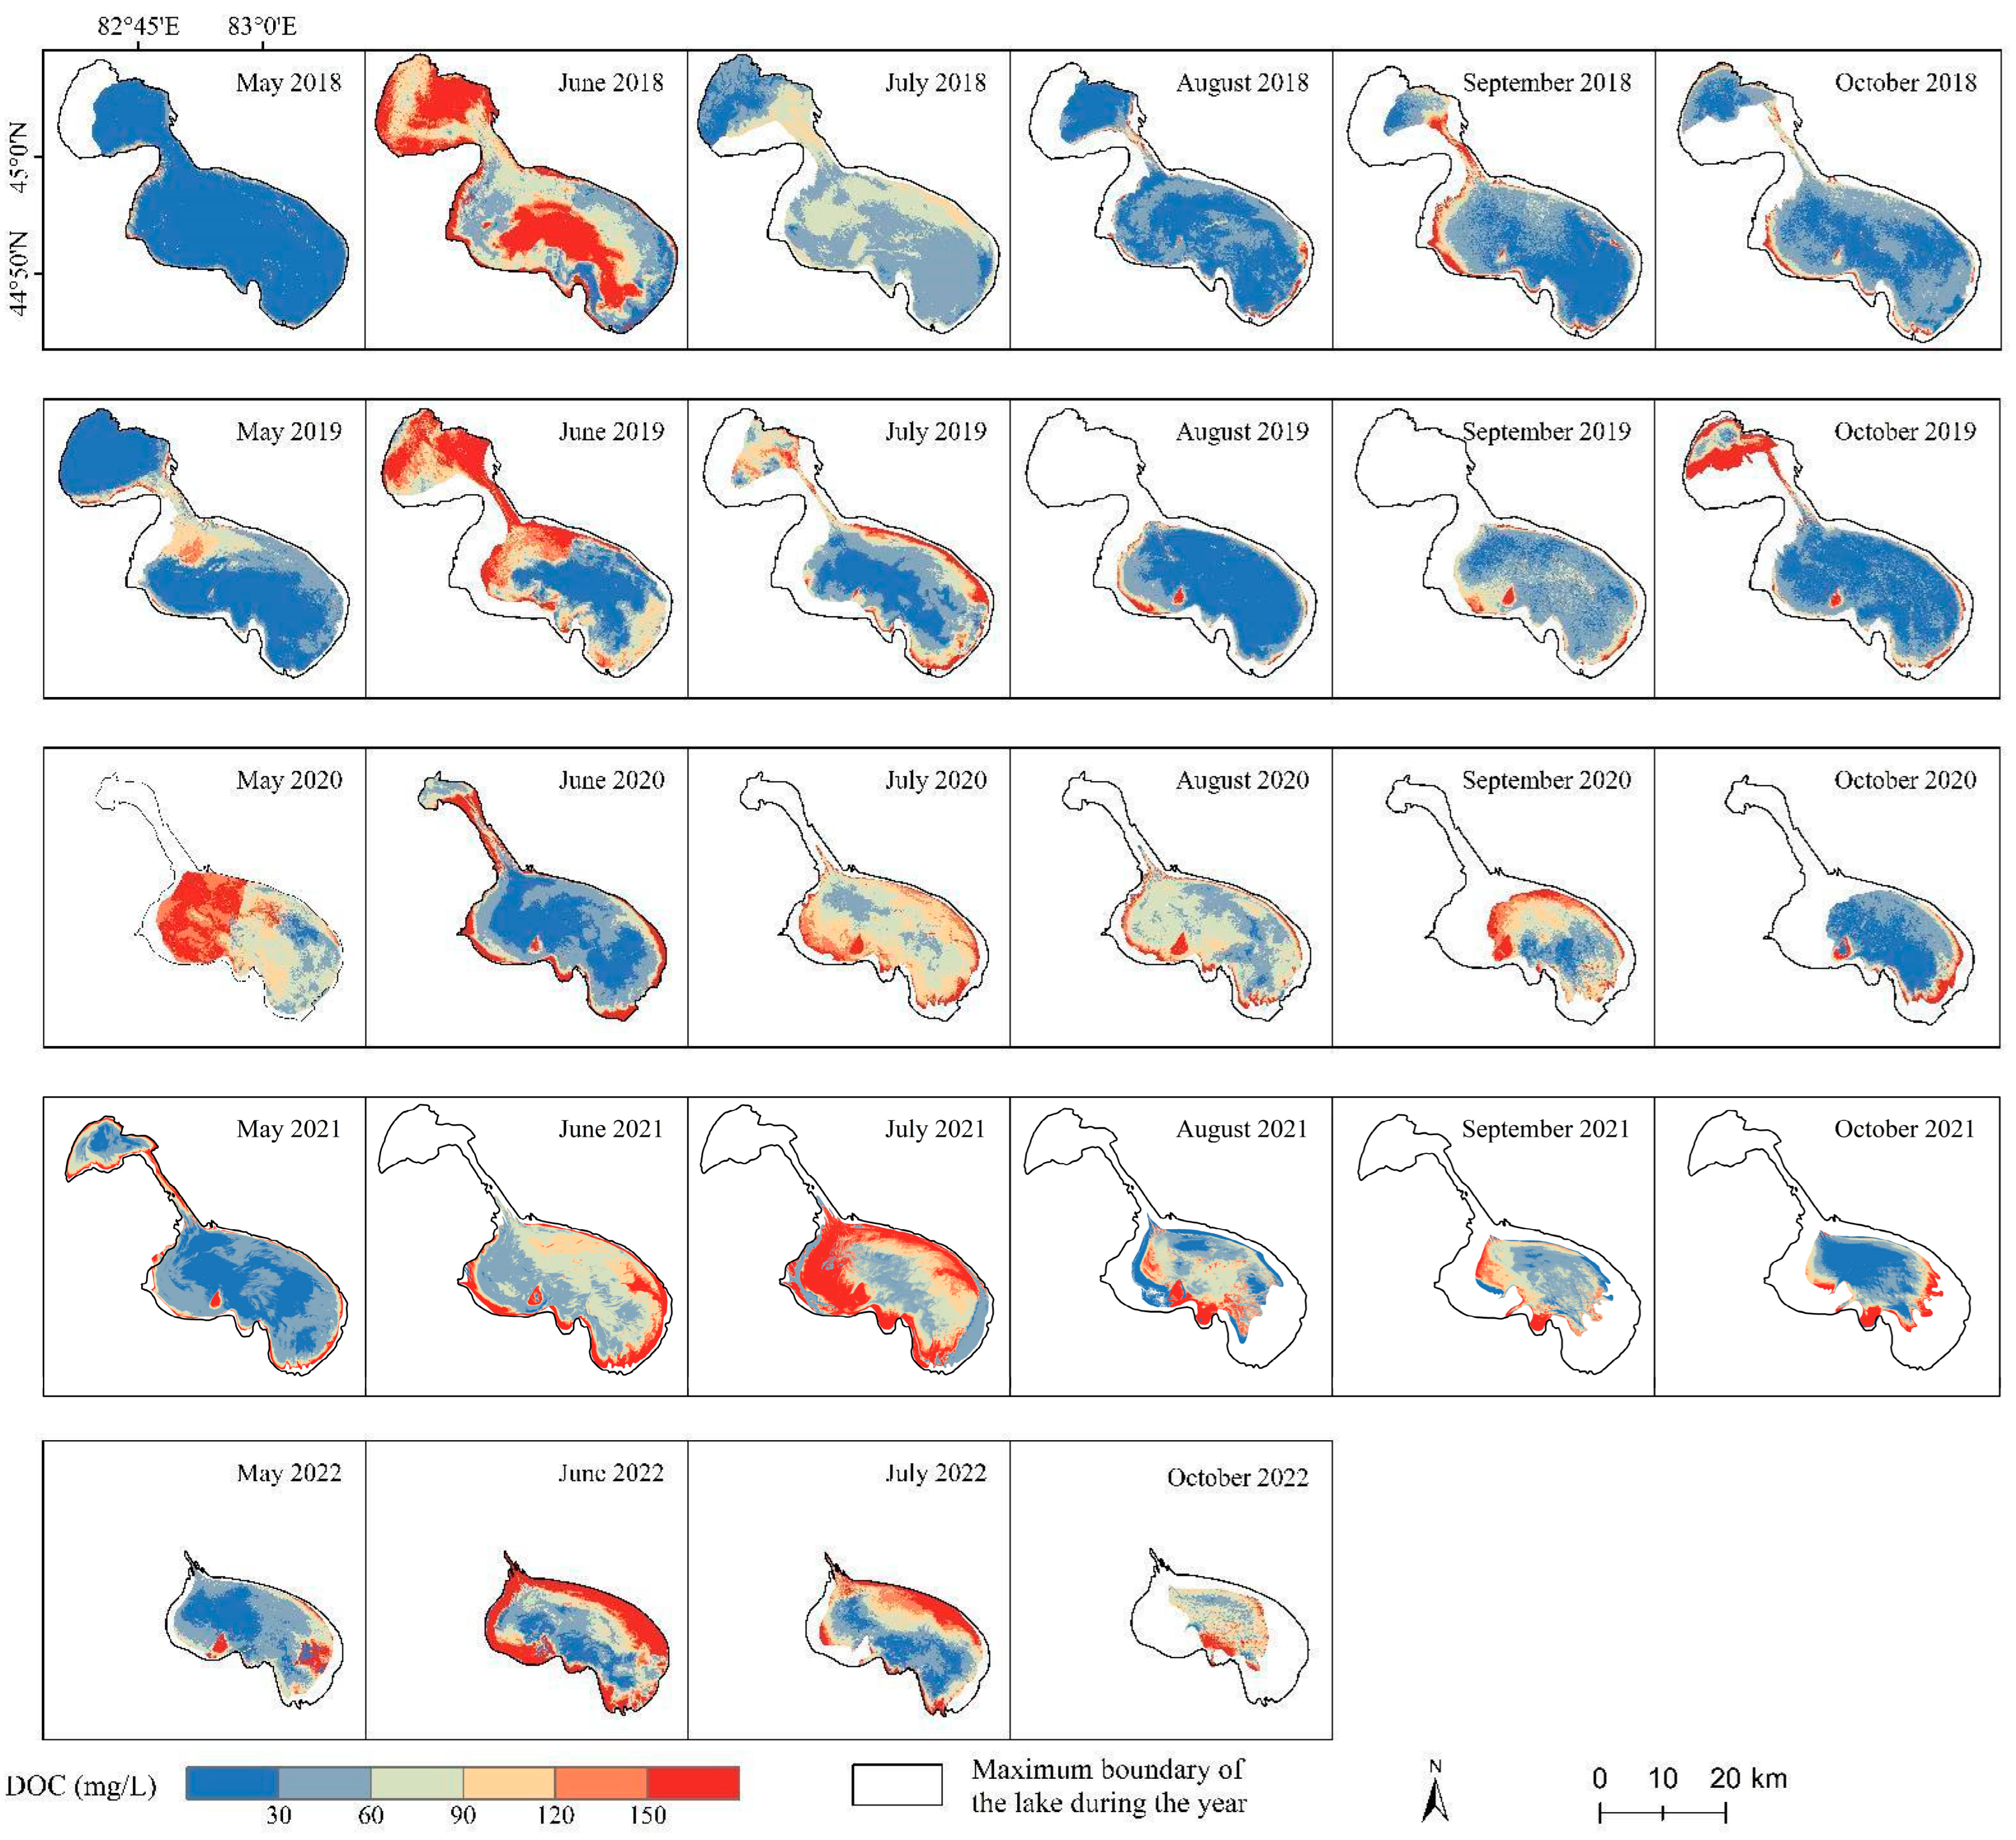
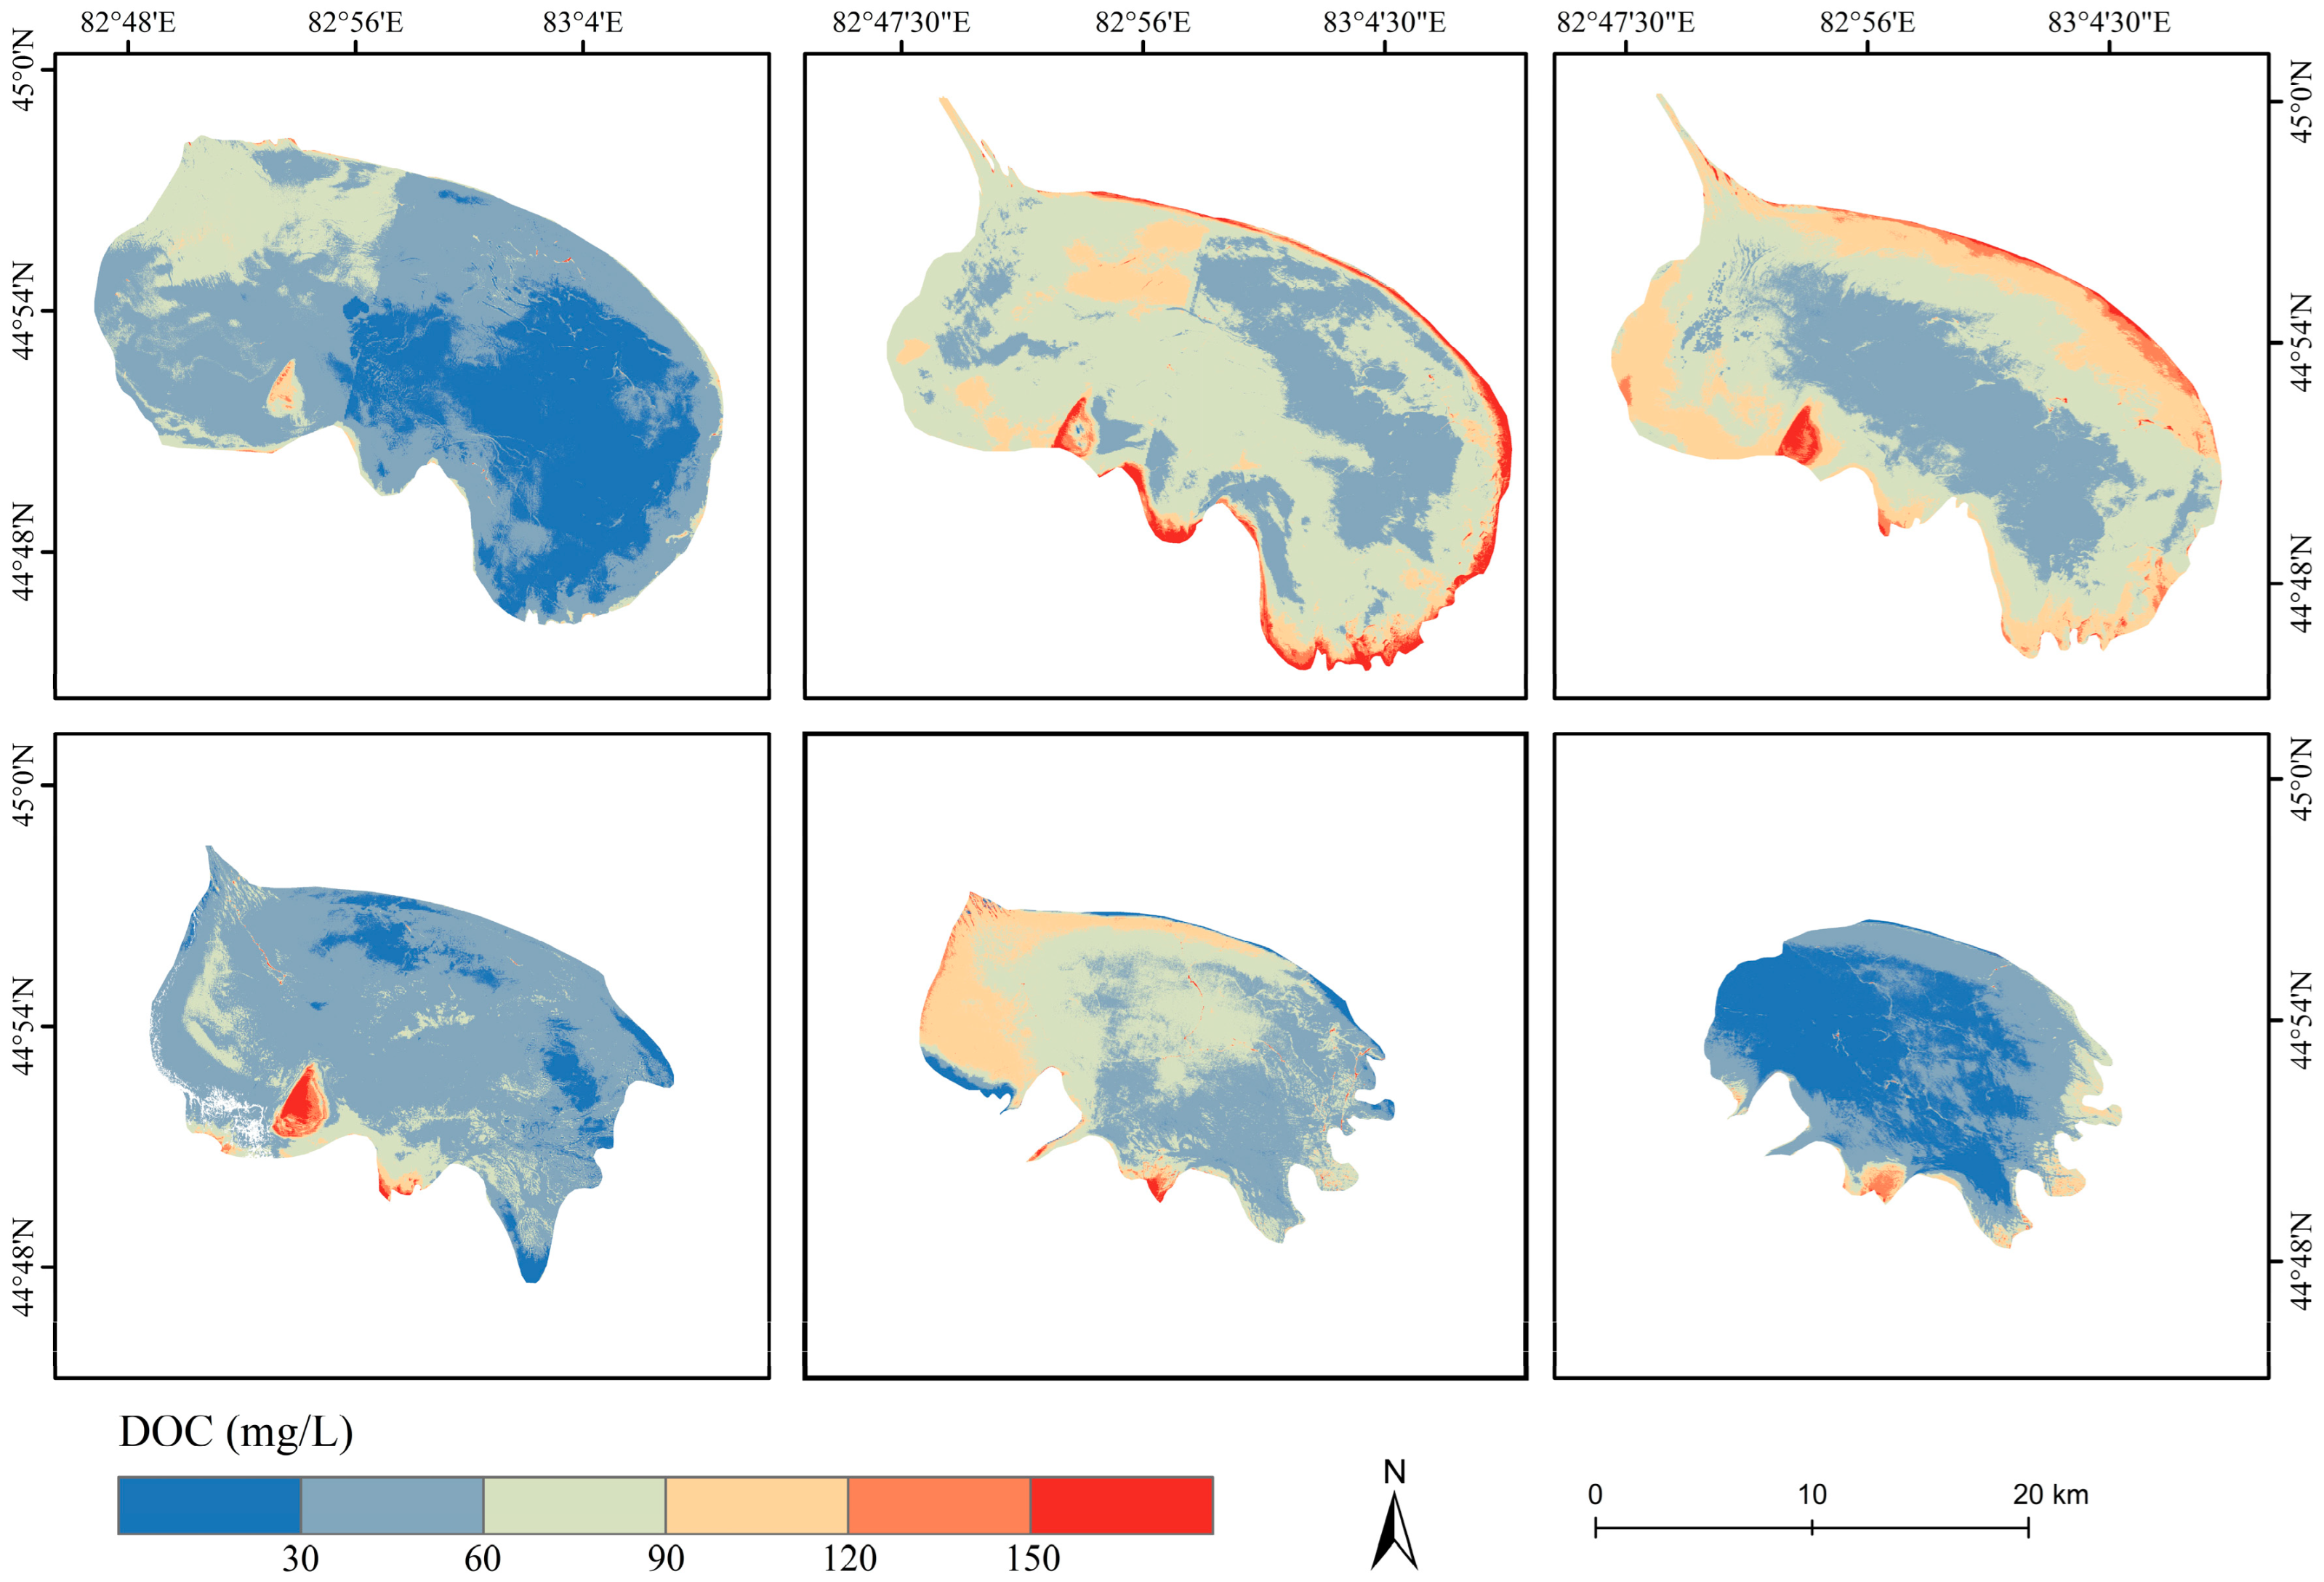
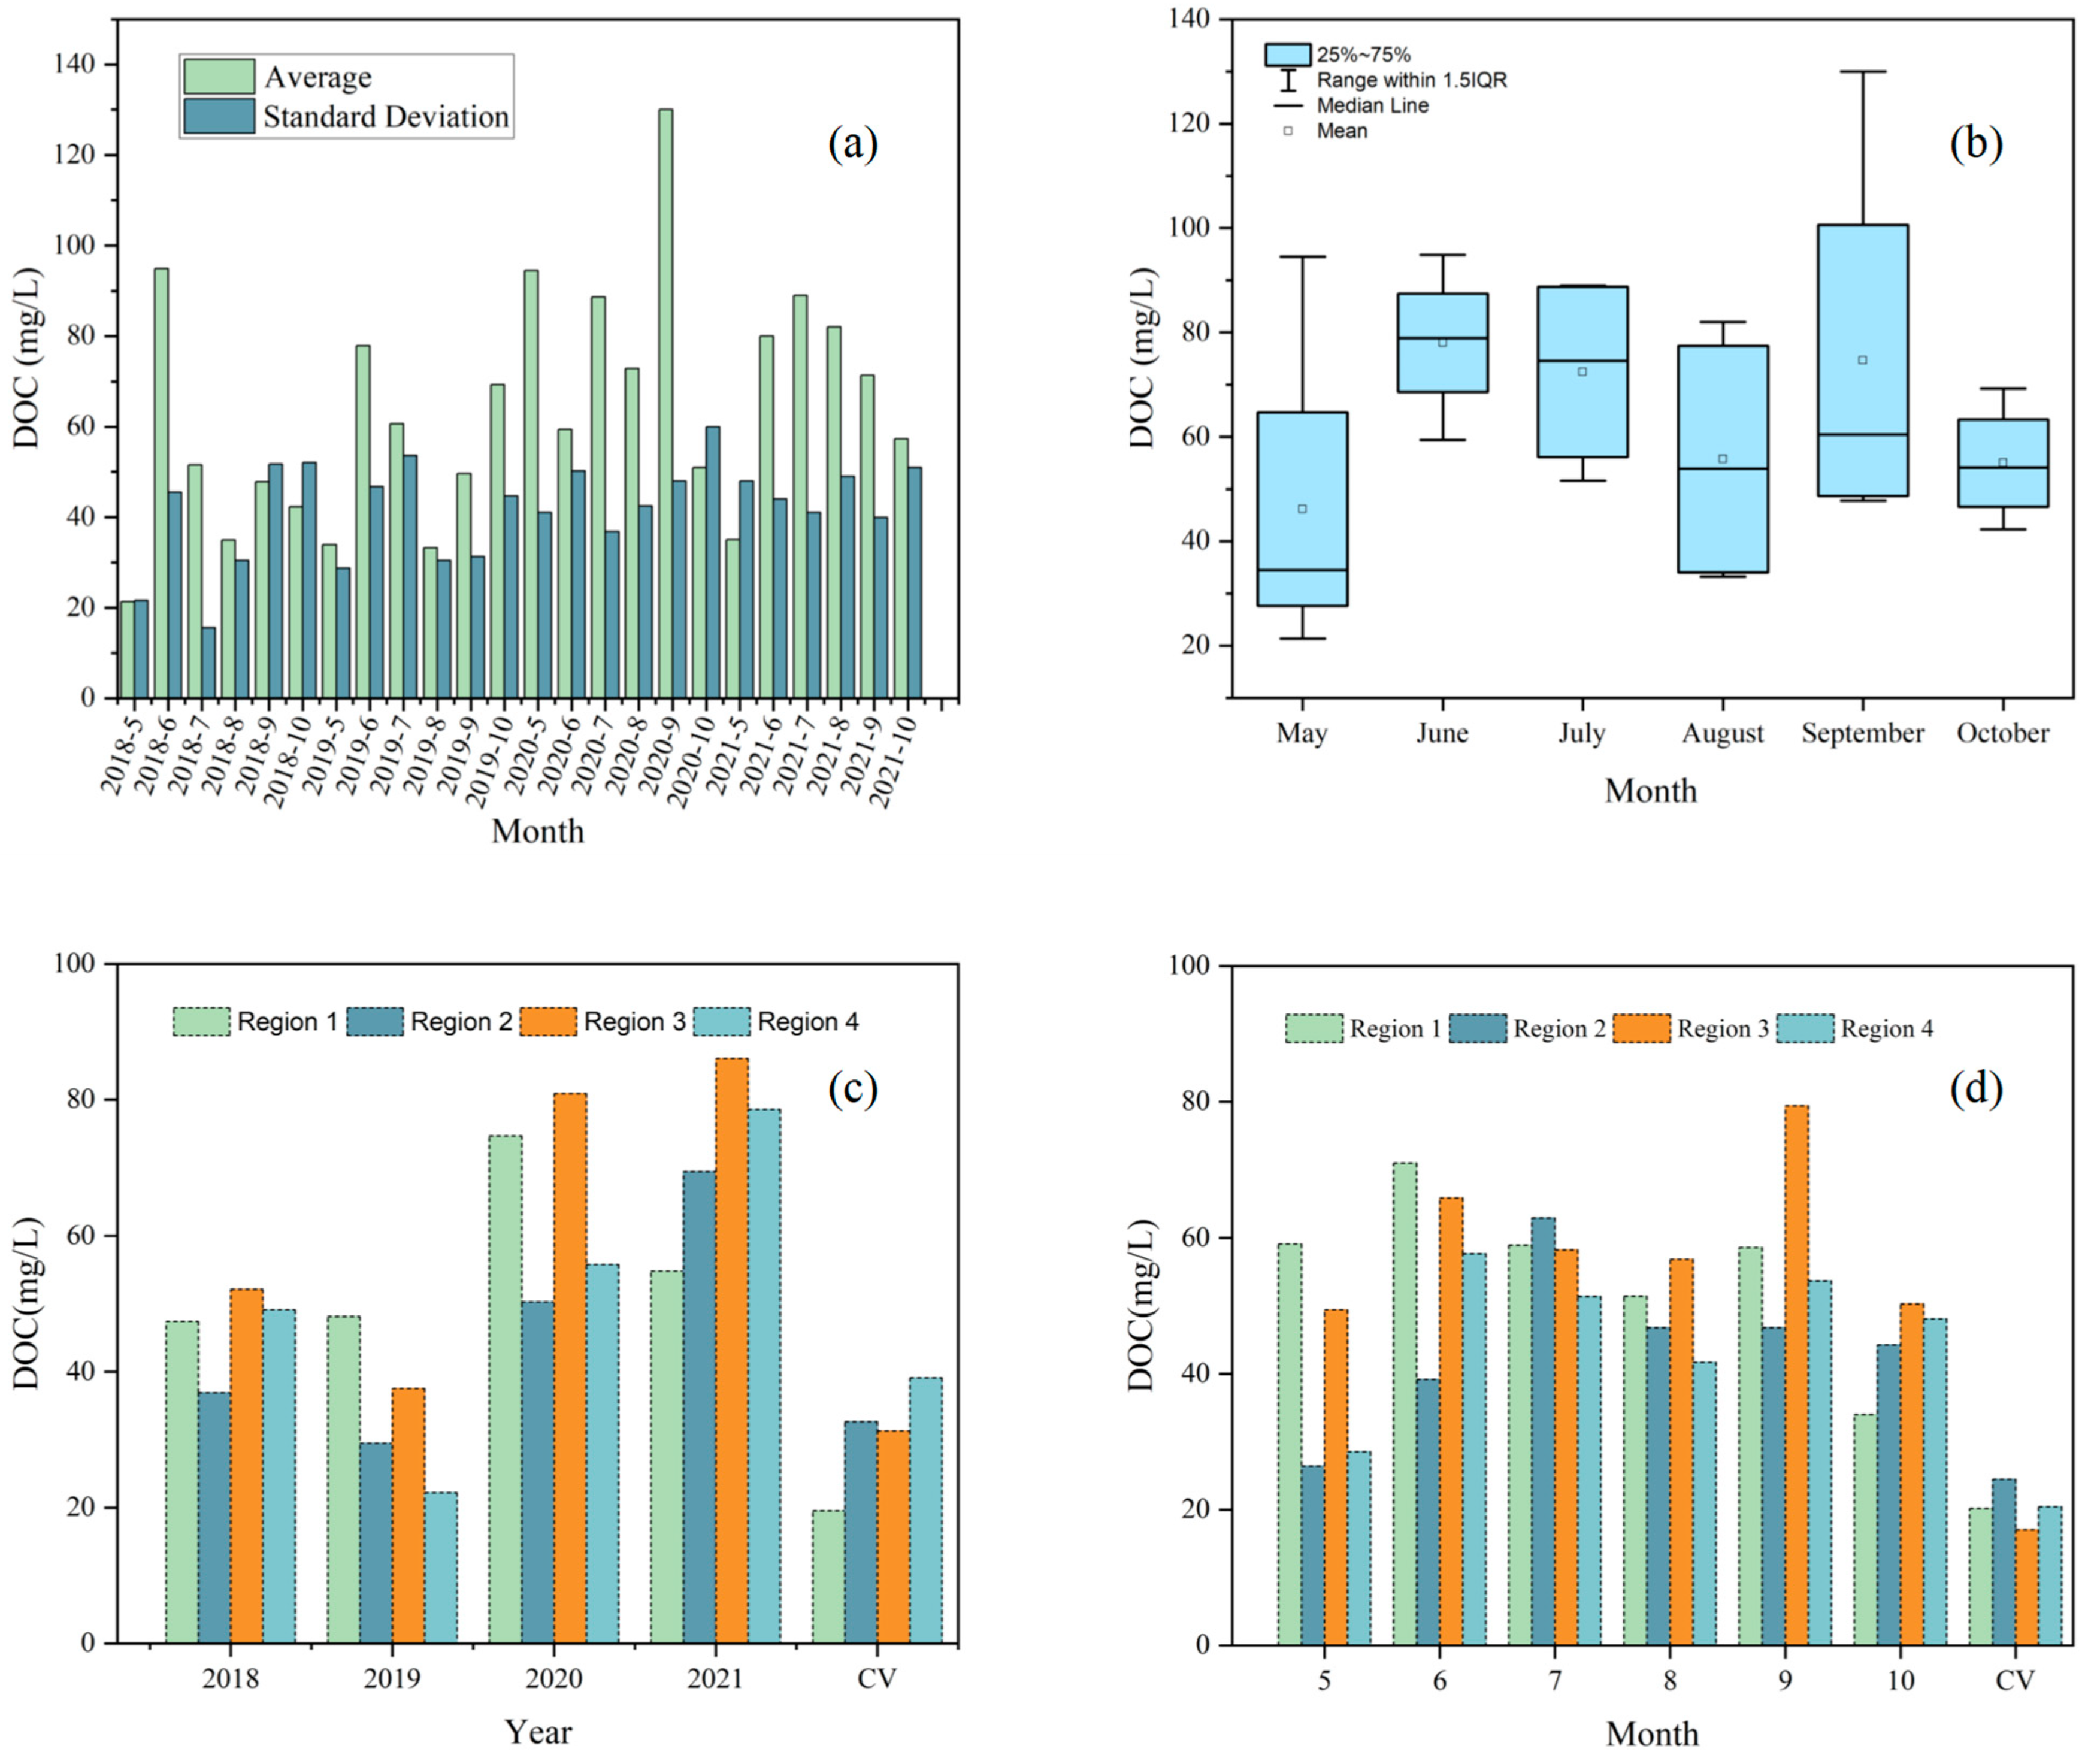
By conducting a comparative analysis of the spatial variation in Lake Ebinur’s DOC, it could be inferred that from 2018 to 2022, Lake Ebinur’s DOC concentration exhibited an overall increasing trend. The concentration predominantly ranged between 30 and 90 mg/L, with a few regions displaying DOC concentrations exceeding 150 mg/L. Further comparison of Lake Ebinur’s spatial DOC variations from 2018 to 2021 revealed a year-on-year increase in DOC concentration. Additionally, upon contrasting the spatial distribution patterns of DOC across different months, it became evident that DOC concentrations in June and July of each year exceeded those in other months, while concentrations in May were notably lower.
(4)
Analyzing the temporal variations in Lake Ebinur’s DOC concentration revealed a distinct fluctuating trend, characterized by an overall increasing trajectory over time. Among these variations, the month of June stood out with the highest average DOC concentration (80 mg/L), whereas the lowest average concentration was observed in May (48 mg/L). From 2018 to 2021, the coefficient of variation in region 4 was the highest, and the coefficient of variation in region 1 was the smallest.

Author Contributions

Methodology, N.C.; Validation, C.-Y.J. and X.M.; Formal analysis, C.L.; Investigation, G.H.; Data curation, X.L. and F.Z.; Writing—original draft, N.C.; Writing—review & editing, M.L.T.; Visualization, J.S.; Supervision, C.L. All authors have read and agreed to the published version of the manuscript.

Funding

This research was carried out with financial support provided by the National Natural Science Foundation of China (42261006), the State Key Laboratory of Lake Science and Environment (2022SKL007), and the Tianshan Talent Project (Phase III) of the Xinjiang Uygur Autonomous Region.

Data Availability Statement

Data are contained within the article.

Acknowledgments

We thank the editor and anonymous reviewers for their valuable comments and suggestions in developing this paper.

Conflicts of Interest

The authors declare no conflict of interest.

Abbreviations

CDOMColored dissolved organic matter
DOCDissolved organic carbon
DOMDissolved organic matter
QAAQuasi-analytical algorithm
SPMSuspended particulate matter

References

  1. Li, J.; Yu, Q.; Tian, Y.Q.; Becker, B.L. Remote sensing estimation of colored dissolved organic matter (CDOM) in optically shallow waters. ISPRS J. Photogramm. Remote Sens. 2017, 128, 98–110. [Google Scholar] [CrossRef]
  2. DelSontro, T.; Beaulieu, J.J.; Downing, J.A. Greenhouse gas emissions from lakes and impoundments: Upscaling in the face of global change. Limnol. Oceanogr. Lett. 2018, 3, 64–75. [Google Scholar] [CrossRef] [PubMed]
  3. Liu, D.; Yu, S.J.; Xiao, Q.T.; Duan, H.T. Satellite estimation of dissolved organic carbon in eutrophic Lake Taihu, China. Remote Sens. Environ. 2021, 264, 112572. [Google Scholar] [CrossRef]
  4. Ferrari, G.M.; Dowell, M.D.; Grossi, S.; Targa, C. Relationship between the optical properties of chromophoric dissolved organic matter and total concentration of dissolved organic carbon in the southern Baltic Sea region. Mar. Chem. 1996, 55, 299–316. [Google Scholar] [CrossRef]
  5. Mannino, A.; Russ, M.E.; Hooker, S.B. Algorithm development and validation for satellite-derived distributions of DOC and CDOM in the US Middle Atlantic Bight. J. Geophys. Res. Ocean. 2008, 113, 19. [Google Scholar] [CrossRef]
  6. Kutser, T. The possibility of using the Landsat image archive for monitoring long time trends in coloured dissolved organic matter concentration in lake waters. Remote Sens. Environ. 2012, 123, 334–338. [Google Scholar] [CrossRef]
  7. Juhls, B.; Matsuoka, A.; Lizotte, M. Seasonal dynamics of dissolved organic matter in the Mackenzie Delta, Canadian Arctic waters: Implications for ocean colour remote sensing. Remote Sens. Environ. 2022, 283, 113327. [Google Scholar] [CrossRef]
  8. Zhou, B.T.; Liu, X.L.; Wu, L. Retrieval model of colored dissolved organic matter concentration based on water color remote sensing in Hongkong Waters. Mar. Environ. Sci. 2013, 32, 115–119. [Google Scholar]
  9. Chen, J.; Zhu, W.N.; Tian, Y.Q.; Yu, Q. Estimation of colored dissolved organic matter from landsat-8 imagery for complex inland water: Case study of lake Huron. IEEE Trans. Geosci. Remote Sens. 2017, 55, 2201–2212. [Google Scholar] [CrossRef]
  10. Tian, Y.; Guo, Z.Q.; Qiao, Y.C. Remote sensing of water quality monitoring in Guanting Reservoir. Acta Ecol. Sin. 2015, 35, 2217–2226. [Google Scholar]
  11. Morel, A.; Louis, P. Analysis of variations in ocean color. Limnol. Oceanogr. 1997, 22, 709–722. [Google Scholar] [CrossRef]
  12. Chen, J.; Zhu, W.; Tian, Y.Q.; Yu, Q. Monitoring dissolved organic carbon by combining Landsat-8 and Sentinel-2 satellites: Case study in Saginaw River estuary, Lake Huron. Sci. Total Environ. 2020, 718, 137374. [Google Scholar] [CrossRef] [PubMed]
  13. Shang, Y.; Liu, G.; Wen, Z.D.; Jacinthe, P.A.; Song, K.S.; Zhang, B.; Lyu, L.L.; Li, S.J.; Wang, X.; Yu, X.F. Remote estimates of CDOM using Sentinel-2 remote sensing data in reservoirs with different trophic states across China. J. Environ. Manag. 2021, 286, 112275. [Google Scholar] [CrossRef] [PubMed]
  14. Liu, C.J.; Zhang, F.; Tan, M.L.; Jim, C.Y.; Song, K.S.; Shi, J.C.; Lin, X.W.; Kung, H.T. High spatiotemporal resolution reconstruction of suspended particulate matter concentration in arid brackish lake, China. J. Clean. Prod. 2023, 414, 137673. [Google Scholar] [CrossRef]
  15. Zhu, W.; Tian, Y.Q.; Yu, Q.; Becker, B.L. Using Hyperion imagery to monitor the spatial and temporal distribution of colored dissolved organic matter in estuarine and coastal regions. Remote Sens. Environ. 2013, 134, 342–354. [Google Scholar] [CrossRef]
  16. Harkort, L.; Duan, Z. Estimation of dissolved organic carbon from inland waters at a large scale using satellite data and machine learning methods. Water Res. 2022, 29, 119478. [Google Scholar] [CrossRef] [PubMed]
  17. Lv, H.; Zhou, L.Y.; Jiang, N. Estimation of Dissolved organic Carbon Concentration in Taihu Lake Using Reflectance Spectral and Simulated MERIS. J. Nanjing For. Univ. 2006, 40, 38. [Google Scholar]
  18. Brezonik, P.L.; Olmanson, L.G.; Finlay, J.C.; Bauer, M.E. Factors affecting the measurement of CDOM by remote sensing of optically complex inland waters. Remote Sens. Environ. 2015, 157, 199–215. [Google Scholar] [CrossRef]
  19. Zhang, Y.; Zhou, L.; Zhou, Y.; Zhang, L.; Yao, X.; Shi, K.; Jeppesen, E.; Yu, Q.; Zhu, W. Chromophoric dissolved organic matter in inland waters: Present knowledge and future challenges. Sci. Total Environ. 2021, 759, 143550. [Google Scholar] [CrossRef]
  20. Liu, C.J.; Zhang, F.; Jim, C.Y.; Johnson, V.C.; Tan, M.L.; Shi, J.C.; Lin, X.W. Controlled and driving mechanism of the SPM variation of shallow Brackish Lakes in arid regions. Sci. Total Environ. 2023, 878, 163127. [Google Scholar] [CrossRef]
  21. Kirk, J.T.O. Light and Photosynthesis in Aquatic Ecosystems; Cambridge University Press: Cambridge, UK, 1994. [Google Scholar]
  22. Buiteveld, H.; Donze, M.; Donze, M. Optical properties of pure water. Int. Soc. Opt. Eng. 1994, 2258, 174–183. [Google Scholar]
  23. Pinkerton, M.H.; Richardson, K.M.; Boyd, P.W. Inter-comparison of ocean colour band-ratio algorithms for chlorophyll concentration in the subtropical front east of New Zealand. Remote Sens. Environ. 2005, 97, 382–402. [Google Scholar] [CrossRef]
  24. Cleveland, J.S.; Weidemann, A.D. Quantifying absorption by aquatic particles: A multiple scattering correction for glass-fiber filters. Limnol. Oceanogr. 1993, 38, 1321–1327. [Google Scholar] [CrossRef]
  25. Bricaud, A.; Morel, A.; Prieur, L. Absorption by dissolved organic matter of the sea (yellow substance) in the UV and visible domain. Limnol. Oceanogr. 1981, 26, 43–53. [Google Scholar] [CrossRef]
  26. Lee, Z.P.; Carder, K.L.; Arnone, R.A. Deriving inherent optical properties from water color: A multiband quasi-analytical algorithm for optically deep waters. Appl. Opt. 2002, 41, 5755–5772. [Google Scholar] [CrossRef] [PubMed]
  27. Le, C.F.; Li, Y.M.; Zha, Y.; Yin, B.; Zhang, H. Study on Partitioning of Phytoplankton Absorption Coefficient from Total Spectral Absorption in Taihu. Acta Opt. Sin. 2010, 30, 3090–3096. (In Chinese) [Google Scholar]
  28. Araújo, C.A.S.; B’elanger, S. Variability of bio-optical properties in nearshore waters of the estuary and Gulf of St. Lawrence: Absorption and backscattering coefficients. Estuar. Coast. Shelf Sci. 2022, 264, 107688. [Google Scholar] [CrossRef]
  29. Wang, Z.; Zhang, F.; Zhang, X.L.; Chan, N.W.; Kung, H.; Zhou, X.H.; Wang, Y.S. Quantitative Evaluation of Spatial and Temporal Variation of Soil Salinization Risk Using GIS-Based Geostatistical Method. Remote Sens. 2020, 12, 2405. [Google Scholar] [CrossRef]
  30. Duan, P.; Zhang, F.; Jim, C.Y.; Tan, M.L.; Cai, Y.F.; Shi, J.C.; Liu, C.J.; Wang, W.W.; Wang, Z. Reconstruction of Sentinel Images for Suspended Particulate Matter Monitoring in Arid Regions. Remote Sens. 2023, 15, 872. [Google Scholar] [CrossRef]
  31. Vadeboncoeur, Y.; McIntyre, P.B.; Vander Zanden, M.J. Borders of biodiversity: Life at the edge of the world’s large lakes. Bioscience 2011, 61, 526–537. [Google Scholar] [CrossRef]
  32. Jiang, D.L.; Scholze, J.; Liu, X.H.; Simis, S.G.H.; Stelzer, K.; Müller, D.; Hunter, P.; Tyler, A.; Apyrakos, E. A data-driven approach to flag land-affected signals in satellite derived water quality from small lakes. Int. J. Appl. Earth Obs. Geoinf. 2023, 117, 103188. [Google Scholar] [CrossRef]
  33. Strock, K.E.; Saros, J.E.; Nelson, S.J.; Birkel, S.D.; Kahl, J.S.; McDowell, W.H. Extreme weather years drive episodic changes in lake chemistry: Implications for recovery from sulfate deposition and long-term trends in dissolved organic carbon. Biogeochemistry 2016, 127, 353–365. [Google Scholar] [CrossRef]
  34. Pedro, M.; Dale, S.; Pinto, R.L. The International Seabed Authority and the United Nations 2030 Agenda for Sustainable Development. Resour. Policy 2023, 86, 104166. [Google Scholar]
  35. Zhao, H.; Yao, B.; Wang, S.R.; Wang, G.Q. Remote sensing estimation of the concentration and sources of coloured dissolved organic matter based on MODIS: A case study of Erhai lake. Ecol. Indic. 2021, 131, 108180. [Google Scholar]
  36. Del, V.R.; Blouhgh, N.V. Spatial and seasonal distribution of chro-mophoric dissolved organic matter and dissolved organic carbon in the Middle Atlantic Bight. Mar. Chem. 2004, 89, 169–187. [Google Scholar]
  37. Wu, J.F.; Yao, H.X.; Wang, G.Q.; Chen, X.H.; Yuan, X.; Zhou, Y.L.; Zhang, D.J. Dynamics of DOC concentration and flux in different propagation stages of hydrological drought: Patterns and drivers. J. Hydrol. 2022, 617, 128939. [Google Scholar] [CrossRef]
Figure 1. (a) Xinjiang, China, (b) sampling points over the main lake area, (c) average wind direction and speed in Lake Ebinur from 2014 to 2022, and (d) field sampling weather condition statistics.
Remotesensing 16 00252 g001
Figure 2. Flowchart of this study.
Remotesensing 16 00252 g002
Figure 3. Absorption coefficients of (a) CDOM and (b) SPM.
Remotesensing 16 00252 g003
Figure 4. Comparison between the absorption coefficients of dewatering and pure water ((a) represents the absorption coefficient of dewatering, (b) represents a comparison between the absorption coefficient of pure water and that of non-water, where the blue curve represents the average value of the measured absorption coefficient of non-water).
Remotesensing 16 00252 g004
Figure 5. CDOM inversion model validation of the QAA-CDOM.
Remotesensing 16 00252 g005
Figure 6. Accuracy verification of DOC estimation model ((a) linear regression model, (b) quadratic regression model, (c) exponential regression model, (d) logarithmic regression model).
Remotesensing 16 00252 g006
Figure 7. Monthly DOC inversion results for Lake Ebinur from 2018 to 2022.
Remotesensing 16 00252 g007
Figure 8. Interannual DOC changes in Lake Ebinur from 2018 to 2021 (considering that the area of Lake Ebinur varies greatly, the minimum lake area for different months in the same year was selected as the boundary when the annual average data of Lake Ebinur from 2018 to 2021 were synthesized).
Remotesensing 16 00252 g008
Figure 9. Seasonal DOC changes in Lake Ebinur from 2018 to 2021 (considering the large seasonal variation in Lake Ebinur’s area, the minimum lake area of the same month in different years was selected as the boundary when compiling the monthly average data of Lake Ebinur from 2018 to 2021).
Remotesensing 16 00252 g009
Figure 10. Average monthly DOC statistics of Lake Ebinur from 2018 to 2022. ((a) Line chart of the monthly DOC concentration in Lake Ebinur; (b) box chart of the average DOC concentration in Lake Ebinur in different months; (c) variation coefficient of DOC in different regions from 2018 to 2022; (d) variation coefficient of DOC in different regions from May to October.).
Remotesensing 16 00252 g010
Figure 11. Accuracy verification of linear regression model.
Remotesensing 16 00252 g011
Table 1. Calculation process of the QAA-CDOM algorithm based on the Sentinel-2 image.
StepFormula
(1) r rs ( λ ) = R rs ( λ ) / ( 0.52 + 1.7 R rs ( λ ) )
(2) μ ( λ ) = g 0 + ( g 0 ) 2 + 4 g 1 × r rs ( λ ) 2 g 1 , g 0 = 0.0895 , g 1 = 0.1247
(3) a ( λ 0 )   = a ( 833 ) = a w ( 833 ) + 0.39 × ( r rs ( 833 ) r rs ( 443 ) + r rs ( 492 ) ) 1.14
(4) b bp ( λ 0 )   = b bp ( 833 ) = ( μ ( λ 0 )   ×   a ( λ 0 ) 1 μ ( λ 0 ) )     b bw ( 833 )
(5) Y = 2.0 × ( 1 1.2 exp ( 0.9 × r rs ( 443 ) r rs ( 560 ) ) )
(6) b bp ( λ ) = b bp ( λ 0 ) × ( λ 0 λ ) Y
(7) a ( λ ) = ( 1 μ ( λ ) ) × ( b bw ( λ ) + b bp ( λ ) ) μ ( λ )
(8) a p ( 443 ) = j 1 × b bp × ( 561 ) j 2
(9) a g ( 443 ) = a ( 443 )     a p ( 443 )
Note: Step diagram of QAA-CDOM algorithm (Rrs(λ) represents above-surface remote sensing reflectance (sr−1); rrs(λ) represents below-surface remote sensing reflectance (sr−1); μ(λ) represents ratio of back-scattering coefficient to the sum of absorption and back-scattering coefficients; a(λ) represents the total absorption coefficient (m−1); aw0) represents the absorption coefficient of pure water at a characteristic wavelength (m−1); bb(λ) represents the back-scattering coefficient (m−1); bbw0) represents the back-scattering coefficient of pure water at a characteristic wavelength; Y represents the spectral power of the particle-scattering coefficient; λ0 represents a characteristic wavelength; ap and ag represent SPM and CDOM’s absorption coefficients).
Disclaimer/Publisher’s Note: The statements, opinions and data contained in all publications are solely those of the individual author(s) and contributor(s) and not of MDPI and/or the editor(s). MDPI and/or the editor(s) disclaim responsibility for any injury to people or property resulting from any ideas, methods, instructions or products referred to in the content.

