


Discriminating between Biotic and Abiotic Stress in Poplar Forests Using Hyperspectral and LiDAR Data


Abstract
1. Introduction
2. Materials and Methods
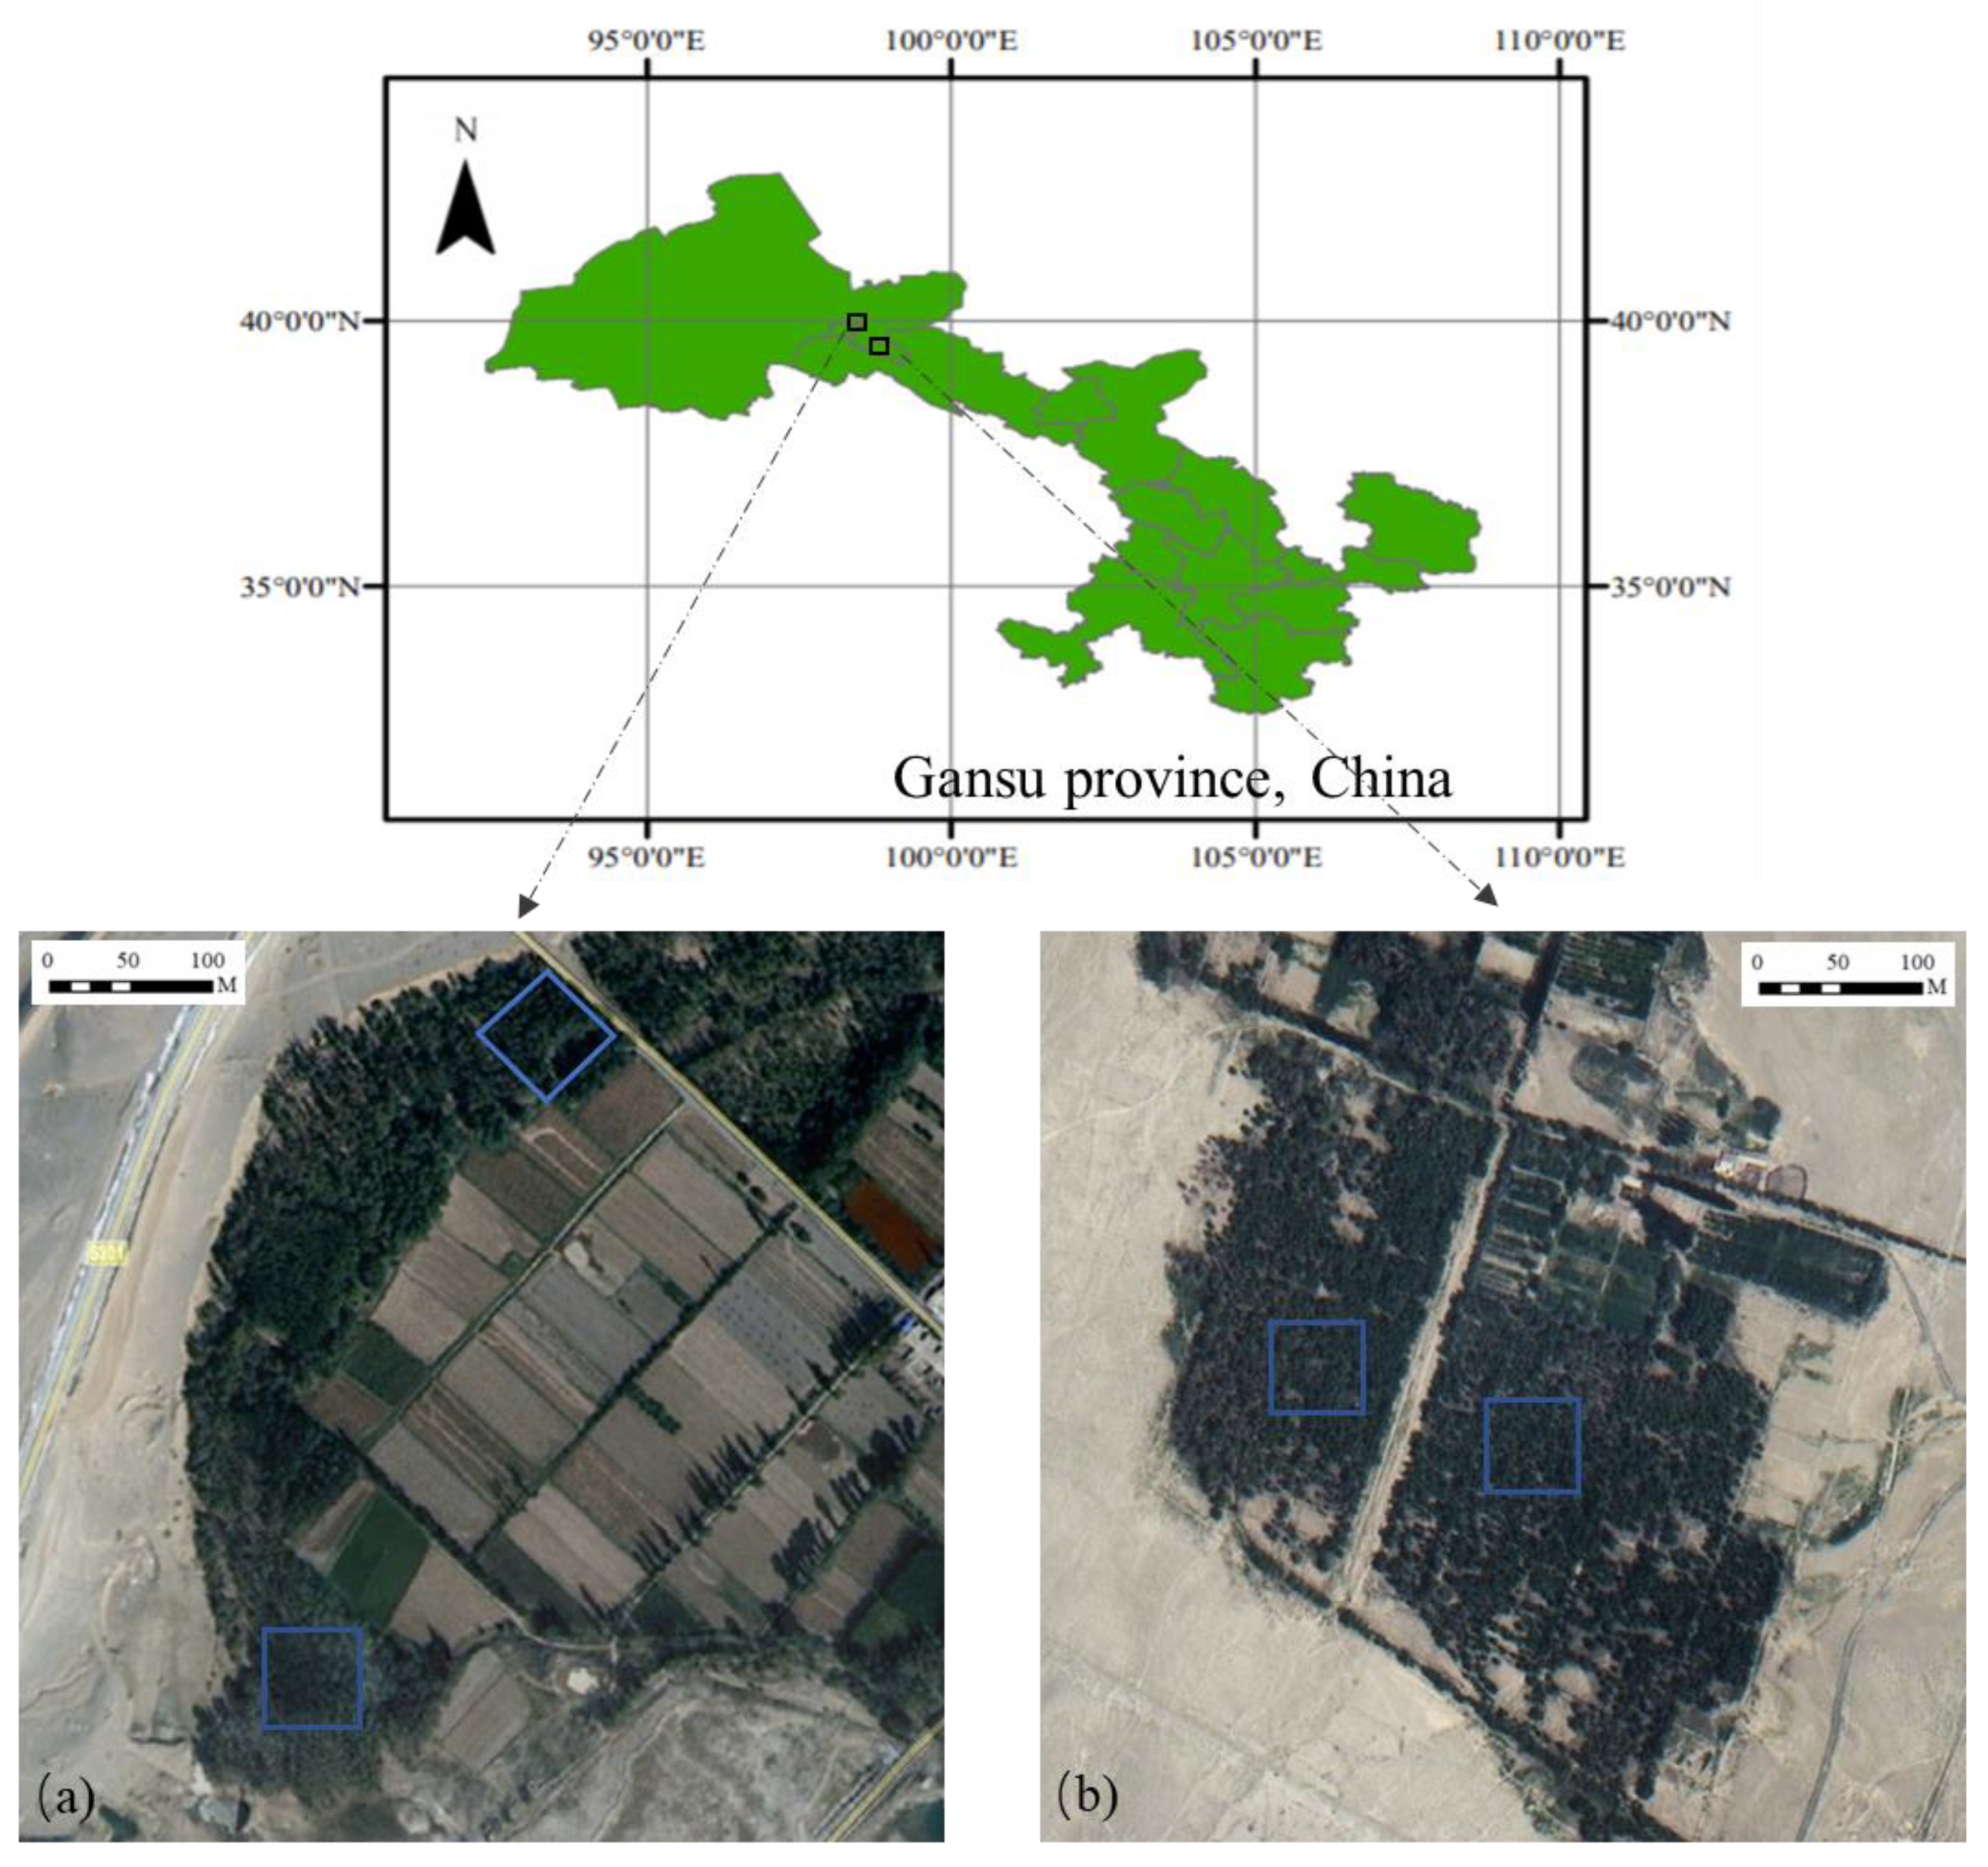
2.1. Study Area
2.2. Determination of Soil Moisture Conditions
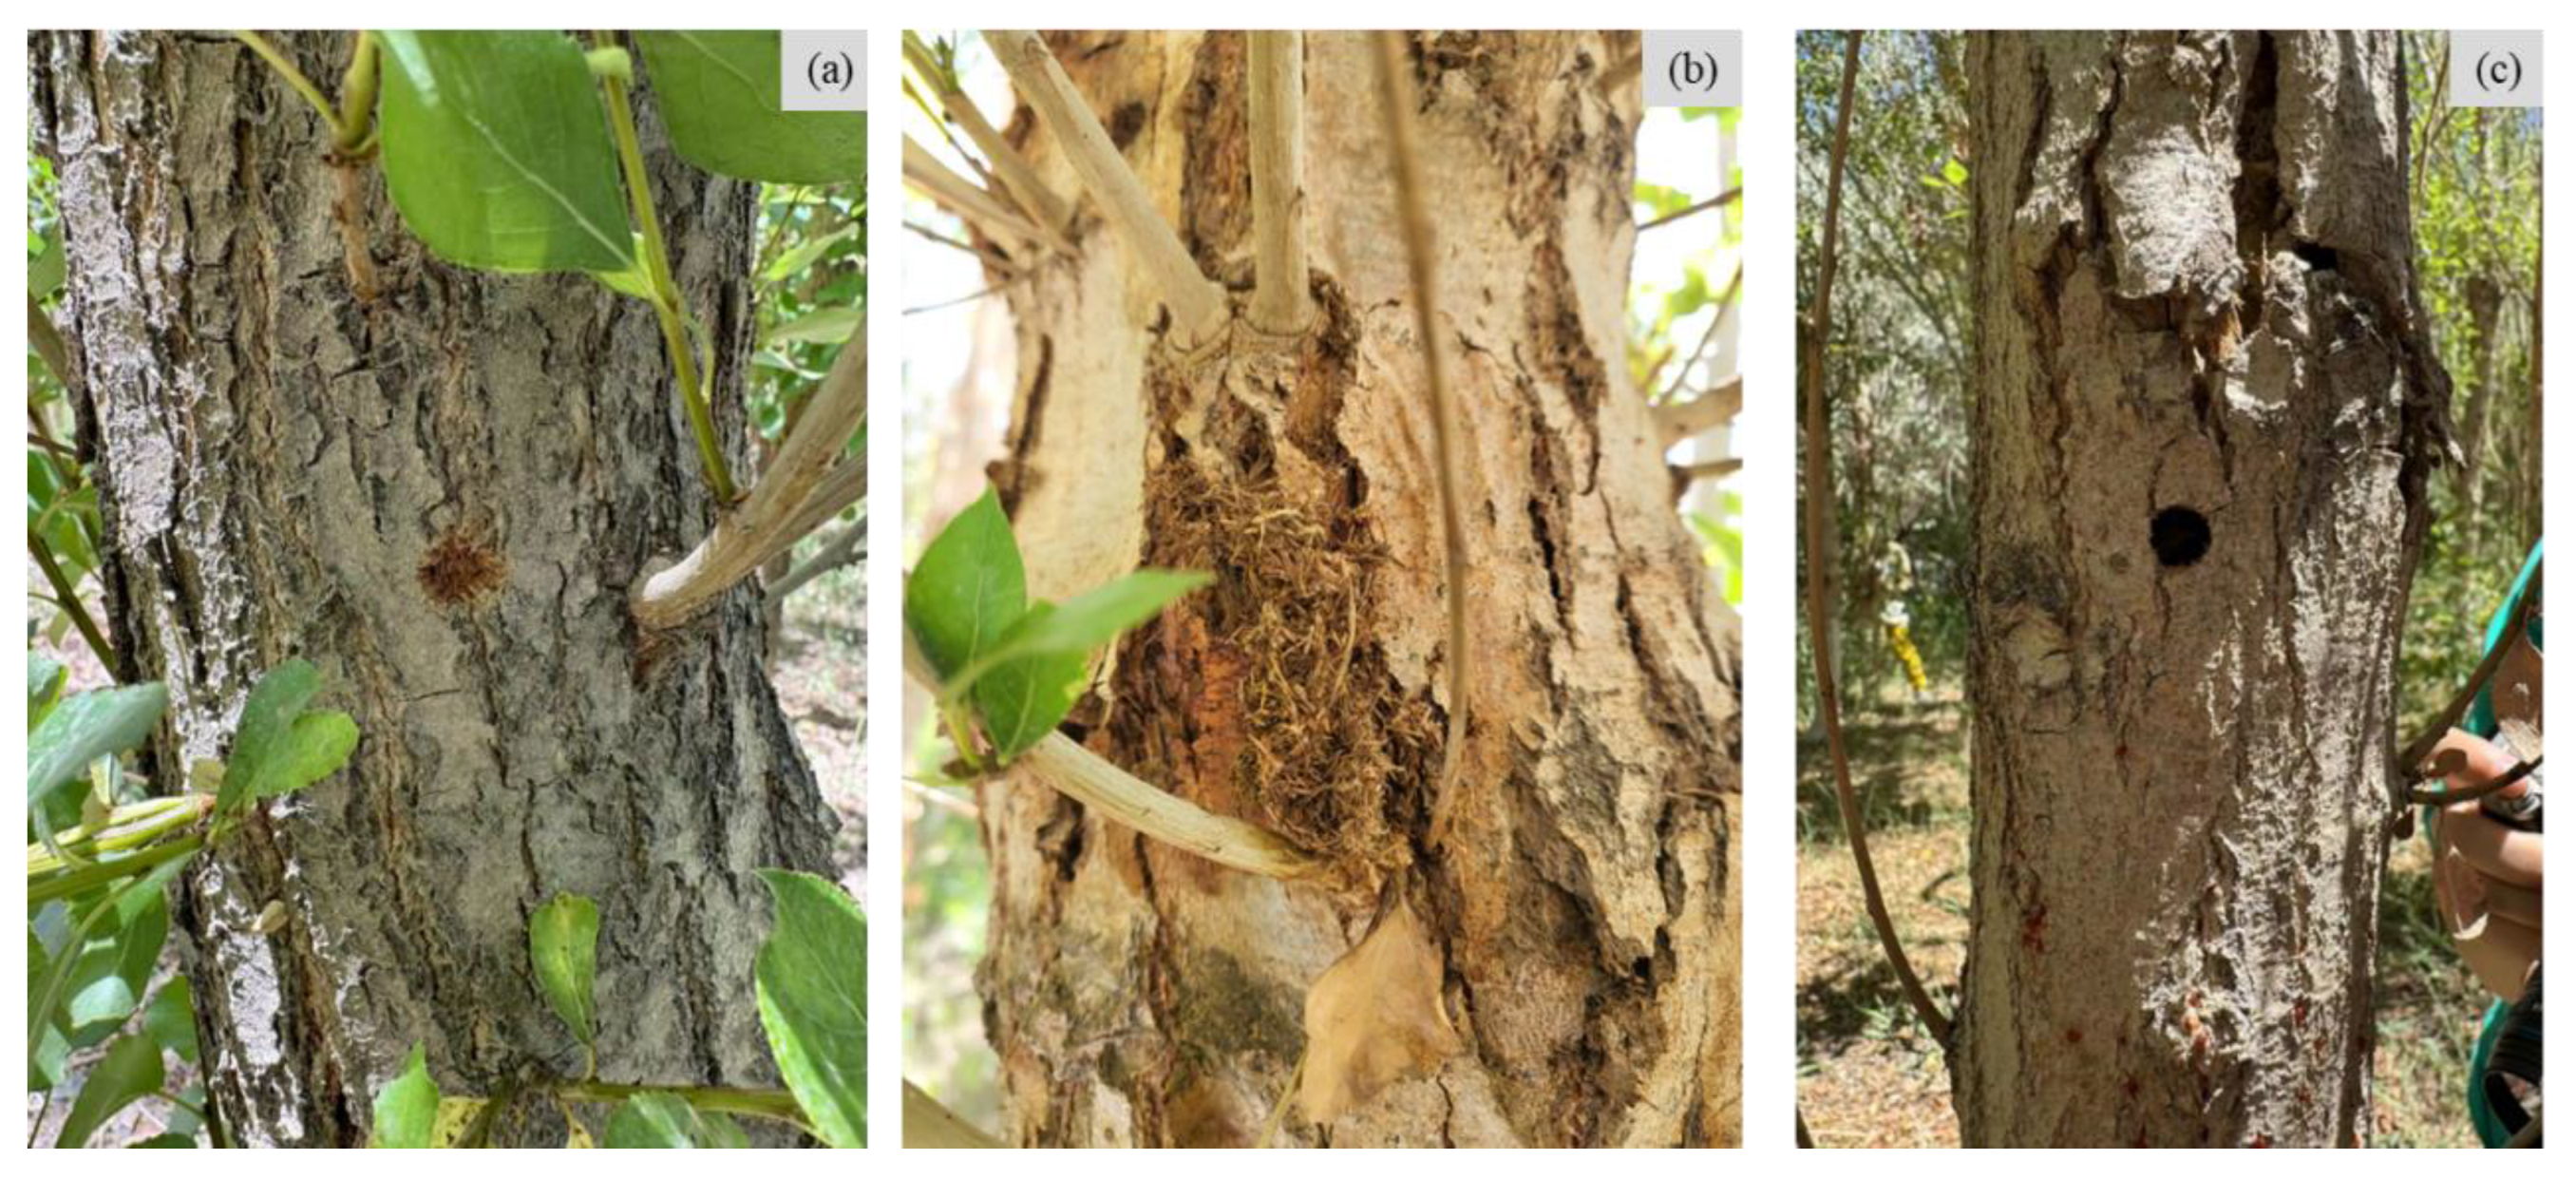
2.3. Determination of ALB Damage and Measurement of Leaf Area Index
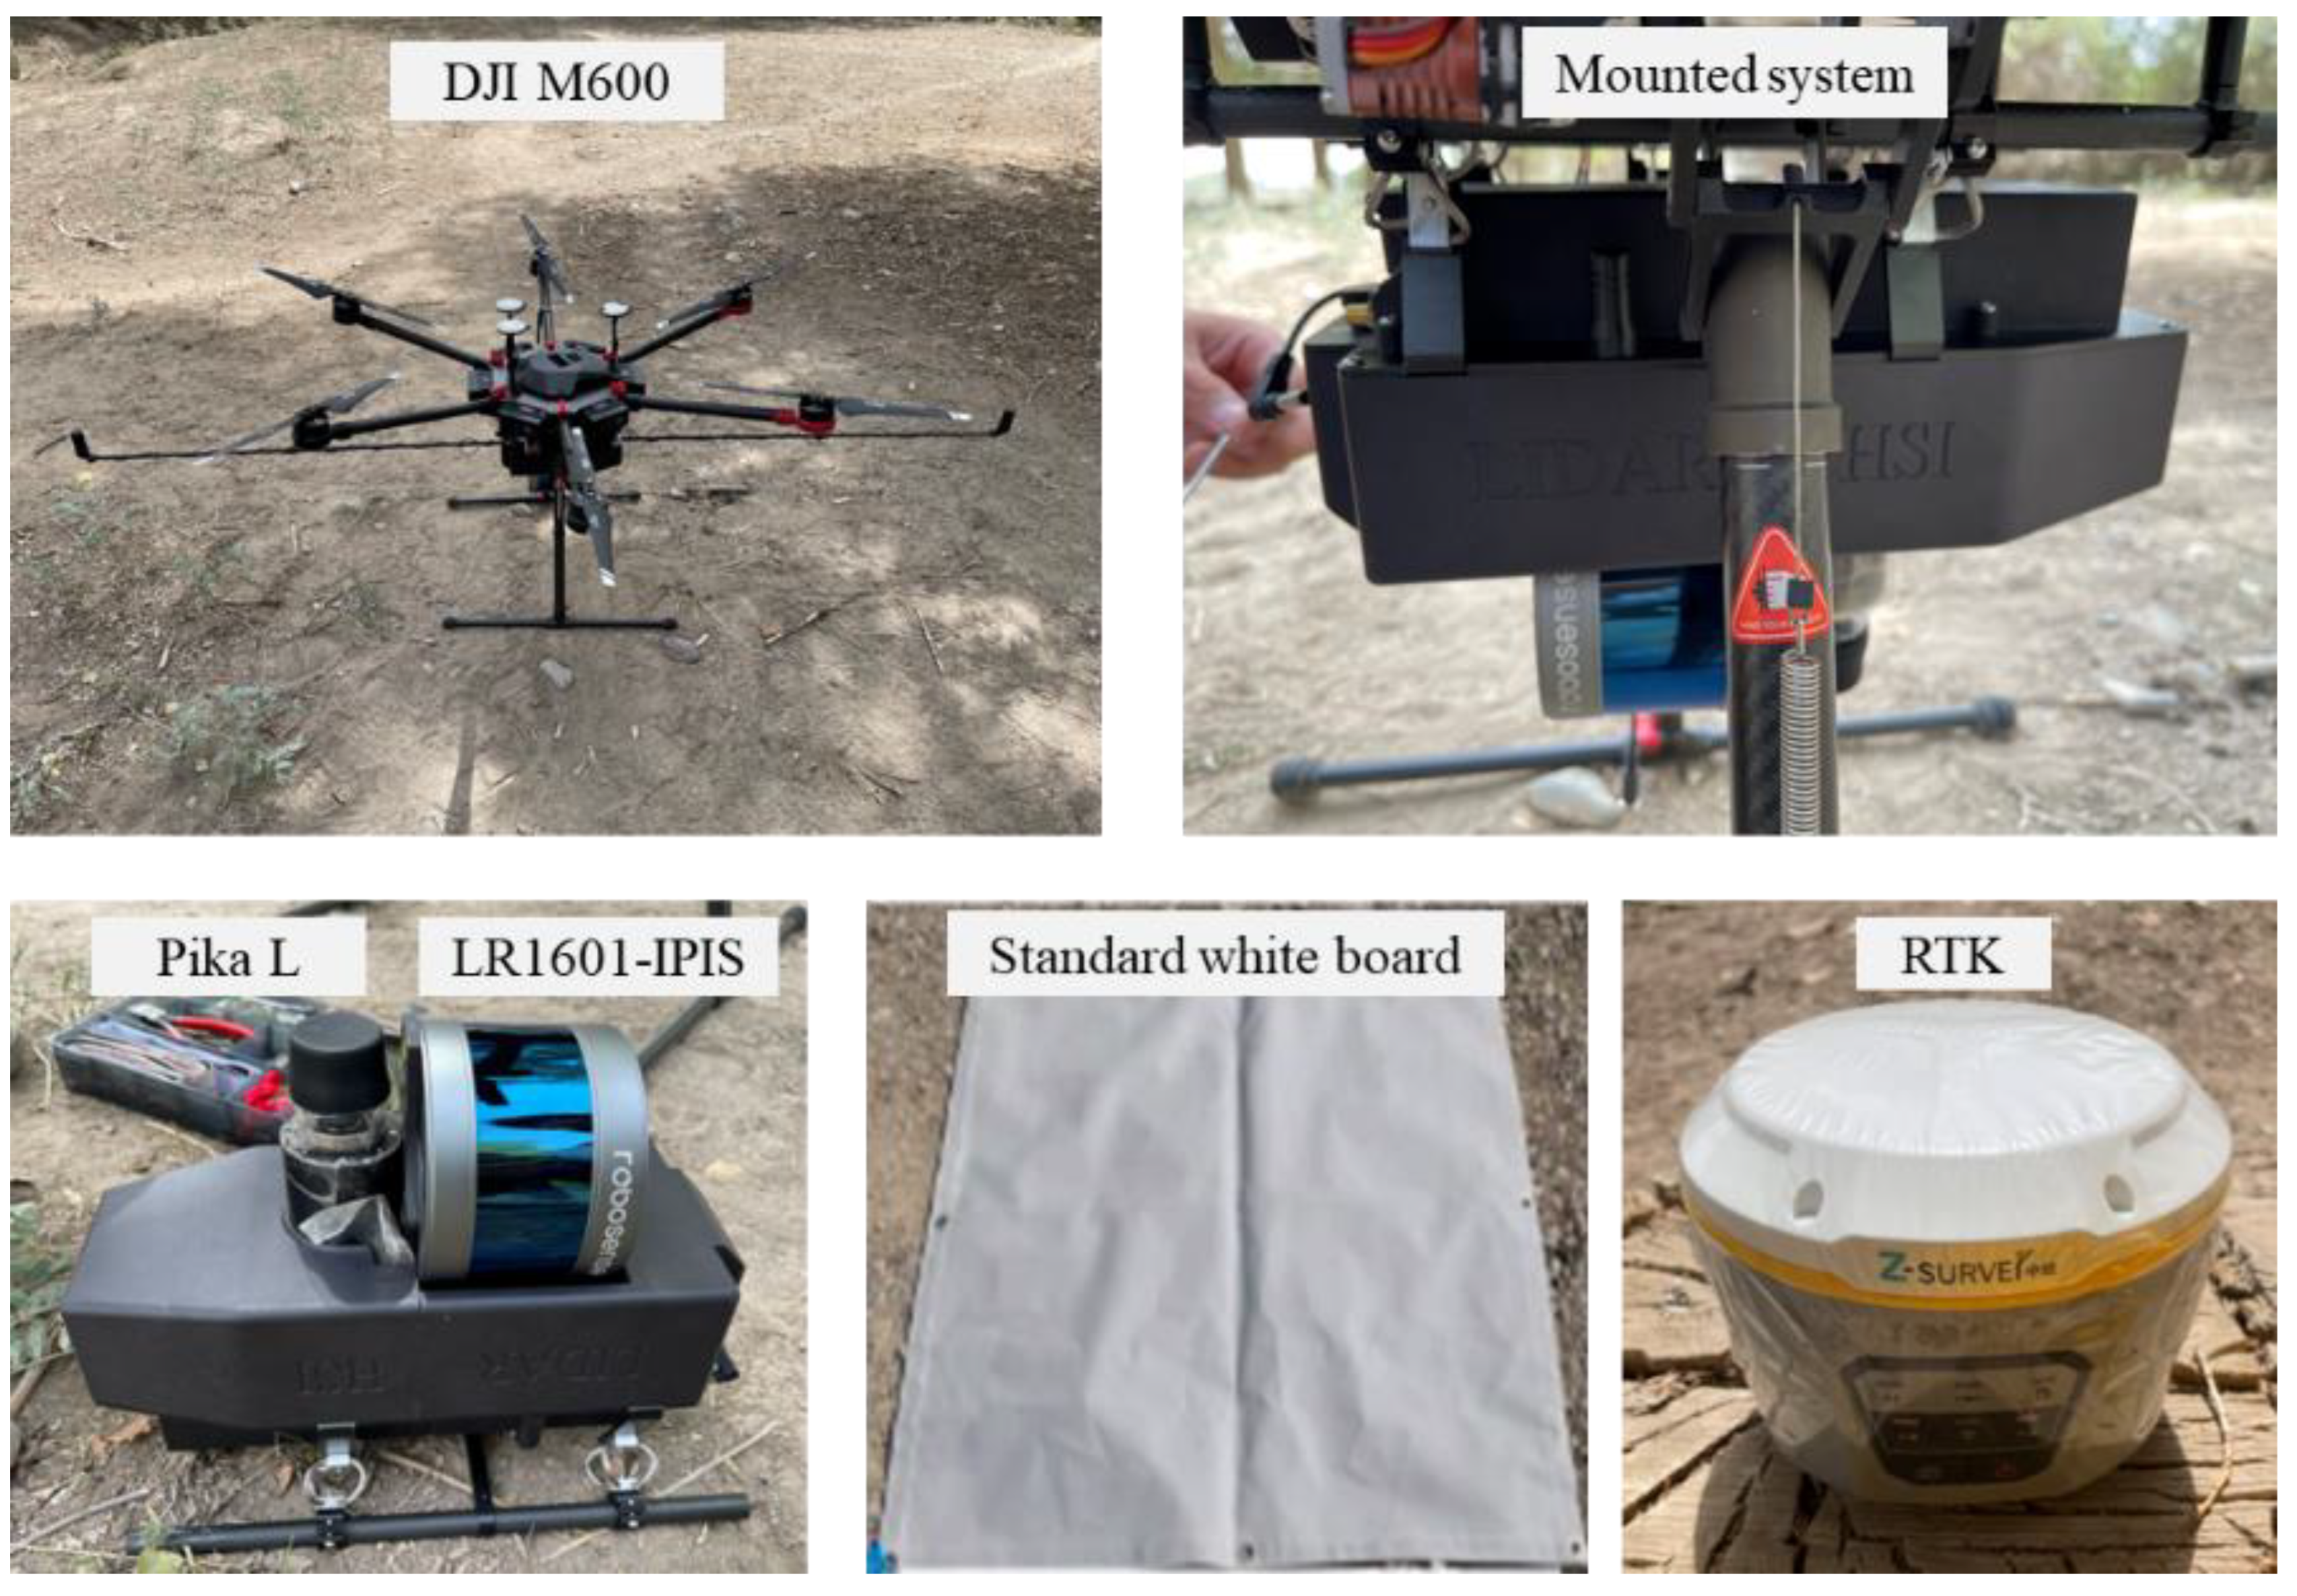
2.4. UAV-Hyperspectral and LiDAR Data Acquisition and Pre-Processing
2.5. Extraction of Hyperspectral and LiDAR Features
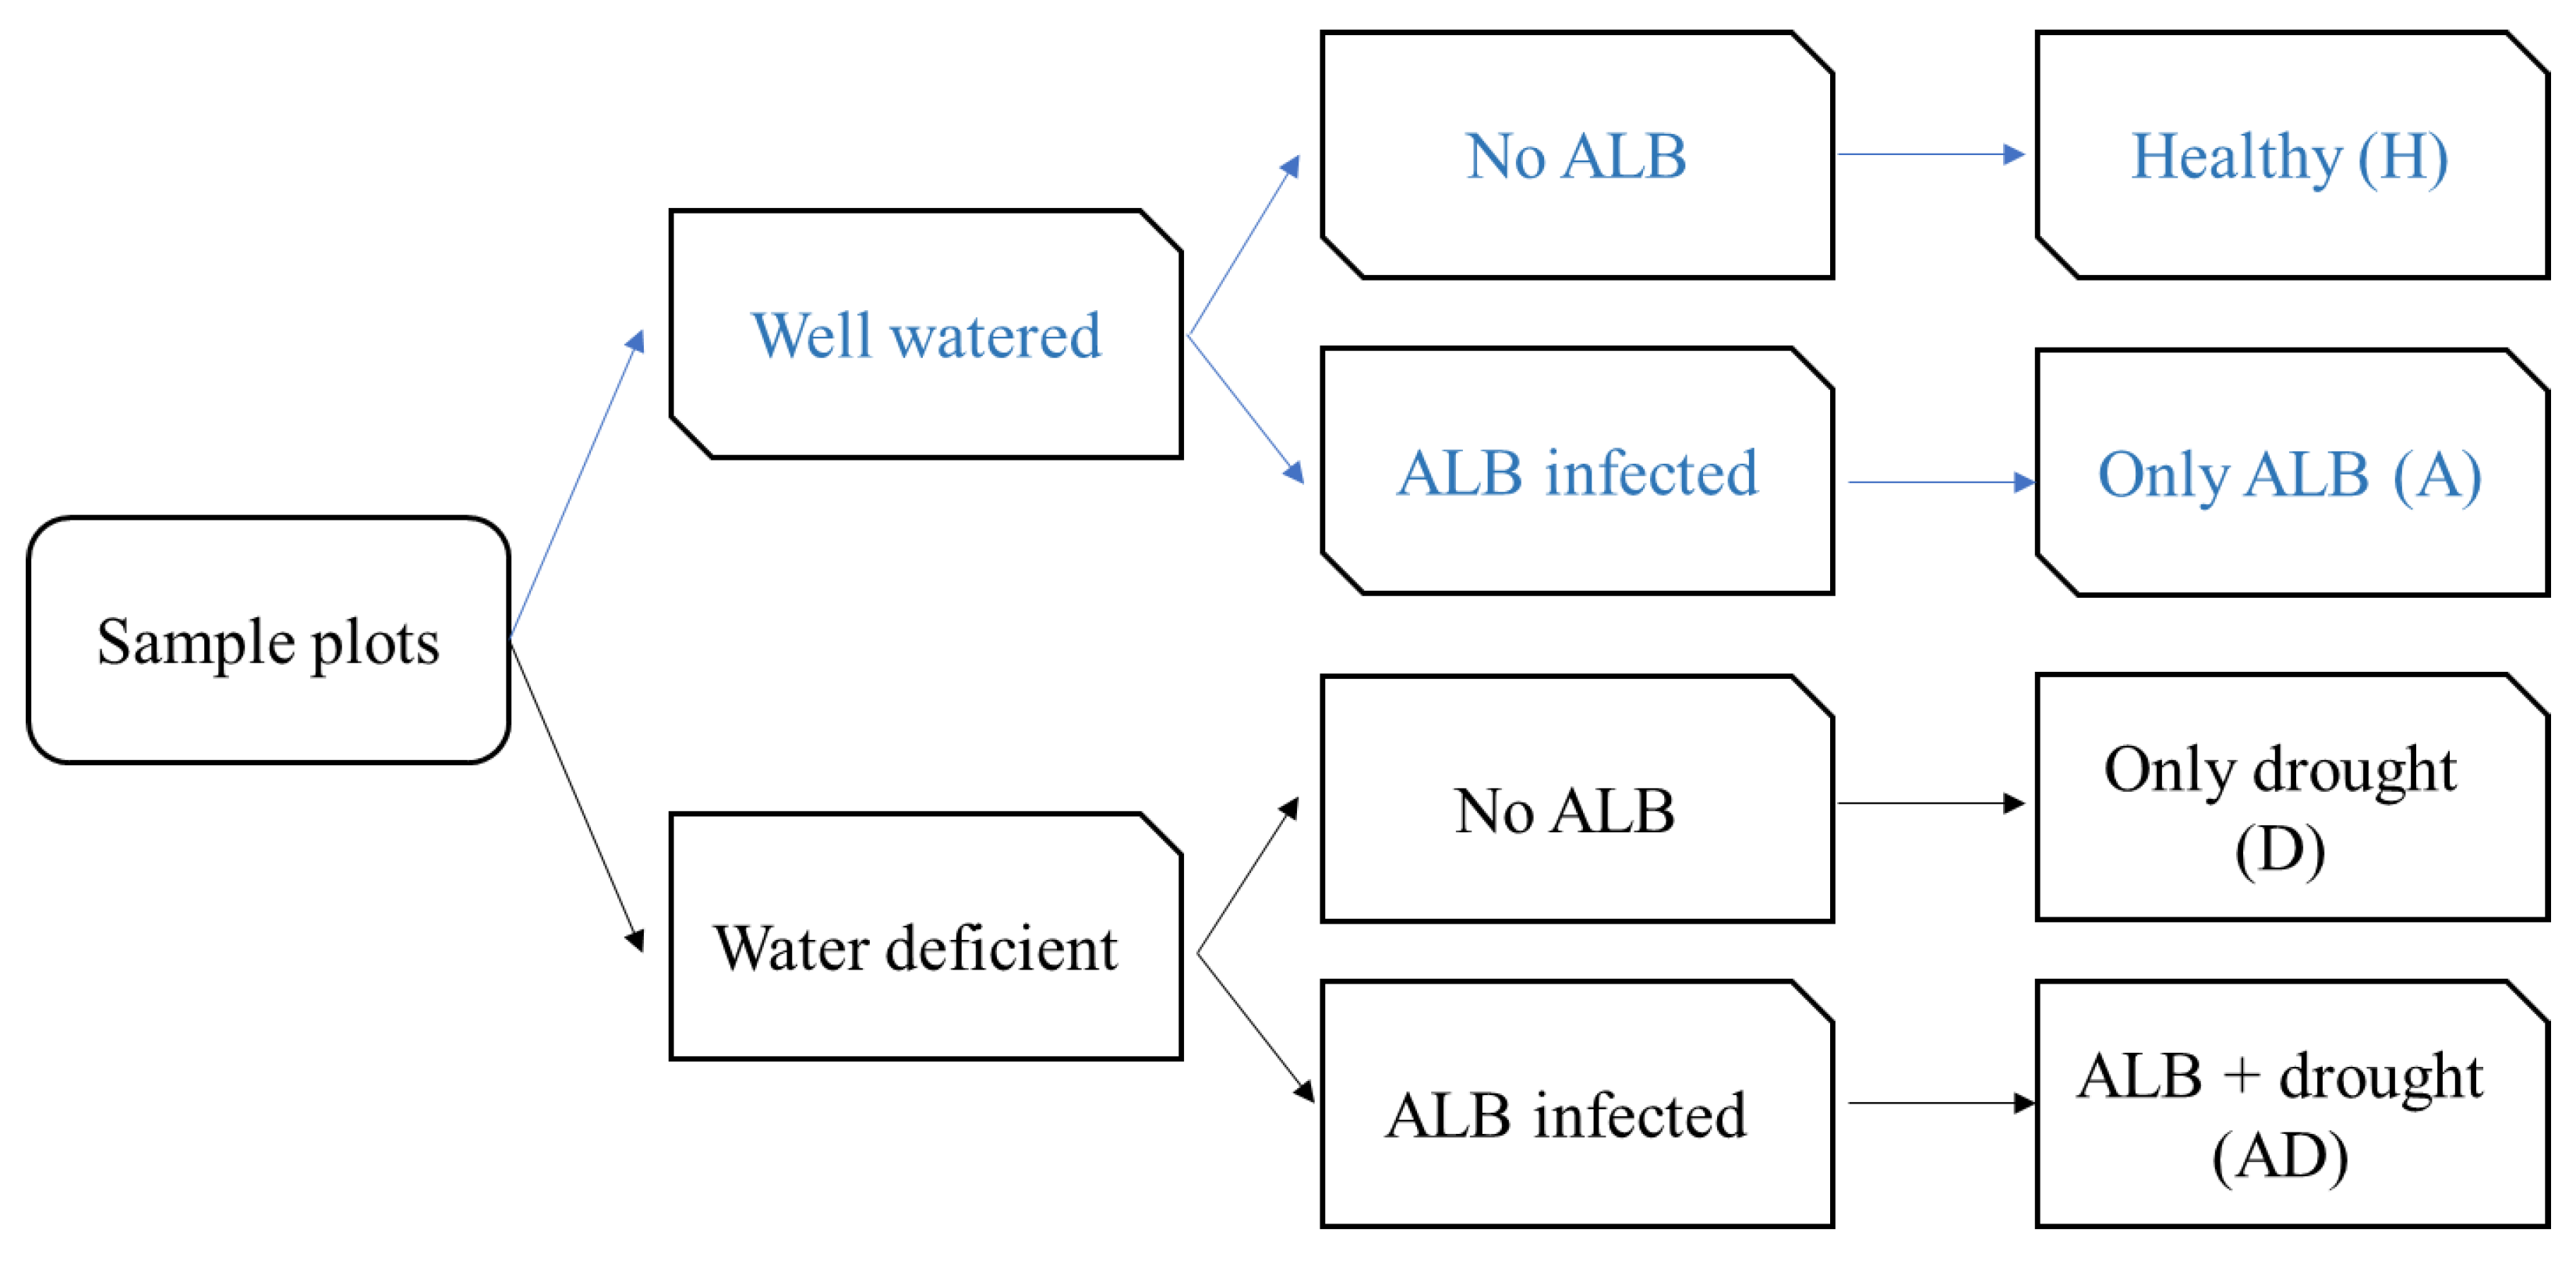
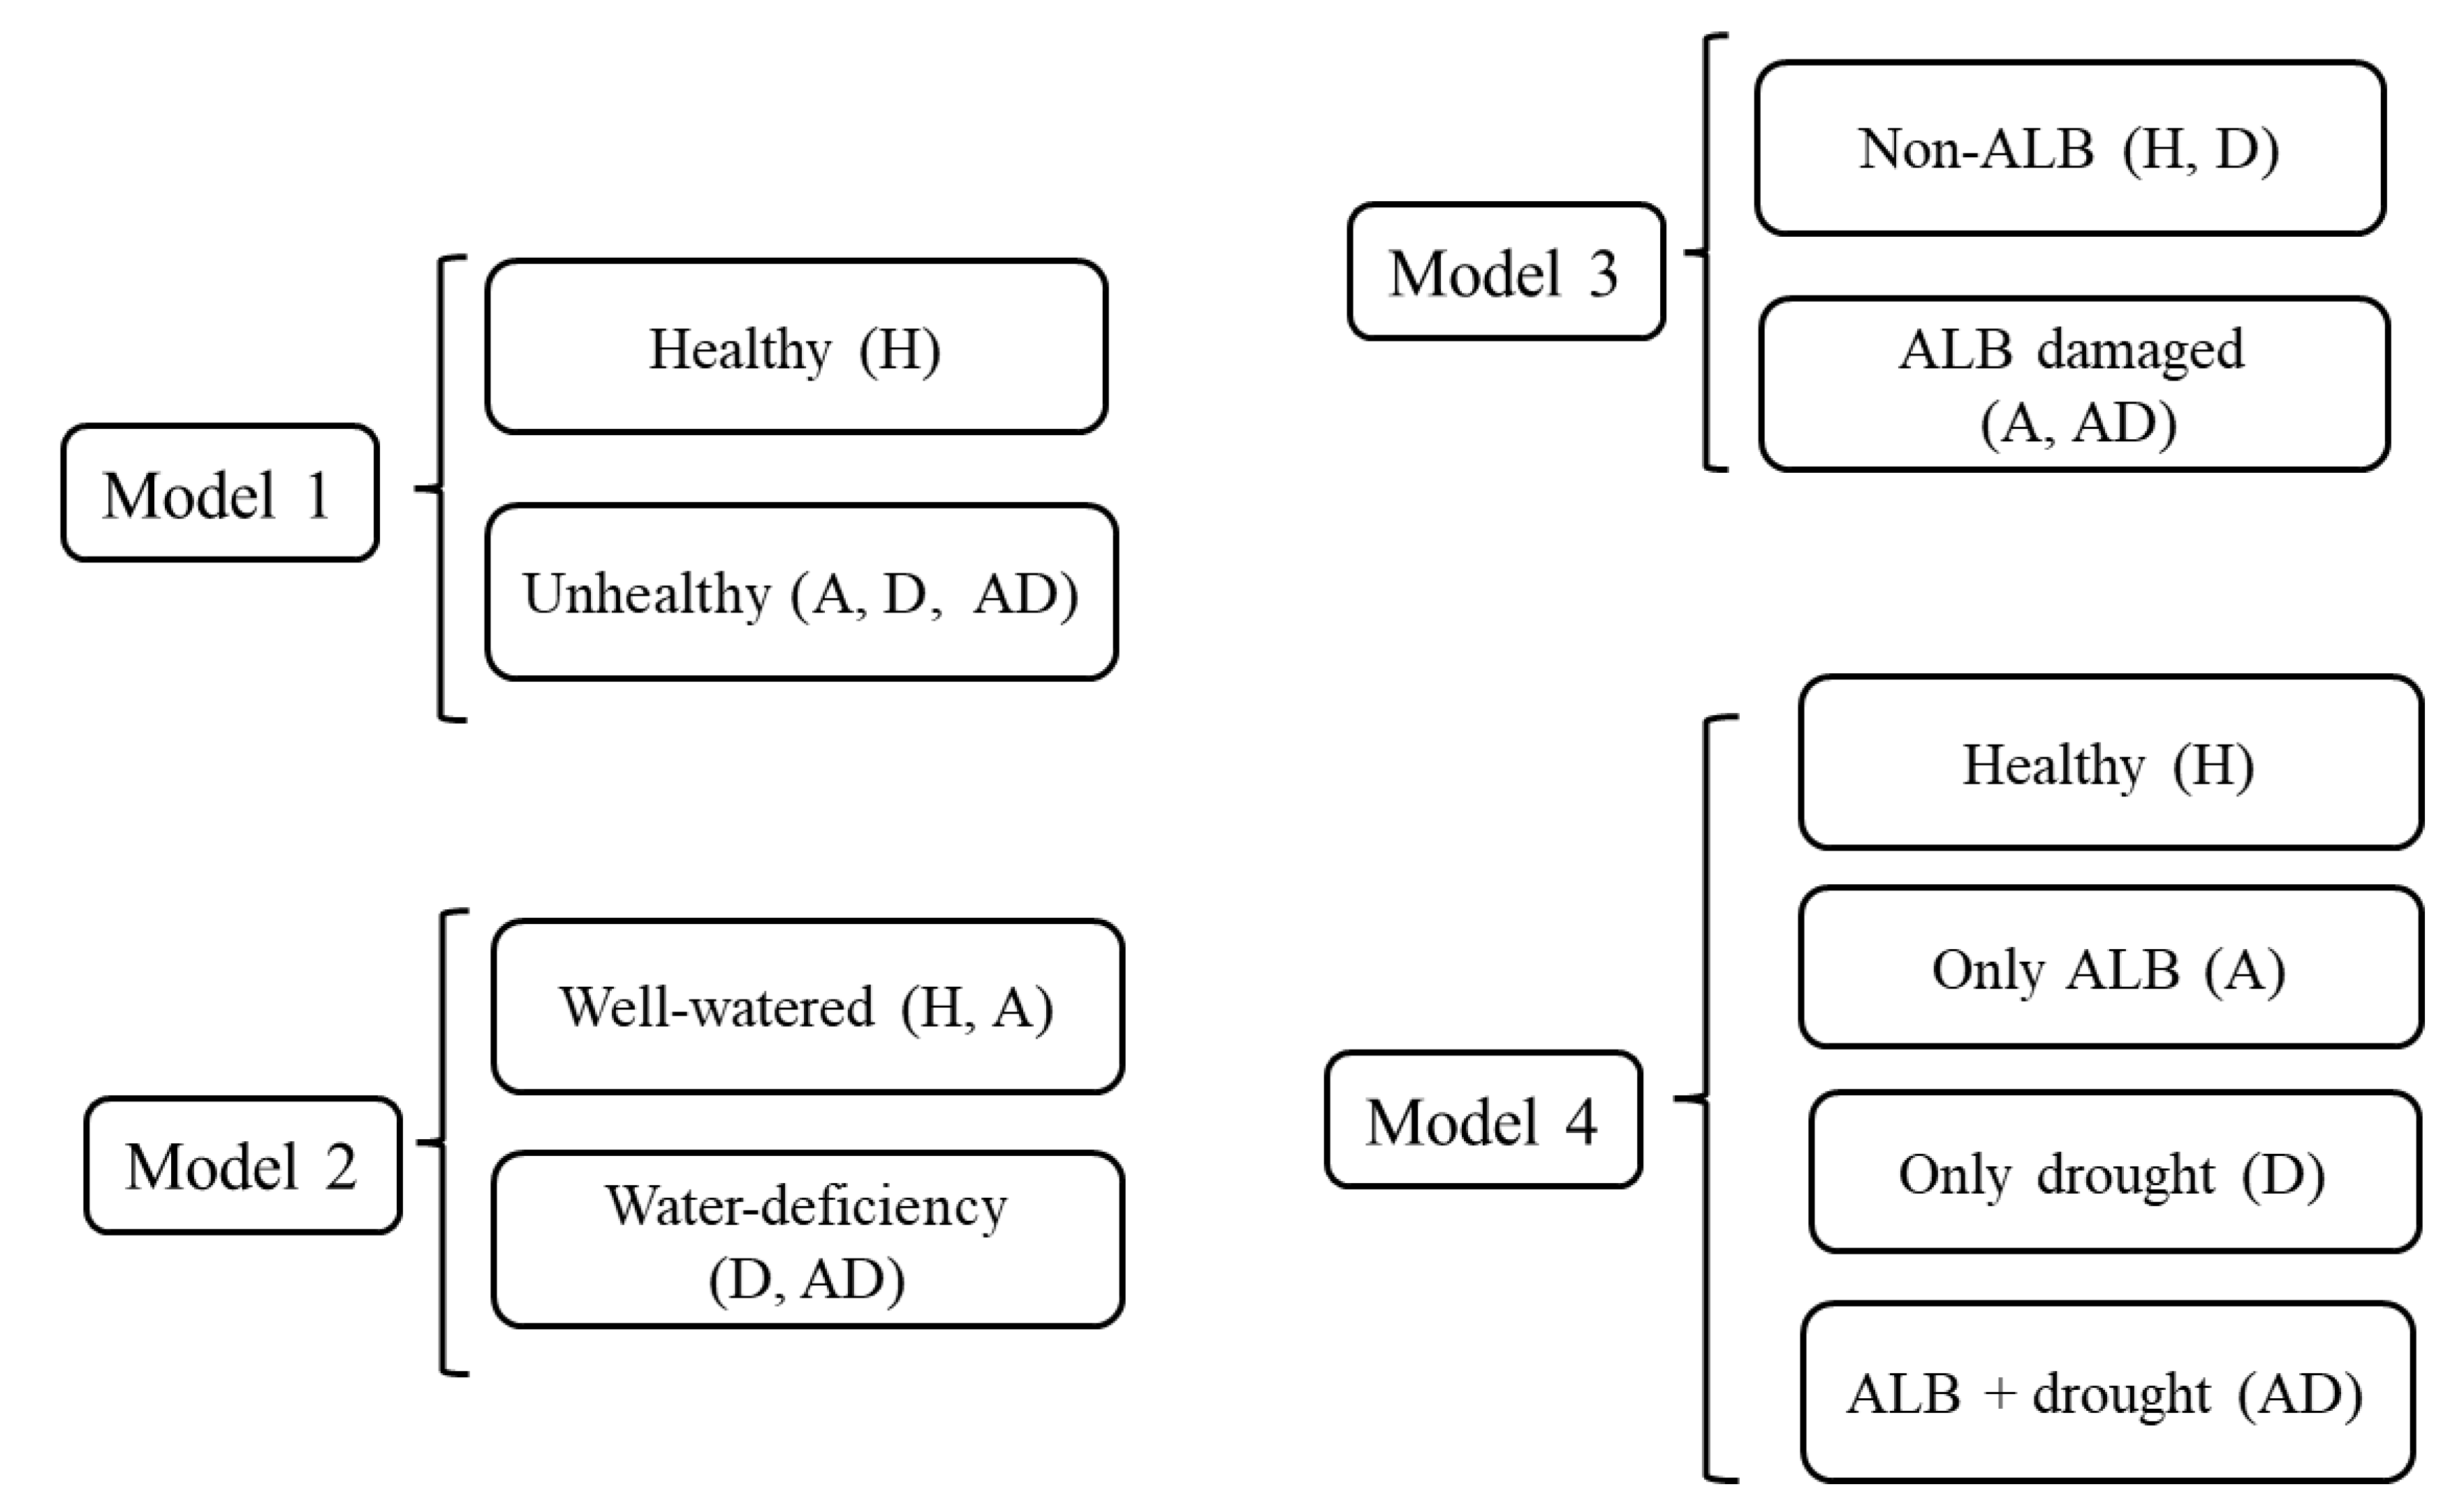
2.6. PLS-SVM Model and Classification
- Model 1: Is the poplar under stress?
- Model 2: Is the poplar under drought?
- Model 3: Is the poplar under ALB stress?
- Model 4: Is the poplar healthy, under ALB stress, drought stress, or combined stress of drought and ALB?
3. Results
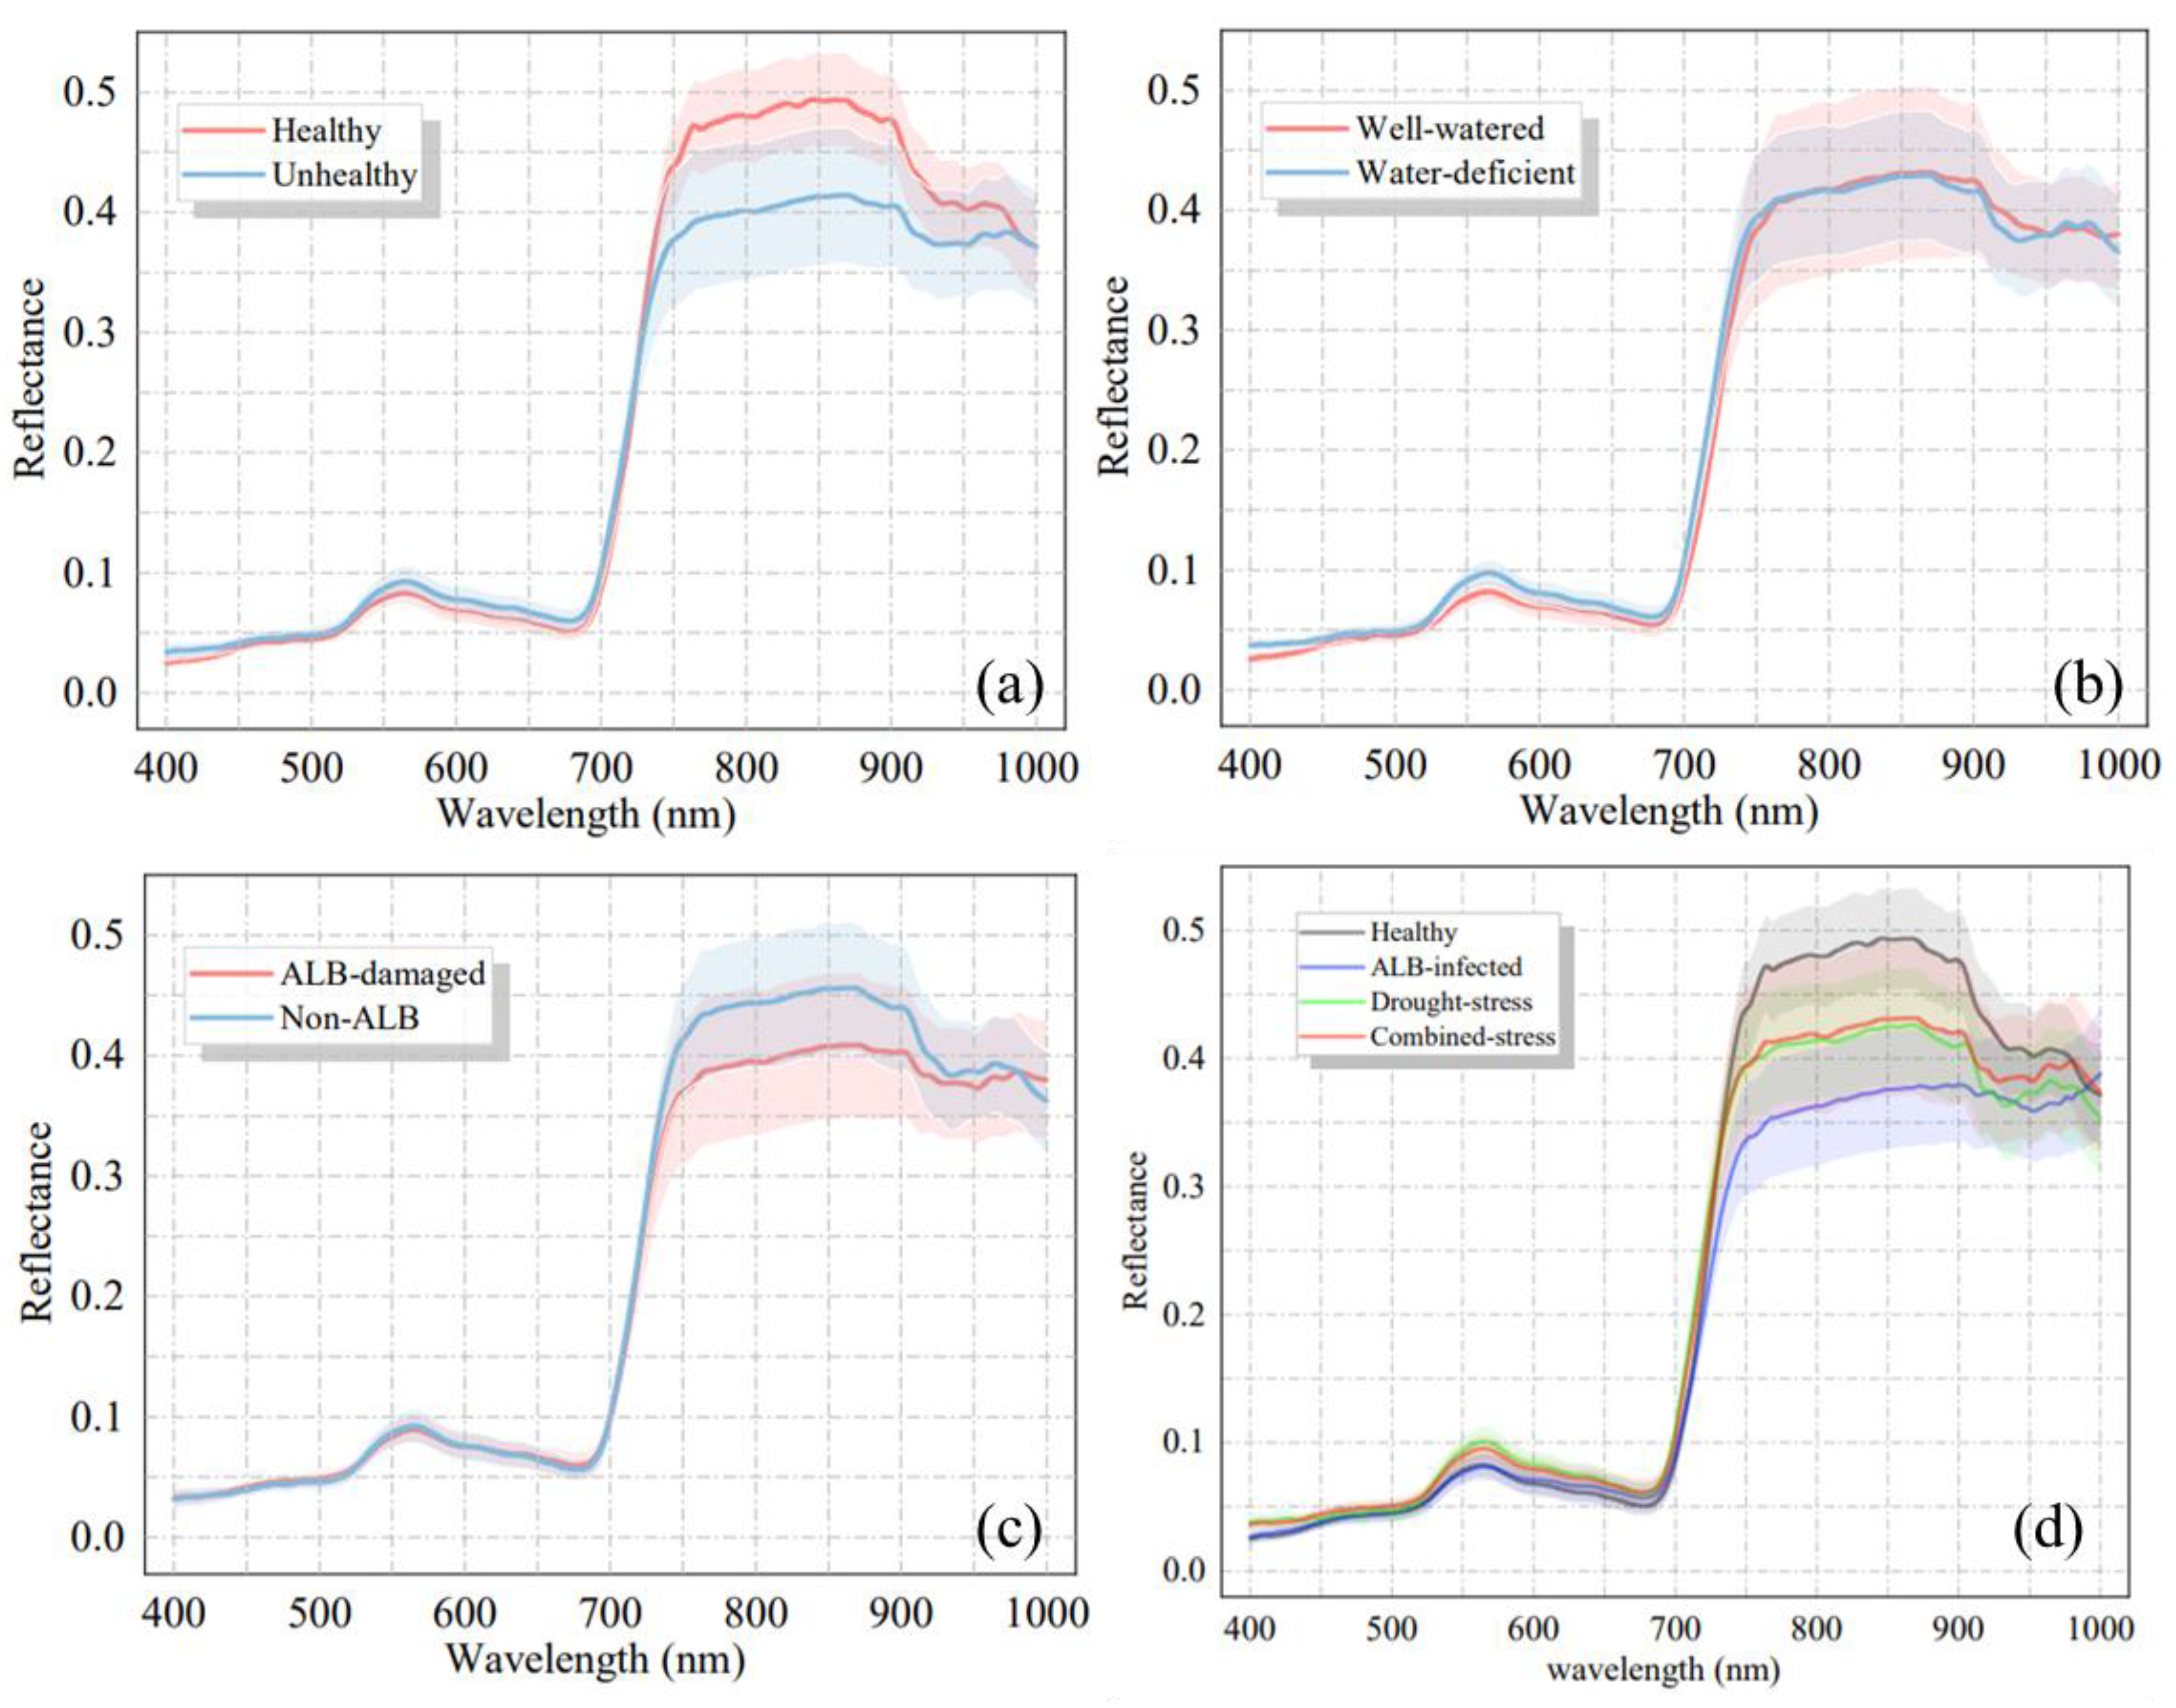
3.1. Signatures of ALB and Drought Stress
3.2. Classification Accuracy
4. Discussion
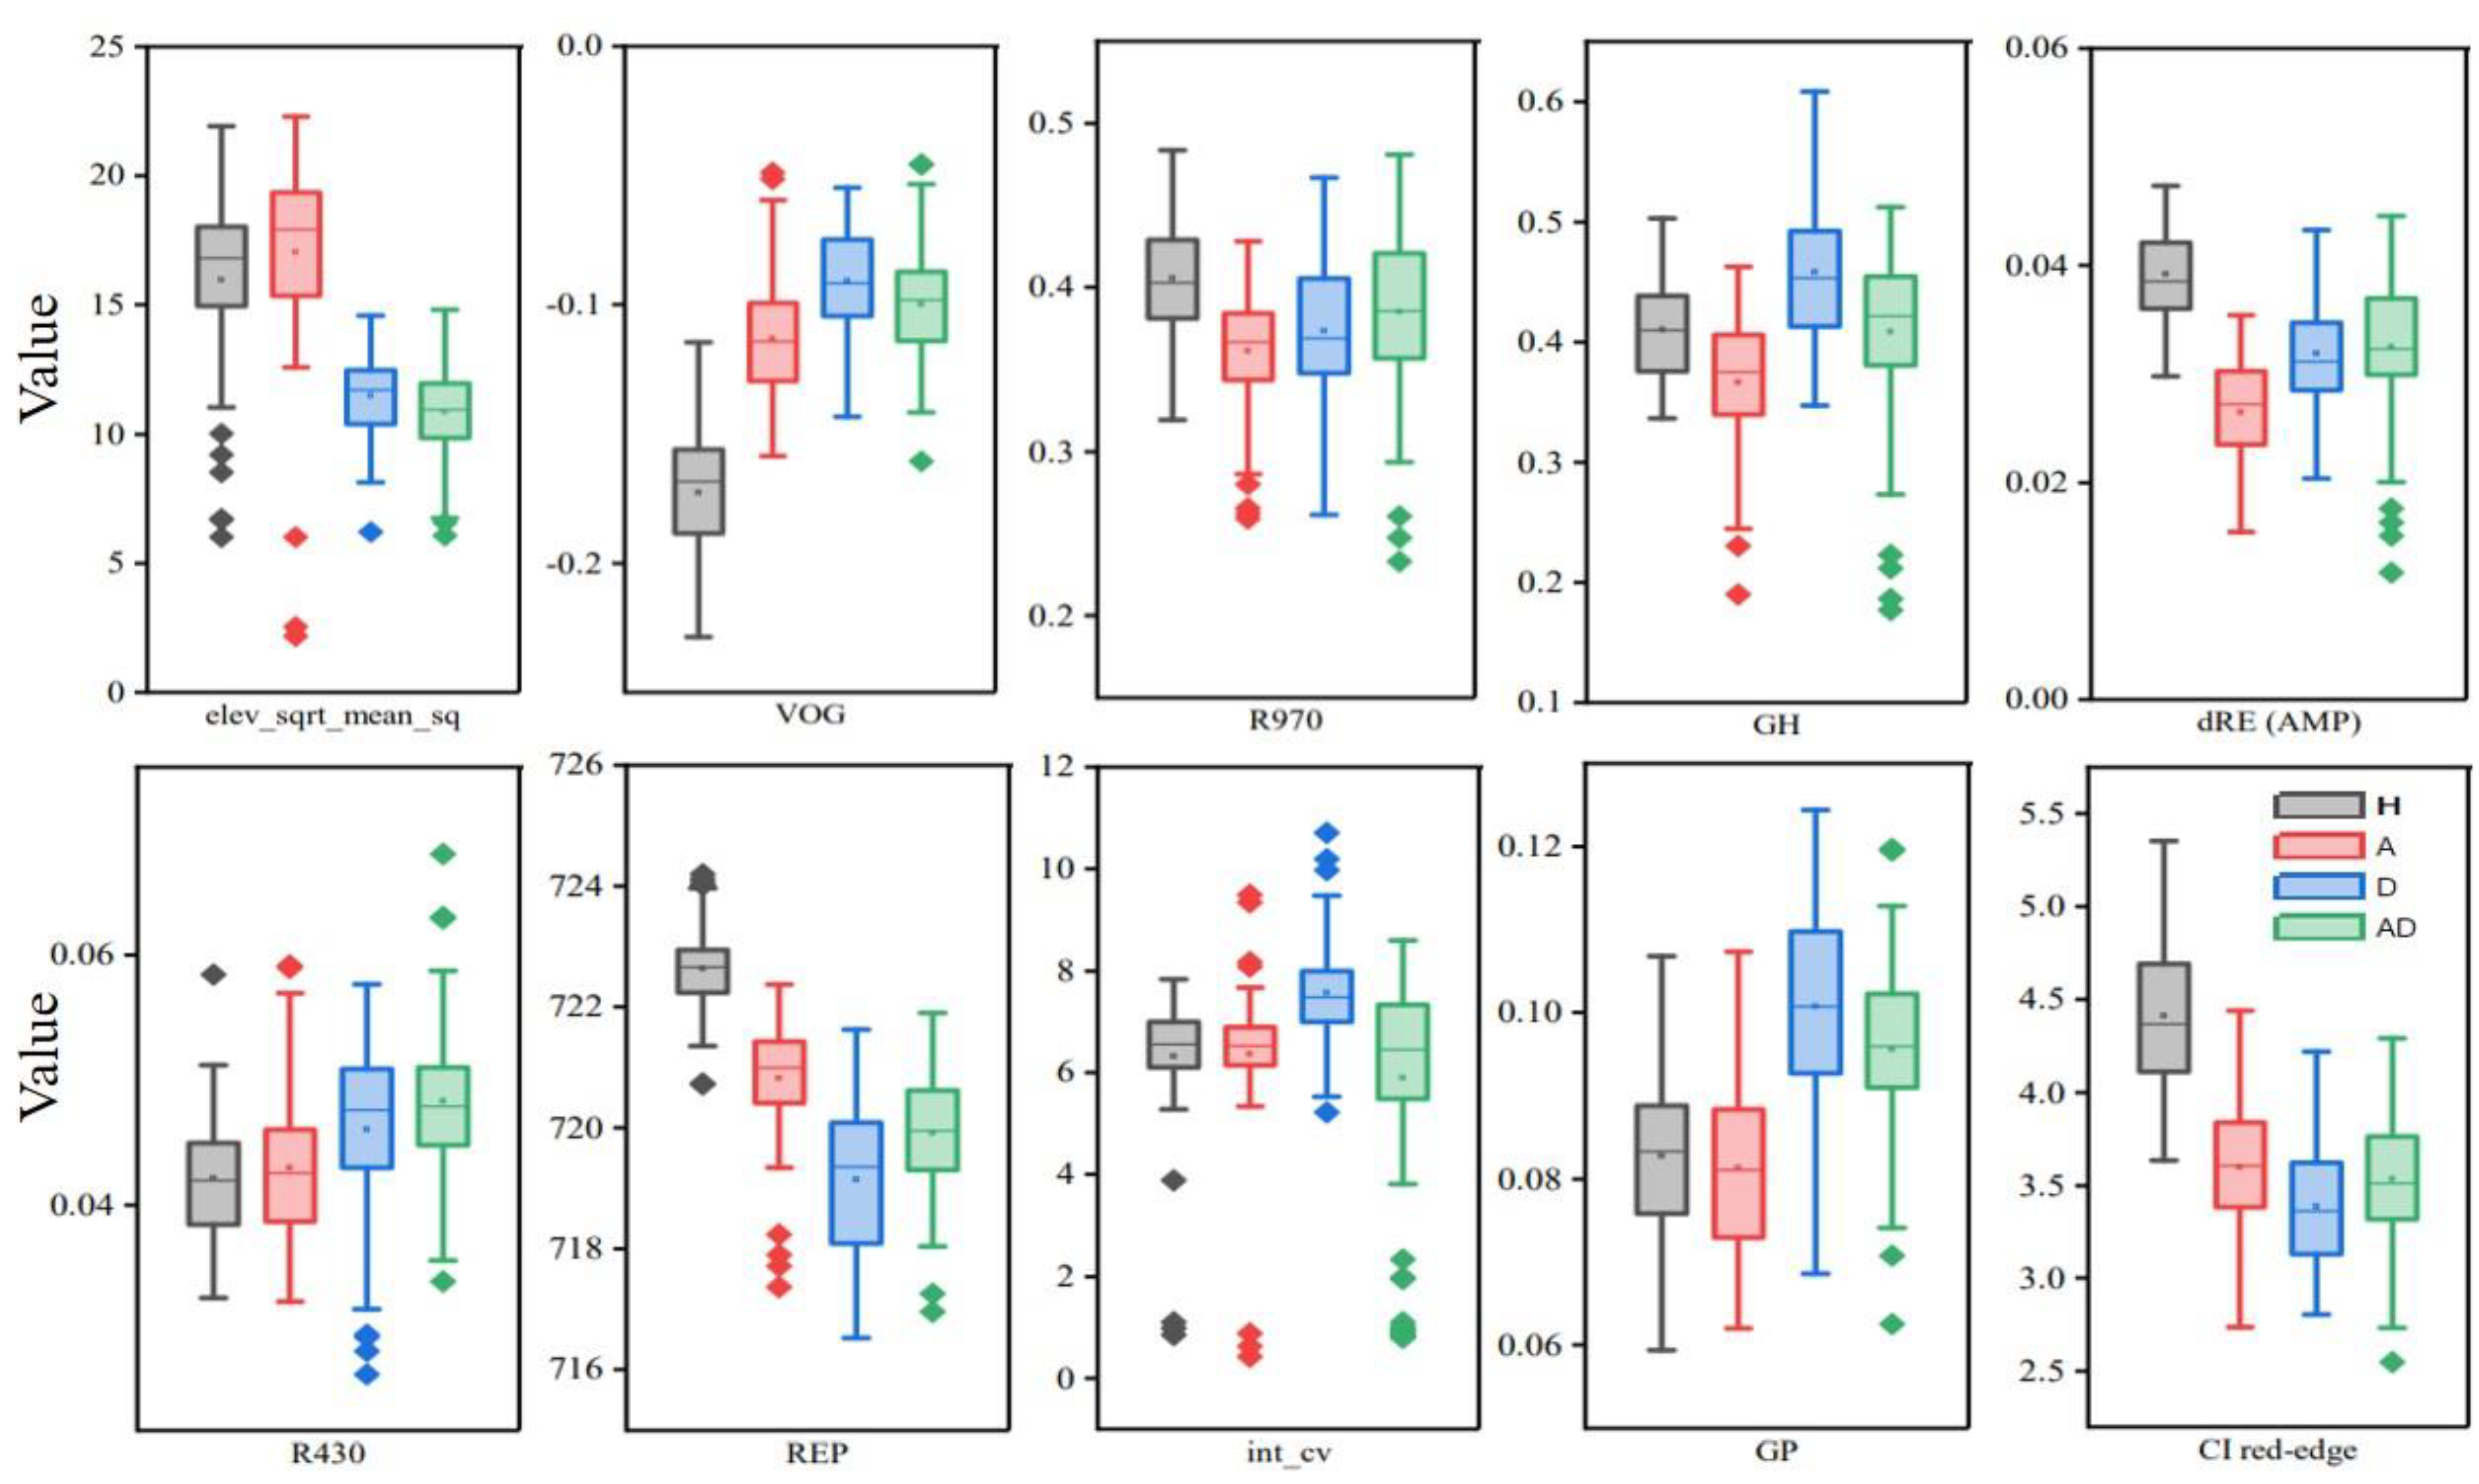
4.1. Optimal Variables for Classification
4.2. Discrimination Performance for Biotic and Abiotic Stress
4.3. Selecting Variables Based on ALB Damage Characteristics
5. Conclusions
Author Contributions
Funding
Data Availability Statement
Conflicts of Interest
References
- Pedlar, J.H.; McKenney, D.W.; Yemshanov, D.; Hope, E.S. Potential Economic Impacts of the Asian Longhorned Beetle (Coleoptera: Cerambycidae) in Eastern Canada. J. Econ. Entomol. 2020, 113, 839–850. [Google Scholar] [CrossRef] [PubMed]
- Haack, R.A.; Law, K.R.; Mastro, V.C.; Ossenbruggen, H.S.; Raimo, B.J. New York’s battle with the Asian long-horned beetle. J. For. 1997, 95, 11–15. [Google Scholar] [CrossRef]
- Colautti, R.I.; Bailey, S.A.; VanOverdijk, C.D.; Amundsen, K.; MacIsaac, H.J. Characterised and projected costs of nonindigenous species in Canada. Biol. Invasions 2006, 8, 45–59. [Google Scholar] [CrossRef]
- Nowak, D.J.; Pasek, J.E.; Sequeira, R.A.; Crane, D.E.; Mastro, V.C. Potential effect of Anoplophora glabripennis (Coleoptera: Cerambycidae) on urban trees in the United States. J. Econ. Entomol. 2001, 94, 116–122. [Google Scholar] [CrossRef]
- Javal, M.; Roques, A.; Haran, J.; Hérard, F.; Keena, M.; Roux, G. Complex invasion history of the Asian longhorned beetle: Fifteen years after first detection in Europe. J. Pest Sci. 2017, 92, 173–187. [Google Scholar] [CrossRef]
- Hu, J.; Angeli, S.; Schuetz, S.; Luo, Y.; Hajek, A.E. Ecology and management of exotic and endemic Asian longhorned beetle Anoplophora glabripennis. Agric. For. Entomol. 2009, 11, 359–375. [Google Scholar] [CrossRef]
- Jin, Y.J.; Li, J.Q.; Li, J.G.; Luo, Y.Q.; Teale, S.A. Olfactory response of Anoplophora glabripennis to volatile compounds from ash-leaf maple (Acer negundo) under drought stress. Sci. Silvae Sin. 2004, 40, 99–105. (In Chinese) [Google Scholar]
- Adachi, I. Development and life cycle of Anoplophora malasiaca (Thomson) (Coleoptera: Cerambycidae) on citrus trees under fluctuating and constant temperature regimes. Appl. Entomol. Zool. 1994, 29, 485–497. [Google Scholar] [CrossRef]
- Qin, X.X.; Gao, R.T.; Li, J.Z.; Hao, W.Q.; Liu, K.J. A preliminary investigation on the resistance of different clones of poplar to Anoplophora glabripennis (Motsch.). Sci. Silvae Sin. 1985, 21, 310–314. [Google Scholar]
- Haack, R.A.; Hérard, F.; Sun, J.; Turgeon, J.J. Managing invasive populations of Asian longhorned beetle and citrus longhorned beetle: A worldwide perspective. Annu. Rev. Entomol. 2010, 55, 521–546. [Google Scholar] [CrossRef]
- Zhao, X.W.; Li, C.G.; Si, L.; Yuan, K.X.; Tian, Y.L. Building a new system of forest resources inventory by information technology. J. Beijing For. Univ. 2002, 24, 147–155. [Google Scholar]
- Gleason, C.J.; Im, J. A Review of Remote Sensing of Forest Biomass and Biofuel: Options for Small-Area Applications. GIScience Remote Sens. 2011, 48, 141–170. [Google Scholar] [CrossRef]
- Lippitt, C.D.; Stow, D.A.; Riggan, P.J. Application of the remote-sensing communication model to a time-sensitive wildfire remote-sensing system. Int. J. Remote Sens. 2016, 37, 3272–3292. [Google Scholar] [CrossRef]
- Hernández-Clemente, R.; Hornero, A.; Mottus, M.; Penuelas, J.; González-Dugo, V.; Jiménez, J.C.; Suárez, L.; Alonso, L.; Zarco-Tejada, P.J. Early Diagnosis of Vegetation Health from High-Resolution Hyperspectral and Thermal Imagery: Lessons Learned From Empirical Relationships and Radiative Transfer Modelling. Curr. For. Rep. 2019, 5, 169–183. [Google Scholar] [CrossRef]
- Nicotra, A.B.; Hofmann, M.; Siebke, K.; Ball, M.C. Spatial patterning of pigmentation in evergreen leaves in response to freezing stress. Plant Cell Environ. 2003, 26, 1893–1904. [Google Scholar] [CrossRef]
- Bell, T.W.; Cavanaugh, K.C.; Siegel, D.A. Remote monitoring of giant kelp biomass and physiological condition: An evaluation of the potential for the Hyperspectral Infrared Imager (HyspIRI) mission. Remote Sens. Environ. 2015, 167, 218–228. [Google Scholar] [CrossRef]
- Lin, Q.; Huang, H.; Wang, J.; Huang, K.; Liu, Y. Detection of Pine Shoot Beetle (PSB) Stress on Pine Forests at Individual Tree Level using UAV-Based Hyperspectral Imagery and LiDAR. Remote Sens. 2019, 11, 2540. [Google Scholar] [CrossRef]
- Yu, R.; Luo, Y.; Zhou, Q.; Zhang, X.; Ren, L. A machine learning algorithm to detect pine wilt disease using UAV-based hyperspectral imagery and LiDAR data at the tree level. Int. J. Appl. Earth Obs. Geoinf. 2021, 101, 102363. [Google Scholar] [CrossRef]
- Sánchez, A.V.D. Advanced support vector machines and kernel methods. Neurocomputing 2003, 55, 5–20. [Google Scholar] [CrossRef]
- Lv, J.; Dai, L. Application of partial least squares support vector machines (PLS-SVM) in spectroscopy quantitative analysis. In Proceedings of the 6th World Congress on Intelligent Control and Automation, Dalian, China, 21–23 June 2006; Institute of Electrical and Electronics Engineers Inc.: Piscataway, NJ, USA, 2006; pp. 5228–5232. [Google Scholar] [CrossRef]
- Susič, N.; Žibrat, U.; Širca, S.; Strajnar, P.; Razinger, J.; Knapič, M.; Vončina, A.; Urek, G.; Stare, B.G. Discrimination between abiotic and biotic drought stress in tomatoes using hyperspectral imaging. Sens. Actuators B Chem. 2018, 273, 842–852. [Google Scholar] [CrossRef]
- Ramamoorthy, P.; Samiappan, S.; Wubben, M.J.; Brooks, J.P.; Shrestha, A.; Panda, R.M.; Reddy, K.R.; Bheemanahalli, R. Hyperspectral Reflectance and Machine Learning Approaches for the Detection of Drought and Root–Knot Nematode Infestation in Cotton. Remote Sens. 2022, 14, 4021. [Google Scholar] [CrossRef]
- Praprotnik, E.; Vončina, A.; Žigon, P.; Knapič, M.; Susič, N.; Širca, S.; Vodnik, D.; Lenarčič, D.; Lapajne, J.; Žibrat, U.; et al. Early Detection of Wireworm (Coleoptera: Elateridae) Infestation and Drought Stress in Maize Using Hyperspectral Imaging. Agronomy 2023, 13, 178. [Google Scholar] [CrossRef]
- Pantazi, X.E.; Moshou, D.; Oberti, R.; West, J.; Mouazen, A.M.; Bochtis, D. Detection of biotic and abiotic stresses in crops by using hierarchical self-organizing classifiers. Precis. Agric. 2017, 18, 383–393. [Google Scholar] [CrossRef]
- Flax, N.J.; Currey, C.J.; Litvin, A.G.; Schrader, J.A.; Grewell, D.; Graves, W.R. Aesthetic Quality and Strength of Bioplastic Biocontainers at Different Substrate Volumetric Water Contents. HortScience 2018, 53, 483–490. [Google Scholar] [CrossRef]
- Liu, Y.; Liu, R.; Chen, J.; Cheng, X.; Zheng, G. Current status and perspectives of leaf area index retrieval from optical remote sensing data. Geo-Inf. Sci. 2013, 15, 734–743. (In Chinese) [Google Scholar] [CrossRef]
- Qu, Y.; Meng, J.; Wan, H.; Li, Y. Preliminary study on integrated wireless smart terminals for leaf area index measurement. Comput. Electron. Agric. 2016, 129, 56–65. [Google Scholar] [CrossRef]
- Chen, Q.; Baldocchi, D.; Gong, P.; Kelly, M. Isolating Individual Trees in a Savanna Woodland Using Small Footprint LiDAR Data. Remote Sens. Environ. 2006, 72, 923–932. [Google Scholar] [CrossRef]
- Lim, K.; Hopkinson, C.; Treitz, P. Examining the effects of sampling point densities on laser canopy height and density metrics. For. Chron. 2008, 84, 876–885. [Google Scholar] [CrossRef]
- Liu, L.; Coops, N.C.; Aven, N.W.; Pang, Y. Mapping urban tree species using integrated airborne hyperspectral and LiDAR remote sensing data. Remote Sens. Environ. 2017, 200, 170–182. [Google Scholar] [CrossRef]
- Zlonis, E.J.; Deo, R.; Berdeen, J.B. LiDAR and multispectral imagery predict the occurrence of tree cavities suitable for a cavity-nesting duck. Remote Sens. Ecol. Conserv. 2021, 8, 191–207. [Google Scholar] [CrossRef]
- Curran, P.J. Remote sensing of foliar chemistry. Remote Sens. Environ. 1989, 30, 271–278. [Google Scholar] [CrossRef]
- Guyot, G.; Baret, F. Utilisation de la haute resolution spectrale pour suivre l’etat des couverts vegetaux. In Proceedings of the Fourth International Colloquium on Spectral Signatures of Objects in Remote Sensing, ESA, SP-287, Assois, France, 18–22 January 1998; Guyenne, T.D., Hunt, J.J., Eds.; pp. 279–286. [Google Scholar]
- Horler, D.N.H.; Dockray, M.; Barber, J. The red-edge of plant leaf reflectance. Int. J. Remote Sens. 1983, 4, 273–288. [Google Scholar] [CrossRef]
- Wang, H.; Shi, L.; Ma, Y.; Shu, Q.; Liao, J.; Du, T. Research of Damage Monitoring Models and Judgment Rules of Pinus yunnanensis with Tomicus yunnanensis. For. Res. 2018, 31, 53–60. [Google Scholar]
- Tucker, C.J. Red and photographic infrared linear combinations for monitoring vegetation. Remote Sens. Environ. 1979, 8, 127–150. [Google Scholar] [CrossRef]
- Gitelson, A.A.; Kaufman, Y.J.; Merzlyak, M.N. Use of a green channel in remote sensing of global vegetation from EOS-MODIS. Remote Sens. Environ. 1996, 58, 289–298. [Google Scholar] [CrossRef]
- Gamon, J.A.; Peñuelas, J.; Field, C.B. A Narrow-waveband spectral index that tracks diurnal changes in photosynthetic efficiency. Remote Sens. Environ. 1992, 41, 35–44. [Google Scholar] [CrossRef]
- Merzlyak, M.N.; Gitelson, A.A.; Chivkunova, O.B.; Rakitin, V.Y. Non-destructive optical detection of pigment changes during leaf senescence and fruit ripening. Physiol. Plant. 1999, 106, 135–141. [Google Scholar] [CrossRef]
- Jordan, C.F. Derivation of leaf area index from quality of light on the forest floor. Ecology 1969, 50, 663–666. [Google Scholar] [CrossRef]
- Vogelman, J.E.; Rock, B.N.; Moss, D.M. Red-edge spectral measurements from sugar maple leaves. Int. J. Remote Sens. 1993, 14, 1563–1575. [Google Scholar] [CrossRef]
- Carter, G.A. Ratios of leaf reflectance in narrow wavebands as indicator of plant stress. Int. J. Remote Sens. 1994, 15, 697–704. [Google Scholar] [CrossRef]
- Gitelson, A.A.; Merzlyak, M.N.; Chivkunova, O.B. Optical properties and nondestructive estimation of anthocyanin content in plant leaves. Photochem. Photobiol. 2001, 74, 38–45. [Google Scholar] [CrossRef] [PubMed]
- Zhou, X.; Huang, W.; Kong, W.; Ye, H.; Dong, Y.; Casa, R. Assessment of leaf carotenoids content with a new carotenoid index: Development and validation on experimental and model data. Int. J. Appl. Earth Obs. Geoinf. 2017, 57, 24–35. [Google Scholar] [CrossRef]
- Gitelson, A.A.; Viña, A.; Ciganda, V.; Rundquist, D.C.; Arkebauer, T.J. Remote estimation of canopy chlorophyll content in crops. Res. Lett. 2005, 32, L08403. [Google Scholar] [CrossRef]
- Gitelson, A.; Merzlyak, M.N. Spectral reflectance changes associated with autumn senescence of Aesculus hippocastanum L. and Acer platanoides L. leaves. Spectral features and relation to chlorophyll estimation. J. Plant Physiol. 1994, 143, 286–292. [Google Scholar] [CrossRef]
- Smith, R.; Adams, J.; Stephens, D.; Hick, P. Forecasting wheat yield in a Mediterranean-type environment from the NOAA satellite. Aust. J. Agric. Res. 1995, 46, 113–125. [Google Scholar] [CrossRef]
- Jamali-Dolatabad, M.; Sadeghi-Bazargani, H.; Sarbakhsh, P. Predictors of fatal outcomes in pedestrian accidents in Tabriz Metropolis of Iran: Application of PLS-DA method. Traffic Inj. Prev. 2019, 20, 873–879. [Google Scholar] [CrossRef]
- Wang, Z.X.; He, Q.P.; Wang, J. Comparison of variable selection methods for PLS-based soft sensor modeling. J. Process. Control. 2015, 26, 56–72. [Google Scholar] [CrossRef]
- Chong, I.-G.; Jun, C.-H. Performance of some variable selection methods when multicollinearity is present. Chemom. Intell. Lab. Syst. 2005, 78, 103–112. [Google Scholar] [CrossRef]
- Bergstra, J.; Bengio, Y. Random search for hyper-parameter optimization. J. Mach. Learn. Res. 2012, 13, 281–305. [Google Scholar]
- Peter, J.S.; Drake, J.; Medley, P.; Ibeanusi, V. Forest Structural Estimates Derived Using a Practical, Open-Source LiDAR-Processing Workflow. Remote Sens. 2021, 13, 4763. [Google Scholar] [CrossRef]
- Pirotti, F. AAnalysis of Full-Waveform LiDAR Data for Forestry Applications: A Review of Investigations and Methods. iForest-Biogeosciences For. 2011, 4, 100–106. [Google Scholar] [CrossRef]
- Akay, A.E.; Oğuz, H.; Karas, I.R.; Aruga, K. Using LiDAR Technology in Forestry Activities. Environ. Monit. Assess. 2009, 151, 117–125. [Google Scholar] [CrossRef] [PubMed]
- Duarte, A.; Borralho, N.; Cabral, P.; Caetano, M. Recent Advances in Forest Insect Pests and Diseases Monitoring Using UAV-Based Data: A Systematic Review. Forests 2022, 13, 911. [Google Scholar] [CrossRef]
- Yu, R.; Ren, L.L.; Luo, Y.Q. Early detection of pine wilt disease in Pinus tabuliformis in North China using a field portable spectrometer and UAV-based hyperspectral imagery. For. Ecosyst. 2021, 8, 44. [Google Scholar] [CrossRef]
- Shi, Y.; Skidmore, A.K.; Wang, T.; Holzwarth, S.; Heiden, U.; Pinnel, N.; Zhu, X.; Heurich, M. Tree species classification using plant functional traits from LiDAR and hyperspectral data. Int. J. Appl. Earth Obs. Geoinf. 2018, 73, 207–219. [Google Scholar] [CrossRef]
- Goetz, A.F.H.; Vane, G.; Solomon, J.E.; Rock, B.N. Imaging spectrometry for earth remote sensing. Science 1985, 228, 1147–1153. [Google Scholar] [CrossRef]
- Monclus, R.; Dreyer, E.; Villar, M.; Delmotte, F.M.; Delay, D.; Petit, J.; Barbaroux, C.; Le Thiec, D.; Bréchet, C.; Brignolas, F. Impact of drought on productivity and water use efficiency in 29 genotypes of Populus deltoides× Populus nigra. New Phytol. 2005, 169, 765–777. [Google Scholar] [CrossRef] [PubMed]
- Holuša, J.; Hlásny, T.; Modlinger, R.; Lukášová, K.; Kula, E. Felled trap trees as the traditional method for bark beetle control: Can the trapping performance be increased? For. Ecol. Manag. 2017, 404, 165–173. [Google Scholar] [CrossRef]
- Liu, Y.; Zhan, Z.; Ren, L.; Ze, S.; Yu, L.; Jiang, Q.; Luo, Y. Hyperspectral evidence of early-stage pine shoot beetle attack in Yunnan pine. For. Ecol. Manag. 2021, 497, 119505. [Google Scholar] [CrossRef]
- Wang, L.; Li, C.; Luo, Y.; Wang, G.; Dou, Z.; Haq, I.U.; Shang, S.; Cui, M. Current and future control of the wood-boring pest Anoplophora glabripennis. Insect Sci. 2023, 30, 1534–1551. [Google Scholar] [CrossRef]
- Li, Y.; Su, Y.; Hu, T.; Xu, G.; Guo, Q. Retrieving 2-D leaf angle distributions for deciduous trees from terrestrial laser scanner data. IEEE Trans. Geosci. Remote Sens. 2018, 56, 4945–4955. [Google Scholar] [CrossRef]
- Junttila, S.; Holopainen, M.; Vastaranta, M.; Lyytikäinen-Saarenmaa, P.; Kaartinen, H.; Hyyppä, J.; Hyyppä, H. The potential of dual-wavelength terrestrial lidar in early detection of Ips typographus (L.) infestation—Leaf water content as a proxy. Remote Sens. Environ. 2019, 231, 111–264. [Google Scholar] [CrossRef]
- Leuzinger, S.; Zotz, G.; Asshoff, R.; Körner, C. Responses of deciduous forest trees to severe drought in Central Europe. Tree Physiol. 2005, 25, 641–650. [Google Scholar] [CrossRef] [PubMed]
- Tan, S.; Sha, Y.; Sun, L.; Li, Z. Abiotic Stress-Induced Leaf Senescence: Regulatory Mechanisms and Application. Int. J. Mol. Sci. 2023, 24, 11996. [Google Scholar] [CrossRef]
- Gao, R.; Qin, X.; Chen, D.; Chen, W. A study on the damage to poplar caused by Anoplophora glabripennis. For. Res. 1993, 6, 189–193. [Google Scholar]
- Haack, R.A. Exotic bark- and wood-boring Coleoptera in the United States: Recent establishments and interceptions. Can. J. For. Res. 2006, 36, 269–288. [Google Scholar] [CrossRef]
- Silva, V.S.d.; Silva, C.A.; Mohan, M.; Cardil, A.; Rex, F.E.; Loureiro, G.H.; Almeida, D.R.A.d.; Broadbent, E.N.; Gorgens, E.B.; Dalla Corte, A.P.; et al. Combined impact of sample size and modeling approaches for predicting stem volume in Eucalyptus spp. forest plantations using field and LiDAR data. Remote Sens. 2020, 12, 1438. [Google Scholar] [CrossRef]
- Goodwin, N.R.; Coops, N.C.; Culvenor, D.S. Assessment of forest structure with airborne LiDAR and the effects of environmental stressors. Remote Sens. Environ. 2006, 103, 140–152. [Google Scholar] [CrossRef]
- Zhang, N.; Zhang, X.; Yang, G.; Zhu, C.; Huo, L.; Feng, H. Assessment of defoliation during the Dendrolimus tabulaeformis tsai et liu disaster outbreak using UAV-based hyperspectral images. Remote Sens. Environ. 2018, 217, 323–339. [Google Scholar] [CrossRef]
- Abdullah, H.; Darvishzadeh, R.; Skidmore, A.K.; Groen, T.A.; Heurich, M. European Spruce bark beetle (Ips typographus, L.) green attack affects foliar reflectance and biochemical properties. Int. J. Appl. Earth Obs. Geoinf. 2018, 64, 199–209. [Google Scholar] [CrossRef]


| Sanhe Forest Farm (Water Deficient) | Xincheng Forest Farm (Well Watered) | |||||||
|---|---|---|---|---|---|---|---|---|
| Mean | Stdev | Max | Min | Mean | Stdev | Max | Min | |
| VWC (%) | 17.82 | 3.73 | 25.2 | 11.8 | 61.1 | 7.44 | 67.7 | 49.2 |
| Stress Types | Leaf Area Index |
|---|---|
| Health | 2.463 ± 0.399 |
| ALB | 2.052 ± 0.318 |
| Drought | 2.032 ± 0.280 |
| ALB and drought | 1.842 ± 0.221 |
| Variables Type | Variable | Formula and Description | Reference |
|---|---|---|---|
| Absorption bands | Spectral reflectance at λ nm (Rλ) | λ = 430, 460, 640, 660, 970 | [32] |
| Red edge parameters | Red-edge position linear interpolation (REP_LiA) | 700 + 40 × ((R670 +R780)/2 − R700)/ (R740 − R700) | [33] |
| dRE (AMP) | Max 1st derivative in red edge region | [34] | |
| Reflection and absorption features | Green peak reflectance (Rg) | Rmax (510, 560) | [35] |
| Red valley reflectance (Rr) | Rmax (640, 680) | ||
| Green peak height (GH) | 1 − [R500 + 0.35× (R670 − R500)]/R560 | ||
| Red valley depth (RD) | 1 − R670/[R560+ 0.55 × (R760 − R560)] | ||
| Vegetation indexes (VIs) | Normalized difference vegetation index (NDVI) | (R800 − R670)/(R800 +R670) | [36] |
| Green NDVI (GNDVI) | (R800 − R550)/(R800 +R550) | [37] | |
| Photochemical reflectance index (PRI) | (R570 − R531)/(R531 +R570) | [38] | |
| Plant senescing reflectance index (PSRI) | (R680 − R500)/R750 | [39] | |
| Simple ratio index (SR) | R800/R680 | [40] | |
| Vogelmann red edge index (VOG) | (R734 − R747)/(R715 +R726) | [41] | |
| Carter index (CI) | R760/R695 | [42] | |
| Anthocyanin Reflectance Index (ARI) | 1/R550 − 1/R700 | [43] | |
| Carotenoids Index (CARI) | (R720 − R521)/R521 | [44] | |
| Red-edge Chlorophyll Index (CIred-edge) | (R750 + R705)/R705 | [45] | |
| Red Edge Normalized Difference Vegetation Index (RENDVI) | (R750 − R705)/ (R750 + R705) | [46] | |
| Greenness Index (GI) | R554/R677 | [47] |
| Variable Type | Formula or Variable Name | Definition |
|---|---|---|
| Distribution of point-cloud heights | Height_IQ/TH | Interquartile range of height percentile of crown return points (normalized by tree height) |
| Height_P10/TH | 10th height percentile of crown return points (normalized by tree height) | |
| Height_P25/TH | 25th height percentile of crown return points (normalized by tree height) | |
| Height_P50/TH | 50th height percentile of crown return points (normalized by tree height) | |
| Height_P75/TH | 75th height percentile of crown return points (normalized by tree height) | |
| Height_P90/TH | 90th height percentile of crown return points (normalized by tree height) | |
| Height_P99/TH | 99th height percentile of crown return points (normalized by tree height) | |
| elev_aad | Average absolute deviation of elevations of all returns | |
| elev_IQ | Interquartile range of elevations of all returns | |
| elev_kurtosis | kurtosis of elevations of all returns | |
| elev_skewness | Skewness of elevations of all returns | |
| elev_sqrt_mean_sq | Quadratic mean of elevations of all returns | |
| elev_stddev | Standard deviation of elevations of all returns | |
| elev_variance | Variance of elevations of all returns | |
| Density_metrics of all returns | density_metrics [1] | Densities of all returns in 10th interval |
| density_metrics [3] | Densities of all returns in 30th interval | |
| density_metrics [5] | Densities of all returns in 50th interval | |
| density_metrics [7] | Densities of all returns in 70th interval | |
| density_metrics [9] | Densities of all returns in 90th interval | |
| Intensity of point-cloud | int_percentile_25th | 25th percentile of crown return intensity |
| int_percentile_75th | 75th percentile of crown return intensity | |
| int_percentile_90th | 90th percentile of crown return intensity | |
| int_percentile_99th | 99th percentile of crown return intensity | |
| int_aad | Average absolute deviation of intensities of all returns | |
| int_cv | Coefficient of variation of crown return intensity | |
| int_kurtosis | Kurtosis of intensities of all returns | |
| int_max | Maximum intensity of all returns | |
| int_mean | Mean intensity of all returns | |
| int_skewness | Skewness of intensities of all returns | |
| int_variance | Variance of intensities of all returns | |
| int_stddev | Standard deviation of intensities of all returns |
| Model 1 (Healthy/Unhealthy) | Model 2 (Well-Watered/ Water-Deficient) | Model 3 (ALB-Damaged/ Non-ALB) | Model 4 (Health/Only ALB-Infected/Only Water-Deficient/Combined Damages) |
|---|---|---|---|
| VOG | elev_sqrt_mean_sq | R970 | elev_sqrt_mean_sq |
| REP | REP | Height_P99/TH | VOG |
| CI red-edge | GP | int_cv | R970 |
| RENDVI | VOG | VOG | GH |
| CI | elev_stddev | dRE (AMP) | dRE (AMP) |
| dRE (AMP) | R430 | GH | R430 |
| SR | elev_variance | Height_P90/TH | REP |
| GNDVI | CI red-edge | PSRI | int_cv |
| R970 | RENDVI | R430 | GP |
| elev_stddev | GH | GP | CI red-edge |
Disclaimer/Publisher’s Note: The statements, opinions and data contained in all publications are solely those of the individual author(s) and contributor(s) and not of MDPI and/or the editor(s). MDPI and/or the editor(s) disclaim responsibility for any injury to people or property resulting from any ideas, methods, instructions or products referred to in the content. |
© 2024 by the authors. Licensee MDPI, Basel, Switzerland. This article is an open access article distributed under the terms and conditions of the Creative Commons Attribution (CC BY) license (https://creativecommons.org/licenses/by/4.0/).
Share and Cite
Zhou, Q.; Kuang, J.; Yu, L.; Zhang, X.; Ren, L.; Luo, Y. Discriminating between Biotic and Abiotic Stress in Poplar Forests Using Hyperspectral and LiDAR Data. Remote Sens. 2024, 16, 3751. https://doi.org/10.3390/rs16193751
Zhou Q, Kuang J, Yu L, Zhang X, Ren L, Luo Y. Discriminating between Biotic and Abiotic Stress in Poplar Forests Using Hyperspectral and LiDAR Data. Remote Sensing. 2024; 16(19):3751. https://doi.org/10.3390/rs16193751
Chicago/Turabian StyleZhou, Quan, Jinjia Kuang, Linfeng Yu, Xudong Zhang, Lili Ren, and Youqing Luo. 2024. "Discriminating between Biotic and Abiotic Stress in Poplar Forests Using Hyperspectral and LiDAR Data" Remote Sensing 16, no. 19: 3751. https://doi.org/10.3390/rs16193751
APA StyleZhou, Q., Kuang, J., Yu, L., Zhang, X., Ren, L., & Luo, Y. (2024). Discriminating between Biotic and Abiotic Stress in Poplar Forests Using Hyperspectral and LiDAR Data. Remote Sensing, 16(19), 3751. https://doi.org/10.3390/rs16193751