Article

Response of NO 5.3 μm Emission to the Geomagnetic Storm on 24 April 2023

by
Hongshan Liu
1,2,3,
Hong Gao
1,2,*,
Zheng Li
4,
Jiyao Xu
1,2,
Weihua Bai
5,
Longchang Sun
1,2 and
Zhongmu Li
6
1
State Key Laboratory of Space Weather, National Space Science Center, Chinese Academy of Sciences, Beijing 100190, China
2
Key Laboratory of Solar Activity and Space Weather, National Space Science Center, Chinese Academy of Sciences, Beijing 100190, China
3
University of Chinese Academy of Sciences, Beijing 100190, China
4
Institute of Space Weather, Nanjing University of Information Science and Technology, Nanjing 210044, China
5
Beijing Key Laboratory of Space Environment Exploration, National Space Science Center, Chinese Academy of Sciences, Beijing 100190, China
6
Institute of Astronomy and Information, Dali University, Dali 671003, China
*
Author to whom correspondence should be addressed.
Remote Sens. 2024, 16(19), 3683; https://doi.org/10.3390/rs16193683
Submission received: 3 August 2024 / Revised: 28 September 2024 / Accepted: 30 September 2024 / Published: 2 October 2024

Abstract

:
The response of NO emission at 5.3 μm in the thermosphere to the geomagnetic storm on 24 April 2023 is analyzed using TIMED/SABER observations and TIEGCM simulations. Both the observations and the simulations indicate a significant enhancement in NO emission during the storm. Observations show two peaks around 50°S/N in the altitude–latitude distribution of NO emission and its relative variation. Additionally, the peak emission and enhancement are stronger on the nightside compared with the dayside. The peak altitude in the Northern Hemisphere is approximately 2–10 km higher than in the Southern Hemisphere; meanwhile, the peak altitude on the dayside is approximately 2–8 km higher than that on the nightside. Simulations reveal three peaks around 50°S, the equator, and 65°N, with peak altitudes at higher latitudes being slightly lower than those observed. In general, the altitude–latitude distribution structure of the relative variation in simulated NO emission matches observations, with two peaks around 50°S/N. TIEGCM simulations suggest that the increase in NO density and temperature during a geomagnetic storm can lead to an increase in NO emission at most altitudes and latitudes. Furthermore, the significant enhancement around 50°S/N is mainly attributed to the changes in NO density.

1. Introduction

During geomagnetic storms, solar wind induces intense Joule heating and ion drag within the magnetosphere–ionosphere–thermosphere system via enhanced auroral particle precipitation and high-latitude electric fields. This leads to alterations in atmospheric temperatures and compositions, wind fields, and ionospheric electron density in high-latitude regions [1,2]. The substantial energy deposition in the thermosphere leads to strong upwelling, transporting the atmosphere with rich molecules and low atomic oxygen upwards. Simultaneously, changes in the pressure gradient cause a significant enhancement of meridional wind [3]. These alterations further trigger variations in atmospheric composition in other regions through dynamical, thermodynamic, and chemical processes. The energy deposition results in an increase in temperature within the thermosphere, whereas infrared radiation by carbon dioxide (CO2) and nitric oxide (NO) as well as heat conduction are its major cooling mechanisms [4,5,6]. The cooling effect of the emission bands of CO2 at 15 μm is important below 130 km, while the cooling effect of NO emission at 5.3 μm is dominant from about 100 km up to at least 200 km. Therefore, NO emission at 5.3 μm is the dominant cooling mechanism for the thermosphere and is often referred to as the natural thermostat [7,8].
NO emission at 5.3 μm is mainly from inelastic collisions between atomic oxygen and NO. Despite NO being a minor constituent in the mesosphere and lower thermosphere, it is both chemically and radiatively active, because of its low ionization potential, NO also plays a very important role in determining the composition and structure of the ionosphere [5]. NO is produced in the thermosphere through the exothermic reaction between excited-state nitrogen N D 2 and molecular oxygen, as well as the reaction between ground-state atomic nitrogen N S 4 and molecular oxygen [9,10,11,12], as follows.
N D 2 + O 2 N O + O
N S 4 + O 2 N O + O
Reaction (1) is the primary source of NO in the lower thermosphere near the altitude of the NO density peak (~110 km), while Reaction (2) is the main source of NO at higher altitudes above 130 km in the thermosphere. The main sources of excited atomic nitrogen atoms in the lower thermosphere are the dissociative recombination of ionized NO and the reaction between ionized molecular nitrogen and atomic oxygen. The next important source is the photoelectron impact dissociation of molecular nitrogen. During auroral bombardment, auroral secondary electrons are an important source of excited atomic nitrogen. Both the ionization and dissociation of N2 by soft X-rays and auroral particle precipitation can contribute to the generation of NO [9,13,14,15]. During the daytime, solar soft X-rays and extreme ultraviolet play a significant role in the production of NO density, whereas Joule heating and energetic particle precipitation are important at high latitudes. During geomagnetic storms and auroral occurrences, plenty of energetic particles, predominantly electrons, descend into the lower thermosphere, where they disintegrate N2 molecules, leading to the generation of nitrogen in the N D 2 and N S 4 energy states. This can cause a large amount of NO production.
Regarding the loss processes, the principal loss mechanism for NO is its reaction with ground-state atomic nitrogen N S 4 . Furthermore, the reaction of NO with ionized molecular oxygen O 2 + also serves as a destruction mechanism of NO.
N O + N S 4 N 2 + O
N O + O 2 + N O + + O 2
In addition, during the daytime, photodissociation of solar ultraviolet radiation also provides a loss process for NO.
N O + h ν N S 4 + O
It should be noted that only Reaction (3) destroys molecules with odd number N of atoms. Reactions (4) and (5) destroy NO while only recovering Odd-N. However, by photodissociating NO and destroying it through Reaction (5), a ground-state nitrogen atom is produced. This atom can then destroy NO, thereby enhancing the effectiveness of photodissociation in destroying NO and removing Odd-N [16].
Ref. [17] used observations from the SNOE and simulations from the Thermosphere–Ionosphere–Electrodynamics General Circulation Model (TIEGCM) and found that when Joule heating occurred in the auroral zone around 150 km and persisted for several hours, it generated a meridional wind blowing equatorward and a gravity wave propagating equatorward, leading to a noticeable increase in the temperature in the mid- to high-latitude region; within the subsequent 24 h, the increased NO diffused downward from 150 km to around 110 km. Moreover, an enhanced NO concentration could be observed in the equatorial region, with NO being transported downward to 110 km [18].
As previously mentioned, inelastic collisions between atomic oxygen and NO are the primary sources of NO emission at 5.3 μm [4,19,20].
N O + O α 1 N O + O + h ν 5.3 μ m
The rate coefficient α 1 in Equation (6) is closely related to temperature. From Equation (6), it is evident that the response of NO emission to geomagnetic activity is primarily influenced by three factors: NO density, O density, and temperature [7,8,21]. Since NO emission is not only dependent on NO density but also on O density and temperature, the peak altitudes of NO emission and NO density are not completely consistent. According to the study by ref. [22], the peak in NO density occurred around 105 km, whereas the NO emission peaked at approximately 120–130 km.
Based on observations from the Sounding of the Atmosphere using Broadband Emission Radiometry on the Thermosphere–Ionosphere–Mesosphere Energetics and Dynamics satellite (TIMED/SABER), ref. [23] quantitatively assessed the relationship between Joule heating power and global NO radiation cooling power, concluding that the energy loss due to NO emission accounts for over 80% of the Joule heating energy during geomagnetic storm. The studies by refs. [6,24] indicated that, during geomagnetic storms, both the NO density and NO emission intensity in the auroral region significantly increased; moreover, the time required for NO density to return to quiet-time levels was longer than that for thermospheric temperature recovery; additionally, the significant enhancement of NO emission could lead to rapid neutral density recovery, resulting in a phenomenon of post-storm neutral densities being lower than pre-storm levels, due to overcooling during strong geomagnetic storm. Ref. [25] pointed out that during the geomagnetic storm in April 2010, the TIEGCM simulations overestimated the NO cooling power in low-latitude regions and underestimated the NO cooling power in the high-latitude regions compared with the SABER measurements. Ref. [26] reported that the peak altitude of NO emission observed by the SABER was generally higher than that simulated by the TIEGCM, with the difference reaching up to 16 km, and the peak altitude of NO emission also exhibited variations with solar activity and seasonal cycles. Ref. [27] also reported an upward shift in the peak of NO emission in mid-latitude regions during the geomagnetic storm from 7–12 November 2004. However, ref. [15] reported a downward shift in the peak altitude of NO emission during the November 2004 geomagnetic storm.
In this study, we investigate the response of NO emission at 5.3 μm (referred to as NO emission hereinafter) to the geomagnetic storm that occurred on 22–26 April 2023, using observations from the TIMED/SABER satellite and simulations from the TIEGCM. The hemispheric asymmetry of the response as well as the difference between the dayside and nightside are examined. Based on the TIEGCM simulations, we also analyze the possible impact of changes in NO density, O density, and temperature on the response of NO emission to the geomagnetic storm.

2. Data and Model

2.1. TIMED/SABER Satellite Observations

The TIMED satellite was launched in 2001 with an orbital inclination of 74°. The SABER is one of the four payloads onboard the TIMED satellite, began observations in January 2002 and has been operating well since then. The satellite completes approximately 15 orbits per day. The latitude range observed by the SABER spans from 52° in one hemisphere to 83° in the other, with coverage over each hemisphere varying every 60–65 days due to the TIMED satellite’s yaw maneuvers. It takes about 60–65 days for the SABER to achieve full coverage in a 24 h local time period [28]. The SABER is a ten-channel radiometer that measures specially integrated infrared radiance in 10 bands between 1.27 and 15 μm as it scans the limb from the surface of the Earth to approximately 350 km [7]. These infrared emissions play an important role in the studies on the processes in the middle and upper atmosphere; their emission intensities are controlled by the atmospheric temperature and the density of relevant atmospheric components. At the same time, their temporal and spatial distribution is modulated by various atmospheric dynamical processes such as atmospheric gravity waves, tidal waves, and planetary waves. Therefore, the infrared emissions are an important tracer for atmospheric photochemical and dynamical processes. Some atmospheric parameters, including atmospheric temperature and density, and some atmospheric compositions, such as atomic oxygen, atomic hydrogen, CO2, and so on, have been derived from the emissions. Plenty of studies on the energy budget, atmospheric structure, chemical composition distribution, and atmospheric dynamics characteristics in the middle and lower thermosphere have been carried out based on the observed infrared emissions and the derived atmospheric parameters.
In the spectral coverage ranges observed by the SABER, the NO emission at 5.3 μm is encompassed [8,29]. This provides us a chance to study the NO emission. For this study, the SABER version 2.08 data are utilized. During the geomagnetic storm on 22–26 April 2023, the SABER operated in a northward-looking mode, covering latitudes from 52°S to 83°N. The data are initially binned with a sliding window of 10° × 20° latitude–longitude with a step of 1° in both latitude and longitude directions for each day. The VER profiles in each bin are averaged. The zonal mean of these profiles for each latitude is then calculated.

2.2. TIEGCM Simulation

The TIEGCM was developed by the National Center for Atmospheric Research. This model can provide photoionization and photodissociation rates of O, O2, and N2. It also computes comprehensive global distributions encompassing the temperature and wind patterns of neutral gases, the altitude of constant pressure surfaces, as well as the number densities of primary components such as O2, N2, and O, along with minor neutral constituents, including N( D 2 ), N( S 4 ), and NO in the thermosphere. Additionally, it determines the ionospheric structure by providing global distributions of various ion species, including O + , O 2 + , electron density, and temperatures of both ions and electrons.
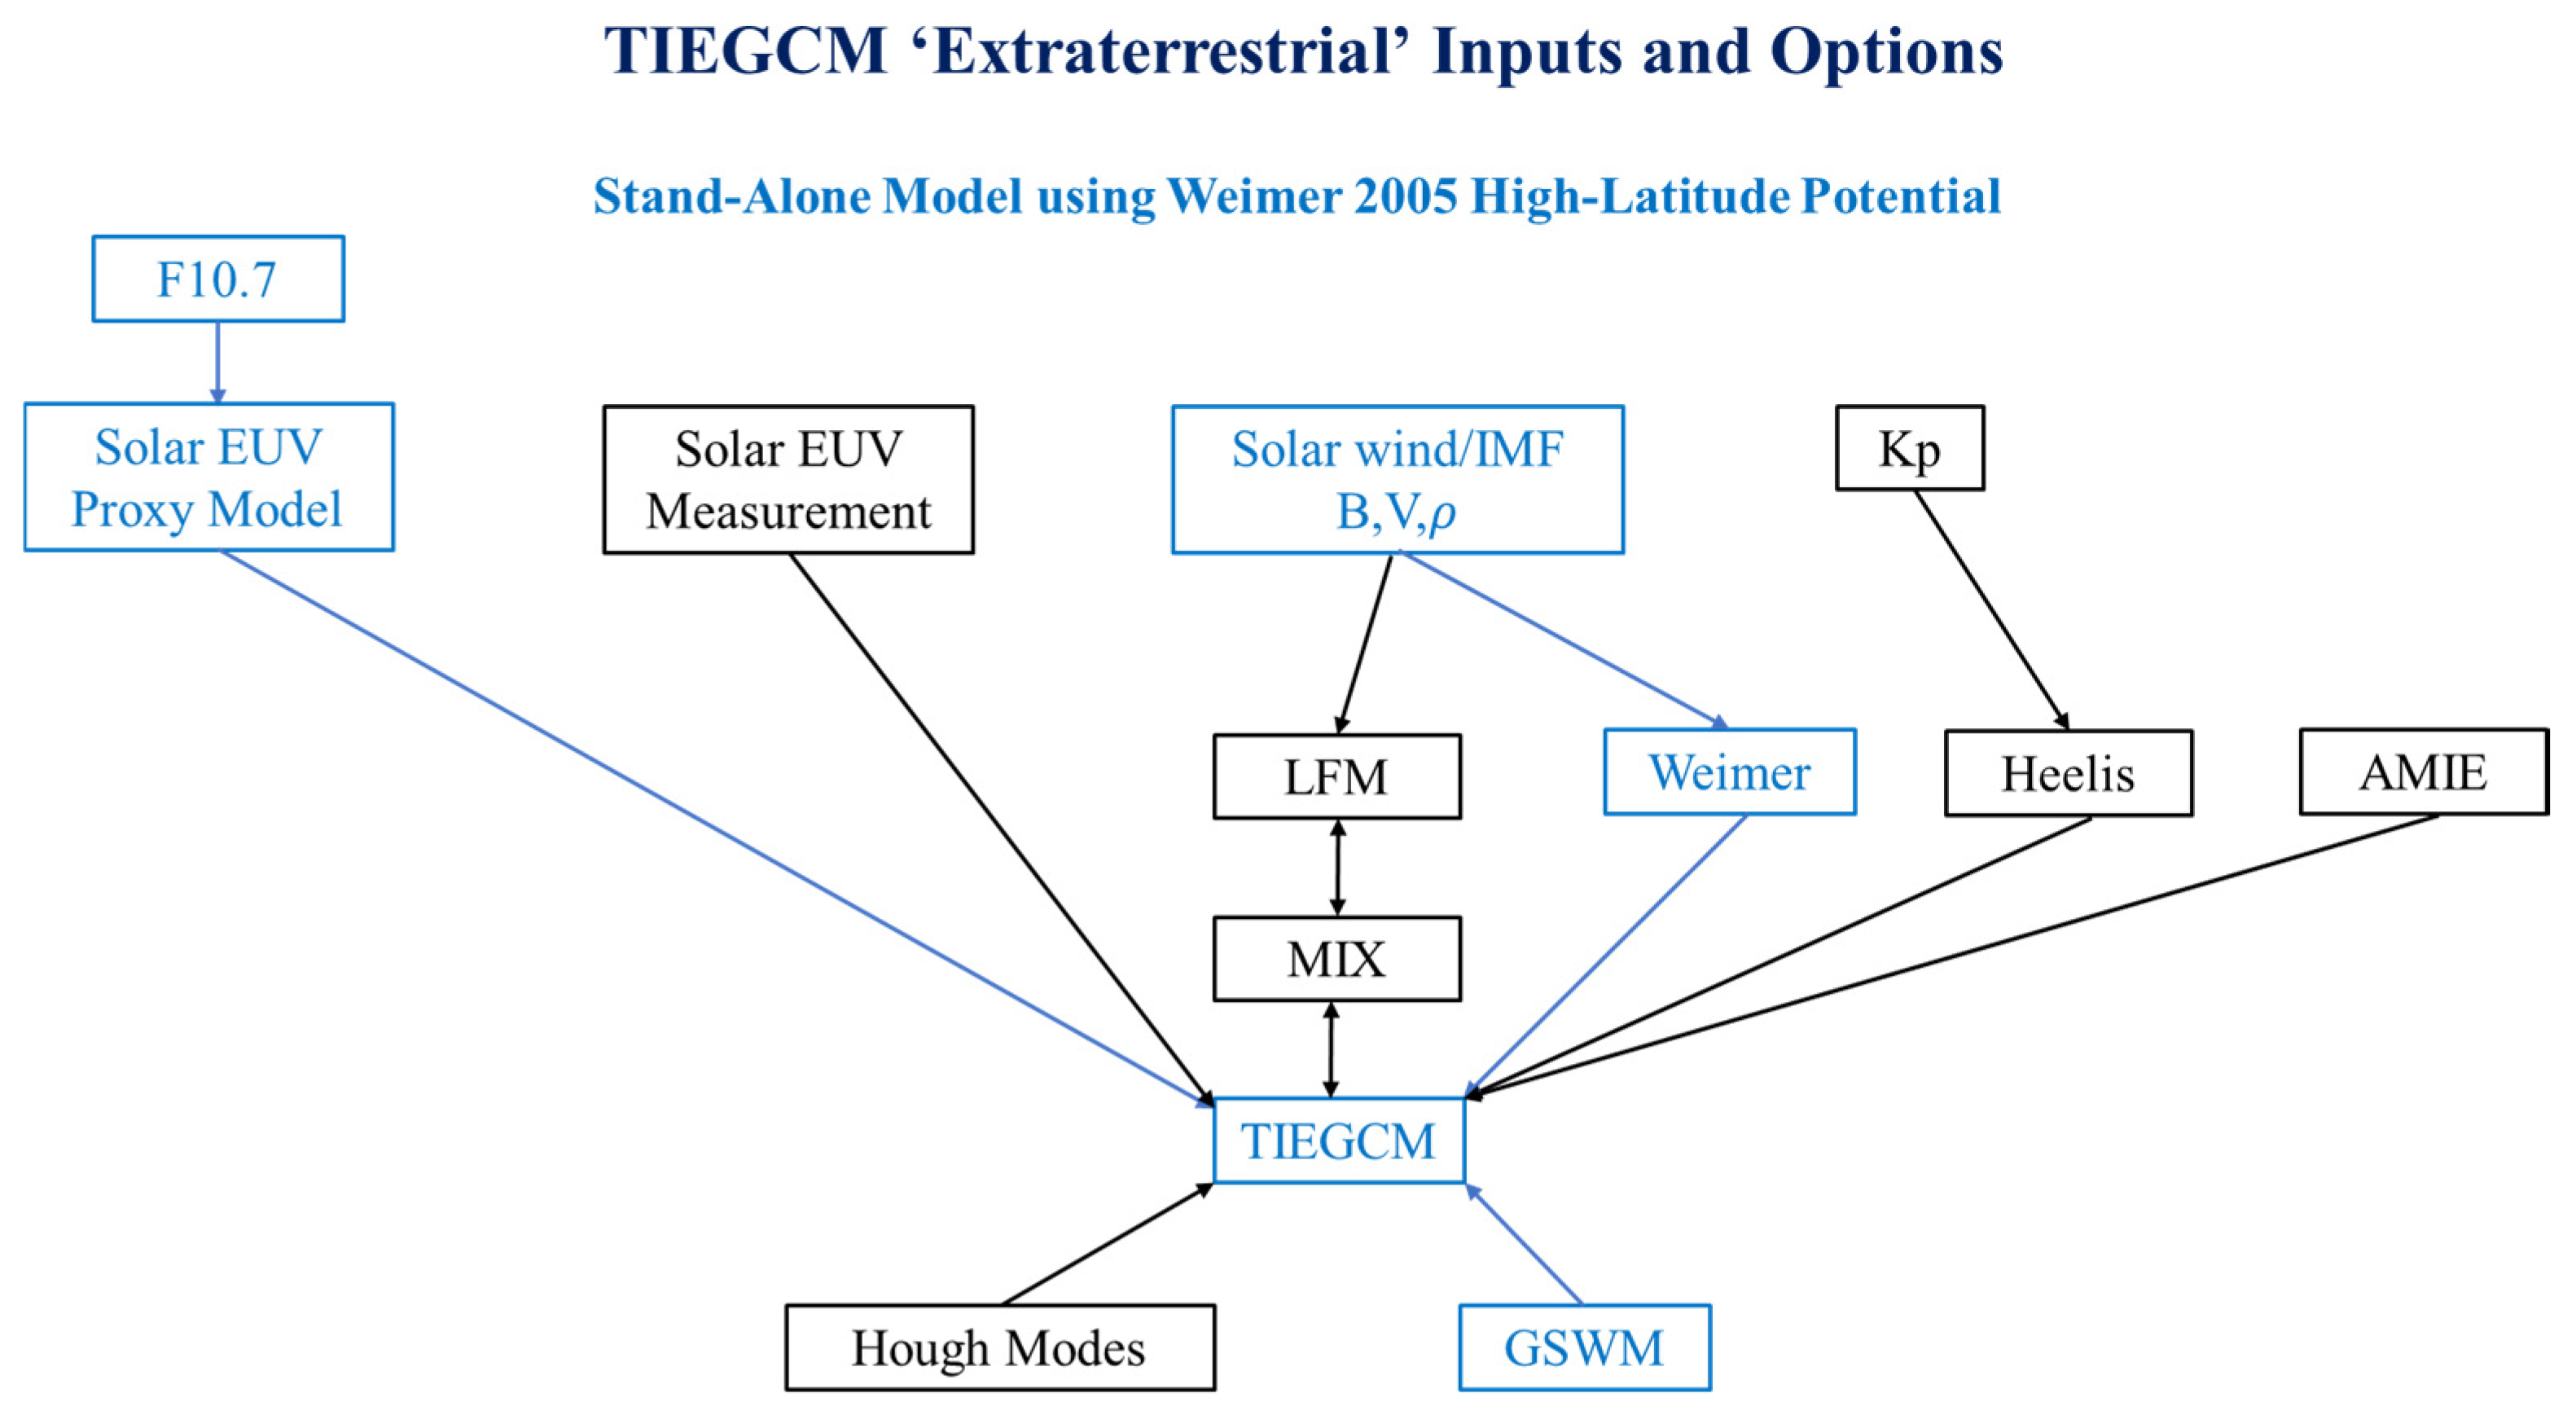
The TIEGCM is a comprehensive, first-principle, three-dimensional, nonlinear representation of the coupled thermosphere and ionosphere system. The TIEGCM utilizes a spherical coordinate system fixed relative to the rotating Earth. By employing latitude and longitude as horizontal coordinates and pressure surfaces as vertical coordinates, the latitude changes cover from 87.5°S to 87.5°N, and the longitude changes cover all longitude ranges in the world [30,31]. The vertical direction is the pressure surface coordinates. The model solves the three-dimensional momentum, energy, and continuity equations for neutral and ion species using a semi-implicit, fourth-order, centered finite difference scheme on each pressure surface. The TIEGCM extends from nearly 97 km to the upper atmosphere; the height of the upper boundary will change under the influence of solar activities, with an upper boundary around 500 km during the solar minimum period. The TIEGCM is driven by the F10.7 index-parameterized solar extreme ultraviolet and ultraviolet spectral fluxes, high-latitude particle precipitation and ionospheric convection patterns, and the amplitudes and phases of tides from the lower atmosphere. The energy input associated with auroral particle precipitation can be determined either through the use of an analytical auroral model for calculation or by following the AMIE procedure for definition [5]. The ionospheric electric fields at high latitudes are provided by the Heelis model and the Weimer model. The inputs for the Heelis model include the cross polar cap potential in kV, obtained from 3 h Kp index Hemispheric Power in GW. The inputs for the Weimer model include the interplanetary magnetic fields, By and Bz, as well as solar wind density and speed. The upper boundary conditions for electron heat and flux transfer are simple empirical specifications. The inputs for the lower boundary are the atmospheric diurnal and semi-diurnal migrating tides, specified by the Global Scale Wave Model (GSWM) [31,32]. A brief introduction to the TIEGCM and the inputs selected for this study is provided in Appendix A.
Infrared radiative (IR) cooling processes play an important role in regulating the energy in the thermosphere. In the upper thermosphere, the cooling at 63 μm IR radiation from the fine structure of atomic oxygen is the dominant radiative loss process. In the middle thermosphere, the NO radiative cooling at 5.3 μm is important. In the lower thermosphere, the CO2 radiative cooling at 15 μm is dominant [33,34]. In the TIEGCM, the calculation of non-LTE (Local Thermodynamic Equilibrium) CO2 cooling at 15 μm employs a cool-to-space approximation. Conversely, the non-LTE NO cooling at 5.3 μm is determined utilizing Kockarts’s equation [4]. The NO 5.3 μm emission radiative cooling rates in the TIEGCM are calculated based on Equation (7) [4,26]. More specifically, it is the combination of the quenching of vibrationally excited NO by O2 with a rate coefficient of 2.4 × 10 14   c m 3   s 1 and by O with a rate coefficient of 4.2 × 10 11   c m 3   s 1 [35]. As mentioned previously, inelastic collisions between atomic oxygen and NO are the primary sources of NO emission at 5.3 μm; therefore, the rate coefficient of the quenching by O is much larger than that by O2.
N O V E R = h ν 0 A 10 n ( N O ν = 0 ) × ( K O n O + K O 2 n ( O 2 ) ) K O n O + K O 2 n O 2 + A 10 × e h ν 0 K B T N
Here, h denotes the Planck constant, KB represents the Boltzmann constant, and TN is the neutral temperature. The frequency ν 0 = c λ 0 , where c is the speed of light, and the wavelength λ 0   equals   5.3   μ m . Moreover, A 10 is the transition probability from the N O ν = 1 state to the N O ( ν = 0 ) state, K O is the collisional relaxation rate for NO colliding with O, and K O 2 is the collisional relaxation rate for NO colliding with O2. Furthermore, n ( N O ν = 0 ) , n(O) and n(O2) represent the number densities of N O ( ν = 0 ) , O, and O2, respectively [26,36]. The TIEGCM simulation results used in this study, namely the NO cooling rate, NO density, O density, O2 density, and atmospheric temperature, were provided by CCMC at Goddard Space Flight Center through their publicly available simulation services https://ccmc.gsfc.nasa.gov (accessed on 1 April 2024). The polar precipitation parameters for the TIEGCM simulations are specified according to the method of ref. [14], with high-latitude convective electric fields using the Weimer model. In order to integrate the wind dynamo region with the high-latitude region, a dynamic cross-over boundary is introduced that adjusts based on the intensity of the magnetospheric forcing. The input parameters for the Weimer 2005 model are solar wind density N s w and speed V s w , as well as the IMFs, By and Bz [37]. The NO cooling rate from the TIEGCM is given in the unit of erg/g/s, and the NO volume emission rate from the SABER data set is in the unit of erg/cm3/s. To facilitate the comparison between the NO emission observed by the TIMED/SABER satellite and that simulated by the TIEGCM, the observed and modeled NO emissions are uniformly converted into NO volume emission rates (VERs) in units of photons/cm3/s. This study uses the TIEGCM V2.0 version, which has a horizontal resolution of 2.5° × 2.5° in latitude and longitude, a vertical resolution of one-quarter scale height, and a time resolution of 20 min. The TIEGCM simulations are interpolated based on the time and location of the TIMED/SABER observations.

2.3. Overview of the Geomagnetic Storm Event

The temporal evolution of the components of the interplanetary magnetic fields (IMFs), B y and B z , and of the solar wind speed, the Dst index, and the F10.7 index from 22 to 26 April is given in Figure 1. It is evident from Figure 1a,b that intense disturbances of the interplanetary magnetic field began to occur on 23 April. Upon the arrival of the solar wind shock to Earth at approximately 08:00 UT on 23 April, both the Bz and By components of the interplanetary magnetic field commenced oscillating. The sign of the IMF B z changed rapidly during this interval; it rose rapidly to 20 nT at 22:00 UT on 23 April and then quickly dropped to −20 nT within four hours. Simultaneously, a marked disturbance in the solar wind occurred. As shown in Figure 1c, the solar wind speed increased rapidly, reaching its peak exceeding 740 km/s. In Figure 1d, the Dst index started to decrease significantly from 08:00 UT on 23 April, reaching its minimum value of −213 nT at 05:00 UT on 24 April; then, it began to increase. After 26 April, the geomagnetic storm gradually returned to its typical quiet-time levels. In Figure 1e, the variation of the F10.7 index remained insubstantial during the geomagnetic storm. All indices depicted in Figure 1 are sourced from the OMNI database (https://omniweb.gsfc.nasa.gov (accessed on 1 April 2024)).

3. Results and Discussion

3.1. Global Distribution of NO Emission Response during the Geomagnetic Storm

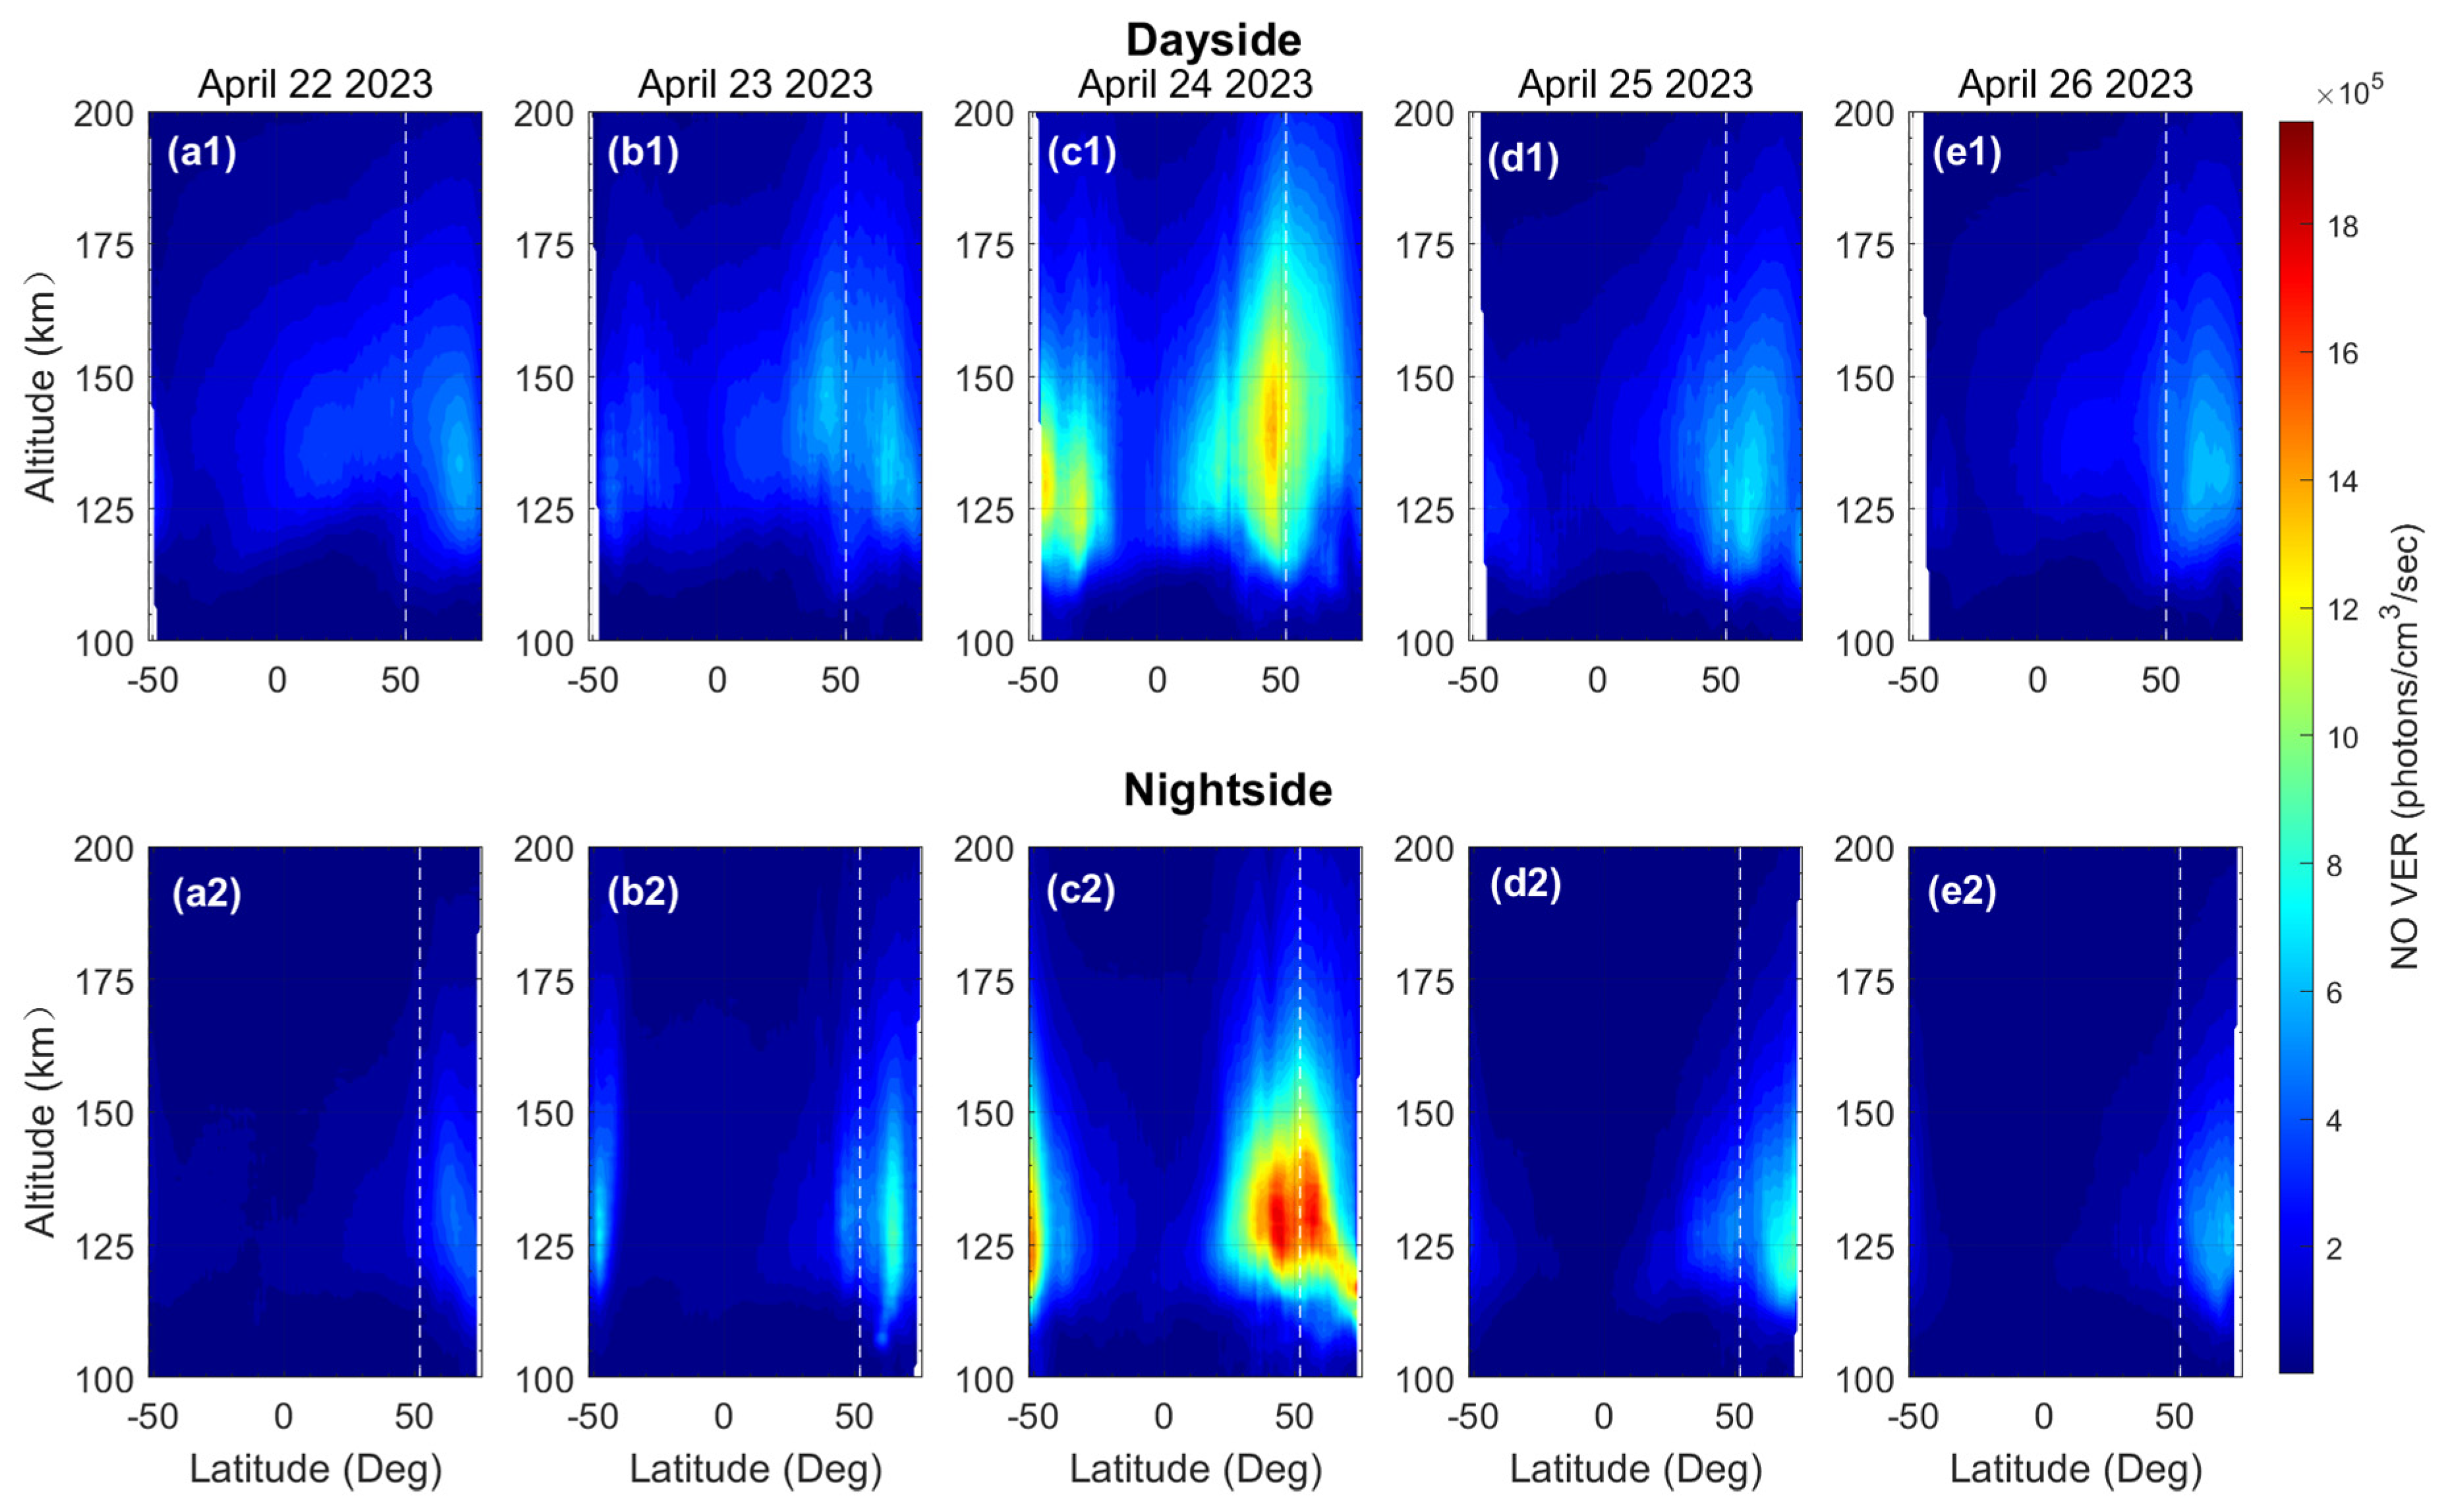
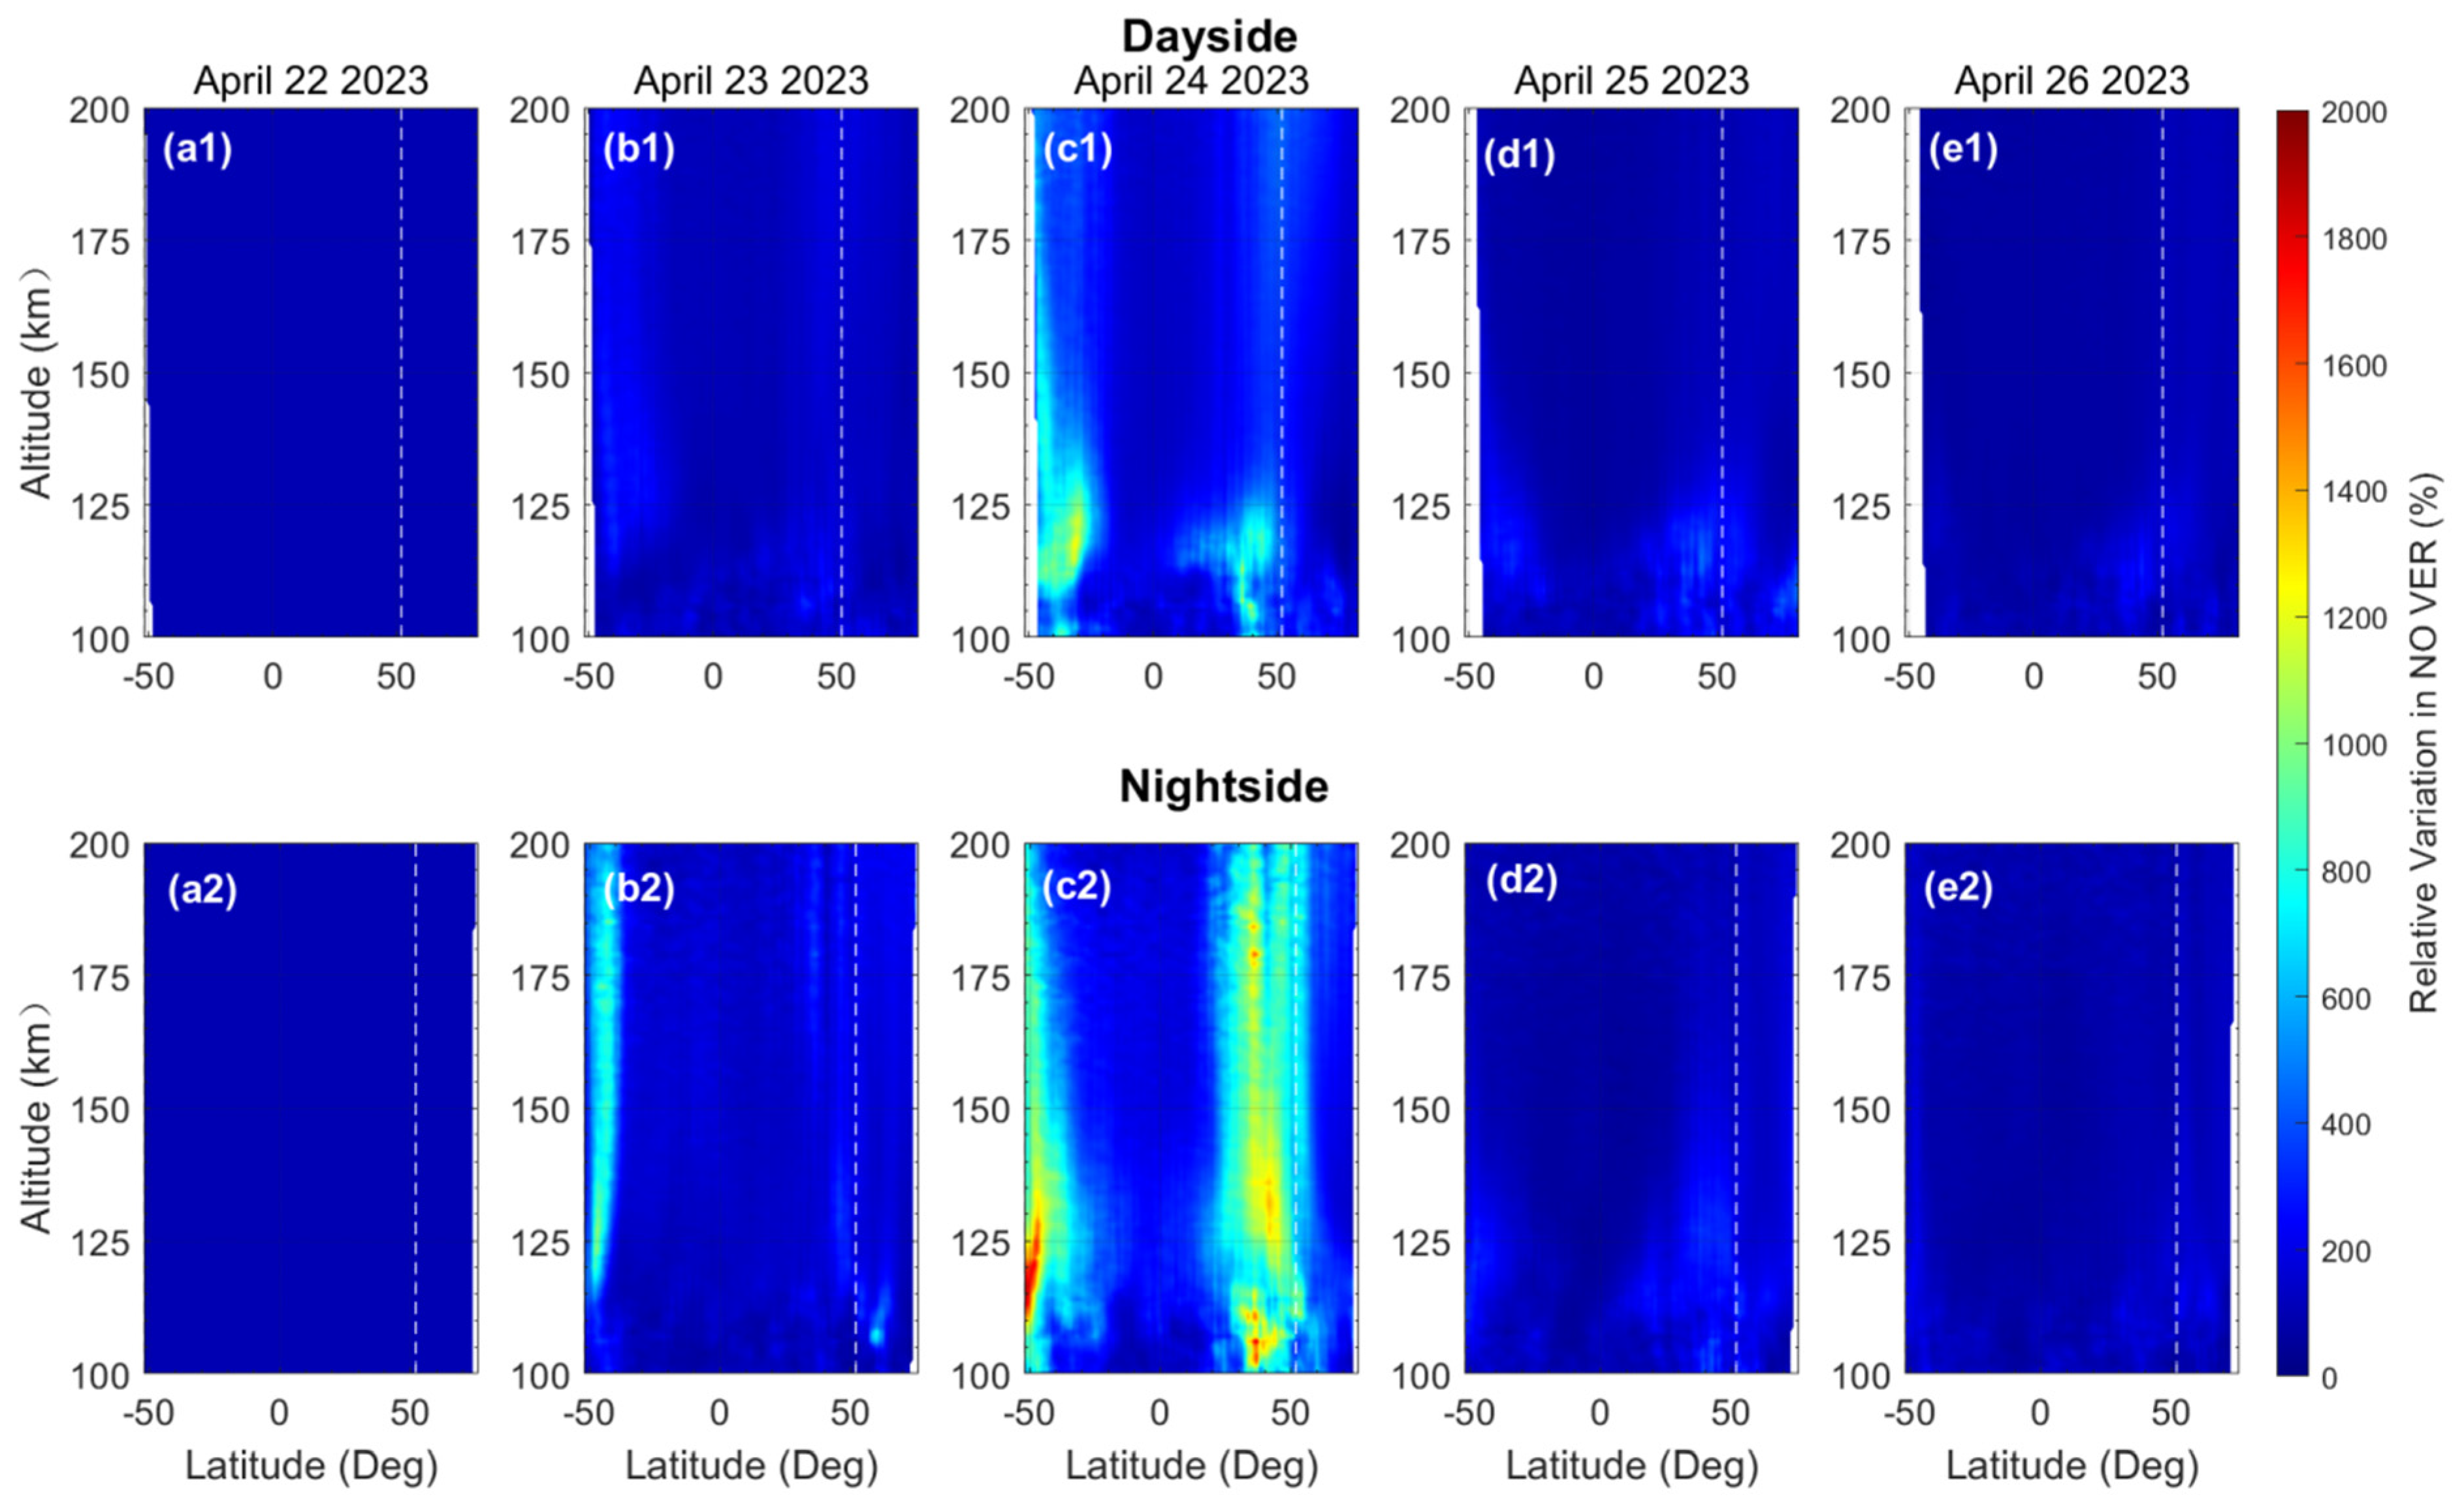
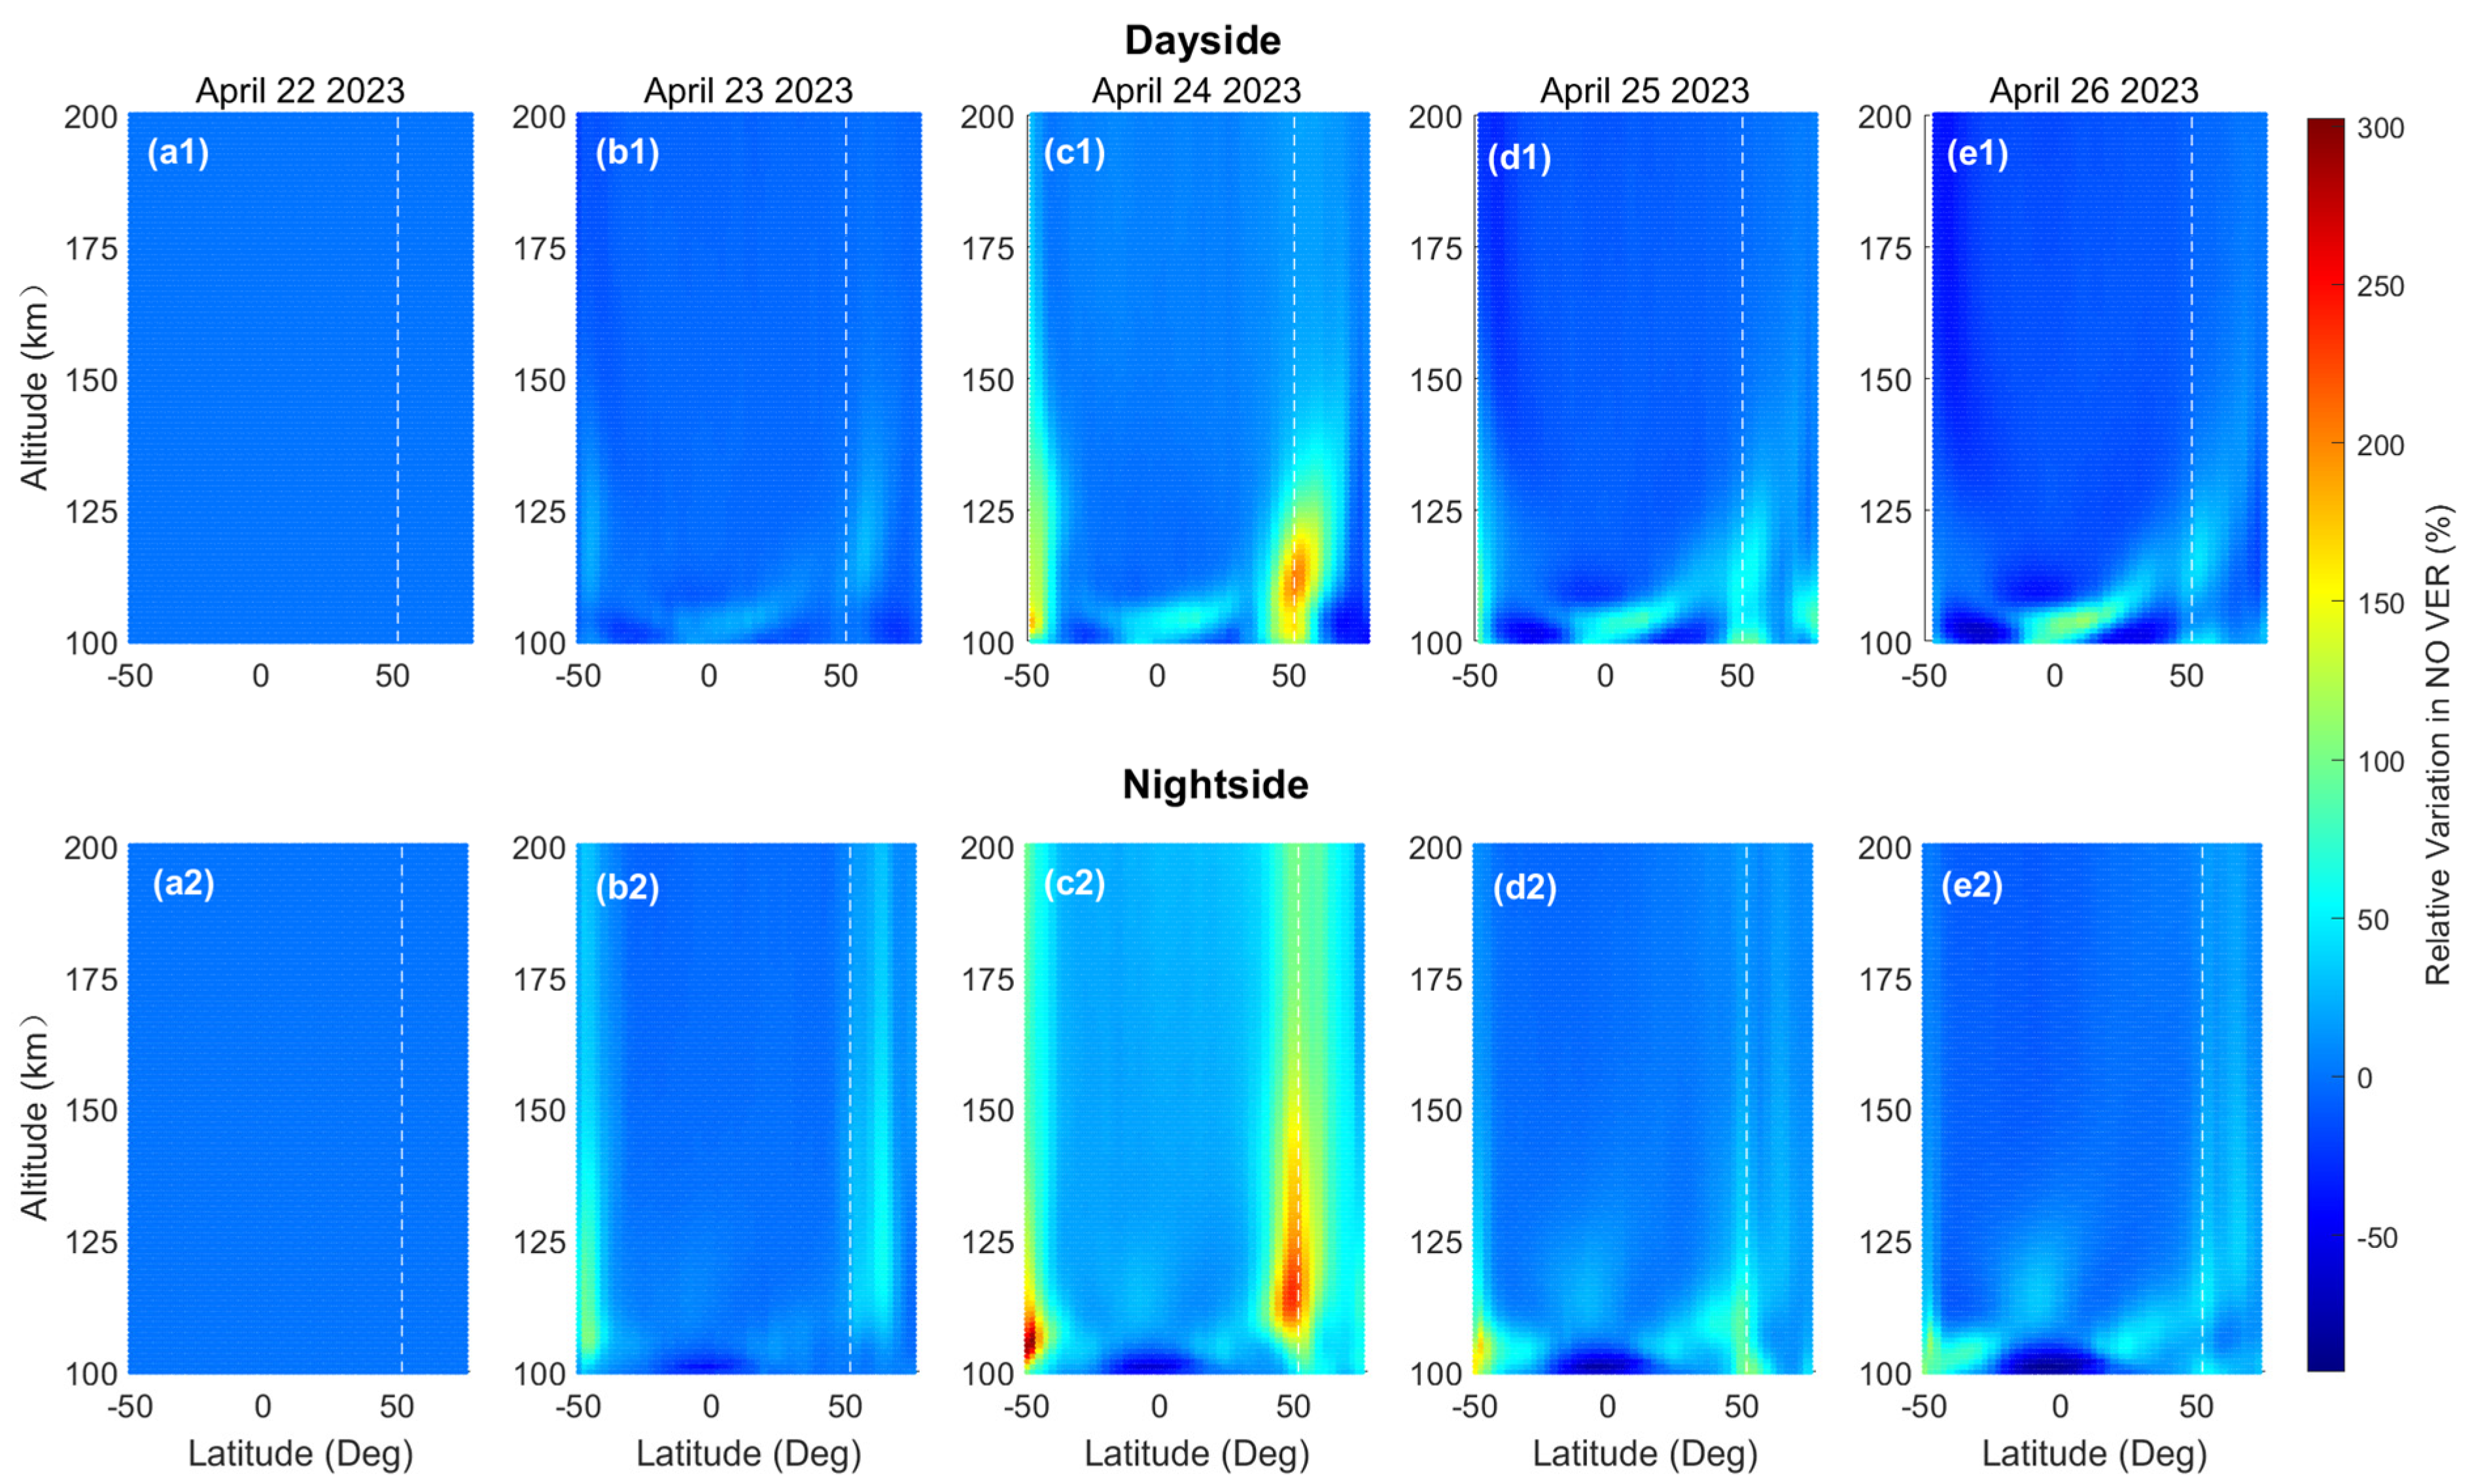
Figure 2 shows the altitude–latitude distributions of the dayside and nightside NO VER observed by the TIMED/SABER from 22–26 April 2023. During this period, since the highest latitude observed in the Southern Hemisphere was about 52°S, a white dashed line is shown to mark 52°N for ease of intuitive comparison between the Southern Hemisphere (SH) and the Northern Hemisphere (NH). In order to derive the variation in NO emission due to the geomagnetic storm, the background emission should be removed first. Before 21 April, the SABER operated in a southward-looking mode, with a latitude coverage of 83°S–52°N; on 21 April, the SABER’s operational mode changed from a southward-looking to a northward-looking direction; after 21 April, the SABER operated in a northward-looking mode, with a latitude coverage of 52°S–83°N. As shown in Figure 1, the geomagnetic storm began on 23 April and reached the strongest on 24 April. Considering that the latitude coverage of the SABER observations before 22 April is different from that during the geomagnetic storm, using the observations before 22 April as the background is not appropriate. In addition, as shown in Figure 1, the geomagnetic activity was relatively quiet on 22 April. Therefore, in this study, the NO emission on 22 April is considered as the background during the geomagnetic storm. The variations in NO emission caused by the geomagnetic storm are calculated by subtracting the background from the emission observed during the geomagnetic storm. The relative variations are obtained by dividing the variations by the background. Figure 3 illustrates the relative variations in the NO VER observed by the TIMED/SABER satellite on the dayside and nightside.
Figure 2 and Figure 3 reveal that both the dayside and nightside NO emission increase during the geomagnetic storm, which is consistent with the conclusion of ref. [38]. The increase can be seen in the distributions of the daily mean NO emission on 23 April. However, the most evident increase appears in the distributions of the daily mean result on 24 April. This is because that the emissions on 23 April are observed by the SABER both before and during the geomagnetic storm, and the emissions on 24 April are observed by the SABER during the main phase and recovery phase, according to the temporal distribution of the Dst index shown in Figure 1d. Moreover, on 24 April, the strong NO emission and the pronounced relative variations in NO emission due to the geomagnetic storm mainly appear around 50°S/N latitude. It can be seen from Figure 2 that, in both hemispheres on 24 April, the peak NO VERs on the nightside are larger than those on the dayside; however, the peak altitudes on the dayside are about 2–8 km higher than those on the nightside. On 24 April, the peak altitudes in the NH are generally 2–10 km higher than those in the SH, and the latitudes where the peaks appear (peak latitude) in the NH are slightly lower than those in the SH. In fact, the hemispheric asymmetry also exists during geomagnetic quiet periods. For example, the NO emission in the NH is, in general, stronger than that in the SH in the latitude range of 0–50°, as shown in Figure 2a1,a2.
Furthermore, the enhancement of the dayside and nightside NO emission in both hemispheres during the geomagnetic storm extends from around 50°N/S towards the equator as shown in Figure 2 and Figure 3. This finding aligns with the zonally averaged NO VER results presented in ref. [32], and is primarily attributed to the large amount of energy injected into the aurora zones during the geomagnetic storm, which alters the meridional wind pressure gradient, drives changes in the global circulation, and even generates equatorial meridional winds capable of transporting NO-rich air from high latitudes to lower latitudes, even across hemispheres [1,3,13]. With the recovery of the geomagnetic storm, the NO emission rapidly weakened, and, on 26 April, it almost returned to quiet-time levels, except in the high-latitude region, which is consistent with the conclusion that the effective chemical lifetime of the NO molecule to diffusive transport is approximately one day [9,39].
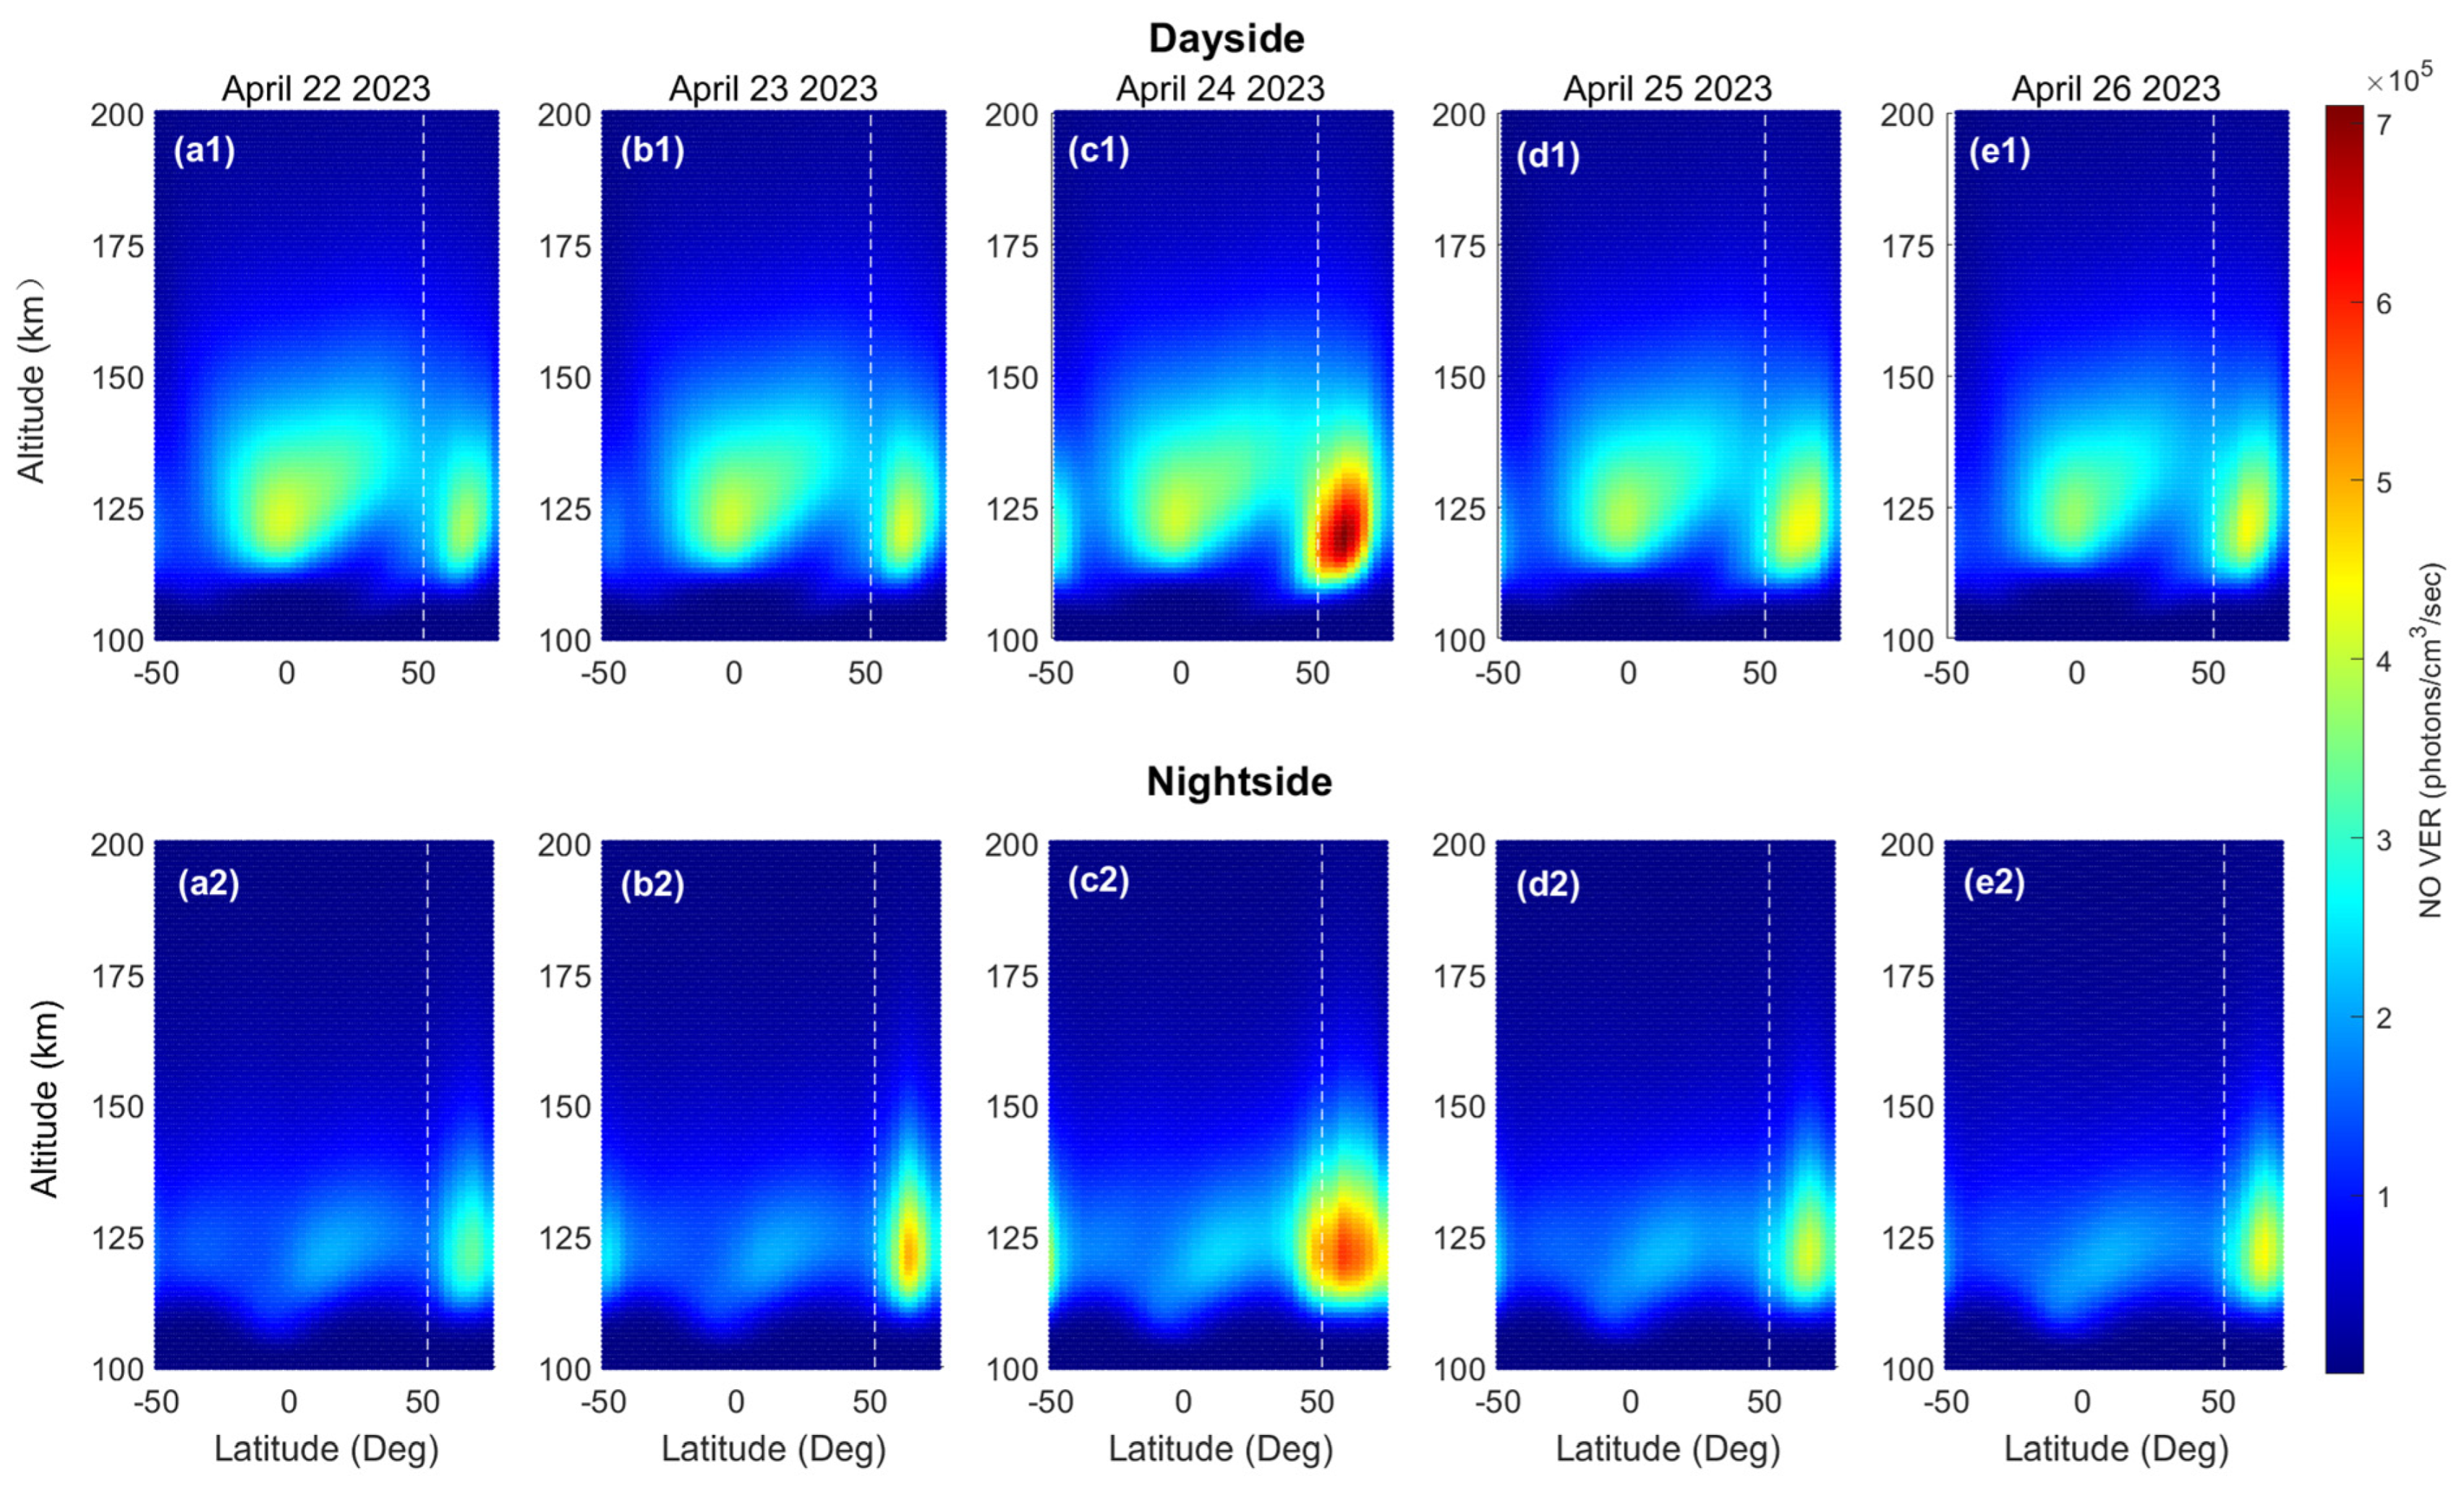
The NO VER simulated by the TIEGCM and its relative variation caused by the geomagnetic storm are presented in Figure 4 and Figure 5, respectively. Similar to the TIMED/SABER observations, the NO emission simulated by the TIEGCM also increased abruptly on 24 April. In Figure 4, the NO emission is stronger in the altitude range of 110–160 km. The NO VER on the dayside is generally stronger than that on the nightside, especially in the middle–low latitudes and equatorial regions. On the dayside, during the geomagnetic quiet time, there are two emission peaks in the altitude–latitude distribution of the dayside NO emission; one located near the equator and the other at 65°N. Furthermore, the intensity of the peak emission around the equator is comparable to the other peak. During the geomagnetic storm on 24 April, the enhancement of the NO emission at higher latitudes was more significant, with a peak emission intensity of approximately 7.05 × 10⁵ photons/cm3/s near 62°N, which was significantly stronger than the peak emission near the equator; moreover, an emission peak appeared around 50°S. On the nightside, the emission at around 65°N was stronger than the other regions for both the geomagnetic quiet period and the geomagnetic storm period. Similar to the dayside, during the geomagnetic storm, the enhancement of NO emission at higher latitudes was significant, and an emission peak could be seen around 50°S. Overall, the peak altitude of the NO VER simulated by the TIEGCM was lower than that observed by the TIMED/SABER, which is consistent with the difference in peak altitudes reported by ref. [29].
Compared with the observations from the TIMED/SABER, the differences in the NO emission distributions simulated by the TIEGCM are more pronounced between the dayside and nightside. Specifically, the NO emission in the middle to low latitudes and equatorial regions on the dayside is significantly stronger than that on the nightside. The altitude–latitude distribution structure of the simulated NO emission is different from the observations, especially on the dayside, which shows weaker emission around the equator compared with higher latitudes. The difference indicates that the model may overestimate the contributions from solar soft X-ray and extreme ultraviolet radiation, which play a significant role in the production of NO density during the dayside [9,13,14], or that it may underestimate the contributions from Joule heating and energetic particle precipitation, which are important at high latitudes.
Although there are some differences between the distributions of the simulated and observed NO emissions, the altitude–latitude distribution structure of the simulated NO VER relative variation is, in general, similar to that observed by the TIMED/SABER. As shown in Figure 5, the peak of the relative variation appears around 50°S/N. Furthermore, the maximum relative variation on the nightside is greater than that on the dayside during the geomagnetic storm. This is similar to the observations given in Figure 3. In addition, the maximum value of the NO VER relative variation for the TIEGCM simulation is less than that observed by the TIMED/SABER.

3.2. Effects of Variations in Three Parameters during the Geomagnetic Storm on the Response of NO Emission

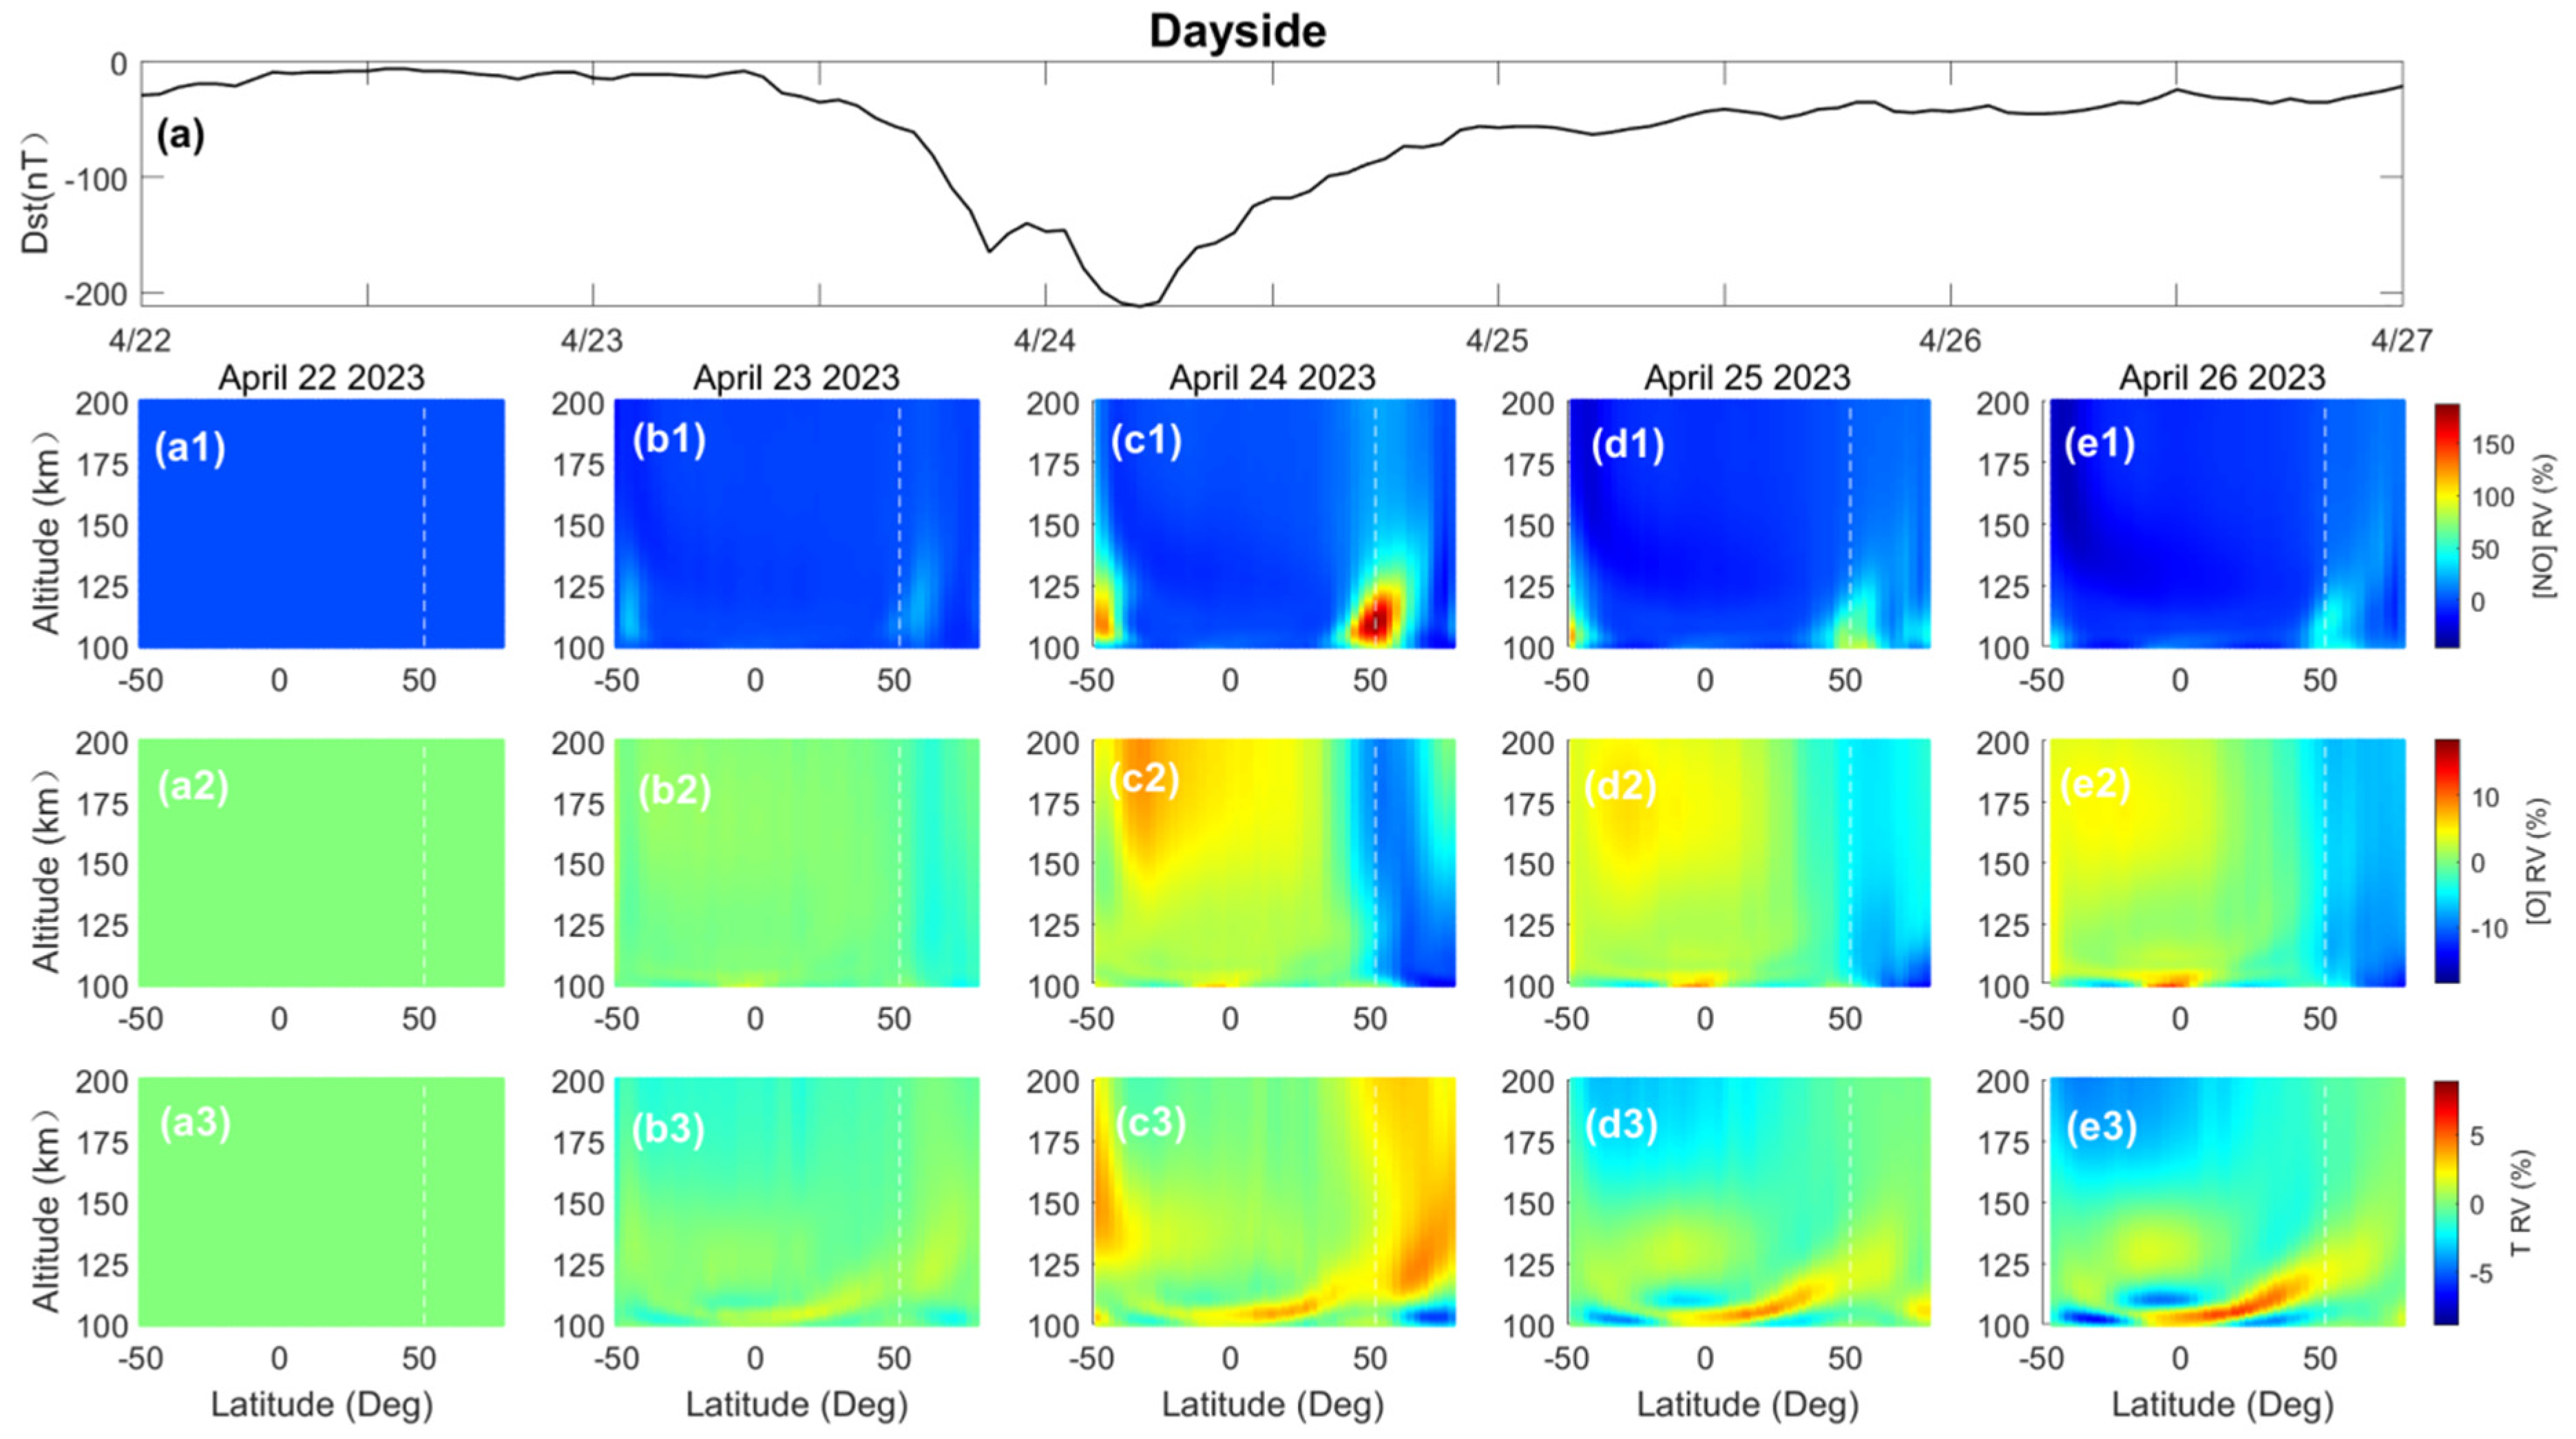
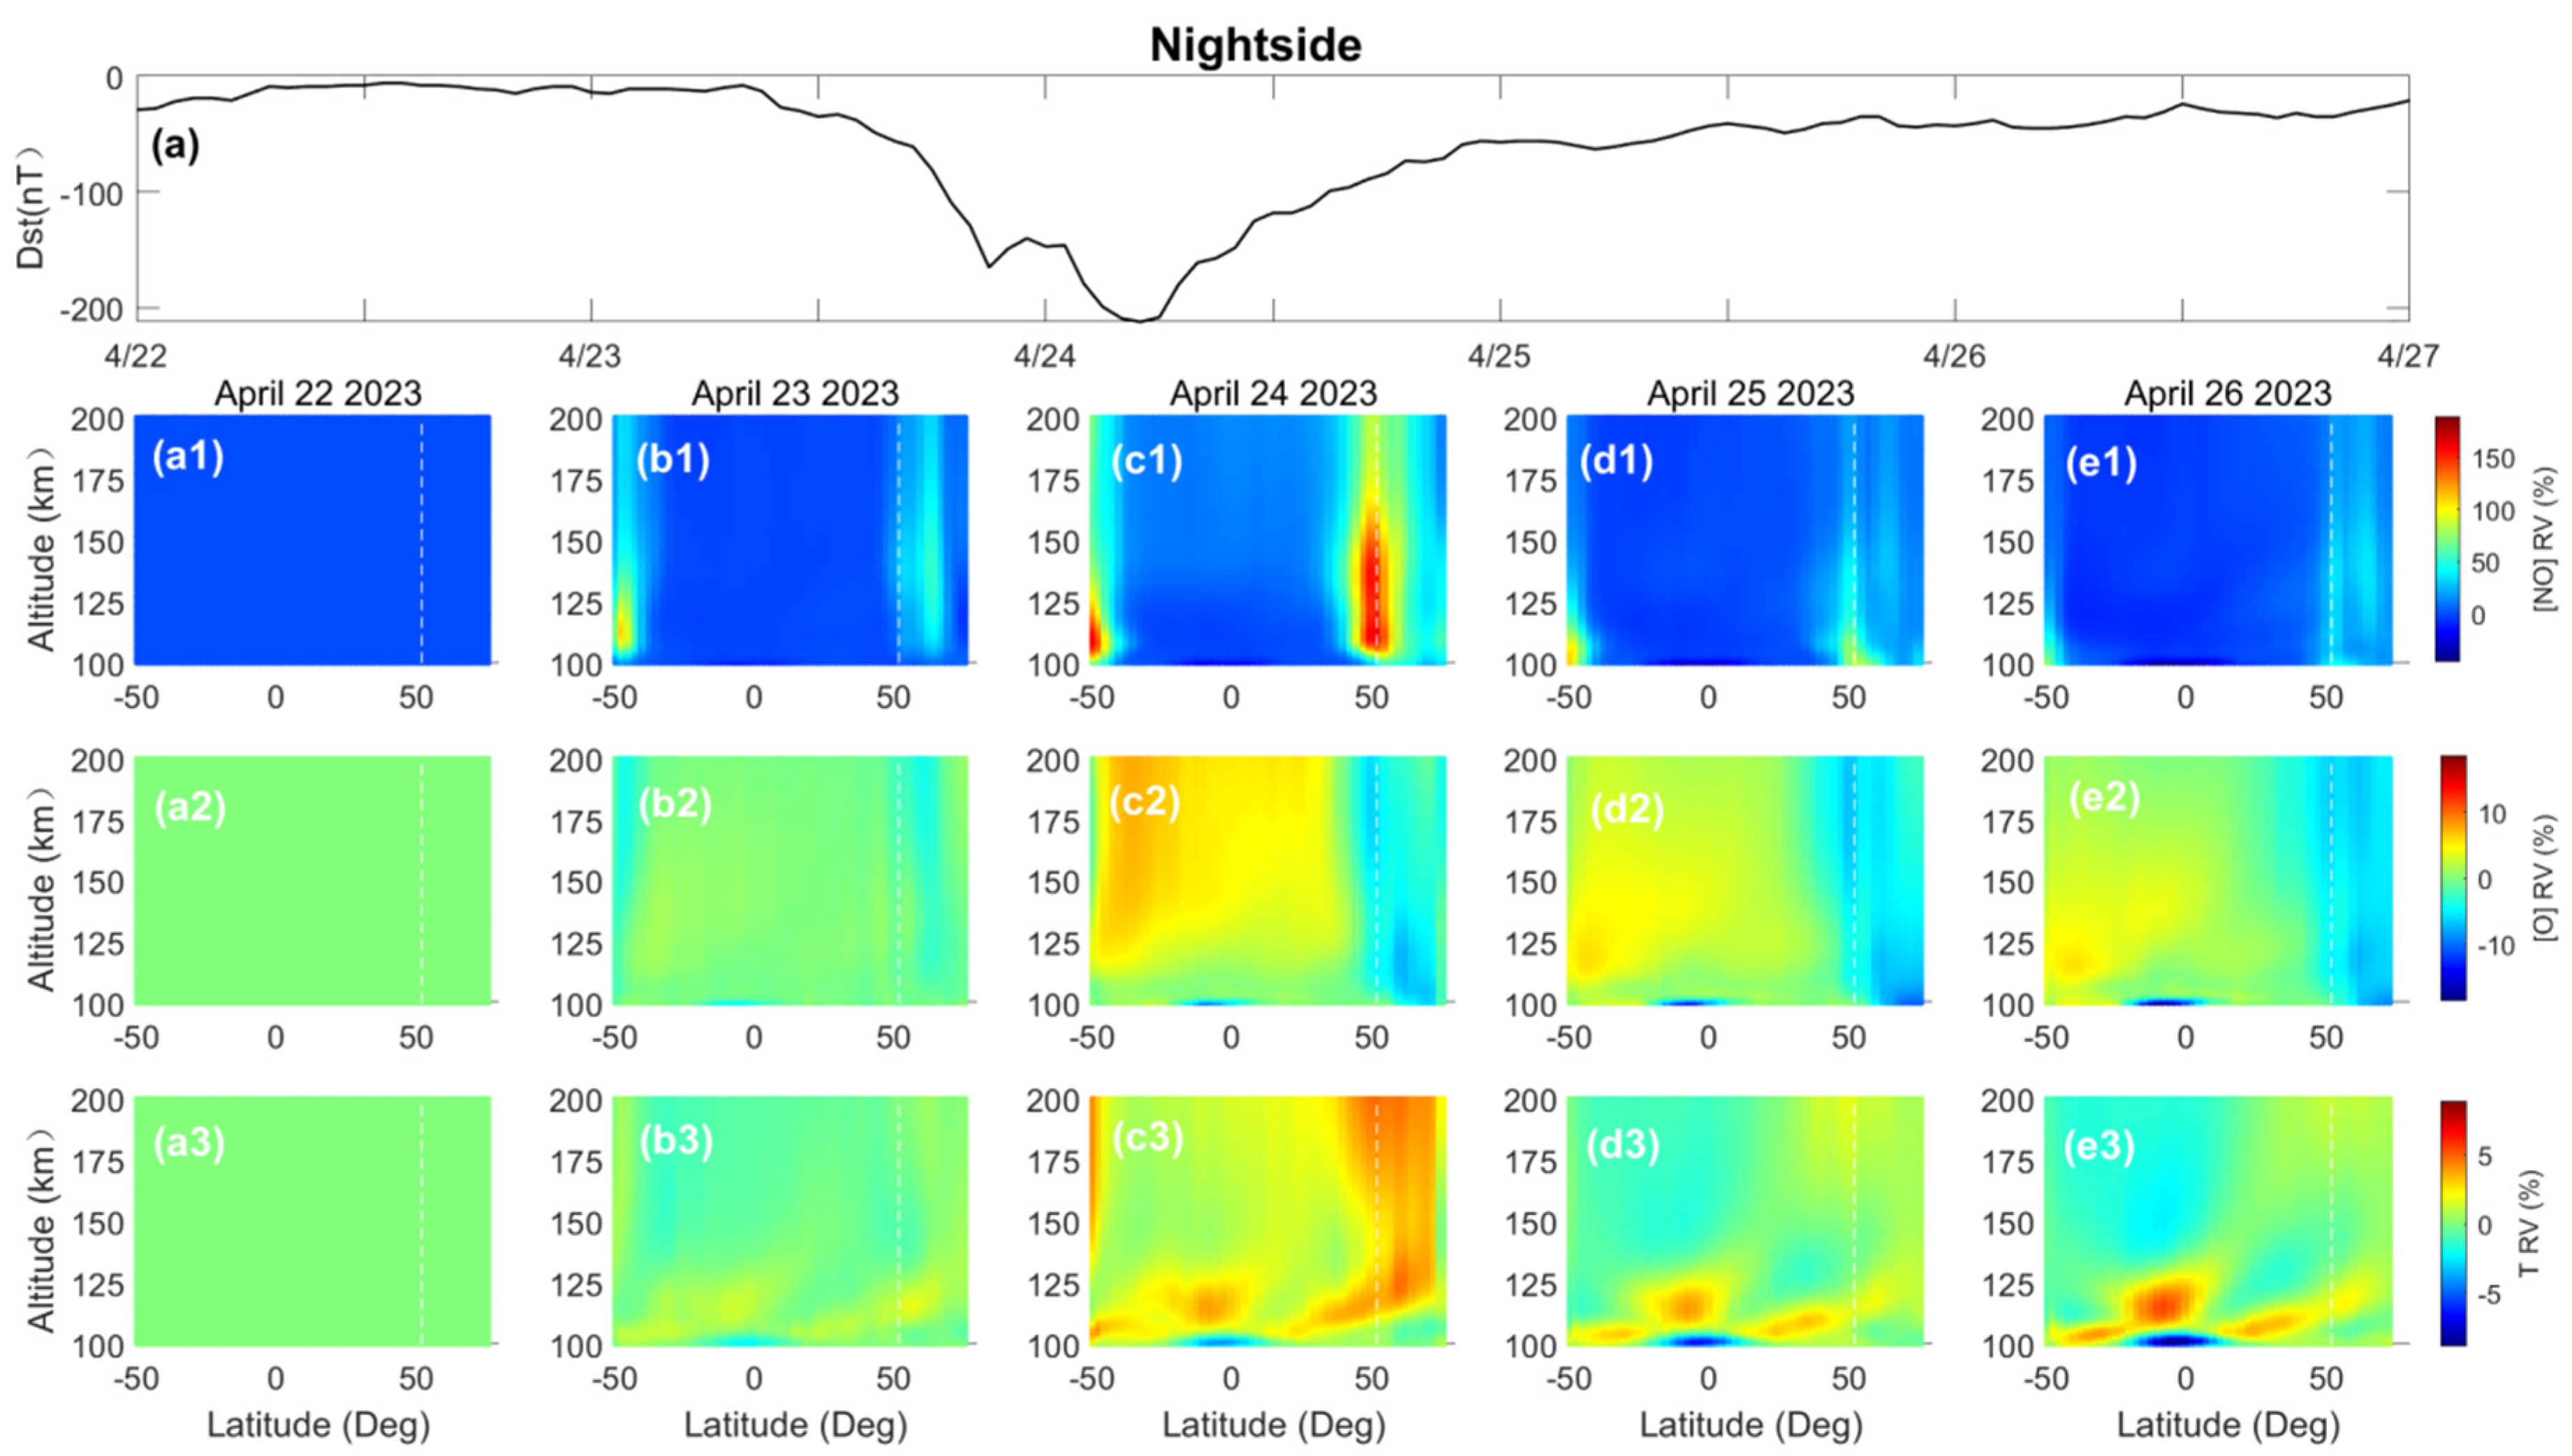
As mentioned earlier, NO emission depends on NO density, O density, and temperature. The relative changes in the altitude–latitude distribution of NO density, O density, and temperature simulated by the TIEGCM on the dayside and nightside are shown in Figure 6 and Figure 7, respectively. As shown in Figure 6c1 and Figure 7c1, on 24 April, the NO density near 50° in both the Southern and the Northern Hemispheres significantly increases. In addition, the response of the Northern Hemisphere on both the dayside and nightside is stronger than that of the Southern Hemisphere. The global distribution of NO density from the Coupled Middle Atmosphere and Thermosphere (CMAT) model indicates that the peak magnitude and height of NO density mainly depend on the location of the aurora ellipse, the meridional wind transport of NO, changes in solar radiation flux, and particle deposition [40]. In addition, on 24 April, the increase in NO density also shows a trend of extending towards lower latitudes and decreasing towards higher altitudes, especially near the Northern Hemisphere on the dayside, which is consistent with the findings of refs. [11,12,41]. In Figure 6 and Figure 7, the increase in NO density on April 25 is still evident; by 26 April, the NO density near 50°N/S has not fully recovered to pre-storm levels.
The atmospheric fluctuations in the low latitudes are primarily governed by Joule heating and particle heating processes occurring in the polar regions. These heating mechanisms drive the air along the pressure gradients, leading to an increase in molecular density and a corresponding reduction in atomic oxygen density, as reported by ref. [42]. This altered air composition, characterized by enriched N2 and depleted atomic densities, then spreads towards mid and low latitudes via equatorward winds. This dissemination subsequently modifies the circulation patterns of neutral winds within the low-latitude regions [43]. In Figure 6a2–e2 and Figure 7a2–e2, the O density in the area north of about 40°N significantly decreased, while the O density in the area south of 40°N significantly increased. In addition, it can be observed that the decrease in O density had not fully recovered as of 26 April.
From Figure 6a3–e3 and Figure 7a3–e3, it can be seen that during the geomagnetic storm, except for the low-altitude regions near the equator on the nightside and the high-latitude regions of the Northern Hemisphere at about 100 km on the dayside, the temperature in the thermosphere significantly increased. On April 25, the temperature rapidly decreased, and some areas even fell below the pre-storm level, indicating that the temperature regulation in this area was rapid.
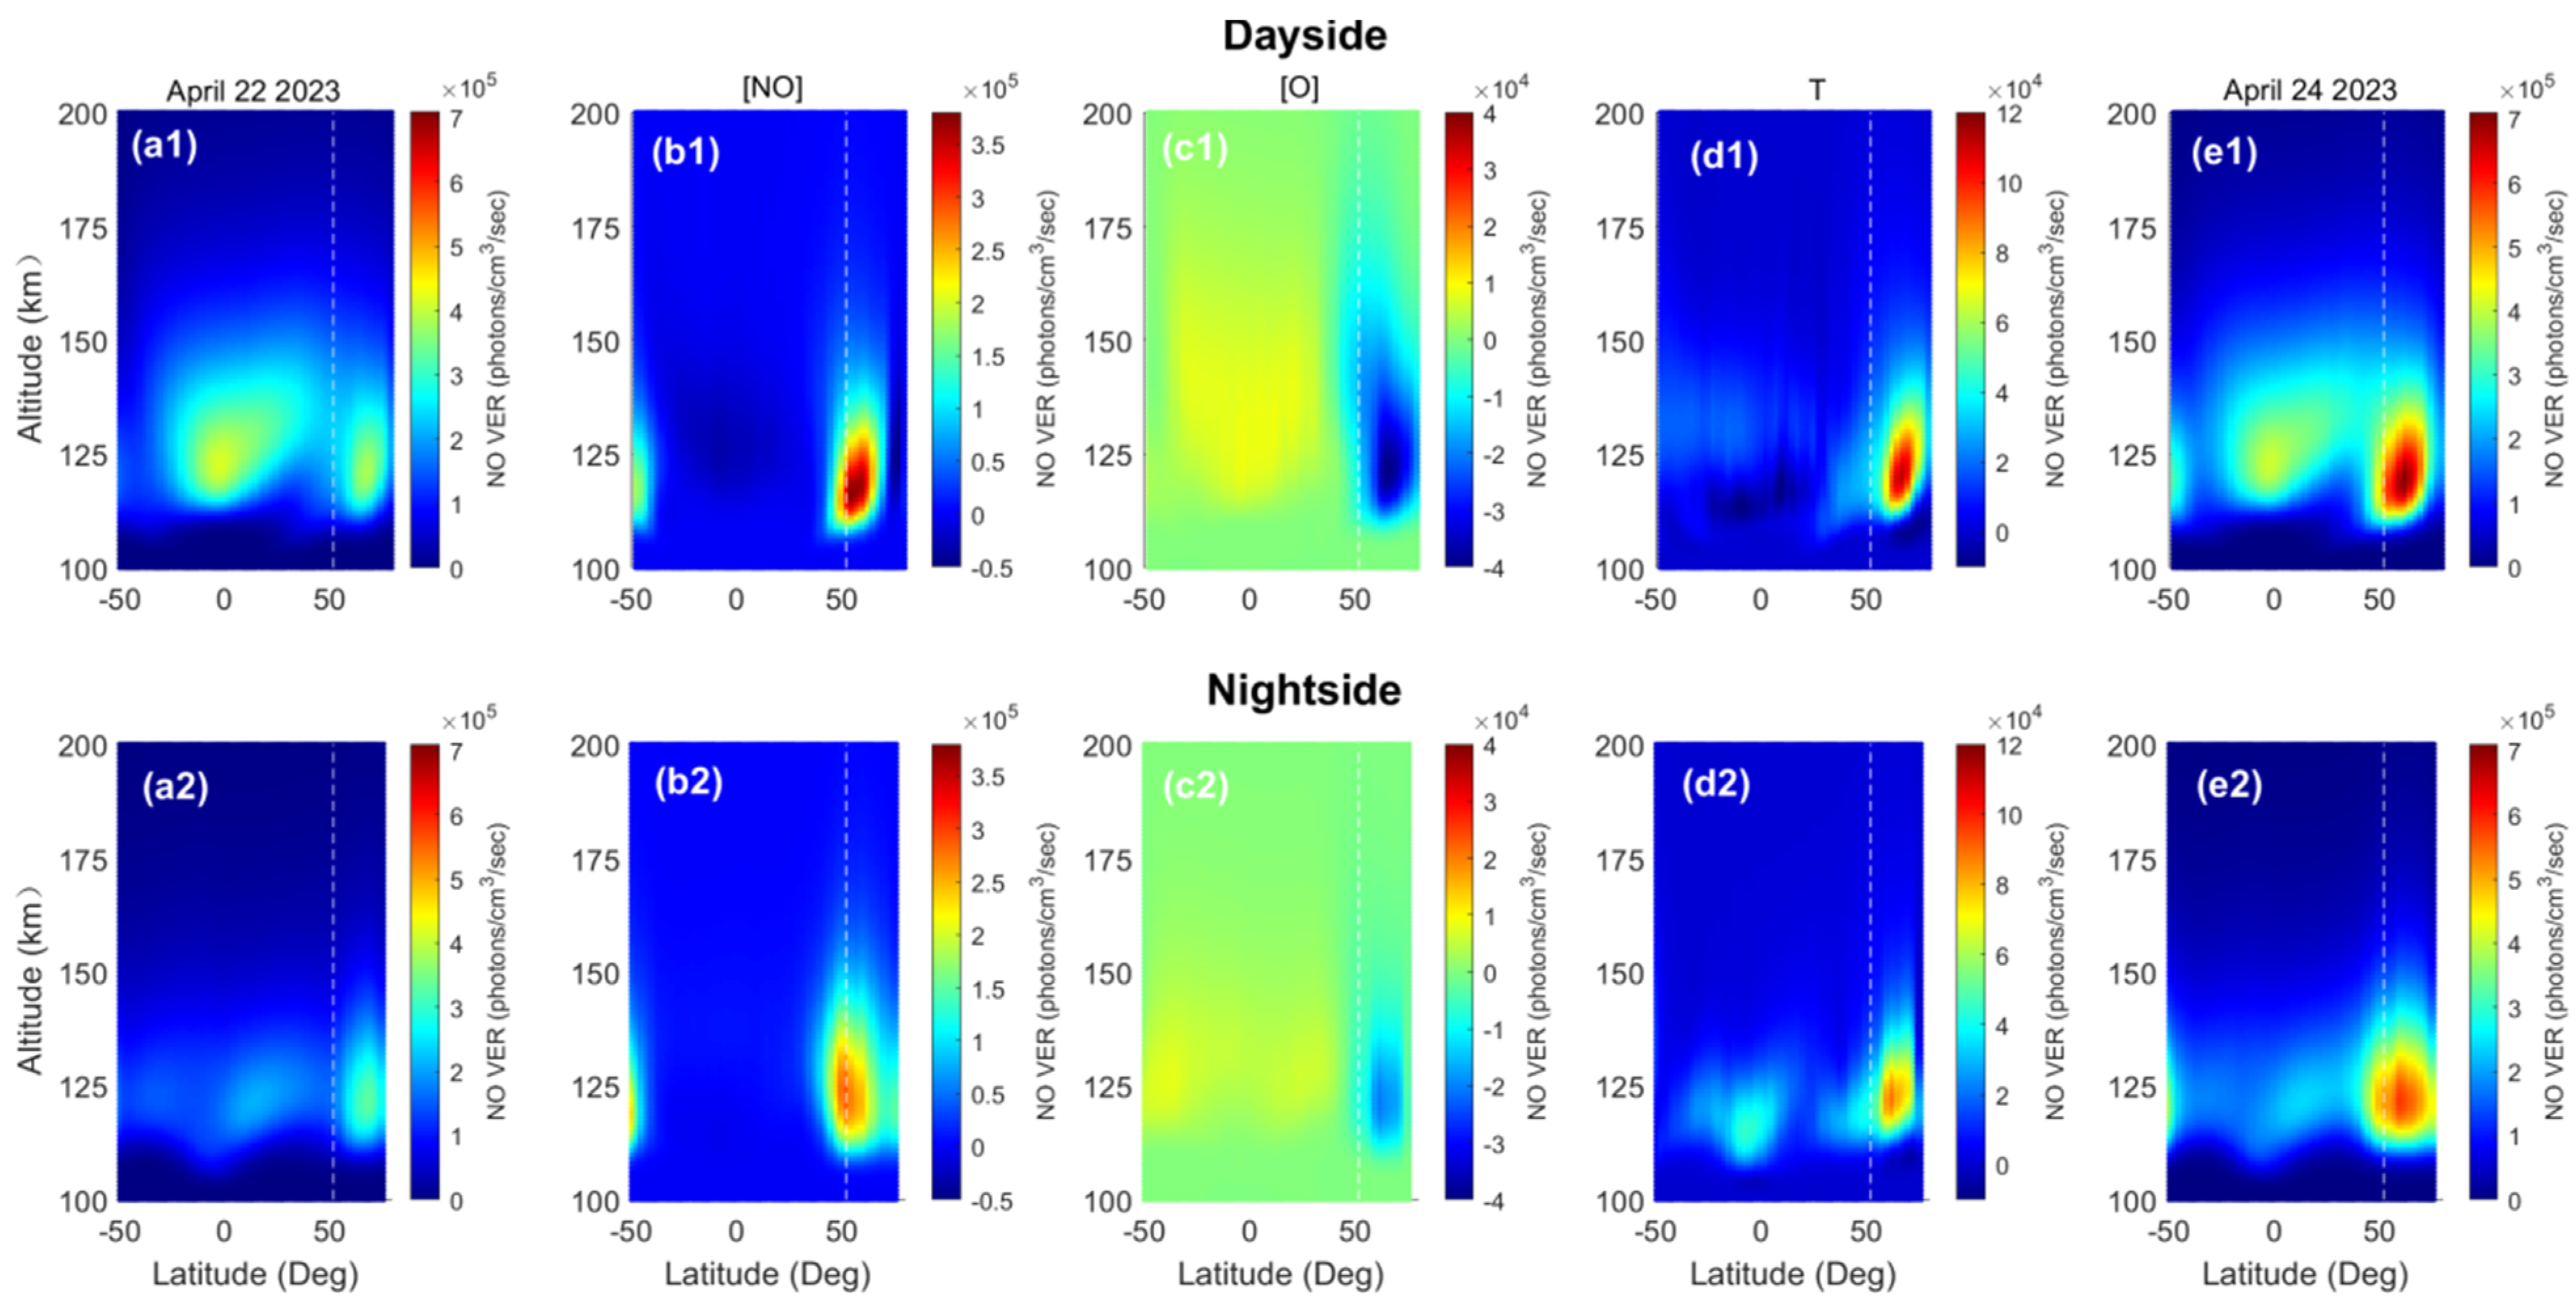
As shown in Figure 6 and Figure 7, NO density, O density, and temperature all changed significantly during the magnetic storm. In addition, the change of each parameter affected NO emission. In order to analyze the impact of each parameter change on the latitude–height distribution structure of NO emissions during the magnetic storm, we calculated the NO VER changes caused by each parameter change based on Equation (7) and the TIEGCM simulation on 22 April. The NO VER changes and relative variations caused by the changes in NO density, O density, and temperature on 24 April are shown in Figure 8 and Figure 9. The simulated NO VERs on 22 April and 24 April are also shown in Figure 8. The relative variations on 24 April compared with 22 April are also presented in Figure 9.
In Figure 8a1,a2, there are two emission peaks of NO emissions during the dayside and nightside on 22 April, located near the equator and 65°N. Figure 8b1,b2 clearly depict a substantial enhancement in NO emission during geomagnetic storms, stemming from variations in NO density around 50°S and 55°N. Notably, this increase is more pronounced during the dayside compared with the nightside. On the dayside, the maximum increase in the NO VER occurred at an altitude of 118 km at 50°S and 56°N, with values of 1.8 × 10⁵ and 3.7 × 10⁵ photons/cm3/s, respectively. On the nightside, the maximum increase in the NO VER occurred near 120 km at 50°S and 52°N, with values of 2.2 × 10⁵ and 2.8 × 10⁵ photons/cm3/s, respectively. This aligns with the NO VER simulated by the TIEGCM on 24 April in Figure 8e1,e2, particularly the more apparent enhancement of NO emission at 50°S and high latitudes in the NH compared with Figure 8a1,a2. Figure 8c1,c2 reveal that variation in O density leads to decreased NO emission north of approximately 35°N and increased NO emission south of 35°N, albeit with a relatively minor impact compared with the effects of NO density change. On the dayside, the decrease exceeds 3.8 × 10⁴ photons/cm3/s at near 68°N, while on the nightside, the maximum decrease reaches 2.1 × 10⁴ photons/cm3/s near 124 km. Similar to the influence of NO density change, Figure 8d1,d2 show that variation in temperature enhances NO emission at most latitudes and altitudes. On the dayside, the peak NO emission occurs at 65°N, while on the nightside, there are two peaks, at 5°S and 60°N, respectively. The maximum increase occurs near 120 km on the dayside at 65°N. However, the enhancement due to the temperature variation is significantly less than the enhancement due to the variation in NO density. Hence, we speculate that the significant enhancement around 50°S/N on 24 April is primarily driven by a change in NO density.
Similar to Figure 8, Figure 9 reveals that the relative change in NO emission caused by variations in O density is relatively minor compared with that induced by changes in NO density and temperature. A clear distinction can be made by contrasting Figure 9b1,b2 with Figure 9e1,e2, demonstrating that alterations in NO density significantly impact the relative change in NO emission, particularly pronounced near 50°S/N. Taking 50°N as an example, at an altitude of 110 km during the magnetic storm, the relative change in NO density can reach 200%, and the relative change in NO emission intensity is about 290%. The significant increase in the relative change in NO emissions is attributed to the change in NO density. In addition, as can be seen from Figure 9c1,c2, taking 35°N as a boundary, variations in O density lead to a decrease in the relative change of NO emission north of approximately 35°N and an increase south of this latitude. However, overall, the relative change in O density during magnetic storms is relatively small, ranging from approximately −12% to 12%. In Figure 9d1,d2, except for the region spanning 100–108 km at 60°N–80°N during the dayside and 100–105 km at 15°S–10°N during the nightside, changes in temperature in other regions increase in the relative change of NO emission. In summary, Figure 8 and Figure 9 collectively indicate that NO density and temperature generally exhibit a positive correlation with NO emission changes, with NO density variations having a more pronounced influence on NO emission variations. In contrast, changes in O density have a relatively smaller impact on the altitude–latitude distribution structure of NO emission variation due to the geomagnetic storm.

4. Conclusions

A CME in April 2023 triggered a severe geomagnetic storm, during which, the D s t index reached a minimum value of 213 nT at 05:00 UT on 24 April. This study examines the response of NO emission in the thermosphere to the geomagnetic storm, based on observations from the TIMED/SABER satellite and simulations from the TIEGCM. The main results are as follows:
(1)
Both the observed and the simulated NO emissions significantly increase during the geomagnetic storm. Furthermore, the enhancement depends on latitude and altitude.
(2)
Observational results show that NO emission exhibits asymmetric distributions during both the geomagnetic quiet period and the geomagnetic storm period, regardless of whether they are in the Southern or the Northern Hemisphere or on the dayside or nightside. During the storm, the peak altitude of NO emission in the Northern Hemisphere is approximately 2–10 km higher than in the Southern Hemisphere. Additionally, the peak emission on the nightside is stronger than that on the dayside, and the peak altitude on the dayside is about 2–8 km higher than that on the nightside. The NO emission enhancement extends from near 50° latitude towards the equator, with a stronger response on the nightside.
(3)
There are differences between the simulated and observed altitude–latitude distributions of NO emissions. Simulated emission around the equator is strong compared with that at higher latitudes, especially on the dayside, during both the geomagnetic quiet period and the geomagnetic storm period. In addition, the simulated emission on the dayside is stronger than that on the nightside. This is contrary to the observations, which show weak emission around the equator. However, the altitude–latitude distribution structure of relative variation in NO emission is generally similar between simulations and observations, with enhancement peaks around 50°S/N and the peak enhancement on the nightside being generally stronger than that on the dayside.
(4)
The intensity of NO emission is closely related to NO density, O density, and temperature. The simulation results indicate that changes in NO density and temperature during the geomagnetic storm lead to an increase in NO emission at most latitudes and altitudes. Changes in O density result in decreased NO emission north of approximately 35°N and increased emission south of 35°N. The simulation results suggest that the peak enhancements of NO emission around 50°S/N can be mainly attributed to changes in NO density.
It is worth mentioning that the latitude range covered by the TIMED/SABER observation is 52°S–83°N during the geomagnetic storm. Therefore, we simply present the results in the latitude range of 52°S–83°N in this work. Due to the lack of observations in the high-latitude region of the Southern Hemisphere, it is possible that the true NO emission peaks and enhancement peaks in the SH may be situated south of 50°S.

Author Contributions

Conceptualization, H.L., H.G., J.X., W.B. and Z.L. (Zhongmu Li); Methodology, J.X. and L.S.; Investigation, H.L., H.G. and Z.L. (Zheng Li); Writing–original draft, H.L.; Writing–review & editing, H.L., H.G., Z.L. (Zheng Li) and J.X.; Funding acquisition, H.G., W.B. and Z.L. (Zhongmu Li). All authors have read and agreed to the published version of the manuscript.

Funding

This work was funded by the National Natural Science Foundation of China, Grant number 41774160 and 42374207, the Youth Cross Team Scientific Research project of the Chinese Academy of Sciences, Grant number JCTD-2021-10, and the Pandeng Program of the National Space Science Center, the Chinese Academy of Sciences, and the Yunnan Academician Workstation of Wang Jingxiu, Grant number 202005AF150025.

Data Availability Statement

The original contributions presented in the study are included in the article, further inquiries can be directed to the corresponding author.

Acknowledgments

We acknowledge the SABER, the OMNIWeb, and the Community Coordinated Modeling Center (CCMC) for providing all necessary data for this study. We also thank Koltovskoi Igor for his suggestions during this work. The OMNIWeb data are available at: https://spdf.gsfc.nasa.gov/pub/data/omni (accessed on 1 April 2024) and the SABER data are available at: http://saber.gats-Inc.com/data.php (accessed on 1 April 2024). The TIEGCM simulation results have been provided by CCMC at Goddard Space Flight Center through their publicly available simulation services https://ccmc.gsfc.nasa.gov (accessed on 1 April 2024).

Conflicts of Interest

The authors declare no conflict of interest.

Appendix A

1. The TIEGCM
The TIEGCM was developed by the National Center for Atmospheric Research (NCAR). It is a comprehensive, first-principle, three-dimensional, nonlinear representation of the coupled thermosphere and ionosphere system. The TIEGCM evolved from the foundational Thermosphere General Circulation Model (TGCM). This evolutionary process entailed the incorporation of the ionosphere into the TGCM, resulting in the creation of the Thermosphere–Ionosphere General Circulation Model (TIGCM), as reported by refs. [5,14]. Following this, the TIGCM underwent significant enhancements through the implementation of self-consistent electrodynamics, ultimately giving rise to the development of the TIEGCM [19]. The model solves the three-dimensional momentum, energy, and continuity equations for neutral and ion species at each time step.
The code of the TIEGCM and user guide are provided on the website:
The detail descriptions of the model are given in the document:
In this study, the thermospheric temperature, major neutral components O2 and O, and the minor component NO are used. Furthermore, the neutral winds are needed to calculate the thermospheric temperature and components. In the document (model_description.pdf), the formulae for calculating the neutral winds, atmospheric temperature, major neutral components, and minor composition NO in the thermosphere are as follows:
(1) Neutral winds
The vertical velocity in the TIEGCM is derived through the resolution of the continuity equation pertaining to the thermospheric neutral gas. This continuity equation assumes the following mathematical form:
1 R c o s λ λ ( v n c o s λ ) + 1 R c o s λ u n ϕ + e z Z ( e z W ) = 0
where dimensionless vertical velocity W = d z d t , vertical velocity relative to a pressure level is obtained by integrating the continuity equation over Z to get W, and then W is multiplied by the scale height H,
The zonal and meridional momentum equation is solved to get the neutral horizontal velocities u n and v n . The momentum equation in the zonal direction can be written as:
u n t = g e z P 0 Z [ μ u n H Z ] + f c o r v n + λ x x ( v E x B , x u n ) + λ x y ( v E x B , y v n ) v n · u n + u n v n R E t a n λ 1 R E c o s λ Ψ ϕ w u n Z h d u
with λ x x and λ x y being the ion drag coefficients. The meridional momentum equation of the TIEGCM is defined as:
v n t = g e z P 0 Z [ μ v n H Z ] + f c o r v n + λ y y ( v E x B , x u n ) + λ y x ( v E x B , y u n ) v n · u n + u n v n R E t a n λ 1 R E Ψ λ w u n Z h d v
Horizontal diffusion h d u and h d v are also included in the momentum equations. The time rate of change in the horizontal velocity on the left-hand (1. term) side is equal to the forcing terms on the right-hand side. The forcing terms are the following, in this order: the vertical viscosity (2. term); the Coriolis force (3. term); the ion drag force (4. 5. term); the nonlinear horizontal advection (6. term) and momentum force (7. term); the pressure gradient force (8. term); and the vertical advection (9. term) and horizontal diffusion (10. term). Quoted from http://www.hao.ucar.edu/modeling/tgcm/ (accessed on 1 April 2024).
(2) Thermospheric temperature
The thermodynamic equation is solved to get the neutral temperature
T n t = g e z P 0 Z K T H T n Z + K E H 2 C P [ g C P + 1 H T Z ] v n · T n W ( T n Z + R * T n C P m ¯ ) + Q e x p e z L e x p C P L i m p T n
with TN being the neutral temperature, g the gravitational acceleration, Cp the specific heat per unit mass, P 0 the reference pressure, KT the molecular thermal conductivity, H the pressure scale height, v n the horizontal neutral velocity with the zonal and meridional components u n and v n , W the dimensionless vertical velocity given by W = d z d t , R * the universal gas constant, m ¯ the mean atmospheric mass, and Q and L being the heating and cooling rates, respectively.
(3) Major neutral components
The main neutral components of the thermosphere calculated by the TIEGCM are O2, O, and N2. The mass mixing ratio of these are:
ψ i = n i m i ( j = 1 3 n j m j ) 1
where n i represents the number density of the i th species and where i = 1, 2, 3 correspond to O2, O, and N2 respectively. The molecular mass of the i th species is denoted by m i . The vector of mass mixing ratios is then defined by:
ψ = ψ O 2 ψ O
The N 2  mass mixing ratio is determined by:
ψ N 2 = 1 ψ O 2 ψ O
The coupled vector equation for the mass mixing ratio vector is:
t ψ = e z τ 1 z [ m ¯ m N 2 ( T 00 T n ) 0.25 α 1 L ψ ] + e z z ( K ( z ) e z t ψ ) ( v n · ψ + W z ψ ) + S R
Given time t , the vertical coordinated z is defined as z = l n ( P 0 P ) , where P is the pressure and P 0 is the reference pressure. The diffusion time scale τ is calculated as τ = P 0 H o P 00 D o = 1.86 × 10 3 s, where H o is the characteristic molecular nitrogen scale height at T 00 = 273   K , P 00 = 10 5   P a , the characteristic diffusion coefficient at P 00 and temperature T 00 is D o = 210 5 m 2 / s . The mean molecular mass is denoted by m ¯ , and the molecular mass of each species is m i . The horizontal neutral velocity is represented by v n , while the “vertical” velocity W is defined as W = d z d t . K ( z ) is the eddy diffusion coefficient; S represents the effective mass source; and R is the removal rate.
(4) Minor component NO
NO (and HOx in the TIEGCM) is given by ref. [14]:
ψ t = e Z Z [ A ( Z E ) ψ ] + S ψ R V n · ψ + W n ψ Z + e Z [ e Z K E ( Z + 1 m ¯ m ¯ Z ) ψ ] + H s u b
where E ~ = [ 1 m m ¯ 1 m ¯ m ¯ Z ] α ~ 1 T n T n Z + F ~ ψ ~ . The vertical diffusion coefficient for molecules is denoted as A, while the production and loss terms are represented by S and R, respectively. The term E encompasses the influences of gravity, thermal diffusion, and friction with dominant species on the vertical distribution of two species, specifically Ox and O2. The matrix operator that models the frictional interactions is F ~ . Additionally, the thermal diffusion coefficient is α , the average molecular mass is m ¯ , and ψ signifies the mass mixing ratio of either NO, N( S 4 ), or HOx. In the TIEGCM, Ox is simply O.
2. The forcing of the TIEGCM
The external forcing of the TIEGCM is shown in the block diagram below. The inputs for the model include the solar input, magnetospheric input, and lower boundary. The brief explanations about the inputs are given below.
(1) Solar input
As shown in the diagram, both the EUVAC solar proxy model and the solar EUV measurements can provide the solar irradiance. The TIEGCM uses the EUVAC solar proxy model as its default solar input within the spectral range spanning from 5–105 nm. This model serves as an empirical depiction of solar irradiance and its fluctuations, comprising two key components: a reference spectrum representing solar minimum conditions and a wavelength-specific measure of solar variability. The latter is typically quantified using historically recorded solar indices, with the F10.7 index being the most widely used. To derive the solar flux at a particular level of solar activity, the F10.7 index and its 81-day average < F 10.7 > are utilized as follows:
The EUVAC model is used between 5 nm and 105 nm.
f ( λ ) = f r e f ( λ ) [ 1 + A ( λ ) ( P 80 ) ]
where f r e f is the reference spectrum, A is the solar variability factor, and P = ( F 10.7 + < F 10.7 > ) / 2 . The EUVAC model is based on the F74113 reference spectrum, with the EUV fluxes between 15 nm and 25 nm doubled and the EUV flux below 15 nm increased by a factor of 3; the solar variability scale factors are based on the AE-E and calibration rocket measurements.
Although solar proxy models have been widely used in aeronomy studies, solar irradiance can deviate significantly from empirical parameterizations, the TIEGCM has an option to use measured solar irradiance spectra directly. The TIMED/SEE instrument has measured solar spectral irradiance from 0.1–195 nm since 2002. It can be used as the solar input.
In this study, the EUVAC solar proxy model is used.
Figure A1. The external forcing of the TIEGCM and options (based on a block diagram given in a poster from Solomon et al. [39]). In this study, the options displayed in blue are used.
Remotesensing 16 03683 g0a1
(2) Magnetospheric input
The magnetospheric inputs encompass the high-latitude ion convection model (Heelis or Weimer 2005) and the aurora. The occurrence and characteristics of the aurora are contingent upon the Hemisphere Power (HP), with the auroral radius potentially influenced by the Cross Polar Cap Potential (CPCP) of both hemispheres. The convection process described by Heelis relies on the CPCP as well as the IMF By. The input parameters required for the Weimer 2005 model encompass the solar wind density N S W , its speed ( V S W ), and the IMF components, By and Bz.
For the Heelis model,
If K p 7
h p = 16.82 · e ( 0.32 K p ) 4.86
If K p > 7
h p = 153.13 + ( k p 7 ) ( 9 7 )   ( 300 153.13 )
c p c p = 15 + 15 K p + 0.8 K p 2
For the Weimer 2005 model,
If B z < 0
h p = ( 6.0 + 3.3 · a b s ( B z ) + 0.06 + 0.003 · a b s ( B z ) )
( m i n ( V S W , 700 ) 300 ) · f a c
If B z 0
h p = 5.0 + 0.05 · ( m i n ( V S W , 700 ) 300 ) · f a c
where f a c = 2.0.
In addition, in Figure A1, the LFM portion of the model solves the ideal MHD equations to simulate the interaction of the solar wind with the magnetosphere. A full description of the model can be found in ref. [44]. The MIX portion of the model provides electric field inner boundary condition information to the LFM and, when coupled to the TIEGCM, obtains conductance information needed for the calculation of the electric potential. Full details about the MIX model can be found in ref. [45].
In this study, the Weimer 2005 is used.
(3) Lower boundary
The TIEGCM utilizes a spherical coordinate system fixed relative to the rotating Earth, employing latitude and longitude as horizontal coordinates and pressure surfaces as vertical coordinates; the latitude changes cover from 87.5°S to 87.5°N, and the longitude changes cover all longitude ranges in the world [30,31]. The vertical direction is the pressure surface coordinates, specially defined as z = ln( P 0 P ), where P 0 is a fixed pressure, the size is 5 × 10⁻⁵ pa, and z changes from −7 to 7. The TIEGCM designates the lower boundary of the background thermosphere as the pressure level of −7 on the interface grid (at approximately 97 km). At the lower boundary, a constant background field for various parameters is established. Specifically, the geopotential height is set to 96.37229 km, the neutral temperature is maintained at 181.0 K, and both the zonal and meridional winds of the neutral atmosphere are set to zero. Notably, this background configuration remains constant throughout the year, independent of the specific day.
Tidal perturbations caused by solar radiation can be added to the background. Both models provide two ways of specifying the migrating tidal perturbations: Hough Modes and the Global Scale Wave Model (GSWM). However, the model team recommend using only the Global Scale Wave Model option to include tidal perturbations and using Hough Modes only for numerical experiments done by experienced users. The GSWM is a numerical model of planetary waves and solar tides in the Earth’s atmosphere from 0–125 km developed at the HAO (High Altitude Observatory), NCAR (National Center for Atmospheric Research), by M. Hagan. In this study, the tides are from the GSWM.
It should be noted that this appendix simply provides a brief introduction to the TIEGCM, so that readers who are unfamiliar with the model can get a general understanding of it. This introduction is mainly from http://www.hao.ucar.edu/modeling/tgcm/doc/description/model_description.pdf (accessed on 1 April 2024). For the detailed information about this model, please refer to this document (model_description.pdf) as well as the references provided above.

References

  1. Fuller-Rowell, T.J.; Codrescu, M.V.; Moffett, R.J.; Quegan, S. Response of the thermosphere and ionosphere to geomagnetic storms. J. Geophys. Res. 1994, 99, 3893–3914. [Google Scholar] [CrossRef]
  2. Richmond, A.D.; Lu, G. Upper-atmospheric effects of magnetic storms: A brief tutorial. J. Atmos. Sol. Terr. Phys. 2000, 62, 1115–1127. [Google Scholar] [CrossRef]
  3. Burns, A.; Killeen, T.; Deng, W.; Carignan, G.; Roble, R. Geomagnetic Storm Effects in the Low-Latitude to Middle-Latitude Upper Thermosphere. J. Geophys. Res. Space Phys. 1995, 100, 14673–14691. [Google Scholar] [CrossRef]
  4. Kockarts, G. Nitric oxide cooling in the terrestrial thermosphere. Geophys. Res. Lett. 1980, 7, 137–140. [Google Scholar] [CrossRef]
  5. Roble, R.G.; Ridley, E.C.; Dickinson, R.E. On the global mean structure of the thermosphere. J. Geophys. Res. Space Phys. 1987, 92, 8745–8758. [Google Scholar] [CrossRef]
  6. Lei, J.; Burns, A.G.; Thayer, J.P.; Wang, W.B.; Mlynczak, M.G.; Hunt, L.A.; Dou, X.K.; Sutton, E. Overcooling in the upper thermosphere during the recovery phase of the 2003 October storms. J. Geophys. Res. Atmos. 2012, 117, A03314. [Google Scholar] [CrossRef]
  7. Mlynczak, M.G.; Martine-Torres, F.J.; Russell, J.; Jacobson, S.; Kozyra, J.; Lopez-Puertas, M.; Funke, B.; Mertens, C.; Gordley, L.; Picard, R.; et al. The natural thermostat of nitric oxide emission at 5.3 μm in the thermosphere observed during the solar storms of April 2002. Geophys. Res. Lett. 2003, 30, 2100. [Google Scholar] [CrossRef]
  8. Mlynczak, M.G.; Martin-Torres, F.J.; Crowley, G.; Kratz, D.P.; Funke, B.; Lu, G.; Lopez-Puertas, M.; Russell, J.M., III; Kozyra, J.; Mertens, C.; et al. Energy transport in the thermosphere during the solar storms of April 2002. J. Geophys. Res. Space Phys. 2005, 110, A12S25. [Google Scholar] [CrossRef]
  9. Barth, C.A. Nitric oxide in the lower thermosphere. Planet. Space Sci. 1992, 40, 315–336. [Google Scholar] [CrossRef]
  10. Sharma, R.D.; Dothe, H.; Duff, J.W. Model of the 5.3 μm radiance from NO during the sunlit terrestrial thermosphere. J. Geophys. Res. Space Phys. 1998, 103, 14753–14768. [Google Scholar] [CrossRef]
  11. Dobbin, A.L.; Aylward, A.D.; Harris, M.J. Three-dimensional GCM modeling of nitric oxide in the lower thermosphere. J. Geophys. Res. Space Phys. 2006, 111, A07314. [Google Scholar] [CrossRef]
  12. Dobbin, A.L.; Griffin, E.M.; Aylward, A.D.; Millward, G.H. 3-D GCM Modelling of Thermospheric Nitric Oxide during the 2003 Halloween Storm. Ann. Geophys. 2006, 24, 2403–2412. [Google Scholar] [CrossRef]
  13. Siskind, D.E.; Barth, C.A.; Roble, R.G. The response of thermospheric nitric oxide to an auroral storm: 1. Low and middle latitudes. J. Geophys. Res. Space Phys. 1989, 94, 16885–16898. [Google Scholar]
  14. Roble, R.G.; Ridley, E.C.; Richmond, A.D.; Dickinson, R.E. A coupled thermosphere/ionosphere general circulation model. Geophys. Res. Lett. 1988, 15, 1325–1328. [Google Scholar] [CrossRef]
  15. Bag, T. Local Time Hemispheric Asymmetry in Nitric Oxide Radiative Emission During Geomagnetic Activity. J. Geophys. Res-Space Phys. 2018, 123, 9669–9681. [Google Scholar] [CrossRef]
  16. Bailey, S.M.; Barth, C.A.; Solomon, S.C. A model of nitric oxide in the lower thermosphere. J. Geophys. Res. Space Phys. 2002, 107, SIA 22-1–SIA 22-12. [Google Scholar] [CrossRef]
  17. Barth, C.A.; Lu, G.; Roble, R.G. Joule heating and nitric oxide in the thermosphere. J. Geophys. Res. Space Phys. 2009, 114, A05301. [Google Scholar] [CrossRef]
  18. Barth, C.A. Joule heating and nitric oxide in the thermosphere, 2. J. Geophys. Res. Space Phys. 2010, 115, A10305. [Google Scholar] [CrossRef]
  19. Li, Z.; Knipp, D.; Wang, W. Understanding the behaviors of thermospheric nitric oxide cooling during the 15 May 2005 geomagnetic storm. J. Geophys. Res. Space Phys. 2019, 124, 2113–2126. [Google Scholar] [CrossRef]
  20. Caledonia, G.E.; Kennealy, J.P. NO infrared emission in the upper atmosphere. Planet. Space Sci. 1982, 30, 1043–1056. [Google Scholar] [CrossRef]
  21. Sharma, R.; Dothe, H.; Esse, F.V.; Kharchenko, V.A.; Sun, Y.; Dalgarno, A. Production of vibrationally and rotationally excited NO in the night time terrestrial thermosphere. J. Geophys. Res. Space Phys. 1996, 101, 19707–19713. [Google Scholar]
  22. Hendrickx, K.; Megner, L.; Daniel, R.; Marsh Gumbel, J.; Strandberg, R.; Martinsson, F. Relative Importance of Nitric Oxide Physical Drivers in the Lower Thermosphere. Geophys. Res. Lett. 2017, 44, 10081–10087. [Google Scholar] [CrossRef]
  23. Lu, G.; Mlynczak, M.G.; Hunt, L.A.; Woods, T.N.; Roble, R.G. On the relationship of Joule heating and nitric oxide radiative cooling in the thermosphere. J. Geophys. Res. Space Phys. 2010, 115, A05306. [Google Scholar] [CrossRef]
  24. Lei, J.; Thayer, J.P.; Lu, G.; Burns, A.G.; Wang, W.B.; Sutton, E.K.; Emery, B.A. Rapid recovery of thermosphere density during the October 2003 geomagnetic storms. J. Geophys. Res. 2011, 116, A03306. [Google Scholar] [CrossRef]
  25. Sheng, C.; Lu, G.; Solomon, S.C.; Wang, W.B.; Doornbos, E.; Hunt, L.A.; Mlynczak, M.G. Thermospheric recovery during the 5 April 2010 geomagnetic storm. J. Geophys. Res. Space Phys. 2017, 122, 4588–4599. [Google Scholar] [CrossRef]
  26. Li, Z.; Knipp, D.; Wang, W.B.; Sheng, C.; Qian, L.Y.; Flynn, S. A Comparison Study of NO Cooling Between TIMED/SABER Measurements and TIEGCM Simulations. J. Geophys. Res. Space Phys. 2018, 123, 8714–8729. [Google Scholar] [CrossRef]
  27. Bharti, G.; SunilKrishna, M.V.; Bar, T.; Jain, P. Storm Time Variation of Radiative Cooling by Nitric Oxide as Observed by TIMED-SABER and GUVI. J. Geophys. Res. Space Phys. 2018, 123, 1500–1514. [Google Scholar] [CrossRef]
  28. Russell, J.M., III; Mlynczak, M.G.; Gordley, L.L.; Tansock, J.J., Jr.; Esplin, R.W. An Overview of the SABER Experiment and Preliminary Calibration Results. Proc. SPIE 1999, 3756, 277–288. [Google Scholar]
  29. Richmond, A.D. Ionospheric electrodynamics using magnetic apex coordinates. J. Geomagn. Geoelectr. 1995, 47, 191–212. [Google Scholar] [CrossRef]
  30. Wang, W.; Burns, A.G.; Wiltberger, M.; Solomon, S.C.; Killeen, T.L. Altitude variations of the horizontal thermospheric winds during geomagnetic storms. J. Geophys. Res. Space Phys. 2008, 113, A02301. [Google Scholar] [CrossRef]
  31. Qian, L.; Burns, A.; Emery, B.; Foster, B.; Lu, G.; Maute, A.; Richmond, A.; Roble, R.G.; Solomon, S.; Wang, W. The NCAR TIE-GCM: A community model of the coupled thermosphere/ionosphere system. Geophys. Monogr. Ser. 2013, 201, 73–83. [Google Scholar]
  32. Mlynczak, M.G.; Hunt, L.A.; Thomas Marshall, B.; Martin-Torres, F.J.; Mertens, C.J.; Russell, J.M., III; Remsberg, E.E.; López-Puertas, M.; Picard, R.; Winick, J.; et al. Observations of infrared radiative cooling in the thermosphere on daily to multiyear timescales from the TIMED/SABER instrument. J. Geophys. Res. 2010, 115, A03309. [Google Scholar] [CrossRef]
  33. Roble, R.G. Energetics of the Mesosphere and Thermosphere; Johnson, R.M., Killeen, T.L., Eds.; Geophysical Monograph Series; American Geophysical Union: Washington, DC, USA, 1995; Volume 87, pp. 1–22. [Google Scholar]
  34. Bates, D.R. The Temperature of the Upper Atmosphere. Proc. Phys. Soc. Sect. B 1951, 64, 805–821. [Google Scholar] [CrossRef]
  35. Hagan, M.E.; Burrage, M.D.; Forbes, J.M.; Hackney, J.; Randel, W.J.; Zhang, X. GSWM-98: Results for migrating solar tides. J. Geophys. Res. 1999, 104, 6813–6827. [Google Scholar] [CrossRef]
  36. Murphy, R.E.; Lee, E.T.P.; Hart, A.M. Quenching of vibrationally excited nitric oxide by molecular oxygen and nitrogen. J. Chem. Phys. 1975, 63, 2919–2925. [Google Scholar] [CrossRef]
  37. Weimer, D.R. Improved ionospheric electrodynamic models and application to calculating Joule heating rates. J. Geophys. Res. Space Phys. 2005, 110, A05306. [Google Scholar] [CrossRef]
  38. Li, Z.; Sun, M.; Li, J.Y.; Zhang, K.D.; Zhang, H.; Xu, X.J.; Zhao, X.H. Significant Variations of Thermospheric Nitric Oxide Cooling during the Minor Geomagnetic Storm on 6 May 2015. Universe 2022, 8, 236. [Google Scholar] [CrossRef]
  39. Solomon, S.C.; Barth, C.A.; Bailey, S.M. Auroral production of nitric oxide measured by the SNOE satellite. Geophys. Res. Lett. 1999, 26, 1259–1262. [Google Scholar] [CrossRef]
  40. Ren, Z.P.; Wan, W.X.; Liu, L.B. GCITEM-IGGCAS: A new global coupled ionosphere–thermosphere-electrodynamics model. J. Atmos. Sol. Terr. Phys. 2009, 71, 2064–2076. [Google Scholar] [CrossRef]
  41. Richards, P.G. On the increases in nitric oxide density at midlatitudes during ionospheric storms. J. Geophys. Res. Space Phys. 2004, 109, A06304. [Google Scholar] [CrossRef]
  42. Crowley, G.; Emery, B.A.; Roble, R.G.; Carlson, H.C., Jr.; Knipp, D.J. Thermospheric dynamics during September 18–19, 1984, 1. Model simulations. J. Geophys. Res. 1989, 94, 16925–16944. [Google Scholar]
  43. Bag, T.; Singh, V.; Krishna, M.V.S. Study of atomic oxygen greenline dayglow emission in thermosphere during geomagnetic storm conditions. Adv. Space Res. 2017, 59, 302–310. [Google Scholar] [CrossRef]
  44. Lyon, J.G.; Fedder, J.A.; Mobarry, C.M. The Lyon-Fedder-Mobarry (LFM) global MHD magnetospheric simulation code. J. Atmos. Sol. Terr. Phys. 2004, 66, 1333–1350. [Google Scholar] [CrossRef]
  45. Merkin, V.G.; Lyon, J.G. Effects of the low-latitude ionospheric boundary condition on the global magnetosphere. J. Geophys. Res. 2010, 115, A10202. [Google Scholar] [CrossRef]
Figure 1. Temporal distribution of (a) By, (b) B z , (c) solar wind speed, (d) Dst index, and (e) F10.7 index from 22–26 April 2023.
Remotesensing 16 03683 g001
Figure 2. Altitude–latitude distribution of NO VER observed by the TIMED/SABER satellite on the dayside (a1e1) and nightside (a2e2) from 22–26 April 2023.
Remotesensing 16 03683 g002
Figure 3. Altitude–latitude distribution of relative variations in NO VER observed by the TIMED/SABER satellite on the dayside (a1e1) and nightside (a2e2) from 22–26 April 2023.
Remotesensing 16 03683 g003
Figure 4. Altitude–latitude distribution of NO VER on the dayside (a1e1) and nightside (a2e2) from 22–26 April 2023, simulated by the TIEGCM.
Remotesensing 16 03683 g004
Figure 5. Altitude–latitude distribution of NO VER relative variation on the dayside (a1e1) and nightside (a2e2) from 22–26 April 2023, simulated by the TIEGCM.
Remotesensing 16 03683 g005
Figure 6. Temporal dayside distribution of D s t index (a), altitude–latitude distributions of relative variations in the TIEGCM-simulated NO density (a1e1), O density (a2e2), and temperature (a3e3) from 22–26 April 2023.
Remotesensing 16 03683 g006
Figure 7. Same as Figure 6 but for the nightside, Temporal nightside distribution of D s t index (a), altitude–latitude distributions of relative variations in the TIEGCM-simulated NO density (a1e1), O density (a2e2), and temperature (a3e3) from 22–26 April 2023.
Remotesensing 16 03683 g007
Figure 8. Altitude–latitude distributions of the TIEGCM-simulated NO VER on 22 April (a1,a2), variations in NO VER respectively caused by changes in NO density (b1,b2), O density (c1,c2), and temperature (d1,d2) on 24 April compared with 22 April, and the TIEGCM-simulated NO VER on 24 April (e1,e2) on both the dayside (upper row) and nightside (lower row).
Remotesensing 16 03683 g008
Figure 9. Altitude–latitude distributions of the TIEGCM-simulated NO VER relative variations on 22 April (a1,a2), variations in NO VER relative variations respectively caused by changes in NO density (b1,b2), O density (c1,c2), and temperature (d1,d2) on 24 April compared with 22 April, and the TIEGCM-simulated NO VER relative variations on 24 April (e1,e2) on both the dayside (upper row) and nightside (lower row).
Remotesensing 16 03683 g009
Disclaimer/Publisher’s Note: The statements, opinions and data contained in all publications are solely those of the individual author(s) and contributor(s) and not of MDPI and/or the editor(s). MDPI and/or the editor(s) disclaim responsibility for any injury to people or property resulting from any ideas, methods, instructions or products referred to in the content.