Article

Solar Cycle Dependence of Migrating Diurnal Tide in the Equatorial Mesosphere and Lower Thermosphere

1
State Key Laboratory of Space Weather, National Space Science Center, Chinese Academy of Sciences, Beijing 100090, China
2
College of Earth and Planetary Sciences, University of Chinese Academy of Sciences, Beijing 100049, China
3
Key Laboratory of Science and Technology on Environmental Space Situation Awareness, Chinese Academy of Sciences, Beijing 100190, China
4
School of Astronomy and Space Science, University of Chinese Academy of Sciences, Beijing 100049, China
*
Author to whom correspondence should be addressed.
Remote Sens. 2024, 16(18), 3437; https://doi.org/10.3390/rs16183437
Submission received: 9 July 2024 / Revised: 13 September 2024 / Accepted: 13 September 2024 / Published: 16 September 2024

Abstract

:
Atmospheric migrating diurnal tide (DW1) is one of the prominent variabilities in the mesosphere and lower thermosphere (MLT). The existence of the solar cycle dependence of DW1 is debated, and there exist different and even opposite findings at different latitudes. In this paper, the solar cycle dependence of temperature DW1 in the equatorial mesosphere and lower thermosphere (MLT) is investigated using temperature global observations from TIMED/SABER spanning 22 years (2002–2023). The results show that (a) the solar cycle dependence of temperature DW1 is seen very clearly at the equator. The maximum correlation coefficient between DW1 and the F10.7 index occurs at 87km, with 0.72; the second maximum coefficient occurs at 99 km, with 0.62. The coefficient could reach 0.87 at 87 km and 0.67 at 99 km after dropping the years influenced by the Stratosphere Quasi-biennial oscillation (SQBO) disruption event. (b) DW1 shows a lag response to the solar cycle at the equator. DW1 amplitudes show a 1-year lag to the F10.7 index at 87 km and a 2-year lag to the F10.7 index at 99 km.

Graphical Abstract

1. Introduction

Atmospheric solar tide could propagate upward and exhibit large amplitudes in the mesosphere and lower thermosphere (MLT) region [1]. Atmospheric tides are planetary-scale harmonic waves that occur within the period of a solar day. The periods of solar tides are usually 24 h, 12 h, 8 h, and 6 h. The solar tides with these periods are called diurnal, semidiurnal, terdiurnal, and quarter-diurnal tides. Among those tides, the migrating diurnal tide (DW1) is one of the most significant components. It could transport momentum into the MLT and play an important role in the dynamics of this region [2]. Stratosphere Quasi-biennial oscillation (SQBO) and El Niño-Southern Oscillation (ENSO) have been reported to modulate DW1 [3,4]. The solar cycle (SC) is also an important external force. DW1 is expected to be influenced by the solar cycle as well [5,6].
The existence of the solar cycle dependence of DW1 has been debated for a long time. Studies providing ground-based observations have shown inconsistent results in relation to diurnal tides. For example, using low-frequency radar at 51°N, 13°E, Bremer et al. [7] reported a small SC response to diurnal tides. Baumgaertner et al. [8] revealed a negative response to SC at Scott Base, Antarctica (78°S, 167°E). With observations at Tirunelveli (8.5°N, 77°E), Sridharan et al. [9] and Singh and Gurubaran [6] reported a negative response of meridional and zonal wind diurnal tides to the solar cycle. Using meteor radar observations at Cachoeira Paulista (22.7°S, 45°W), Guharay et al. [10] and Andrioli et al. [11] reported the seasonality of the tides responses to the solar cycle. This discrepancy may be because the DW1 may not be separated based on single-station measurements. Moreover, the response of the solar cycle in diurnal tide components varied at different latitudes [12]. To separate DW1 from the diurnal tides and examine the solar cycle variation of DW1, global-scale observations are necessary.
There are also inconsistent conclusions regarding the existence of DW1 solar cycle dependence revealed by space-borne observations [5,12,13]. Using Thermosphere–Ionosphere–Mesosphere Energetics and Dynamics (TIMED) Doppler interferometer (TIDI) observations from 2002 to 2016, Dhadly et al. [5] found no clear evidence of any solar cycle dependence in the wind DW1 component. While with TIDI from 2004 to 2014, Wu et al. [13] revealed that DW1 amplitude is negatively correlated with the solar cycle during early winter. With 20 years of TIDI observations, Liu et al. [12] revealed that DW1 shows uniformly negative solar cycle responses in their respective peak regions. Different lengths of TIDI observations reveal the opposite conclusion. For the temperature component, Vitharana et al. [14] reported a positive response in terms of the F10.7 index around 100 km at the equator using Sounding of the Atmosphere using Broadband Emission Radiometry (SABER) observations from 2002 to 2016. Singh and Gurubaran [6] also reported a solar cycle signature in the diurnal tide estimated from SABER temperature observations from 2002 to 2011. Baumgaertner et al. [8] proposed the large inter-annual variability observed in some parameters suggests the importance of long records in identifying precise climatological values. The longer record may satisfy the need to analyze variability like the solar cycle (~11 years).
Currently, there are several different conclusions on the existence of the solar cycle dependence of DW1. There needs to be more sufficient evidence to prove its existence or not. Furthermore, confirming the solar cycle dependence of DW1 may improve the understanding of solar forcing–atmosphere interactions. DW1 originates from the troposphere and stratosphere and propagates upward. If solar cycle dependence exists, where and how does the solar exert its influence on it?
In this study, based on SABER/TIMED temperature observations from 2002 to 2023 (~22 years), the solar cycle dependence of temperature DW1 in the equatorial MLT is investigated. The article is organized as follows: Section 2 introduces TIMED/SABER data and the methodologies to extract the migrating tides. Section 3 presents the solar cycle dependence feature revealed by SABER/TIMED temperature observations. The mechanism of DW1 solar cycle dependence is discussed in Section 4. Section 5 presents the conclusions.

2. Data and Methods

The TIMED satellite is in a near sun-synchronal orbit with a 73° inclination at about 625 km. The orbital period is about 1.6 h. SABER, an instrument in the TIMED satellite, is a 10-channel broadband (1.27–17 μm) limb-scanning infrared radiometer. SABER observations of infrared radiance are used to retrieve kinetic temperature, geopotential height, etc. The kinetic temperature is selected to analyze the tides’ activities. Kinetic temperature is derived using a full non-LTE inversion algorithm [15,16] with the combination of the measured 15 μm CO2 vertical emission profile and the diurnally averaged CO2 volume mixing ratio (VMR) calculated using the Whole Atmosphere Community Climate Model (WACCM) [17]. The data latitudinal coverage every 60 days extends from 53°N to 83°S or 53°S–83°N. Temperature observations taken from version 2.07 data from 2002 to 2019 and version 2.08 data from 2020 to 2023 are used. For details on the change in version, refer to Mlynczak et al. [18]. The retrieved temperature observations used in this work cover altitudes from approximately 25 km to 105 km.
Non-uniform SABER observational data were processed into evenly distributed grid data to extract the solar tide. The procedures are as follows. Firstly, the kinetic temperature observational profiles are interpolated vertically with a 1 km spacing from 25 km to 105 km. Profiles of each day are sorted into two groups by local time, corresponding to the ascending and descending phases. Due to the characteristics of a near sun-synchronal orbit, the SABER observations at the ascending and descending phases are centered nearly at two local times each day, respectively. Secondly, the irregular data at whole heights and in both groups were interpolated to grid data using a cubic spline fitting, covering latitudes from 50°S to 50°N and longitudes from 0° to 360° with a resolution of 5° × 10°. Then, the zonal mean temperature was calculated for each latitude, height, and group. Finally, ascending and descending phase data over 60 days were combined to cover nearly 24 h of local time as the combinational data.
At a fixed latitude and height, the following equation is used to extract the tide from the combinational data:
1 2 0 2 π T t L T , λ d λ = T ¯ + η t t 0 + j = 1 J A j t w c o s j ω t L T + j = 1 J B j t w s i n j ω t L T
where ω = 2 π 24 , t L T is the local time, and λ is longitude. On the right section of the equation, T ¯ denotes the 60-day average of the temperature in the window; the second term is the linear trend of the window: t is day of the window and t 0 is the center day of the window; the third and fourth terms denote the superimposed harmonic signals by four periods migrating tides, including diurnal tide (DW1), semidiurnal tide (SW2), terdiurnal tide (TW3), and 6 h tide (QW4). The tw (tide wave) represents the migrating tide wave in Equation (1). The amplitude and phase of each migrating tide are retrieved using A j 2 + B j 2 and a r c t a n ( B j / A j ) , respectively. The overlapping analyses are obtained by sliding the 60-day window forward in 1-day intervals to obtain the daily values of the wave characteristics. Figure 1 shows an example of the full processing procedure. For detail of the methods used for data processing and tide extraction, refer to Xu et al. [19,20].
Migrating tides, especially DW1, exhibit day-to-day variability [21]. In this study, the method used to extract migrating tide used a 60-day window. Under the circumstances, the amplitude and phase are the average of the 60-day result. The day-to-day variation is averaged. This feature is valid for revealing for time scales larger than 2 months. The decadal features are actually not affected by the flaws of this method. A zonal mean process is also applied to remove non-migrating tides and stationary planetary waves before extracting the migrating tides. Due to background temperature semiannual oscillations (SAOs) in the mesosphere [22], aliasing from tides to the zonal mean temperature is possible. Xu et al. [19] confirmed that broad local time coverage like TIMED/SABER could avoid tidal aliasing to a great extent. Mesosphere temperature SAO does not contaminate the tides. Thus, the extracting method ensures the reliability of the features analyzed from the DW1 amplitude time series.
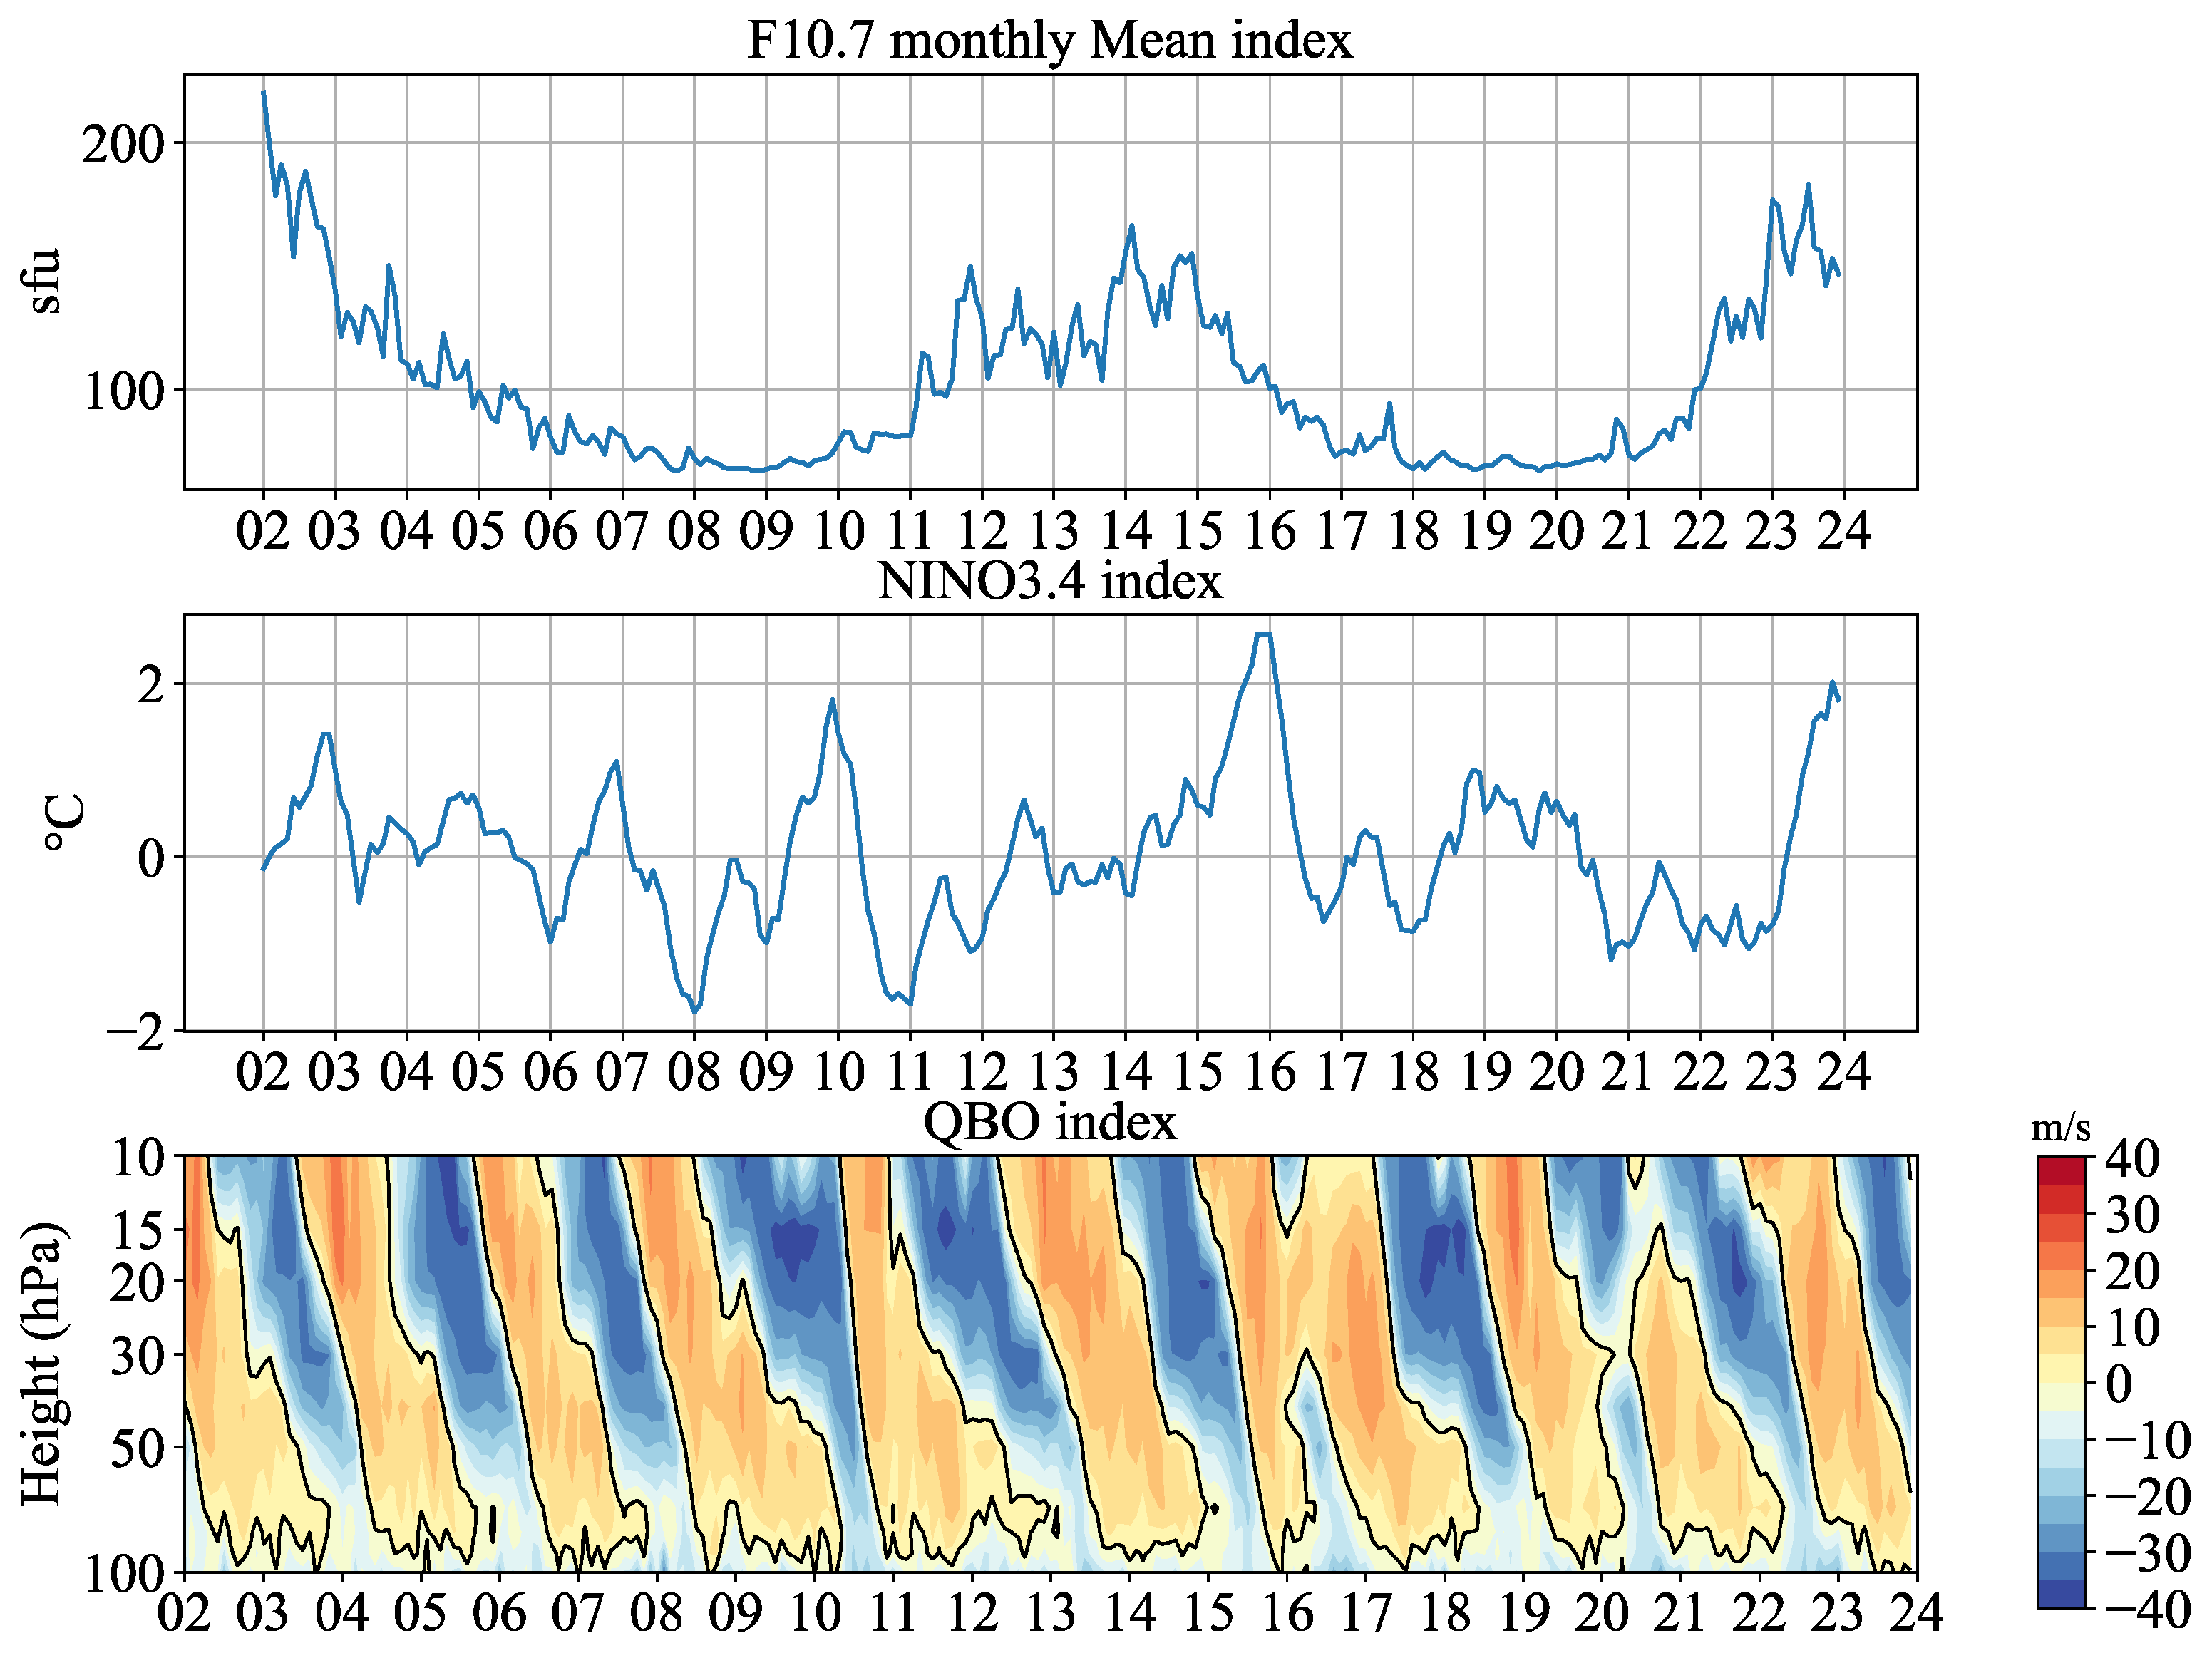
Multiple linear regression (MLR) is applied to quantify the influence of the different external forcings of DW1. The forcings involved are as follows: Stratosphere Quasi-biennial oscillation (SQBO), El Niño-Southern Oscillation (ENSO), and the solar cycle. SQBO employs monthly mean zonal wind values derived from daily Singapore sonde. The ENSO applies the NINO3.4 index, which is the sea surface temperature (SST) anomaly averaged over 120–170°W and 5°S–5°N. F10.7 is a 10.7 cm solar flux, which is expressed in sfu, where 1 sfu = 10−22 Wm−2Hz−1. The index used in this study is shown in Figure 2.
The fitting equation is as follows:
A r e s t i = i = 1 N α i Q B O i t i + β N I N O 3.4 t i + γ F 10.7 t i + δ t i + b + ε t i
A r e s is the DW1 de-seasonalized monthly mean amplitude, which is processed by 12-month moving average. The ti in Equation (2) is the month of the monthly mean amplitude series. N represents the number of QBO layers. The regression coefficients ( α i ,   β and γ) indicate the responses of A r e s to SQBO at a single layer or multilayers, NINO3.4 and F10.7, respectively. These parameters are also processed as a 12-month moving average. The regression coefficient δ is the long-term trend. b is the intercept. ε t i is the residual. For details on the MLR method used for the long-term components, refer to Vitharana et al. [14]. The coefficient of determination (R-square) is used to evaluate the fitting result. The equation is as follows:
R 2 = 1 1 n y p r e   i y t r u e   i 2 1 n y t r u e m e a n y t r u e i   2 ,   i   ( 1 , n )
where y p r e   i is the prediction, y t r u e   i is the observations, y t r u e m e a n is the mean of the observations, and n is the number of the total observations. The closer R 2 is to 1, the better the fitting while the closer R 2 is to 0, the worse the fitting.
The QBO component given by the MLR method still differs from the observations. The solar cycle component of DW1 is not revealed in sufficient detail after subtracting the DW1 QBO component. Because of this, ensemble empirical mode decomposition (EEMD) is introduced to extract the QBO signal. It is an adaptive time-frequency data analysis method based on empirical mode decomposition (EMD) [23]. This characteristic meets the need to detect QBO signals, which are changing periods. Data X are regarded as a combination of several intrinsic mode functions (IMFs) C and residual R in this method. The equation is as follows:
X = i = 1 N C i + R
where N in Equation (4) is the number of IMFs. The IMFs number N is estimated by assessing the length of the data. The determination of the IMF is based on the local minima and maxima. Firstly, the envelope of the local minima and maxima using a cubic spline method is generated. Then, the minima and maxima envelopes are averaged and subtracted from the raw data. The residual of the data continues the former steps until the stoppage criteria are met. The stoppage occurs when the average of the minima and maxima envelope is 0. This residual is one of the IMFs. Subtract this IMF from the raw data and repeat the procedure until no meaningful IMFs are extracted. The algorithm used referred to Wu et al. [24] and Zou et al. [25]. To alleviate the problem of mode mixing, EEMD applies the ensemble means method. Firstly, white noise was added to the raw data, and the IMFs were extracted from this data series. The steps above were repeated several times and the corresponding IMFs were averaged as the final result. With this method, the chance of scale mixing is reduced [26]. To examine whether the EEMD method could separate the physical variation of DW1, the power spectrum method was applied to validate if the IMF could correspond to the period of physical variation.

3. Solar Cycle Dependence of Temperature DW1

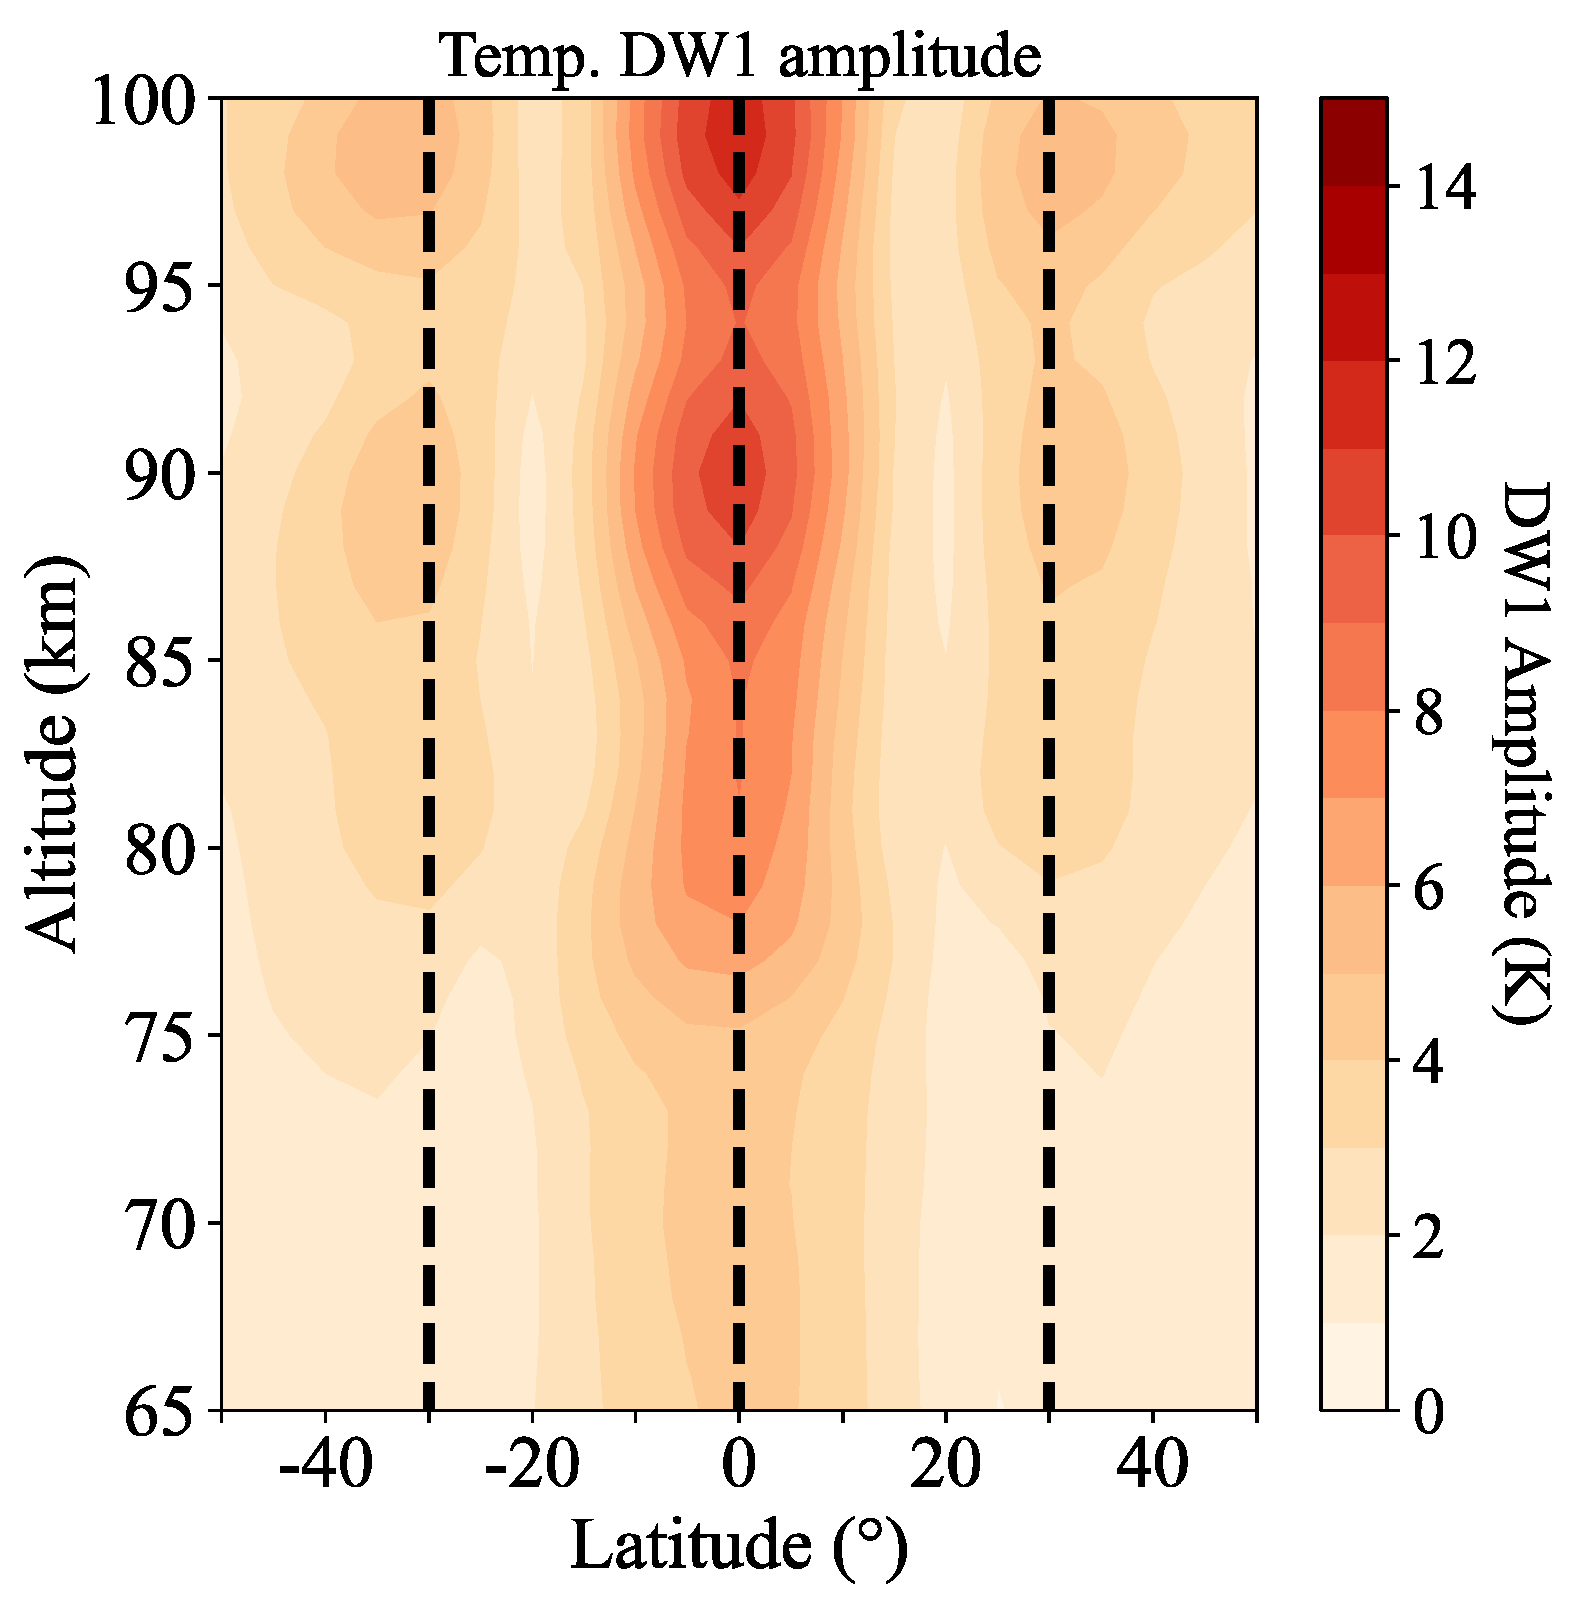
The altitude–latitude distribution of DW1 amplitude obtained via the average for 2002–2023 is shown in Figure 3. The latitude distribution agrees with the theoretical calculation results. The peaks are located at 30°S, 0°, and 30°N. This result is consistent with former works (e.g., Liu et al. [27], Gu and Du [28], and Garcia [3]). Regarding height distribution, the peaks are located at 90 km and 99 km, with the largest amplitude at 99 km.
The QBO component of DW1 is comparable to the semiannual oscillation (SAO), which is one of the prominent components of DW1 amplitude [20]. There have been several works suggesting that SQBO modulates DW1 (e.g., Garcia [3]; Pramith et al. [29]). So, when modeling the DW1 amplitude using Equation (2), selecting the SQBO index is crucial. Picking the best single SQBO index at any altitude or two SQBO indices in quadrature helps reproduce the QBO component and model the DW1 variations. Usually, two-layer QBO indices in quadrature capture the QBO signal’s downward propagation over several months [30]. To evaluate which SQBO index or SQBO combinations are the indices, the R-squared of the average region is computed. The average area corresponds to the peaks in Figure 3. The latitude covers 35–25°S, 5°S–5°N, and 25–35°N. The altitude covers 80–100 km. Table 1 shows the result of the average R-square using the MLR method with different QBO indices combinations and the correlation coefficient between two QBO indices. From Table 1, the largest R-square occurs from the 40 to 15 hPa QBO indices combination, which is 0.48. The correlation coefficient between both is −0.15, which means that these two QBO indexes are nearly in quadrature. Based on the results, the QBO term shown in Equation (2) is 40 hPa and 15 hPa in the QBO indices combination.
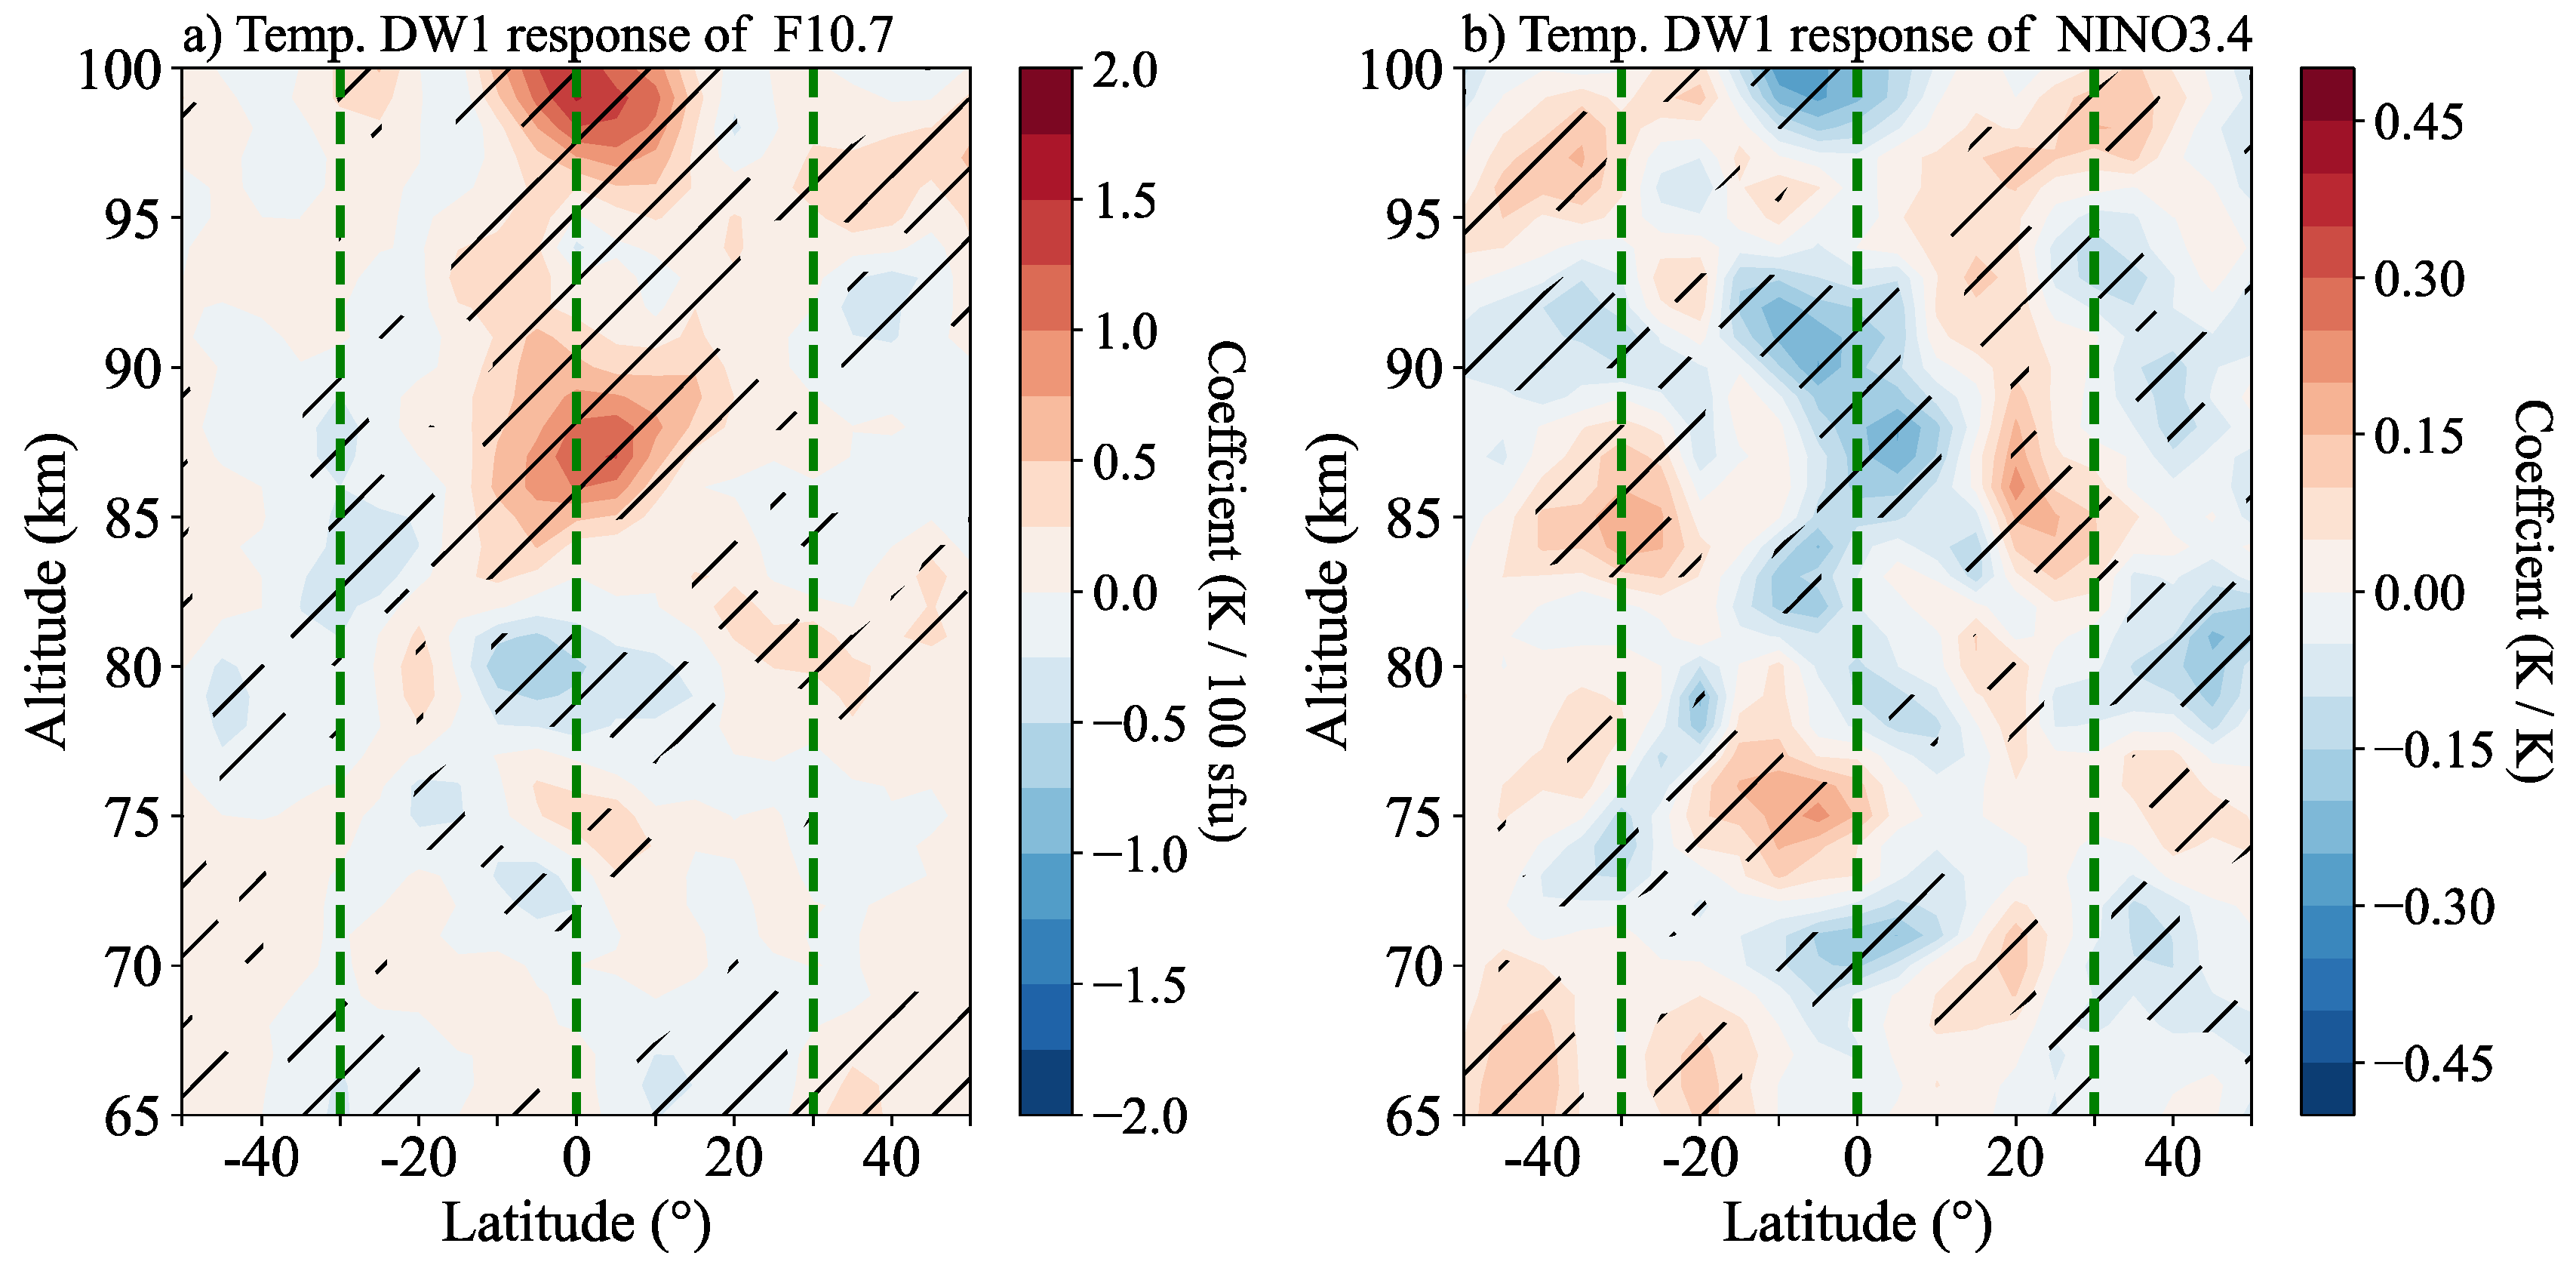
Figure 4a shows the DW1 response to the F10.7 index as a function of height and latitude revealed using the MLR method. The oblique line region indicates the coefficients over the 95% significance level. According to the DW1 peak distribution shown in Figure 3, only the responses of the solar cycle at 30°N/S and the equator are considered. As depicted in Figure 4a, the equatorial most significant response is mainly found at around 87 km and 99 km. The responses are 1.2 K/100 sfu and 1.54 K/100 sfu. Responses at 30°S and 30°N (green vertical lines on both sides) are too weak and will not be considered. Then, the amplitude series at the latitude and height mentioned above are selected. The reconstructed QBO component obtained from the MLR method is subtracted from DW1 de-seasonalized monthly mean amplitude. This processing removes the strong modulation of SQBO [3] to the temperature DW1 and leaves solar cycle variability and ENSO variability. However, the ENSO response is relatively small (Figure 4b). The ENSO effect is ignored. The series subtract QBO component could be regarded as the solar cycle series.
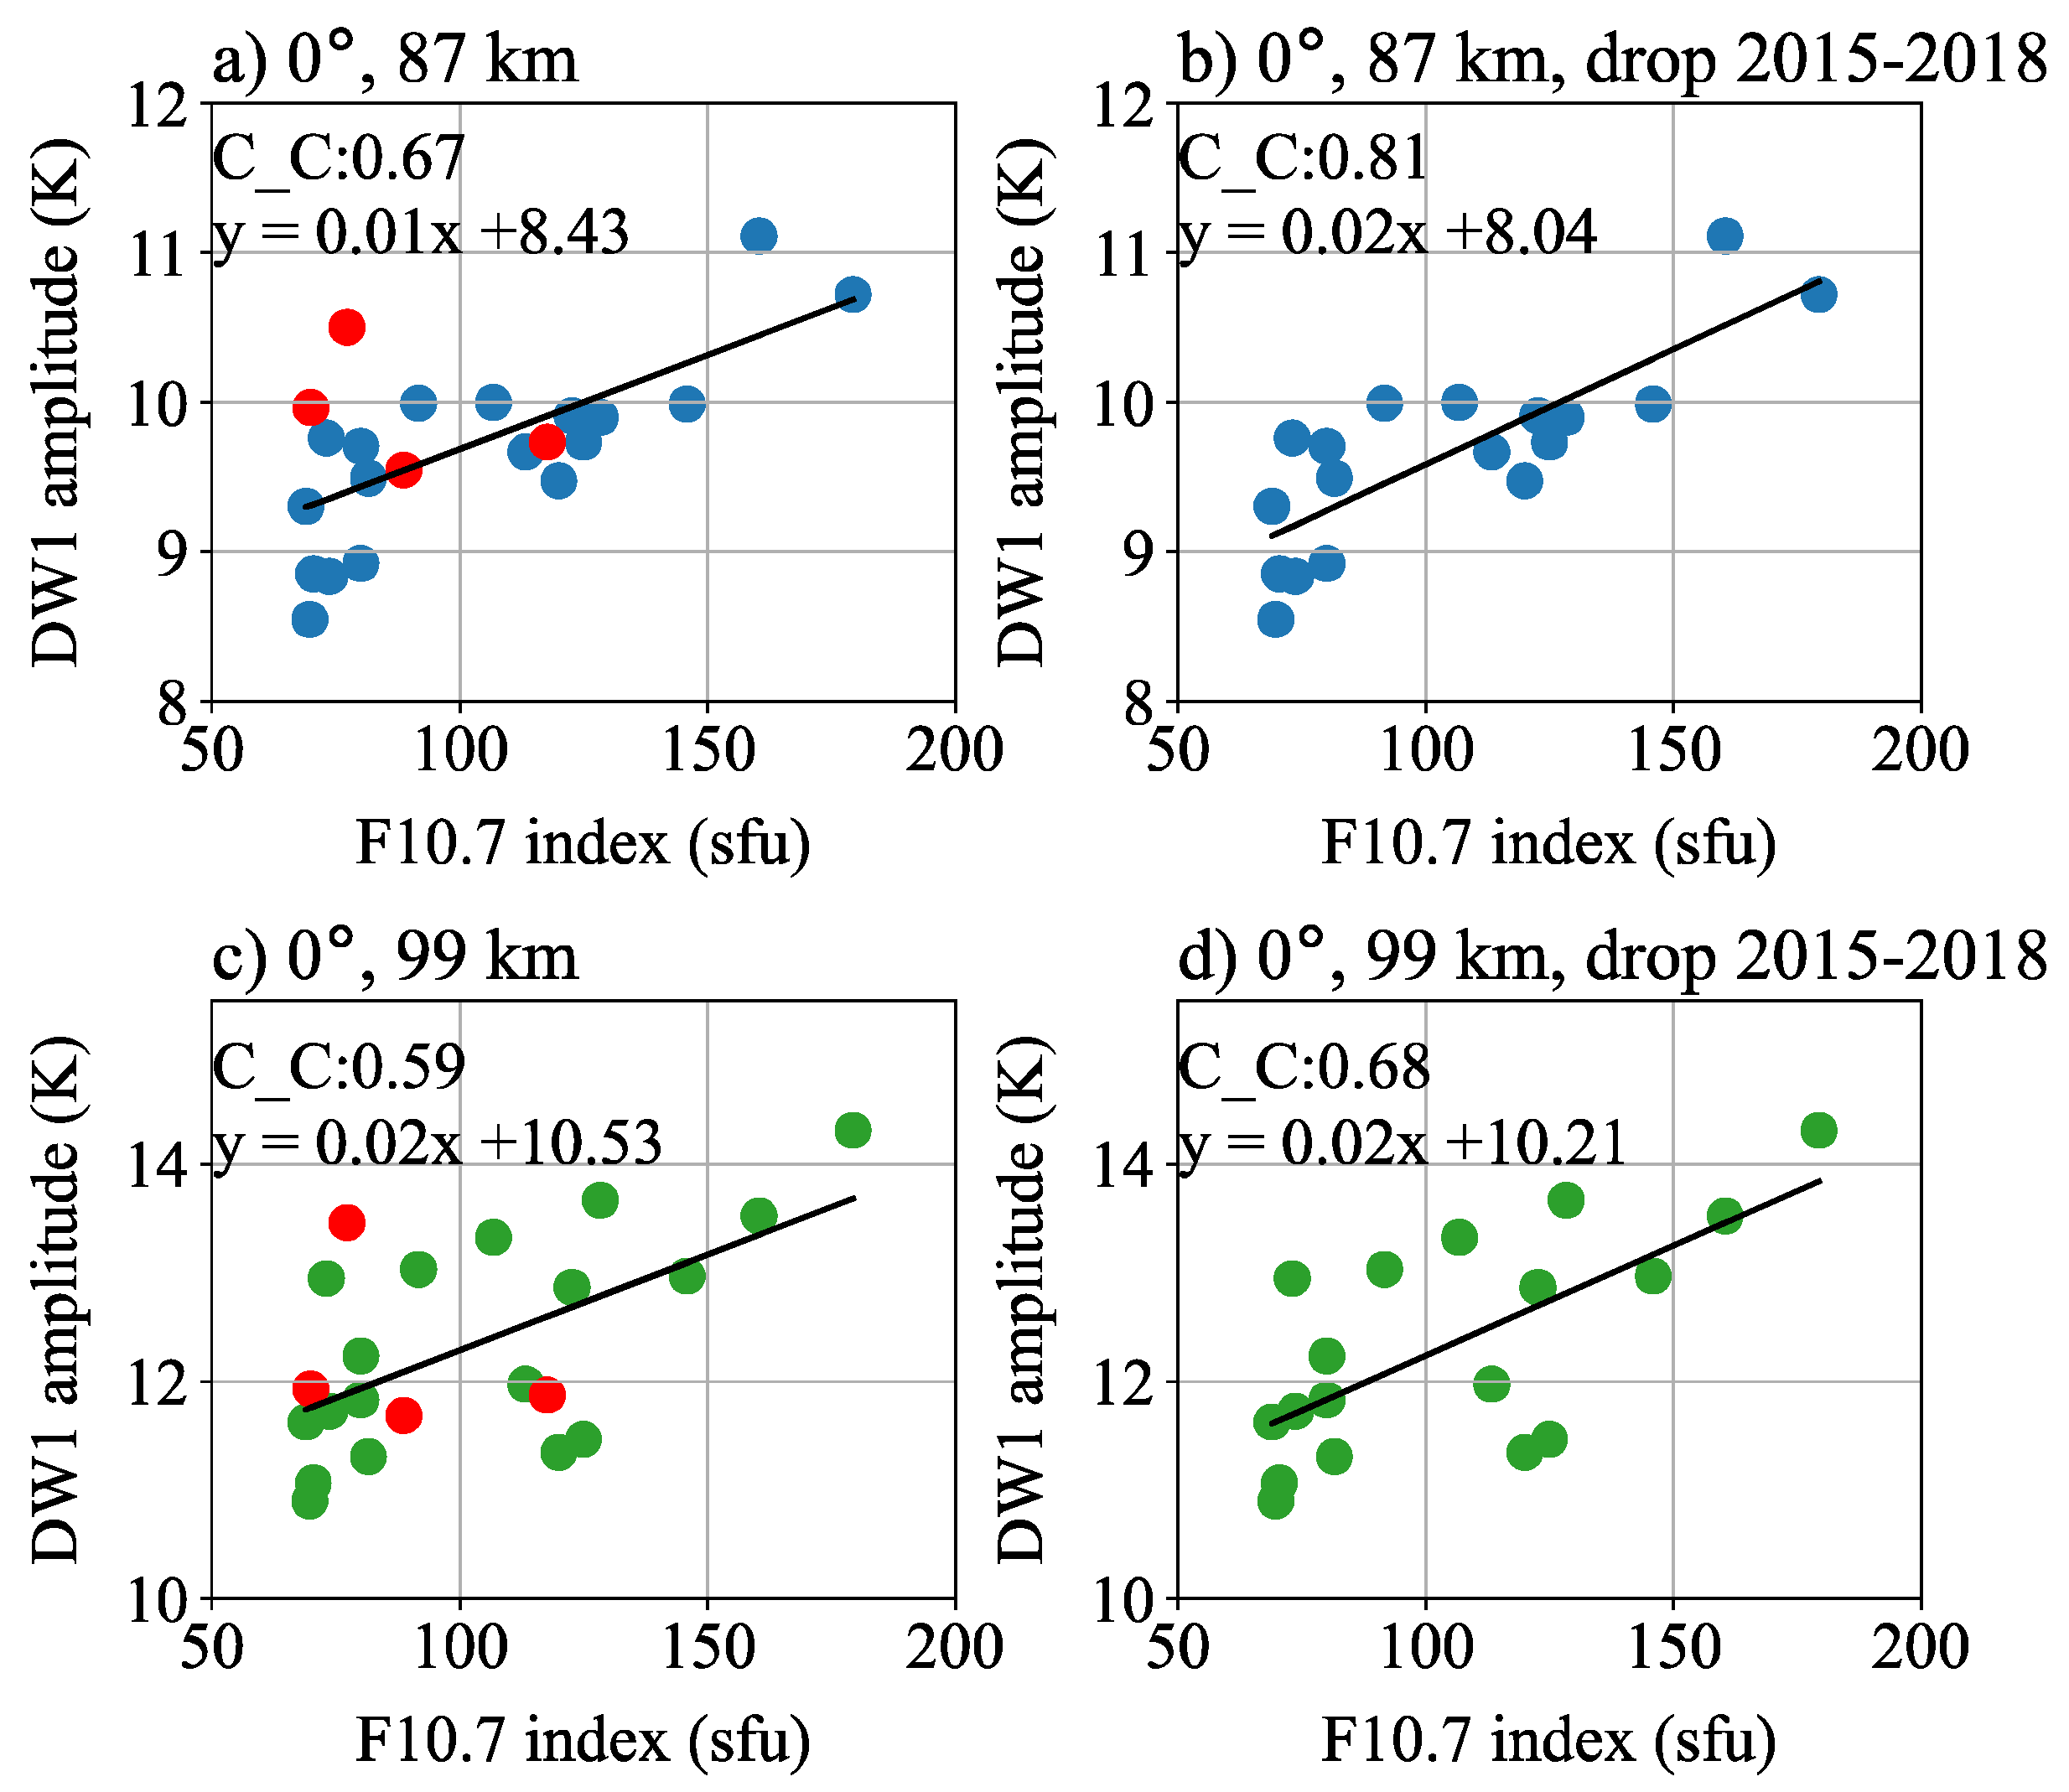
The annual mean amplitudes of the solar cycle series using the MLR method are shown in Figure 5, and the annual mean F10.7 index from 2002 to 2023 are overplotted. In Figure 5, the series at two peak response heights (87 and 99 km) and a small response height (93 km) are shown. The black dashed line gives the annual mean F10.7 index. The F10.7 index reaches a local maximum in 2002, 2014, and 2023 while reaching a local minimum in 2008 and 2019 during 2002–2023. Comparing the F10.7 index and DW1 amplitudes at 87 km and 99 km (Figure 5a,c), the DW1 amplitudes show similar evolution to the F10.7 index. While at 93 km (Figure 5b), there is less response to the F10.7 index. So, only the series at 87 and 99 km will be analyzed. The amplitudes during high solar activity years adhere well to the F10.7 index like 2002–2003, 2013–2015, and 2022–2023. Between 2002 and 2014, the DW1 minimum amplitudes at 87 and 99 km appeared in 2009. Between 2014 and 2023, the DW1 minimum amplitudes at 87 and 99 km occurred in 2019, corresponding to a solar minimum year. As shown in Figure 6a,c, the DW1 amplitude shows a significant positive correlation with an F10.7 index of around 87 km and 99 km. The correlation coefficients are 0.67 at 87 km and 0.59 at 99 km. However, there are still QBO-like oscillations in these annual mean series (e.g., 2005–2006, 2009–2010). Moreover, during the period from the QBO disruption event in 2015–2016, the QBO period reaches more than 3 years (red dots, from about 2015 to 2018, e.g., Wang et al. [31]). Meanwhile, the MLT DW1 amplitude shows a remarkable anomaly in that duration. From Figure 5, the solar cycle series derived using MLR does not reflect the changes well. If these years are dropped, the solar cycle dependence could be better shown (see Figure 6b,d), which causes distinct improvements in the correlation coefficients, from 0.67 to 0.81 at 87 and from 0.59 to 0.68 at 99 km, respectively.
Actually, SQBO also showed a disruption event in 2019–2020, as mentioned by Anstey et al. [32]; however, temperature DW1 does not show significant anomaly during this time like that in 2015–2016. The reason might be the difference in the behaviors of SQBO between these two disruption periods. Further discussion is presented in Section 4.
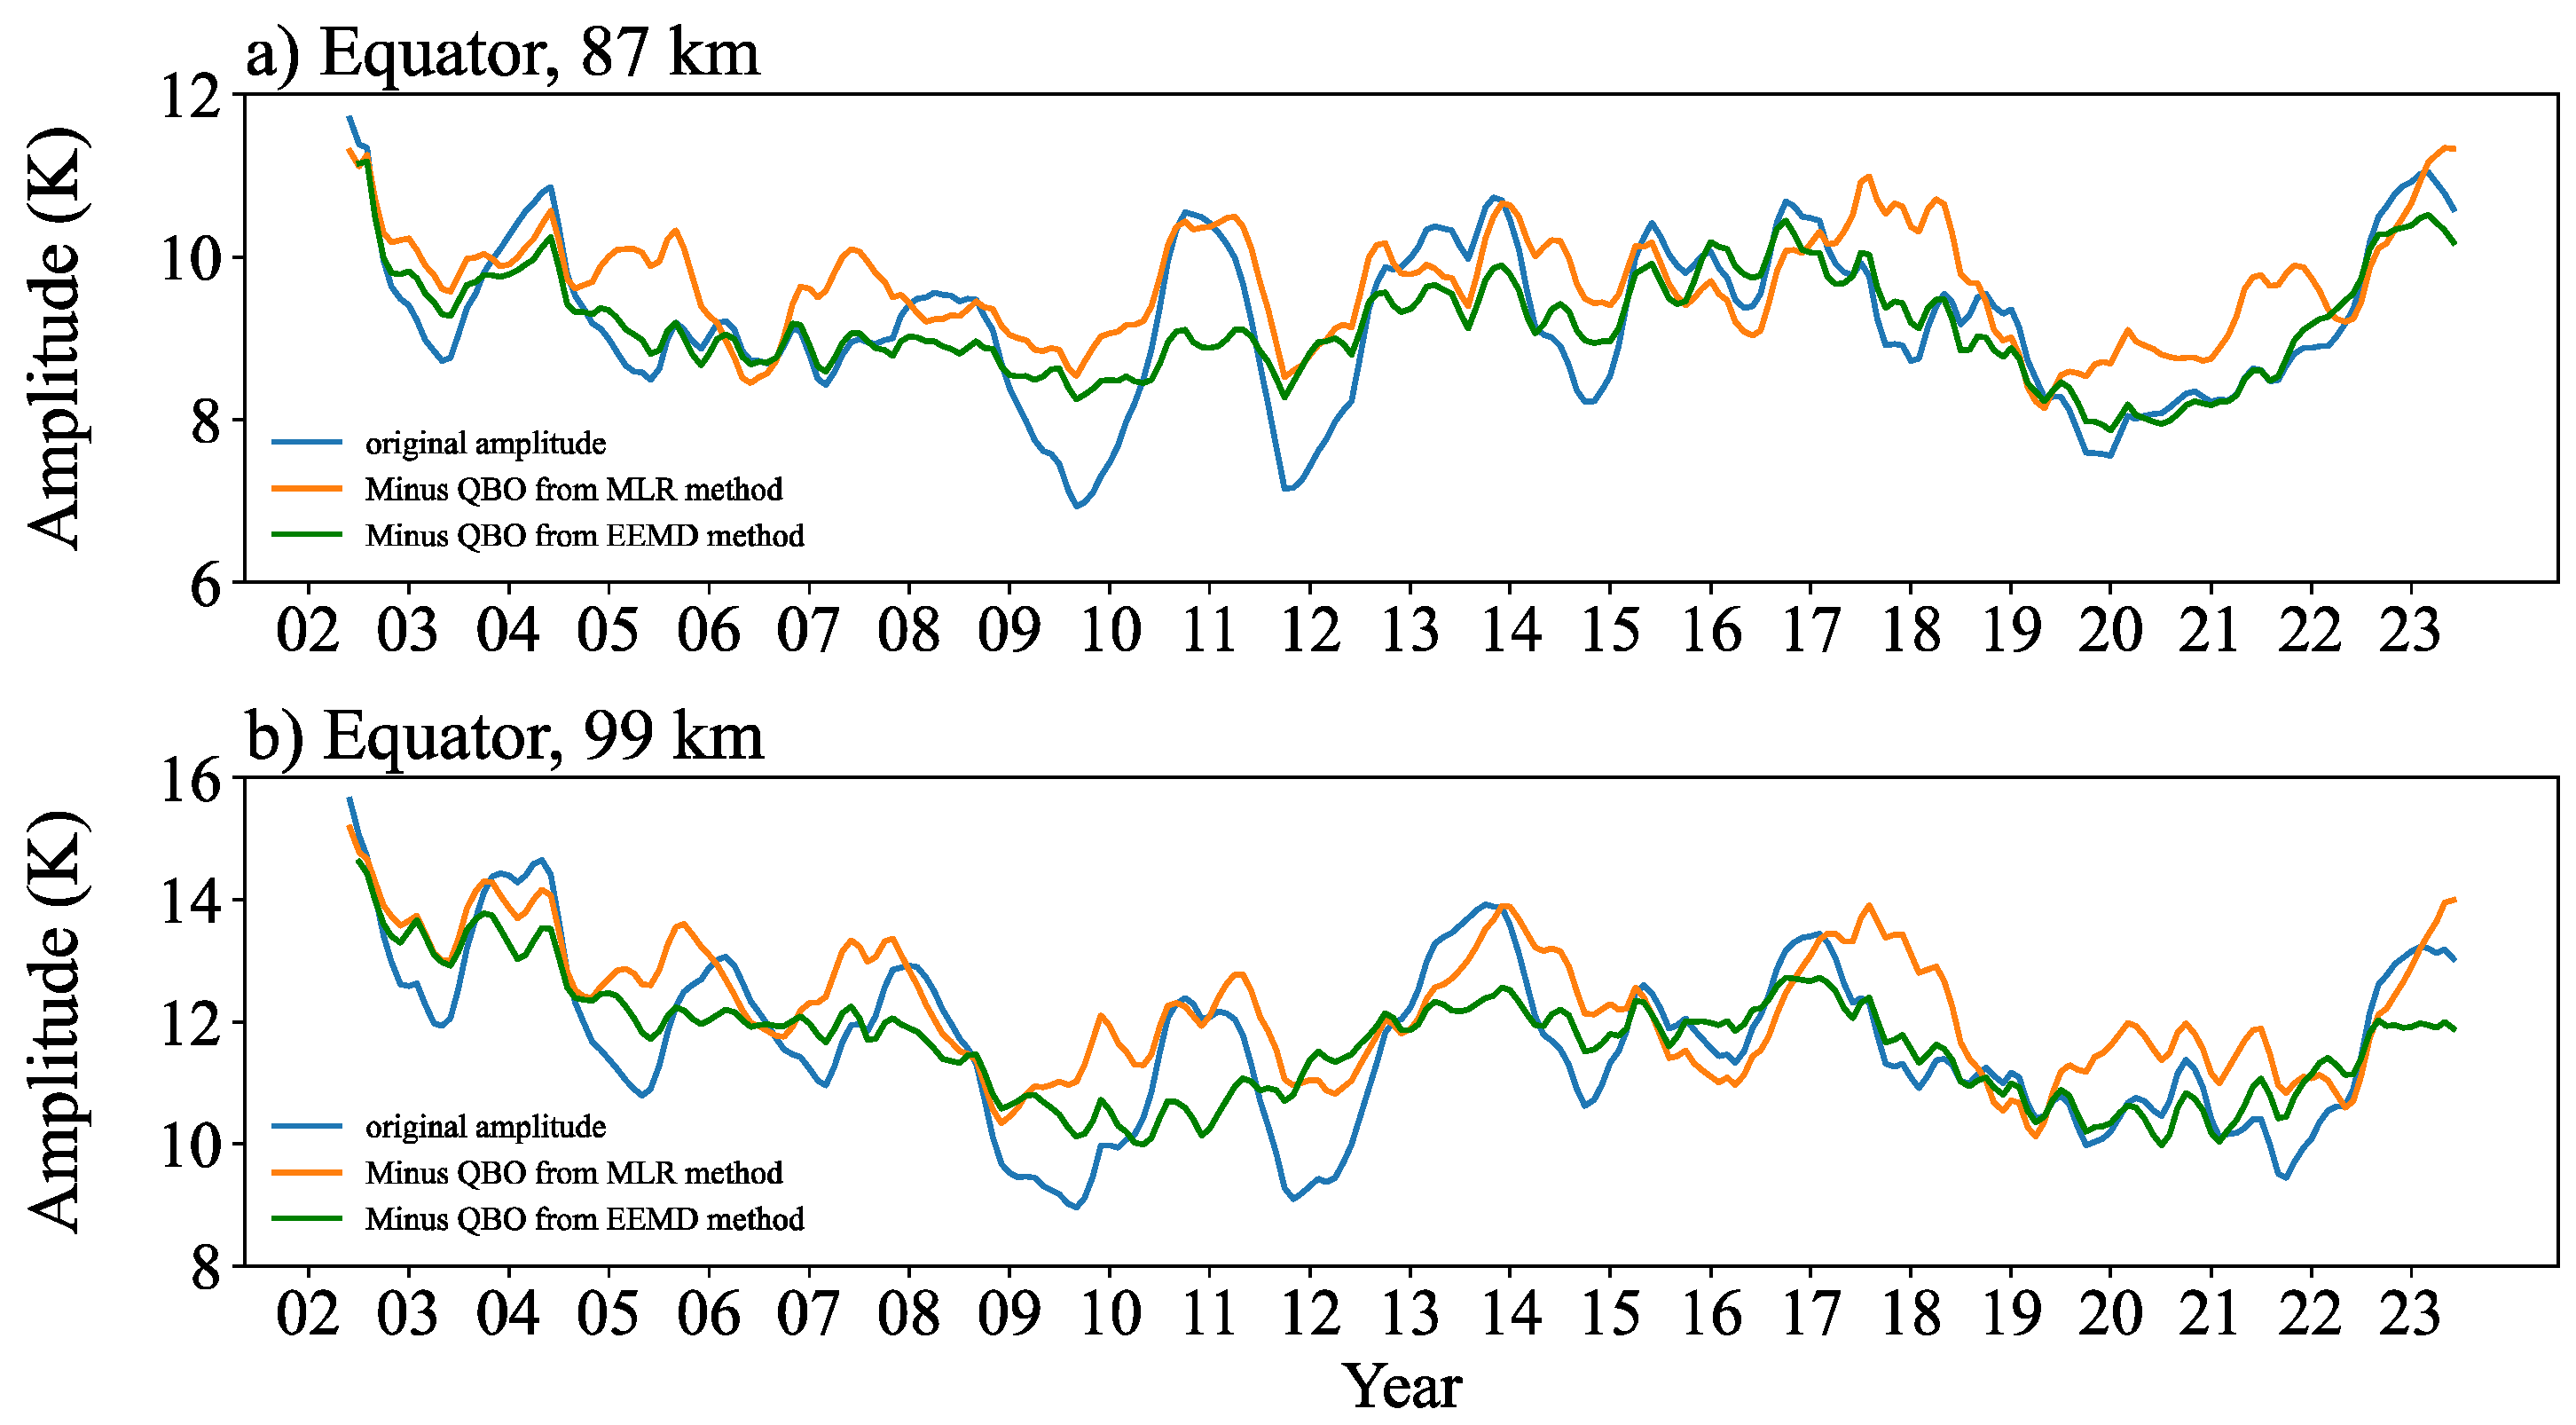
Concerning this characteristic, the EEMD method is introduced. The EEMD method could effectively separate signals with different periods. This advantage can be used to extract QBO variation, which is period-changing. Using the EEMD method, the QBO-like monthly mean amplitudes are extracted from DW1 de-seasonalized monthly mean amplitudes. Then, the extracted QBO component is subtracted from DW1 de-seasonalized monthly mean amplitude. Figure 7 shows the monthly mean series of temperature DW1 amplitude and the amplitudes that remove QBO components using the MLR and EEMD methods, which are shown in blue, orange, and green lines, respectively. As mentioned, the 2015–2016 QBO disruption event influenced DW1 amplitude and the QBO period. The EEMD method could not realize the variation within such a long period. Then, the DW1 QBO amplitudes are underestimated during this period. After subtracting the QBO component, the series leaves a large amplitude in 2016–2018 (red dots in Figure 8). Except for the SQBO disruption-induced flaw, shown in Figure 7, the series removed QBO using the EEMD method, which could effectively eliminate the QBO component. The series (green line) is regarded as the solar cycle series.
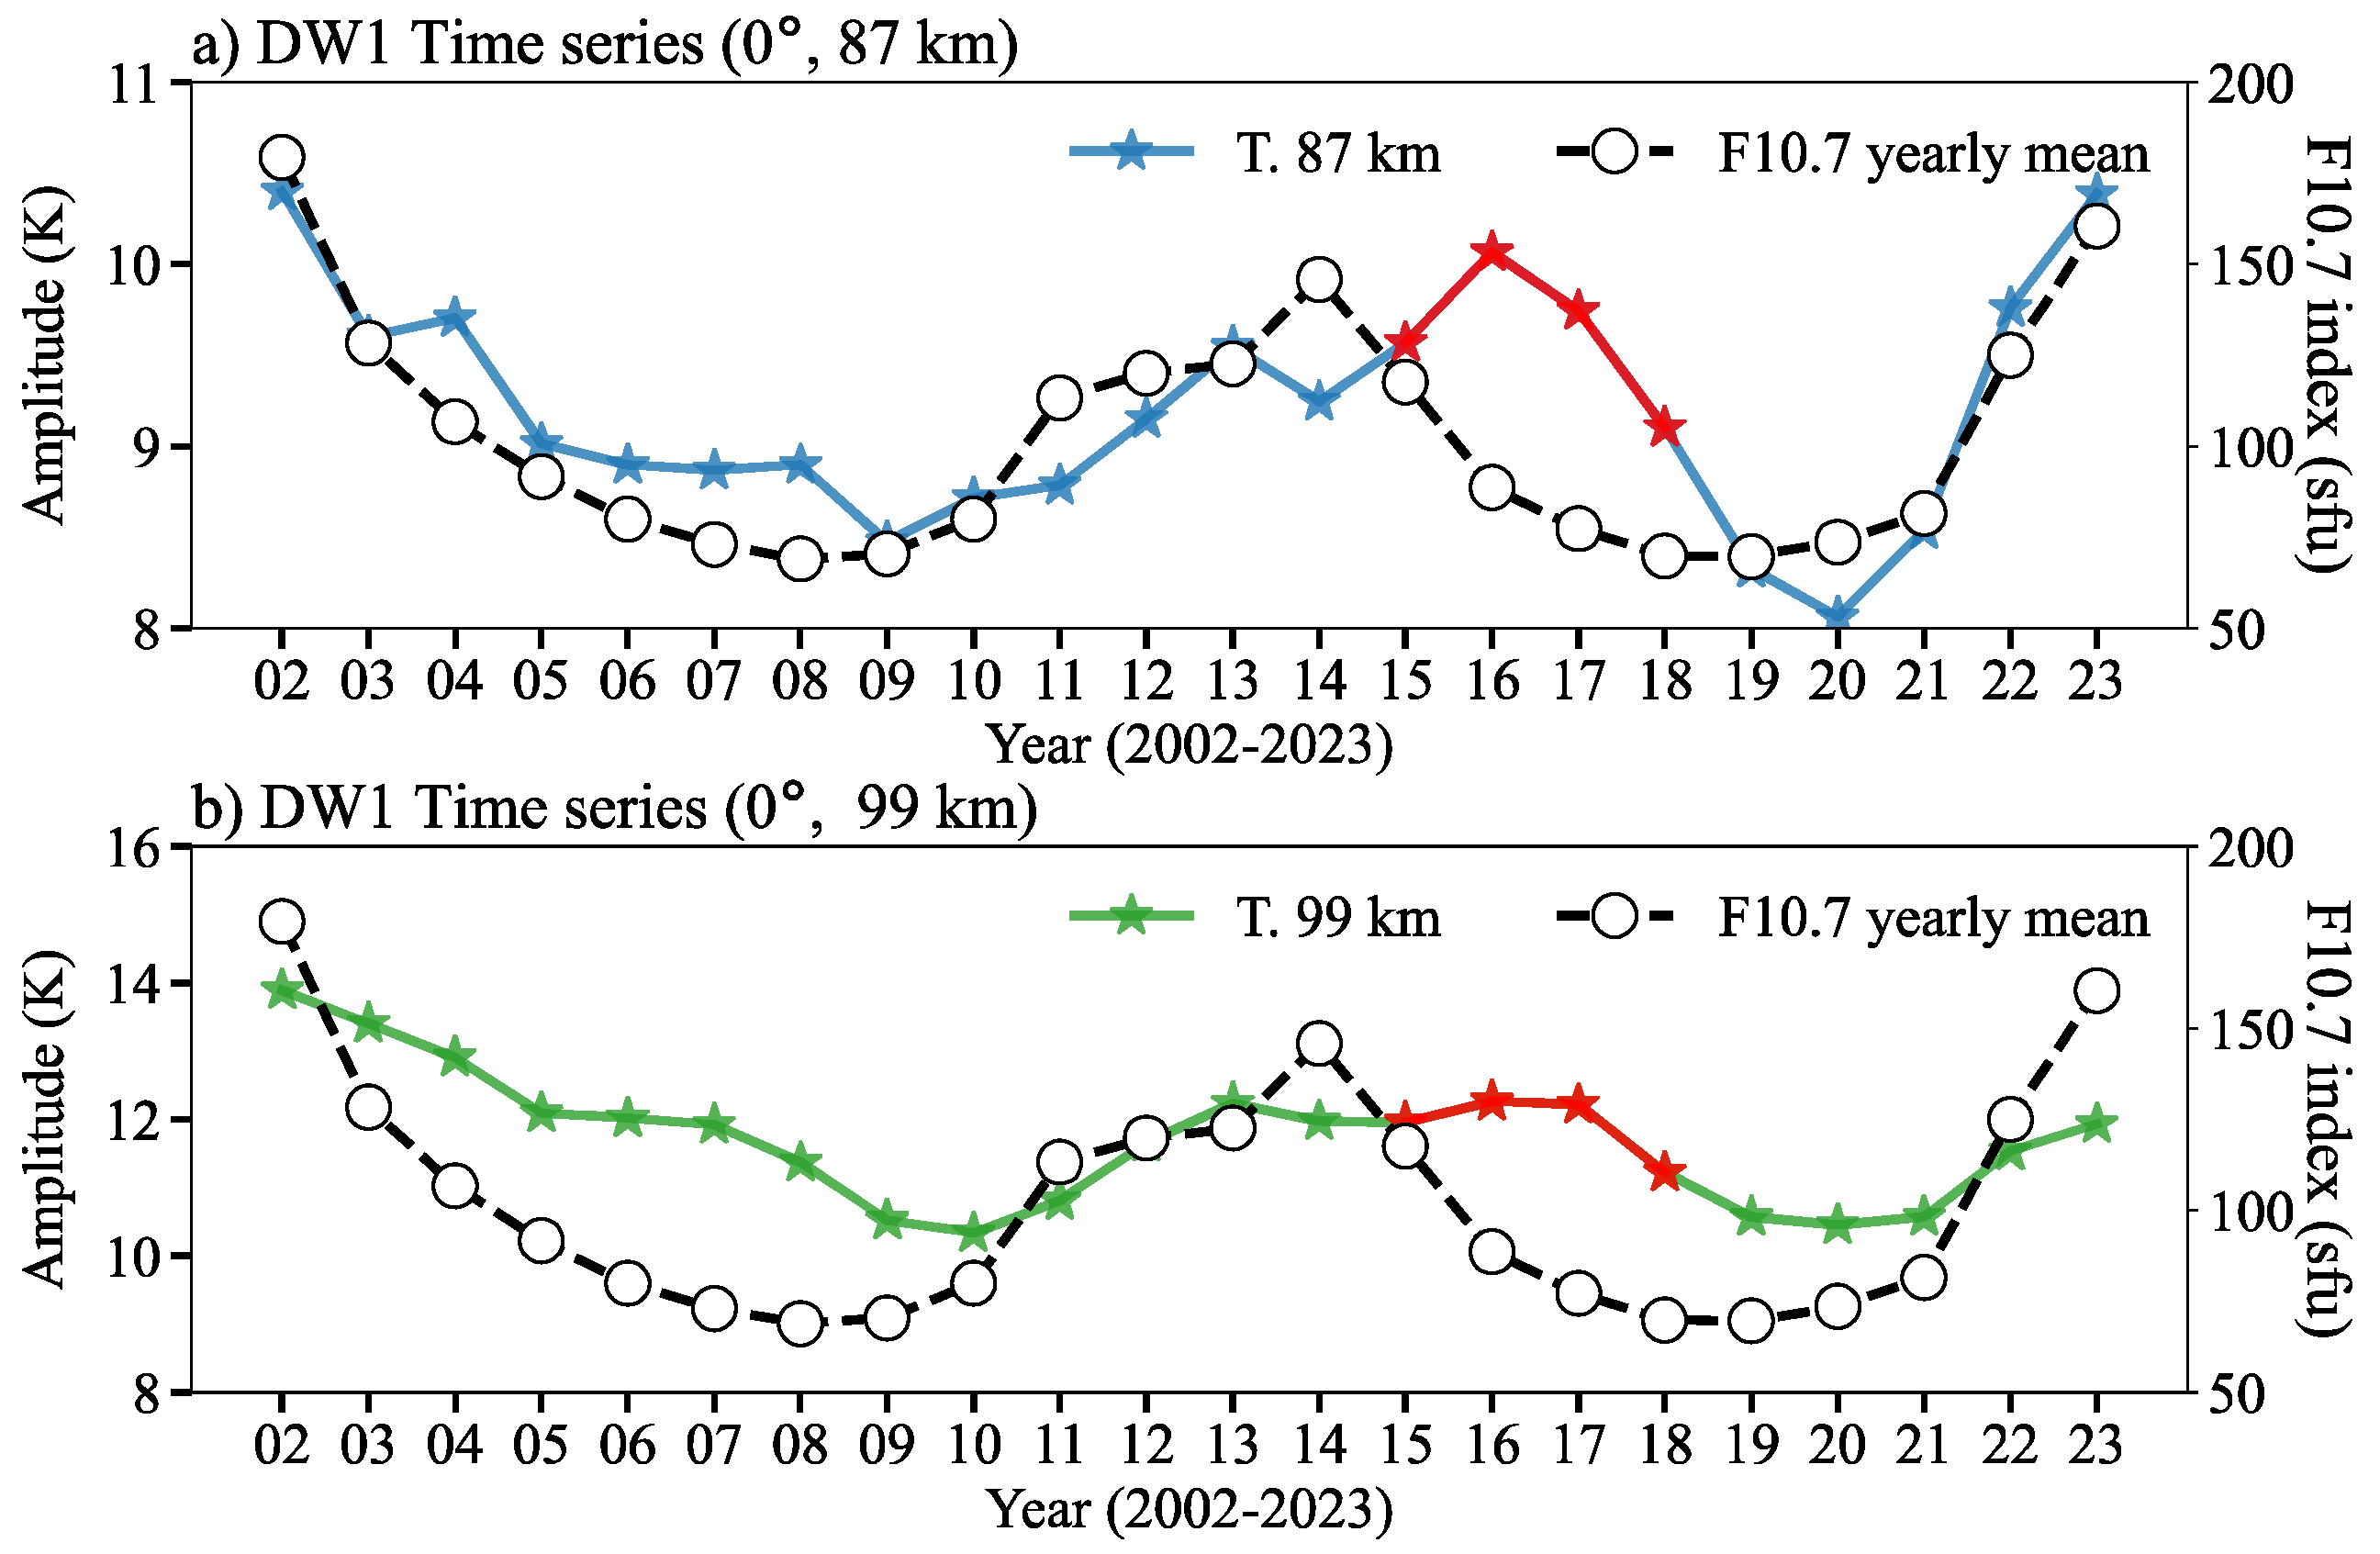
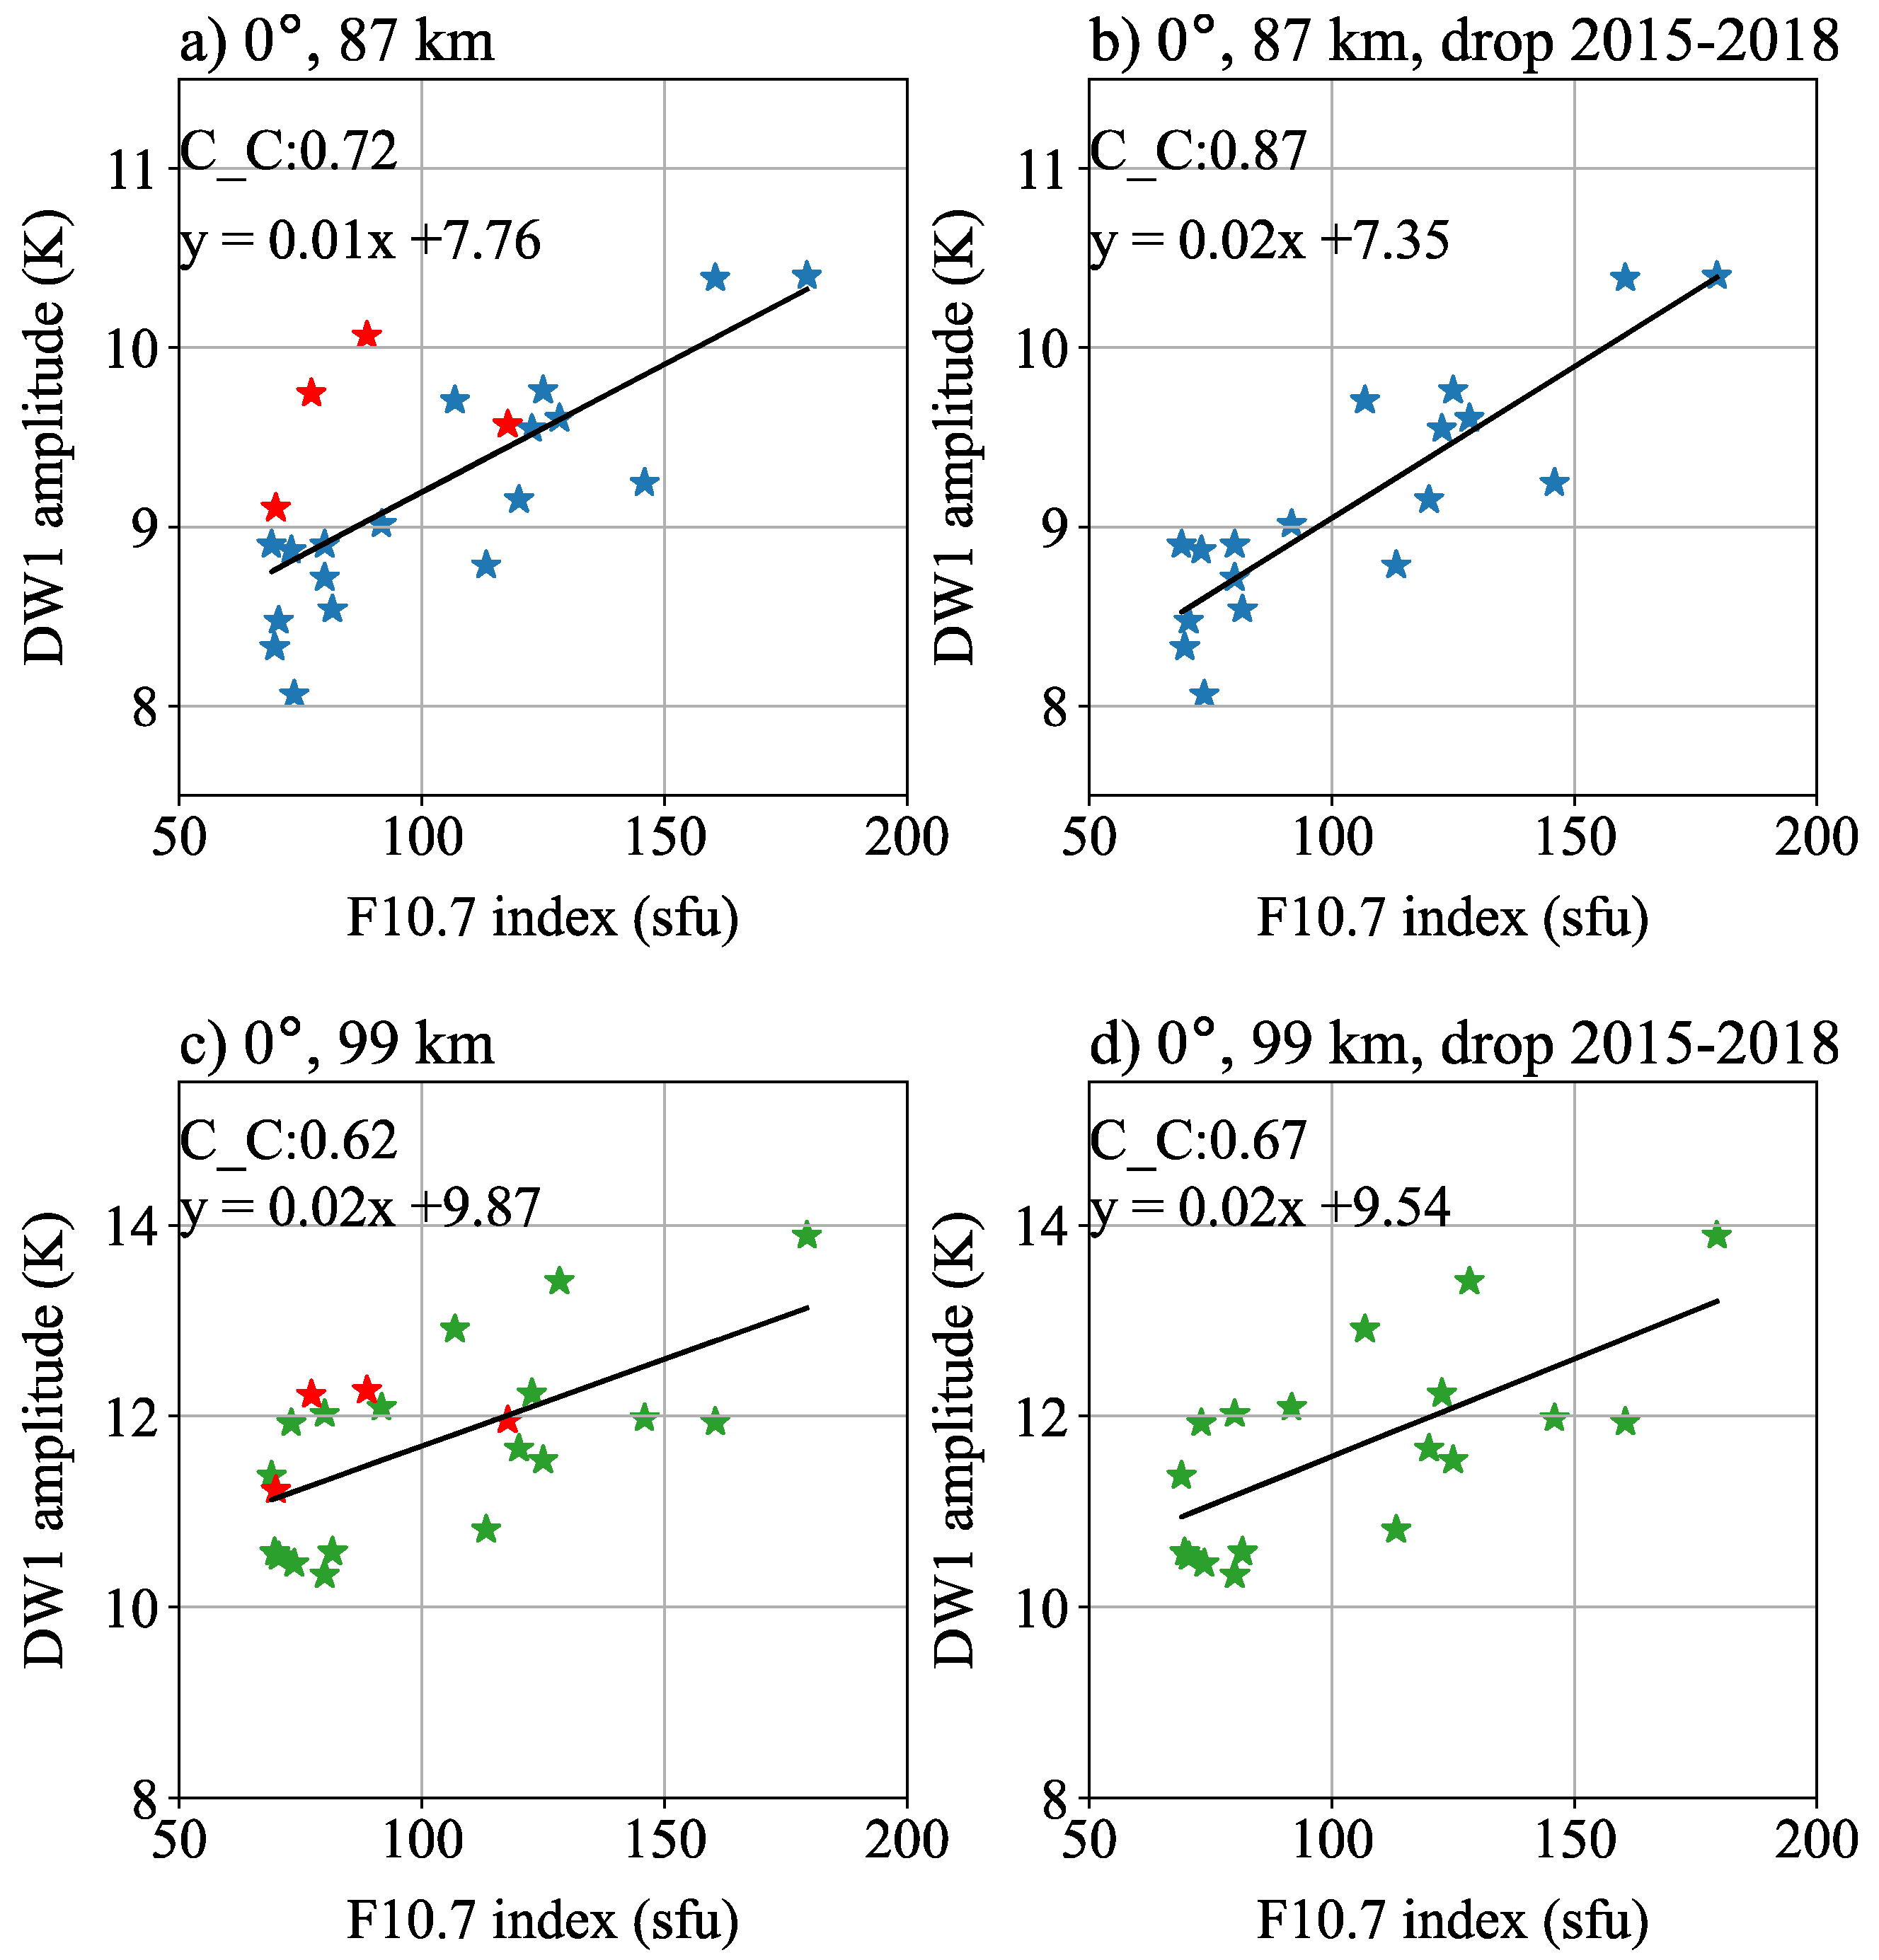
The annual mean amplitudes of the solar cycle series (averaged from the monthly mean amplitude minus QBO from the EEMD method—shown with the green line in Figure 7) are given in Figure 8, and the annual mean F10.7 index from 2002 to 2023 is overplotted. The amplitudes at 87 km reach a local maximum in 2013 and 2016 between these two solar cycles. As introduced before, the SQBO disruption event influences the amplitude. Therefore, the maximum amplitude between these two solar cycles is located in 2013 and not in 2016. The series reached a minimum in these two solar cycles in 2009 and 2020, which is later than the solar minimum in 2008 and 2019. The amplitudes at 99 km reached their maximum in 2013 while reaching their minimum in 2010 and 2020. The significant positive correlation between the annual mean series and the F10.7 index is confirmed at the equator. The correlation coefficients at 87 and 99 km are 0.72 and 0.62 (Figure 9a,c), respectively. After dropping the QBO disruption years, the correlation coefficients increased from 0.72 to 0.87 and from 0.62 to 0.67 at 87 and 99 km, respectively. When inspecting these series, lag responses from DW1 to F10.7 may exist. Thus, lag correlations are calculated between QBO-removed annual mean DW1 amplitudes and the annual mean F10.7 index (move F10.7 index backward one year at a time and calculate the correlation coefficient, e.g., 2001–2022, 2000–2021), as shown in Table 2. The most significant lag-correlation coefficient appears in the 1-year correlation at equatorial 87 km and the 2-year correlation at equatorial 99 km.

4. Discussion

The evolution of SQBO could modulate the QBO response of DW1 in MLT. DW1 amplitudes are relatively larger during the SQBO eastward phase than those seen during the westward phase [3,5,29,33]. There is a significant QBO disruption in 2015–2016; westerlies can be found between 30 hPa and 20 hPa and continue until 2018 without the expected reverse in 2016 (see bottom subgraph of Figure 2). Therefore, DW1 could propagate upward during this longer period, resulting in a significant amplitude in MLT (Figure 5). Even though there was also a QBO disruption in 2019–2020, it exhibited a distinct difference in terms of behavior from the disruption of 2015–2016. The westerlies between 30 hPa and 40 hPa reverse to easterlies during the expected year of 2020, even if it is about 4 months later than the regular QBO cycle. Therefore, in the 2019–2020 disruption, a suppressed MLT DW1 amplitude exists. Further investigations of these mechanisms will be discussed in detail using numerical models.
As shown in Figure 4, Figure 5 and Figure 8, the response to the solar cycle in the DW1 temperature component is clear. However, this mechanism is currently uncertain. Considering how the tides are excited and propagated may explain how DW1 shows solar cycle dependence.
The excitation source could be mainly classified into two sources: solar radiation in the near-infrared (IR) absorptions by tropospheric H2O and solar radiation in the ultraviolet (UV) absorptions by stratospheric and lower mesospheric O3. Several works have examined the abundance of H2O and O3 responses to the solar cycle [34,35,36,37]. Schieferdecker et al. [34] reported that water vapor showed an anti-correlation relationship with the solar cycle in the lower stratosphere using a Halogen Occultation Instrument (HALOE) and Michelson Interferometer for Passive Atmospheric Sounding (MIPAS) data. Using Microwave Limb Sounder (MLS) observations, Sridharan and Sandhya [35] also found a negative response in terms of water vapor to the solar cycle under 21 hPa. Using SABER observations, Nath and Sridharan revealed a positive response of ozone to the solar cycle in the stratosphere. Ball et al. [36] also reported a positive response with several observation data sets and model simulations. Apart from the solar cycle variability of the excitation source’s abundance, NIR and UV radiation also show solar cycle variability and appear to be in phase with it [38,39]. However, the excitation source actually shows the opposite response. Thus, the solar cycle modulation of DW1 discussed from the excitation is more complicated and needs more quantitative calculations.
When DW1 propagates upward, background wind may also be a potential subject for examination. Some works attempt to establish contact with the zonal mean wind and the DW1 semiannual oscillation using observations or model simulations [27,40,41], and these two variations are in good correlation [27]. However, the mechanism is currently uncertain. Using simulations from the latest version of the Whole Atmospheric Community Climate Model (WACCM6) from 1850 to 2014, zonal wind showed a positive response to the solar cycle at the equatorial MLT region during winter [42]. With a balanced wind data set [43], Liu et al. also revealed the positive response of zonal wind to the solar cycle [44]. The relationship between the solar cycle component of zonal wind and DW1 is worth examining. Besides the possible modulation of zonal wind, Baumgaertner et al. [8] suggested that planetary wave activity varying with solar activity and pressure and density gradient changes might explain the correlation between tide and solar cycle. The modulation mechanism needs further investigation.
The lag response to the solar cycle shown in Figure 5 and Figure 8 may also relate to DW1 excitation. A similar phenomenon was also found in the zonal wind component of the diurnal tide in Hawaii (22°N, 160°W) [45]. They reported that diurnal tide reached its amplitude minimum later than the solar cycle maximum. Whether the lag response exists in tropospheric H2O and stratospheric and lower mesospheric O3 is worth examining. Schieferdecker et al. [34] reported a phase-shifted anti-correlation between the abundance of water vapor and solar radiation. They found that this phase shift within the lower stratosphere is composed of an almost constant inherent time lag of about 25 months and a variable delay approximately following the age of stratospheric air. Remsberg and Deaver [46] found a 13.5-year temperature oscillation period in the middle and upper stratosphere observed using HALOE. This phenomenon may influence the excitation source, such as O3, resulting in lagging. Iimura et al. [45] also suggested that the phase difference in the diurnal tide excited by O3 and H2O [47,48] may lead to lag.

5. Conclusions

In this study, the solar cycle dependence of temperature DW1 in the MLT region at the equator is investigated. The temperatures observed using SABER/TIMED were used with a time span from 2002 to 2023 and an altitude range of 60–100 km. The findings are as follows:
(1) The clear solar cycle dependence (~11-year) of temperature DW1 is revealed at the equator by using MLR and EEMD methods. The most significant responses of temperature DW1 to the F10.7 index occur around the equator at 87 km and 99 km. The coefficients are 1.2 K/100 sfu and 1.54 K/100 sfu, respectively. A high correlation between temperature DW1 and the F10.7 index is found at 87 and 99 km. The correlation coefficients are 0.72 at 87 km and 0.62 at 99 km, respectively. The coefficients that removed the influence of SQBO disruption reach 0.87 at 87 km and 0.67 at 99 km, respectively.
(2) A lag response to the solar cycle is found in DW1 at the equator. DW1 shows a 1-year lag correlation to the F10.7 index at 87 km amplitudes and a 2-year lag correlation at 99 km.
This study aimed to reveal whether there is solar cycle dependence in temperature DW1 because its existence is still in debate. From the long observation results, the existence is validated. Moreover, a lag response is revealed. This may suggest the involvement of a complex physical process. A systematic explanation may require more observations and dedicated numerical simulations. The solar cycle response of excitation sources of tides and modulation of the background field may be worth investigating.
Based on SABER temperature observations, the solar cycle effect on temperature DW1 at the equator was clearly found. The difference caused by the DW1 solar cycle component in high and low solar activity years is relatively considerable. Thus, it is highly recommended to take the solar cycle variations of DW1 at the equator into account when modeling temperature variations; otherwise, in high and low solar activity years, the solar cycle component of DW1 will be the result of a mean state, which, in turn, affects modeling accuracy.

Author Contributions

Conceptualization, S.L. and G.J.; data curation, S.L.; investigation, S.L. and G.J.; methodology, S.L. and G.J.; supervision, G.J. and B.L.; visualization, S.L.; writing—original draft, S.L.; writing—review and editing, G.J., B.L., J.X., R.L., Y.Z. and W.L. All authors have read and agreed to the published version of the manuscript.

Funding

This work was supported by the Strategic Priority Research Program of the Chinese Academy of Sciences (Grant No. XDB0560000); the Pandeng Program of National Space Science Center CAS; the National Key R&D program of China (2021YFE0110200); the Project of Stable Support for Youth Team in Basic Research Field, CAS (YSBR-018); the National Natural Science Foundation of China (41831073, 42174196 and 42174212); the Chinese Meridian Project; the Specialized Research Fund for State Key Laboratories; the International Partnership Program of Chinese Academy of Sciences, Grant No. 183311KYSB20200003.

Data Availability Statement

All data used in this study are publicly available. SABER data are available from the SABER project data server at https://spdf.gsfc.nasa.gov/pub/data/timed/saber/level2a_netCDF/, accessed on 1 February 2024. F10.7 index is obtained from https://omniweb.gsfc.nasa.gov/form/dx1.html, accessed on 1 February 2024. NINO3.4 index is from https://psl.noaa.gov/gcos_wgsp/Timeseries/Data/nino34.long.anom.data, accessed on 1 February 2024. The QBO index reanalysis data can be retrieved from https://acd-ext.gsfc.nasa.gov/Data_services/met/qbo/QBO_Singapore_Uvals_GSFC.txt, accessed on 1 February 2024.

Acknowledgments

We acknowledge the SABER team, NOAA, and GSFC for providing the data. We are grateful for helpful comments from Xiao Liu from Henan Normal University, Additionally, we are grateful to the reviewers for their valuable suggestions.

Conflicts of Interest

The authors declare no conflicts of interest.

References

  1. Smith, A.K. Global Dynamics of the MLT. Surv. Geophys. 2012, 33, 1177–1230. [Google Scholar] [CrossRef]
  2. Lieberman, R.S.; Smith, A.K.; Franke, S.J.; Vincent, R.A.; Isler, J.R.; Manson, A.H.; Meek, C.E.; Fraser, G.J.; Fahrutdinova, A.; Thayaparan, T.; et al. Comparison of mesospheric and lower thermospheric residual wind with High Resolution Doppler Imager, medium frequency, and meteor radar winds. J. Geophys. Res. Atmos. 2000, 105, 27023–27035. [Google Scholar] [CrossRef]
  3. Garcia, R.R. On the Structure and Variability of the Migrating Diurnal Temperature Tide Observed by SABER. J. Atmos. Sci. 2023, 80, 687–704. [Google Scholar] [CrossRef]
  4. Cen, Y.; Yang, C.; Li, T.; Russell Iii, J.M.; Dou, X. Suppressed migrating diurnal tides in the mesosphere and lower thermosphere region during El Niño in northern winter and its possible mechanism. Atmos. Chem. Phys. 2022, 22, 7861–7874. [Google Scholar] [CrossRef]
  5. Dhadly, M.S.; Emmert, J.T.; Drob, D.P.; McCormack, J.P.; Niciejewski, R.J. Short-Term and Interannual Variations of Migrating Diurnal and Semidiurnal Tides in the Mesosphere and Lower Thermosphere. J. Geophys. Res. Space Phys. 2018, 123, 7106–7123. [Google Scholar] [CrossRef]
  6. Singh, D.; Gurubaran, S. Variability of diurnal tide in the MLT region over Tirunelveli (8.7°N), India: Consistency between ground- and space-based observations. J. Geophys. Res. Atmos. 2017, 122, 2696–2713. [Google Scholar] [CrossRef]
  7. Bremer, J.; Schminder, R.; Greisiger, K.M.; Hoffmann, P.; Kürschner, D.; Singer, W. Solar cycle dependence and long-term trends in the wind field of the mesosphere/lower thermosphere. J. Atmos. Sol. Terr. Phys. 1997, 59, 497–509. [Google Scholar] [CrossRef]
  8. Baumgaertner, A.J.G.; McDonald, A.J.; Fraser, G.J.; Plank, G.E. Long-term observations of mean winds and tides in the upper mesosphere and lower thermosphere above Scott Base, Antarctica. J. Atmos. Sol. Terr. Phys. 2005, 67, 1480–1496. [Google Scholar] [CrossRef]
  9. Sridharan, S.; Tsuda, T.; Gurubaran, S. Long-term tendencies in the mesosphere/lower thermosphere mean winds and tides as observed by medium-frequency radar at Tirunelveli (8.7°N, 77.8°E). J. Geophys. Res. 2010, 115, D08109. [Google Scholar] [CrossRef]
  10. Guharay, A.; Batista, P.P.; Andrioli, V.F. Investigation of solar cycle dependence of the tides in the low latitude MLT using meteor radar observations. J. Atmos. Sol. Terr. Phys. 2019, 193, 105083. [Google Scholar] [CrossRef]
  11. Andrioli, V.F.; Xu, J.; Batista, P.P.; Resende, L.C.A.; Da Silva, L.A.; Marchezi, J.P.; Li, H.; Wang, C.; Liu, Z.; Guharay, A. New Findings Relating Tidal Variability and Solar Activity in the Low Latitude MLT Region. J. Geophys. Res. Space Phys. 2022, 127, e2021JA030239. [Google Scholar] [CrossRef]
  12. Liu, Y.; Xu, J.; Smith, A.K.; Liu, X. Seasonal and Interannual Variations of Global Tides in the Mesosphere and Lower Thermosphere Neutral Winds: I. Diurnal Tides. J. Geophys. Res. Space Phys. 2024, 129, e2023JA031887. [Google Scholar] [CrossRef]
  13. Wu, C.; Ridley, A.J.; Cullens, C.Y. Seasonal Dependency of the Solar Cycle, QBO, and ENSO Effects on the Interannual Variability of the Wind DW1 in the MLT Region. J. Geophys. Res. Space Phys. 2024, 129, e2024JA032472. [Google Scholar] [CrossRef]
  14. Vitharana, A.; Du, J.; Zhu, X.; Oberheide, J.; Ward, W.E. Numerical Prediction of the Migrating Diurnal Tide Total Variability in the Mesosphere and Lower Thermosphere. J. Geophys. Res. Space Phys. 2021, 126, e2021JA029588. [Google Scholar] [CrossRef]
  15. Mertens, C.J.; Mlynczak, M.G.; López-Puertas, M.; Wintersteiner, P.P.; Picard, R.H.; Winick, J.R.; Gordley, L.L.; Russell, J.M. Retrieval of mesospheric and lower thermospheric kinetic temperature from measurements of CO215 µm Earth Limb Emission under non-LTE conditions. Geophys. Res. Lett. 2001, 28, 1391–1394. [Google Scholar] [CrossRef]
  16. Mertens, C.J. SABER observations of mesospheric temperatures and comparisons with falling sphere measurements taken during the 2002 summer MaCWAVE campaign. Geophys. Res. Lett. 2004, 31, L03105. [Google Scholar] [CrossRef]
  17. Dawkins, E.C.M.; Feofilov, A.; Rezac, L.; Kutepov, A.A.; Janches, D.; Höffner, J.; Chu, X.; Lu, X.; Mlynczak, M.G.; Russell, J. Validation of SABER v2.0 Operational Temperature Data With Ground-Based Lidars in the Mesosphere-Lower Thermosphere Region (75–105 km). J. Geophys. Res. Atmos. 2018, 123, 9916–9934. [Google Scholar] [CrossRef]
  18. Mlynczak, M.G.; Marshall, B.T.; Garcia, R.R.; Hunt, L.; Yue, J.; Harvey, V.L.; Lopez-Puertas, M.; Mertens, C.; Russell, J. Algorithm Stability and the Long-Term Geospace Data Record From TIMED/SABER. Geophys. Res. Lett. 2023, 50, e2022GL102398. [Google Scholar] [CrossRef]
  19. Xu, J.; Smith, A.K.; Yuan, W.; Liu, H.L.; Wu, Q.; Mlynczak, M.G.; Russell, J.M. Global structure and long-term variations of zonal mean temperature observed by TIMED/SABER. J. Geophys. Res. 2007, 112, D24106. [Google Scholar] [CrossRef]
  20. Xu, J.; Smith, A.K.; Liu, H.L.; Yuan, W.; Wu, Q.; Jiang, G.; Mlynczak, M.G.; Russell, J.M.; Franke, S.J. Seasonal and quasi-biennial variations in the migrating diurnal tide observed by Thermosphere, Ionosphere, Mesosphere, Energetics and Dynamics (TIMED). J. Geophys. Res. 2009, 114, D13107. [Google Scholar] [CrossRef]
  21. Liu, H.L. WACCM-X Simulation of Tidal and Planetary Wave Variability in the Upper Atmosphere. 2014, pp. 181–199. Available online: https://agupubs.onlinelibrary.wiley.com/doi/abs/10.1002/9781118704417.ch16 (accessed on 1 May 2024).
  22. Huang, F.T.; Mayr, H.G.; Reber, C.A.; Russell, J.M.; Mlynczak, M.G.; Mengel, J.G. Ozone quasi-biennial oscillations (QBO), semiannual oscillations (SAO), and correlations with temperature in the mesosphere, lower thermosphere, and stratosphere, based on measurements from SABER on TIMED and MLS on UARS. J. Geophys. Res. Space Phys. 2008, 113, A01316. [Google Scholar] [CrossRef]
  23. Huang, N.E.; Shen, Z.; Long, S.R.; Wu, M.C.; Shih, H.H.; Zheng, Q.; Yen, N.-C.; Tung, C.C.; Liu, H.H. The empirical mode decomposition and the Hilbert spectrum for nonlinear and non-stationary time series analysis. Proc. R. Soc. Lond. Ser. A Math. Phys. Eng. Sci. 1998, 454, 903–995. [Google Scholar] [CrossRef]
  24. Wu, Y.; Shen, B.-W. An Evaluation of the Parallel Ensemble Empirical Mode Decomposition Method in Revealing the Role of Downscaling Processes Associated with African Easterly Waves in Tropical Cyclone Genesis. J. Atmos. Oceanic Technol. 2016, 33, 1611–1628. [Google Scholar] [CrossRef]
  25. Zou, M.; Xiong, X.; Wu, Z.; Li, S.; Zhang, Y.; Chen, L. Increase of Atmospheric Methane Observed from Space-Borne and Ground-Based Measurements. Remote Sens. 2019, 11, 964. [Google Scholar] [CrossRef]
  26. Wu, Z.; Huang, N.E. Ensemble Empirical Mode Decomposition: A Noise-Assisted Data Analysis Method. Adv. Adapt. Data Anal. 2011, 1, 1–41. [Google Scholar] [CrossRef]
  27. Liu, M.; Xu, J.; Liu, H.; Liu, X. Possible modulation of migrating diurnal tide by latitudinal gradient of zonal wind observed by SABER/TIMED. Sci. China Earth Sci. 2015, 59, 408–417. [Google Scholar] [CrossRef]
  28. Gu, H.; Du, J. On the Roles of Advection and Solar Heating in Seasonal Variation of the Migrating Diurnal Tide in the Stratosphere, Mesosphere, and Lower Thermosphere. Atmosphere 2018, 9, 440. [Google Scholar] [CrossRef]
  29. Pramitha, M.; Kumar, K.K.; Ratnam, M.V.; Praveen, M.; Bhaskara Rao, S.V. Stratospheric Quasi Biennial Oscillation Modulations of Migrating Diurnal Tide in the Mesosphere and Lower Thermosphere Over the Low and Equatorial Latitudes. J. Geophys. Res. Space Phys. 2021, 126, e2020JA028970. [Google Scholar] [CrossRef]
  30. Seidel, D.J.; Li, J.; Mears, C.; Moradi, I.; Nash, J.; Randel, W.J.; Saunders, R.; Thompson, D.W.J.; Zou, C.Z. Stratospheric temperature changes during the satellite era. J. Geophys. Res. Atmos. 2016, 121, 664–681. [Google Scholar] [CrossRef]
  31. Wang, Y.; Rao, J.; Lu, Y.; Ju, Z.; Yang, J.; Luo, J. A revisit and comparison of the quasi-biennial oscillation (QBO) disruption events in 2015/16 and 2019/20. Atmos. Res. 2023, 294, 106970. [Google Scholar] [CrossRef]
  32. Anstey, J.A.; Banyard, T.P.; Butchart, N.; Coy, L.; Newman, P.A.; Osprey, S.; Wright, C.J. Prospect of Increased Disruption to the QBO in a Changing Climate. Geophys. Res. Lett. 2021, 48, e2021GL093058. [Google Scholar] [CrossRef]
  33. Pramitha, M.; Kishore Kumar, K.; Venkat Ratnam, M.; Praveen, M.; Rao, S.V.B. Disrupted Stratospheric QBO Signatures in the Diurnal Tides Over the Low-Latitude MLT Region. Geophys. Res. Lett. 2021, 48, e2021GL093022. [Google Scholar] [CrossRef]
  34. Schieferdecker, T.; Lossow, S.; Stiller, G.P.; von Clarmann, T. Is there a solar signal in lower stratospheric water vapour? Atmos. Chem. Phys. 2015, 15, 9851–9863. [Google Scholar] [CrossRef]
  35. Sridharan, S.; Sandhya, M. Long-term (2004–2015) tendencies and variabilities of tropical UTLS water vapor mixing ratio and temperature observed by AURA/MLS using multivariate regression analysis. J. Atmos. Sol. Terr. Phys. 2016, 147, 156–165. [Google Scholar] [CrossRef]
  36. Ball, W.T.; Rozanov, E.V.; Alsing, J.; Marsh, D.R.; Tummon, F.; Mortlock, D.J.; Kinnison, D.; Haigh, J.D. The Upper Stratospheric Solar Cycle Ozone Response. Geophys. Res. Lett. 2019, 46, 1831–1841. [Google Scholar] [CrossRef]
  37. Nath, O.; Sridharan, S. Long-term variabilities and tendencies in zonal mean TIMED–SABER ozone and temperature in the middle atmosphere at 10–15° N. J. Atmos. Sol. Terr. Phys. 2014, 120, 1–8. [Google Scholar] [CrossRef]
  38. Woods, T.N.; Harder, J.W.; Kopp, G.; Snow, M. Solar-Cycle Variability Results from the Solar Radiation and Climate Experiment (SORCE) Mission. Sol. Phys. 2022, 297, 43. [Google Scholar] [CrossRef]
  39. Thuillier, G.; Zhu, P.; Snow, M.; Zhang, P.; Ye, X. Characteristics of solar-irradiance spectra from measurements, modeling, and theoretical approach. Light Sci Appl 2022, 11, 79. [Google Scholar] [CrossRef]
  40. Ortland, D.A. Daily estimates of the migrating tide and zonal mean temperature in the mesosphere and lower thermosphere derived from SABER data. J. Geophys. Res. Atmos. 2017, 122, 3754–3785. [Google Scholar] [CrossRef]
  41. McLandress, C. The Seasonal Variation of the Propagating Diurnal Tide in the Mesosphere and Lower Thermosphere. Part II: The Role of Tidal Heating and Zonal Mean Winds. J. Atmos. Sci. 2002, 59, 907–922. [Google Scholar] [CrossRef]
  42. Ramesh, K.; Smith, A.K.; Garcia, R.R.; Marsh, D.R.; Sridharan, S.; Kishore Kumar, K. Long-Term Variability and Tendencies in Middle Atmosphere Temperature and Zonal Wind From WACCM6 Simulations During 1850–2014. J. Geophys. Res. Atmos. 2020, 125, e2020JD033579. [Google Scholar] [CrossRef]
  43. Liu, X.; Xu, J.; Yue, J.; Yu, Y.; Batista, P.P.; Andrioli, V.F.; Liu, Z.; Yuan, T.; Wang, C.; Zou, Z.; et al. Global balanced wind derived from SABER temperature and pressure observations and its validations. Earth Syst. Sci. Data 2021, 13, 5643–5661. [Google Scholar] [CrossRef]
  44. Liu, X.; Xu, J.; Yue, J.; Andrioli, V.F. Variations in global zonal wind from 18 to 100 km due to solar activity and the quasi-biennial oscillation and El Niño–Southern Oscillation during 2002–2019. Atmos. Chem. Phys. 2023, 23, 6145–6167. [Google Scholar] [CrossRef]
  45. Iimura, H.; Fritts, D.C.; Riggin, D.M. Long-term oscillations of the wind field in the tropical mesosphere and lower thermosphere from Hawaii MF radar measurements. J. Geophys. Res. 2010, 115, D09112. [Google Scholar] [CrossRef]
  46. Remsberg, E.E.; Deaver, L.E. Interannual, solar cycle, and trend terms in middle atmospheric temperature time series from HALOE. J. Geophys. Res. Atmos. 2005, 110, D0610. [Google Scholar] [CrossRef]
  47. Hagan, M.E. Comparative effects of migrating solar sources on tidal signatures in the middle and upper atmosphere. J. Geophys. Res. Atmos. 1996, 101, 21213–21222. [Google Scholar] [CrossRef]
  48. Hagan, M.E.; Burrage, M.D.; Forbes, J.M.; Hackney, J.; Randel, W.J.; Zhang, X. GSWM-98: Results for migrating solar tides. J. Geophys. Res. Space Phys. 1999, 104, 6813–6827. [Google Scholar] [CrossRef]
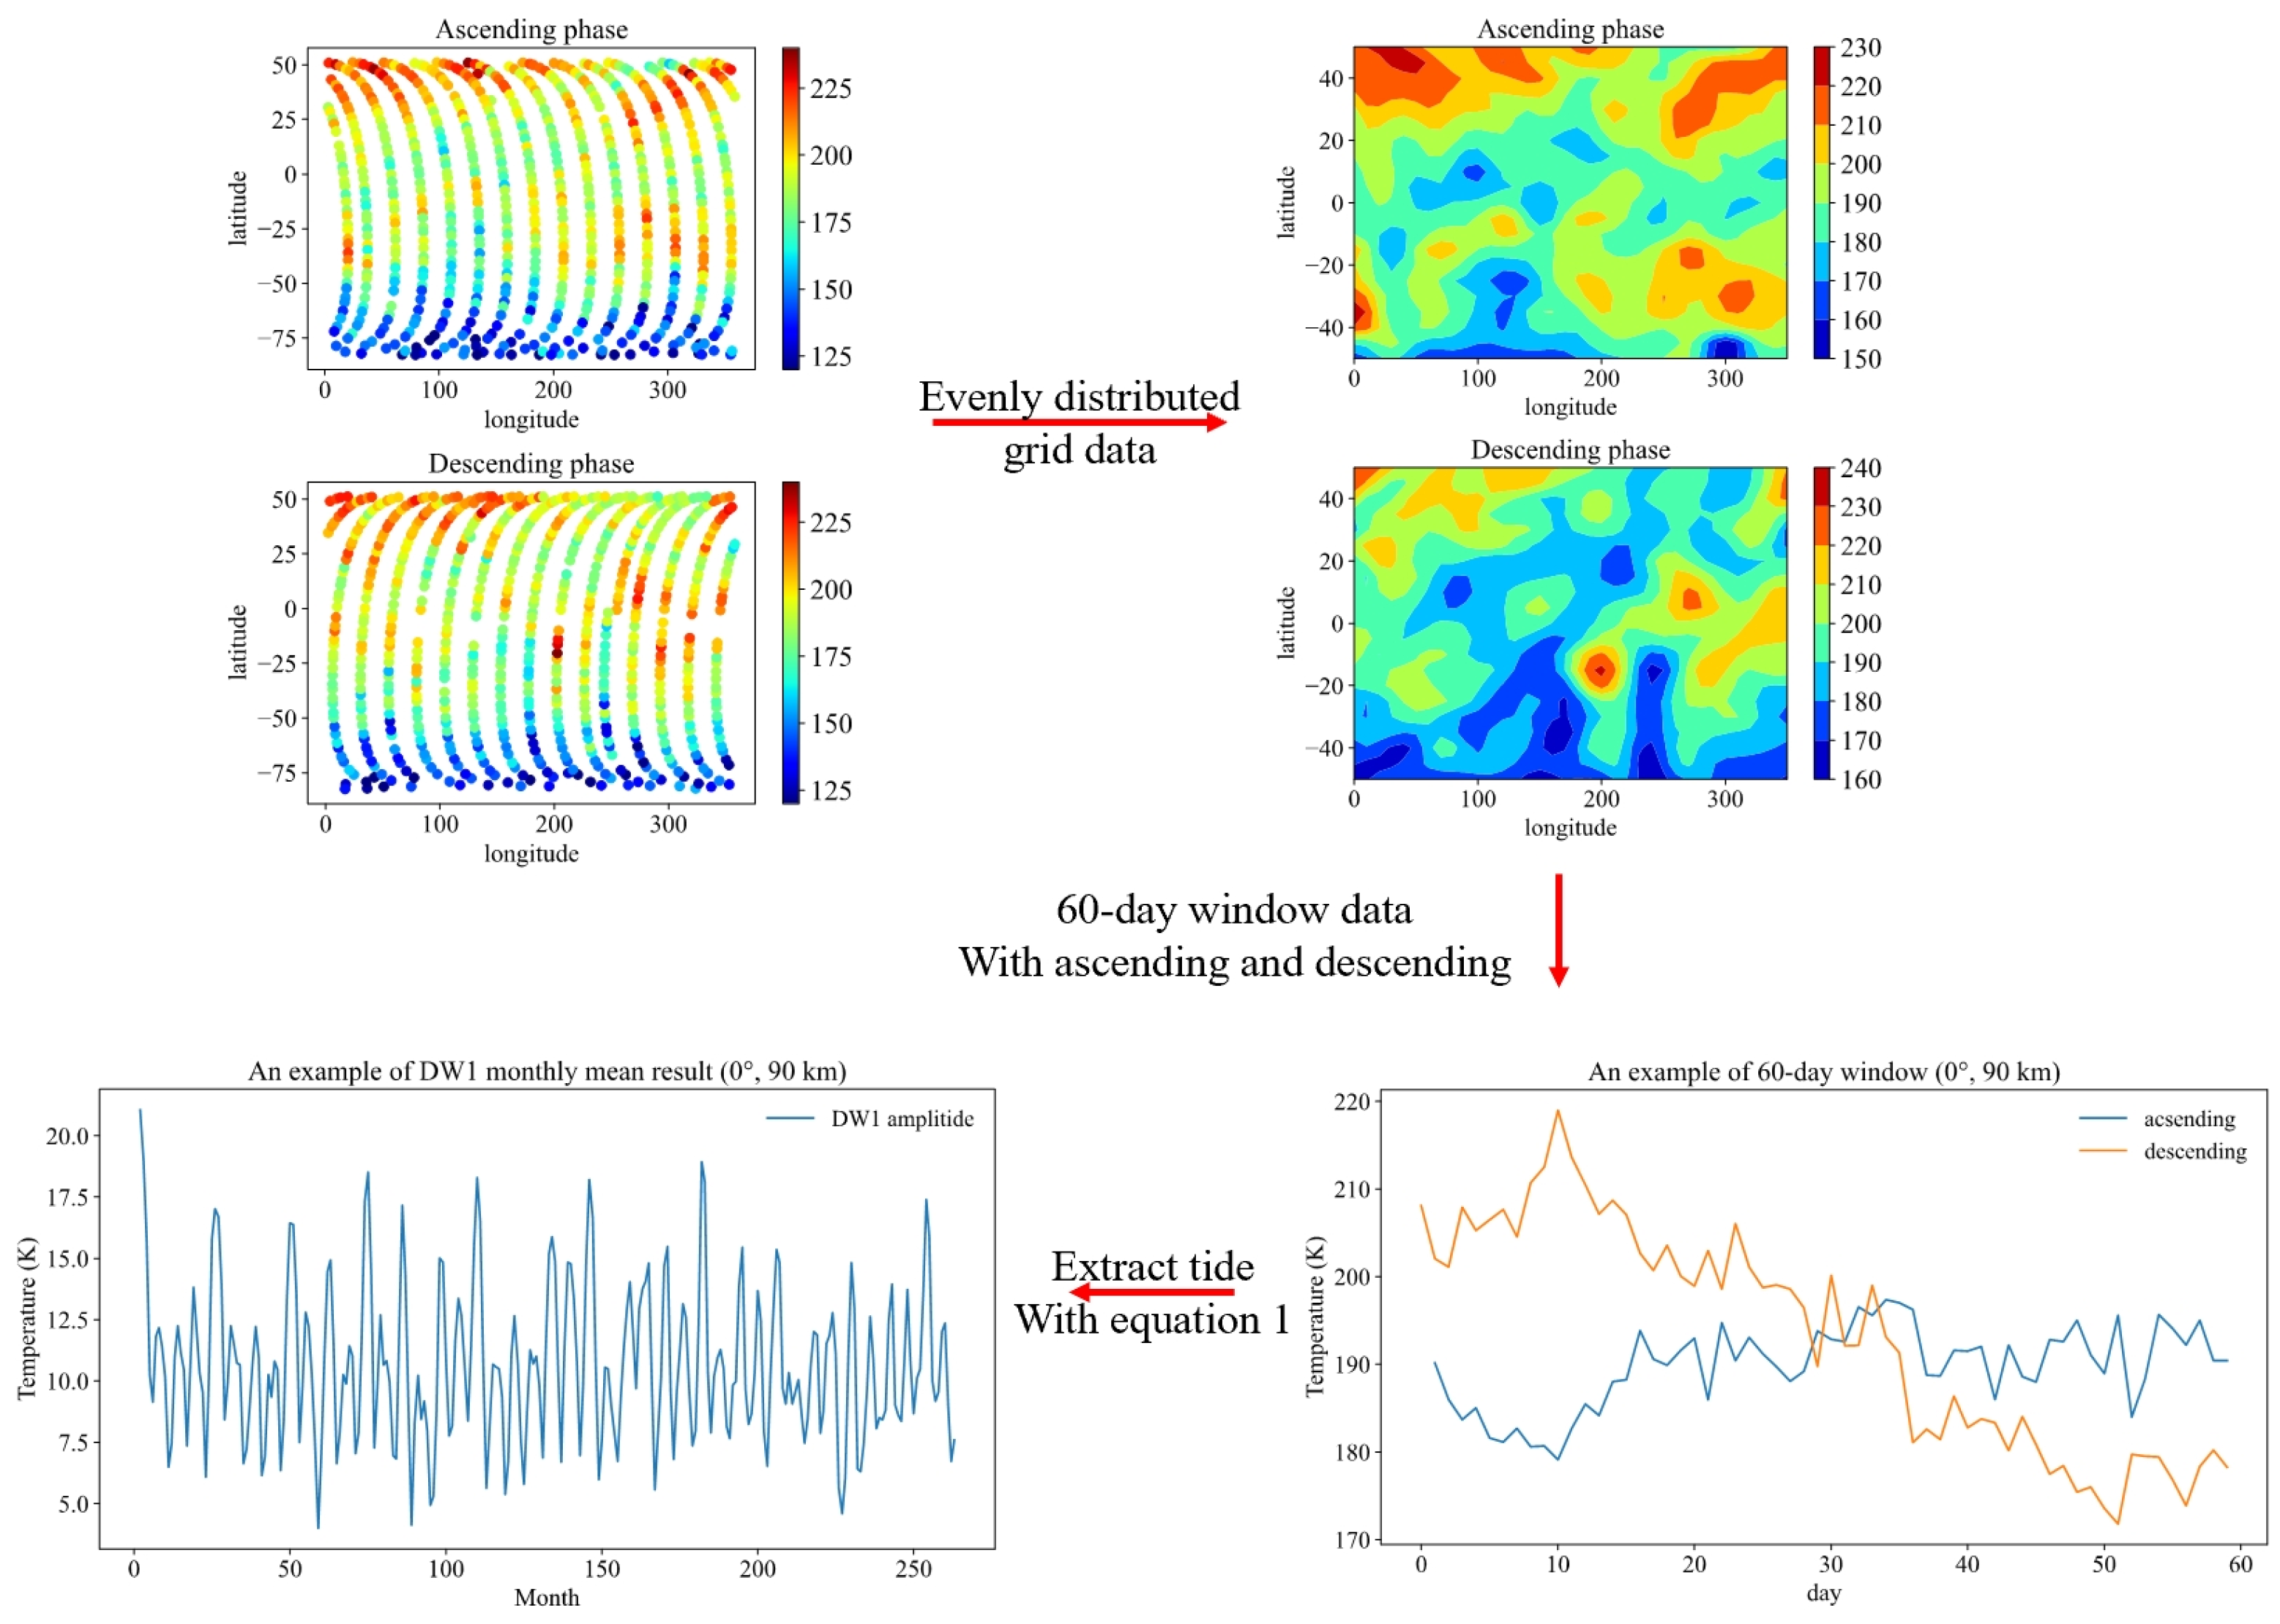
Figure 1. Full processing procedure from SABER/TIMED observations to migrating tide amplitudes.
Remotesensing 16 03437 g001
Figure 2. Indices used in the multiple linear regression: F10.7 (top), NINO3.4 (middle), and QBO (bottom). Black solid lines show where the zero winds are.
Remotesensing 16 03437 g002
Figure 3. Temperature migrating diurnal tide amplitude structure as a function of altitude (65–100 km) and latitude (50°S–50°N) obtained by the average from 2002 to 2023. The vertical dashed lines give the latitudes corresponding to the peaks of theoretical calculation results.
Remotesensing 16 03437 g003
Figure 4. Temperature DW1 amplitude response to (a) solar activity (F10.7 index) and (b) ENSO (NINO3.4) as a function of height (65–100 km) and latitude (50°S–50°N) revealed using the MLR method. The oblique line region indicates the coefficients over the 95% significance level. The contour parts represent the coefficient. The vertical green dashed lines give the latitudes, which give the latitude corresponding to the peak of the theoretical calculation.
Remotesensing 16 03437 g004
Figure 5. Relationships between the temperature DW1 amplitude, which removes QBO component using the MLR method and F10.7 index. (ac) annual mean results of temperature DW1 amplitude and F10.7 index at 87 km, 93 km, and 99 km on the equator. The years in red represent the series influenced by the 2015–2016 SQBO disruption event.
Remotesensing 16 03437 g005
Figure 6. Scatter plots of temperature DW1 amplitude and F10.7 index (a) at 87 km (blue dots) and (c) 99 km (green dots) on the equator. The red dots represent the years influenced by 2015–2016 SQBO disruption event. Series drop amplitude from 2015 to 2018 (b) at 87 km and (d) at 99 km. C_C represents the correlation coefficient.
Remotesensing 16 03437 g006
Figure 7. Comparison of temperature DW1 amplitude from original data (blue lines) and the data removing the QBO component using the MLR (orange) and EEMD (green lines) methods at 87 km and 99 km on the equator.
Remotesensing 16 03437 g007
Figure 8. The same as Figure 5 but with the QBO component removed using the EEMD method at (a) 87 (blue stars) and (b) 99 km (green stars). The red stars represent the years influenced by 2015–2016 SQBO disruption event.
Remotesensing 16 03437 g008
Figure 9. Same as Figure 6 but remove QBO component by EEMD method at (a) 87 (blue stars) and (c) 99 km (green starts). The red stars represent the years influenced by 2015–2016 SQBO disruption event. Series drop amplitude from 2015 to 2018 (b) at 87 km and (d) at 99 km.
Remotesensing 16 03437 g009
Table 1. The average R-square result using multiple linear regression (MLR) with different combinations of QBO index and single QBO index.
Two LayersR-SquareCorrelation
Coefficient
Single LayerR-Square
30 hPa & 10 hPa0.44−0.1270 hPa0.25
40 hPa & 15 hPa0.48−0.1550 hPa0.13
50 hPa & 20 hPa0.45−0.2740 hPa0.12
70 hPa & 30 hPa0.36−0.2930 hPa0.27
20 hPa0.45
15 hPa0.43
10 hPa0.23
Table 2. The lag correlation between the annual mean F10.7 index (the lag one) and annual mean DW1 amplitude minus the QBO component amplitude. The maximum lag correlation at each latitude and height is shown in bold. * means the correlation is over the 95% significance level.
Time Lag (Years)−5−4−3−2−10
0°, 87 km−0.310.060.390.62 *0.73 *0.72 *
0°, 99 km0.060.46 *0.75 *0.90 *0.87 *0.62 *
Disclaimer/Publisher’s Note: The statements, opinions and data contained in all publications are solely those of the individual author(s) and contributor(s) and not of MDPI and/or the editor(s). MDPI and/or the editor(s) disclaim responsibility for any injury to people or property resulting from any ideas, methods, instructions or products referred to in the content.