Abstract
Farmland shelterbelts are aimed at farmland protection and productivity improvement, environmental protection and ecological balance, as well as land use planning and management. Farmland shelterbelts play a vital role in determining the structural integrity and overall effectiveness of farmland, and assessing the dynamic changes within these protective forests accurately and swiftly is essential to maintaining their protective functions as well as for policy formulation and effectiveness evaluation in relevant departments. Traditional methods for extracting farmland shelterbelt information have faced significant challenges due to the large workload required and the inconsistencies in the accuracy of existing methods. For example, the existing vegetation index extraction methods often have significant errors, which remain unresolved. Therefore, developing a more efficient extraction method with greater accuracy is imperative. This study focused on Youyi Farm in Heilongjiang Province, China, utilizing satellite data with spatial resolutions ranging from 0.8 m (GF-7) to 30 m (Landsat). By taking into account the growth cycles of farmland shelterbelts and variations in crop types, the optimal temporal window for extraction is identified based on phenological analysis. The study introduced a new index—the Re-Modified Anthocyanin Reflectance Index (RMARI)—which is an improvement on existing vegetation indexes, such as the NDVI and the improved original ARI. Both the accuracy and extraction results showed significant improvements, and the feasibility of the RMARI was confirmed. The study proposed four extraction schemes for farmland shelterbelts: (1) spectral feature extraction, (2) extraction using vegetation indexes, (3) random forest extraction, and (4) RF combined with characteristic index bands. The extraction process was implemented on the GEE platform, and results from different spatial resolutions were compared. Results showed that (1) the bare soil period in May is the optimal time period for extracting farmland shelterbelts; (2) the RF method combined with characteristic index bands produces the best extraction results, effectively distinguishing shelterbelts from other land features; (3) the RMARI reduces background noise more effectively than the NDVI and ARI, resulting in more comprehensive extraction outcomes; and (4) among the satellite images analyzed—GF-7, Planet, Sentinel-2, and Landsat OLI 8—GF-7 achieves the highest extraction accuracy (with a Kappa coefficient of 0.95 and an OA of 0.97), providing the most detailed textural information. However, comprehensive analysis suggests that Sentinel-2 is more suitable for large-scale farmland shelterbelt information extraction. This study provides new approaches and technical support for periodic dynamic forestry surveys, providing valuable reference points for agricultural ecological research.
1. Introduction
Farmland shelterbelts serve as essential ecological barriers, protecting agricultural production from natural disasters while also contributing to regional soil and water conservation, wind erosion control, and climate regulation [1]. By reducing wind speeds, these shelterbelts create a more favorable microclimate within protected areas, leading to increased crop yields. Therefore, monitoring and extracting farmland shelterbelt information is a critical aspect of forestry resource surveys. As an important type of protective forest, shelterbelts play a vital role in enhancing ecological security and improving the quality of human living environments. The ecological, economic, and social benefits they offer highlight their significant role in promoting sustainable agricultural development and enhancing the ecological environment [2]. The timely and accurate identification of shelterbelt structures and distribution is essential for the sustainable management of these protective forests and for assessing the progress of shelterbelt engineering projects [3].
Traditional field survey methods are time-consuming, costly, and labor-intensive, making them impractical for large-scale studies, especially in the current era of rapidly advancing information technology. In contrast, remote sensing monitoring technology offers distinct advantages, such as wide coverage, multi-scale capabilities, and the availability of long-term data series. These characteristics provide a robust data foundation for obtaining information on farmland shelterbelts [4]. Initially, visual interpretation methods were predominantly used to establish interpretation keys for investigating and studying shelterbelts. By incorporating human–computer interaction techniques, spatial distribution information could be effectively extracted [5]. Object-oriented classification further enhances analysis by utilizing all the features contained within satellite images. For instance, researchers [6] employed Landsat TM imagery in combination with non-remote sensing data. Through the establishment of standards via visual interpretation methods, they conducted a comprehensive investigation of farmland shelterbelts. Through human–computer interactive visual interpretation, farmland shelterbelts were accurately identified, information was extracted, and distribution information on the shelterbelts was clearly obtained. However, there was a lack of evaluation regarding the accuracy of the extraction results.
With advancements in remote sensing technology, the accuracy and efficiency of extracting targets through remote sensing have significantly improved. Researchers have increasingly utilized techniques such as data fusion, computer-based automatic recognition, and remote sensing information extraction, coupled with advanced image processing methods, to successfully identify, extract, and analyze shelterbelt information in various regions. These studies have demonstrated that remote sensing imagery is highly effective for processing and revealing large-scale spatial distribution information, providing valuable data for the construction and management of shelterbelts. For example, Wiseman et al. [7] utilized aerial high-resolution remote sensing imagery, while Aksoy et al. [8] used sub-meter QuickBird-2 data. By combining spectral reflectance, shape, texture, and other features, these researchers were able to identify distinct characteristics of shelterbelts and successfully extract linear farmland shelterbelt information, with promising results. The accuracy of the research results produced by Wiseman and Aksoy both exceeded 94%. Similarly, Liknes et al. [9] employed 1 m resolution remote sensing imagery, integrating image segmentation with ensemble methods like random forests to extract farmland shelterbelt information in a rapid and automated way. Tree cover mapping classification using RF achieved a model prediction accuracy of 84.8% consistency. Further studies have also explored different methodologies for shelterbelt information extraction. Li et al. [10] conducted a remote sensing survey of the agricultural landscape using ZY-3 satellite imagery. They compared the maximum likelihood method with support vector machines for the classification and statistical analysis of shelterbelt areas. Among the various methods and models, SVM achieved the highest performance in classification results, with the highest accuracy reaching 87.34%. Xing et al. [11] also utilized ZY-3 multispectral imagery to explore methods for extracting shelterbelt information. They established a model for identifying shelterbelt data and proposed a shelterbelt integrity index to evaluate the accuracy of the extraction results; the correlation between the remote sensing results of shelterbelt preservation rates and reference data is strong, with an R2 of 0.936 and a mean absolute error of 5.4%, indicating high overall accuracy.
Remote sensing technology offers the ability to promptly detect and respond to changes in shelterbelts, providing clear visualizations of their shape and distribution. This enables efficient quantitative analysis and timely monitoring [12]. In agricultural remote sensing studies, vegetation indexes have shown significant advantages, particularly in the extraction and monitoring of vegetation features. Many researchers have incorporated vegetation indexes as effective tools for discriminative extraction methods. For example, Qiao et al. [13] used NDVI time series to reconstruct eucalyptus distribution information, with results validated for accuracy; when validated using high-resolution mosaicked images at coarse temporal resolution, the producer and user accuracies reached 79%. Qi et al. [14] developed a monitoring model for leaf chlorophyll content based on vegetation indexes extracted from multispectral images. The overall accuracy of the BP neural network was significantly higher than that of linear models and other machine learning models, with RMSE, NRMSE, MAE, and MAPE values of 0.814, 2.29%, 0.485, and 1.32%, respectively. Guerini Filho et al. [15] demonstrated a significant correlation between field and remote sensing data using vegetation indexes, which they used to estimate biomass in the natural grasslands of Brazil’s Pampas region; at growing degree days of 375 and 750, the R2 values were 0.51 and 0.65, respectively, and the biomass estimation results met the requirements. Gao et al. [16] combined two radiative transfer models to select appropriate remote sensing vegetation indexes for assessing forest chlorophyll concentration based on specific vegetation parameters. Similarly, Yang et al. [17] used spectral transformation vegetation indexes derived from drone imagery to construct classification features for desert grassland species, providing quantitative indicators for ecological management; the classification decision tree models constructed using the Continuous Change Detection and Classification (CCDC) normalized difference vegetation index (NDVI) and the Continuous Change Detection and Classification (CCDC) difference vegetation index (DVI) yielded the best results, with an overall classification accuracy and Kappa coefficient of 87% and 0.8, respectively. In addition to these methods, several researchers have proposed improvements to existing vegetation indexes. Ling et al. [18] developed the RGB-based Vegetation Difference Index (VDVI) and the HSV-transformed Vegetation Index (HSVVI) to enhance vegetation extraction. Cheng et al. [19] introduced the Normalized Hue and Lightness Vegetation Index (NHLVI), while Gao et al. [20] proposed the Enhanced Green–Red–Blue Difference Index (EGRBDI) based on the Red–Green–Blue Vegetation Index (RGBVI) to amplify vegetation’s strong reflectance in the green band. Zheng et al. [21] created the Visible Light Vegetation Enhanced Green–Blue Ratio Index (EGBRI) by incorporating the spectral characteristics of healthy green vegetation using the green and blue bands. These advancements allow for the rapid extraction of vegetation information from large-scale imagery, ensuring strong differentiation between vegetation and other land features, along with high extraction accuracy. Among these approaches, Li et al. [22] combined spectral features, vegetation indexes, and texture characteristics while substituting other wavelength bands without altering the vegetation index formulas. They utilized the RF algorithm for feature selection and classification, successfully extracting the distribution of farmland shelterbelts. This approach validated and evaluated the application potential and effectiveness of the 5 m optical 02 satellite. Under the optimal scheme, the OA and Kappa coefficients are 0.8908 and 0.8499, respectively. Deng et al. [23] proposed a remote extraction method for accurately reflecting the distribution of farmland shelterbelts using a random forest algorithm to classify ZY-3 images. This method achieved an overall accuracy rate of 94.9% in the study area, with the highest accuracy in different regions reaching 98.4% and the lowest being 87.7%.
However, remote sensing images capture wide-area information of the Earth’s surface through satellite or aerial sensors, containing rich spatial and spectral data. Each surface feature, such as vegetation, water bodies, buildings, and soil, exhibits unique spectral responses in different bands of the electromagnetic spectrum. This diversity in land types complicates the process of accurately interpreting the data. The research by the above scholars has achieved excellent results in extracting farmland shelterbelts. From the perspective of agricultural land analysis, research on extracting farmland shelterbelts meets the accuracy requirements at this stage, highlighting the need for improvements in vegetation extraction efficiency, the distinction between vegetation and other land features, and image resolution and accuracy. There is still room for improvement and a trend toward enhancing vegetation extraction efficiency and increasing the distinction between vegetation and other land features. Additionally, some limiting factors related to image resolution and extraction accuracy remain, which can be analyzed further. In addition, although there are various indices used for vegetation extraction, and the system is already well established, the current vegetation indices are still not fully suitable for the extraction of farmland shelterbelts. There may be result errors due to the phenomenon of spectral similarity between different objects. There is a lack of a vegetation index specifically designed for the extraction of farmland shelterbelts, making it necessary to propose a new index tailored for this purpose. Building on the research of previous scholars, it is clear that understanding the characteristics of farmland shelterbelts is essential for enhancing recognition accuracy, enabling the rapid and efficient extraction of spatial structures, and informing more targeted government policy decisions. Therefore, the primary objective of this study is to achieve high-precision identification and extraction of farmland shelterbelts. This will be accomplished by exploring phenological information, spectral features, and the sensitivity of green vegetation to various bands, and by developing effective extraction indexes. We plan to integrate these indexes with feature band fusion and machine learning algorithms to improve the performance of our system. Furthermore, we investigate how different levels of spatial resolution affect the accuracy of our extraction methods by analyzing the error rates across multiple datasets obtained from different satellites. Our analysis aims to fine-tune the methodology behind shelterbelt extraction so that future applications yield more precise and reliable environmental assessment and policymaking data [24].
2. Material and Methods
2.1. Study Area
The study area for this experiment is located in Youyi County, Shuangyashan City, in the eastern part of Heilongjiang Province, as illustrated in Figure 1. This region lies between longitudes 131.27°E and 132.15°E and latitudes 46.28°N and 46.59°N. It experiences a temperate monsoon climate characterized by distinct seasons, with warm, humid summers where rainfall and heat coincide, creating favorable conditions for crop growth and maturation. The terrain of Youyi County is relatively flat, consisting mainly of hills and plains. The fertile soil in this area supports agricultural production, making Youyi County a significant agricultural region within Heilongjiang Province.
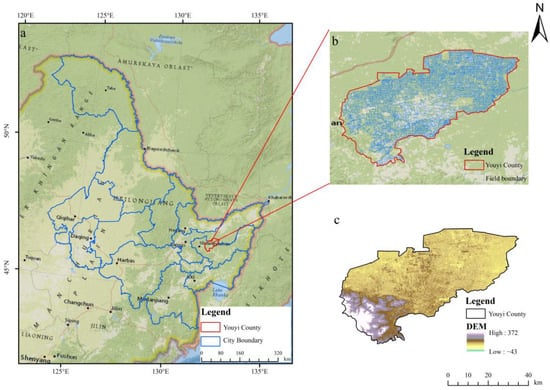
Figure 1.
Overview of the study area. (a) Boundary of Heilongjiang Province. (b) Youyi County. (c) DEM of Youyi County.
2.2. Data Acquisition and Preprocessing
Data for the GF-7, Planet Labs, Sentinel-2, and Landsat OLI 8 satellites were sourced from the following platforms: GF-7 data were obtained through the China Resources Satellite Application Center (https://www.cresda.com/) (accessed on 29 August 2024); Planet Labs data were retrieved from the official Planet website (https://www.planet.com/) (accessed on 29 August 2024); Sentinel-2 data were accessed via the Google Earth Engine platform (https://earthengine.google.com/) (accessed on 29 August 2024); and Landsat OLI 8 data were downloaded from the Geospatial Data Cloud (https://www.gscloud.cn/) (accessed on 29 August 2024). Notably, the GF-7 is China’s first satellite capable of acquiring sub-meter spatial resolution imagery [25]. Equipped with a star map fusion star sensor, the GF-7 satellite performs angle corrections, significantly enhancing its accuracy [26]. As part of the preprocessing steps, radiometric calibration, orthorectification, and true color composite generation were performed on the multispectral and panchromatic band data. Planet Labs operates the world’s largest Earth-imaging satellite constellation, capable of capturing daily satellite imagery. This imagery undergoes sensor correction, radiometric correction, and geometric correction, and is then mosaicked to cover the study area. Sentinel-2, launched by the European Space Agency, is a high-resolution multispectral imaging satellite that covers 13 bands, ranging from visible light to shortwave infrared. Meanwhile, the U.S. Landsat satellite series has been used for Earth observation for nearly 50 years, offering remote sensing imagery with high radiometric calibration accuracy and excellent data integrity [27]. The sensor parameters for the GF-7 and Planet satellites are provided in Table 1. The sensor parameters for the Sentinel-2 and Landsat 8 satellites are detailed in Appendix A, while the specific dates of the imagery used are listed in Appendix B.

Table 1.
Parameters of GF-7 and Planet satellites.
2.3. Samples and Validation Data
Annotations for the study were carried out using visual interpretation methods. Farmland shelterbelts, being long-term distributed vegetation, exhibit minimal changes between adjacent years. Therefore, typical and representative samples were selected to ensure accuracy. Label vectors were carefully drawn to fully encompass the farmland shelterbelts, with appropriate lengths chosen for breakpoints. Even when adjacent areas were present, they were labeled separately to prevent interference from the spectral information of other land features. An example of these annotations is presented in Figure 2 of this document. In total, 2127 sample points for farmland shelterbelts were created within the study area, providing valuable ground-truth data to complement the remotely sensed imagery. To further ensure the accuracy of these sample points, field surveys were conducted in areas where uncertainties were identified.
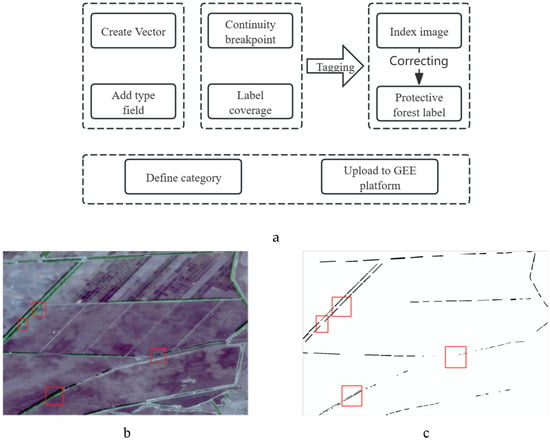
Figure 2.
Example of dataset labeling. (a) Annotation workflow diagram. (b) High-resolution original image used for labeling. (c) Detailed annotation labeling; among them, the red borders indicate detailed demonstration cases.
From the 2127 sample points, 600 were selected as training samples for the establishment of classifiers and for accuracy verification. Additionally, 200 label samples were created for non-vegetated areas, including urban buildings, water bodies, and bare soil. These non-vegetated samples were specifically designed to reduce the impact of such areas on classification. By treating these non-vegetated regions as background noise, the robustness and distinguishability of the dataset were enhanced, contributing to improved accuracy in the final classification results.
2.4. Phenological Analysis Selection and Time Series Analysis
The study area’s climate is characterized by long, cold winters and warm, humid summers. Trees generally begin to green in the spring, typically starting in late April within the same growing season. The growth cycle of crops in this region is influenced by factors such as temperature, soil conditions, and precipitation. About 10 days after sowing, usually in early June, new sprouts start to emerge in the fields and gradually become visible as green in satellite imagery. Farmland shelterbelts, however, follow a different growth cycle compared to crops, which allows them to be distinctly identified from other land features during specific times of the year. This distinction is crucial for the accurate classification and extraction of farmland shelterbelts in remote sensing studies.
To analyze the growth trend of farmland shelterbelts, focusing on their relatively stable growth cycle throughout the years, our study concentrates on the timeframe spanning from 2018 to 2024. During this period, we have systematically examined cloud-free monthly images selected for the months of March through June inclusive, ensuring consistent 10-day intervals between observations served as temporal markers. For each of these four months, image acquisition took place thrice, resulting in a comprehensive collection of yearly datasets containing twelve images apiece. A selection of these images taken at various stages is depicted in Figure 3. Additionally, 100 representative farmland shelterbelts sample points were selected based on the following criteria: farmland shelterbelt areas surrounding other land features with similar spectral characteristics, smaller farmland shelterbelt areas, and densely planted shelterbelts. Field survey records from March, April, May, and June 2024 were used to verify the phenological characteristics of the farmland shelterbelts and to serve as a validation for the subsequent methodological results.
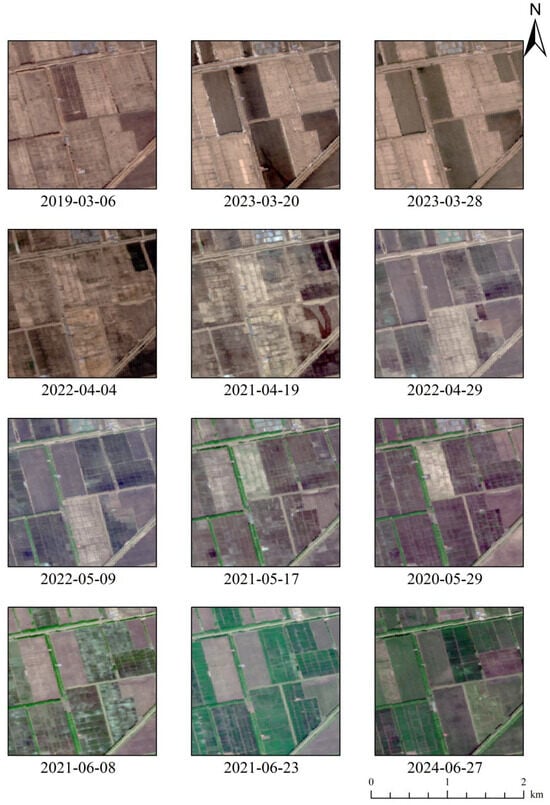
Figure 3.
Comparison of imagery for different months during the bare soil period.
To pinpoint and affirm the most opportune time frame suitable for accurately extracting data pertaining to farmland shelterbelts, we leveraged normalized difference vegetation index (NDVI) time-series plots these graphical representations elucidate discernible patterns of change observed in NDVI metrics distinguishing vegetated from unshaded lands over varying timelines. These curves illustrate the variations in NDVI values between vegetation and non-vegetation over different periods [28].
Figure 4 demonstrates that the normalized difference vegetation index (NDVI) for areas lacking substantial vegetation—notably urban centers, barren landscapes, and aquatic bodies—tends to stay minimally variable and consistently lower across seasons. Interestingly, while NDVI readings for farmland shelter belts plunge to their lowest point annually in March due to wintertime dormancy, these very shelter belts exhibit markedly elevated NDVI scores come May. This surge precedes the summer crescendo witnessed amongst broader categories of greenery—a phase marked by sharp increases in NDVI up until July, signaling prime growth vigor. Subsequently, NDVI rates for both shelterbelts and wider vegetation populations commence a downturn post-July. Notably, the challenge of distinctively identifying farmland shelter belts against the backdrop of other burgeoning flora intensifies between June and August, given that NDVI values converge.
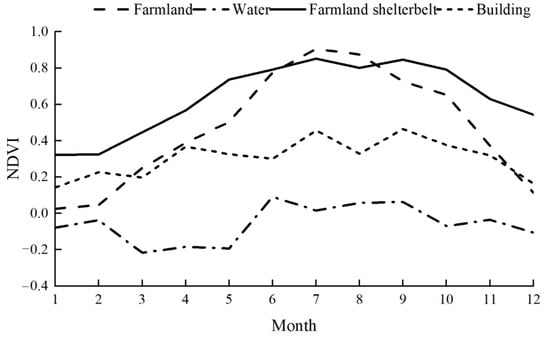
Figure 4.
Normalized difference vegetation index (NDVI) time series curve.
2.5. Construction of Spectral Feature Indexes
Given the insights gleaned from the NDVI time series and recognizing the unique phenological characteristics exhibited by farmland shelterbelts, May was identified and confirmed as the optimal temporal window for information extraction. Following this determination, further analysis was performed on the spectral band characteristics of farmland shelterbelts in comparison to other land features using imagery from May.
2.5.1. Spectral Analysis of Different Land Features
The average values for each band in the multispectral imagery were calculated for various land cover samples within the study area, and spectral curves were plotted accordingly. As shown in Figure 5, the spectral response characteristics of different land cover types exhibit some variability. Due to the unique growth cycle of farmland shelterbelts, which results in distinct spectral characteristics compared to traditional ground components such as earth substrates, man-made structures, and aqueous environments. Specifically, there is a noticeable increase in reflectance around the 670 nm wavelength in the blue spectrum, whilst concurrently revealing a notable depression in absorbance within the close-to-infrared spectrum stretching from 750 to 850 nm. Furthermore, concerning the responsiveness of the red and green bands, situated in the optical realm extending from 500 to 600 nm, existing measures echo the baseline responses characteristic of myriad other land-based phenomena. Through this methodical spectral profiling, we establish a foundation for comparing farmland shelterbelt systems with their surrounding milieu. Water bodies and impervious surfaces exhibit more distinctive spectral curve characteristics, with the lowest reflectance values across all bands. In contrast, soil and buildings demonstrate a steady increase in reflectance with wavelength, although the overall trend remains relatively stable.
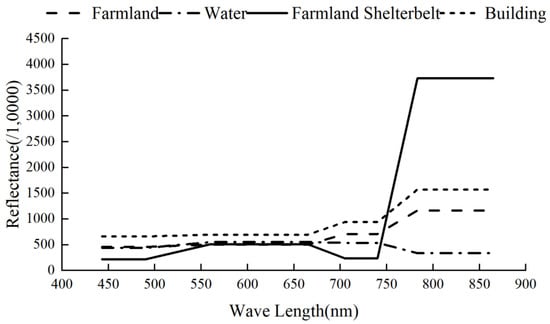
Figure 5.
Spectral reflectance of different land features.
In summary, the spectra of farmland shelterbelts can be clearly distinguished from those of other land cover types. Despite some differences between the spectral curves of vegetation in the imagery and typical vegetation spectral curves, the overall spectral characteristics still offer a solid foundation for classification and extraction.
2.5.2. Vegetation Index Extraction
Feature extraction is a critical step in remote sensing classification, as combining various feature variables can greatly improve the accuracy of classification results [8]. Vegetation indexes, which provide simple, effective, and direct measures of surface vegetation conditions, are widely employed in both global and regional land cover and vegetation classification. The incorporation of vegetation indexes into the classification process can help reduce misclassification and omission errors, thereby playing a key role in identifying land cover types and calculating relevant parameters. While vegetation indexes may not entirely distinguish shelterbelts from other types of vegetation, they are instrumental in minimizing potential linear artifacts during the information extraction process [29]. This makes them a valuable tool in enhancing the precision and reliability of remote sensing classifications.
Spectral vegetation indexes are mathematical combinations of different spectral bands designed to enhance the information available in spectral reflectance data. Chlorophyll, a crucial pigment in photosynthesis, plays a significant role in a plant’s ability to exchange matter and energy with its environment. The content of chlorophyll not only dictates the manner in which plants interact with their surroundings but also serves as a litmus test for assessing a plant’s physiological well-being [30]. Some studies suggest that chlorophyll content in leaves can reduce confusion effects caused by complex scattering patterns from canopy structures and other noise sources, such as background interference and atmospheric conditions [31]. Remote sensing holds substantial potential for large-scale chlorophyll estimation, and vegetation indexes are widely used for this purpose. Effective vegetation indexes are those that maximize sensitivity to vegetation characteristics and improve model accuracy. The most commonly used spectral bands for developing these indexes are located in the red region of chlorophyll absorption (around 670 nm) and the near-infrared region (750–900 nm), where vegetation exhibits strong reflectance [32]. By identifying specific wavelengths in visible and near-infrared light, it is possible to monitor biochemical substances in leaves at the canopy level. This suggests that the spectral absorption characteristics of crop shelterbelts are broad and exhibit strong spectral signals, making them distinguishable from other land covers. In this study, vegetation indexes sensitive to chlorophyll content were selected from optical feature parameters to enhance contrast, reduce missing values, and lower noise. Additionally, non-vegetation indexes—such as those pertaining to soil, buildings, and water bodies—were introduced to further differentiate and compare land cover types. These indexes included in the study are NDVI [33], RVI [33], GLI, EVI [34], SAVI [35], MSAVI [35], CIG, GRVI, RGBVI, PSRT, SIPI, and ARI [36]. These indexes were treated as independent spectral bands and incorporated into subsequent RF classification tasks to aid in feature band calibration and land cover classification. The study compared changes in model classification accuracy before and after the inclusion of these vegetation indexes. Among the calculated indexes, NDVI, GNDVI, SAVI, MSAVI, RGBVI, SIPI, and ARI exhibited more distinct color differences under the same hue arrangement template, as shown in Appendix C Figure A1. These indexes effectively differentiated shelterbelts from other land cover backgrounds, demonstrating their utility as feature bands in RF classification tasks. The specific formulas for these indexes are provided in Appendix C.
2.5.3. Improvement and Optimization Design of Anthocyanin Reflectance Index
Gitelson et al. [37] first introduced the Anthocyanin Reflectance Index (ARI), which is formulated as shown in Formula 1 of Table 2. The index leverages the optical characteristics of anthocyanins, pigments present in vegetation, to identify and quantify their absorption and reflection spectra, thus estimating anthocyanin content in leaves. ARI is calculated using spectral information from two specific bands, where the reciprocal of these bands enhances the signal sensitivity, effectively capturing changes in anthocyanin content. This approach focuses on the difference between the reciprocals of these two bands, allowing for a more accurate detection of anthocyanins in vegetation. In 2006, Gitelson et al. [38] expanded on this concept by introducing the Modified Anthocyanin Reflectance Index (MARI). This method provides a rapid and non-invasive technique for estimating pigment content, making it highly suitable for large-scale and real-time applications in remote sensing. In 2019, Bayle et al. [39] further refined the approach by proposing the Normalized Anthocyanin Reflectance Index (NARI). This index is based on the observation that plants with higher anthocyanin concentrations exhibit distinct absorption patterns in the green spectrum (500–550 nm), which can be exploited to measure anthocyanin levels. More recently, in 2023, Gitelson et al. [40] developed the Normalized Difference Anthocyanin Index (NDAI). This index is based on the high absorption of anthocyanins in the green part of the spectrum and their low absorption in the red part. Gitelson’s experiments revealed that while significant progress has been made in estimating chlorophyll and carotenoid content, the methods for measuring anthocyanins are less well understood. The NDAI leverages spectral band data similar to those used for chlorophyll and carotenoid extraction, making it particularly suitable for remote sensing applications that utilize different spectral bands. These indexes collectively enhance our ability to measure and monitor anthocyanin content in vegetation, which is vital for understanding plant health, stress, and other physiological characteristics. The adaptation of these indexes for remote sensing applications allows for more accurate, large-scale, and cost-effective vegetation analysis.

Table 2.
Formulas for Anthocyanin Reflectance Index and improved optimization indexes.
The original ARI, while pioneering, indeed has some structural limitations that can impact its reliability and accuracy, especially in challenging conditions. Reciprocal calculation issues and amplification of differences: When reflectance values are close to zero, taking the reciprocal can disproportionately amplify small differences, which can lead to instability in the index. For instance, if the reflectance is very low, the reciprocal becomes large, potentially exaggerating noise and errors in the data. This can be particularly problematic in bands where the reflectance values are naturally low, such as in shadowed areas or in vegetation under stress, where reflectance might be reduced. Noise magnification: The magnification of noise due to the reciprocal calculation can result in unreliable measurements, especially in conditions where the signal-to-noise ratio is already low. This can lead to misinterpretation of anthocyanin content, as the index might reflect noise more than actual pigment concentration. Difference calculation limitations and linear relationship constraints: The ARI relies on simple linear differences between the reciprocals of reflectance in different bands. However, this approach may not accurately capture the complex, non-linear spectral variations that occur due to changes in anthocyanin content. Vegetation spectra are influenced by multiple factors, including leaf structure, pigment concentration, and environmental conditions, all of which can create non-linear relationships that simple linear differences might fail to represent accurately. Potential for uncertainty: Because the ARI is based on a difference calculation that assumes a linear response, it might not fully account for the intricate ways in which anthocyanins affect reflectance. It could introduce uncertainty into the index, especially when dealing with diverse vegetation types or varying environmental conditions, where the relationship between reflectance and anthocyanin content is more complex. Limited value range: the distribution range of the index values in the resulting images is narrow, making it challenging to extract and delineate the distribution of farmland shelterbelts, which may lead to random results. Band-specific dependence: the formula relies on specific bands at 550 nm and 700 nm. Inaccuracies: The reflectance of these bands can significantly impact the index’s calculation results. Additionally, the index may not be well suited for different plant species, as their reflectance responses in these bands may vary, leading to limitations in band selection across various plant types. Although subsequent improvements have been made to the ARI formula, focusing on refining the extraction of anthocyanin content in leaves, its application for identifying and extracting farmland shelterbelts still requires further optimization and refinement.
Building on this, we introduced additional spectral bands and applied logarithmic enhancement transformations, for example, based on the improvement approaches of the SAVI and MSAVI [35] indices drawing on modified anthocyanin indexes and other vegetation indexes. This approach is designed to improve the discrimination capability and applicability of the indexes for extracting farmland shelterbelts. The resulting improved and optimized formulas are detailed in Table 3. However, it is important to recognize that this indicator still requires further evaluation, and there may be alternative methods for developing indicators that are more sensitive to anthocyanin content.

Table 3.
Optimized index formula schemes.
2.6. RF Land Cover Classification and Extraction
Accurately extracting farmland shelterbelts from complex green vegetation backgrounds using only spectral information and vegetation indexes poses significant challenges. In response to this, our study based on the GEE platform and the random forest model incorporates vegetation indices as feature bands to further classify and extract farmland shelterbelts from remote sensing imagery.
RF [41], a powerful and widely used machine learning method, is a supervised classification technique that utilizes an ensemble of decision trees. Remote sensing image classification demonstrates strong resistance to noise, effectively prevents overfitting, and eliminates the need for pruning operations, thereby reducing computational complexity. This method is well suited for multi-class and multi-feature classification, as well as for extracting information from remote sensing images and handling high-dimensional and highly correlated data with ease. Compared to other classifiers like support vector machines, classification and regression trees, and naive Bayes, RF generally offers superior performance and more significant advantages [42].
In this study, we used the RF algorithm implemented on the Google Earth Engine (GEE) platform. The feature bands selected for classification were B2, B3, B4, and B8, with additional indexes included as input features. We randomly allocated 70% of the data for training and used the remaining 30% for validation. The classification results were assessed using a confusion matrix, and further validation was performed with ground-truth samples obtained from field investigations.
The classification accuracy of the model was evaluated using overall accuracy (OA) and the Kappa coefficient. To assess the model’s performance, a confusion matrix was employed to compare the location of each ground-truth pixel with its corresponding position in the classified image. OA measures the ratio of correctly classified pixels to the total number of pixels, while the Kappa coefficient quantifies the accuracy of the classification. These two standard metrics were used to evaluate the accuracy of farmland shelterbelt distribution extraction. The specific calculations for these metrics are detailed in Formulas (1) and (2).
2.7. Technical Process
The research was organized into three main parts. (1) Data acquisition and preprocessing: This phase involves collecting remote sensing images and performing necessary preprocessing tasks. Training label datasets were created through visual interpretation. (2) Analysis and extraction: This section focuses on selecting and comparing the spectral characteristics of farmland shelterbelts across different phenological periods to determine the optimal extraction window. A time series curve is constructed, and vegetation indexes are employed for unsupervised classification to extract farmland shelterbelts. An improved index is proposed, and an RF model, implemented on the GEE platform, is used for classification. Indexes are incorporated as feature bands in this extraction process. (3) Resolution comparison and accuracy assessment: Different resolution images are used to compare extraction outcomes at various resolutions and assess the accuracy of the results. The study evaluates the feasibility and applicability of extraction using different satellites. The distribution of farmland shelterbelts in Youyi County is mapped, and the accuracy of the extraction results is validated with field survey data and confusion matrices. The specific technical process is depicted in Figure 6.
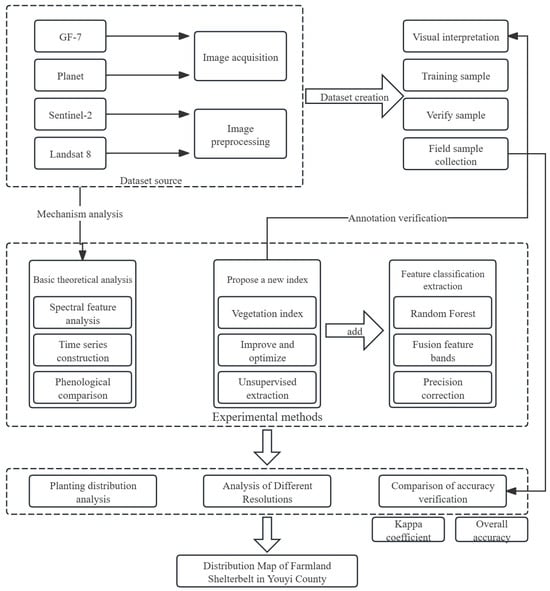
Figure 6.
Technical workflow for farmland shelterbelt extraction.
3. Results and Analysis
3.1. RMARI Verification and Analysis
Figure 7 illustrates the four proposed improvement schemes for shelterbelt extraction. In these grayscale images, intensity values range from 0 to 255, with 0 representing pure black and 255 representing pure white. This mapping enhances visual contrast, making subtle differences more discernible and improving the overall clarity of the data. The figure shows that Scheme 4 offers the most effective differentiation between farmland shelterbelts and background features. It successfully reduces noise and achieves the clearest separation.
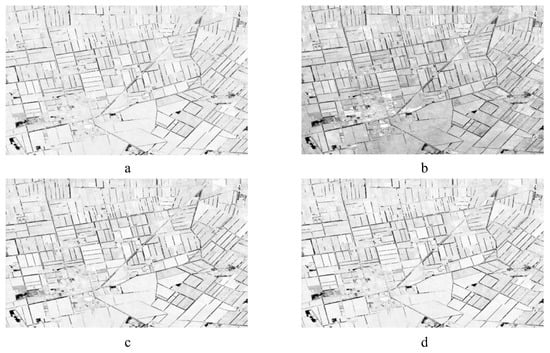
Figure 7.
Comparison of the four extraction schemes. (a) Scheme with added blue band. (b) Scheme with logarithmic structure and modified values. (c) Scheme with added blue band and logarithmic structure. (d) Scheme with added blue band, logarithmic structure, and modified values.
The study discovered that incorporating an additional blue band improves the capture of pigment variations related to photosynthesis in vegetation. This approach reduces dependence on single-band reflectance data, enhances data robustness, and minimizes the impact of noise. By integrating spectral information from the blue, green, and red bands, the overall spectral characteristics of vegetation are more accurately represented, which enhances the precision of farmland shelterbelt extraction across various sensors and scenarios [43]. Furthermore, research indicates that applying logarithmic enhancement to band features can effectively mitigate the impact of extreme values. This method reduces the influence of very low reflectance values, which can cause large values in the original ARI formula due to the reciprocal operation. Logarithmic transformation smooths out these extreme variations and normalizes the reflectance data distribution, making the system more sensitive to proportional relationships and relative changes between bands.
The introduction of correction values can smooth out extreme data and minimize the impact of noise on results [44]. These correction values account for environmental and background effects, allowing adjustments for different backgrounds to reduce interference from background reflectance. This enhancement improves adaptability to various plant species and focuses on spectral characteristics, making the index more effective for extracting chlorophyll. To further validate the effectiveness of the improved index, both the ARI and the modified index were used as individual feature bands in RF classification tasks [45]. The extraction accuracy of farmland shelterbelts at a 10 m resolution using Sentinel-2 data is presented in Table 4. Detailed comparison images of the original and extracted results are shown in Figure 8.

Table 4.
Accuracy of RF classification with ARI and improved indexes.
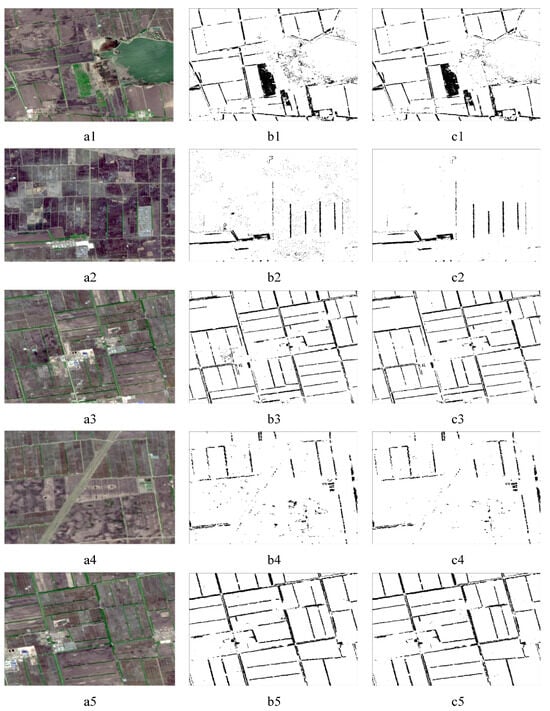
Figure 8.
Comparison of original image and extraction using different indexes ((a1–a5): original image; (b1–b5): ARI extraction; (c1–c5): improved index extraction).
The results from the RF classification using the improved index show a more effective reduction in large-scale background noise, elimination of missing values, and production of smoother and more complete contours for extracting farmland shelterbelts at a 10 m resolution with Sentinel-2 imagery compared to the ARI, besting the capabilities of its predecessor, the ARI. Indeed, the slippage margin noted in the precision ratings of the improved index relative to the ARI appears negligible. Both models boast comparable Kappa coefficients and OA, aligning closely enough to render this incremental dip in effectiveness almost inconsequential. This slight decrease is attributed to the inclusion of additional land cover class labels in the classification process, which enhances model stability and improves differentiation between land cover types. The improved approach aims to enhance the extraction effectiveness and accuracy of green vegetation (e.g., shelterbelts) during the bare soil period, but it may somewhat neglect the sensitivity to non-vegetation areas (soil, buildings, water bodies) in band feature extraction. As a result, the overall evaluation metrics are influenced by the classification of other land cover types, leading to slight reductions in the Kappa coefficient and OA. Figure 9 illustrates a comparison between the NDVI and the improved index extraction results. The NDVI fails to effectively capture the edges of the farmland shelterbelts, resulting in information loss, whereas the improved index better retains green vegetation information from the original image.
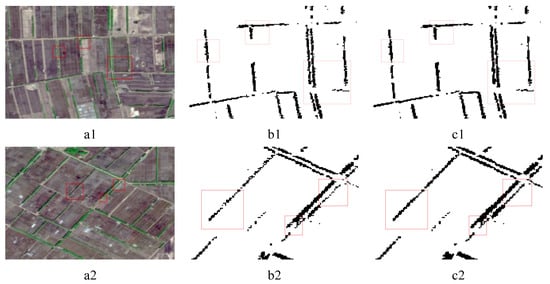
Figure 9.
NDVI contrast improved index detail extraction comparison ((a1,a2): original images; (b1,b2): NDVI extraction; (c1,c2): improved index extraction); among them, the red borders indicate detailed demonstration cases.
In summary, Scheme 4’s enhanced design can be proposed as a new index in this study. The analysis of its overall performance, compared to the ARI in terms of accuracy and extraction results, confirms the feasibility of the improved index for extracting farmland shelterbelts during the bare soil period. This new index, named the Re-Modified Anthocyanin Reflectance Index (RMARI), can be effectively used as a reference vegetation index for this purpose.
3.2. Comparison of Extraction Accuracy across Different Improvement Schemes
Validation using field survey sample points led to the following conclusions: Regarding spectral features and unsupervised classification, both methods effectively identify the locations of farmland shelterbelt distributions, but issues persist. Sparse farmland areas are sometimes misclassified as shelterbelts, excessive background noise points remain, and shelterbelt contours are not always fully recognized, leaving partiality to interpretation. Scheme 2, unsupervised extraction, struggles with threshold determination, leading to incomplete classification with either pixel loss or excess. Scheme 3, RF extraction, demonstrates improved performance over traditional methods. It effectively filters different land types and separates non-farmland shelterbelt areas with similar spectral characteristics. However, it still encounters issues with incomplete and blurred shelterbelt contours, affecting extraction quality. Scheme 4, integrating feature indexes as input bands in RF classification, yields the most refined extraction results. It achieves complete contour recognition, significantly reduces background noise, and accurately separates farmland shelterbelts from other land types. Overall, the optimized Scheme 4, which integrates feature bands into the RF model, provides the highest recognition accuracy and best extraction performance. Out of 100 field survey validation sample points, 96 met the criteria for clear and complete contour extraction. Figure 10 displays the extraction results for the various schemes.
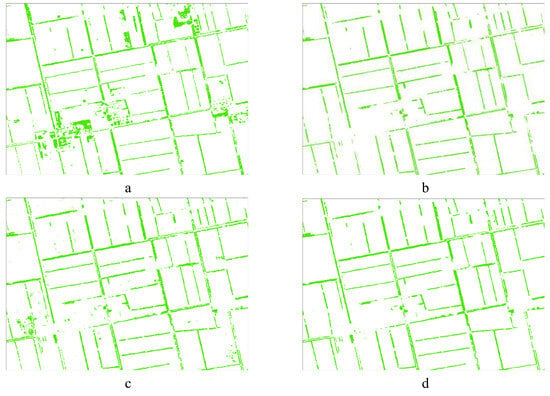
Figure 10.
Spatial distribution details of extracted farmland shelterbelt information. (a) Extracted from original near-infrared band; (b) extracted using index; (c) extracted using RF; (d) extracted using RF + index bands.
The Kappa coefficient for the RF-based farmland shelterbelt extraction is 0.9089, with an OA of 0.9431. For the RF with the band extraction scheme, the Kappa coefficient is 0.9293, and the OA is 0.9564. This indicates that incorporating spectral indexes into the classification process improves the Kappa coefficient by 0.02 points and the OA by 0.02 points. This modest improvement reflects enhanced performance compared to using a single index for classification. The accuracy comparison of the different schemes is presented in Table 5.

Table 5.
Comparison of accuracy for RF and feature band integration.
3.3. Analysis of Extraction Results from Different Resolution Images
The extraction results and accuracy of farmland shelterbelts for the May bare soil period were compared across different resolutions using the RF with spectral band index method. The resolutions compared include GF-7 at 0.8 m, Planet at 3 m, Sentinel-2 at 10 m, and Landsat 8 at 30 m. The results for each resolution are illustrated in Figure 11.
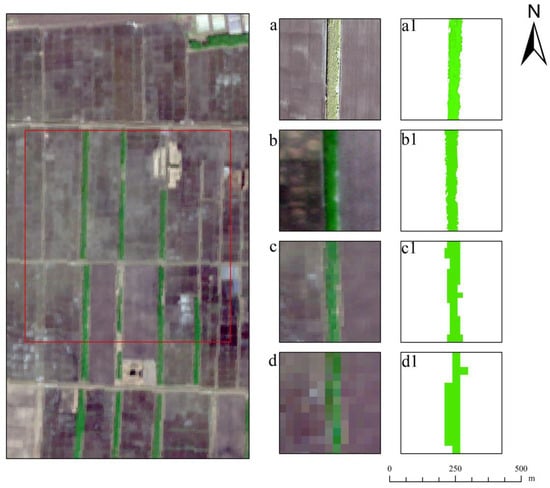
Figure 11.
Details of extraction results at different resolutions; among them, the red borders indicate detailed demonstration cases. (a) GF-7, (b) Planet, (c) Sentinel-2, and (d) Landsat. (a1–d1) represent the details of the extraction results for farmland shelterbelts using four types of satellite imagery.
Satellite observations with different spatial resolutions can capture the phenological dynamics of farmland shelterbelts, although finer-scale variations may be obscured. Lower spatial resolution images reduce the precision of capturing land cover details and introduce uncertainty in pure endmember extraction, affecting the accuracy of spectral unmixing methods [46]. As spatial resolution changes, with each pixel aggregating different elements, the extraction effectiveness of farmland shelterbelts can be enhanced. The 0.8 m resolution results can capture the fine structure of farmland shelterbelts, with extracted pixels densely covering the shelterbelts area, creating a complete and clear result. For example, details such as leaf contours, tree trunks, and gaps between leaves are visible, with smooth and continuous boundaries. This high resolution is suitable for projects requiring high accuracy. However, the large data volume and extended processing time are challenges, and the high resolution of GF-7 also results in the extraction of details of other green vegetation, such as weeds. Therefore, it is more suitable for small-scale extraction studies; the 3 m extraction results, compared to the 0.8 m results, show a loss of detail and are unable to capture very fine structures. Extraction issues persist even in high-resolution images, and due to the challenges in data acquisition, the Planet satellite is not suitable for extracting farmland shelterbelts. The 10 m extraction results, while not capturing small or elongated shelterbelts and missing some details and small-scale changes, are adequate for the extraction of the overall planting distribution of farmland shelterbelts. This resolution is sufficient for identifying large-scale shelterbelt layouts and changes, with relatively low data processing and storage requirements, making it suitable for large-area analyses. The 30 m extraction results exhibit significant differences in pixel distribution. Due to the low resolution, there are fewer pixels in small shelterbelts, leading to larger errors and substantial loss of boundary details. Landsat 8’s suitability is limited, making it more appropriate for long-term series and macro-scale analysis rather than current small-scale farmland shelterbelt extraction studies.
The Kappa coefficient and OA vary across different-resolution images. Detailed metrics for each resolution are presented in Table 6, while Figure 12 illustrates the trends in accuracy as a function of spatial resolution.

Table 6.
Extraction accuracy for different resolutions.
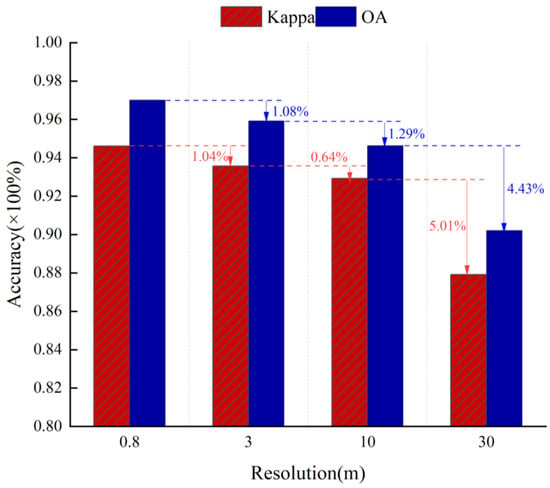
Figure 12.
Bar chart comparing different resolutions.
In datasets with high-resolution imagery better than 5 m, such as those from GF-7 and Planet satellites, the extraction of pure endmembers is highly accurate, preserving rich detail and boundary features with minimal misclassification. Consequently, GF-7, with its 0.8 m resolution, achieves the highest Kappa coefficient and OA for extracting farmland shelterbelts. For publicly available datasets, Sentinel-2 with a 10 m resolution shows a decrease in both Kappa coefficient and OA compared to higher resolutions, but it still maintains relatively high accuracy. As spatial resolution decreases, the ability to capture detailed information and the model’s recognition capability decline. The difference in accuracy compared to Landsat 8 at 30 m is more pronounced, with the Kappa coefficient dropping by 0.5 percentage points and OA decreasing by 0.6 percentage points. Overall, accuracy improves with higher resolution. There is a slight decrease in accuracy when moving from 0.8 m to 3 m resolution, a significant drop at 10 m, and the most notable decline at 30 m.
In summary, from the perspective of satellite spatial resolution, most data from satellite sensors are too coarse to accurately observe narrow tree planting belts. Although high-resolution satellite imagery can detect small or narrow features, the high cost of such data hinders its application in detailed surveys. The GF-7 satellite (0.8 m resolution) is ideal for detailed research and small-scale high-precision projects. It provides excellent texture extraction and detail preservation but is complex and resource-intensive to process. The Planet satellite (3 m resolution) offers good extraction precision, though not as detailed as GF-7. It is suitable for projects where spatial resolution and pixel size need to be balanced for effective land cover extraction. Sentinel-2 (10 m resolution) is a balanced choice for regional analysis, offering a good trade-off between accuracy and processing costs. It effectively captures the features and distribution of large-scale farmland shelterbelts. Landsat 8 (30 m resolution) shows significant boundary loss and accuracy differences compared to higher resolutions; it is best suited for macro-trend analysis and large-scale long-term monitoring, where detailed extraction is less critical.
Investigation into pixel extraction principles across diverse satellite resolutions merits intensified scrutiny. We must delve deeper into the plusses and minuses of various resolutions, illuminating their impacts on farmland shelterbelt extraction techniques. Further probing is imperative to hone these methods across differing scales.
3.4. Spatial Distribution of Farmland Shelterbelts
Figure 13 displays the farmland shelterbelt distribution map and a false-color composite comparison. Farmland shelterbelts are primarily situated within farmland, along borders, and beside roads to block wind and sand, reduce soil erosion, and provide protection. Analysis of the farmland shelterbelt extraction results, using RF classification as an example, indicates that the distribution and area of farmland shelterbelts in Youyi County are relatively stable. They are mainly concentrated in the central and eastern parts of the county, showing a contiguous and concentrated spatial distribution. In contrast, the northern and southwestern areas have a more scattered and less dense distribution. The planting of farmland shelterbelts is influenced by factors such as terrain, field distribution, topography, and transportation. Youyi County features a high southern terrain and a lower northern terrain, with the southwestern area being slightly elevated and the northeastern region relatively low-lying, primarily consisting of plains with some low hills and micro hills. The overall topographical variations are not significant, which restricts the extent of field planting. In flat, large cultivated areas near water systems with good transportation access, farmland shelterbelts planting is denser. Conversely, in the southwestern region, characterized by varied and mountainous terrain with steeper slopes, large-scale crop planting is less feasible. This area is rich in forest resources and is more suited for forestry and timber harvesting. Some areas have been converted to agricultural land with terraced planting to prevent soil erosion. The natural conditions in the western mountainous region are more suitable for forestry and specialized agriculture, resulting in a more scattered distribution of farmland shelterbelts in this part of Youyi County.
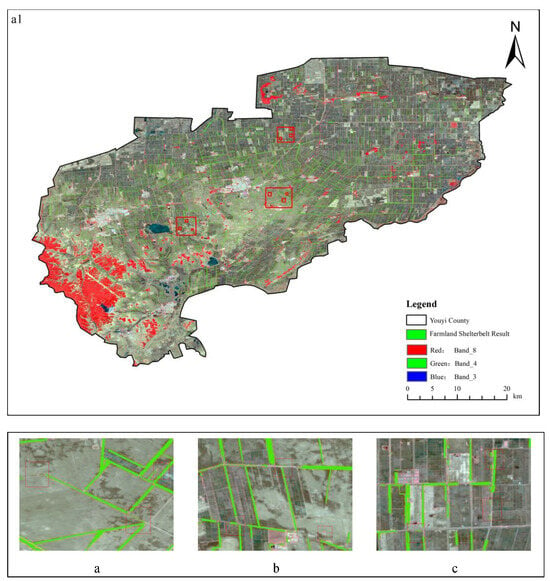
Figure 13.
(a1) Distribution map of farmland shelterbelts and false-color composite imagery (band 8, 4, 3) in Youyi County; among them, the red borders indicate detailed demonstration cases, where (a–c) are detailed diagrams of the extraction results.
4. Discussion
4.1. Comparison of Different Satellite Resolutions
In this study, we assessed and compared the accuracy of extracting farmland shelterbelts from images across various resolutions, from the highest resolution of 0.8 m to the lowest of 30 m. The analysis revealed a decrease in the Kappa coefficient by 6.69% and a drop in OA by 6.8% as resolution decreased. The challenges associated with using high-resolution data from sources such as GF-7 and Planet include their commercial nature, limited accessibility to the broader scientific community, high computational requirements, and large data volumes. Given these constraints, exploring the feasibility of publicly available satellite data with coarser resolutions [47], such as Sentinel-2 (10 m) and Landsat-8 (30 m), is essential for farmland shelterbelt extraction. However, the feasibility of using these coarser resolutions has not been fully established [48]. Coarser spatial resolutions may introduce higher uncertainty in phenological monitoring due to increased species mixing within larger pixel sizes, which reduces the likelihood of capturing pure pixels. Publicly available satellite observations are generally used for large-scale vegetation monitoring [49], but the potential benefits and drawbacks of different resolutions and their impact on object extraction need further exploration. Understanding these factors is crucial for optimizing extraction methods and improving accuracy across various satellite resolutions.
4.2. Extraction Uncertainty Analysis
The GEE cloud platform offers several advantages for data processing, including the ability to handle large datasets and perform complex analyses without local resource constraints. However, it also presents some challenges. Limited user access: the platform restricts the number of user accesses per second, which can lead to timeout errors during image uploads and data exports. Network dependence: A stable network connection is crucial for efficient computation. Poor network conditions can adversely affect performance and reliability. Computational limits: GEE’s free resources have computational limits. Large-area and high-resolution analyses may encounter errors such as computation timeouts and exceeded resource limits. Current solutions to address these issues include clipping the study area to reduce data size, limiting the number of labels to streamline processing, and enhancing evaluation metrics to manage computational demands effectively.
While enhancements such as incorporating the blue band, applying logarithmic transformations, and adding correction values can improve the performance of the ARI—leading to effective vegetation extraction and better suppression of non-vegetative features—several issues and drawbacks persist, as follows. Increased complexity: these improvements complicate the formula, which may result in higher computational loads and longer processing times when integrating feature bands into RF classification tasks. Limited applicability: the improved index may perform well for current green vegetation extraction but could be less effective for different phenological periods or other types of land cover, potentially limiting its broader applicability. Shadow effects: images from blue and green bands are prone to variability in reflectance values due to shadow areas, which can introduce significant variability in shadowed pixels. Lack of correlation analysis: the index has not yet undergone correlation analysis within RF classification tasks, leaving its feasibility for extracting farmland shelterbelt distributions unverified. These factors highlight the need for further investigation to fully assess the index’s performance across various conditions and its integration into different classification tasks.
The RF algorithm, a machine learning method that relies on decision trees as its primary classifiers, employs principles of sampling and feature selection with inherent randomness. This randomness helps mitigate overfitting and enhances tolerance to noise. However, since each decision tree within the algorithm is constructed from randomly selected samples and features, the results can exhibit slight variations. These variations, with numerical errors generally within 1%, can introduce some uncertainty into classification outcomes.
4.3. Limitations and Future Prospects
Remote sensing images encompass key features, including spectral, texture, geometric, and spatial relationship characteristics. Phenomena such as “same object, different spectra” and “different objects, same spectra” can significantly impact classification accuracy. The confusion matrix from the classification results indicates that farmland shelterbelts are often misclassified or omitted, particularly when confused with other vegetation types. This study focused solely on analyzing spectral vegetation index characteristics for farmland shelterbelt extraction and did not account for texture features. Additionally [50], methods like polarization features or backscatter coefficients [51], which provide detailed scattering information for improved differentiation, were not incorporated. However, Liu’s research [10] on agricultural landscape cover classification indicates that in vegetation extraction, texture features do not significantly aid classification. Instead, newly introduced features help improve classification accuracy. This finding may not necessarily apply to the sensitivity of texture feature selection for farmland shelterbelts classification. Therefore, in subsequent classification tasks, comparing texture feature extraction with other feature extraction methods can help validate the feasibility of using texture features for extracting farmland shelterbelts.
While enhancing the index can improve its accuracy and applicability, these modifications also introduce new challenges. To ensure the reliability and stability of the improved index across various application scenarios, it is crucial to employ a combination of methods and technologies and to continually conduct field validations and adjustments. Incorporating multi-band hyperspectral data, considering different phenological periods, and accounting for background interference are essential steps. Although correction factors can help mitigate background interference, the diversity of soil types, vegetation, and atmospheric conditions may still pose significant calibration challenges, making it difficult to completely eliminate background noise. Future research should focus on the extraction of near-infrared bands and the effects of different phenological periods to validate and address the uncertainties associated with the improved index.
The structure of the shelterbelts encompasses several factors, including porosity, wind penetration coefficient, planting density (row spacing), width, tree species selection and configuration, height, length, continuity, retention rate, and cross-sectional shape. The effectiveness of a shelterbelt in providing protection is closely linked to its structural integrity. This integrity is reflected in its completeness, which relates to the continuity of the shelterbelts, as well as the presence of gaps, breakpoints, and any damage. In this study, the evaluation of agricultural shelterbelts focuses on comparing the distribution of extracted pixels and the smoothness of contours and textures with field survey data. However, the current evaluation is not comprehensive. Future research should develop new indicators to assess the completeness of shelterbelts and verify the integrity of extraction results more effectively.
Heilongjiang Province’s Youyi County covers an area of 7691 square kilometers, and the 2127 sample points used are considered sufficient. However, the feasibility of extracting farmland shelterbelts in this county may involve some degree of randomness, such as the impact of temperature on the growth phenology of shelterbelts and the usability of satellite imagery (e.g., spectral confusion of satellite sensors, atmospheric effects, weather conditions). Therefore, this method and new indices need to be applied to extraction tasks in different regions to confirm their transferability. Additionally, the limited data volume compared to large-scale extraction highlights a lack of sufficient data for validating the method’s robustness and general applicability. Future research will address these limitations by incorporating a larger sample size and applying the method to extract farmland shelterbelts in Northeast China to verify its validity.
Multi-source data fusion in the field of remote sensing is a technology that integrates remote sensing data from different sources and of various types, aiming to enhance the monitoring, analysis, and understanding of Earth’s surface features. It can address many challenges that are difficult to manage with a single data source, especially in terms of improving the accuracy, completeness, and applicability of data. Integrating multi-dimensional information can solve issues such as inconsistencies in spatial and temporal resolution, sensor blind spots and limitations, incomplete information, and data gaps or discontinuities. This process enhances the reliability, robustness, and applicability of the data. With the advancement in deep learning and the interdisciplinary integration of various fields, multi-source data fusion will be increasingly considered in future work.
Currently, machine learning and deep learning have been successfully applied to time series analysis, image classification, and object attribute assessment. Machine learning constructs ensemble models by automatically adjusting the weights of each factor and organizing fitting parameters, while deep learning extracts high-level features from raw spectral data through sparse local connections and weight sharing. However, the performance of these methods in remote sensing classification tasks is not yet clearly evident, especially when dealing with multi-source data. Due to different perspectives and the selection of these variables, they have not been fully utilized in current farmland shelterbelt classification research. It remains unclear whether machine learning and deep learning are suitable for identifying farmland shelterbelts. Further validation through extensive experiments and research on different levels is needed.
Agricultural shelterbelts are classified into three primary types: (1) Strip (or network) shelterbelts, which are protective forest belts planted around the perimeter of farmland in a strip-like distribution. They are the most commonly used type of shelterbelts globally. (2) Agroforestry intercropping shelterbelts, in which trees are interplanted within the farmland, creating a complex agroforestry ecosystem without distinct boundaries. (3) Island-type shelterbelts, which consist of tree clusters or small patches of forest planted within the farmland [52]. Current methods are insufficient for effectively extracting the planting structures of these shelterbelt types. Future research will aim to address this by employing deep learning semantic segmentation models to accurately extract and identify strip-shaped agricultural shelterbelts on a large scale. Additionally, to verify the robustness, transferability, and applicability of the improved model, the extraction of farmland shelterbelts across different periods and months will be considered.
5. Conclusions
Timely and accurate identification of shelterbelt structures and their distribution are essential for sustainable shelterbelt management and assessing progress in shelterbelt engineering. This study leveraged the growth cycle characteristics of farmland shelterbelts and crop differences to enhance existing vegetation indexes, leading to the proposal of the RMARI. The feasibility of RMARI was confirmed, enabling large-scale extraction of agricultural shelterbelts in the study area. The key conclusions are as follows: (1) May was identified as the optimal temporal window for extracting agricultural shelterbelts. The RMARI effectively minimizes background noise and improves differentiation between agricultural shelterbelts and other land cover types. (2) Adjustments to the formula structure resolve extraction uncertainties, while the inclusion of the blue band stabilizes the index. (3) The effectiveness of extraction methods is ranked as follows: RF + index feature band extraction > RF extraction > vegetation index extraction > spectral feature extraction. Specifically, the RF + index feature band extraction method achieved a Kappa coefficient of 0.9293 and an OA of 0.9564. (4) Among the four different resolutions tested, GF-7 imagery provided the highest accuracy with the clearest and most precise edge contours. Compared to Landsat 8 (30 m resolution), GF-7 imagery improved the Kappa coefficient by 6.69% and the OA by 6.8%. (5) There is a clear positive correlation between resolution and accuracy, though the relationship is not proportional. Accuracy decreases by approximately 1% on average when moving from 0.8 m to 10 m resolution, and about 5% when moving from 10 m to 30 m resolution.
Author Contributions
Conceptualization, X.Z.; Data curation, J.L. and L.M.; Formal analysis, L.M. and J.L.; Methodology, X.Z., L.M. and J.L.; Project administration, X.Z. and H.L.; Software, Y.W., C.Q. and Z.A.; Writing—original draft, J.L.; Writing—review and editing, L.M. and X.Z. All authors have read and agreed to the published version of the manuscript.
Funding
This research was supported by the National Key R&D Program of China (2021YFD1500100) and the Science and Technology Development Plan Project of Jilin Province, China (20240101043JC).
Data Availability Statement
Data is privacy restrictions, please contact the corresponding author.
Acknowledgments
We thank the National Earth System Science Data Center for providing geographic information data.
Conflicts of Interest
The authors declare no conflicts of interest.
Appendix A. Parameter Table for Sentinel-2 and Landsat 8 Satellites
| Band | Central Wavelength/μm | Resolution/m |
| Coastal aerosol | 0.443 | 60 |
| Blue | 0.490 | 10 |
| Green | 0.560 | 10 |
| Red | 0.665 | 10 |
| Vegetation Red Edge | 0.705 | 20 |
| Vegetation Red Edge | 0.740 | 20 |
| Vegetation Red Edge | 0.783 | 20 |
| NIR | 0.842 | 10 |
| Vegetation Red Edge | 0.865 | 20 |
| Water vapour | 0.945 | 60 |
| SWIR-Cirrus | 1.375 | 60 |
| SWIR | 1.610 | 20 |
| SWIR | 2.190 | 20 |
| Band | Wavelength/μm | Resolution/m |
| COASTAL/AEROSOL | 0.43–0.45 | 30 |
| Blue | 0.45–0.51 | 30 |
| Green | 0.53–0.59 | 30 |
| Red | 0.64–0.67 | 30 |
| NIR | 0.85–0.88 | 30 |
| SWIR-1 | 1.57–1.65 | 30 |
| SWIR-2 | 2.11–2.29 | 30 |
| PAN | 0.5–0.68 | 15 |
| Cirrus | 1.36–1.38 | 30 |
Appendix B. Image Acquisition Date
| Satellite | Date of Image Use | Resolution/m |
| GF-7 | 9 May 2024 | 0.8 |
| Planet | 8 May 2022 | 3 |
| Sentinel-2 | 6 March 2019 | 10 |
| 29 May 2020 | 10 | |
| 19 April 2021 | 10 | |
| 17 May 2021 | 10 | |
| 8 June 2021 | 10 | |
| 23 June 2021 | 10 | |
| 4 April 2022 | 10 | |
| 29 April 2022 | 10 | |
| 9 May 2022 | 10 | |
| 20 March 2023 | 10 | |
| 28 March 2023 | 10 | |
| 27 June 2024 | 10 | |
| Landsat OLI 8 | 12 May 2016 | 30 |
Appendix C. Index Formulas
| Name | Index | Formula | Threshold |
| Normalized Difference Vegetation Index | NDVI | (−1, 1) | |
| Ratio Vegetation Index | RVI | - | |
| Green Leaf Index | GLI | (−1, 1) | |
| Enhanced Vegetation Index | EVI | (−1, 1) | |
| Soil-Adjusted Vegetation Index | SAVI | (−1, 1) | |
| Modified Soil-Adjusted Vegetation Index | MSAVI | (−1, 1) | |
| Chlorophyll Index Green | CIG | - | |
| Green-Red Vegetation Index | GRVI | (−1, 1) | |
| Red-Green-Blue Vegetation Index | RGBVI | (−1, 1) | |
| Vegetation Aging Reflectance Index | PSRT | - | |
| Structure-Insensitive Pigment Index | SIPI | (−1, 1) | |
| Anthocyanin Reflectance Index | ARI | (−1, 1) |
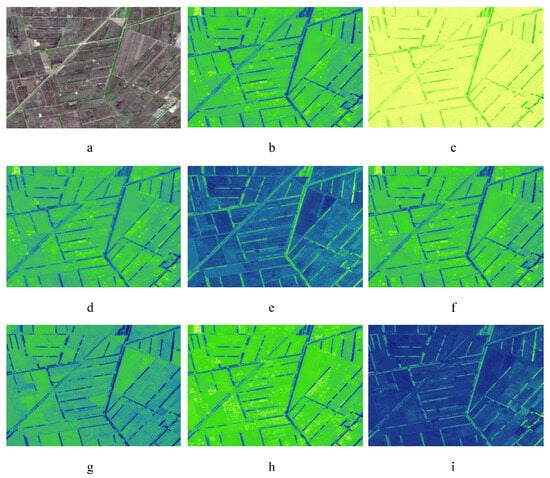
Figure A1.
Extracted images of indexes with distinct color differences. (a) Original image; (b) NDVI; (c) RVI; (d) GNDVI; (e) GRVI; (f) SAVI; (g) RGBVI; (h) SIPI; (i) ARI.
References
- Luo, C.; Yang, Y.; Xin, Z.; Li, J.; Jia, X.; Fan, G.; Zhu, J.; Song, J.; Wang, Z.; Xiao, H. Assessment of the Declining Degree of Farmland Shelterbelts in a Desert Oasis Based on LiDAR and Hyperspectral Imagery. Remote Sens. 2023, 15, 4508. [Google Scholar] [CrossRef]
- George, E.J.; Broberg, D.; Worthington, E.L. Influence of various types of field windbreaks on reducing wind velocities and depositing snow. J. For. 1963, 61, 345–349. [Google Scholar]
- Smith, M.M.; Bentrup, G.; Kellerman, T.; MacFarland, K.; Straight, R.; Ameyaw, L. Windbreaks in the United States: A systematic review of producer-reported benefits, challenges, management activities and drivers of adoption. Agric. Syst. 2021, 187, 103032. [Google Scholar] [CrossRef]
- Deng, R.; Yang, G.; Li, Y.; Xu, Z.; Zhang, X.; Zhang, L.; Li, C. Identification of shelterbelt width from high-resolution remote sensing imagery. Agrofor. Syst. 2022, 96, 1091–1101. [Google Scholar] [CrossRef]
- Wu, J.; Zheng, X.; Gao, T.; Song, L.; Zhang, T. Quantitative analysis of the socioeconomic development impacts of the Three-North Afforestation Program on Horqin Sandy Land. Chin. J. Ecol. 2020, 39, 3567. [Google Scholar]
- Jianjun, C.; Tang, J.; Zhang, S.; Zhang, Y. Remote Sensing Survey of Shelterbelt Based on Landsat 7 ETM+ Image in Daqing City, China. J. Northeast. For. Univ. 2003, 5, 101–102. [Google Scholar]
- Wiseman, G.; Kortb, J.; Walker, D. Quantification of shelterbelt characteristics using high-resolution imagery. Agric. Ecosyst. Environ. 2009, 131, 111–117. [Google Scholar] [CrossRef]
- Aksoy, S.; Akcay, H.G.; Wassenaar, T. Automatic mapping of linear woody vegetation features in agricultural landscapes using very high resolution imagery. IEEE Trans. Geosci. Remote Sens. 2010, 48, 511–522. [Google Scholar] [CrossRef]
- Liknes, G.C.; Perry, C.H.; Meneguzzo, D.M. Assessing tree cover in agricultural landscapes using high-resolution aerial imagery. J. Terr. Obs. 2010, 2, 38–55. [Google Scholar]
- Li, X.; Chen, W.; Cheng, X.; Wang, L. A comparison of machine learning algorithms for mapping of complex surface-mined and agricultural landscapes using ZiYuan-3 stereo satellite imagery. Remote Sens. 2016, 8, 514. [Google Scholar] [CrossRef]
- Zheng, X.; Zhu, J.; Xing, Z. Assessment of the effects of shelterbelts on crop yields at the regional scale in Northeast China. Agric. Syst. 2016, 143, 49–60. [Google Scholar] [CrossRef]
- Fu, K.; Lu, W.X.; Liu, X.Y.; Deng, C.B.; Yu, H.F.; Sun, X. A comprehensive survey and assumption of remote sensing foundation modal. Natl. Remote Sens. Bull. 2024, 28, 1667–1680. [Google Scholar] [CrossRef]
- Qiao, H.; Wu, M.; Shakir, M.; Wang, L.; Kang, J.; Niu, Z. Classification of small-scale eucalyptus plantations based on NDVI time series obtained from multiple high-resolution datasets. Remote Sens. 2016, 8, 117. [Google Scholar] [CrossRef]
- Qi, H.; Wu, Z.; Zhang, L.; Li, J.; Zhou, J.; Jun, Z.; Zhu, B. Monitoring of peanut leaves chlorophyll content based on drone-based multispectral image feature extraction. Comput. Electron. Agric. 2021, 187, 106292. [Google Scholar] [CrossRef]
- Filho, G.; Marildo, G.F.; Kuplich, T.M.; De Quadros, F.L.F. Estimating natural grassland biomass by vegetation indices using Sentinel 2 remote sensing data. Int. J. Remote Sens. 2020, 41, 2861–2876. [Google Scholar] [CrossRef]
- Gao, S.; Yan, K.; Liu, J.; Pu, J.; Zou, D.; Qi, J.; Mu, X.; Yan, G. Assessment of remote-sensed vegetation indices for estimating forest chlorophyll concentration. Ecol. Indic. 2024, 162, 112001. [Google Scholar] [CrossRef]
- Yang, H.; Du, J. Classification of desert steppe species based on unmanned aerial vehicle hyperspectral remote sensing and continuum removal vegetation indices. Optik 2021, 247, 167877. [Google Scholar] [CrossRef]
- Ling, C.; Liu, H.; Ji, P.; Hu, H.; Huang, X.; Hou, R. Estimation of Vegetation Coverage Based on VDVI Index of UAV Visible Image—Using the Shelterbelt Research Area as An Example. For. Eng. 2021, 37, 57–66. [Google Scholar]
- Tao, C.H.; Linjie, G.U.; Xinyan, Z.H.; Shu, T.A.; Yin, G.A. Visible light vegetation extraction of hue saturation and lightness color model. Bull. Surv. Mapp. 2022, 2, 116. [Google Scholar]
- Gao, Y.G.; Lin, Y.H.; Wen, X.L.; Jian, W. Vegetation information recognition in visible band based on UAV images. Trans. Chin. Soc. Agric. Eng. 2020, 36, 178–189. [Google Scholar]
- Zheng, S.; Dao, J.; Zhang, X.; Wang, J. Research on Green Vegetation Extraction Method Based on Visible Light Band. J. Agric. Sci. Technol. 2023, 1, 11. [Google Scholar]
- Li, Y.; Sun, B.; Gao, Z.; Wang, B.; Yan, Z.; Su, W.; Gao, T.; Yue, W. Farmland shelterbelt information extraction based on multispectral image of the ZY1-02E satellite. J. Remote Sens. 2024, 28, 624–634. [Google Scholar]
- Deng, R.; Qunzuo, G.; Menghao, J.; Yuzong, W.; Qiwen, Z.; Zhengran, X. Extraction of farmland shelterbelts from remote sensing imagery based on a belt-oriented method. Front. For. Glob. Chang. 2023, 6, 1247032. [Google Scholar] [CrossRef]
- Liu, Y.; Li, H.; Wu, M.; Wang, A.; Wu, J.; Guan, D. Estimating the legacy effect of post-cutting shelterbelt on crop yield using Google Earth and Sentinel-2 Data. Remote Sens. 2022, 14, 5005. [Google Scholar] [CrossRef]
- Zhu, X.; Xinming, T.; Guo, Z.; Bin, L.; Wenmin, H. Accuracy comparison and assessment of DSM derived from GFDM satellite and GF-7 satellite imagery. Remote Sens. 2021, 13, 4791. [Google Scholar] [CrossRef]
- Tang, X.; Xie, J.; Liu, R.; Huang, G.; Zhao, C.; Zhen, Y.; Tang, H.; Dou, X. Overview of the GF-7 laser altimeter system mission. Earth Space Sci. 2020, 7, e2019EA000777. [Google Scholar] [CrossRef]
- Wulder, M.A.; Loveland, T.R.; Roy, D.P.; Crawford, C.J.; Masek, J.G.; Woodcock, C.E.; Allen, R.G.; Anderson, M.C.; Belward, A.S.; Cohen, W.B.; et al. Current status of Landsat program, science, and applications. Remote Sens. Environ. 2019, 225, 127–147. [Google Scholar] [CrossRef]
- Pettorelli, N.; Vik, J.O.; Mysterud, A.; Gaillard, J.-M.; Tucker, C.J.; Stenseth, N.C. Using the satellite-derived NDVI to assess ecological responses to environmental change. Trends Ecol. Evol. 2005, 20, 503–510. [Google Scholar] [CrossRef]
- Xiong, H.; Zhou, X.; Wang, X.; Cui, Y. Mapping the spatial distribution of tea plantations with 10 m resolution in Fujian Province using Google Earth Engine. J. Geo-Inf. Sci. 2021, 23, 1325–1337. [Google Scholar]
- Wang, J.; Zhou, Q.; Shang, J.; Liu, C.; Zhuang, T.; Ding, J.; Xian, Y.; Zhao, L.; Wang, W.; Zhou, G.; et al. UAV- and machine learning-based retrieval of wheat SPAD values at the overwintering stage for variety screening. Remote Sens. 2021, 13, 5166. [Google Scholar] [CrossRef]
- Myneni, R.B.; Hall, F.G.; Sellers, P.J.; Marshak, A. The interpretation of spectral vegetation indexes. IEEE Trans. Geosci. Remote Sens. 1995, 33, 481–486. [Google Scholar] [CrossRef]
- Rouse, J.W., Jr.; Haas, R.H.; Schell, J.A.; Deering, D.W. Monitoring vegetation systems in the Great Plains with ERTS. NASA Spec. Publ. 1974, 351, 309. [Google Scholar]
- Zeng, Y.; Hao, D.; Huete, A.; Dechant, B.; Berry, J.; Chen, J.M.; Joiner, J.; Frankenberg, C.; Bond-Lamberty, B.; Ryu, Y.; et al. Optical vegetation indices for monitoring terrestrial ecosystems globally. Nat. Rev. Earth Environ. 2022, 3, 477–493. [Google Scholar] [CrossRef]
- Ao, D.; Jiahui, Y.; Weiting, D.; An, S. Review of 54 Vegetation indices. Anhui Agric. Sci. 2023, 51, 13–21, 28. [Google Scholar]
- Xue, J.; Su, B. Significant remote sensing vegetation indices: A review of developments and applications. J. Sens. 2017, 1, 1353691. [Google Scholar] [CrossRef]
- Viña, A.; Gitelson, A.A. Sensitivity to foliar anthocyanin content of vegetation indices using green reflectance. IEEE Geosci. Remote Sens. Lett. 2010, 8, 464–468. [Google Scholar] [CrossRef]
- Gitelson, A.A.; Merzlyak, M.N.; Chivkunova, O.B. Optical properties and nondestructive estimation of anthocyanin content in plant leaves. Photochem. Photobiol. 2001, 74, 38–45. [Google Scholar] [CrossRef]
- Gitelson, A.A.; Keydan, G.P.; Merzlyak, M.N. Three-band model for noninvasive estimation of chlorophyll, carotenoids, and anthocyanin contents in higher plant leaves. Geophys. Res. Lett. 2006, 33, 11. [Google Scholar] [CrossRef]
- Bayle, A.; Carlson, B.Z.; Thierion, V.; Isenmann, M.; Choler, P. Improved mapping of mountain shrublands using the sentinel-2 red-edge band. Remote Sens. 2019, 11, 2807. [Google Scholar] [CrossRef]
- Kim, C.; van Iersel, M.W. Image-based phenotyping to estimate anthocyanin concentrations in lettuce. Front. Plant Sci. 2023, 14, 1155722. [Google Scholar] [CrossRef]
- Breiman, L. Bagging predictors. Mach. Learn. 1996, 24, 123–140. [Google Scholar] [CrossRef]
- Janga, B.; Asamani, G.P.; Sun, Z.; Cristea, N. A review of practical ai for remote sensing in earth sciences. Remote Sens. 2023, 15, 4112. [Google Scholar] [CrossRef]
- Daughtry Craig, S.T.; Walthall, C.L.; Kim, M.S.; De Colstoun, E.B.; McMurtrey, J.E. Estimating corn leaf chlorophyll concentration from leaf and canopy reflectance. Remote Sens. Environ. 2000, 74, 229–239. [Google Scholar] [CrossRef]
- Tomoaki, M.; Huete, A.R.; Yoshioka, H. Evaluation of sensor calibration uncertainties on vegetation indices for MODIS. IEEE Trans. Geosci. Remote Sens. 2000, 38, 1399–1409. [Google Scholar]
- Markus, I.; Vuolo, F.; Atzberger, C. First experience with Sentinel-2 data for crop and tree species classifications in central Europe. Remote Sens. 2016, 8, 166. [Google Scholar] [CrossRef]
- Gao, L.; Zhu, H.; Hong, D.; Zhang, B.; Chanussot, J. CyCU-Net: Cycle-consistency unmixing network by learning cascaded autoencoders. IEEE Trans. Geosci. Remote Sens. 2021, 60, 1–14. [Google Scholar] [CrossRef]
- Minkyu, M.; Richardson, A.D.; Friedl, M.A. Multiscale assessment of land surface phenology from harmonized Landsat 8 and Sentinel-2, PlanetScope, and PhenoCam imagery. Remote Sens. Environ. 2021, 266, 112716. [Google Scholar]
- Peng, D.; Wang, Y.; Xian, G.; Huete, A.R.; Huang, W.; Shen, M.; Wang, F.; Yu, L.; Liu, L.; Xie, Q.; et al. Investigation of land surface phenology detections in shrublands using multiple scale satellite data. Remote Sens. Environ. 2021, 252, 112133. [Google Scholar] [CrossRef]
- Bolton, D.K.; Gray, J.M.; Melaas, E.K.; Moon, M.; Eklundh, L.; Friedl, M.A. Continental-scale land surface phenology from harmonized Landsat 8 and Sentinel-2 imagery. Remote Sens. Environ. 2020, 240, 111685. [Google Scholar] [CrossRef]
- Meng, H.; Li, C.; Zheng, X.; Gong, Y.; Liu, Y.; Pan, Y. Research on Extraction of Camellia Oleifera by Integrating Spectral, Texture and Time Sequence Remote Sensing Information. Spectrosc. Spectr. Anal. 2023, 43, 1589–1597. [Google Scholar]
- Han, W.; Zhou, C.; Zhu, J.; Fu, H.; Xie, Q.; Hu, J.; Wang, C.; Gao, H. Research Progress and Challenges in the Polarimetric SAR Decompositon. J. Wuhan Univ. Inf. Sci. Ed. 2024, 1, 35. [Google Scholar]
- Zhu, X.; Liu, W.; Chen, J.; Bruijnzeel, L.A. Reductions in water, soil and nutrient losses and pesticide pollution in agroforestry practices: A review of evidence and processes. Plant Soil 2020, 453, 45–86. [Google Scholar] [CrossRef]
Disclaimer/Publisher’s Note: The statements, opinions and data contained in all publications are solely those of the individual author(s) and contributor(s) and not of MDPI and/or the editor(s). MDPI and/or the editor(s) disclaim responsibility for any injury to people or property resulting from any ideas, methods, instructions or products referred to in the content. |
© 2024 by the authors. Licensee MDPI, Basel, Switzerland. This article is an open access article distributed under the terms and conditions of the Creative Commons Attribution (CC BY) license (https://creativecommons.org/licenses/by/4.0/).