Article

Comparison and Optimization of Light Use Efficiency-Based Gross Primary Productivity Models in an Agroforestry Orchard

by
Ningbo Cui
1,†,
Ziling He
1,†,
Mingjun Wang
1,
Wenjiang Zhang
1,
Lu Zhao
1,
Daozhi Gong
2,
Jun Li
1 and
Shouzheng Jiang
1,*
1
State Key Laboratory of Hydraulics and Mountain River Engineering & College of Water Resource and Hydropower, Sichuan University, Chengdu 610065, China
2
State Engineering Laboratory of Efficient Water Use of Crops and Disaster Loss Mitigation, Institute of Environment and Sustainable Development in Agriculture, Chinese Academy of Agriculture Science, Beijing 100081, China
*
Author to whom correspondence should be addressed.
These authors contributed equally to this work.
Remote Sens. 2024, 16(19), 3679; https://doi.org/10.3390/rs16193679
Submission received: 14 August 2024 / Revised: 28 September 2024 / Accepted: 29 September 2024 / Published: 2 October 2024

Abstract

:
The light-use efficiency-based gross primary productivity (LUE-GPP) model is widely utilized for simulating terrestrial ecosystem carbon exchanges owing to its perceived simplicity and reliability. Variations in cloud cover and aerosol concentrations can affect ecosystem LUE, thereby influencing the performance of the LUE-GPP model, particularly in humid regions. In this study, the performance of six big-leaf LUE-GPP models and one two-leaf LUE-GPP model were evaluated in a humid agroforestry ecosystem from 2018–2020. All big-leaf LUE-GPP models yielded GPP values consistent with that derived from the eddy covariance system (GPPEC), with R2 ranging from 0.66–0.73 and RMSE ranging from 1.81–3.04 g C m−2 d−1. Differences in model performance were attributed to the differences in the quantification of temperature (Ts) and moisture constraints (Ws) and their combination forms in the models. The Ts and Ws algorithms in the eddy covariance-light-use efficiency (EF-LUE) model well characterized the environmental constraints on LUE. Simulation accuracy under the common limitation of Ts and Ws (Ts × Ws) was higher than the maximum limitation of Ts or Ws (Min (Ts, Ws)), and the combination of the Ts algorithm in the Carnegie–Ames–Stanford Approach (CASA) and the Ws algorithm in the EF-LUE model was optimized in combination forms, thereby constraining LUE for GPP estimates (GPPBLO, R2 = 0.76). Various big-leaf LUE-GPP models overestimated or underestimated GPP on sunny or cloudy days, respectively, while the two-leaf LUE-GPP model, which considered the transmission of diffuse radiation and the difference in photosynthetic capacity of canopy leaves, performed well (R2 = 0.72, p < 0.01). Nevertheless, the underestimation/overestimation for shaded/sunlit leaves remained under different weather conditions. Then, the clearness index (Kt) was introduced to calculate the dynamic LUE in the big-leaf and two-leaf LUE-GPP models in the form of exponential or power functions, resulting in consistent performance even in different weather conditions and an overall higher simulation accuracy. This study confirmed the potential applicability of different LUE-GPP models and emphasized the importance of dynamic LUE on model performance.

1. Introduction

Food and its additional products produced by plants through photosynthesis have important values for humans and livestock [1]. Gross primary productivity (GPP) is the most considerable component of CO2 flux in global ecosystem carbon exchanges and is the most important carbon flux component of the agroecosystem carbon cycle, and it sustains the food chain and plays a vital role in ecosystem function [2]. GPP estimation of agroforestry systems is key for evaluating carbon sequestration capacity and is, thus, crucial for crop production prediction and ecosystem carbon management [3,4]. The eddy covariance (EC) flux system can measure the near-surface net ecosystem CO2 exchange continuously at high frequency, estimating GPP by partitioning NEE and ecosystem respiration (Re) [5,6]. Some GPP data have been shared in global or regional flux networks. However, the EC flux system is still limited in space and time owing to its high price and the difficulty to obtain access from some private managers.
The light-use efficiency-based GPP (LUE-GPP) model defines GPP as the product of photosynthetically-active radiation absorbed by vegetation canopy and photosynthetic utilization efficiency. In combination with available meteorological or biological variables or satellite remote sensing data, the LUE-GPP model is widely used for calculating regional or global GPP [7,8]. Some models regard the photosynthetic parameters of the underlying surface as a whole; thus, they are known as big-leaf LUE-GPP (BL) models [9,10] and include the EC-light use efficiency (EF-LUE) model [11], moderate resolution imaging spectroradiometer (MODIS) GPP algorithm [12], vegetation photosynthesis model (VPM) [13,14], and Carnegie–Ames–Stanford Approach (CASA) model [15]. However, the evaluation of the ecosystem GPP still has great uncertainty [3,4,16,17]. Chen et al. [15] showed that the LUE values calculated by the CASA model were significantly different across 12 farmland EC sites, and the larger difference in photosynthetic capacity between C3 and C4 species highlights the necessity of model parameterizations (i.e., maximal light use efficiency) [17]. In addition, the seasonal variation of LUE enhances the difficulty in cropland productivity estimates [3,4]. Wang et al. [18] reported that, based on data from China FLUXNET sites (China Flux Research Observation Network), the LUE-GPP model, which considers the influence of diffuse radiation on LUE, performed better than the MODIS GPP model in different ecosystems. Considering the transmission of scattered light in the canopy and the difference between the LUEmax (LUE without any environmental constraints) of shaded and sunlit leaves, He et al. [9] proposed a two-leaf LUE-GPP model to separately calculate the GPP of shaded and sunlit leaves and reported more reliable simulation results with those of the EC measurements. Xu et al. [19] assessed the global performance of ten LUE-GPP models and considered the effect of diffuse radiation in FLUXNET sites. They revealed that the LUE models incorporating diffuse radiation effects accounted for 46.7–63.6% of the daily variability in GPP, as measured by the EC sites. Moreover, the performance of the LUE-GPP models varied across different ecosystems [19], highlighting the importance of evaluating and analyzing model performance to enhance the application of LUE-GPP models in agroforestry ecosystems.
The introduction of temperature (Ts) and moisture constraints (Ws) and their combination are the main sources causing the different model performances [20]. For example, the MODIS model used vapor pressure deficit (VPD) to quantify the limitation of atmospheric drought on LUEmax [21], whereas the VPM used the land surface water index (LSWI) to characterize the underlying moisture limitation on LUEmax [13]. To quantify the effect of temperature on LUEmax, MODIS used a linear function, whereas the EF-LUE model used a quadratic function [22]. In terms of model structure, the EF-LUE model assumes that LUEmax is mainly affected by the maximum constraints of moisture or temperature, while the MODIS model assumes that LUEmax is jointly affected by both moisture and temperature. Analysis of the model structure and the main environmental constraints is the premise for the practical application of the model and the basis for improving future models [20].
Photosynthetic active radiation (PAR) is an important variable in the LUE-GPP model. The presence of clouds and aerosols in the atmosphere reduces PAR reaching the canopy [23]. As the cloud thickness and aerosol concentration increase, direct PAR decreases, whereas diffuse PAR at the canopy increases [24,25]. Changes in ecosystem radiation components greatly affect the ecosystem carbon flux and, consequently, LUE [24,26]. Numerous studies have reported that LUE increases with an increase in cloud thickness [27,28]. Affected by the Southeast and Southwest monsoons, moist air streams originating from the South China Sea and Bay of Bengal converge here owing to the obstruction of the mountains, resulting in frequent cloudy and rainy weather conditions in Chengdu Plain, which is the most important agricultural region in Southwest China [29]. However, the response of agroecosystem LUE to different weather conditions and its effect on the performance of LUE-GPP models have not been explored. Thus, quantifying the performance of models under different weather conditions could provide valuable information on agroecosystem GPP model evaluation in humid regions. This study aimed to (1) evaluate the applicability of various big-leaf and two-leaf LUE-GPP models, (2) determine the effect of a single environmental constraint (Ts or Ws) and their combination on estimating ecosystem GPP, and (3) assess model performance under different weather conditions and improve model accuracy by incorporating weather variables into the big-leaf and two-leaf LUE-GPP algorithms.

2. Materials and Methods

2.1. Study Site

The experiment was conducted in an agroforestry orchard ecosystem located in Pujiang County, Chengdu City, Sichuan Province, China (30°19′N, 103°25′E, altitude of approximately 537 m) (Figure S1). The study area is characterized by a subtropical monsoon humid climate, with an annual average temperature of 16.3 °C and an annual average precipitation of 1280 mm, more than 70% of which is concentrated in the period of June to September. The annual sunshine hour duration is 1122 h and the relative humidity is 84%. The study site is a shallow hilly area, the elevation difference in the study area is less than 10 m, and the soil type is mainly yellow loam. The soil bulk density at 10–100 cm deep is 1.27–1.35 g cm−3, and the field and saturated capacities are 38.18% and 44.53%, respectively.
The orchard field primarily comprised kiwifruit trees (Actinidia chinensis deliciosa, cv. Jin Yan), with minimal representation of other landscape species (<5%). The kiwifruit trees were planted in 2006, with a row spacing of 5.0 m and a plant spacing of 4.5 m, oriented in north-to-south rows. The diameter of the trunk measured at 0.6 m above the ground surface ranges from 8–12 cm. A horizontal trellis system, consisting of six 1.8-m high wires, was utilized to support the kiwifruit tree branches, creating a horizontal canopy with height ranging from 1.8–2.2 m. The growth period of kiwifruit extends from mid-March to the end of November, during which the leaves are shed and tree branches are pruned. Sprinkler irrigation was used for watering purposes. Irrigation was typically administered multiple times at the onset of the growing season and intermittently during the summer to mitigate potential damage from heat by improving the microclimate of the orchard.

2.2. Measurement of Environmental Variables

In this study, a comprehensive set of meteorological data was collected from an automated meteorological station. The variables measured included photosynthetic activity radiation (PAR, expressed in W m–2), net radiation (Rn, W m–2), relative humidity (RH, %), VPD (kPa) calculated from measured air temperature (Ta, °C) and RH, wind speed (u, m s–1), rainfall (Rf, mm), soil heat fluxes (G, W m–2), soil volumetric water content (SWC, %), and soil surface temperature (St, °C). Radiation sensors were positioned at 3.5 m above ground level (AGL). SWC sensors were deployed in two groups, each containing four sensors buried at 20, 40, 60, and 80 cm deep below the surface. Soil surface temperature sensors were positioned at 5, 10, 15, and 20 cm below the surface. Data collection was performed at 5-s intervals, and data were averaged or aggregated (in the case of precipitation) at 30-min intervals for analysis.

2.3. Flux Data Measurement, Processes, and Gap Filling

A close-path EC system (CPEC200, Campbell Scientific Inc., Logan, UT, USA) was used to monitor water and carbon fluxes between the land surface and atmosphere. It was positioned on a tower placed 8 m AGL within a kiwifruit orchard spanning approximately 133 hectares (30.3265N, 103.4252E, altitude 537 m). The orchard had adequate fetch and met the requirement for EC measurement. The EC system consisted primarily of a closed-path CO2/H2O gas analyzer (EC155, Campbell Scientific) to measure CO2 and water vapor concentrations and a three-dimensional sonic anemometer (CSAT3A, Campbell Scientific) to measure wind velocity. The original 10-Hz flux data underwent standard processing, such as 2-D coordinate rotation, time-lag compensation, and low- and high-frequency corrections [30], and were aggregated using a data collector (CR6 Campbell Scientific) and averaged at 30-min intervals. Datapoints with latent flux (LE) and sensible heat flux (H) below −200 W m−2, H exceeding 500 W m−2, and LE exceeding 800 W m−2 were excluded from half-hour data. Nighttime friction wind speeds below 0.15 m s−1 were disregarded to ensure that flux data were collected under high-turbulence conditions [6]. Subsequently, 11.5% of daytime data points and 38.7% of nighttime data points were removed.
In instances where LE data were missing for less than 2 h, linear interpolation was used to fill the gaps, while the daily average variation (DAV) interpolation method was used for intervals exceeding 2 h [30,31]. Net ecosystem exchange (NEE) data gaps of shorter durations (≤2 h) were addressed using linear interpolation. For longer data gaps (>2 h), missing daytime NEE data were filled using an empirical equation calibrated with high-quality data [32]. Missing nighttime NEE data and daytime ecosystem respiration (Re) were estimated using a regression equation correlating nighttime NEE with soil temperature at a depth of 10 cm [33]. Ecosystem GPP was derived as follows: GPPEC = ReNEE.

2.4. Calculation of Leaf Area Index and LSWI

The LAI-2000 canopy analyzer (LAI-2000, Li-COR, Inc., Lincoln, NE, USA) was used to measure the kiwifruit tree canopy leaf area index (LAI). We measured a group of 50-cm intervals along the branch extension direction at 50 cm below the canopy. A total of 10 groups per tree and 8 trees were selected for measurement once a week, and the duration extended to 2 weeks during the stable period of vegetation canopy. The canopy leaf area indexes at different time intervals were interpolated into daily values by spline interpolation. The 8-day MODIS Surface Reflectance product (MODIS 09A1) at 0.5-km spatial resolution was downloaded and used to calculate LSWI (LSWI = (ρNIR − ρSWIR)/(ρNIR + ρSWIR)). The missing MODIS data were filled using linear interpolation based on nearby available data [34,35,36]. The 8-day LSWI was interpolated to a daily scale using a spline function [34].

2.5. Big-Leaf LUE-GPP Models

Six big-leaf LUE-GPP models, including EF-LUE, MODIS, VPM, MVPM, TEC, and CASA models, were selected, and their performances were compared. Among them, EF-LUE is more dedicated to environmental constraints in a specific ecosystem GPP estimation, MODIS, VPM and MVPM are more dedicated to regional GPP estimation, and TEC and CASA are widely used for broader ecosystem carbon cycling studies. This section introduces each model, and their corresponding model structures and parameters are summarized in Table 1.

2.5.1. EC-LUE Model

The eddy covariance-light-use efficiency (EF-LUE) model was first proposed by Yuan et al. [37], who developed a LUE daily GPP model from EC measurements. Its reliability has been verified in many ecosystems [16]. The GPP in EF-LUE is estimated as follows:
G P P = P A R × f P A R × L U E max × M i n ( T s , W s )
where LUEmax is the maximum LUE (g C m−2 MJ−1) without any environmental stress, which is derived from leaf-scale measurements using a Li-6400 (Li-COR, USA) photosynthesis system. Specifically, an intensive leaf-scale field measurement was conducted in the peak growing season. The quantified maximum apparent quantum yield was close to 0.066 μmol CO2/μmol PPFD and very close to the 1.67 g C MJ–1 based on an approximate conversion of 2.05–2.17 between MJ (106 J) and mol PPFD [38]. The fraction of PAR absorbed by the canopy, known as fPAR, is generally described by the Beers–Lambert exponential decay equation (fPAR = 1 − e−kLAI). Ts and Ws represent the temperature and moisture constraints on LUEmax, respectively, and Min (Ts, Ws) indicates that LUEmax is only affected by the maximum constraints of Ts and Ws.
T s = ( T a T min ) × ( T a T max ) ( T a T min ) × ( T a T max ) + ( T a T opt ) 2 T min T a T max 0 T a < T min   o r   T a > T max
W s = L E R n
where Tmin, Tmax, and Topt denote the minimum, maximum, and optimum air temperatures (°C), respectively, conducive to the photosynthetic activity of kiwifruit leaves; LE denotes the latent heat (W m−2) measured by EC; and Rn denotes the net radiation (W m−2). In this study, Tmin and Tmax were set to 0 and 40 °C, respectively, and Topt was determined by least-square nonlinear fitting [37].

2.5.2. MODIS Model

The MODIS model assumes that LUEmax is jointly affected by Ts and Ws rather than completely restricted by only one of them. Moreover, it uses VPD to quantify the moisture constraints on LUEmax since APAR cannot be used for estimating GPP because leaf stomata are closed when VPD is high [21]. The MODIS model is expressed as below:
G P P = P A R × f P A R × L U E max × T s × W s
T s = 0 T min < 0 T a T min T M A X min T min T min T a T M A X min 1 T a > T M A X min
W s = 0 V P D > V P D max V P D max V P D V P D max V P D min V P D min V P D V P D max 1 V P D < V P D min
where VPDmin and VPDmax indicate the lower and upper thresholds of VPD (kPa) affecting leaf photosynthesis, which are set to 0.5 kPa and 4 kPa, respectively, and TMAXmin indicates the temperature when LUE is at maximum and is assumed to be consistent with Topt in this study.

2.5.3. VPM

The VPM assumes that LUE varies with phenological changes (Ps) and introduces Ps to incorporate this effect [13]. The VPM can be expressed as follows:
G P P = P A R × f P A R × L U E max × T s × W s × P s
P s = 1 + L S W I 2 ( w h e n   l e a v e s   e x p a n d e d   r a p i d l y ) 1 ( w h e n   l e a v e s   s t o p   e x p a n d i n g )
W s = 1 + L S W I 1 + L S W I max
where LSWImax denotes the maximum LSWI observed during the growing seasons. Ts was calculated similarly to the EF-LUE model.

2.5.4. MVPM

The MVPM algorithm includes the influence of VPD on LUEmax based on the VPM to consider the constraints from soil and atmosphere [11]. The MVPM is calculated as:
G P P = P A R × f P A R × L U E max × M i n ( T s , W s 1 × W s 2 )
W s 2 = V P D max V P D V P D max V P D > 0.5   kpa 1 V P D 0.5   kpa
where Ws1 and Ws2 represent the constraints of soil and atmospheric drought on plant photosynthesis, respectively. Ws1 was calculated similarly to the VPM, and Ts was calculated similarly to the EF-LUE model.

2.5.5. Terrestrial Ecosystem Carbon Flux (TEC) Model

The TEC model redefines Ws as the ratio of actual evapotranspiration (ETa) to potential evapotranspiration (ETpot) [39] and is expressed as below:
G P P = P A R × f P A R × L U E max × T s × W s
W s = E T a E T pot
E T a = L E λ
λ E T pot = Δ ( R n G ) Δ + γ
where λ is the latent heat of vaporization (MJ kg−1), Δ is the rate of change of saturation vapor pressure with temperature (kPa K–1), and γ denotes the psychrometric constant (kPa K–1). Ts was estimated similarly to the EC-LUE model.

2.5.6. CASA Model

The CASA model is expressed as follows [14]:
G P P = P A R × f P A R × L U E max × T s 1 × T s 2 × W s
T s 1 = 1.1814 1 + e x p 0.3 ( T opt + 10 + T a ) 1 + e x p 0.2 ( T opt 10 T a )
T s 2 = 0.8 + 0.02 T opt 0.0005 T opt 2
W s = 0.5 + E T a E T pot
where Ts1 denotes the effect of extremely high and low temperatures on LUEmax, and Ts2 denotes the effect of temperature near optimal on LUEmax. ETa and ETpot were calculated similarly to the TEC model. The calculation of ETa in the original CASA model requires multi-parameter calibration, which is complex and has low accuracy at the daily scale. Therefore, in this study, the measured evapotranspiration was used to replace ETa in the original model.

2.6. Two-Leaf LUE-GPP Model

He et al. [9] considered the transmission of scattered light in the canopy and the difference in LUEmax (LUE without environmental constraints) between shaded and sunlit leaves and proposed a two-leaf model to calculate separately the GPP values of shaded and sunlit leaves. Zhou et al. [40] found that the two-leaf LUE-GPP model performed better than the MODIS model based on data from 98 EC sites globally. The expression of the two-leaf LUE-GPP model is as follows:
G P P = ( L U E su max A P A R su + L U E sh max A P A R sh ) × T s × W s
A P A R su = ( 1 α ) P A R dir × cos ( β ) cos ( θ ) + P A R dif P A R dif , u L A I + C × L A I su
A P A R sh = ( 1 α ) ( P A R dif P A R dif , u L A I + C ) × L A I sh
where LUEsu-max and LUEsh-max represent the LUEmax values of sunlit and shaded leaves, respectively; α represents the leaf albedo, set to 0.23 for crop [41]; APARsu and APARsh represent the absorbed PAR values of sunlit and shaded leaves, respectively; LAIsu and LAIsh represent the estimated canopy LAI values of sunlit and shaded, respectively; (PARdifPARdif,u)/LAI represents the diffuse PAR on the unit leaf area of the canopy [42]; C represents the parameter for quantifying PAR scattering inside the canopy [43]; θ represents the solar zenith angle; β represents the mean leaf-sun angle set to 60° for a canopy with spherical leaf-angle distribution [9]; PARdif and PARdir represent the diffuse PAR and direct PAR, respectively; and PARdif,u represents the PARdif below the canopy. Ts and Ws were calculated according to the MODIS model.
The LAIsu and LAIsh values were calculated as follows [9,42,43]:
L A I su = 2 × c o s ( θ ) × ( 1 e x p ( 0.5 Ω L A I c o s θ ) )
L A I sh = L A I L A I su
P A R dif = P A R × D f
D f = 0.7527 + 3.8453 K t 16.31 K t 2 + 18.962 K t 3 7.0802 K t 4
C = 0.07 Ω P A R dir ( 1.1 0.1 L A I ) e x p ( cos θ )
where Df is the proportion of diffuse PAR to total PAR determined by Kt; Kt is the clearness index used to quantify cloud thickness [44]; and Ω is the aggregation index set to 0.75 based on Tang et al. [45].
K t = R g R a
R a = 24 × 60 π G sc d r ( ω s s i n φ s i n δ + c o s φ c o s δ c o s w s )
d r = 1 + 0.033 c o s ( 2 π J 365 )
δ = 0.409 s i n ( 2 π J 365 1.39 )
w s = a r c c o s ( t a n φ t a n δ )
where Ra is the solar radiation at the top of the atmosphere (MJ m−2 d−1), Gsc is the solar constant (0.082 MJ m−2 min−1), dr is the inverse relative distance between the sun and earth, ws is sunset angle (rad), φ is the latitude (rad), δ is the solar declination (rad), and J is the number of days.
P A R dif , u = P A R dif × e x p ( 0.5 Ω L A I cos θ ¯ )
where θ ¯ is a representative zenith angle for the transmission of diffuse radiation and is slightly related to LAI [42]. It is calculated as below:
c o s θ ¯ = 0.537 + 0.025 L A I

2.7. Analysis of the Model Structure

The six big-leaf LUE-GPP models described in this paper consider the temperature and moisture constraints on GPP estimation. Two comparisons were additionally conducted to explore the effect of a single environmental limitation factor and their combination on estimating GPP. The model comparison schemes are described in Table 2.
Additionally, two simple functions (power and exponential) were used to construct the dynamic LUE model by introducing Kt to improve the simulation accuracy under different weather conditions. For the optimized big-leaf LUE-GPP (OBL) model, the constructed Kt-based dynamic LUE is expressed as below:
Power function-based optimized model:
G P P O B L - P = P A R × f P A R × A 1 K t B 1 × T s × W s
Exponential function-based optimized model:
G P P O B L - E = P A R × f P A R × A 1 exp ( B 1 K t ) × T s × W s
where A1 represents the dynamic LUEmax based on Kt and B1 represents the adjustment parameter related to Kt.
For the two-leaf LUE-GPP model (TL), the constructed Kt-based dynamic LUE is expressed as follows:
Power function based optimized model:
G P P T L - P = ( A 1 K t B 1 A P A R s h + A 2 K t B 2 A P A R s u ) × T s × W s
Exponential function based optimized model:
G P P T L - E = ( A 1 e x p ( B 1 K t ) A P A R s h + A 2 e x p ( B 2 K t ) A P A R s u ) × T s × W s
where A1 and A2 represent the Kt-based dynamic LUEsu-max and LUEsh-max values, respectively, set at a range of 0 and 4, and B1 and B2 represent the Kt-related adjustment parameters for shaded and sunlit leaves, respectively, set at a range of −3 to 3. The parameters A1, A2, B1, and B2 in the optimized LUE-GPP models were determined by least-square nonlinear fitting (Table 3).

2.8. Evaluation of Model Performances

The following evaluation parameters were used to assess model accuracy: determination coefficients (R2), mean absolute error (MAE), root-mean-squared errors (RMSE), corrected efficiency index (η), and corrected summation index (d1). R2, η, and d1 values close to 1 and MAE and RMSE values close to 0 represent better simulation performance.
In addition, global performance indicator (GPI) was used to provide a comprehensive assessment of model performance. First, different indexes were normalized as below:
x scaled = x 0 x min x max x min
where xscaled, x0, xmin, and xmax denote the scaled, actual, minimum, and maximum values of an evaluation parameter, respectively.
Then, GPI is summed as follows:
G P I i = j = 1 5 a i j ( g i j y i j )
where aij is a constant equivalent to 1 for normalized RMSE, η, and MAE and to −1 for normalized R2 and d1; gij is the median of the normalized evaluation parameter j; and yij is the normalized evaluation parameter j (xscaled-j) corresponding to the LUE-GPP model I, calculated using Equation (35).
The comprehensive performance and ranking of the different LUE-GPP models were estimated based on GPI values, and a higher GPI value indicated better performance.

3. Results

3.1. Performances of Various LUE-GPP Models

3.1.1. Six Big-Leaf LUE-GPP Models

The seasonal changes and the correlation between daily GPPEC and GPP estimates by the six big-leaf LUE-GPP models in the orchard ecosystem from 2018–2020 are shown in Figure 1. The models well simulated the seasonal variations in GPPEC during the growing seasons, with R2 values ranging from 0.666–0.729. However, all GPP estimations were overestimated, as shown by a linear slope of <1 between simulated GPP and GPPEC. This phenomenon was notable during the mid-growing seasons.
In the 2018 growing season, the six big-leaf LUE-GPP models exhibited various model performances, with R2 values ranging from 0.711–0.790, MAE from 1.377–2.441 g C m−2 d−1, RMSE from 1.808–3.308 g C m−2 d−1, η from 0.226–0.563, d1 from 0.607–0.776, and GPI from −2.048 to 0.875 (Table 4). Overall, the EF-LUE model outperformed the other five models, reaching a GPI of up to 0.875 (1) (bracketed figures represent rankings).
The model performances varied across the growing seasons and between years (Table 4 and Table 5). For example, GPI calculated by the EF-LUE model was 1.37 (2) in 2019 and 1.26 (1) in 2020. The daily average GPP of the EF-LUE model was 6.27, 5.62, and 6.09 g C m–2 d–1, respectively, which are similar to GPPEC (6.77, 5.88, and 6.00 g C m–2 d–1) during the 2018–2020 growing seasons (Table 5). Overall, the EF-LUE model was superior to the other five big-leaf models in terms of accuracy and stability.

3.1.2. Two-Leaf LUE-GPP Models

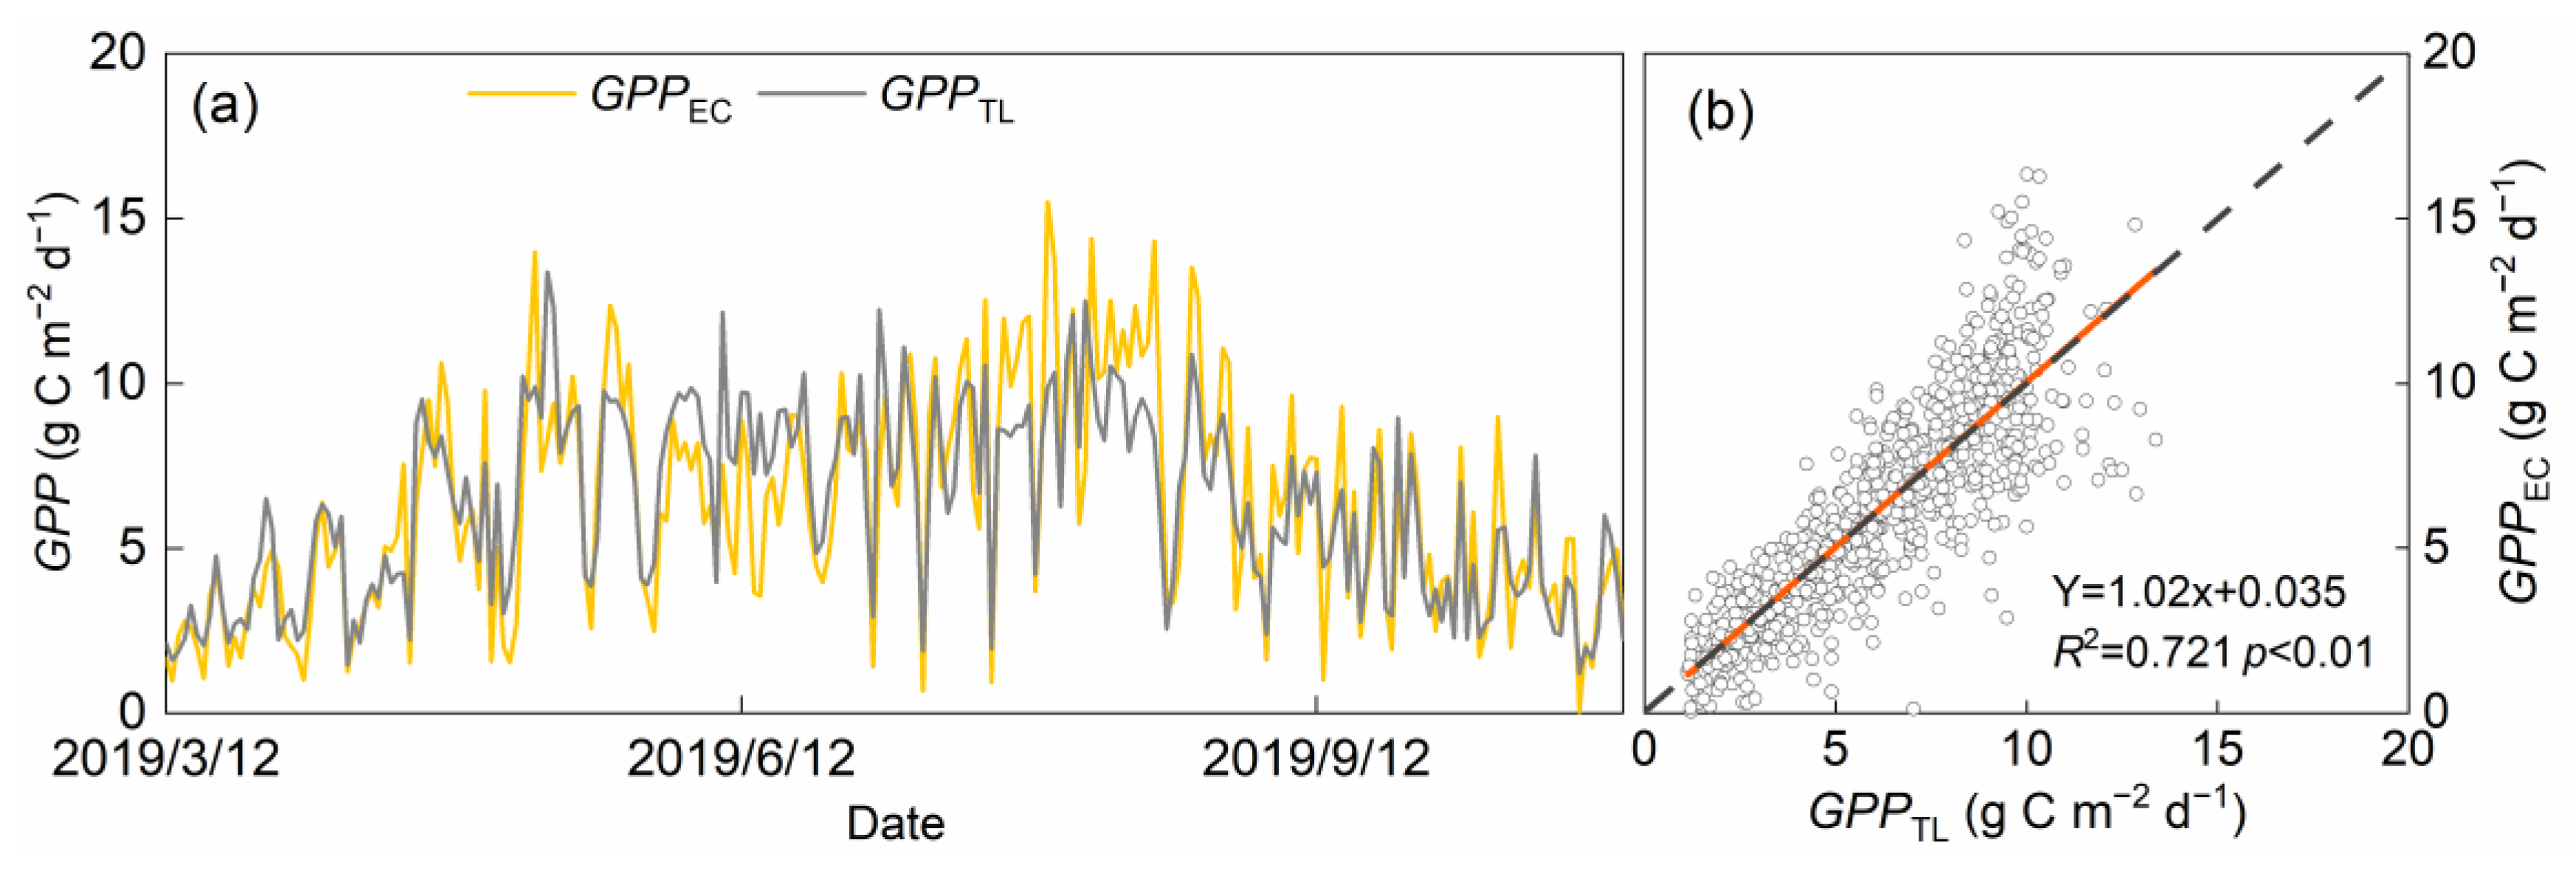
The GPP simulated by the two-leaf LUE-GPP model was consistent with the changes in GPPEC, with a slope of 1.02 and an R2 of 0.721 (p < 0.01, Figure 2). The GPP values estimated by the two-leaf model in 2018–2020 growing seasons were 6.43, 5.87, and 6.28 g C m−2 d−1, respectively, which were comparable to GPPEC values (Table 5). The R2 values between the GPPTL and GPPEC in 2018–2020 growing seasons were, respectively, 0.786, 0.733, and 0.621 (Table 6); MAE were 1.395, 1.329, and 1.259 g C m−2 d−1; RMSE were 1.844, 1.751, and 1.725 g C m−2 d−1; η were 0.558, 0.537, and 0.440; and d1 were 0.755, 0.758, and 0.714. The calculated GPI values were 0.601 (3), 1.185 (3), and 1.293 (3), respectively, and the overall performance was good (the bracket number indicates the ranking compared with the six big-leaf GPP models).

3.2. Influence of Model Structure on Model Performance

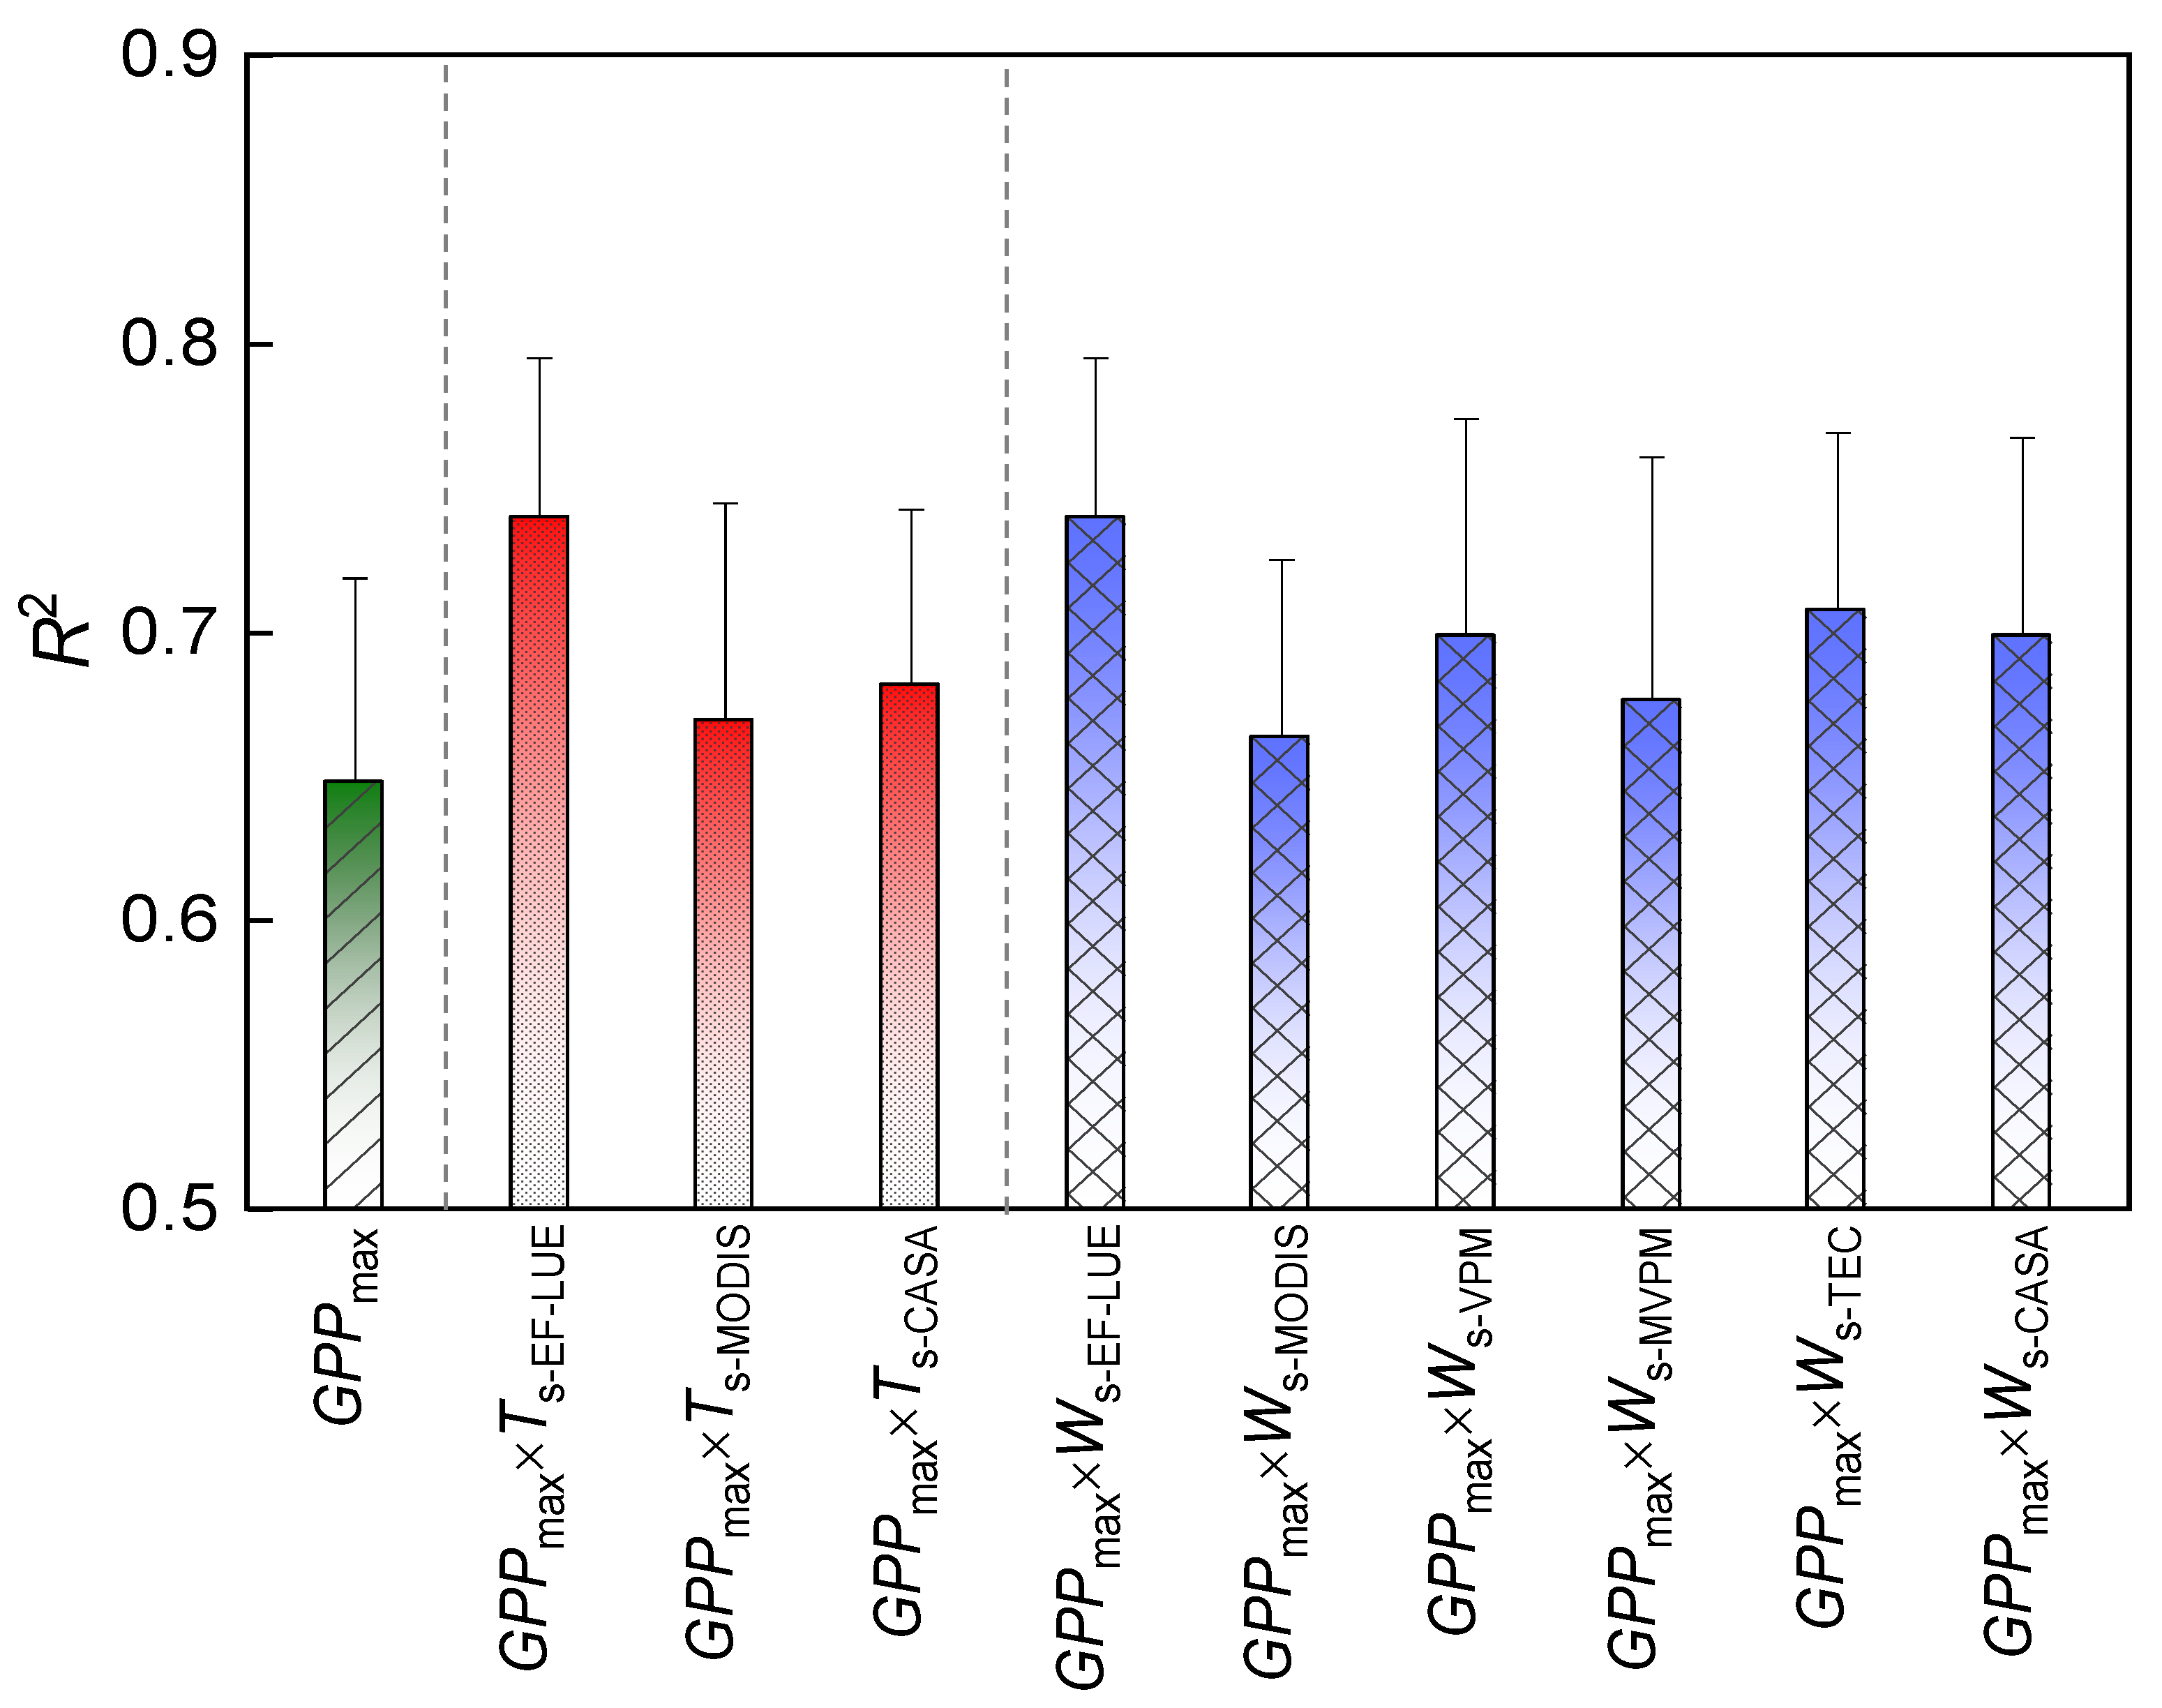
The influence of a single environmental constraint (Ts or Ws) and the combination of different environmental constraints on the performance of the six big-leaf LUE-GPP models was explored. From Figure 3, the models that only considered Ts (R2 = 0.672–0.743) or Ws (R2 = 0.656–0.744) showed better performance than those without any environmental constraints (R2 = 0.651). Among the Ts quantification methods, that calculated by the EF-LUE model (Ts-EF) could better quantify the influence of Ts on GPP estimation (R2 = 0.742 ± 0.06), followed by those by the CASA (R2 = 0.678 ± 0.06) and MODIS models (R2 = 0.673 ± 0.08). Among the Ws quantification methods, that calculated by the EF-LUE (Ws-EF) model better simulated the effect of Ws on GPP estimation (R2 = 0.742 ± 0.06), followed by those simulated by the TEC (R2 = 0.708 ± 0.06), CASA (R2 = 0.704 ± 0.07), VPM (R2 = 0.702 ± 0.08), MVPM (R2 = 0.676 ± 0.09), and MODIS (R2 = 0.655 ± 0.06) models.
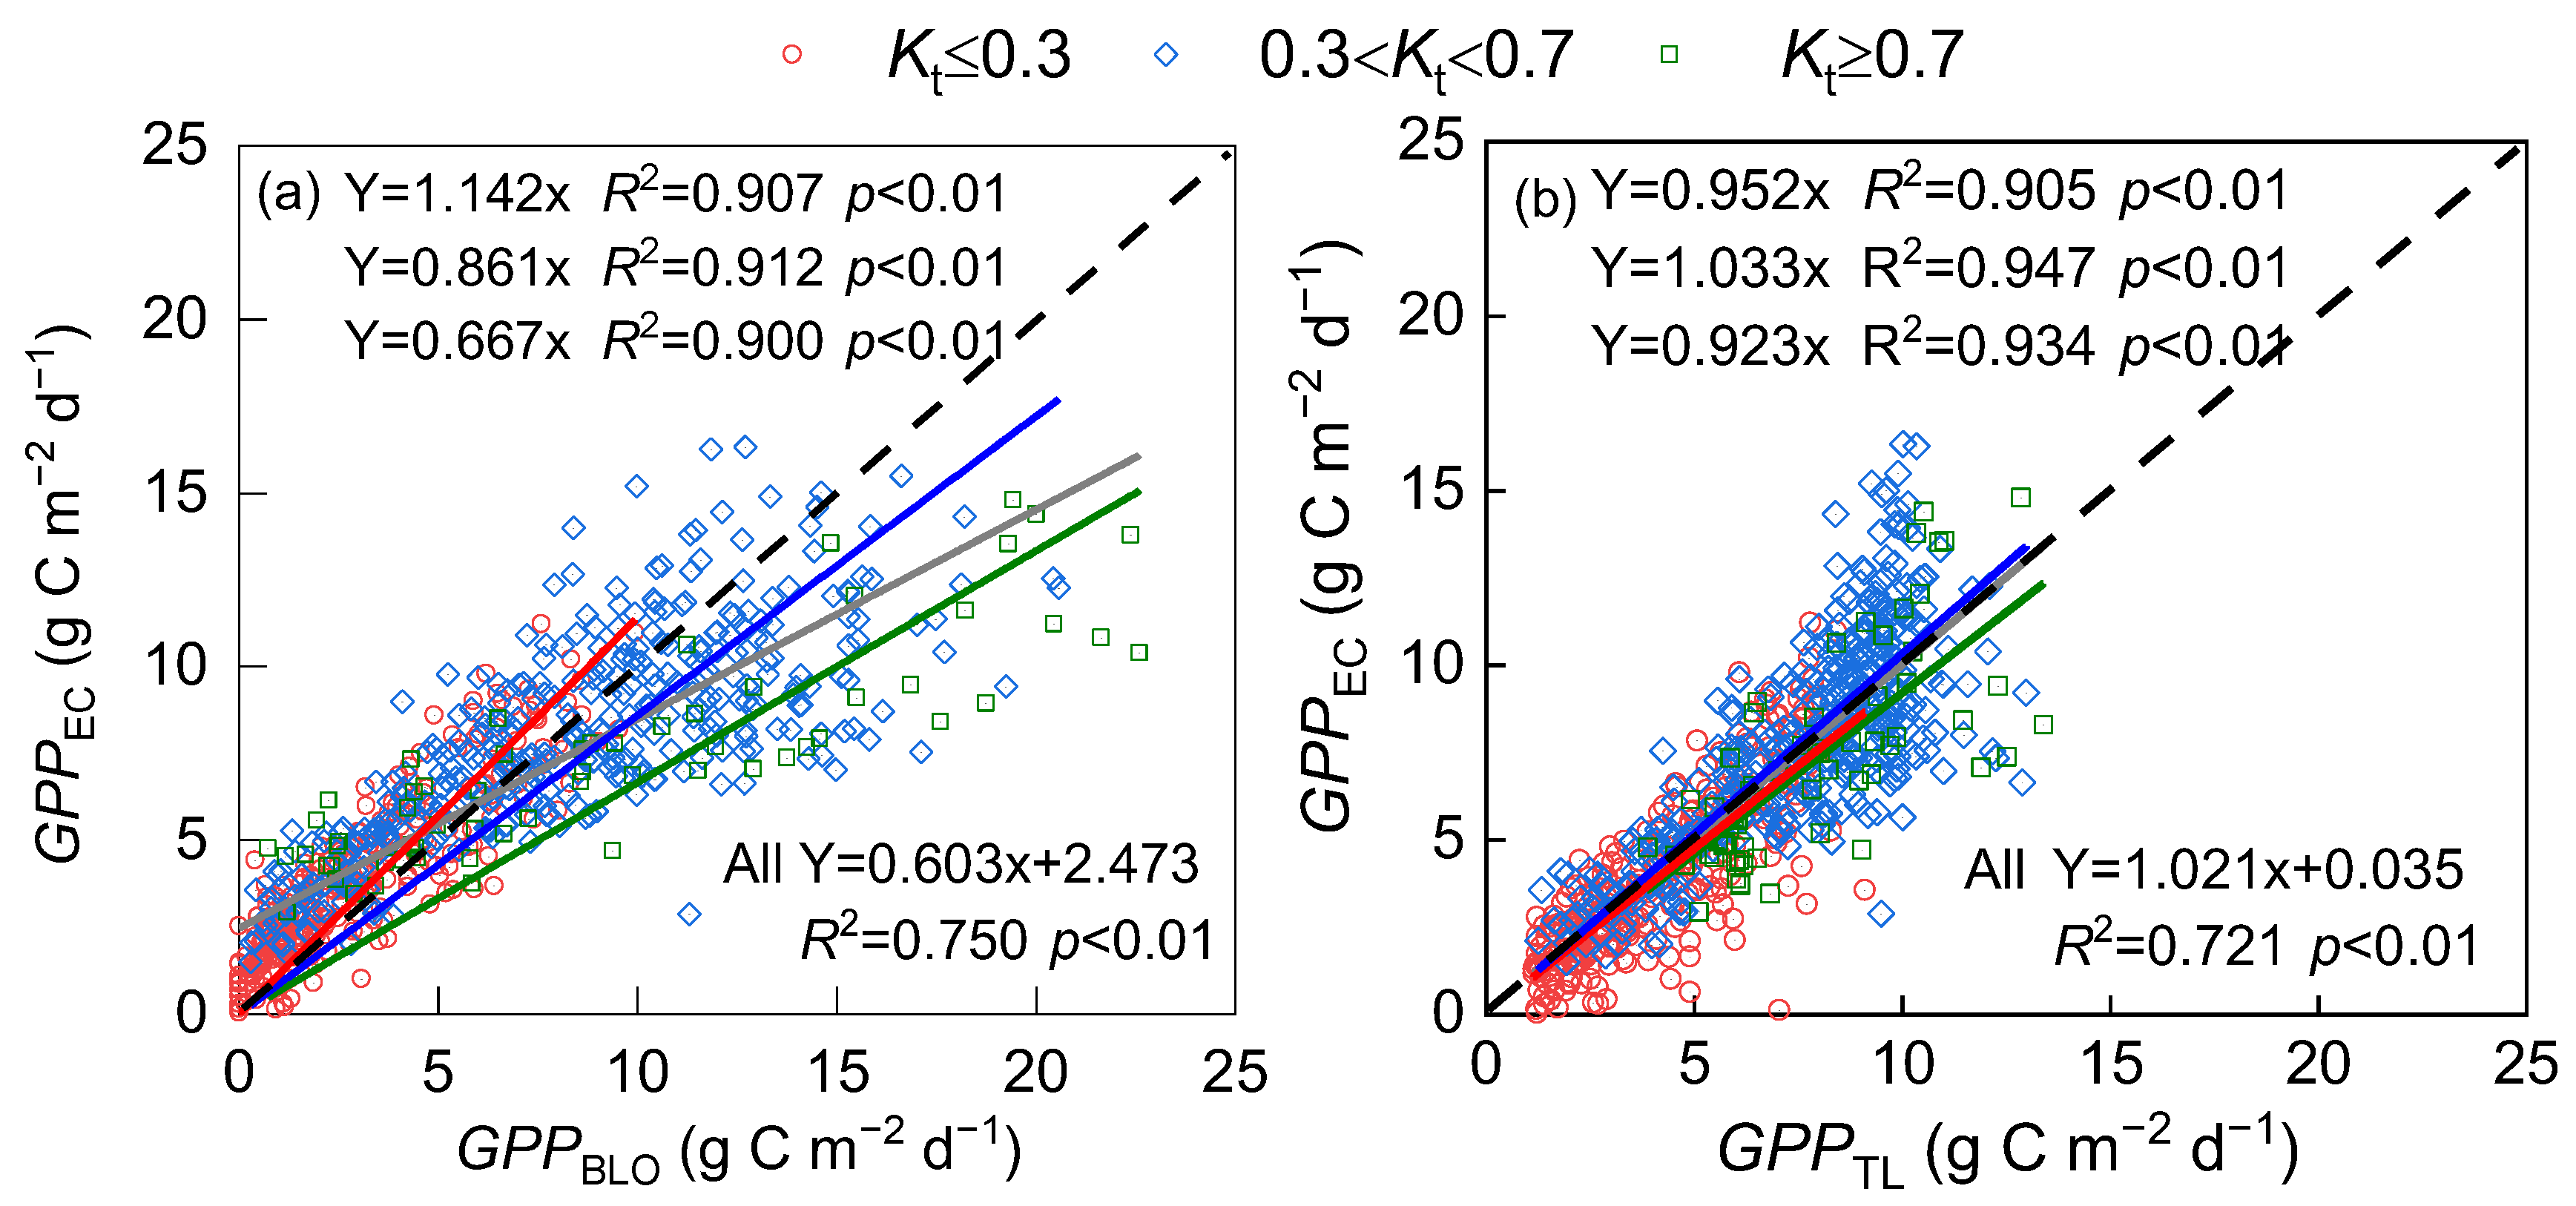
Because Ws-EF could better simulate the effect of moisture constraints on GPP, the model performances of different combinations of Ts and Ws-EF were superior to those of other combinations in simulating GPP (Figure 4). Among the combinations of joint constraints of Ts and Ws (Ts × Ws, Figure 4a), that of Ts quantification by the MODIS model and Ws in EC-LUE model (Ws-EF) had the highest R2 (0.751), followed by those of Ts quantification by the EF-LUE and Ws-EF (R2 = 0.748) and Ts of the CASA model (Ts-CASA) and Ws-EF (R2 = 0.745). Among the combinations of maximum constraints of Ts or Ws (Min (Ts, Ws), Figure 4b), that of Ts-CASA and Ws-EF had the highest R2 (0.756), followed by those of Ts-MODIS and Ws-EF (R2 = 0.747) and Ts-EF and Ws-EF (R2 = 0.745). The model performances of various combinations of Ts-CASA and any Ws were generally superior to those of other combinations, indicating that, although Ts-CASA may not be optimal, it can be combined with other Ws quantification methods for estimating GPP. In addition, for the same quantification method for Ts and Ws, the joint constraints combination of Ts and Ws had a higher R2 than the other maximum restriction combinations. Based on the model structural analysis, the optimal big-leaf LUE-GPP model was obtained (quantification of GPPOBL = GPPmax × Ts-CASA × Ws-EF). The R2 between GPPOBL and GPPEC was 0.750 (p < 0.01), with a slope of 0.603 (Figure 5a). The averaged GPPOBL values were 6.46, 5.81, and 6.45 g C m−2 d−1 in 2018, 2019, and 2020 growing seasons, respectively, which were overall more consistent with GPPEC values (Table 5).

3.3. Model Performances under Different Weather Conditions

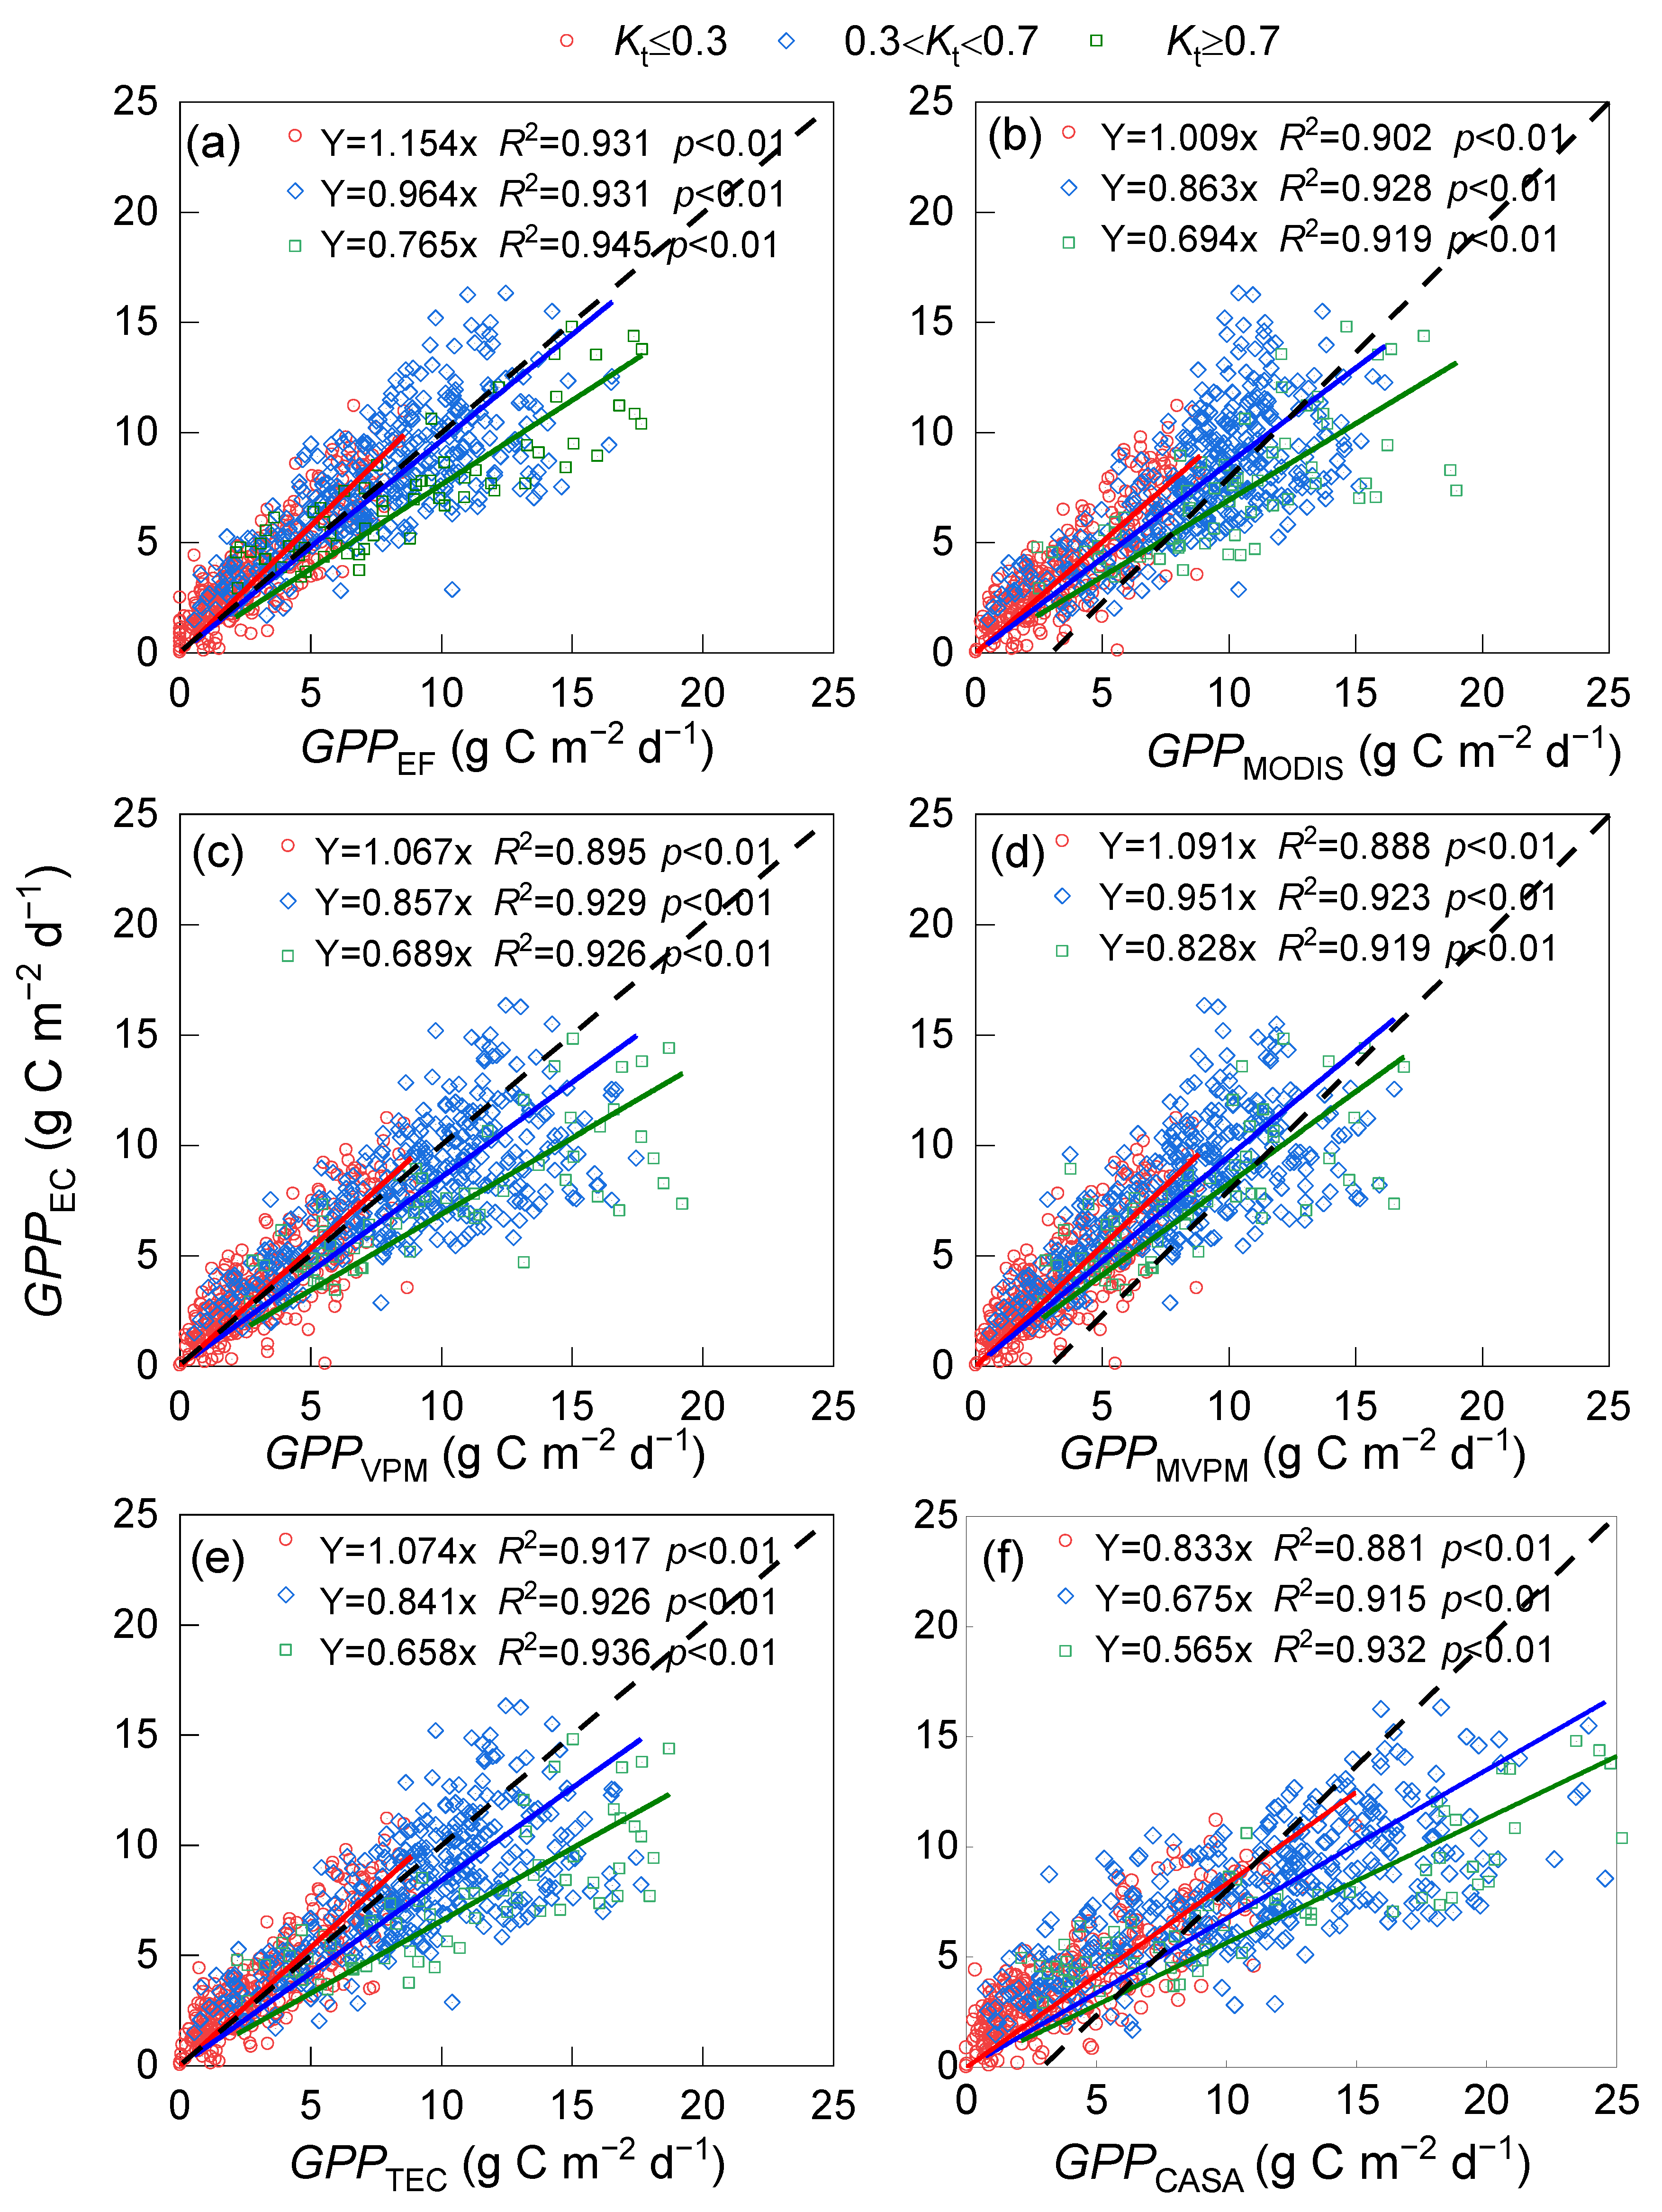
Based on Kt, weather was divided into sunny (Kt ≥ 0.7), moderate (0.3 < Kt < 0.7), and cloudy days (Kt ≤ 0.3). The simulated performances of the optimal big-leaf and two-leaf LUE-GPP models under different weather conditions were analyzed (Figure 5). The performances of the optimal big-leaf LUE-GPP model varied under different weather conditions, and the slopes of 1.142, 0.861, and 0.667 between GPPOBL and GPPEC and RMSE values of 1.49, 2.80, and 4.47 g C m−2 d−1 for cloudy, moderate, and sunny weather, respectively, were obtained (Figure 5a, Table 7). Thus, the optimal big-leaf LUE-GPP model overestimated GPP on sunny days but underestimated GPP on cloudy days. Similar trends were observed in the other big-leaf LUE-GPP models (Figure 6). The optimal big-leaf LUE-GPP model only considered the optimal combination of various environmental constraints, although the overall simulation accuracy was improved, the model could not consider the estimation error under different weather conditions.
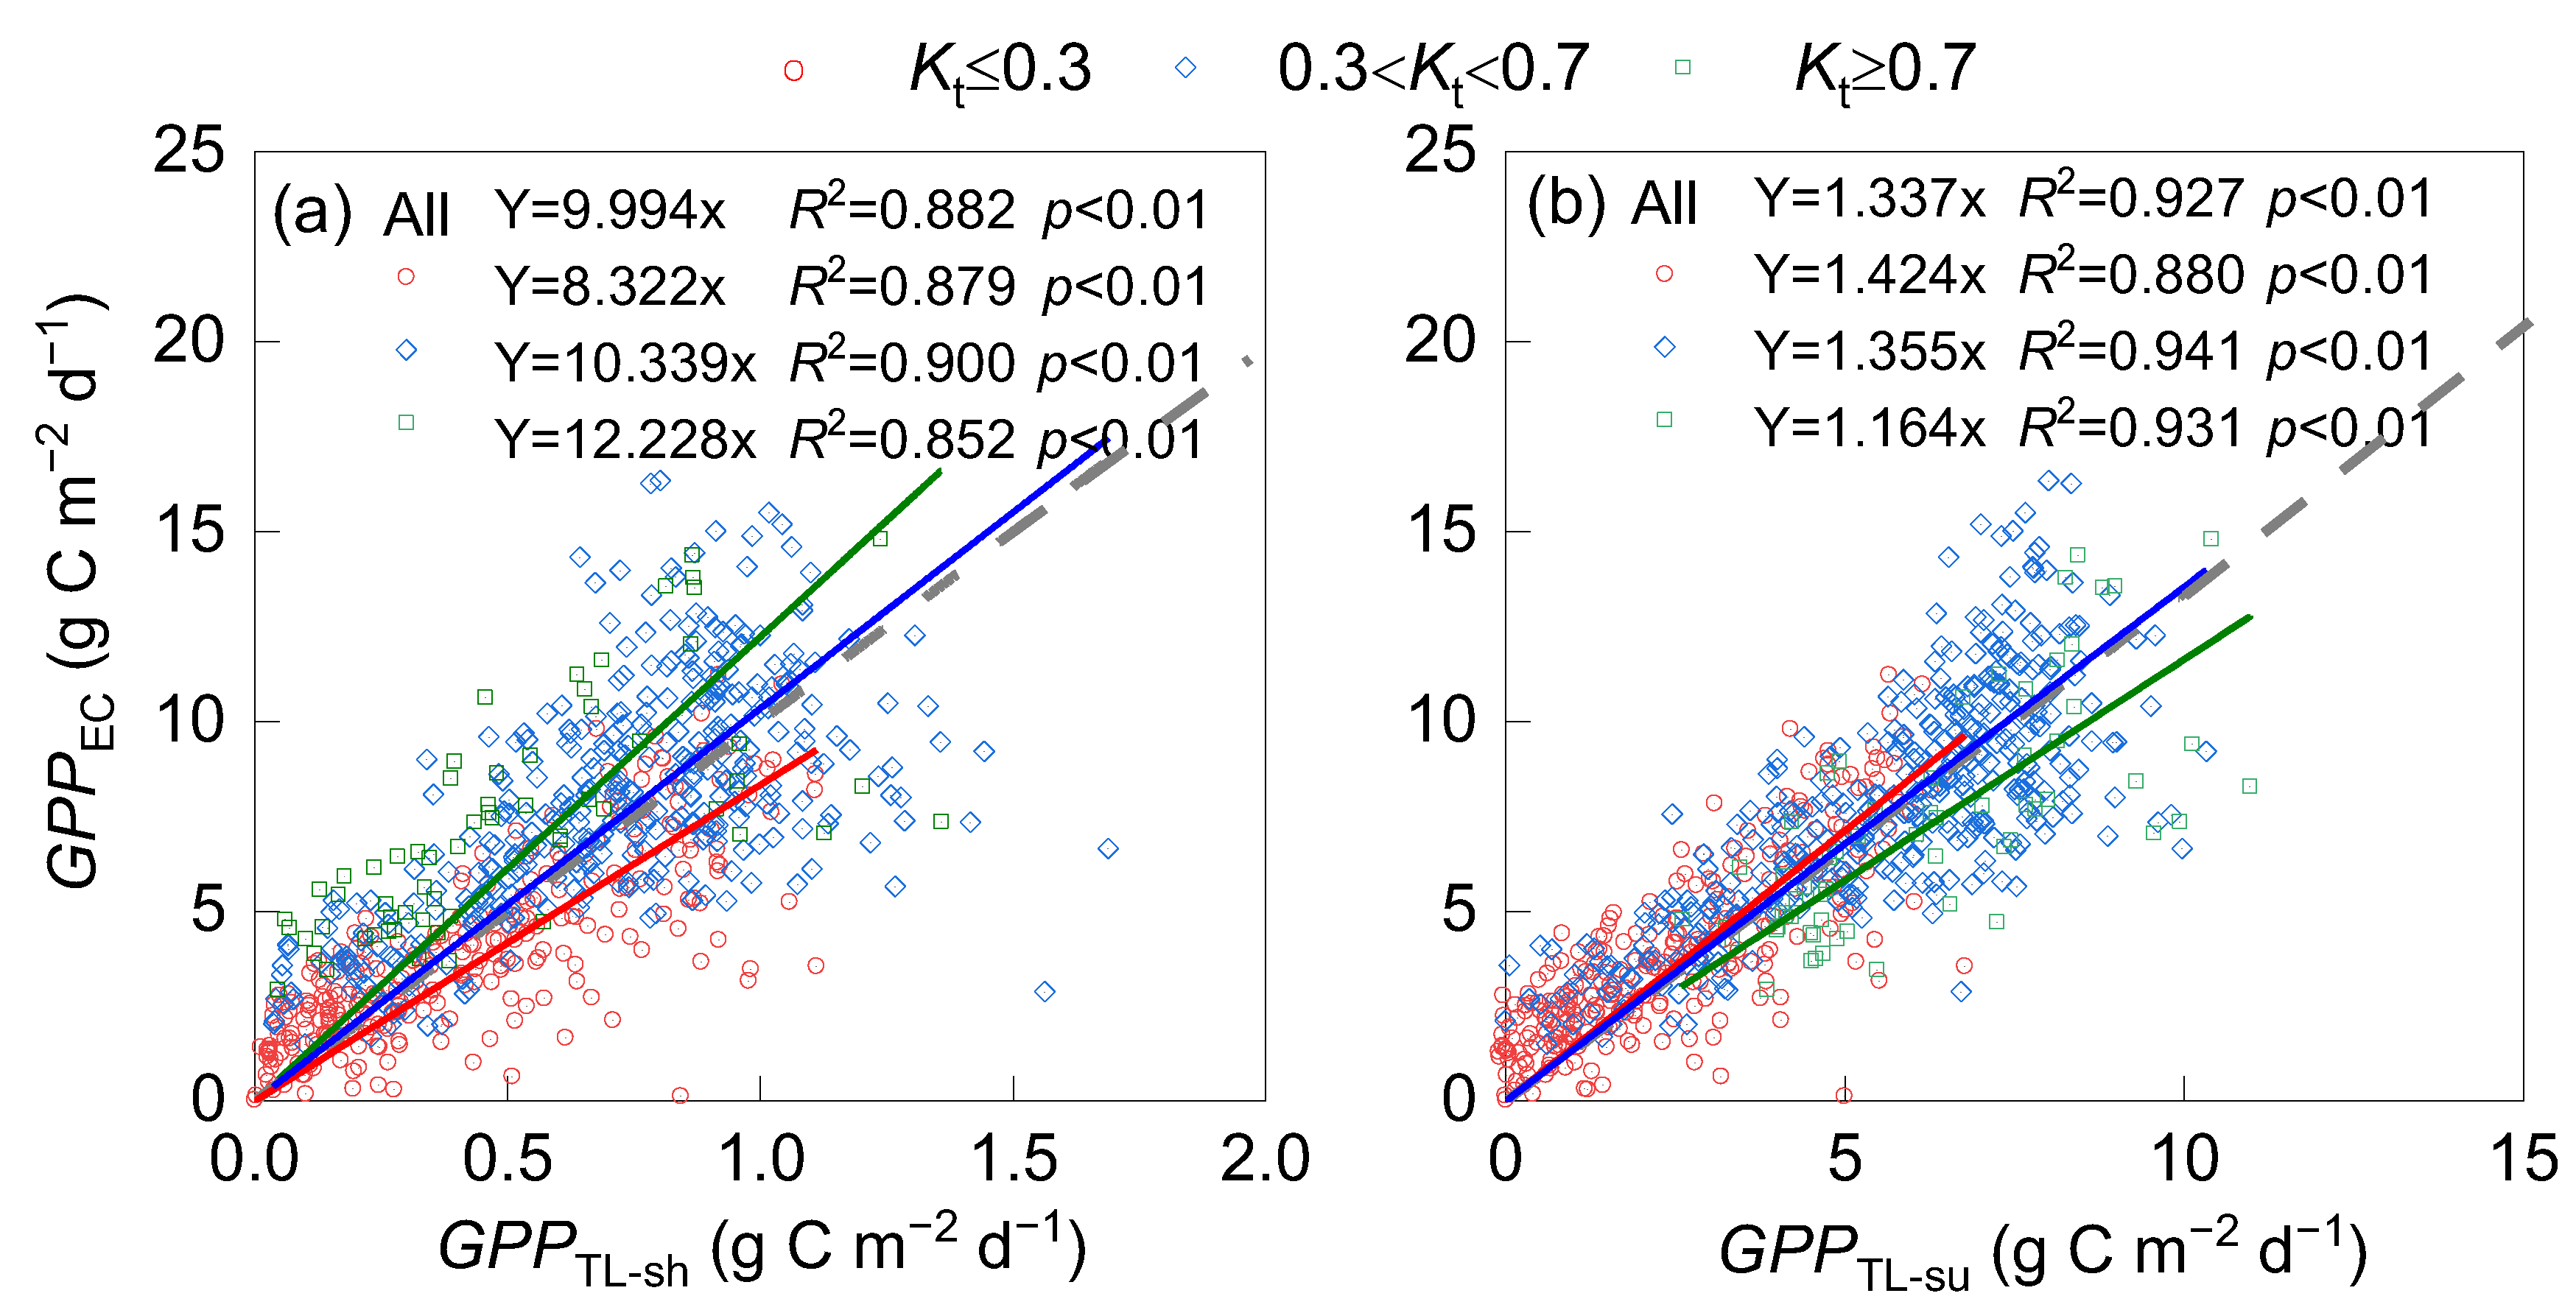
The slopes between GPPEC and GPP simulated by the two-leaf LUE-GPP model (GPPTL) for sunny, moderate, and cloudy conditions were 0.923, 1.033, and 0.952, with RMSE values of 1.42, 1.95, and 2.10 g C m−2 d−1, respectively (Figure 5b, Table 7). The two-leaf LUE-GPP model improved the consistency of the model performances under different weather conditions, as it considered both the diffusion effect and differences in the LUE of shaded and sunlit leaves. The slopes between GPPEC and GPP for shaded leaves simulated by the two-leaf GPP model were 12.228, 10.339, and 8.322, whereas those for sunlit leaves were 1.164, 1.355, and 1.424, for sunny, moderate, and cloudy conditions, respectively (Figure 7). These results demonstrated that although the two-leaf GPP model considered the difference in the photosynthesis of shaded and sunlit leaves and changes in scattering transmission in the canopy, estimation results of GPP in shaded and sunlit leaves remained inconsistent under different weather conditions. On sunny days, the two-leaf GPP model underestimated the GPP of shaded leaves but overestimated that of sunlit leaves, while the simulation results showed the opposite trend on cloudy days. Therefore, the under/overestimation errors were offset, resulting in acceptable total GPP estimates by the two-leaf GPP model under different weather conditions.

3.4. Optimization of the LUE-GPP Model by Introducing Kt

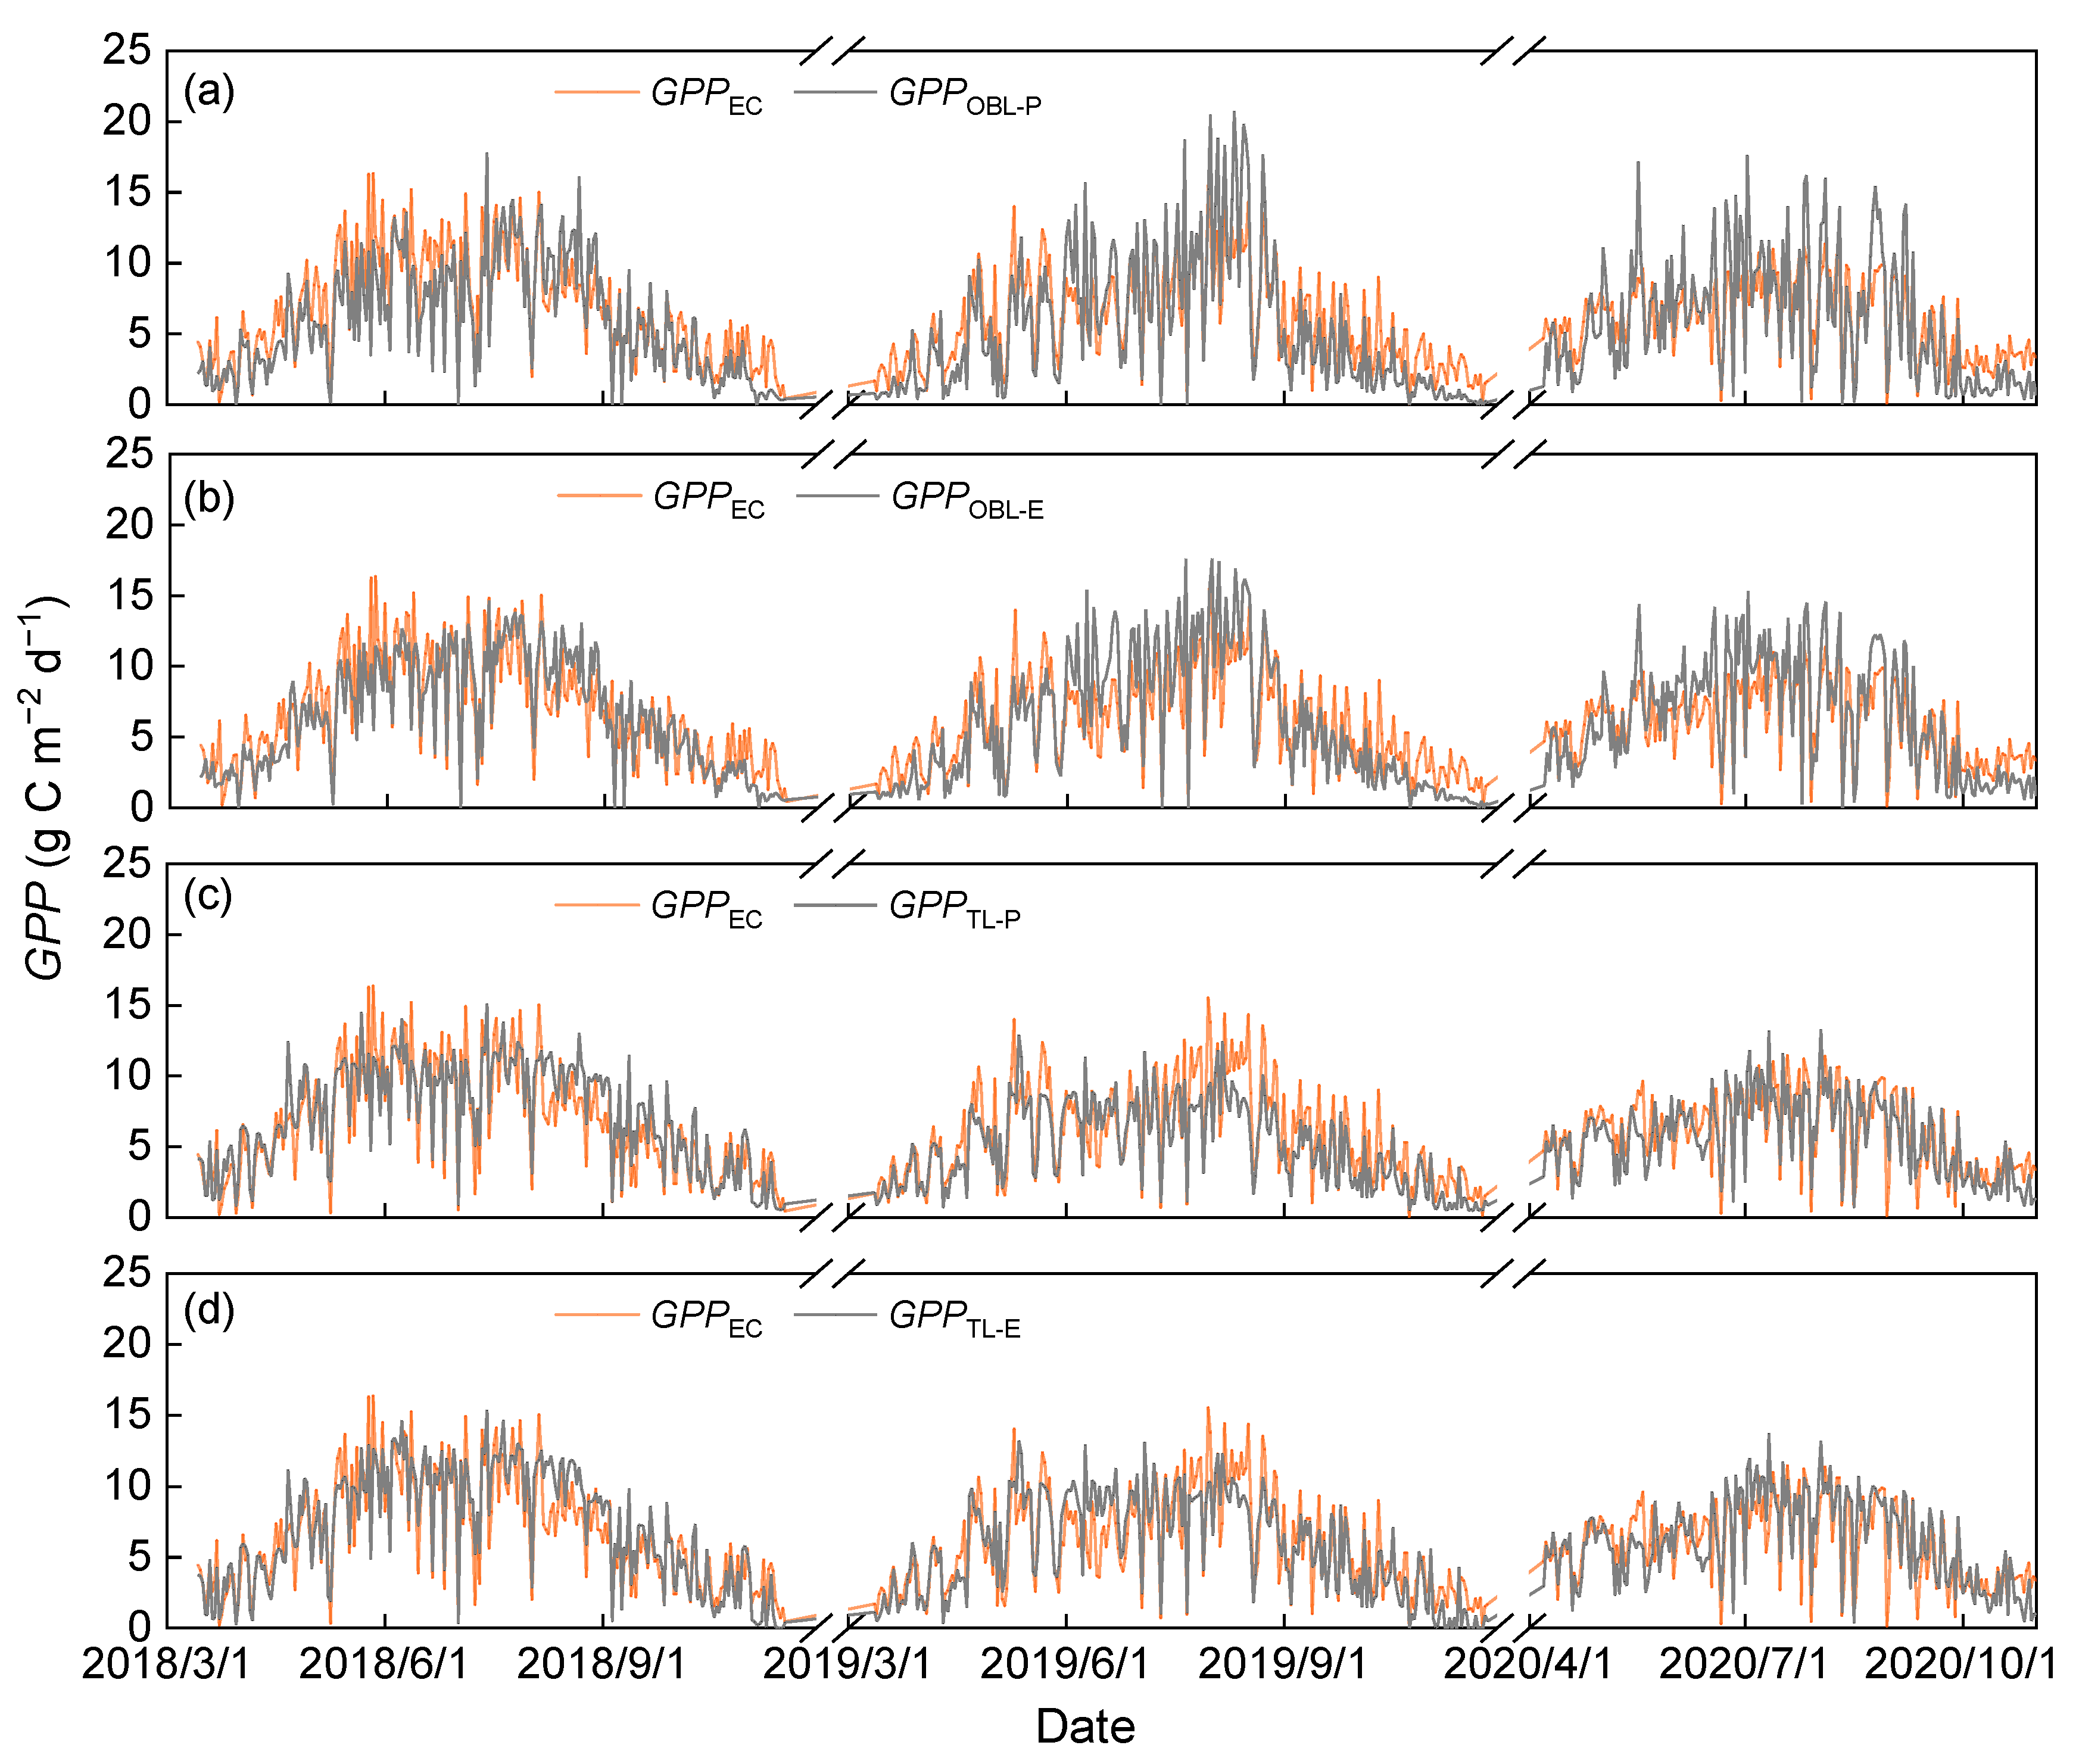
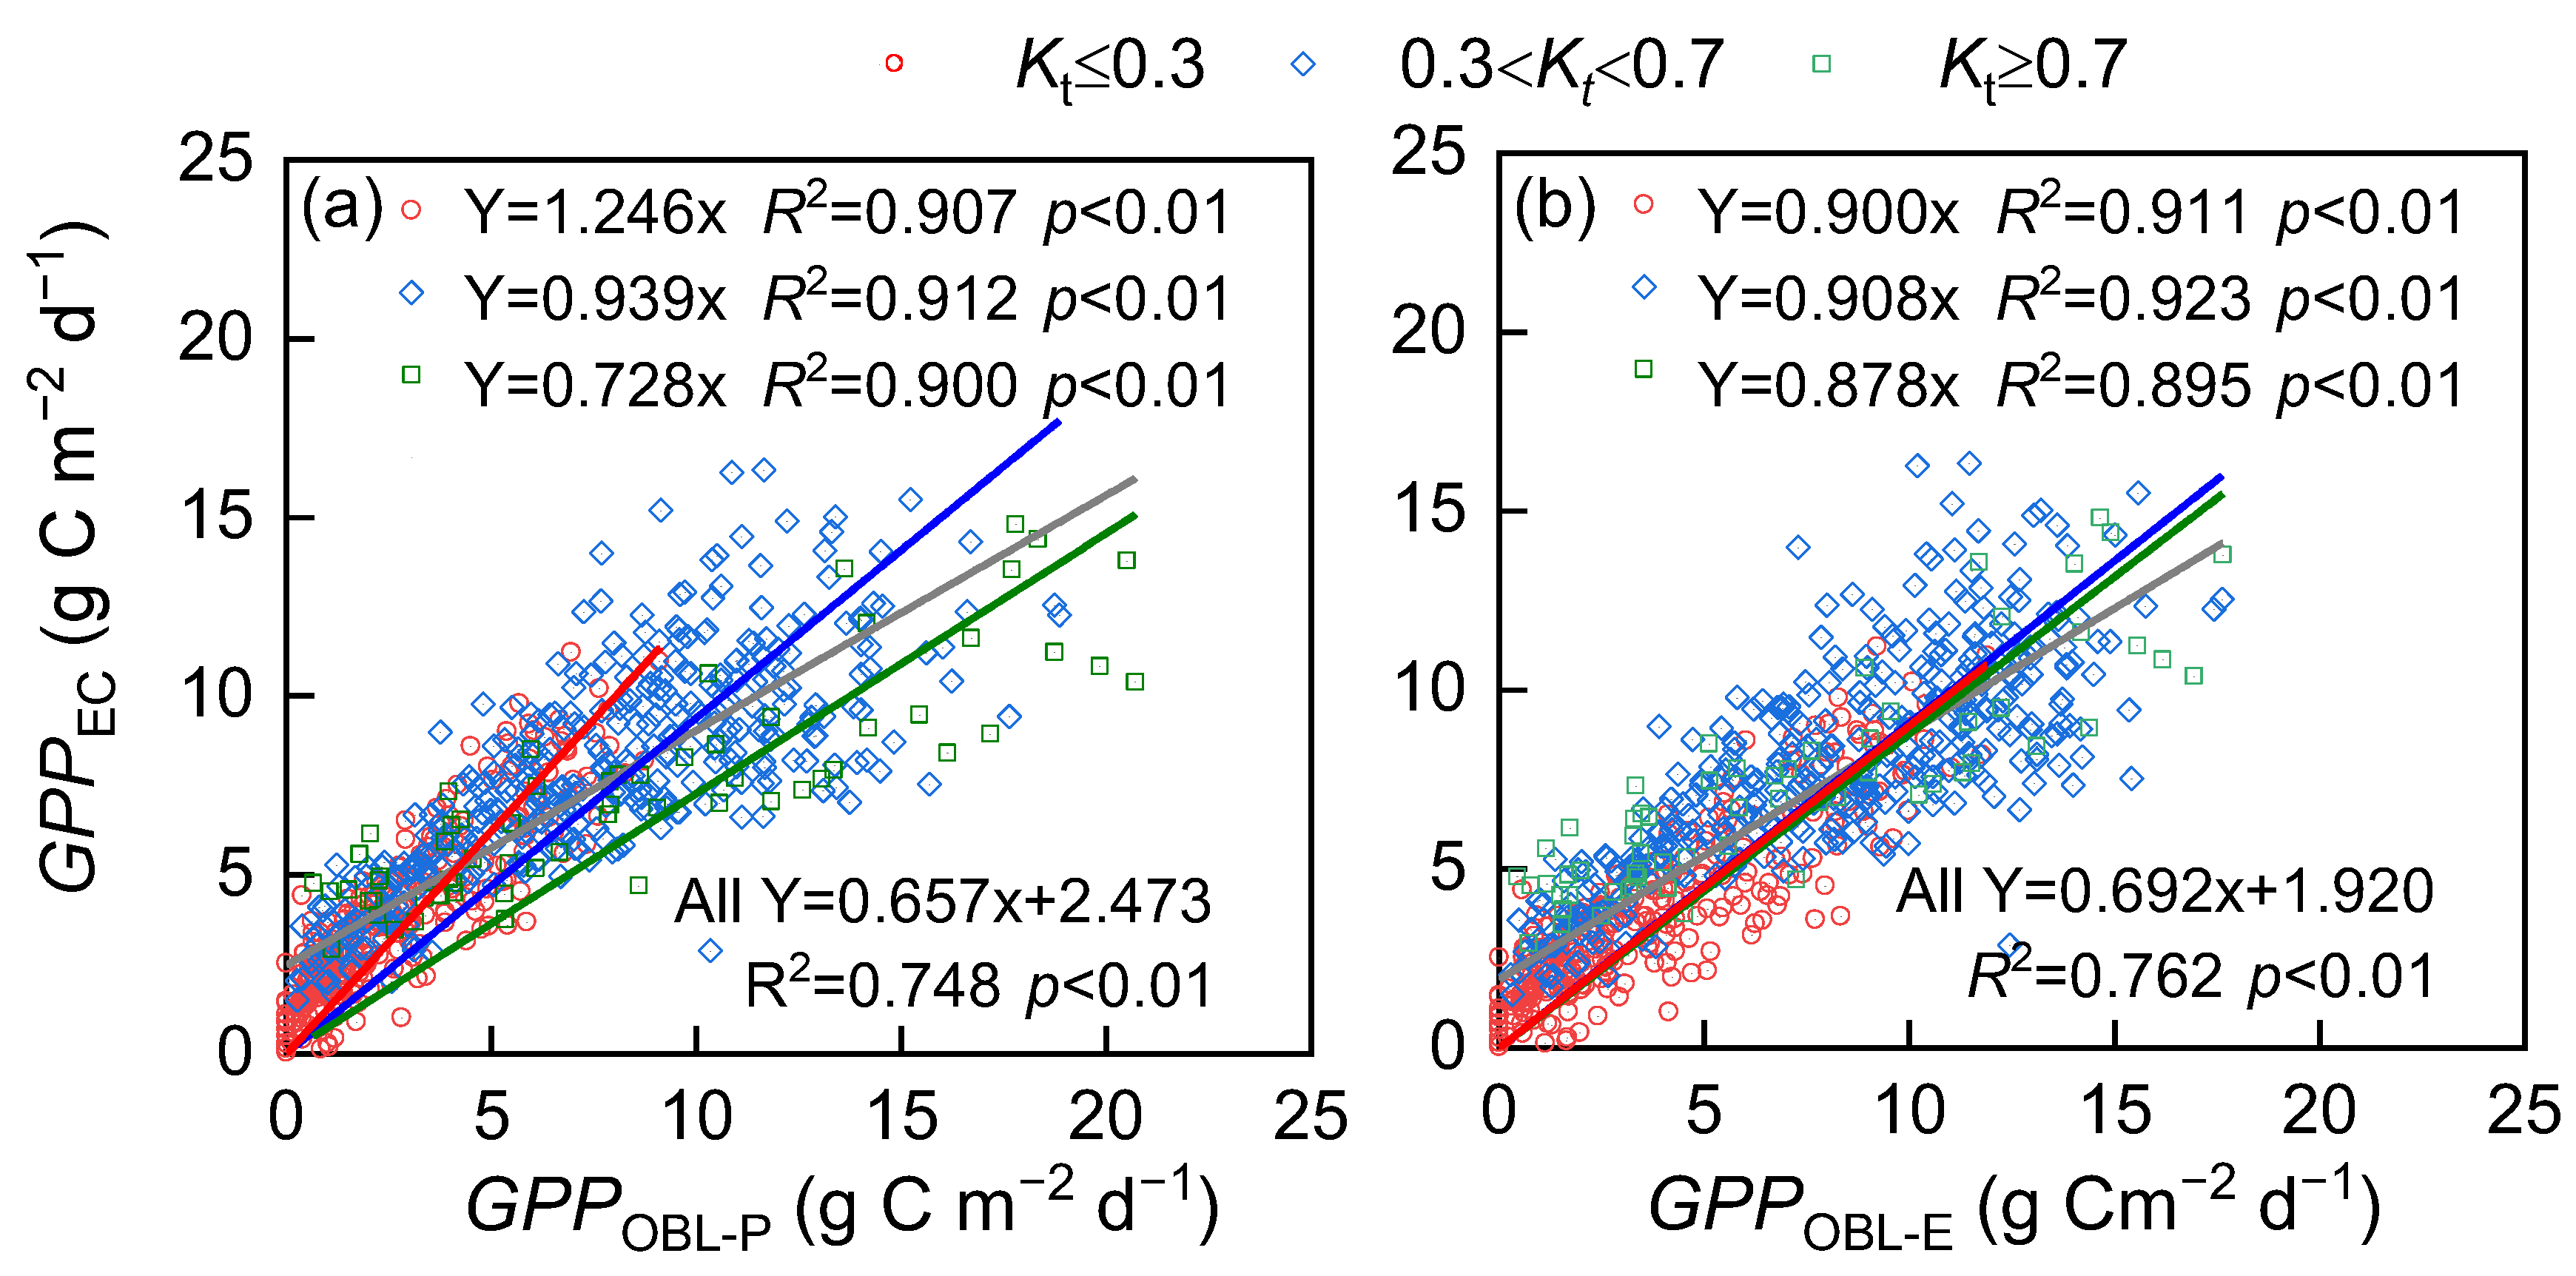
Various models that consider the dynamic LUE well simulated the seasonal variations in GPPEC during the growing seasons (Figure 8). The R2 between GPPOBL-P and GPPEC was 0.748 (p < 0.01), and the slopes between GPPOBL-P and GPPEC for sunny, moderate, and cloudy conditions were 0.728, 0.939, and 1.246, with RMSE values of 1.63, 2.54, and 3.72 g C m−2 d−1, respectively (Figure 9a, Table 7). The R2 between GPPOBL-E and GPPEC was 0.762 (p < 0.01), and their respective slopes were 0.878, 0.908, and 0.900, for sunny, moderate, and cloudy conditions, with RMSE values of 1.44, 2.46, and 2.73 g C m−2 d−1, respectively (Figure 9b). Thus, the Kt-based dynamic LUE-GPP model with exponential form greatly improved the inconsistent performance of the traditional big-leaf LUE-GPP model under different weather conditions, achieving an overall high simulation accuracy.
For the two-leaf LUE-GPP model, the R2 between GPPTL-P and GPPEC was 0.758 (p < 0.01), with slopes of 0.965, 1.013, and 1.000 and RMSE values of 1.49, 2.02, and 2.16 g C m−2 d−1 for sunny, moderate, and cloudy conditions, respectively (Figure 10a, Table 7). The R2 between GPPTL-Z and GPPEC was 0.759 (p < 0.01), with slopes of 0.930, 0.950, and 0.90 and RMSE values of 1.62, 1.94, and 2.02 g C m−2 d−1, for sunny, moderate, and cloudy conditions, respectively (Figure 10b). The accuracy and the consistent performance under different weather conditions of the Kt-based two-leaf LUE-GPP model and the traditional two-leaf model are comparable.
The R2 between shaded leaves GPP (GPPTL-P-sh) and sunlit leaves GPP (GPPTL-P-su) estimated by the two-leaf model combined with the Kt-based power function under different weather conditions are shown in Figure 10c,e. The R2 between GPPTL-P-sh and GPPEC is 0.926 (Figure 10c, p < 0.01), and the slopes for sunny, cloudy, and cloudy conditions were comparable (1.241, 1.363, and 1.304, respectively (p < 0.01)). Those between GPPTL-P-su and GPPEC were also comparable under different weather conditions, with slopes ranging from 3.728–3.985 (Figure 10e). These results indicate that the combination of the two-leaf model and Kt-based power function improves the accuracy of GPP estimates of shaded and sunlit leaves under different weather conditions.
The R2 between GPP of shaded leaves (GPPTL-E-sh) and sunlit leaves (GPPTL-P-su) estimated by the two-leaf LUE-GPP model, combined with the Kt-based exponential function under different weather conditions, is shown in Figure 10d,f. Because the fitted parameter A1 was extremely small, calculation of GPPTL-E-sh is negligible; thus, we could not compare model performances under different weather conditions (Figure 10d). Nevertheless, the slopes of the GPPTL-P-su and GPPEC were comparable under different weather conditions, with values ranging from 0.900–0.955 (Figure 10f). This implies that by introducing the Kt-based exponential function, the two-leaf LUE-GPP model can improve the accuracy of GPP estimates under different weather conditions.

4. Discussion

4.1. Comparison of Big-Leaf LUE-GPP Models

The estimations of the big-leaf LUE-GPP models were consistent with those derived from the EC system, confirming that the former are useful in estimating GPP of agroforestry ecosystems in humid regions. Based on the performance evaluation of the LUE-GPP models in various ecosystem types [19,46], the LUE-GPP model could be used for deciduous broad-leaved plants because APAR is directly related to leaf area index [47], while the distinctive seasonal phenological changes in its leaves can be completely captured by satellite [46,48]. However, for some ecosystems with close canopies and evergreen species, the canopy does not seasonally vary during the growing season, and the simulation results were not accurate [11]. Therefore, the performance of the LUE-GPP model is closely related to the vegetation index, as photosynthesis occurs in the leaves. Seasonal variations in pigment concentration and the canopy characteristics of kiwifruit are evident, which may be one of the reasons for the satisfactory simulation results of the LUE-GPP models.
All six big-leaf LUE-GPP models overestimated GPP during the observation period. This may be related to the high set value of LUEmax. For example, LUEmax was only set to 1.04 g C MJ−1 in MOD 17 products. Previous studies considered LUEmax as a crop-invariant parameter and calculated it according to a site-specific calibration [49]; by contrast, we determined it according to the leaf-scale measurements. Thus, calibrated LUEmax values would vary owing to differences in the quantification of environmental constraints for different LUE algorithms. However, for a specific crop, LUEmax should be constant. Therefore, to ensure a rigorous comparison of models, we used the same LUEmax value across the six big-leaf LUE-GPP models.
Differences in the performances of the various big-leaf LUE-GPP models were attributed to differences in the quantification of environmental constraints and combinations of the different environmental constraints. Taking the Ts quantification method as an example, quantification of Ts using the MODIS model might not fully characterize the temperature stress on photosynthesis with linear function stress, whereas that of Ts using the CASA and EF-LUE models may be more reasonable (Figure 2). EF was used as a measure of moisture stress in the EC-LUE model, as an increase in the energy directed towards evaporating water signifies a large potential water supply [20]. Moreover, nonlinear temperature constraints compound the physiological response of photosynthesis to temperature in the EF-LUE model [22]. Therefore, the EF-LUE model had the best performance among the six big-leaf LUE-GPP models. Kurc and Small [50] reported that the EF-LUE model outperformed the other LUE-GPP models at the farmland sites.
The high accuracy of the TEC model may be attributed to a more accurate expression of Ws (Ws = ETa/ETpot) than other big-leaf LUE-GPP models. Similar to EF, the equaled ETa and ETpot indicate that underlying ET was limited by available energy rather than soil moisture [51]. However, the CASA model had a slightly lower accuracy than the TEC model, although they both used similar Ws algorithms. This may be attributed to the limited water constraint in the CASA model by introducing a fixed factor of 0.5 in Ws-CASA, which cannot fully characterize Ws on LUE (Figure 2). In addition, the Ts algorithm in the CASA model may affect its performance. The better performance of the VPM may be attributed to the use of LSWI in quantifying Ws and consideration of the effect of phenological change in LUE, since LSWI could accurately represent the water status of the vegetation canopy [52].
Furthermore, the MVPM added Ws-VPD to characterize the constraints of atmospheric water requirement on leaf photosynthesis. However, the R2 value was lower between GPPmax × Ws-MVPM and GPPEC than between GPPmax × Ws-VPM and GPPEC, indicating that adding a linear function constraint of VPD yields inaccurate estimates. Moreover, the Ws algorithm used in the MODIS might not fully quantify the effect of water stress on productivity, since the consistency between GPPmax × Ws-MODIS and GPPEC is not ideal. The decoupled relationship between VPD and GPP was also reported in corn and soybean field sites [52]. Several studies have indicated that VPD may not comprehensively capture the limitations of moisture on plant photosynthesis, as it solely accounts for atmospheric water availability while disregarding soil water supply [53].
The joint constraint combination of Ts and Ws better simulated the environmental constraints imposed on GPP than the maximum constraint combinations. This is because Ts and Ws were both set to <1, and the maximum limit of Ts or Ws may underestimate the effect of certain environmental constraints on estimating GPP. The combination of environmental factors in the form of a product (joint constraint combination) greatly improved the simulation accuracy of the EF-LUE model [11], which was consistent with our results. However, a specific LUE-GPP model is consistently superior over other models across various ecosystems. For instance, the VPM showed superior performance in deciduous broadleaf forest sites with deep root systems, as Ws effectively characterizes the effect of leaf age and canopy water availability on photosynthesis. However, the EF-LUE model had the best performance in non-forest sites [11]. In addition, compared to Ts-EF, Ts-CASA might not be optimal in quantifying temperature constraints, but it can improve model performance when combined with any form of Ws in big-leaf LUE-GPP models.

4.2. Evaluation of LUE-GPP Model Performance under Different Weather Conditions

The big-leaf LUE-GPP models performed differently under different weather conditions. Specifically, they overestimated GPP on sunny days (Kt > 0.7) and underestimated it on cloudy days (Kt ≤ 0.3). Based on the measured light-response curve, the light saturation point of kiwifruit leaves was 960 μmol (photon) m−2 s−1 PPFD, which was approximately half of the midday summer irradiance observed in the field. Therefore, the intercepted solar radiation energy cannot be fully converted to photosynthetic chemical energy [54]. The simplified big-leaf LUE-GPP model considered the canopy as a whole with consistent properties; however, light intensity within the canopy leaves is often variable. The upper canopy leaves reach light saturation, whereas the lower ones do not receive sufficient sunlight for efficient photosynthesis due to shading. Thus, ignoring the photosynthetic difference under different light intensities may introduce estimation errors into the big-leaf LUE-GPP models [24,55]. By contrast, the two-leaf LUE-GPP model considered the light distribution difference within the canopy and calculated the GPP of shaded and sunlit leaves separately, reporting consistent model performance under different weather conditions.
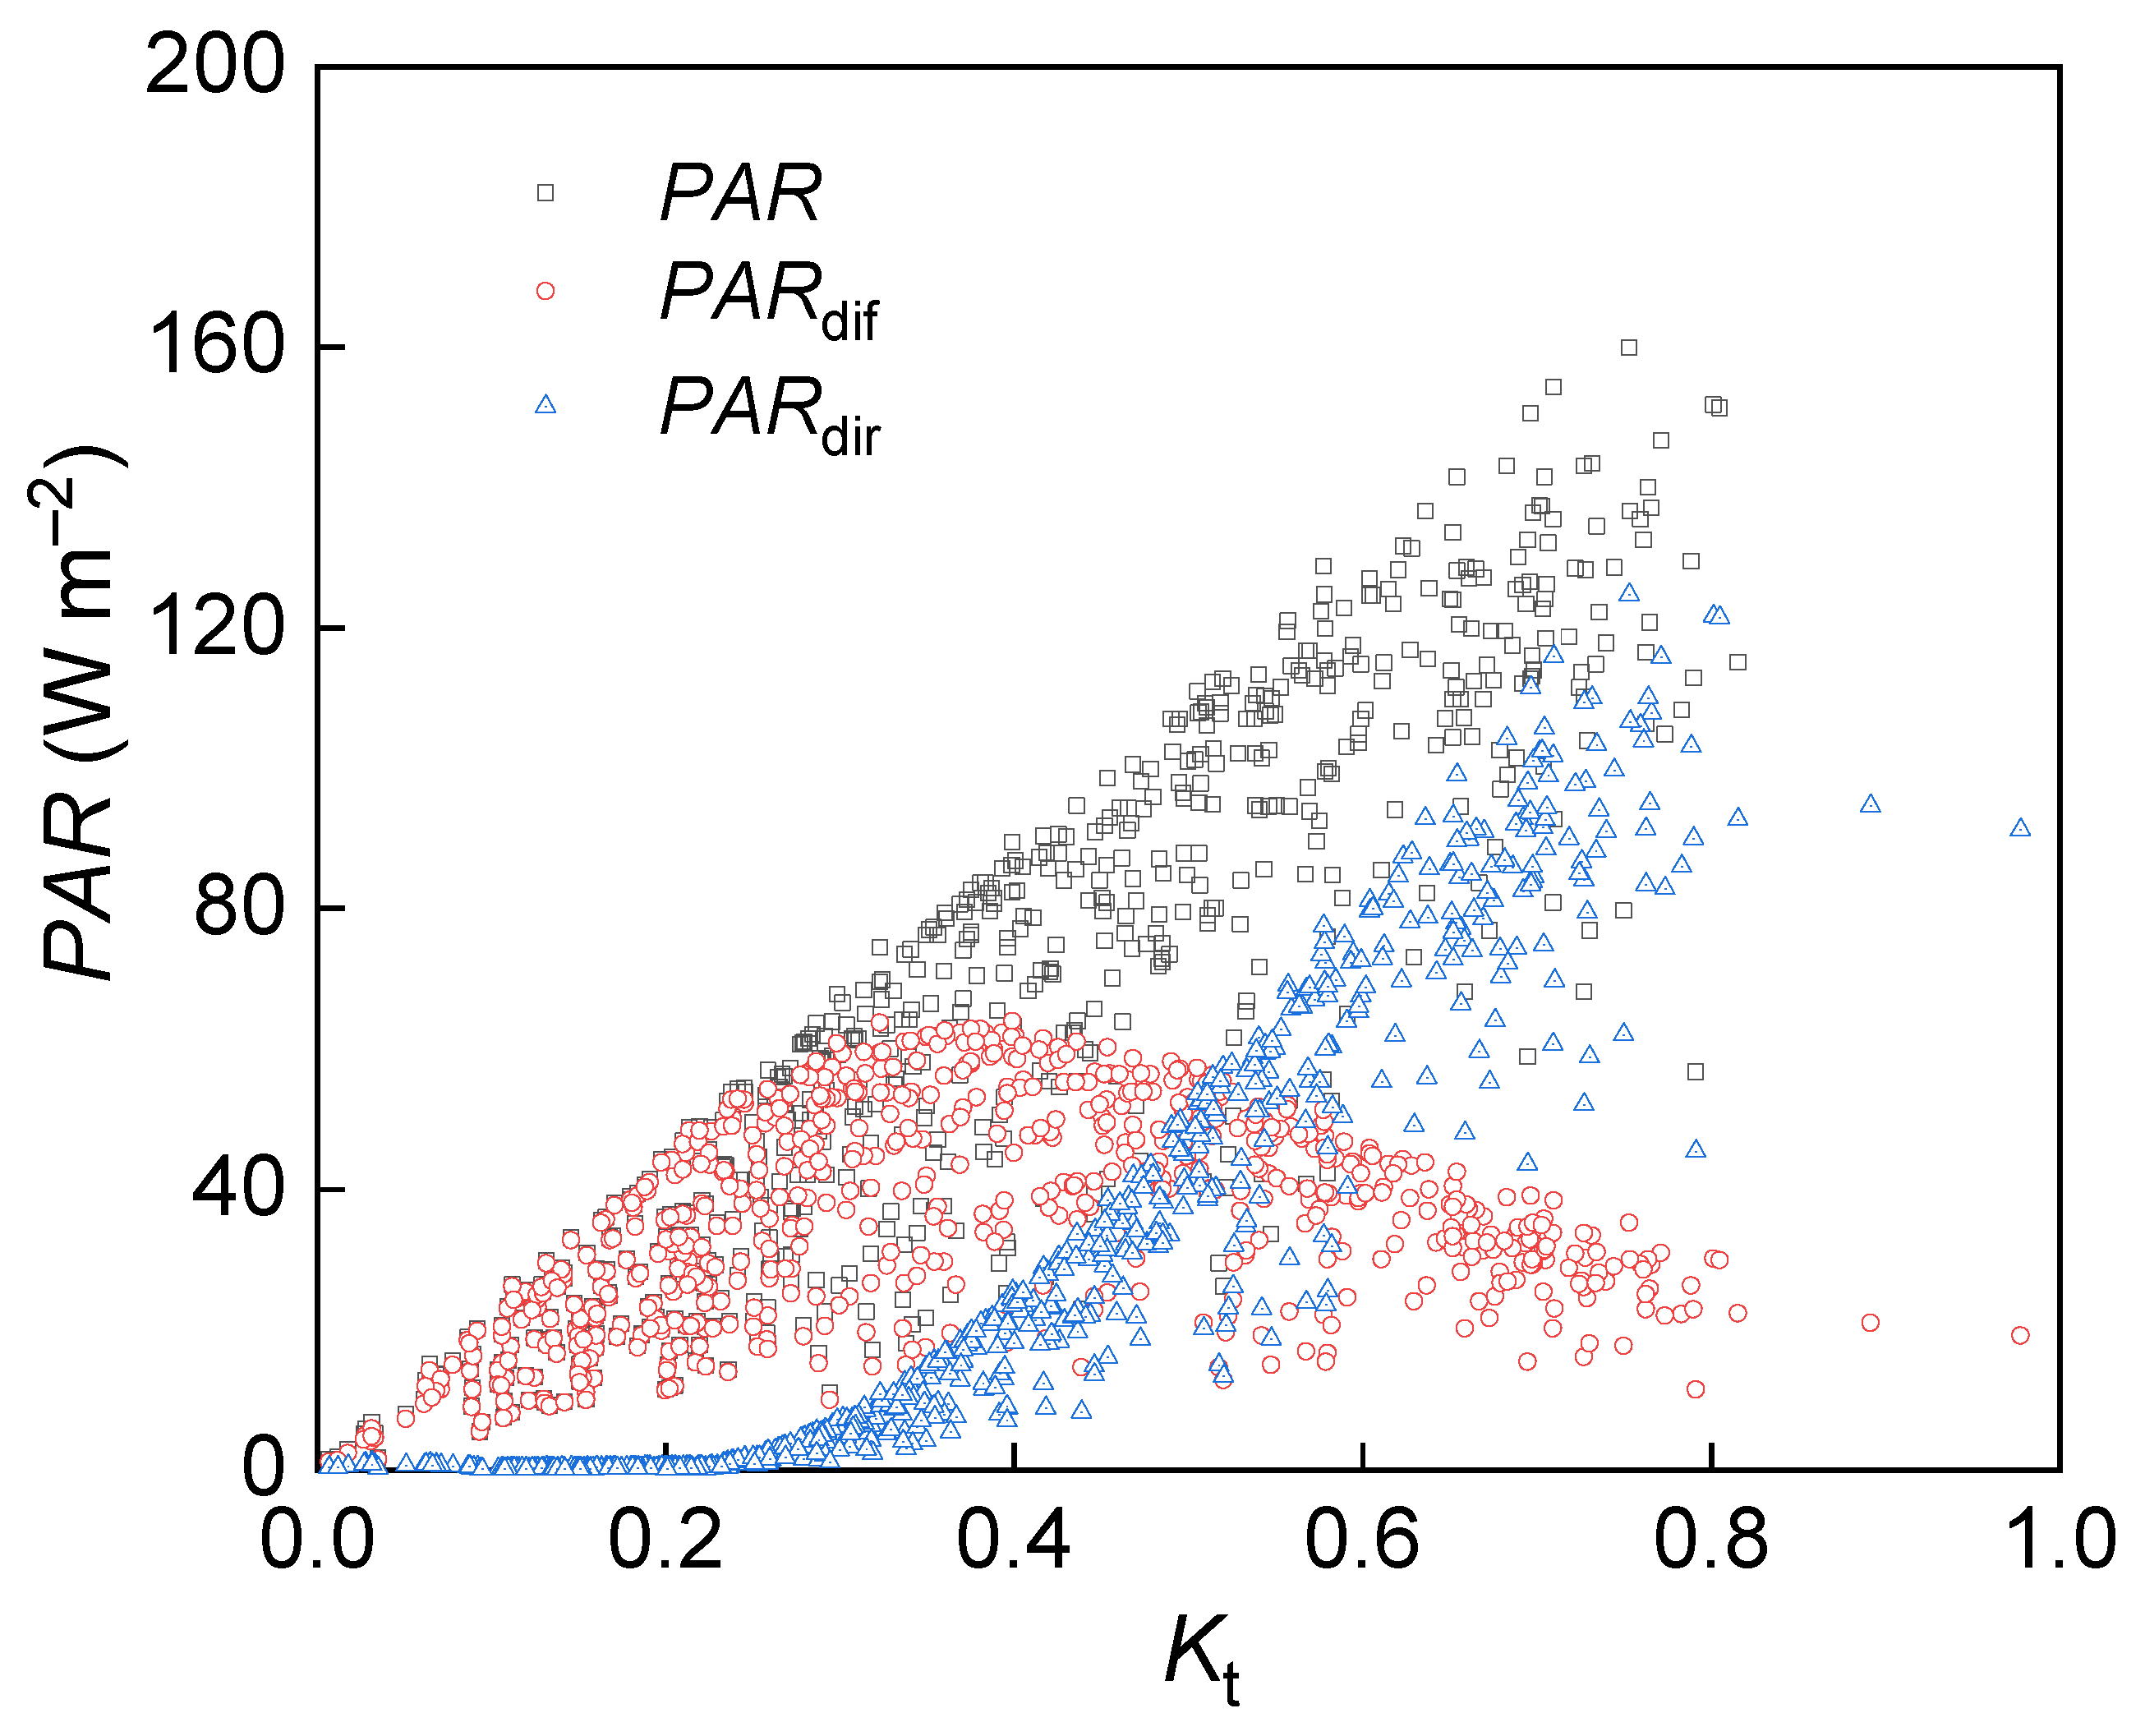
As reported by Knohl and Baldocchi [26], changes in ecosystem PAR components due to weather conditions greatly affected ecosystem photosynthesis productivity. A parabolic relationship was found between Kt and GPP (Figure 11). Therefore, although total sunlight radiation decreased with a decrease in Kt (Figure 12), the photosynthetic rate might be higher in thin-cloudy conditions. In fact, daytime light intensity generally exceeds the light saturation point of most plants [54]. During thin-cloudy days, the reduced PARdir may be higher than the maximum light-saturation point of sunlit leaves, but the enhanced PARdif can better illuminate the lower canopy and increase the GPP of shaded leaves [55]; thus, the total GPP of the canopy is increased [25]. Although LUE may increase under low Kt and high diffuse radiation, the total GPP will decrease when total radiation is decreased significantly, leading to a nonlinear relationship between Kt and GPP.
Aside from the radiation distribution, ignoring the dynamic changes in LUE due to Kt may introduce some errors in estimating GPP [14,18]. Field observation studies have reported that LUE increases with a decrease in Kt [10,44]. The LUE values in the big-leaf and two-leaf models (sunlit and shaded leaves) are specified as constants, which explains the inconsistency in model performance under different weather conditions [9]. The constructed Kt-based dynamic LUE model with exponential form greatly improved the performance consistency of the traditional big-leaf LUE-GPP model under different weather conditions, achieving an overall high simulation accuracy. The accuracy and consistent performance under different weather conditions of the Kt-based two-leaf model were both improved compared to those of the traditional two-leaf LUE-GPP model. These results indicate that using a power or an exponential function to empirically fit the dynamic effect of Kt on LUE can improve model performance. Notably, the dynamic two-leaf LUE-GPP model based on an exponential function could weaken the estimated GPP of shaded leaves, which may be caused by the small parameter value.

4.3. Limitations of the Study

All LUE-GPP models yielded robust GPP estimates, and model performance could be improved by optimizing the model structure or constructing Kt-based dynamic LUE. The LUE-GPP models can be easily applied due to their simplicity and less need for parameter correction; thus, combined with satellite remote sensing data, they are widely used for calculating regional or global GPP estimates [1,7,8]. All LUE-GPP models calculated GPP under idealized conditions and adjusted the LUEmax to the actual value by incorporating eco-physiological constraints. However, the photosynthetic process is complex and is affected by other abiotic or biological constraints (leaf nutrients, leaf age, environmental CO2 concentration, etc.). Thus, by considering the temperature and moisture factors only, eco-physiological constraints are not fully characterized, representing a limitation of the LUE-GPP model [56].
In addition to model structure, quantification of environmental constraints, and calibration of model parameters, the accuracy of the LUE-GPP models may be affected by the biophysical variables and carbon flux measurements [48,57]. For instance, the mismatched scale between MODIS image pixels and tower footprints could affect the evaluation of the LUE-GPP model, and the mismatch scale in the measurement period of LAI and environmental variables may also potentially contribute to the estimation uncertainties. Specifically, the GPPEC uncertainties of up to 30% were reported due to random and systematic errors, partitioning of NEE into GPP and Re, and the use of carbon flux gap-filling methods [58]. Moreover, MODIS products contain uncertainties, especially the calculation of LSWI owing to persistent cloudy weather conditions in the study area. This may result in inaccurate quantification of Ws using the VPM and MVPM. However, this speculation requires further verification.
Overall, this study introduced a novel method for model optimization of GPP estimates by incorporating Kt into the LUE-GPP model. The proposed method could improve GPP estimates even under various weather conditions; nevertheless, optimized accuracy still relies on the ecosystem type, canopy characteristics, and weather conditions. One drawback is that the application of the model on a large scale is flawed, and the improvements in daily scale GPP rely significantly on calculating daily Kt. Remote sensing data on an 8-day time scale will neutralize the influence of different weather conditions on the PAR components and carbon flux during this period. For example, if there are cloudy and sunny days in an 8-day period (which is very common, especially in humid regions), the overestimation and underestimation in the performance of the traditional LUE-GPP model could be offset, resulting in an inaccurate model evaluation.

5. Conclusions

The performances of six big-leaf and one two-leaf LUE-GPP models were evaluated in a humid agroforestry ecosystem for GPP simulations. All the big-leaf LUE-GPP models well tracked the seasonal changes in GPPEC, while the differences in performance owed to the different quantification methods for Ts and Ws and their combination in the models. The EF-LUE model outperformed the other five big-leaf LUE-GPP models due to the more accurate quantification of Ts and Ws. The big-leaf LUE-GPP models overestimated GPP on sunny days and underestimated it on cloudy days. Meanwhile, the two-leaf LUE-GPP model performed better than the big-leaf LUE-GPP models because the former considered the transmission of radiation in the canopy and the differences in the photosynthetic capacity of canopy leaves; however, under/overestimation of the GPP of shaded/sunlit leaves still occurred under different weather conditions in two-leaf LUE-GPP models. The consistent performance and the accuracy of the traditional big-leaf LUE-GPP model and two-leaf LUE-GPP under different weather conditions were improved by constructing Kt-based dynamic LUE with exponential form and power form, respectively. These results showed that LUE-GPP models with constructing Kt-based dynamic LUE have the potential to serve as the basis for optimizing agroecosystem GPP estimates.

Supplementary Materials

The following supporting information can be downloaded at: https://www.mdpi.com/article/10.3390/rs16193679/s1, Figure S1: The location, boundary, and topographic features of the experimental orchard station.

Author Contributions

Funding acquisition, N.C. and S.J.; Methodology, W.Z. and S.J.; Software, M.W.; Validation, L.Z.; Visualization, J.L.; Writing—original draft, Z.H.; Writing—review and editing, N.C., D.G. and S.J. All authors have read and agreed to the published version of the manuscript.

Funding

This work was supported by the National Natural Science Foundation of China (grant numbers 52309055, 52279041, 52179053, and 52109060), the Fundamental Research Funds for the Central Universities (grant number YJ202259), the Sichuan Province Science and Technology Support Program (grant numbers 2022YFQ0028, 2022YFN0021, 2023YFN0024, and 2023YFQ0025), and the Chengdu Municipal Financial Technology Project (grant number 2022-YF05-01008-SN).

Data Availability Statement

The original contributions presented in the study are included in the article/Supplementary Materials, further inquiries can be directed to the corresponding author.

Conflicts of Interest

Ziling He and Ningbo Cui contributed equally to this work. The authors declare no competing financial interests or personal relationships that could have appeared to influence the work reported in this paper.

References

  1. Wellington, M.J.; Kuhnert, P.; Renzullo, L.J.; Lawes, R. Modelling Within-Season Variation in Light Use Efficiency Enhances Productivity Estimates for Cropland. Remote Sens. 2022, 14, 1495. [Google Scholar] [CrossRef]
  2. Liu, H.; Wang, Z.; Wang, Z.; Zeng, Y.; Xue, P.; Zhang, M. Stability of the ecosystem gross primary productivity increasing in Chinese forestry ecological engineering area. Agric. Ecosyst. Environ. 2023, 356, 108636. [Google Scholar] [CrossRef]
  3. Gonsamo, A.; Chen, J.M.; Lombardozzi, D. Global vegetation productivity response to climatic oscillations during the satellite era. Glob. Chang. Biol. 2016, 2, 3414–3426. [Google Scholar] [CrossRef]
  4. Huang, L.X.; Lin, X.F.; Jiang, S.Z.; Liu, M.; Jiang, Y.Z.; Li, Z.L.; Tang, R.L. A two-stage light-use efficiency model for improving gross primary production estimation in agroecosystems. Environ. Res. Lett. 2022, 17, 104021. [Google Scholar] [CrossRef]
  5. Baldocchi, D.; Falge, E.; Gu, L.H.; Olson, R.; Hollinger, D.; Running, S.; Anthoni, P.; Bernhofer, C.; Davis, K.; Evans, R.; et al. FLUXNET: A new tool to study the temporal and spatial variability of ecosystem-scale carbon dioxide, water vapor, and energy flux densities. Bull. Am. Meteorol. Soc. 2001, 82, 2415–2434. [Google Scholar] [CrossRef]
  6. Schmidt, M.; Reichenau, T.G.; Fiener, P.; Schneider, K. The carbon budget of a winter wheat field: An eddy covariance analysis of seasonal and inter-annual variability. Agric. For. Meteorol. 2012, 165, 114–126. [Google Scholar] [CrossRef]
  7. Hu, Z.M.; Shi, H.; Cheng, K.L.; Wang, Y.P.; Piao, S.L.; Li, Y.; Zhang, L.; Xia, J.Y.; Zhou, L.; Yuan, W.P.; et al. Joint structural and physiological control on the interannual variation in productivity in a temperate grassland: A data-model comparison. Glob. Chang. Biol. 2018, 24, 2965–2979. [Google Scholar] [CrossRef]
  8. Piao, S.L.; Sitch, S.; Ciais, P.; Friedlingstein, P.; Peylin, P.; Wang, X.H.; Ahlstrom, A.; Anav, A.; Canadell, J.G.; Cong, N.; et al. Evaluation of terrestrial carbon cycle models for their response to climate variability and to CO2 trends. Glob. Chang. Biol. 2013, 19, 2117–2132. [Google Scholar] [CrossRef] [PubMed]
  9. He, M.Z.; Ju, W.M.; Zhou, Y.L.; Chen, J.M.; He, H.L.; Wang, S.Q.; Wang, H.M.; Guan, D.X.; Yan, J.H.; Li, Y.N.; et al. Development of a two-leaf light use efficiency model for improving the calculation of terrestrial gross primary productivity. Agric. For. Meteorol. 2013, 173, 28–39. [Google Scholar] [CrossRef]
  10. Yan, H.; Wang, S.Q.; Yu, K.L.; Wang, B.; Yu, Q.; Bohrer, G.; Billesbach, D.; Bracho, R.; Rahman, F.; Shugart, H.H. A Novel Diffuse Fraction-Based Two-Leaf Light Use Efficiency Model: An Application Quantifying Photosynthetic Seasonality across 20 AmeriFlux Flux Tower Sites. J. Adv. Model. Earth Syst. 2017, 9, 2317–2332. [Google Scholar] [CrossRef]
  11. Zhang, L.X.; Zhou, D.C.; Fan, J.W.; Hu, Z.M. Comparison of four light use efficiency models for estimating terrestrial gross primary production. Ecol. Model. 2015, 300, 30–39. [Google Scholar] [CrossRef]
  12. Kalfas, J.L.; Xiao, X.M.; Vanegas, D.X.; Verma, S.B.; Suyker, A.E. Modeling gross primary production of irrigated and rain-fed maize using MODIS imagery and CO2 flux tower data. Agric. For. Meteorol. 2011, 151, 1514–1528. [Google Scholar] [CrossRef]
  13. Xiao, X.M.; Zhang, Q.Y.; Braswell, B.; Urbanski, S.; Boles, S.; Wofsy, S.; Berrien, M.; Ojima, D. Modeling gross primary production of temperate deciduous broadleaf forest using satellite images and climate data. Remote Sens. Environ. 2004, 91, 256–270. [Google Scholar] [CrossRef]
  14. Yuan, W.P.; Cai, W.W.; Xia, J.Z.; Chen, J.Q.; Liu, S.G.; Dong, W.J.; Merbold, L.; Law, B.; Arain, A.; Beringer, J.; et al. Global comparison of light use efficiency models for simulating terrestrial vegetation gross primary production based on the La Thuile database. Agric. For. Meteorol. 2014, 192, 108–120. [Google Scholar] [CrossRef]
  15. Chen, T.X.; van der Werf, G.R.; Dolman, A.J.; Groenendijk, M. Evaluation of cropland maximum light use efficiency using eddy flux measurements in North America and Europe. Geophys. Res. Lett. 2011, 38, L14707. [Google Scholar] [CrossRef]
  16. Du, D.; Zheng, C.; Jia, L.; Chen, Q.; Jiang, M.; Hu, G.; Lu, J. Estimation of Global Cropland Gross Primary Production from Satellite Observations by Integrating Water Availability Variable in Light-Use-Efficiency Model. Remote Sens. 2022, 14, 1722. [Google Scholar] [CrossRef]
  17. Yuan, W.; Cai, W.; Nguy-Robertson, A.L.; Fang, H.; Andrew, E.S.; Chen, Y.; Dong, W.; Liu, S.; Zhang, H. Uncertainty in simulating gross primary production of cropland ecosystem from satellite-based models. Agric. For. Meteorol. 2015, 207, 48–57. [Google Scholar] [CrossRef]
  18. Wang, S.Q.; Huang, K.; Yan, H.; Yan, H.M.; Zhou, L.; Wang, H.M.; Zhang, J.H.; Yan, J.H.; Zhao, L.; Wang, Y.F.; et al. Improving the light use efficiency model for simulating terrestrial vegetation gross primary production by the inclusion of diffuse radiation across ecosystems in China. Ecol. Complex. 2015, 23, 1–13. [Google Scholar] [CrossRef]
  19. Xu, H.; Zhang, Z.; Wu, X.; Wan, J. Light use efficiency models incorporating diffuse radiation impacts for simulating terrestrial ecosystem gross primary productivity: A global comparison. Agric. For. Meteorol. 2023, 332, 109376. [Google Scholar] [CrossRef]
  20. Jiang, S.Z.; Zhao, L.; Liang, C.; Cui, N.B.; Gong, D.Z.; Wang, Y.S.; Feng, Y.; Hu, X.T.; Zou, Q.Y. Comparison of satellite-based models for estimating gross primary productivity in agroecosystems. Agric. For. Meteorol. 2021, 297, 108253. [Google Scholar] [CrossRef]
  21. Running, S.W.; Nemani, R.R.; Heinsch, F.A.; Zhao, M.S.; Reeves, M.; Hashimoto, H. A continuous satellite-derived measure of global terrestrial primary production. Bioscience 2004, 54, 547–560. [Google Scholar] [CrossRef]
  22. Wagle, P.; Zhang, Y.G.; Jin, C.; Xiao, X.M. Comparison of solar-induced chlorophyll fluorescence, light-use efficiency, and process-based GPP models in maize. Ecol. Appl. 2016, 26, 1211–1222. [Google Scholar] [CrossRef]
  23. Wagle, P.; Kakani, V.G. Environmental control of daytime net ecosystem exchange of carbon dioxide in switchgrass. Agric. Ecosyst. Environ. 2014, 186, 170–177. [Google Scholar] [CrossRef]
  24. Liu, P.; Tong, X.; Zhang, J.; Meng, P.; Li, J.; Zhang, J.; Zhou, Y. Effect of diffuse fraction on gross primary productivity and light use efficiency in a warm-temperate mixed plantation. Front. Plant Sci. 2022, 13, 966125. [Google Scholar] [CrossRef]
  25. Xu, H.; Zhang, Z.Q.; Chen, J.Q.; Zhu, M.X.; Kang, M.C. Cloudiness regulates gross primary productivity of a poplar plantation under different environmental conditions. Can. J. For. Res. 2017, 47, 648–658. [Google Scholar] [CrossRef]
  26. Knohl, A.; Baldocchi, D.D. Effects of diffuse radiation on canopy gas exchange processes in a forest ecosystem. J. Geophys. Res. Biogeosci. 2008, 113, G02023. [Google Scholar] [CrossRef]
  27. Kanniah, K.D.; Beringer, J.; Hurley, L. Exploring the link between clouds, radiation, and canopy productivity of tropical savannas. Agric. For. Meteorol. 2013, 182, 304–313. [Google Scholar] [CrossRef]
  28. Gao, X.; Gu, F.; Mei, X.; Hao, W.; Li, H.; Gong, D.; Li, X. Light and Water Use Efficiency as Influenced by Clouds and/or Aerosols in a Rainfed Spring Maize Cropland on the Loess Plateau. Crop Sci. 2018, 58, 853–862. [Google Scholar] [CrossRef]
  29. Jiang, S.Z.; Liang, C.; Cui, N.B.; Zhao, L.; Du, T.S.; Hu, X.T.; Feng, Y.; Guan, J.; Feng, Y. Impacts of climatic variables on reference evapotranspiration during growing season in Southwest China. Agric. Water Manag. 2019, 216, 365–378. [Google Scholar] [CrossRef]
  30. Falge, E.; Baldocchi, D.; Olson, R.; Anthoni, P.; Aubinet, M.; Bernhofer, C.; Burba, G.; Ceulemans, G.; Clement, R.; Dolman, H.; et al. Gap filling strategies for long term energy flux data sets. Agric. For. Meteorol. 2001, 107, 71–77. [Google Scholar] [CrossRef]
  31. Reichstein, M.; Falge, E.; Baldocchi, D.; Papale, D.; Aubinet, M.; Berbigier, P.; Bernhofer, C.; Buchmann, N.; Gilmanov, T.; Granier, A.; et al. On the separation of net ecosystem exchange into assimilation and ecosystem respiration: Review and improved algorithm. Glob. Chang. Biol. 2005, 11, 1424–1439. [Google Scholar] [CrossRef]
  32. Maisongrande, P.; Ruimy, A.; Dedieu, G.; Saugier, B. Monitoring seasonal and interannual variations of gross primary productivity, net primary productivity and net ecosystem productivity using a diagnostic model and remotely-sensed data. Tellus B Chem. Phys. Meteorol. 1995, 47, 178–190. [Google Scholar] [CrossRef]
  33. Lloyd, J.; Taylor, J.A. On the temperature-dependence of soil respiration. Funct. Ecol. 1994, 8, 315–323. [Google Scholar] [CrossRef]
  34. Ding, C.; Liu, X.; Huang, F.; Li, Y.; Zou, X. Onset of drying and dormancy in relation to water dynamics of semi-arid grasslands from MODIS NDWI. Agric. For. Meteorol. 2017, 234–235, 22–30. [Google Scholar] [CrossRef]
  35. Yan, H.; Wang, S.; Shugart, H.H. Large latitudinal difference in soil nitrogen limitation on global vegetation response to elevated CO2. Agric. For. Meteorol. 2023, 342, 109717. [Google Scholar] [CrossRef]
  36. Zhang, Z.; Zhou, Y.; Ju, W.; Chen, J.; Xiao, J. Accumulated soil moisture deficit better indicates the effect of soil water stress on light use efficiency of grasslands during drought years. Agric. For. Meteorol. 2023, 329, 109276. [Google Scholar] [CrossRef]
  37. Yuan, W.P.; Liu, S.; Zhou, G.S.; Zhou, G.Y.; Tieszen, L.L.; Baldocchi, D.; Bernhofer, C.; Gholz, H.; Goldstein, A.H.; Goulden, M.L.; et al. Deriving a light use efficiency model from eddy covariance flux data for predicting daily gross primary production across biomes. Agric. For. Meteorol. 2007, 143, 189–207. [Google Scholar] [CrossRef]
  38. Aber, J.D.; Reich, P.B.; Goulden, M.L. Extrapolating leaf CO2 exchange to the canopy: A generalized model of forest photosynthesis compared with measurements by eddy correlation. Oecologia 1996, 106, 257–265. [Google Scholar] [CrossRef] [PubMed]
  39. Yan, H.; Wang, S.Q.; Billesbach, D.; Oechel, W.; Bohrer, G.; Meyers, T.; Martin, T.A.; Matamala, R.; Phillips, R.P.; Rahman, F.; et al. Improved global simulations of gross primary product based on a new definition of water stress factor and a separate treatment of C3 and C4 plants. Ecol. Model. 2015, 297, 42–59. [Google Scholar] [CrossRef]
  40. Zhou, Y.; Wu, X.; Ju, W.; Chen, J.M.; Wang, S.; Wang, H.; Yuan, W.; Black, T.A.; Jassal, R.; Ibrom, A.; et al. Global parameterization and validation of a two-leaf light use efficiency model for predicting gross primary production across FLUXNET sites. J. Geophys. Res.-Biogeosci. 2016, 121, 1045–1072. [Google Scholar] [CrossRef]
  41. Singarayer, J.S.; Ridgwell, A.; Irvine, P. Assessing the benefits of crop albedo bio-geoengineering. Environ. Res. Lett. 2009, 4, 045110. [Google Scholar] [CrossRef]
  42. Chen, J.M.; Liu, J.; Cihlar, J.; Goulden, M.L. Daily canopy photosynthesis model through temporal and spatial scaling for remote sensing applications. Ecol. Model. 1999, 124, 99–119. [Google Scholar] [CrossRef]
  43. Norman, J.M. Simulation of microclimates. In Biometeorology in Integrated Pest Management; Hatfield, J.L., Thomason, I.J., Eds.; Academic Press: New York, NY, USA, 1982; pp. 65–99. [Google Scholar]
  44. Wang, Y.; Zhou, L.; Jia, Q.Y.; Yu, W.Y. Water use efficiency of a rice paddy field in Liaohe Delta, Northeast China. Agric. Water Manag. 2017, 187, 222–231. [Google Scholar] [CrossRef]
  45. Tang, S.; Chen, J.M.; Zhu, Q.; Li, X.; Chen, M.; Sun, R.; Zhou, Y.; Deng, F.; Xie, D. LAI inversion algorithm based on directional reflectance kernels. J. Environ. Manag. 2007, 85, 638–648. [Google Scholar] [CrossRef]
  46. Raczka, B.M.; Davis, K.J.; Huntzinger, D.; Neilson, R.P.; Poulter, B.; Richardson, A.D.; Xiao, J.F.; Baker, I.; Ciais, P.; Keenan, T.F.; et al. Evaluation of continental carbon cycle simulations with North American flux tower observations. Ecol. Monogr. 2013, 83, 531–556. [Google Scholar] [CrossRef]
  47. Campoe, O.; Stape, J.L.; Albaugh, T.J.; A20llen, H.L.; Fox, T.R.; Rubilar, R.A.; Binkley, D. Fertilization and irrigation effects on tree level aboveground net primary production, light interception and light use efficiency in a loblolly pine plantation. Forest Ecol. Manag. 2013, 288, 43–48. [Google Scholar] [CrossRef]
  48. Cai, W.W.; Yuan, W.P.; Liang, S.L.; Liu, S.G.; Dong, W.J.; Chen, Y.; Liu, D.; Zhang, H.C. Large Differences in Terrestrial Vegetation Production Derived from Satellite-Based Light Use Efficiency Models. Remote Sens. 2014, 6, 8945–8965. [Google Scholar] [CrossRef]
  49. Yan, H.; Fu, Y.; Xiao, X.; Huang, H.Q.; He, H.; Ediger, L. Modeling gross primary productivity for winter wheat–maize double cropping system using MODIS time series and CO2 eddy flux tower data. Agric. Ecosyst. Environ. 2009, 129, 391–400. [Google Scholar] [CrossRef]
  50. Kurc, S.A.; Small, E.E. Dynamics of evapotranspiration in semiarid grassland and shrubland ecosystems during the summer monsoon season, central New Mexico. Water Resour. Res. 2004, 40, W09305. [Google Scholar] [CrossRef]
  51. Tong, Y.Q.; Wang, P.; Li, X.Y.; Wang, L.X.; Wu, X.C.; Shi, F.Z.; Bai, Y.; Li, E.G.; Wang, J.Q.; Wang, Y. Seasonality of the transpiration fraction and its controls across typical ecosystems within the Heihe River Basin. J. Geophys. Res. Atmos. 2019, 124, 1277–1291. [Google Scholar] [CrossRef]
  52. Watham, T.; Patel, N.R.; Kushwaha, S.P.S.; Dadhwal, V.K.; Kumar, A.S. Evaluation of remote-sensing-based models of gross primary productivity over Indian sal forest using flux tower and MODIS satellite data. Int. J. Remote Sens. 2017, 38, 5069–5090. [Google Scholar] [CrossRef]
  53. Leuning, R.; Cleugh, H.A.; Zegelin, S.J.; Hughes, D. Carbon and water fluxes over a temperate Eucalyptus forest and a tropical wet/dry savanna in Australia: Measurements and comparison with MODIS remote sensing estimates. Agric. For. Meteorol. 2005, 129, 151–173. [Google Scholar] [CrossRef]
  54. Berry, Z.C.; Goldsmith, G.R. Diffuse light and wetting differentially affect tropical tree leaf photosynthesis. New Phytol. 2020, 225, 143–153. [Google Scholar] [CrossRef]
  55. Alton, P.B.; Ellis, R.; Los, S.O.; North, P.R. Improved global simulations of gross primary product based on a separate and explicit treatment of diffuse and direct sunlight. J. Geophys. Res. Atmos. 2007, 112, D07203. [Google Scholar] [CrossRef]
  56. Reitz, O.; Bogena, H.; Neuwirth, B.; Sanchez-Azofeifa, A.; Graf, A.; Bates, J.; Leuchner, M. Environmental Drivers of Gross Primary Productivity and Light Use Efficiency of a Temperate Spruce Forest. J. Geophys. Res.-Biogeosci. 2023, 128, e2022JG007197. [Google Scholar] [CrossRef]
  57. Bao, S.; Wutzler, T.; Koirala, S.; Cuntz, M.; Ibrom, A.; Besnard, S.; Walther, S.; Sigut, L.; Moreno, A.; Weber, U.; et al. Environment-sensitivity functions for gross primary productivity in light use efficiency models. Agric. For. Meteorol. 2022, 312, 108708. [Google Scholar] [CrossRef]
  58. Williams, C.A.; Reichstein, M.; Buchmann, N.; Baldocchi, D.; Beer, C.; Schwalm, C.; Wohlfahrt, G.; Hasler, N.; Bernhofer, C.; Foken, T.; et al. Climate and vegetation controls on the surface water balance: Synthesis of evapotranspiration measured across a global network of flux towers. Water Resour. Res. 2012, 48, W06523. [Google Scholar] [CrossRef]
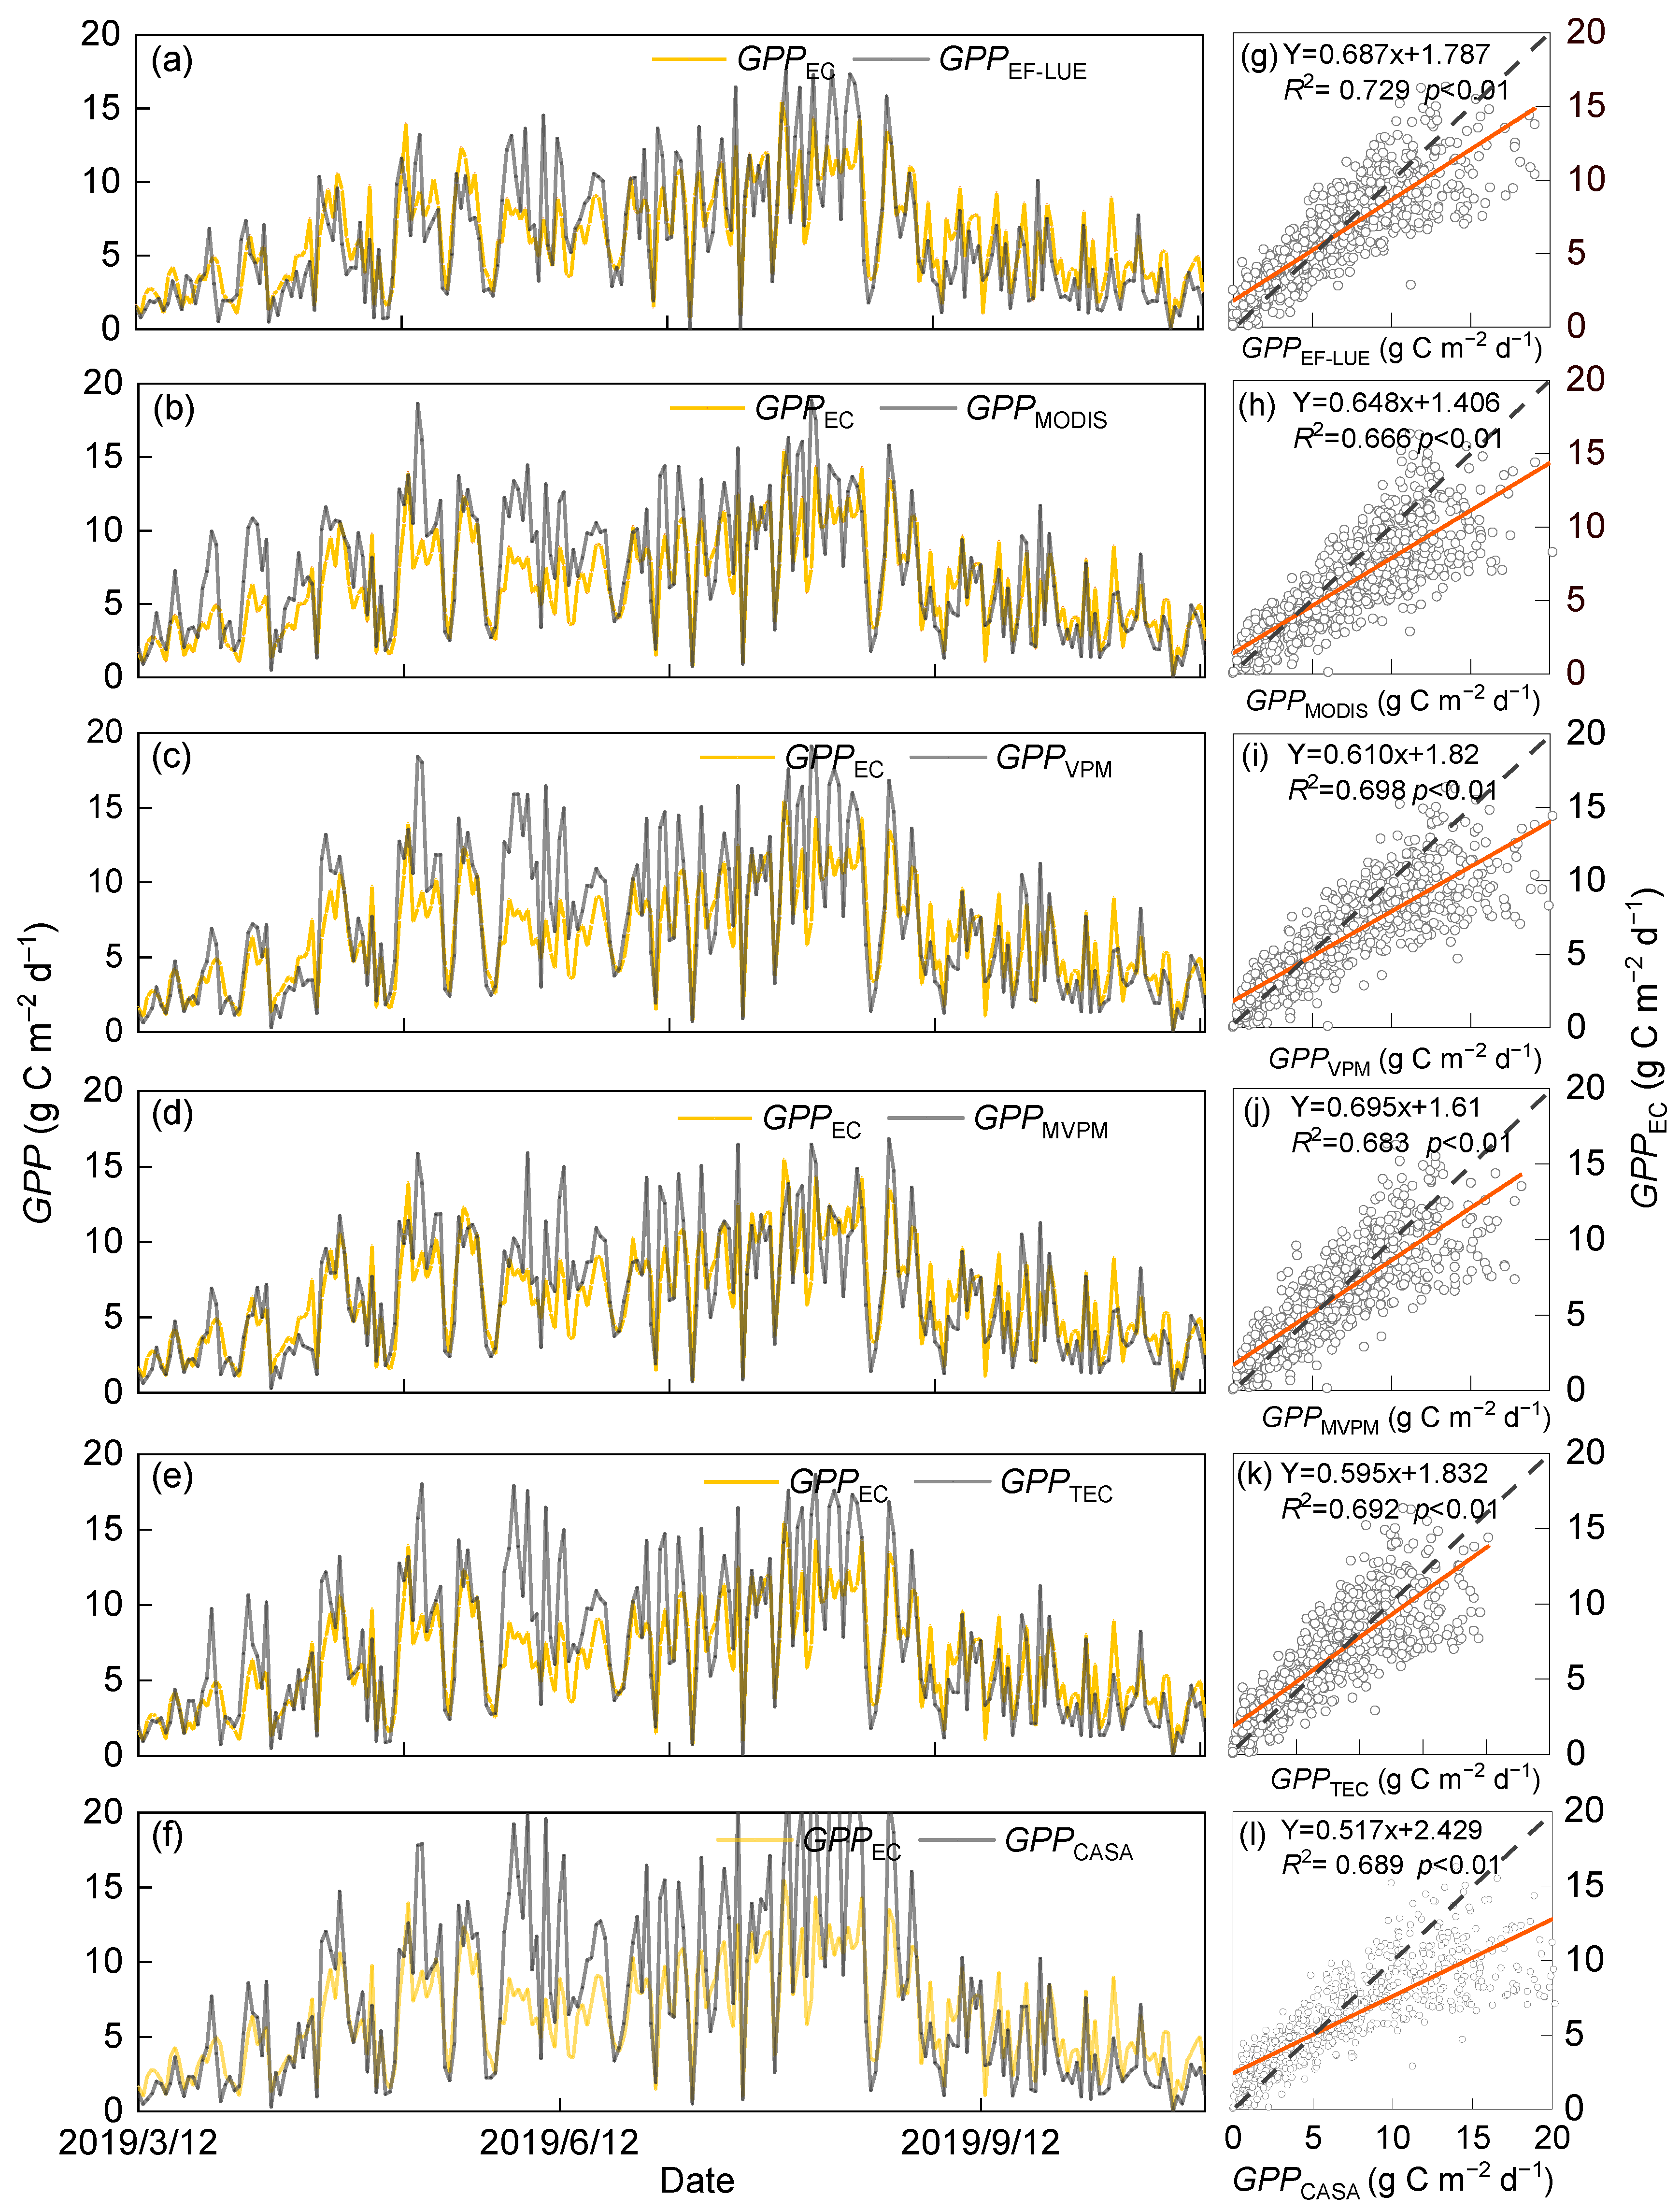
Figure 1. Seasonal variations (left) and the relationships (right) between the gross primary productivity derived from EC measurement (GPPEC) and estimated values by the six big-leaf light use efficiency-based models (EF-LUE in (a,g), MODIS in (b,h), VPM in (c,i), MVPM in (d,j), TEC in (e,k), CASA in (f,l)).
Remotesensing 16 03679 g001
Figure 2. Seasonal variations (a) and the relationship (b) between the gross primary productivity derived from EC measurement (GPPEC) and estimated values by the two-leaf light use efficiency-based models (GPPTL).
Remotesensing 16 03679 g002
Figure 3. The determination coefficients (R2) between gross primary productivity (GPP) derived from the EC system and the simulated GPP without environmental stress (GPPmax), and GPPmax combined with the single temperature stress (Ts) or water stress (Ws) quantified in different big-leaf light use efficiency-based GPP models.
Remotesensing 16 03679 g003
Figure 4. The determination coefficients (R2) between gross primary productivity (GPP) derived from the EC system and the simulated GPP with the integrated stress (Ts and Ws) using the (a) minimum method (Min (Ts, Ws) or (b) multiplication method (Ts × Ws) in different big-leaf light use efficiency-based GPP models.
Remotesensing 16 03679 g004
Figure 5. Relationship between the gross primary productivity (GPP) derived from EC measurement (GPPEC) and estimated by the (a) optimal big-leaf light use efficiency-based GPP model (GPPOBL) and (b) two-leaf LUE-GPP model (GPPTL) under sunny days (Kt ≥ 0.7), moderate days (0.3 < Kt < 0.7), and cloudy days (Kt ≤ 0.3).
Remotesensing 16 03679 g005
Figure 6. The relationship between the gross primary productivity derived from EC measurement (GPPEC) and estimated GPP by the six big-leaf light use efficiency-based GPP model (EF-LUE in (a), MODIS in (b), VPM in (c), MVPM in (d), TEC in (e), and CASA in (f)) under sunny days (Kt ≥ 0.7), moderate days (0.3 < Kt < 0.7), and cloudy days (Kt ≤ 0.3).
Remotesensing 16 03679 g006
Figure 7. Relationship between the gross primary productivity (GPP) derived from the EC measurement (GPPEC) and estimated (a) shade leaves GPP (GPPTL-sh) and (b) sunlit leaves GPP (GPPTL-su) by the two-leaf light use efficiency-based GPP model under sunny days (Kt ≥ 0.7), moderate days (0.3 < Kt < 0.7), and cloudy days (Kt ≤ 0.3).
Remotesensing 16 03679 g007
Figure 8. Seasonal variations of the measured and estimated gross primary productivity (GPP) during 2018–2020 in a humid region orchard ecosystem. GPP was estimated by constructing clearness index-based dynamic LUE with power function and exponential function formulations in big-leaf (GPPOBL-P in (a), GPPOBL-E in (b)), and two-leaf light use efficiency-based GPP model (GPPTL-P in (c), GPPTL-E in (d)), respectively.
Remotesensing 16 03679 g008
Figure 9. Relationship between the gross primary productivity derived from the EC measurement (GPPEC) and the estimated by introducing clearness index (Kt)-based dynamic LUE in optimal big-leaf LUE-GPP model with power function (GPPOBL-P, (a)) and exponential function (GPPOBL-E, (b)) under sunny days (Kt ≥ 0.7), moderate days (0.3 < Kt < 0.7), and cloudy days (Kt ≤ 0.3).
Remotesensing 16 03679 g009
Figure 10. Relationship between the gross primary productivity derived from the EC measurement (GPPEC) and the estimated total (GPPTL-P in (a), GPPTL-E in (b)), shade leaves GPP (GPPTL-P-sh (c), GPPTL-E-sh (d)), and sunlit leaves GPP (GPPTL-P-su in (e), GPPTL-E-su in (f)) by introducing clearness index (Kt)-based dynamic LUE into the two-leaf LUE-GPP model with power function and exponential function under sunny days (Kt ≥ 0.7), moderate days (0.3 < Kt < 0.7), and cloudy days (Kt ≤ 0.3).
Remotesensing 16 03679 g010
Figure 11. The relationship between the clearness index (Kt) and the gross primary productivity derived from EC measurement (GPPEC).
Remotesensing 16 03679 g011
Figure 12. The relationship between clearness index (Kt) and photosynthetic active radiation (PAR), direct PAR (PARdir), and diffuse PAR (PARdif) in the humid region.
Remotesensing 16 03679 g012
Table 1. Model structures and parameters of the seven light use efficiency-based gross primary production (LUE-GPP) models.
ModelModel StructuresRequired ParametersInput Variables
Eddy covariance-light use efficiency model (EC-LUE)PAR × fPAR × εmax × Min (Ts, Ws)εmax, Tmin, Tmax, ToptLAI, PAR, Ta, Rn, LE
Moderate resolution imaging spectroradiometer GPP algorithm (MODIS)PAR × fPAR × εmax × Ts × Wsεmax, Tmin, Topt, TMAXmin VPDmin, VPDmaxLAI, PAR, Ta, VPD
Vegetation photosynthesis model (VPM)PAR × fPAR × εmax × Ts × Ws × Psεmax, Tmin, Tmax, Topt, LSWImaxLAI, PAR, Ta, LSWI
Modified vegetation photosynthesis model (MVPM)PAR × fPAR × εmax × Min (Ts × Ws1 × Ws2)εmax, Tmin, Tmax, Topt, VPDmaxLAI, PAR, Ta, LSWI, VPD
Terrestrial ecosystem carbon flux model (TEC)PAR × fPAR × εmax × Ts × Wsεmax, Tmin, Tmax, Topt,LAI, PAR, Ta, Rn, λ, LE, G, Δ, γ
Carnegie-Ames-Stanford approach (CASA)PAR × fPAR × εmax × Ts1 × Ts2 × Wsεmax, ToptLAI, PAR, Ta, Rn, λ, LE, G, Δ, γ
Two-leaf LUE-GPP model (TL)(PAR × fPAR × εsu-max + PAR × fPAR × εsh-max) × Ts × Wsεsu-max, εsh-max, Tmin, Topt, VPDmin, VPDmaxRa, Rg, Ω, C, LAI, PAR, θ ¯ , Ta, VPD
Table 2. Model structures of big-leaf light use efficiency-based GPP models considering single limitation factor (temperature or moisture) and their combination form.
Model DescriptionModel Structure
Estimated GPP without any environmental constraintsGPPNos = PAR × fPAR × LUEmax
Estimated GPP with Ts onlyGPPTs = PAR × fPAR × LUEmax × Ts
Estimated GPP with Ws onlyGPPWs = PAR × fPAR × LUEmax × Ws
Estimated GPP with the maximum limitation combinationGPPmin(Ts, Ws) = PAR × fPAR × LUEmax × min(Ts, Ws)
Estimated GPP with common limitation combination of Ts and WsGPP(Ts × Ws) =PAR × fPAR × LUEmax × Ts × Ws
Table 3. The fitted parameters of clearness index (Kt)-based dynamic LUE constructed in optimal big-leaf light use efficiency-based GPP (LUE-GPP) model and two-leaf LUE-GPP model.
Optimal Big-Leaf LUE-GPP ModelTwo-Leaf LUE-GPP Model
ParametersPower Function FormExponential FunctionPower Function FormExponential Function
A11.5362.7031.3159.776 × 10−10
B13.010 × 10−9−1.0110.391−1.999
A2 1.4472.9547
B2 3.38 × 10⁻⁶−0.411
Table 4. The compared performances of simulated gross primary productivity (GPP) by six big-leaf light use efficiency-based GPP models (EF-LUE, MODIS, VPM, MVPM, TEC, and CASA) against the GPP derived from the EC measurements by determination coefficients (R2), mean absolute error (MAE), root mean squared errors (RMSE), fixed efficiency index (η), fixed sum index (d1), global performance indicator (GPI), and model ranking during 2018–2020 in a humid region orchard ecosystem.
YearModelsR2MAE
(g C m−2 d−1)
RMSE
(g C m−2 d−1)
ηd1GPIRanking
2018EF-LUE0.7901.3771.8080.5630.7740.8751
MODIS0.7211.5742.0250.5010.739−0.7484
VPM0.7581.4651.9420.5350.7730.2403
MVPM0.7111.5632.0740.5040.739−0.8705
TEC0.7731.4031.8520.5550.7760.6022
CASA0.7422.4413.0380.2260.607−2.0486
2019EF-LUE0.7721.6362.1000.4290.7461.3732
MODIS0.7351.8192.4620.3660.727−0.1925
VPM0.7471.8692.6850.3480.730−0.0624
MVPM0.7591.5112.0830.4730.7641.4511
TEC0.7531.8612.6390.3510.7300.1363
CASA0.7592.1232.5110.2600.665−1.8346
2020EF-LUE0.6801.6902.1990.2490.6871.2621
MODIS0.6151.9572.6450.1300.655−0.1846
VPM0.6261.8952.5410.1580.6560.0623
MVPM0.6011.7262.2070.2330.6610.0662
TEC0.6502.1682.9950.1360.643−0.1455
CASA0.6682.0242.3270.1000.6230.0414
Table 5. Growing season daily average gross primary productivity (GPP, g C m−2 d−1) derived from the EC measurement (GPPEC) and estimated by six big-leaf light use efficiency-based GPP (LUE-GPP) models (EF-LUE, MODIS, VPM, MVPM, TEC, and CASA) and one two-leaf LUE-GPP model.
YearGPPECGPPEF-LUEGPPMODISGPPVPMGPPMVPMGPPTECGPPCASAGPPTL
20186.776.277.036.996.406.997.466.43
20195.885.626.656.545.956.506.805.87
20206.006.097.056.515.797.097.846.28
Table 6. The compared performances of simulated gross primary productivity (GPP) by two-leaf light use efficiency-based GPP models against the GPP derived from the EC measurements by determination coefficients (R2), mean absolute error (MAE), root mean squared errors (RMSE), fixed efficiency index (η), fixed sum index (d1), and global performance indicator (GPI) during 2018–2020 in a humid region orchard ecosystem.
YearR2MAE (g C m−2 d−1)RMSE (g C m−2 d−1)ηd1GPI
20180.7861.3951.8440.5580.7550.601
20190.7331.3291.7510.5370.7581.185
20200.6211.2591.7250.4400.7141.293
Table 7. The difference of root mean squared errors (RMSE, g C m−2 d−1) without and with incorporating clearness index (Kt) into the optimal big-leaf (OBL) and two-leaf LUE-GPP (TL) models in the form of exponential (E) or power functions (P).
Weather ConditionsBLOOBL-POBL-ETLTL-PTL-E
Kt ≤ 0.31.491.631.441.421.491.62
0.3 < Kt < 0.72.802.542.461.952.021.94
Kt ≥ 0.74.473.722.732.102.162.02
ALL2.582.362.141.781.841.83
Disclaimer/Publisher’s Note: The statements, opinions and data contained in all publications are solely those of the individual author(s) and contributor(s) and not of MDPI and/or the editor(s). MDPI and/or the editor(s) disclaim responsibility for any injury to people or property resulting from any ideas, methods, instructions or products referred to in the content.