Abstract
Aiming to solve the challenges of difficult training, mode collapse in current generative adversarial networks (GANs), and the efficiency issue of requiring multiple samples for Denoising Diffusion Probabilistic Models (DDPM), this paper proposes a satellite remote sensing grayscale image colorization method using a denoising GAN. Firstly, a denoising optimization method based on U-ViT for the generator network is introduced to further enhance the model’s generation capability, along with two optimization strategies to significantly reduce the computational burden. Secondly, the discriminator network is optimized by proposing a feature statistical discrimination network, which imposes fewer constraints on the generator network. Finally, grayscale image colorization comparative experiments are conducted on three real satellite remote sensing grayscale image datasets. The results compared with existing typical colorization methods demonstrate that the proposed method can generate color images of higher quality, achieving better performance in both subjective human visual perception and objective metric evaluation. Experiments in building object detection show that the generated color images can improve target detection performance compared to the original grayscale images, demonstrating significant practical value.
1. Introduction
Satellite remote sensing images play a crucial role in disaster monitoring, target detection, military reconnaissance, and other fields [1,2]. Panchromatic and multispectral images are two essential components of satellite remote sensing images, providing information from different spectral bands of the same area. Panchromatic images possess high resolution but are devoid of rich spectral information, while multispectral images comprise spectral information but lack high-resolution spatial details [3]. Due to the limitations of satellite sensors, it is challenging for a single sensor to acquire remote sensing images with both high spatial and spectral resolutions [4]. Traditional approaches typically involve the pan-sharpening processing of panchromatic and multispectral images [5,6] to achieve fused images with high spatial and spectral resolutions. In the future, satellites could be equipped solely with panchromatic sensors without the need for multispectral sensors, which could significantly reduce production costs and operational complexity.
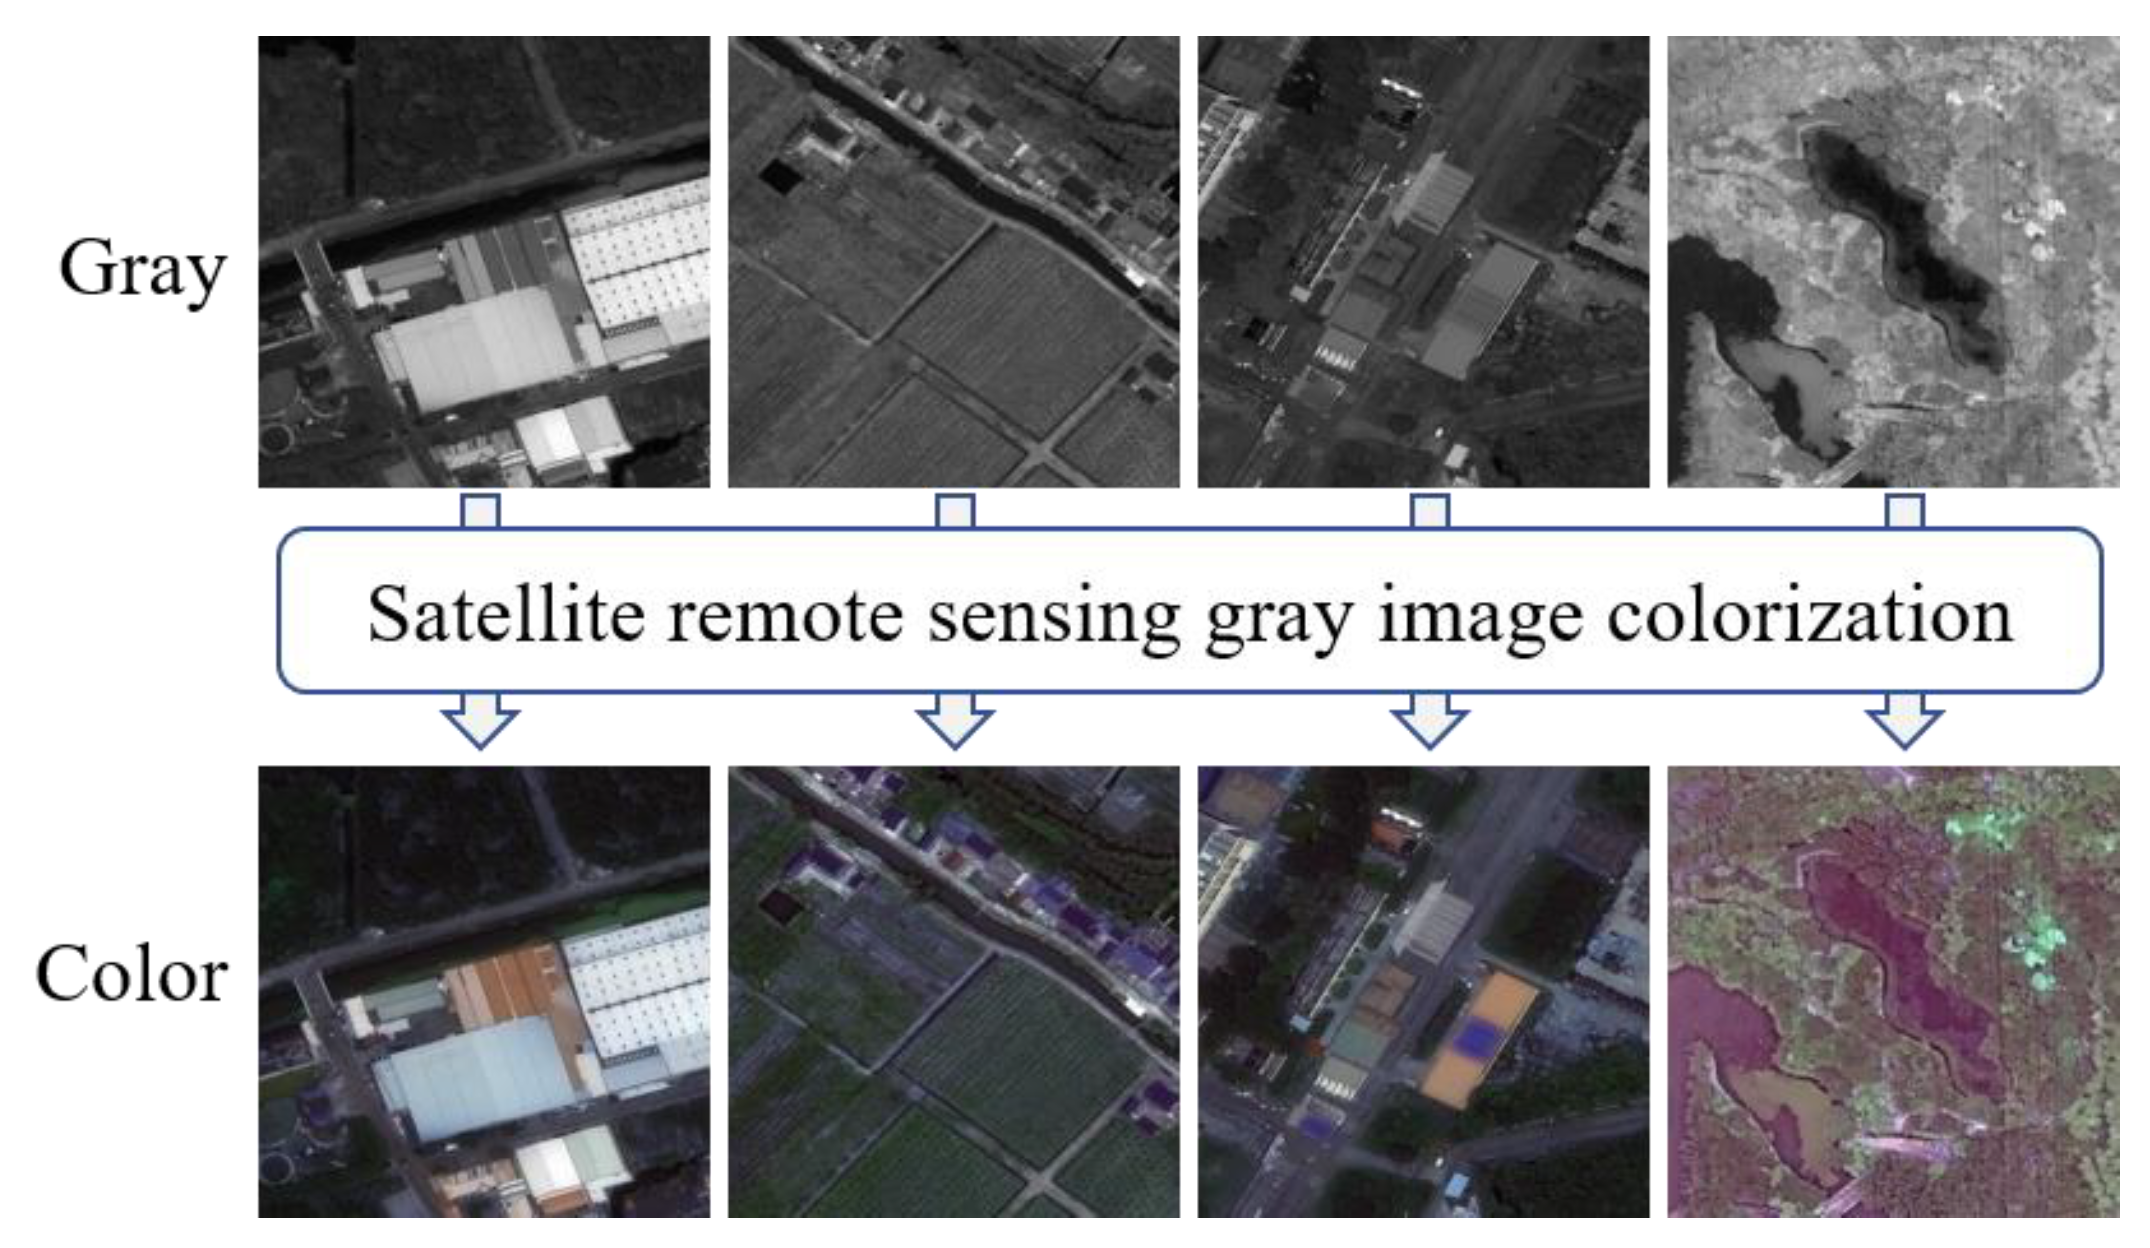
In the field of satellite remote sensing image processing, the colorization of satellite panchromatic images can be considered (as shown in Figure 1) to add spectral information to enhance both spatial and spectral resolutions. The colorization of satellite grayscale images is an important task that can improve the visualization and information representation of satellite grayscale images [7,8]. Colorizing grayscale satellite images is significant for various reasons, including aligning with human visual perception, enhancing image understanding, expanding training data for color images, improving target detection performance, and further broadening the application areas of satellite remote sensing images [9,10].
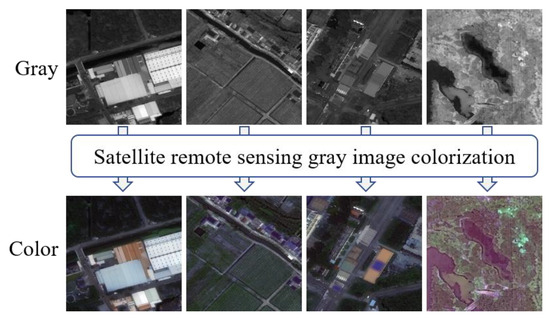
Figure 1.
Satellite remote sensing grayscale image colorization.
Early methods for coloring general natural scene images can be categorized into color transfer-based methods (or example-based methods) [11,12] and scribble-based methods [13]. Color transfer-based methods are limited in generalization as they necessitate a reference image highly similar to the source image. Scribble-based image coloring entails users manually marking some local colors on the target image, with these colors serving as the basis for gradually coloring the entire image. Imperfect manual labeling in scribbling may result in color errors or confusing outcomes.
With the advancement of deep learning methods, image colorization techniques have been extensively researched. Recently, deep generative models, particularly Generative Adversarial Networks (GANs) [14] and their numerous variants [15,16] have shown promising colorization results on general natural scene images.
GANs were introduced by Goodfellow et al. [14] as a class of deep learning models, which consist of a generator network and a discriminator network, both trained in an adversarial framework. The generator is trained to generate new samples by capturing the reference distribution, while the discriminator is trained to differentiate between real and generated fake samples. The probability of belonging to the reference distribution is output by the discriminator, serving as feedback to help the generator improve performance during training. In original GANs setup, a noise vector is used as the input and generates data close to real samples [14]. In the context of image colorization, it is essential to learn the mapping relationship from grayscale to color image. Therefore, grayscale image samples can be utilized instead of noise vectors to adjust the input, preserving spatial information and focusing solely on learning the mapping from grayscale to color image.
An image colorization method based on Conditional Generative Adversarial Networks (CGAN) [15] was proposed by Isola et al. [17], where the generator is designed as a U-Net structure consisting of an encoder, decoder, and skip connections. Additionally, a discriminator is introduced that divides the image into multiple patches, judges each patch, and averages the judgments to determine the authenticity of the entire image, achieving good results on natural scene images. However, satellite remote sensing images are quite different from natural scene images from a spatial structure perspective, with highly unbalanced spatial distributions of objects. In such cases, a single-scale PatchGAN focusing on learning local pixel distributions may exacerbate issues of macro-texture region uncertainty, leading to the generation of abrupt pixels in consistent spaces and making it challenging to ensure color consistency in remote sensing image colorization. The colorization method from Isola et al. [17] was applied to high-resolution image colorization by Nazeri et al. [18], introducing a new loss function that optimizes the network by maximizing the discriminator’s error probability to address the slow convergence issue during network training.
In recent years, multi-scale remote sensing image colorization methods have been the focus of researchers to address color space inconsistency issues. A GAN method with a multi-scale discriminator was proposed by Li et al. [7] to supervise features of different scales in the generator, reducing pathological problems during the colorization process to ensure color consistency in satellite remote sensing image colorization spaces. A multi-scale SEnet GAN model for remote sensing image colorization was introduced by Wu et al. [19], extracting multi-scale features using different-sized convolution kernels and assigning appropriate weights to each channel through squeeze-and-excitation schemes to highlight important information. Subsequently, the remote sensing image colorization task was further transformed from a RGB to YUV color space by Wu et al. [20], improving color effects through multi-scale convolutions to optimize remote sensing colorization results. A joint stream Deep Convolutional Generative Adversarial Network (DCGAN) for colorizing satellite remote sensing grayscale images was proposed by Wang et al. [21], where the network adaptively selects features through gating mechanisms and integrates effective features from two scales. A novel Bidirectional Layout-Semantic-Pixel Joint Decoupling and Embedding Network (BDEnet) was introduced by Nie et al. [22], following human painting principles to generate highly saturated satellite remote sensing color images with strong spatial consistency and object saliency. These methods successfully incorporate GANs into the task of satellite remote sensing grayscale image colorization, effectively addressing color space inconsistency issues by introducing multi-scale feature extraction methods.
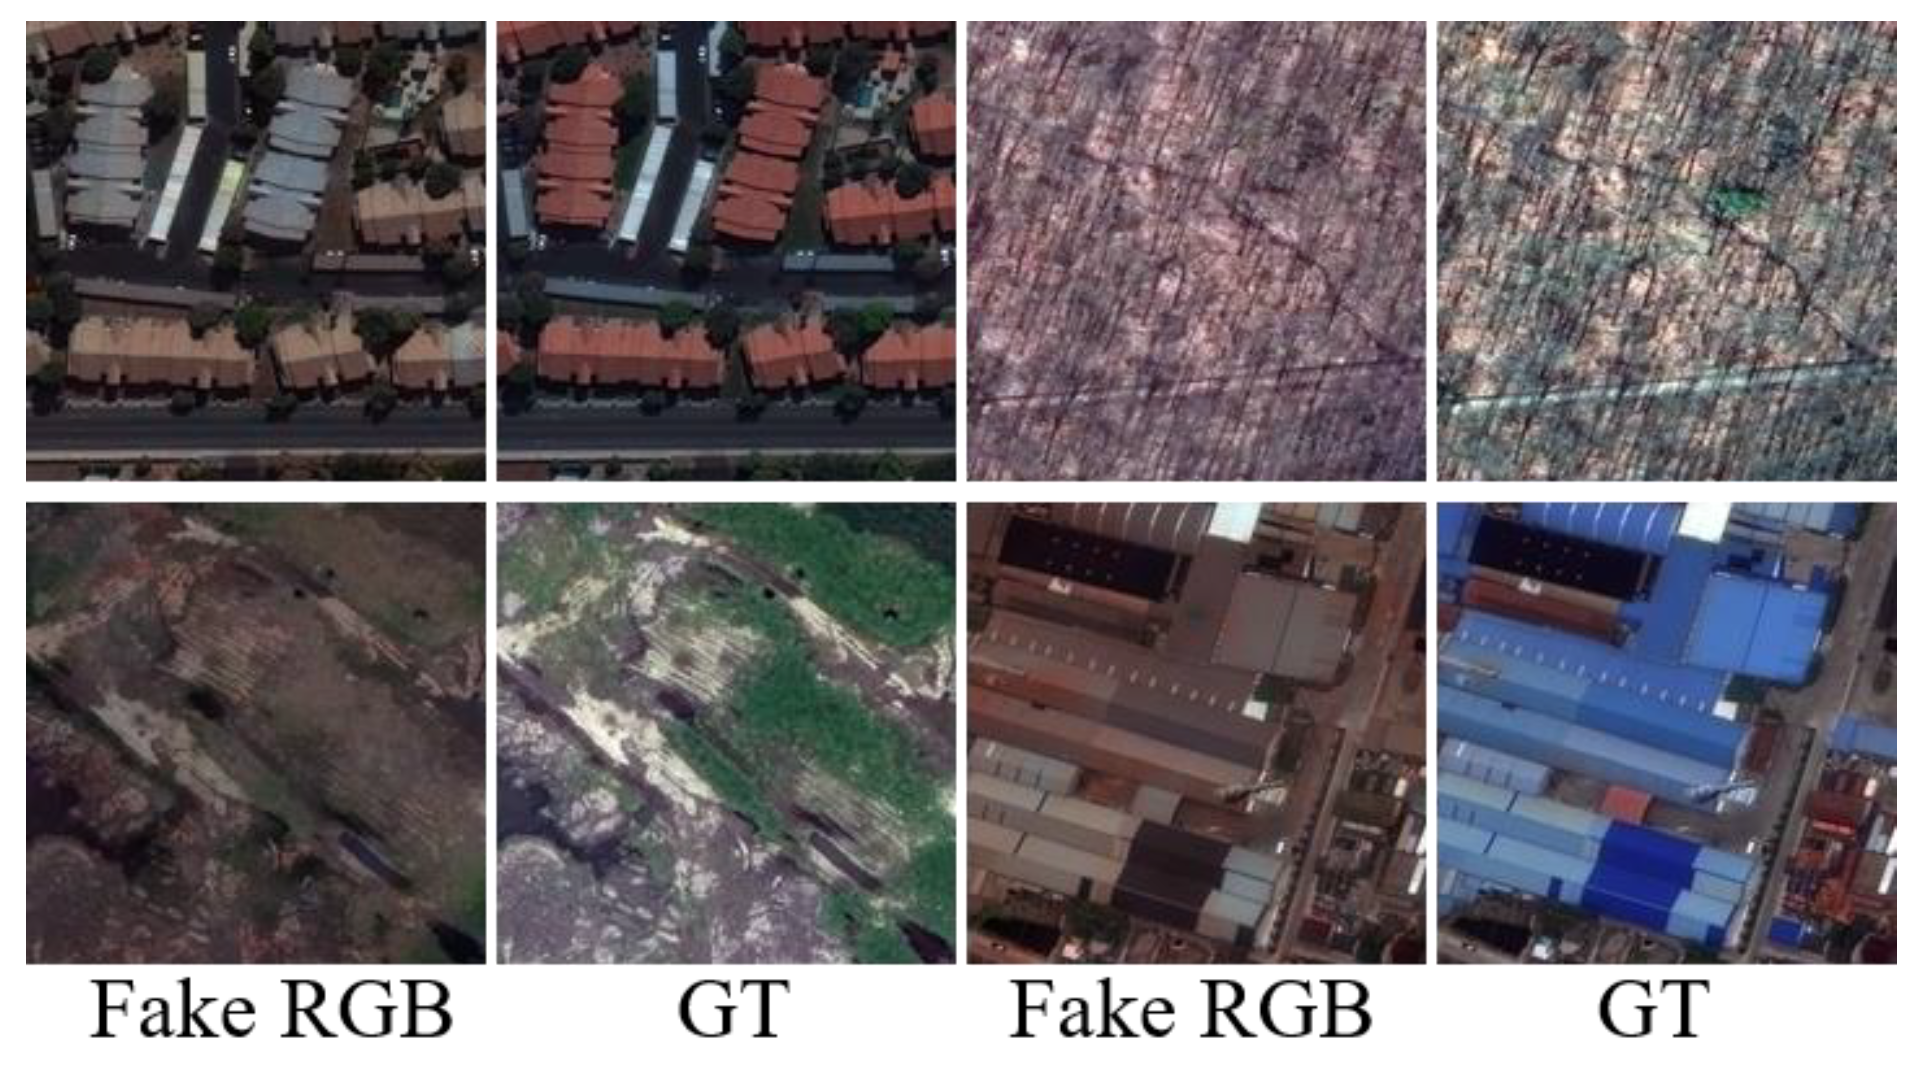
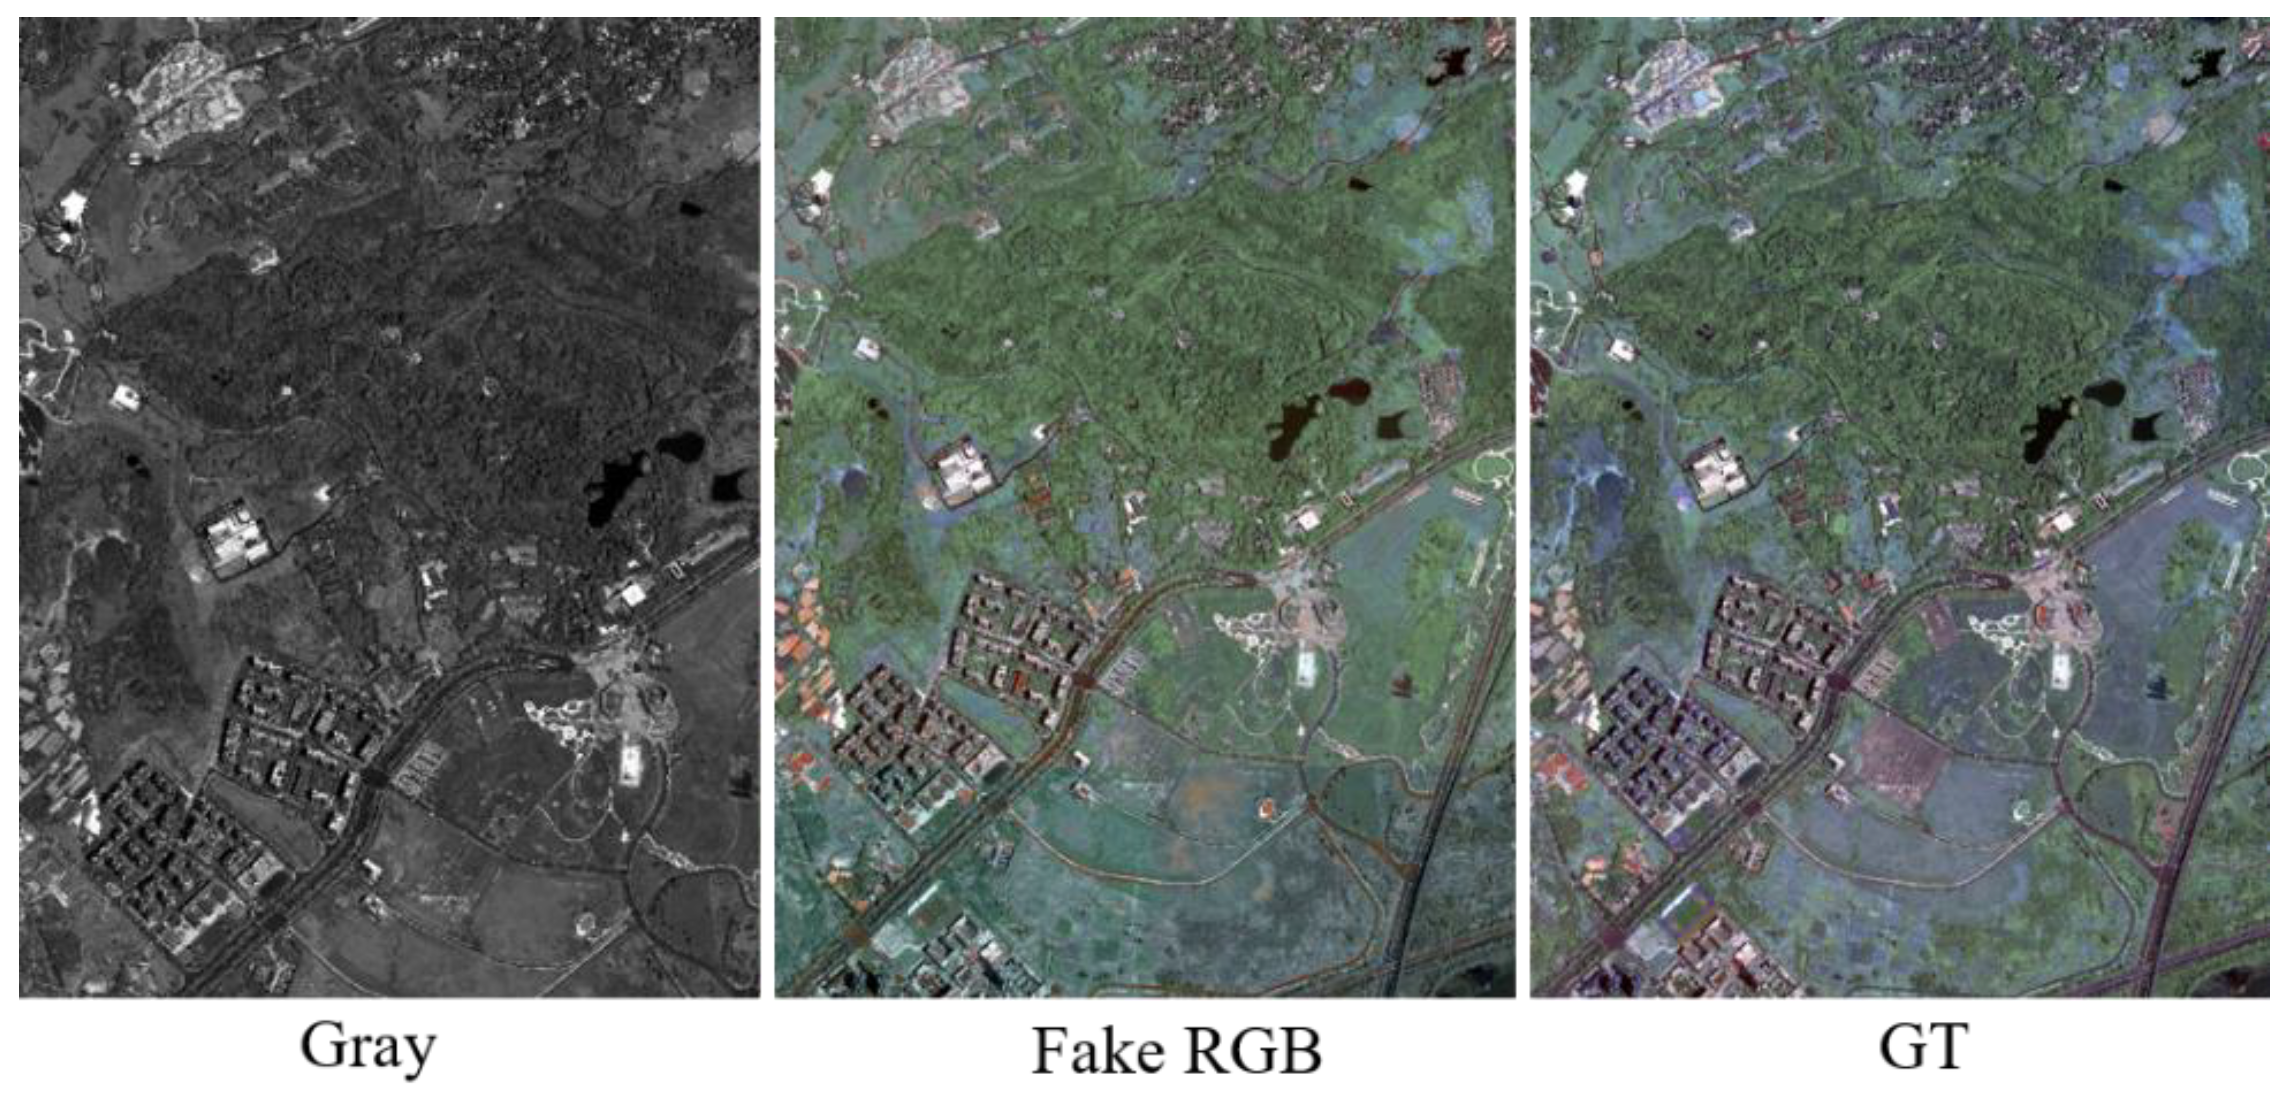
However, network training methods such as GANs have been plagued by issues such as gradient vanishing or exploding, difficulty in training, and mode collapse [23,24], leading to instability in the network model during the training process. Mode collapse is manifested as the network model only learning a part of the target distribution, which leads to a lack of accurate understanding of the overall data distribution during prediction. In such situations, the model’s generalization ability and predictive performance may be reduced, potentially resulting in overfitting or underfitting scenarios [23]. The generator only learns partial modal values of the reference data in such cases, leading to generated color images lacking diversity and exhibiting color deviations from real color images (as shown in Figure 2).
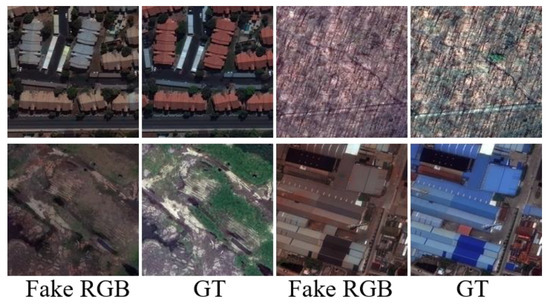
Figure 2.
Grayscale colorization mode collapse issues. The first and third columns represent the generated color images, and the second and fourth columns represent the original true color images.
To address these challenges and issues, extensive research has been conducted by researchers, including weight normalization, introducing Wasserstein distance, and optimizing different divergence metrics to stabilize GAN network training. Specifically, Spectral Normalization (SNGAN) [25] is technique that has been proposed as a weight normalization technique used to stabilize discriminator training. On the other hand, Wasserstein GAN (WGAN) [26] introduces the Wasserstein distance between real and fake distributions as the optimization objective, mitigating the mode collapse problem of the original GAN optimizing Jensen–Shannon divergence. WGAN-GP [27] improves training by enforcing the desired discriminator 1-Lipschitz constraint λ through adding gradient penalty in practice. Least Squares GAN (LSGAN) [28] optimizes the Pearson χ2 divergence between real and fake distributions. By continuously exploring and improving these techniques and methods, researchers have gradually addressed some of the difficulties and challenges in GAN training, but the issue of mode collapse in GAN networks has still not been resolved well.
In recent years, diffusion models have emerged as a mainstream approach for image generation and have been recognized as an effective alternative to GANs in generating high-quality images [29,30]. Markov chains are parametrized in diffusion models to gradually introduce noise to the data until the original distribution is disrupted. During the image generation process, clean, high-quality images are generated through iterative denoising, starting from random Gaussian noise [31]. By training diffusion models using variational lower bounds of the negative log-likelihood, the issue of mode collapse encountered frequently in GANs is circumvented.
A series of studies have been conducted using diffusion models for image-to-image translation. A novel unpaired image-to-image translation method using denoising diffusion probability models was proposed by Sasaki et al. [32], which generates high-quality images without adversarial training and performs significantly better than GAN-based image-to-image translation methods. A unified framework for image-to-image translation based on conditional diffusion models was introduced by Saharia et al. [33], demonstrating superior performance in tasks such as grayscale image colorization compared to powerful GANs. However, to our knowledge, there is no dedicated diffusion model network architecture specifically for colorizing satellite remote sensing grayscale images. Furthermore, during the image generation process, diffusion models typically require thousands of iterations for sampling, significantly impacting the efficiency of image generation. Although some denoising diffusion implicit models (DDIM) [34] have been introduced to effectively reduce the number of sampling iterations, there is still a noticeable gap compared to the single-step mapping of GANs.
The bridging of the gap between GANs and diffusion models has emerged as an important area of current research, with recent studies primarily focused on combining the strengths of both models [35,36,37] to leverage the denoising capabilities of diffusion models within the GAN framework. Attempts have been made to reduce the training cost of the iterative sampling process in diffusion-based models by modeling the denoising distribution as a complex multimodal distribution or making the number of time steps dependent on the data and generator.
This paper introduces a method for colorizing satellite remote sensing grayscale images based on a denoising generative adversarial network, which leverages the advantages of both GANs and denoising diffusion models to fully exploit the high-quality image generation capability of diffusion models while reducing the time consumption of multiple iterations in diffusion models. A novel GAN has been developed where, unlike traditional GAN networks, the generator does not randomly generate images, but instead receives original grayscale images degraded by noise sourced from the discriminator’s discriminant matrix. Furthermore, unlike conventional diffusion models, this approach is not trained using independent time steps but is iteratively adjusted throughout the entire training epoch, thereby enhancing training effectiveness and stability.
Our main contributions are the following:
- (1)
- A novel denoising generative adversarial network model for satellite remote sensing grayscale image colorization is proposed, effectively integrating the advantages of single-step mapping in GANs and the core denoising concept of diffusion models into an efficient grayscale image colorization model. The training instability encountered in GANs is addressed, and potential mode collapse issues during GANs training are avoided through the use of denoising diffusion models.
- (2)
- A denoising optimization method based on U-ViT for the generator network is introduced. By utilizing long skip connections of the U-Net network architecture and the global attention mechanism based on Vision Transformers (ViT), the model’s generation capability is further enhanced, and computational burden is significantly reduced compared to existing U-ViT-based generator networks.
- (3)
- Comparative experiments on grayscale image colorization using three real satellite remote sensing image datasets are conducted, providing intuitive demonstrations of the performance of the proposed network model for grayscale image colorization. Additionally, the denoising generative adversarial network model proposed in this paper is compared with existing colorization models to demonstrate its superiority in qualitative and quantitative evaluations.
2. Methodology
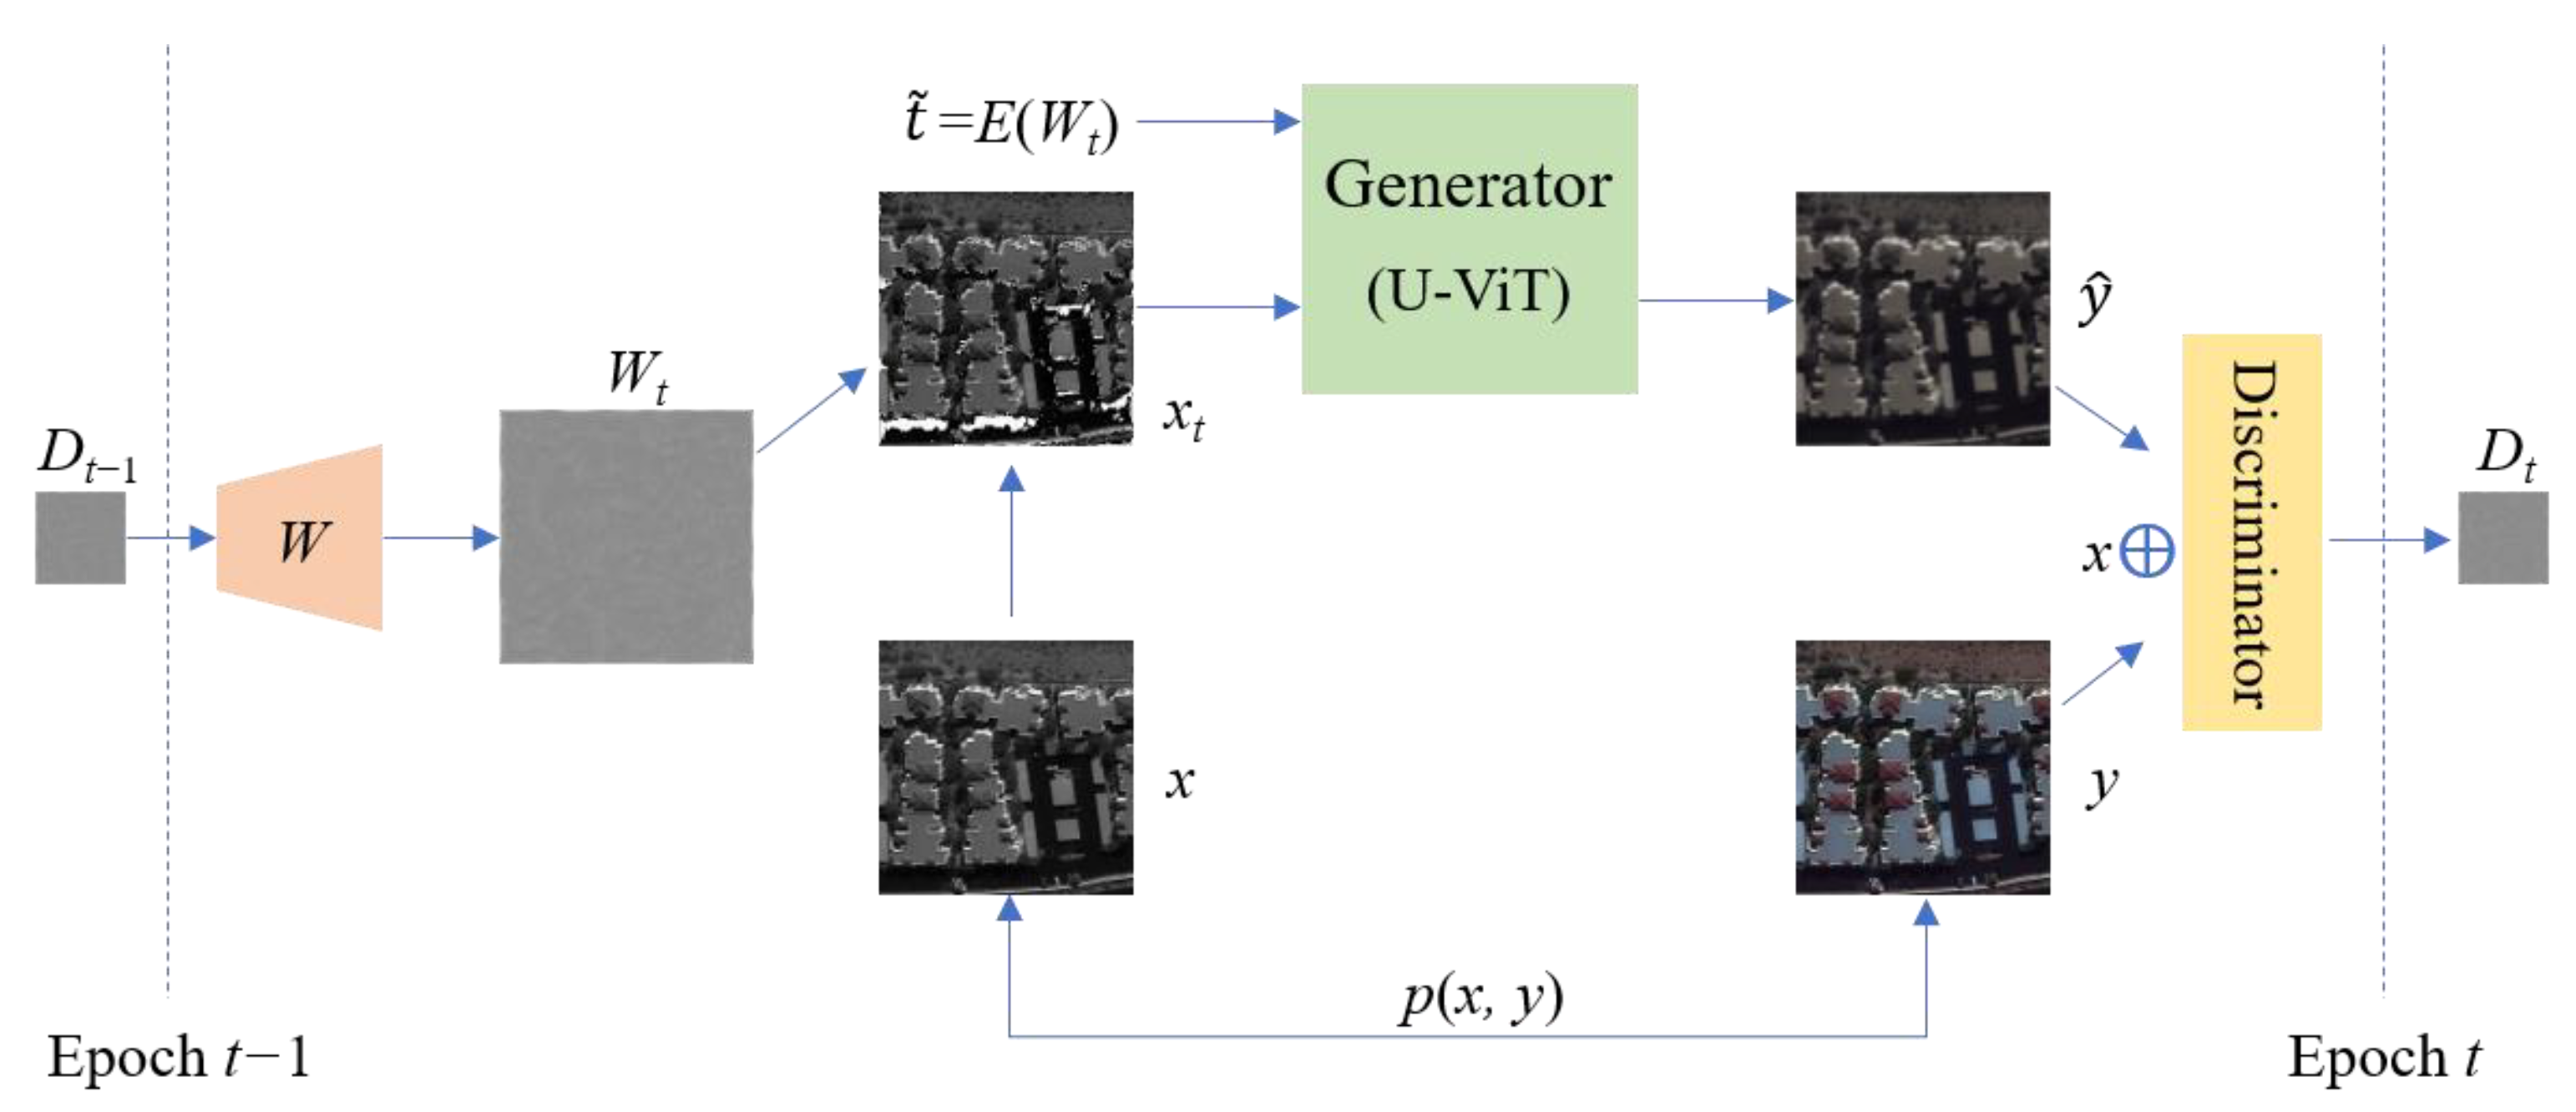
The denoising generative adversarial network model proposed in this paper is an improvement based on the framework of conditional generative adversarial networks (CGAN) [15], with the network structure shown in Figure 3.
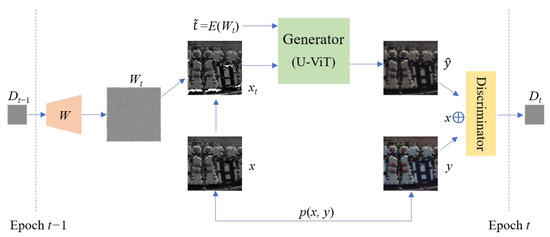
Figure 3.
Architecture of denoising generative adversarial network.
Through the joint distribution of the source domain image (satellite grayscale image) and the target domain image (satellite color image) denoted as p(x, y), at Epoch t, the input source domain image x is combined with the noise image Wt to generate the noisy image xt, where xt = x (1 + Wt). Here, W represents a small-weight initialized neural network, such as Kaiming initialization [38], that transforms the discriminator’s discriminant matrix map Dt−1 from the previous Epoch (t − 1) to Wt. Wt contains content that the generator previously failed to deceive the discriminator with, as well as noise from misjudgments made by the discriminator that have not been fully optimized yet.
The proposed model is composed of a generator network based on an encoder–decoder structure and a feature statistics discriminator network. The noisy source domain satellite remote sensing grayscale image xt is taken as the input by the generator and an improved U-ViT network model is utilized to denoise xt and generate the target domain color image . The objective of the generator is to make the results of the concatenation of x⊕y and x⊕ indistinguishable in the discriminator.
The noise injected into the original satellite remote sensing grayscale image is denoised by the generator through the adversarial learning process. This denoising process unfolds gradually along the timeline of the entire training cycle, unlike typical diffusion models that require independent timelines within a cycle.
During the training iteration process, epochs index the time step t, but the time set in the generator needs to align with the discriminator’s entropy state. The time position in the denoising process can be estimated by the following equation:
where E denotes the expected value of Wt.
2.1. Generator Network
The noisy original satellite remote sensing grayscale image and the time are taken as the input by the generator network, which utilizes an improved U-ViT backbone network to denoise it and generate the corresponding satellite remote sensing color image, as shown in Figure 4.

Figure 4.
U-ViT network architecture.
During the task of satellite grayscale image colorization, the local features of satellite grayscale images and color images do not intuitively correspond, and the pixel distribution of the images is often more dispersed and irregular. ViT can better capture global image information and long-distance dependencies, helping to improve the performance and generalization ability of the network model. Additionally, ViT has better interpretability and visualization capabilities, which aid in understanding the model’s decision-making process. The self-attention module of ViT can globally focus on information, making it more conducive to learning the mapping relationship between satellite grayscale images and color images.
U-ViT [39,40] is a simple and universal backbone network based on ViT that incorporates the idea of the U-Net network architecture. U-ViT follows the core idea of ViT, dividing the input noisy image xt into small blocks, flattening them as tokens, and combining them with the time step . U-ViT uses self-attention instead of convolution for information extraction. However, the computational complexity of self-attention in ViT is quadratically related to the input feature resolution, limiting its application due to the huge computational burden.
The Transformer Block, as the most critical part of ViT, is also the source of computational burden in ViT. To address the computational time consumption issue of ViT, this paper optimizes by adopting two strategies: using Cross-Covariance Attention (XCA) [41] and constructing a Gated Linear Unit Feed Forward Network (GLUFFN) [42] to build the Transformer Block, significantly reducing the network’s computational burden and enhancing its nonlinear representation capacity. The network structure, as shown in Figure 5, includes two normalization layers (Norm), cross-covariance attention, and a gated feed-forward layer. The ⊕ symbol represents a residual connection to prevent network degradation.

Figure 5.
Transformer Block network architecture.
XCA, an attention mechanism that utilizes cross-covariance matrices to enhance traditional attention mechanisms, is integrated into the Vision Transformer (ViT). Within ViT, the conventional self-attention mechanism is replaced by XCA, which computes cross-covariance between image blocks to capture correlations among different regions in the image. This innovative approach helps the ViT model in better understanding the global structure and local details of the image, thereby improving its feature extraction and modeling capabilities. Compared to traditional self-attention mechanisms, the application of cross-covariance attention in ViT can enhance the model’s convergence speed, accuracy, and generalization capabilities, making it more suitable for processing large-scale image datasets. By reducing the computational complexity of the attention mechanism from to , images are effectively processed.
The XCA mechanism operates by linearly transforming the input x of shape (N, d), where N is the number of tokens and d is the number of channels, to obtain the Query vector (Q), Key vector (K), and Value vector (V). Subsequently, by calculating the attention feature map using Q and K and multiplying it with V, the cross-covariance attention is derived. The calculation formula is defined as follows:
where represents the transpose of , Softmax is the activation function, and τ is a learnable parameter. Prior to computing cross-covariance attention, normalization is applied to Q and K to enhance training stability, but may limit feature representation. To address this, a learnable parameter τ is introduced to dynamically adjust and control the attention weights’ range and distribution, mitigating the constraints imposed by normalization on important features.
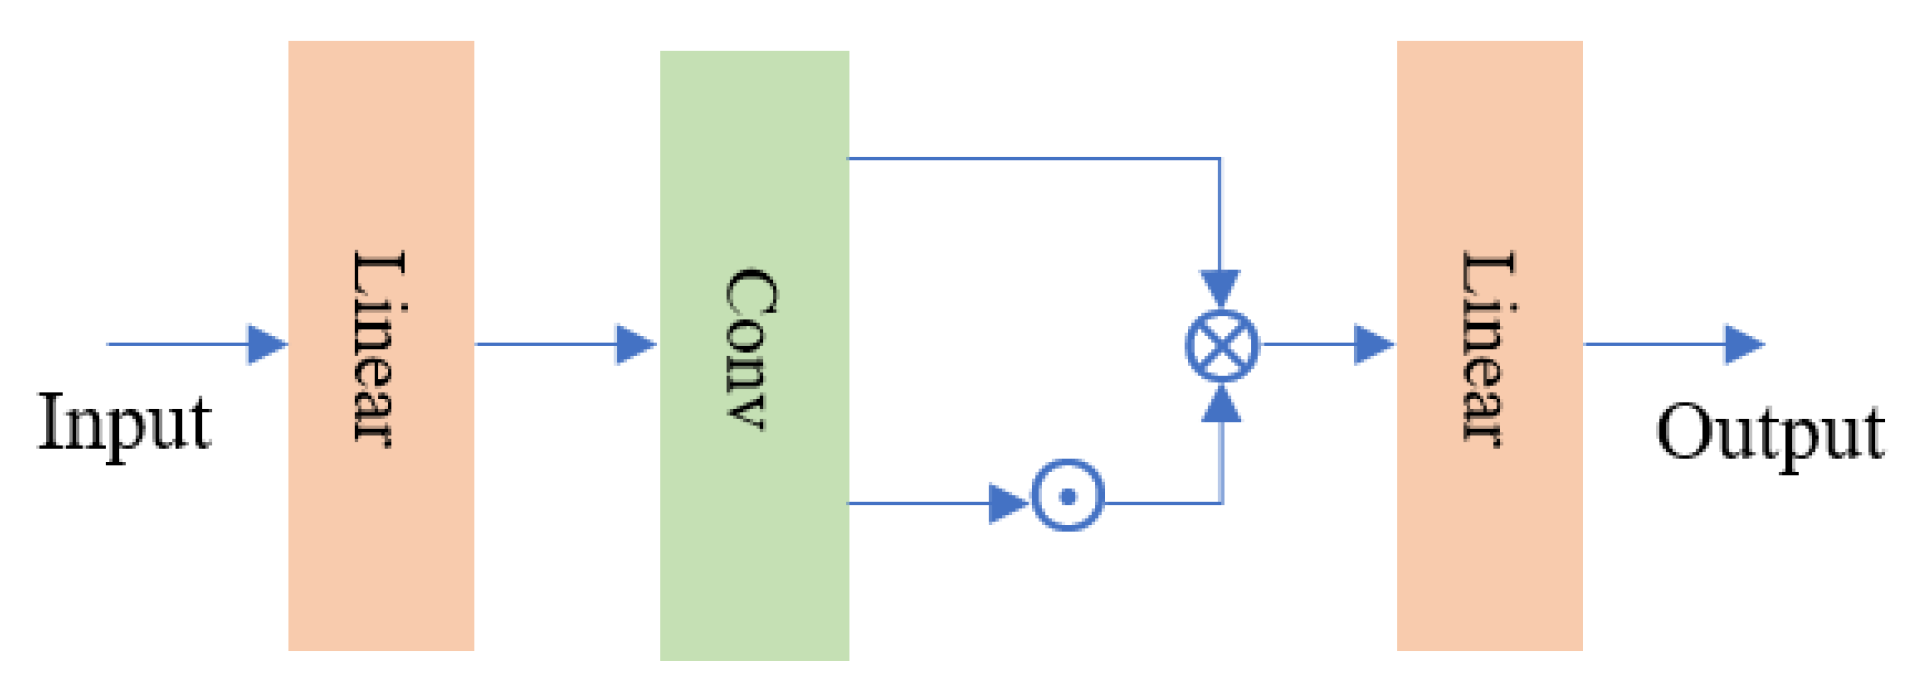
The GLUFFN is a neural network structure where each neuron is composed of Gated Linear Units that control information flow. By modulating information transfer between neurons through this gating mechanism, GLUFFN enhances the network’s learning and representation capabilities, making it more adaptable and flexible to different data types. The gating mechanism selectively activates or suppresses input signals, thereby improving the nonlinear representation capacity of the feed-forward layer. The gating mechanism is defined by the following formula:
where x is the input, are the learnable parameters, σ(.) represents the gelu activation function, and ⊗ denotes the Hadamard product.
The architecture of the feed-forward network with the introduction of the gating mechanism is illustrated in Figure 6, where Linear denotes a linear layer, Conv represents a convolutional layer with a kernel size of 3 × 3 and a stride of 1, ⊙ denotes the gelu activation, and ⊗ denotes the Hadamard product. The input passes through a linear layer and a convolutional layer before splitting into two paths. After passing through the gelu activation function and undergoing the Hadamard product, the outputs are combined and processed through a linear layer for the final output.
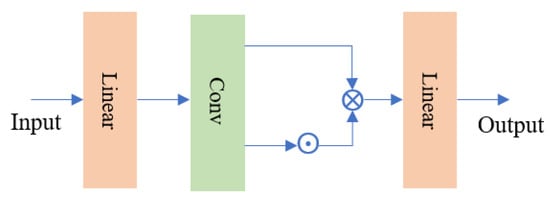
Figure 6.
GLUFFN architecture.
Furthermore, U-ViT adopts the U-Net structure, incorporating skip connections between low and deep layers to better capture features at different levels. Low-level features are crucial for pixel-level predictions in the model, and using skip connections can better leverage these low-level features, simplifying the training of the noise estimation network. By employing similar skip connections, a convenient way is provided for utilizing low-level features, with the connection being represented as , where is a linear layer, denotes dimension concatenation, and represent embeddings from the main and skip branches, respectively.
2.2. Discriminator Network
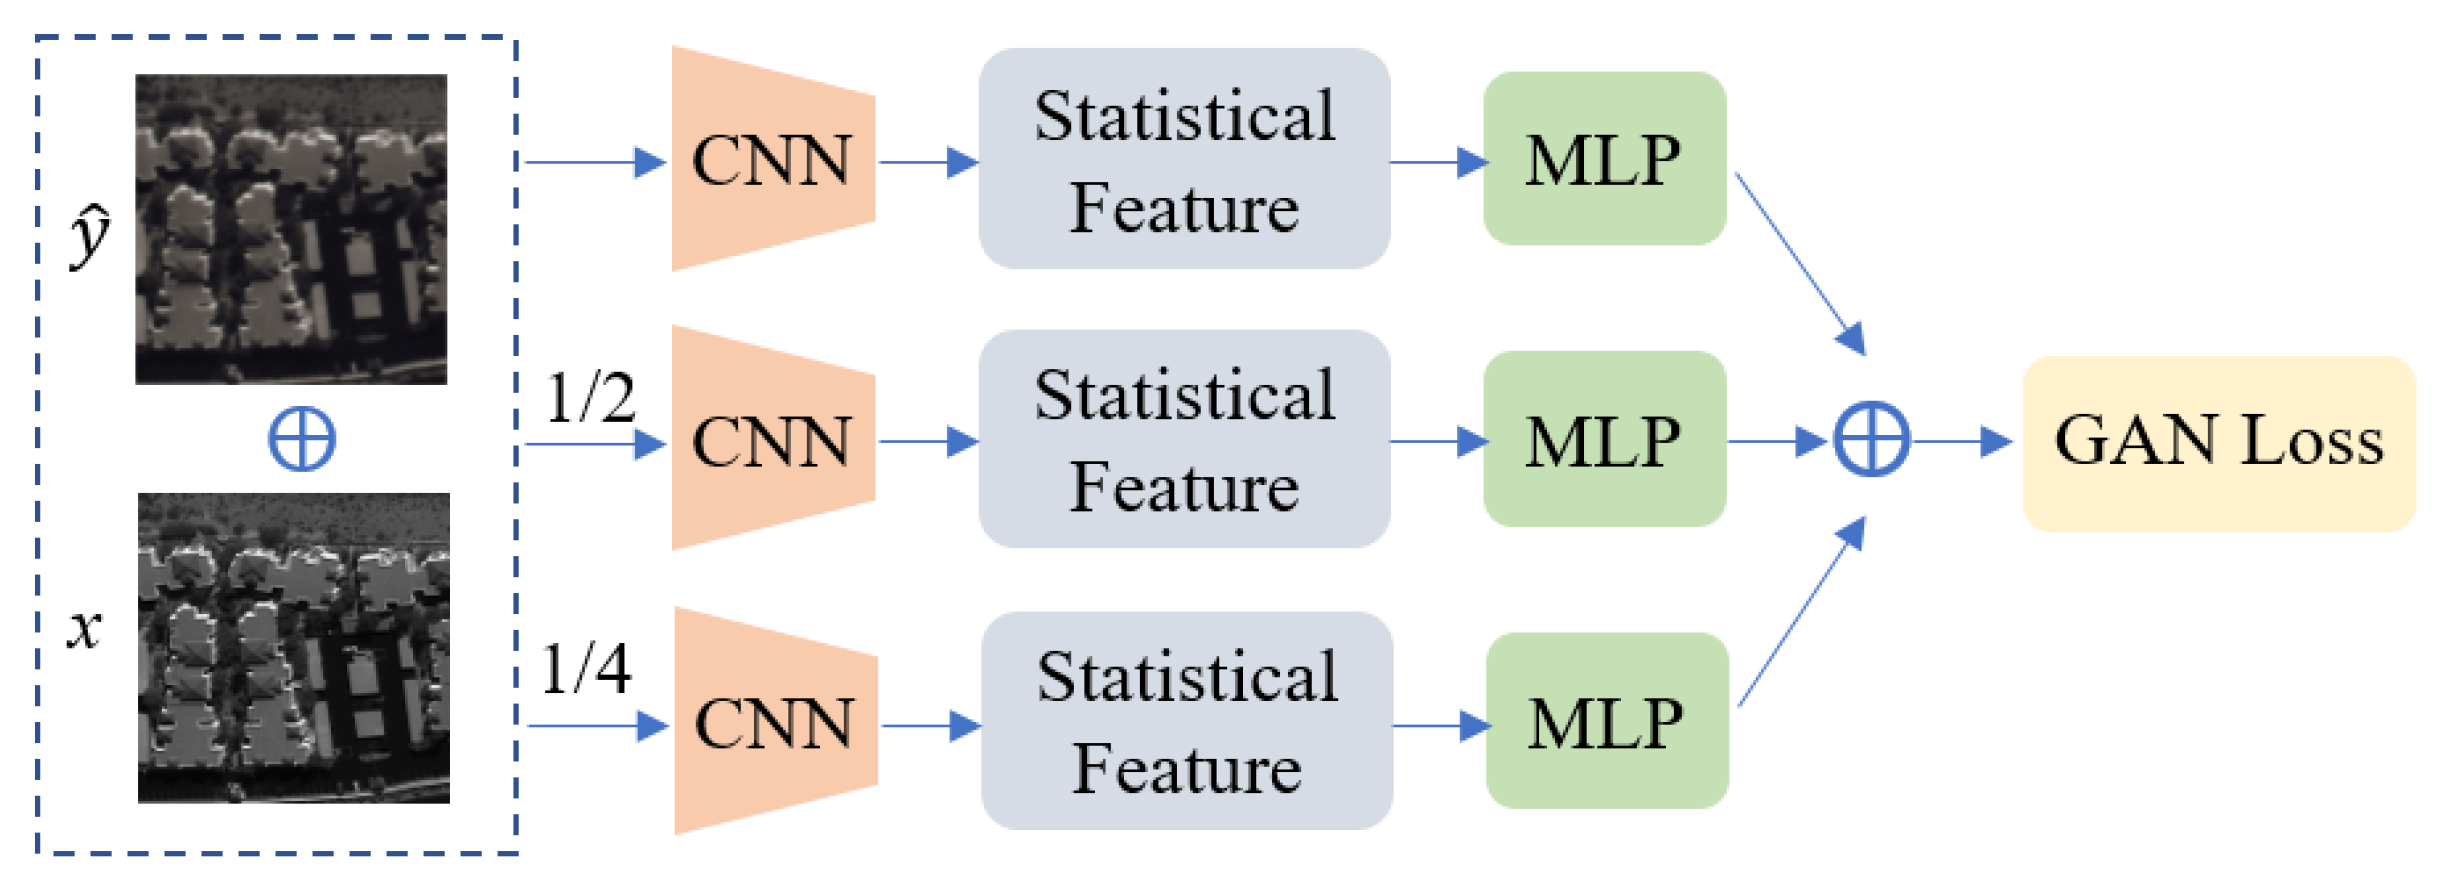
The discriminator network was optimized based on the commonly used PatchGAN structure, and a feature statistic discriminator network was proposed to convert attention to image receptive field features into image feature information statistics, achieving fewer constraints on the generator network. The statistic feature network consists of a feature extraction layer convolutional neural network (CNN), a feature calculation component, and a linear layer multilayer perceptron (MLP), with the image’s feature statistics serving as the supervisory adversarial loss. The architecture of the discriminator network is illustrated in Figure 7.
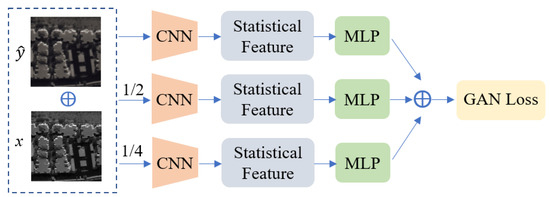
Figure 7.
Discriminator network architecture.
Specifically, the adversarial network downsamples the image through average pooling and performs feature extraction using convolutional layers with the same structure at three different scales of the image. Subsequently, statistical feature computation is carried out, and the losses obtained from linear layers are summed to derive the total loss.
2.3. Loss Function
In order to enhance the similarity between the generated satellite remote sensing color images and the original color images and encourage the generated fake color images to align with human visual perception, an optimized objective function was designed. The GAN framework comprises a generator and a discriminator, where the former is responsible for color information restoration, and the latter distinguishes between real and generated fake color images. The generator aims to make the discriminator unable to differentiate between real and generated images, minimizing the discriminator’s correct prediction probability, while the discriminator aims to maximize the correct differentiation probability between original and generated images.
In this paper, L1 loss and GAN loss were employed to generate high-quality color images, with the overall loss function represented as follows:
where denotes the total loss, represents the conditional generative adversarial network loss, and denotes the L1 loss. represents the expected value, the subscript x represents the original satellite remote sensing grayscale image and the subscript y represents the original satellite remote sensing color image, λ represents the weight of the L1 loss typically set to 100 based on empirical evidence, indicates the probability that the discriminator judges whether the real data are real, represents the generator producing the color image based on the original grayscale image x, and signifies the probability that the discriminator judges whether the generated data are real.
3. Experiments and Results
In this section, the experimental datasets, evaluation metrics, and comparison methods used in the experiments are described, along with important implementation details. Furthermore, the proposed method is validated through qualitative and quantitative metrics in comparative and ablation experiments, and experimental analysis is conducted based on the results and visual effects.
3.1. Experimental Datasets
Three real satellite remote sensing image datasets were utilized for validation in this paper: (1) the SpaceNet dataset of Shanghai; (2) the SpaceNet dataset of six global cities; and (3) the BJ3N dataset of 12 cities in China captured using the Beijing-3 N1 and N2 satellites.
The SpaceNet dataset comprises images captured using the WorldView-3 satellite for tasks such as building and road detection and extraction. It includes four different types of images, with this paper focusing on panchromatic images and Pan-sharpened RGB images.
Dataset A: The Shanghai SpaceNet dataset consists of 4582 satellite remote sensing image patches with a ground sampling distance of 0.3 m. Each image is sized at 650 × 650, with 80% randomly selected for training and the rest split equally for validation and testing.
Dataset B: This is also obtained from the SpaceNet dataset and includes a wider range of cities and a larger dataset overall, encompassing six global cities such as Las Vegas, Paris, Khartoum, Moscow, Mumbai, and San Juan. The dataset consists of 6681 satellite image patches with a ground sampling distance of 0.3 m, where each image measures 1300 × 1300 pixels and is cropped into sub-images of 512 × 512 pixels. Similar to dataset A, 80% of the images are randomly selected for training, while the remaining 20% are designated for validation and testing.
Dataset C: Utilizing satellite remote sensing image data from 12 cities in China captured using the Beijing-3 N1 and N2 satellites, the Pan-sharpened images were processed to retain only the R, G, B channels, resulting in paired panchromatic and Pan-sharpened RGB images. This dataset comprises 24 satellite remote sensing images with a ground sampling distance of 0.5 m and image sizes of approximately 23,467 × 41,440, cropped into 512 × 512 sub-images. In total, 80% of the data are randomly selected for training, with 10% each allocated for validation and testing.
3.2. Evaluation Metrics
The objective of this paper is to colorize the satellite remote sensing grayscale images, aiming for the generated fake color images to closely resemble real color images. The similarity between the generated fake color images and real color images is assessed both qualitatively and quantitatively. To objectively evaluate the performance of the colorization networks on different satellite datasets, Peak Signal-to-Noise Ratio (PSNR), Structural Similarity Index (SSIM), Fréchet Inception Distance (FID), and Learned Perceptual Image Patch Similarity (LPIPS) metrics are employed for quantitative analysis.
PSNR is one of the most commonly used and widely applied image quality assessment metrics, which is calculated based on the errors between corresponding pixels in the color image and the original image, indicating that image quality assessment is error-sensitive. The value is inversely proportional to the distortion effect of the image, with higher PSNR usually indicating better color quality. The formula is as follows:
where represents the maximum pixel value of the image. MSE represents the mean squared error between images x and y.
SSIM evaluates the structural similarity between images from the perspective of structure composition, based on the attributes of brightness, contrast, and structure. SSIM describes the similarity between the generated image and the original image, with a larger SSIM indicating higher similarity. The calculation is as follows:
where and represent the mean and variance of the original grayscale image x, and and represent the mean and variance of the generated color image y, is the covariance between the original grayscale image x and the generated color image y, and and are constants to stabilize the calculation. When the value is closer to 1, it means the two images are more similar.
FID is a measure of the distance between the distribution of generated images and real images. It first extracts features using the Inception network, then models the feature space using a Gaussian model, and finally calculates the distance between the two features. A lower FID implies higher image quality and diversity. The formula is as follows:
where , , , and represent the mean and covariance matrices of the image features. represents the trace of a matrix.
LPIPS is a metric used to assess the perceptual similarity between images. Unlike traditional metrics such as PSNR and SSIM, which primarily focus on pixel-level differences, LPIPS aims to align more closely with human visual perception. The formula is as follows:
where denotes different layers in the network (e.g., convolutional layers), and are the feature maps of images and at layer , is the number of elements in the feature map at layer , and represents the L2 norm (Euclidean distance).
3.3. Experimental Details
All of our training and inference experiments were conducted on a GPU device with 24 GB of VRAM, using the PyTorch deep learning framework. The network input was the preprocessed 512 × 512 single-channel grayscale images, and the output was RGB three-channel color images. The batch size was set to 8, and the Adam optimizer with β1 and β2 was set to 0.5 and 0.999, respectively, and a learning rate of 2 × 10⁻⁴ was used. The models were trained for 200 epochs to ensure convergence. The trained model parameters were used for validation and testing, with the best results from testing being taken as the final experimental data.
In addition, the L1 loss and GAN loss play important roles in the network training in this paper. The weight coefficient λ was set for the L1 loss to coordinate the L1 loss and GAN loss. Setting the L1 loss too large would cause the adversarial network to not work effectively, resulting in generated images lacking texture information. Not adding L1 loss or setting L1 loss too small would make the network difficult to train. Based on empirical knowledge, this paper sets λ to 100.
3.4. Comparative Network Models
Pix2Pix [17]: A milestone method that applies GAN to image-to-image translation. Pix2Pix was the first to use conditional GAN (cGAN) and treated the original grayscale image as the input condition to guide the coloring process.
Palette [33]: A specialized tool for colorization tasks, based on diffusion models, that enhances the process of transforming grayscale images into color images.
RSI-Net [8]: An advanced method designed for the simultaneous colorization and super-resolution of remote sensing images. This paper focuses specifically on its colorization capabilities, omitting the super-resolution aspect to highlight its effectiveness in enhancing the colorization of grayscale remote sensing images.
BDEnet [22]: A novel method for coloring remote sensing images that utilizes a bidirectional layout-semantic-pixel joint decoupling and embedding network, aimed at producing highly saturated color images with strong spatial consistency and enhanced object prominence.
The recommended parameters for each network model, as described in their respective papers, were set, and after multiple rounds of training, the optimal test results were selected. The experimental results were then compared using the same set of images.
3.5. Comparative Experiments
To validate the superiority of our method, experiments were conducted on the three true satellite remote sensing image datasets mentioned earlier, comparing our method with the aforementioned Pix2Pix, Palette, RSI-Net, and BDEnet methods.
3.5.1. Qualitative Analysis
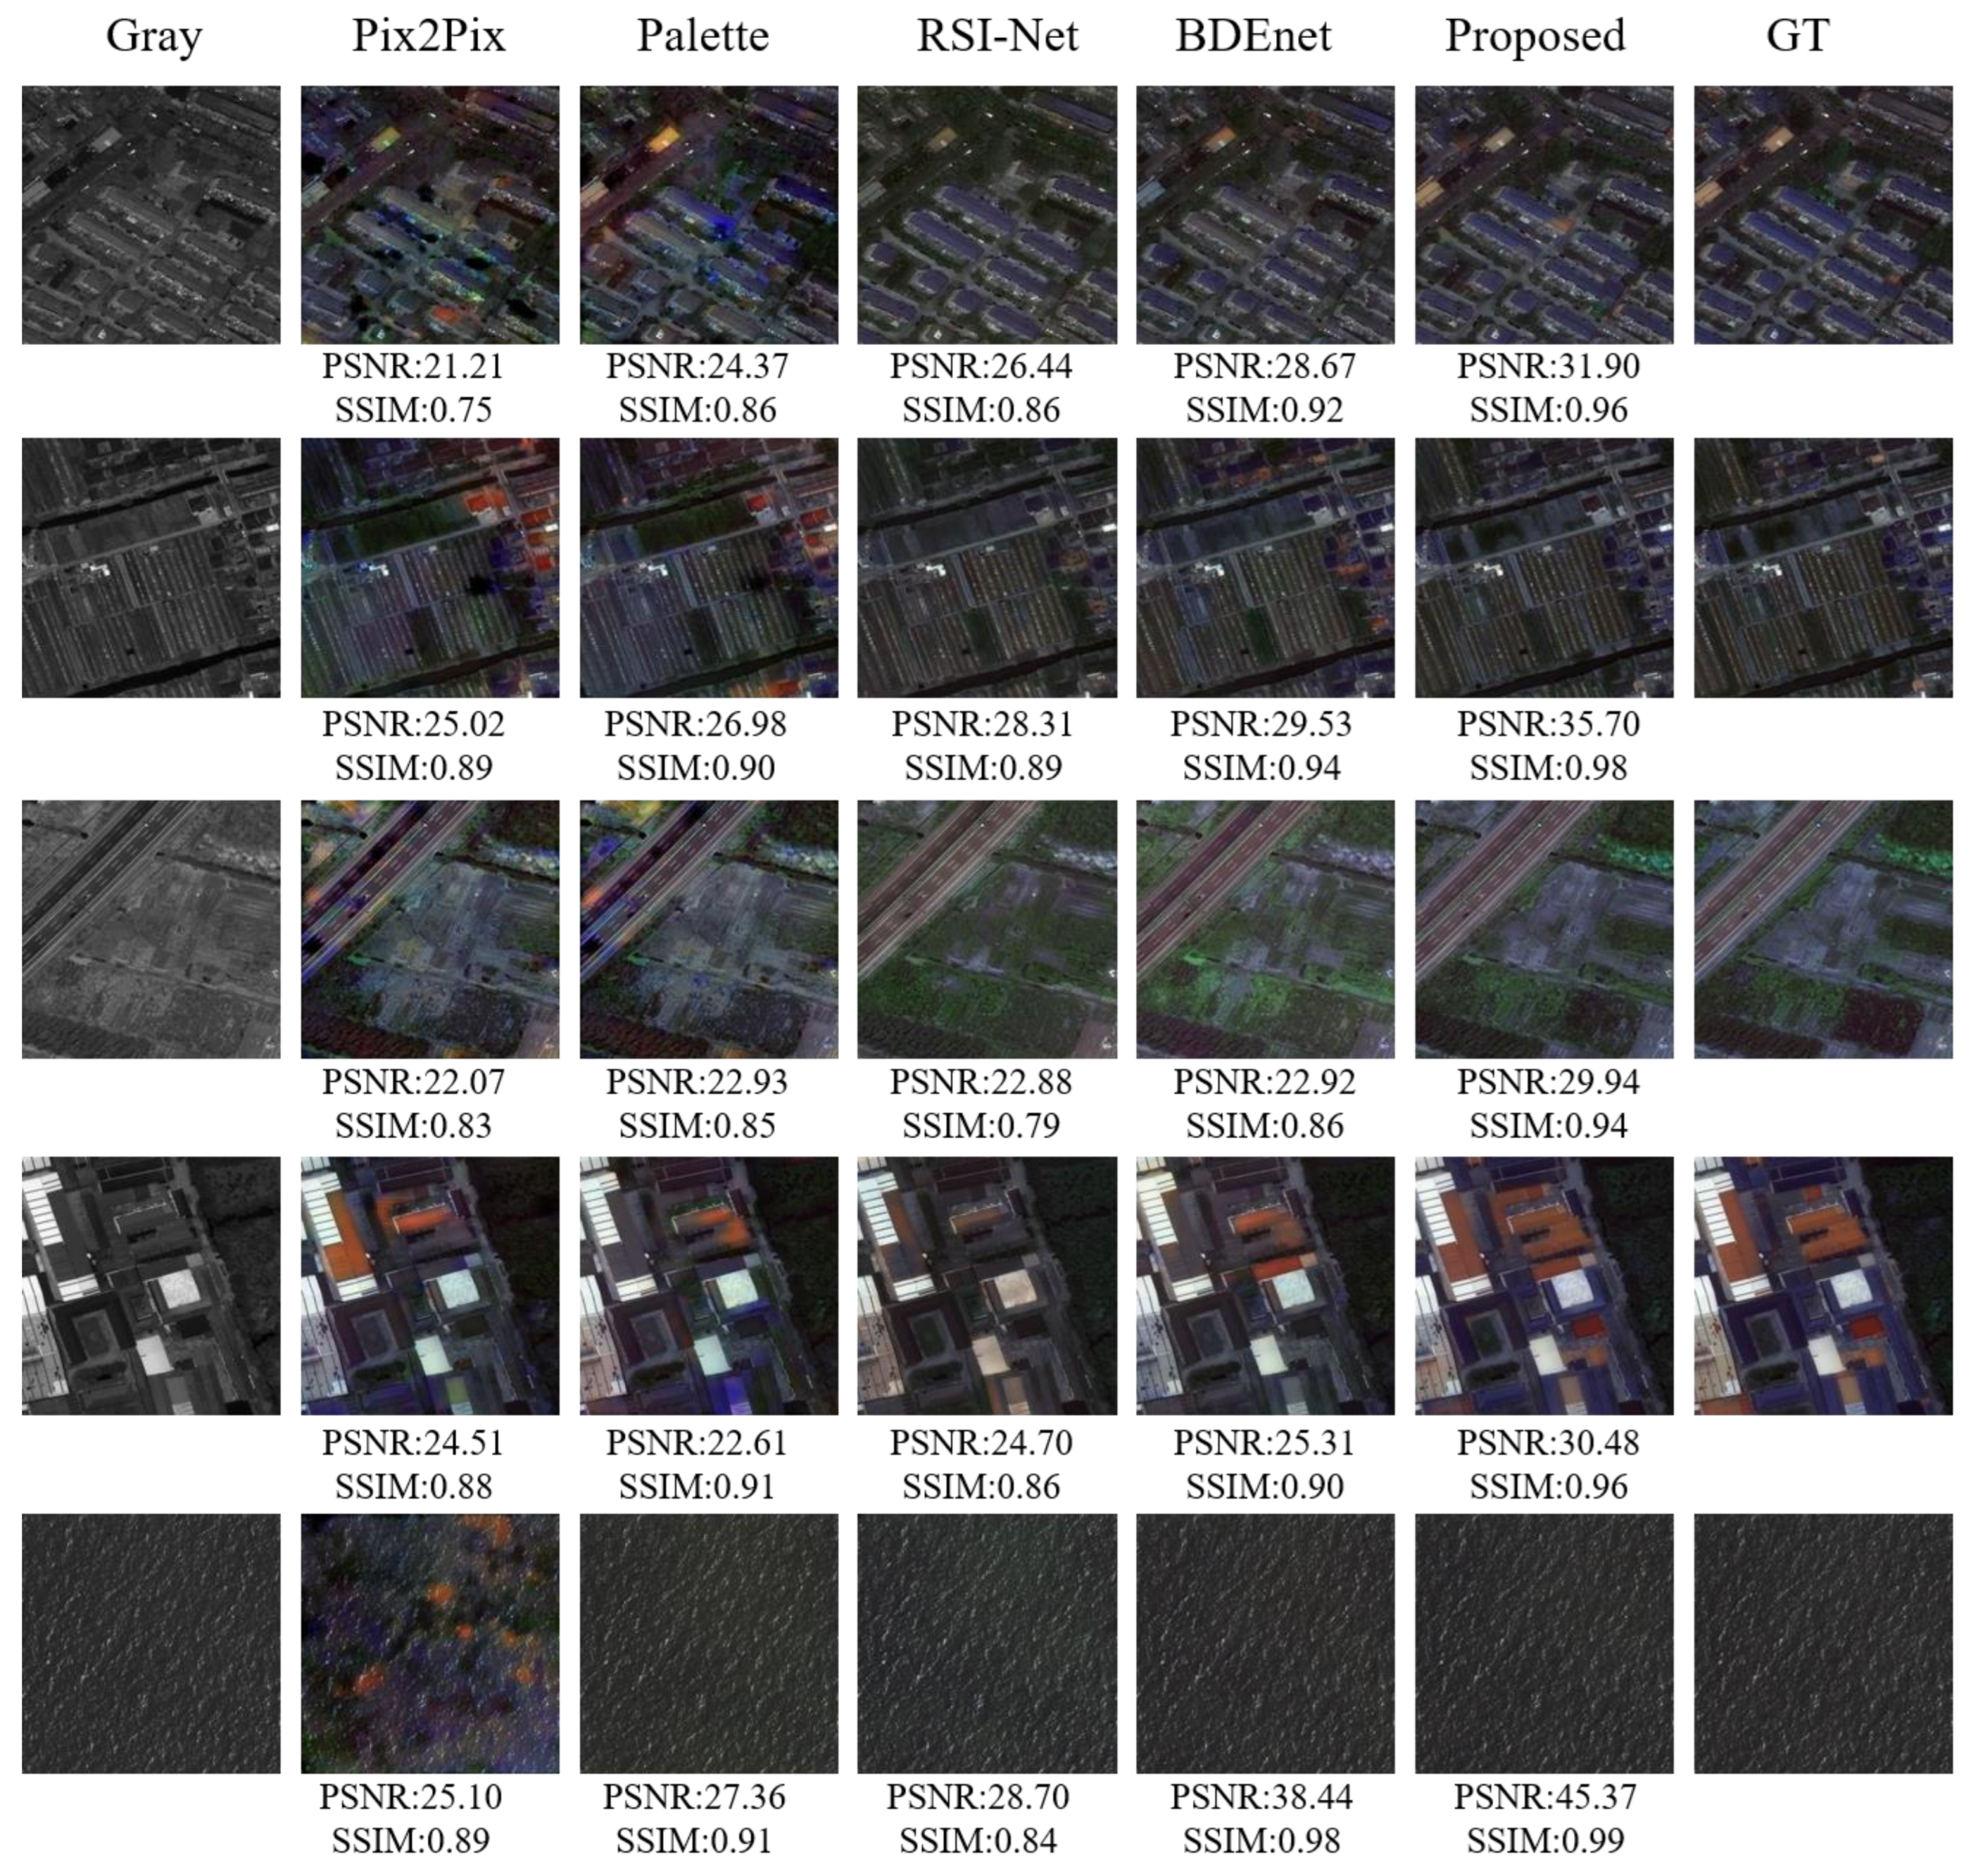
For dataset A, coloring experiments were conducted on all test data using the trained network models, and then five images were randomly selected for comparative analysis. Figure 8 illustrates the visual effects of our method and the comparative methods.
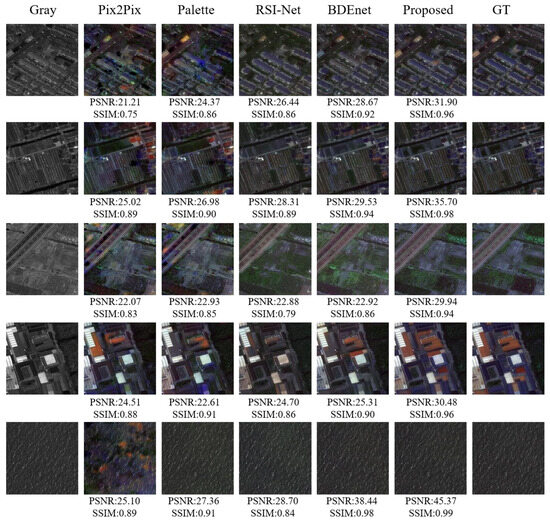
Figure 8.
Coloring results of different coloring methods for dataset A.
In the first row of Figure 8, it can be observed that in urban architectural scenes, the colorization effect of the Pix2Pix method is not ideal, exhibiting mode collapse issues with low image clarity. The roof colors show deviations and leakage, shifting from real blue to gray, with noticeable blue patches at the roof edges. This is due to Pix2Pix using a single scale and the insufficient handling of global consistency, leading to local color mismatches in the generated images. The Palette method, which is based on diffusion models, demonstrates slightly superior colorization results compared to Pix2Pix, offering improved image quality; however, it still suffers from low contrast, with some roofs displaying color deviations and significant edge leakage. In contrast, the RSI-Net method, built on deep convolutional neural networks, achieves better colorization outcomes than the previous two methods, effectively eliminating noticeable color deviations and leakage issues on roofs. Nonetheless, the overall image quality remains low, with some roofs exhibiting blurry boundaries and small white cars on the road lacking prominence. The BDEnet method shows good colorization results, with overall clear and high-contrast colored images, but still has some roof color deviations and vegetation color shifts from green to gray near some buildings. Our proposed method shows the best colorization effect, with generated colored images being continuous and smooth between global pixels, having no abnormal patches, exhibiting strong spatial consistency, being closer to the original colored images, and being more in line with human perception.
In the farmland and highway scenes, the third row of Figure 8 illustrates that the Pix2Pix method yields poor colorization results, exhibiting mode collapse with noticeable abnormal patches on the highway and the insufficient restoration of green vegetation in the farmland. The Palette method shows improved performance in highway colorization compared to Pix2Pix; however, it inaccurately restores the bare ground color in the farmland to purple. Both the RSI-Net and BDEnet methods demonstrate better colorization effects, significantly outperforming the previous two methods, yet they still exhibit some mode collapse, such as the unreasonable restoration of green vegetation near the farmland to gray. Our proposed method achieves the best colorization results, characterized by rich, saturated colors, high vibrancy, and strong prominence, significantly surpassing the performance of the previous four methods.
In the water scene, as depicted in the last row of Figure 8, the Pix2Pix method displays significant orange patches and unreasonable purple hues, resulting in very poor spatial color consistency. The Palette method encounters similar issues. In contrast, the RSI-Net and BDEnet methods do not exhibit these incorrect patches or color blocks, achieving overall good results. The images produced by our proposed method closely resemble real images, making it challenging for the human evaluation to differentiate between them.
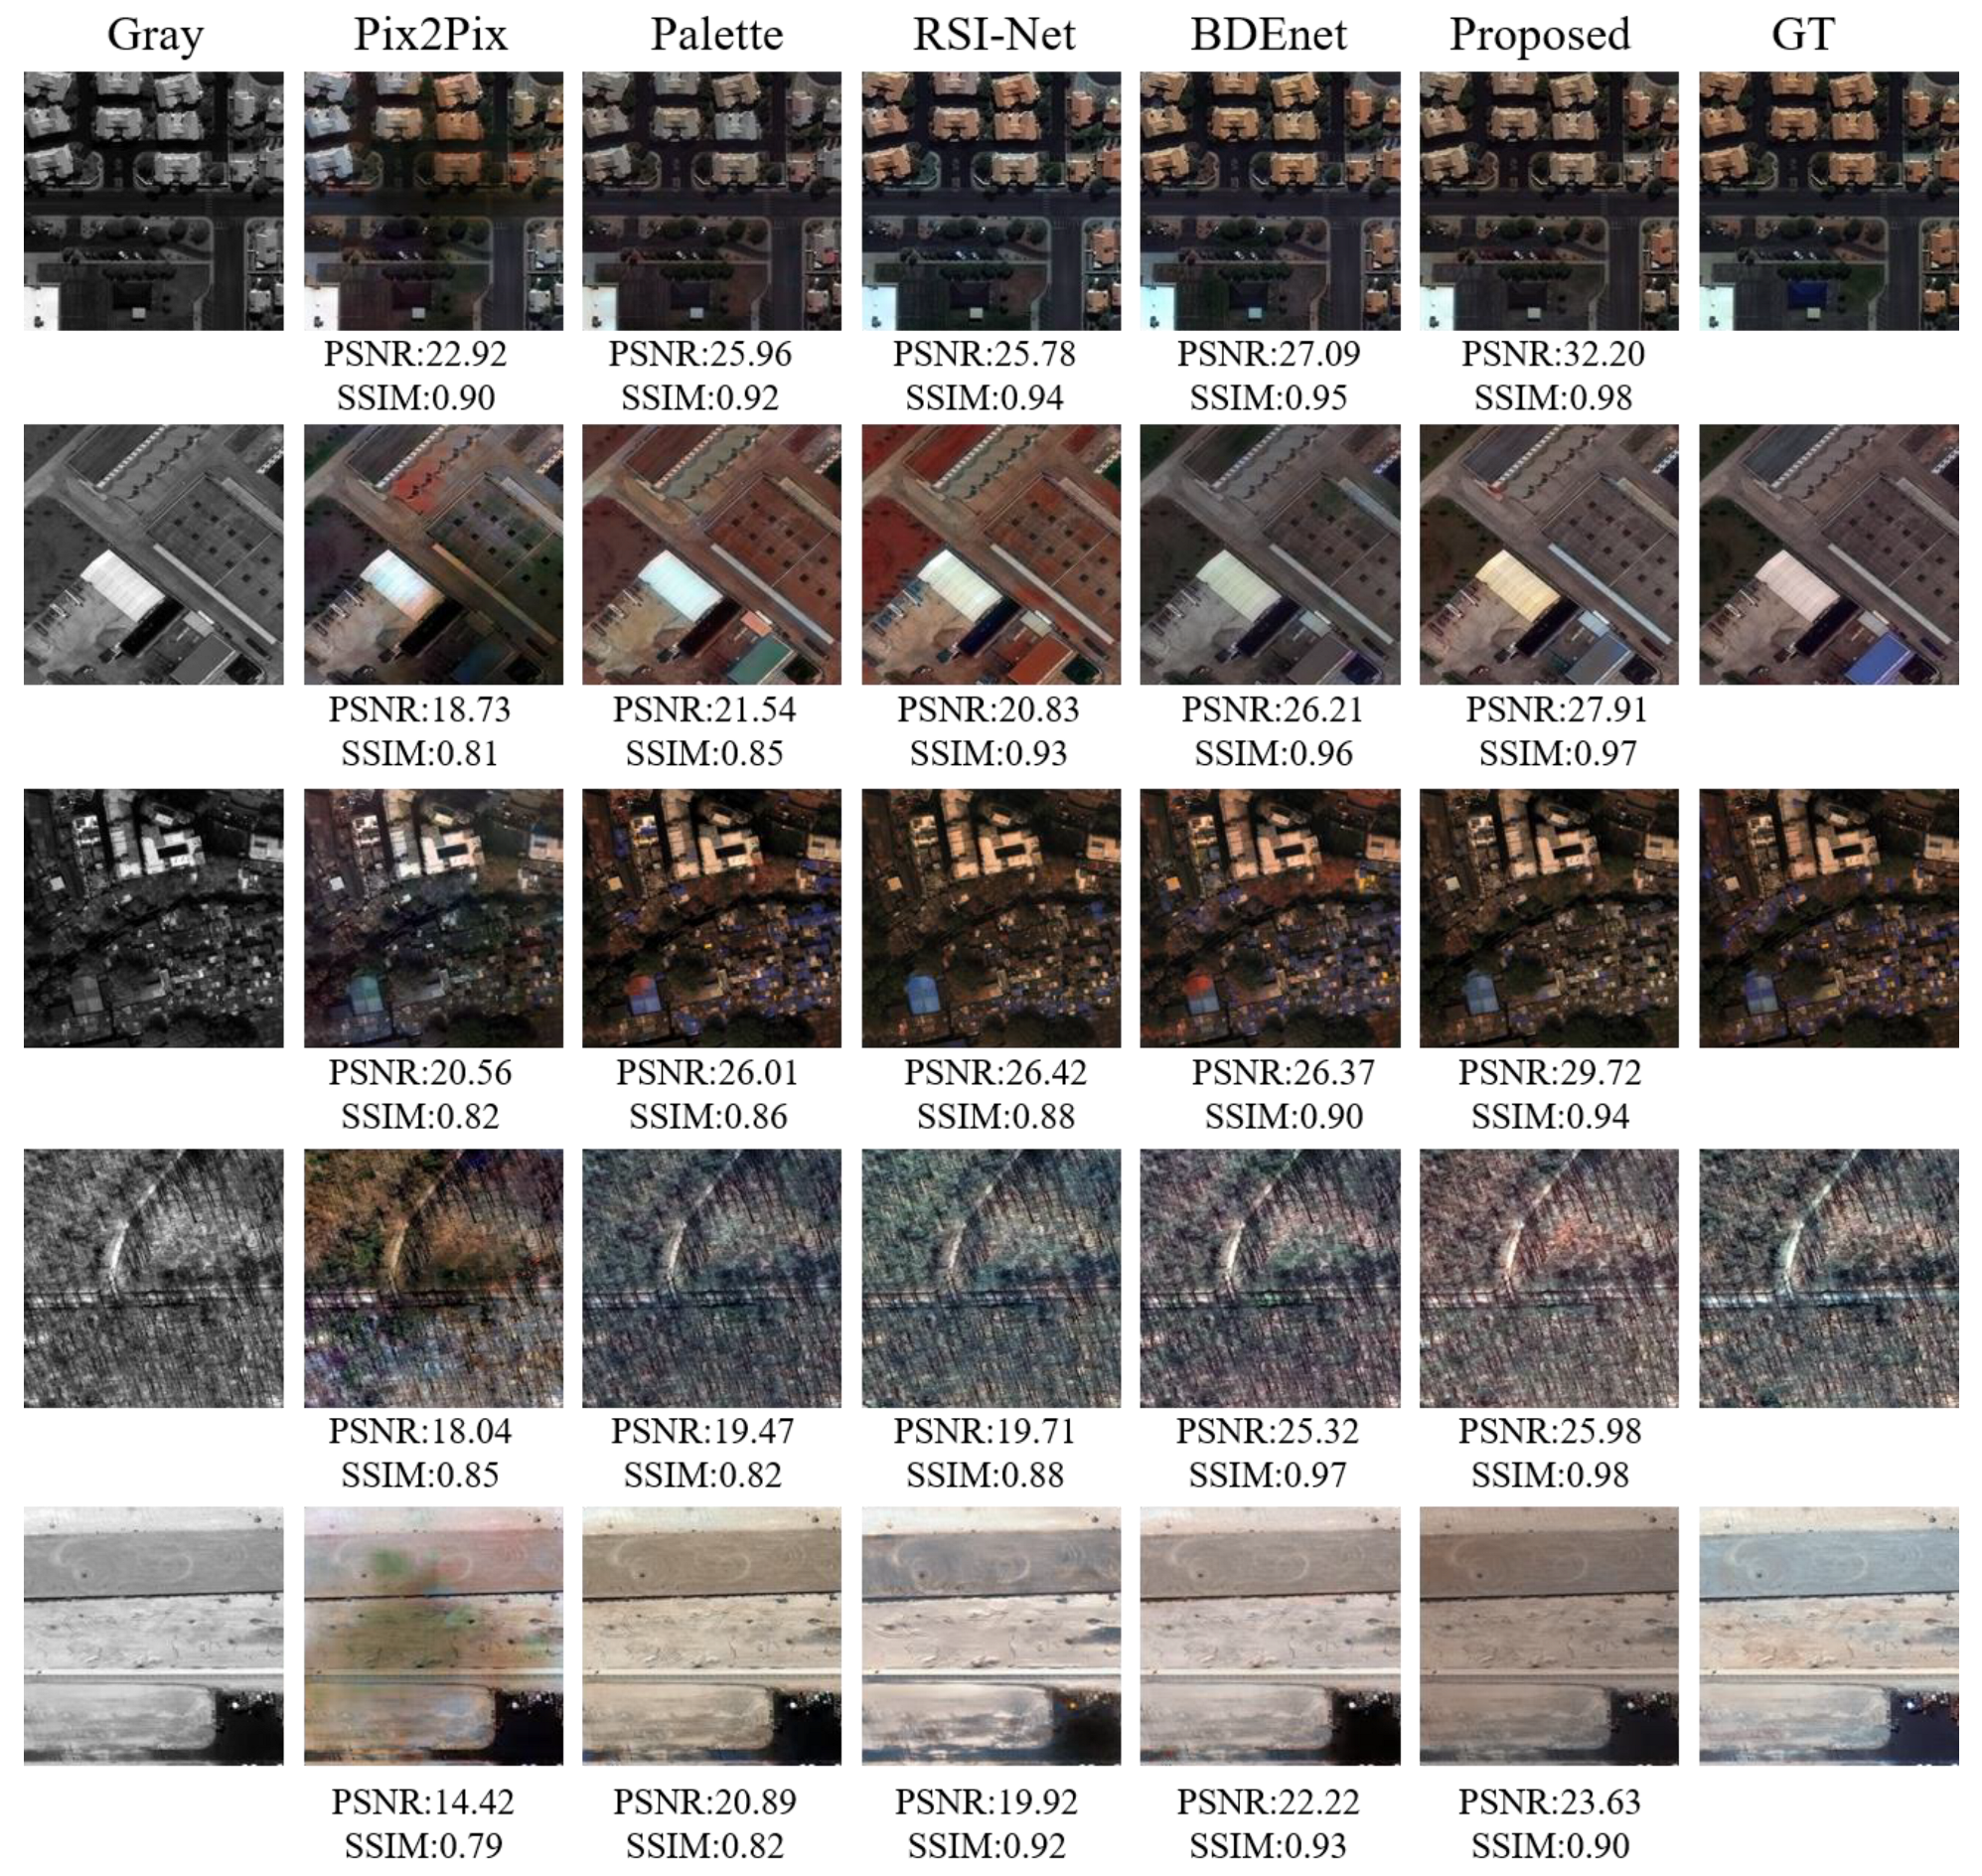
Regarding dataset B, similar experiments were conducted, where five images were randomly selected for comparative analysis from the generated images. The visual effects of our method and the comparative methods can be observed in Figure 9.
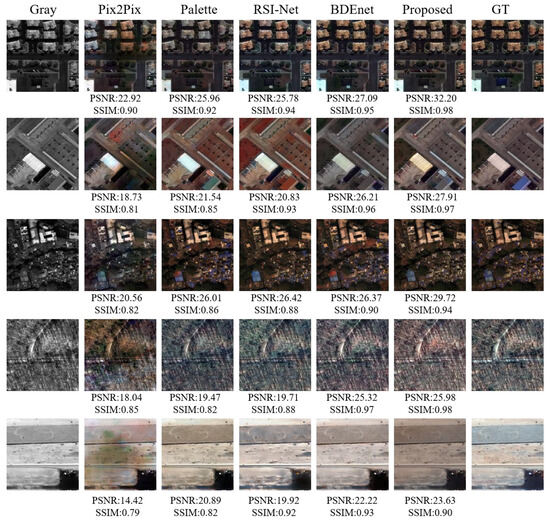
Figure 9.
Coloring results of different coloring methods for dataset B.
Figure 9 reveals that the Pix2Pix method suffers from significant mode collapse issues, resulting in poor colorization effects and noticeable color distortions in the generated images. In the first row, some building roofs are incorrectly colored, while the last row displays extensive color leakage on the road. The Palette method shows unstable colorization effects, demonstrating good consistency with the original real images in the first and third rows, but exhibiting noticeable color deviations in the second row. The colorization results of the RSI-Net and BDEnet methods surpass those of the previous two methods, yet still contain some unreasonable colors. For instance, the RSI-Net method displays abnormal red hues on certain building roofs (as seen in the second row), and the BDEnet method features low saturation in building colors, deviating from the original real colors. In comparison to the previous four methods, our proposed method achieves the best colorization results, although it occasionally exhibits minor shortcomings, such as color deviations on the road in the last row of Figure 9.
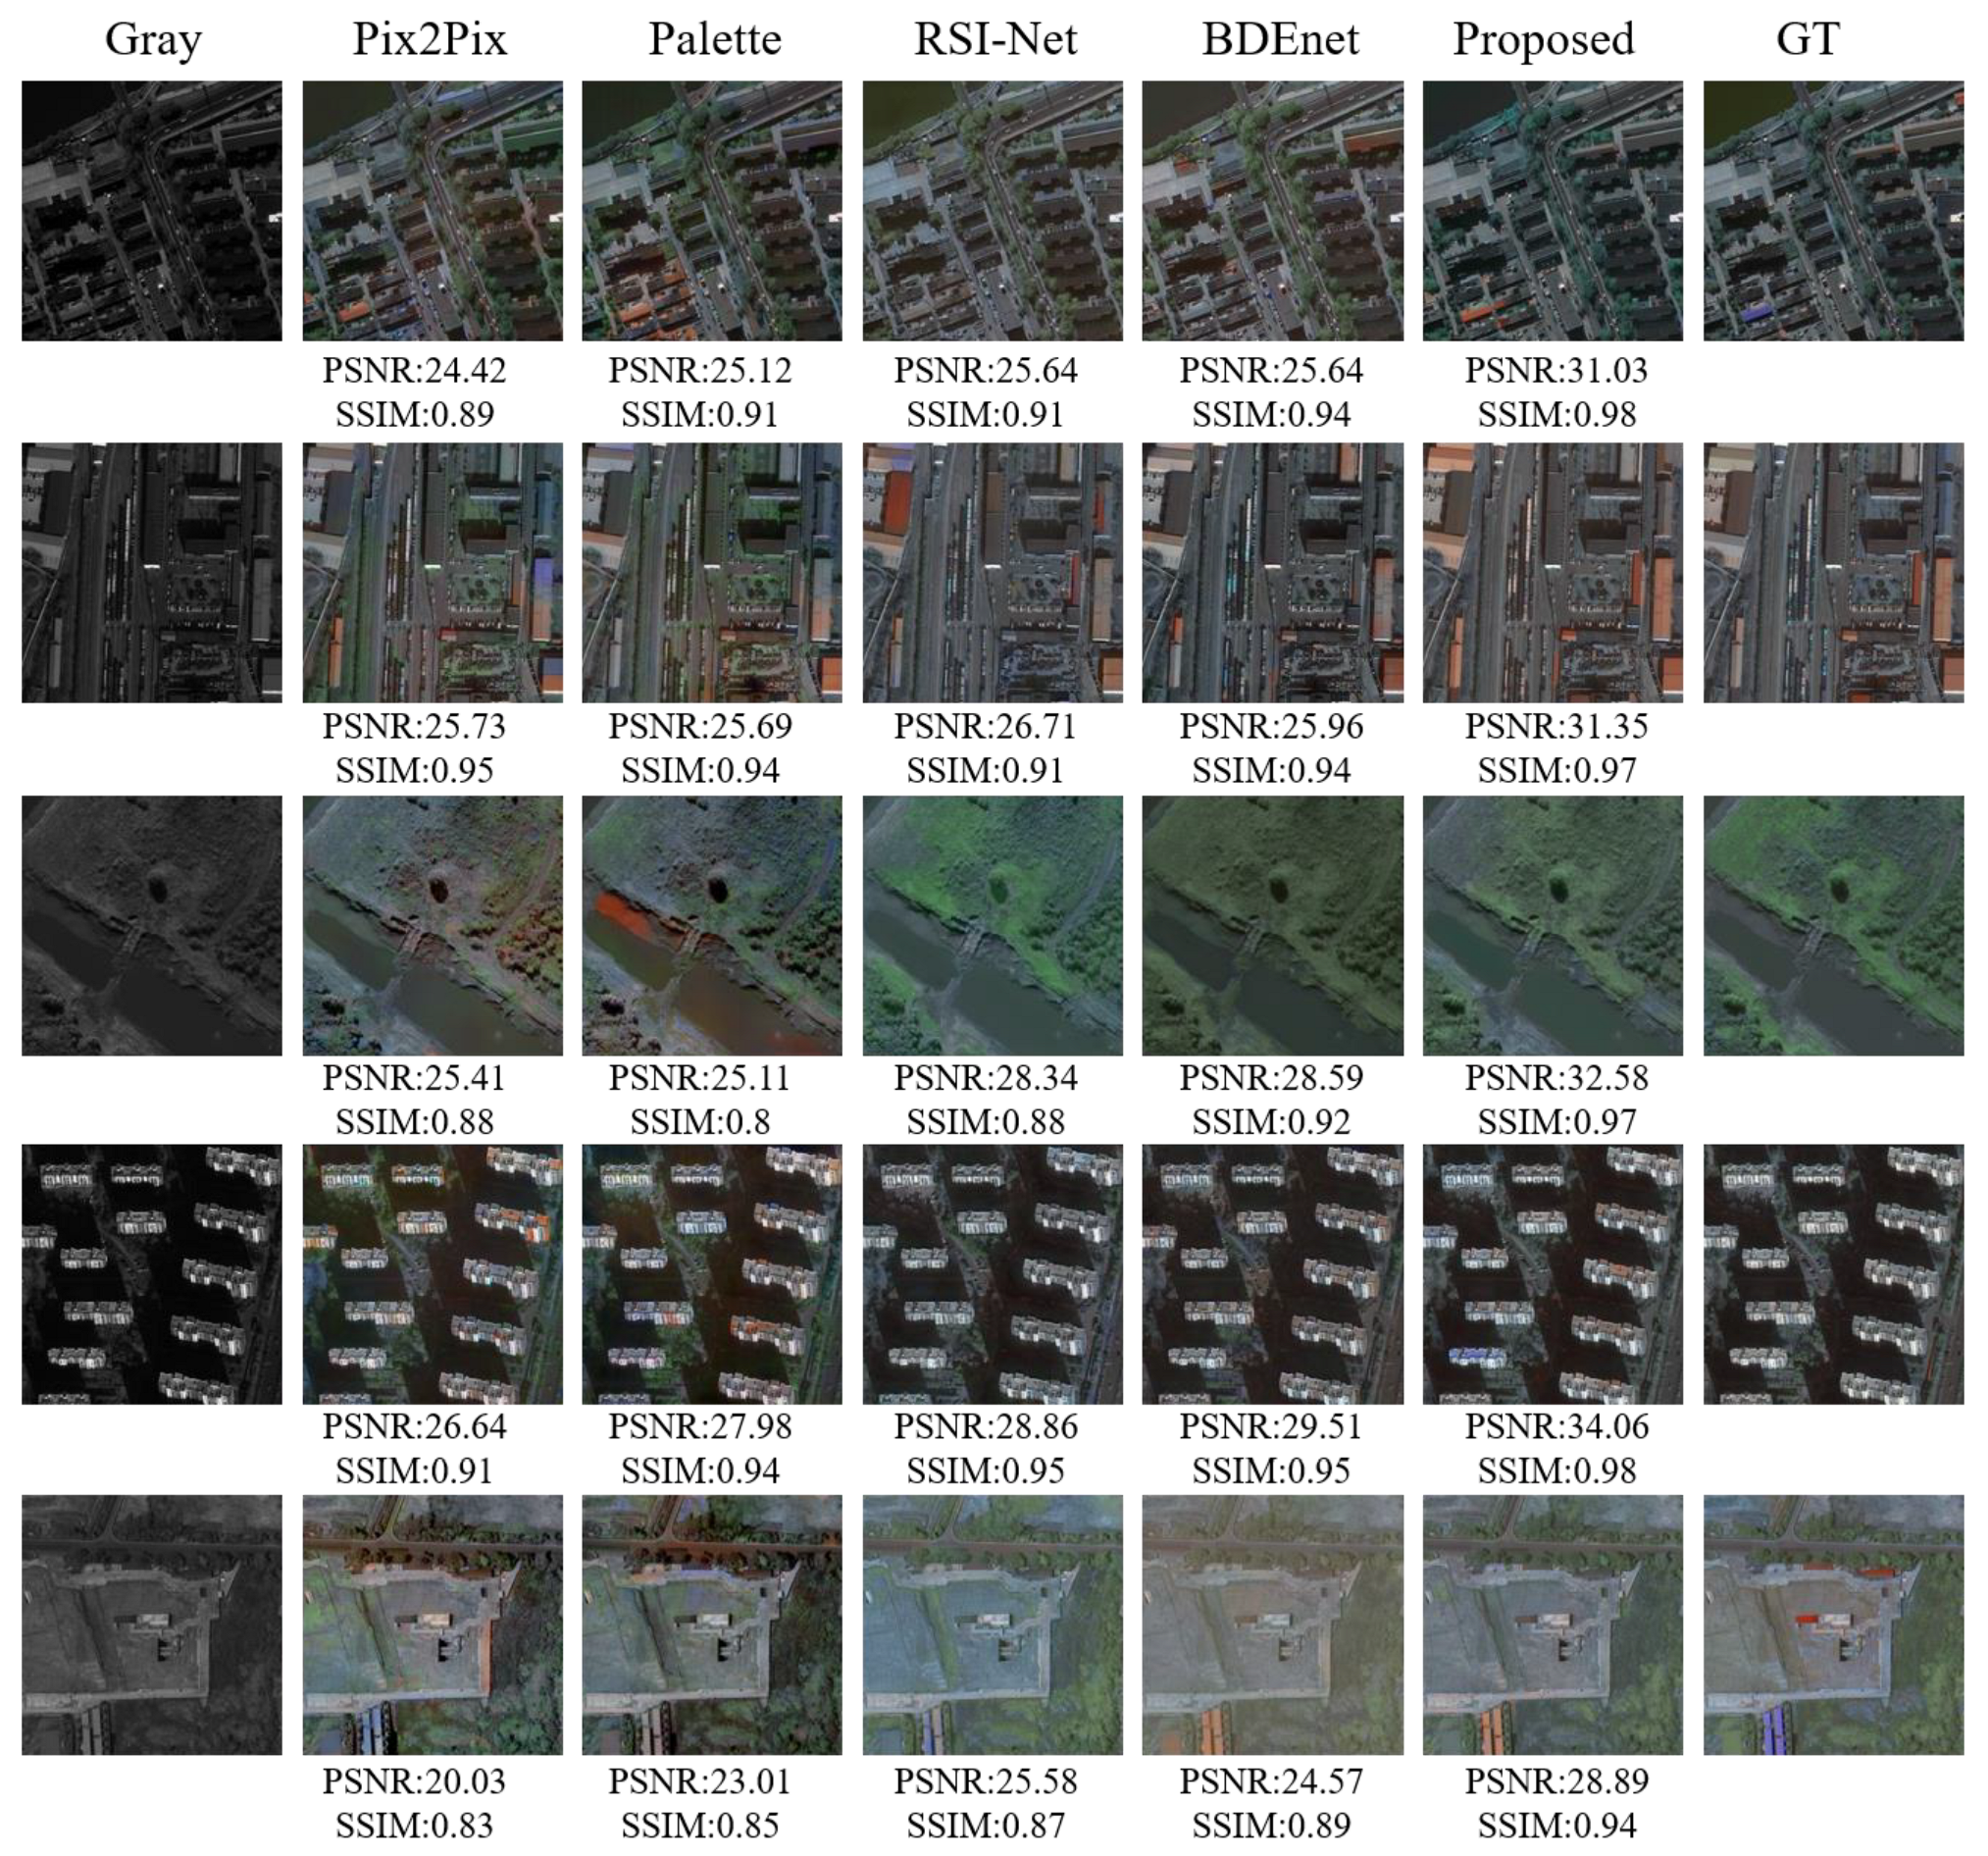
Similar experiments were conducted for dataset C, where five images were randomly selected for comparative analysis from the generated images. Figure 10 illustrates the visual effects of our method and the comparative methods.
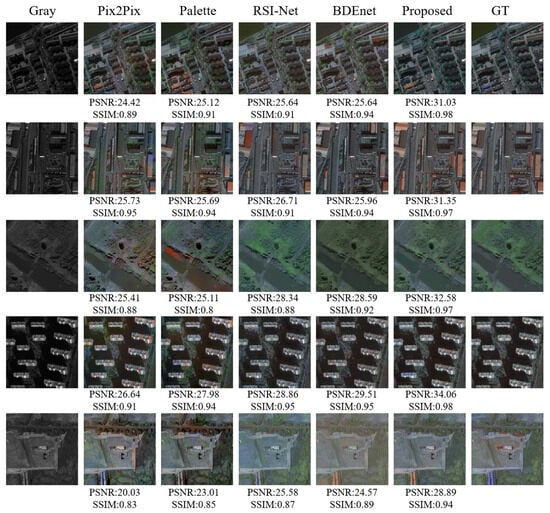
Figure 10.
Coloring results of different coloring methods for dataset C.
3.5.2. Quantitative Analysis
The images generated using these five methods on the three real satellite image test datasets were quantitatively evaluated by calculating the PSNR, SSIM, FID, and LPIPS metric values of all generated images, followed by averaging these values. Table 1, Table 2 and Table 3 show the quantitative statistical results of the five methods.

Table 1.
Comparison of image metrics of different coloring methods of dataset A. The ↑ means higher is better, the ↓ means lower is better.

Table 2.
Comparison of image metrics of different coloring methods of dataset B. The ↑ means higher is better, the ↓ means lower is better.

Table 3.
Comparison of image metrics of different coloring methods of dataset C. The ↑ means higher is better, the ↓ means lower is better.
Using dataset A as an example, the proposed method achieved a PSNR of 33.87 and an SSIM of 0.97, which were higher by 10.64, 9.08, 9.06, and 7.61 compared to the Pix2Pix, Palette, RSI-Net, and BDEnet methods, respectively. Additionally, the method proposed in this paper yielded images with lower FID values than the previous four methods, indicating a closer alignment between the distribution of generated images and real images. In contrast to the Pix2Pix method, which is based on GAN, the denoising GAN model introduced in this paper effectively addresses the mode collapse issue inherent in GANs by incorporating diffusion-based denoising, thereby demonstrating robust image representation and generation capabilities that excel in image colorization tasks.
From Table 1, Table 2 and Table 3, it is evident that the method proposed in this paper excels in image colorization tasks, with significantly higher peak PSNR and SSIM compared to the other four methods. Specifically, the proposed method achieves the best performance in image quality, with a higher clarity and fidelity of regenerated images compared to other methods. The second-best performing method is the BDEnet method, which, although slightly inferior in PSNR and SSIM, still demonstrates good colorization effects. The RSI-Net method ranks third in image colorization tasks, with slightly lower performance than the BDEnet method. The Pix2Pix and Palette methods perform the worst in terms of PSNR and SSIM, with the least desirable colorization effect.
Furthermore, the training efficiency of different methods is compared through analyzing the time cost for one single epoch, as shown in Table 4.

Table 4.
Training time of a single epoch for different coloring methods (units: s).
From Table 4, it can be observed that for dataset A, the Pix2Pix method takes approximately 126 s per epoch, making it the fastest in training speed. This is because the Pix2Pix method utilizes a basic GAN with a simple structure. The Palette method, being a diffusion-based approach, exhibits the lowest efficiency due to its reliance on iterative denoising processes, which incur additional computational costs and consequently lead to longer training times. The proposed method has lower training efficiency compared to the Pix2Pix method due to the addition of a denoising generation process in the generator network. However, it is significantly better than the RSI-Net and BDEnet methods. The RSI-Net method introduces a contrastive loss, which increases training complexity and computational cost by maximizing the similarity between positive sample pairs and minimizing the difference between negative sample pairs, affecting training efficiency.
Typically, satellite remote sensing images are of large scales, requiring the colorization processing of large-scale grayscale remote sensing images. We have devised a stitching method to achieve colorization effects on large-scale grayscale satellite remote sensing images. Initially, the trained network model is employed to colorize segmented image blocks sized 512 × 512, followed by a straightforward histogram matching process to harmonize the colors across image blocks. A randomly selected large-scale grayscale satellite remote sensing image, with sizes approximately 4150 × 5120, was colorized using the method proposed in this paper. The resulting colorized satellite image is shown in Figure 11.
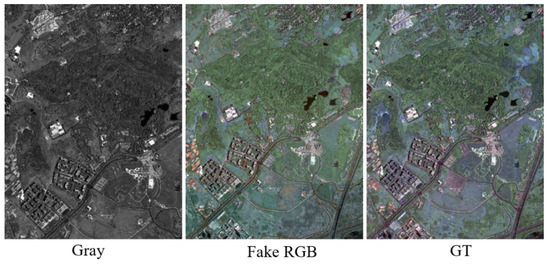
Figure 11.
Coloring result of large-scale remote sensing grayscale image.
From Figure 11, it can be observed that the entire satellite grayscale image exhibits good colorization effects after processing, with realistic color representations of different features, clear color boundaries between various elements, and satisfactory spatial consistency and object saliency in terms of pixel colors.
3.6. Ablation Experiment
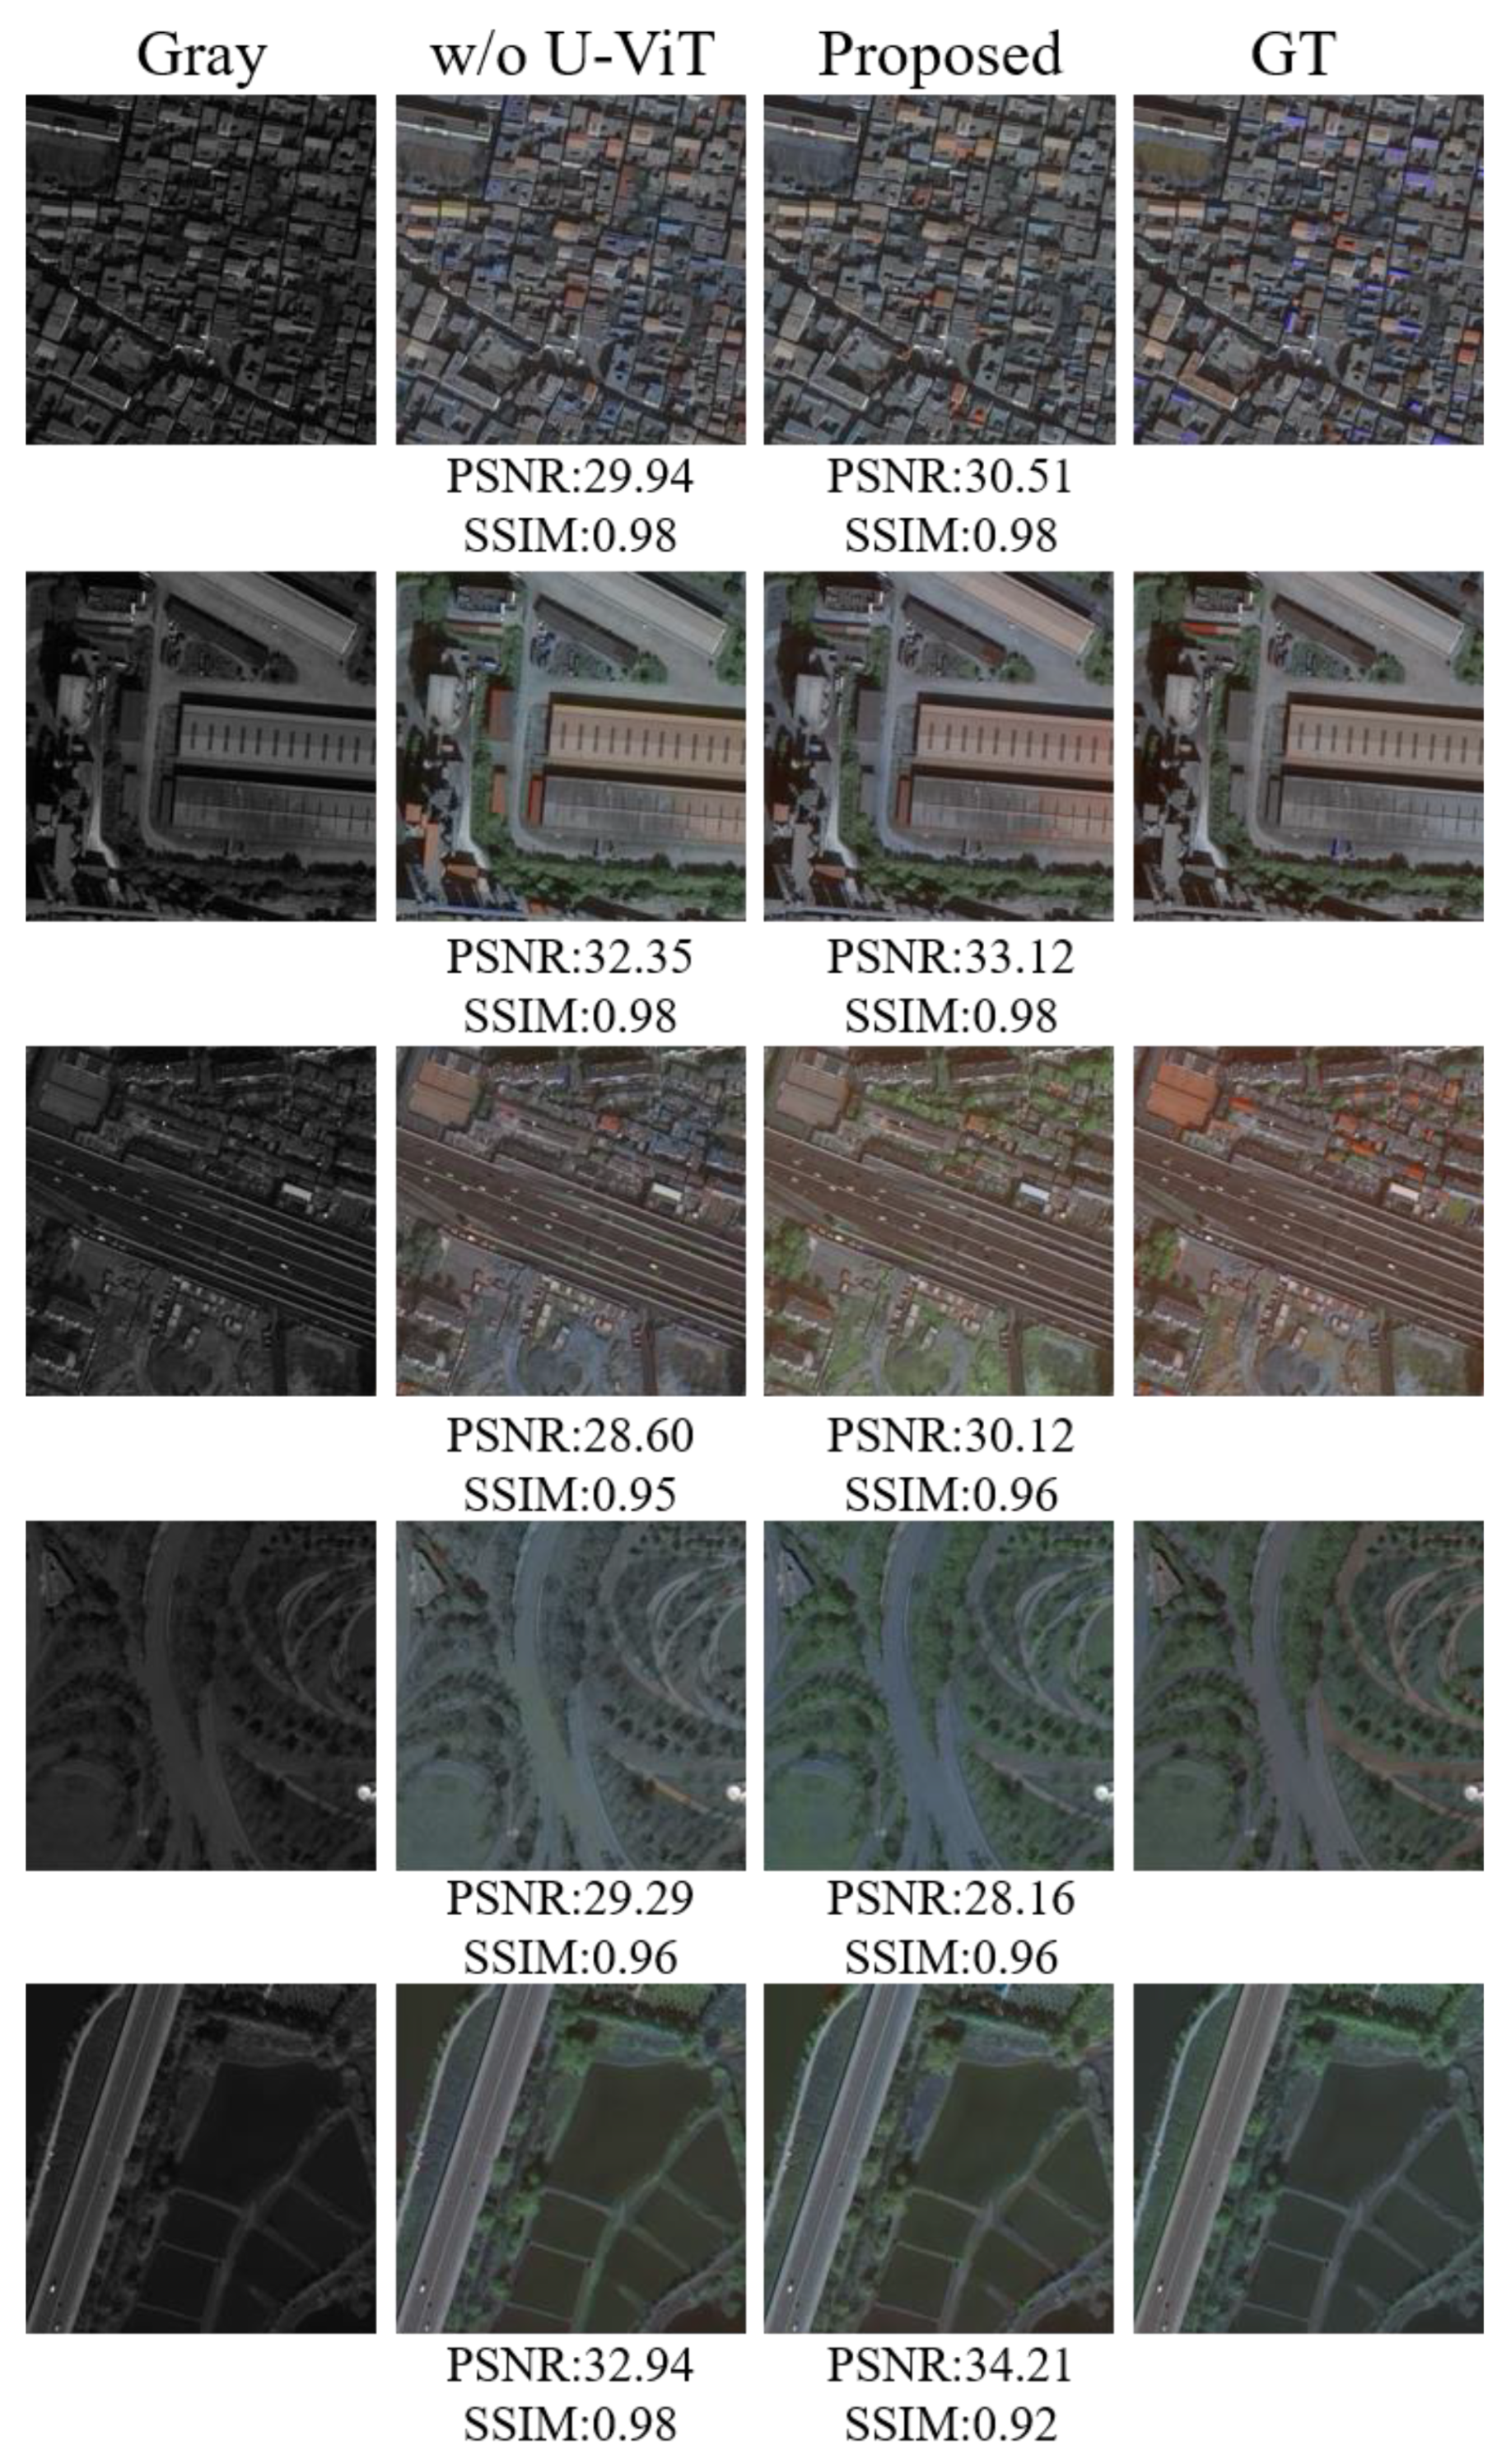
To validate the effectiveness of using U-ViT in the network model proposed in this paper, a comparative experiment was conducted by comparing the U-ViT module and the generic U-Net module. The qualitative results of the ablation experiment are shown in Figure 12, and the quantitative results are shown in Table 5.
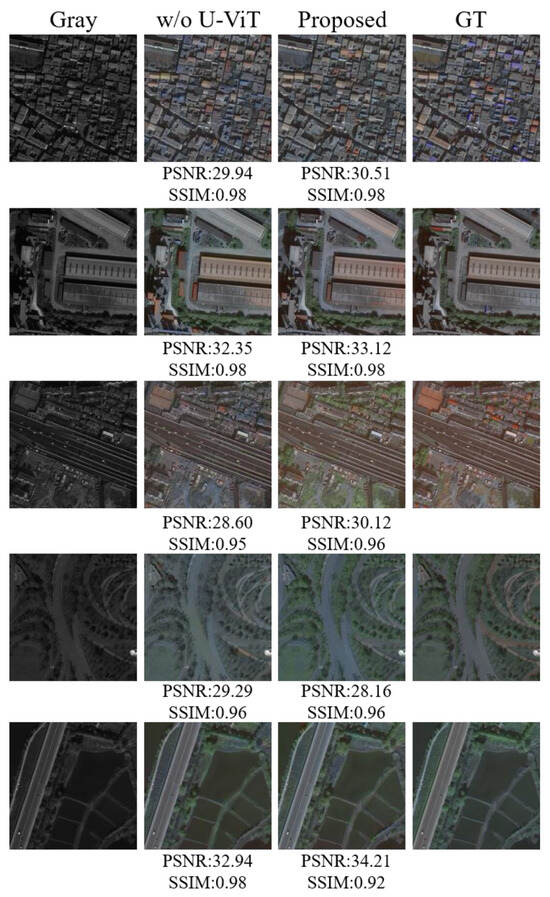
Figure 12.
Coloring results of dataset C without and with the U-ViT module.

Table 5.
Comparison of image metrics of different coloring methods for dataset C. The ↑ means higher is better, the ↓ means lower is better.
Through quantitative results in Table 5, it was found that in the task of image colorization, the method proposed in this paper using the U-ViT module yielded better results compared to colorization with the U-Net module. Specifically, the proposed method achieved significant improvements in PSNR, SSIM, FID, and LPIPS metrics, indicating improvements in image quality, structure preservation, and generated image quality. From the quantitative results, it can be seen that the proposed U-ViT model structure can enhance the similarity between generated images and real images. It is worth noting that in building scenes, the method with U-Net exhibited some color bias, while the introduced U-ViT can eliminate color shifts under the same conditions. Overall, these results indicate that the proposed method has higher performance and effectiveness in the field of image colorization.
3.7. Building Detection Validation
To further validate the practical utility of the generated colorized image, this paper utilizes the colorized image for conducting building target detection experiments. The UNet++ network model [43] was utilized to separately train on original real-color images and grayscale images, followed by the design of the following three approaches for building object detection:
- (1)
- Using the trained grayscale network model for building object detection on grayscale images.
- (2)
- Using the trained real-color network model for building object detection on generated fake color images.
- (3)
- Using the trained real-color network model for building object detection on original real color images.
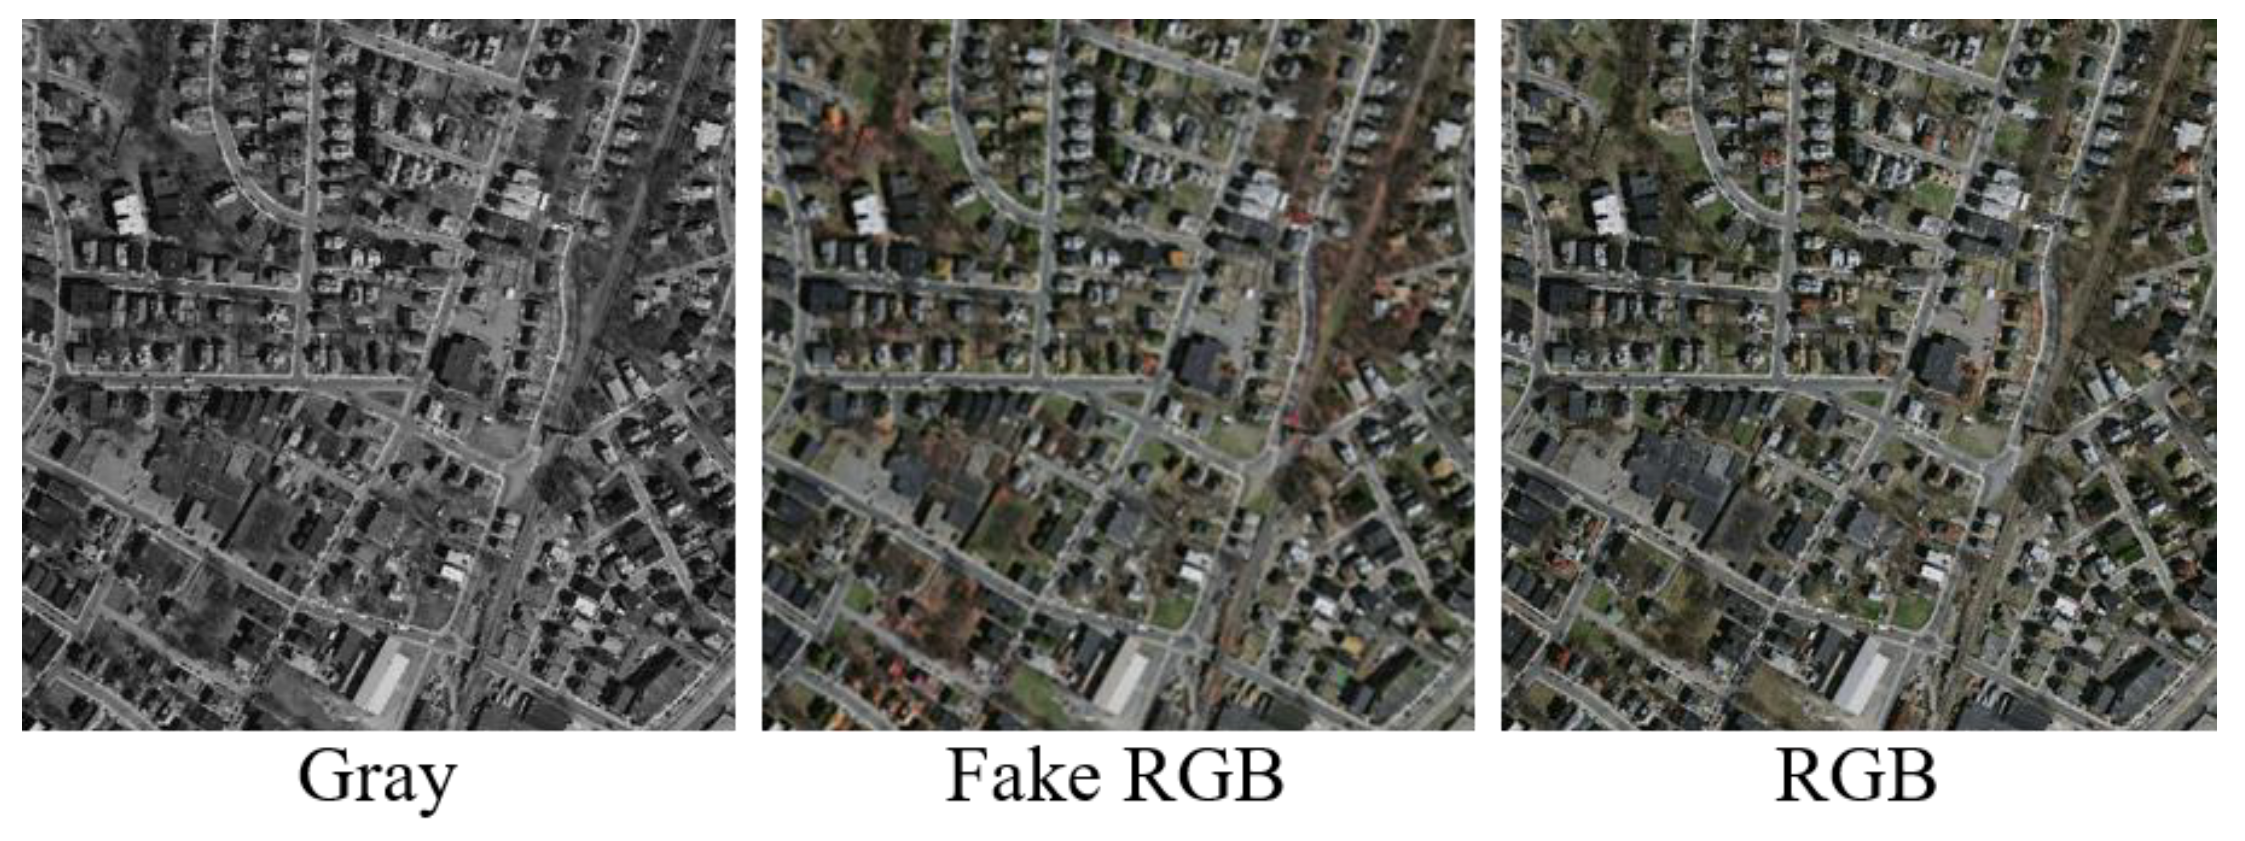
Initially a randomly selected image block from the test dataset with sizes of 512 × 512, Figure 13 shows the original grayscale image, the color image generated using the coloring method described in this paper, and the original color image.
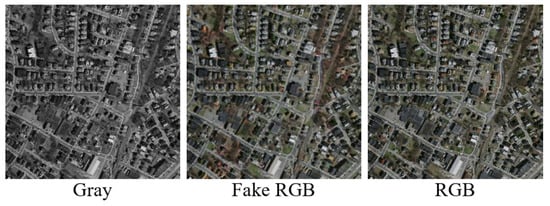
Figure 13.
Selected images for building target detection.
Subsequently, based on the three aforementioned building object detection approaches, the results of the three building object detections for this set of images are as follows:
From Figure 14, it can be observed that the performance of building detection improved further from grayscale images to generated color images, with the Intersection-over-Union (IoU) metric value increasing from 0.46 to 0.52. However, the performance on original color satellite images still outperformed the generated color images. In other words, it is difficult to achieve consistent results in building detection between grayscale images and original color images through coloring.

Figure 14.
Results of building target detection from different images.
4. Conclusions
In this paper, a novel grayscale image colorization method based on a denoising GAN is proposed, which leverages the high-quality image generation capabilities of diffusion models while minimizing time consumption during multiple iterations of sampling based on GANs. High-quality color images are successfully generated from satellite grayscale images. Specifically, a generator network based on U-ViT is utilized, incorporating cross-covariance attention mechanisms and long skip connections to optimize feature maps, thereby enhancing the model’s feature extraction capabilities. To further reduce computational burden, two optimization strategies are employed. A feature statistical discrimination network is implemented to transform attention image receptive field features into statistical representations of image feature information, thereby reducing constraints on the generator network. The proposed method is validated on three real satellite grayscale image datasets, and the experimental results indicate that our approach consistently outperforms state-of-the-art image colorization methods. While the denoising GAN model used in the network increases computational costs, outstanding results are simultaneously achieved. In the future, efforts will be focused on designing lightweight models to further reduce these computational costs.
Author Contributions
Conceptualization, Q.F., S.X., Y.K. and M.S.; methodology, Q.F., S.X. and Y.K.; software, Q.F. and S.X.; validation, Q.F. and S.X.; formal analysis, Y.K. and K.T.; investigation, Y.K. and M.S.; resources, M.S.; writing—original draft, Q.F.; writing—review and editing, S.X., Y.K. and K.T.; visualization, S.X.; supervision, Y.K.; project administration, M.S. All authors have read and agreed to the published version of the manuscript.
Funding
The work described in this paper was jointly supported by Jiangxi Province Key Laboratory of Electronic Data Control and Forensics (Jinggangshan University) (No. 20242BCC32027), National Natural Science Foundation of China (project nos. 42061055 and 61862035), Jiangxi Provincial Natural Science Foundation (20242BAB20128).
Data Availability Statement
The data presented in this study are available upon request from the corresponding authors. The data are not publicly available due to privacy.
Acknowledgments
We would like to express our gratitude to the editors and reviewers for their valuable comments, which greatly improved the quality of our manuscript. We also extend our sincere gratitude to Xu Ke for his invaluable contributions to the experimental work and for his assistance in preparing the dataset.
Conflicts of Interest
The authors declare no conflicts of interest.
References
- Tong, X.H.; Fu, Q.; Liu, S.J.; Wang, H.Y.; Ye, Z.; Jin, Y.M.; Chen, P.; Xu, X.; Wang, C.; Liu, S.C.; et al. Optimal selection of virtual control points with planar constraints for large-scale block adjustment of satellite imagery. Photogramm. Rec. 2020, 35, 487–508. [Google Scholar] [CrossRef]
- Fu, Q.; Tong, X.H.; Liu, S.J.; Ye, Z.; Jin, Y.M.; Wang, H.Y.; Hong, Z.H. A GPU-accelerated PCG method for the block adjustment of large-scale high-resolution optical satellite imagery without GCPs. Photogramm. Eng. Remote Sens. 2023, 89, 211–220. [Google Scholar] [CrossRef]
- Javan, F.D.; Samadzadegan, F.; Mehravar, S.; Toosi, A.; Khatami, R.; Stein, A. A review of image fusion techniques for pan-sharpening of high-resolution satellite imagery. ISPRS-J. Photogramm. Remote Sens. 2021, 171, 101–117. [Google Scholar] [CrossRef]
- Ma, J.Y.; Yu, W.; Chen, C.; Liang, P.W.; Guo, X.J.; Jiang, J.J. Pan-GAN: An unsupervised pan-sharpening method for remote sensing image fusion. Inf. Fusion 2020, 62, 110–120. [Google Scholar] [CrossRef]
- Liu, Q.J.; Zhou, H.Y.; Xu, Q.Z.; Liu, X.Y.; Wang, Y.H. PSGAN: A generative adversarial network for remote sensing image pan-sharpening. IEEE Trans. Geosci. Remote Sens. 2020, 59, 10227–10242. [Google Scholar] [CrossRef]
- Jiang, C.; Zhang, H.Y.; Shen, H.F.; Zhang, L.P. Two-step sparse coding for the pan-sharpening of remote sensing images. IEEE J. Sel. Top. Appl. Earth Observ. Remote Sens. 2013, 7, 1792–1805. [Google Scholar] [CrossRef]
- Li, F.M.; Ma, L.; Cai, J. Multi-discriminator generative adversarial network for high resolution gray-scale satellite image colorization. In Proceedings of the IGARSS 2018—2018 IEEE International Geoscience and Remote Sensing Symposium, Valencia, Spain, 22–27 July 2018; pp. 3489–3492. [Google Scholar] [CrossRef]
- Feng, J.N.; Jiang, Q.; Tseng, C.H.; Jin, X.; Liu, L.; Zhou, W.; Yao, S.W. A deep multitask convolutional neural network for remote sensing image super-resolution and colorization. IEEE Trans. Geosci. Remote Sens. 2022, 60, 5407915. [Google Scholar] [CrossRef]
- Liu, H.; Fu, Z.; Han, J.G.; Shao, L.; Liu, H.S. Single satellite imagery simultaneous super-resolution and colorization using multi-task deep neural networks. J. Vis. Commun. Image Represent. 2018, 53, 20–30. [Google Scholar] [CrossRef]
- Poterek, Q.; Herrault, P.A.; Skupinski, G.; Sheeren, D. Deep learning for automatic colorization of legacy grayscale aerial photographs. IEEE J. Sel. Top. Appl. Earth Observ. Remote Sens. 2020, 13, 2899–2915. [Google Scholar] [CrossRef]
- Reinhard, E.; Adhikhmin, M.; Gooch, B.; Shirley, P. Color transfer between images. IEEE Comput. Graph. Appl. 2001, 21, 34–41. [Google Scholar] [CrossRef]
- Welsh, T.; Ashikhmin, M.; Mueller, K. Transferring color to greyscale images. In Proceedings of the 29th Annual Conference on Computer Graphics and Interactive Techniques, San Antonio, TX, USA, 23–26 July 2002; pp. 277–280. [Google Scholar] [CrossRef]
- Zong, G.G.; Chen, Y.; Cao, G.C.; Dong, J.W. Fast image colorization based on local and global consistency. In Proceedings of the 2015 8th International Symposium on Computational Intelligence and Design (ISCID), Hangzhou, China, 12–13 December 2015; pp. 366–369. [Google Scholar] [CrossRef]
- Goodfellow, I.; Pouget-Abadie, J.; Mirza, M.; Xu, B.; Warde-Farley, D.; Ozair, S.; Courville, A.; Bengio, Y. Generative adversarial nets. arXiv 2014, arXiv:1406.2661. [Google Scholar]
- Mirza, M.; Osindero, S. Conditional generative adversarial nets. arXiv 2014, arXiv:1411.1784. [Google Scholar] [CrossRef]
- Radford, A.; Metz, L.; Chintala, S. Unsupervised representation learning with deep convolutional generative adversarial networks. arXiv 2015, arXiv:1511.06434. [Google Scholar] [CrossRef]
- Isola, P.; Zhu, J.Y.; Zhou, T.; Efros, A.A. Image-to-image translation with conditional adversarial networks. In Proceedings of the IEEE Conference on Computer Vision and Pattern Recognition (CVPR), Honolulu, HI, USA, 21–26 July 2017; pp. 1125–1134. [Google Scholar] [CrossRef]
- Nazeri, K.; Ng, E.; Ebrahimi, M. Image colorization using generative adversarial networks. In Proceedings of the Articulated Motion and Deformable Objects: 10th International Conference, AMDO 2018, Palma de Mallorca, Spain, 12–13 July 2018; pp. 85–94. [Google Scholar] [CrossRef]
- Wu, M.; Jin, X.; Jiang, Q.; Lee, S.J.; Guo, L.; Di, Y.D.; Huang, S.S.; Huang, J.F. Remote sensing image colorization based on multiscale SEnet GAN. In Proceedings of the 2019 12th International Congress on Image and Signal Processing, BioMedical Engineering and Informatics (CISP-BMEI), Suzhou, China, 19–21 October 2019; pp. 1–6. [Google Scholar] [CrossRef]
- Wu, M.; Jin, X.; Jiang, Q.; Lee, S.J.; Liang, W.T.; Lin, G.; Yao, S.W. Remote sensing image colorization using symmetrical multi-scale DCGAN in YUV color space. Visual Comput. 2021, 37, 1707–1729. [Google Scholar] [CrossRef]
- Wang, J.Y.; Nie, J.; Chen, H.; Xie, H.; Zheng, C.Y.; Ye, M.; Wei, Z.Q. Remote sensing image colorization based on joint stream deep convolutional generative adversarial networks. In Proceedings of the 4th ACM International Conference on Multimedia in Asia, Tokyo, Japan, 13–16 December 2022; pp. 1–8. [Google Scholar] [CrossRef]
- Nie, J.; Wang, J.Y.; Jing, N.T.; Zuo, Z.J.; Chen, S.G.; Liang, X.Y. Bidirectional Layout-Semantic-Pixel Joint Decoupling and Embedding Network for Remote Sensing Colorization. IEEE Trans. Geosci. Remote Sens. 2024, 62, 5400614. [Google Scholar] [CrossRef]
- Berthelot, D.; Schumm, T.; Metz, L. Began: Boundary equilibrium generative adversarial networks. arXiv 2017, arXiv:1703.10717. [Google Scholar] [CrossRef]
- Kodali, N.; Abernethy, J.; Hays, J.; Kira, Z. On convergence and stability of gans. arXiv 2017, arXiv:1705.07215. [Google Scholar] [CrossRef]
- Miyato, T.; Kataoka, T.; Koyama, M.; Yoshida, Y. Spectral normalization for generative adversarial networks. arXiv 2018, arXiv:1802.05957. [Google Scholar] [CrossRef]
- Arjovsky, M.; Chintala, S.; Bottou, L. Wasserstein GAN. arXiv 2017, arXiv:1701.07875. [Google Scholar] [CrossRef]
- Gulrajani, I.; Ahmed, F.; Arjovsky, M.; Dumoulin, V.; Courville, A. Improved Training of Wasserstein GANs. arXiv 2017, arXiv:1704.00028. [Google Scholar] [CrossRef]
- Mao, X.D.; Li, Q.; Xie, H.R.; Lau, R.Y.; Wang, Z.; Paul Smolley, S. Least squares generative adversarial networks. In Proceedings of the IEEE International Conference on Computer Vision (ICCV), Venice, Italy, 22–29 October 2017; pp. 2794–2802. [Google Scholar]
- Dhariwal, P.; Nichol, A. Diffusion Models Beat GANs on Image Synthesis. arXiv 2021, arXiv:2105.05233. [Google Scholar] [CrossRef]
- Rombach, R.; Blattmann, A.; Lorenz, D.; Esser, P.; Ommer, B. High-resolution image synthesis with latent diffusion models. In Proceedings of the IEEE/CVF Conference on Computer Vision and Pattern Recognition (CVPR), New Orleans, LA, USA, 19–24 June 2022; pp. 10684–10695. [Google Scholar] [CrossRef]
- Ho, J.; Jain, A.; Abbeel, P. Denoising Diffusion Probabilistic Models. arXiv 2020, arXiv:2006.11239. [Google Scholar] [CrossRef]
- Sasaki, H.; Willcocks, C.G.; Breckon, T.P. Unit-ddpm: Unpaired image translation with denoising diffusion probabilistic models. arXiv 2021, arXiv:2104.05358. [Google Scholar] [CrossRef]
- Saharia, C.; Chan, W.; Chang, H.W.; Lee, C.; Ho, J.; Salimans, T.; Fleet, D.J.; Norouzi, M. Palette: Image-to-Image Diffusion Models. In Proceedings of the ACM SIGGRAPH 2022 Conference Proceedings, New York, NY, USA, 7–11 August 2022; pp. 1–10. [Google Scholar] [CrossRef]
- Song, J.M.; Meng, C.L.; Ermon, S. Denoising diffusion implicit models. arXiv 2020, arXiv:2010.02502. [Google Scholar] [CrossRef]
- Xiao, Z.S.; Kreis, K.; Vahdat, A. Tackling the generative learning trilemma with denoising diffusion gans. arXiv 2021, arXiv:2112.07804. [Google Scholar] [CrossRef]
- Wang, Z.D.; Zheng, H.J.; He, P.C.; Chen, W.Z.; Zhou, M.Y. Diffusion-gan: Training gans with diffusion. arXiv 2022, arXiv:2206.02262. [Google Scholar] [CrossRef]
- Solano-Carrillo, E.; Rodriguez, A.B.; Carrillo-Perez, B.; Steiniger, Y.; Stoppe, J. Look ATME: The Discriminator Mean Entropy Needs Attention. In Proceedings of the IEEE/CVF Conference on Computer Vision and Pattern Recognition (CVPR), Vancouver, BC, Canada, 17–24 June 2023; pp. 787–796. [Google Scholar] [CrossRef]
- He, K.M.; Zhang, X.Y.; Ren, S.Q.; Sun, J. Delving deep into rectifiers: Surpassing human-level performance on imagenet classification. In Proceedings of the IEEE International Conference on Computer Vision (ICCV), Santiago, Chile, 7–13 December 2015; pp. 1026–1034. [Google Scholar] [CrossRef]
- Bao, F.; Nie, S.; Xue, K.W.; Cao, Y.; Li, C.X.; Su, H.; Zhu, J. All are worth words: A vit backbone for diffusion models. In Proceedings of the IEEE/CVF Conference on Computer Vision and Pattern Recognition (CVPR), Vancouver, BC, Canada, 17–24 June 2023; pp. 22669–22679. [Google Scholar] [CrossRef]
- Peebles, W.; Xie, S.N. Scalable diffusion models with transformers. In Proceedings of the IEEE/CVF International Conference on Computer Vision (ICCV), Paris, France, 1–6 October 2023; pp. 4195–4205. [Google Scholar] [CrossRef]
- El-Nouby, A.; Touvron, H.; Caron, M.; Bojanowski, P.; Douze, M.; Joulin, A.; Laptev, I.; Neverova, N.; Synnaeve, G.; Verbeek, J.; et al. XCiT: Cross-Covariance Image Transformers. arXiv 2021, arXiv:2106.09681. [Google Scholar] [CrossRef]
- Veness, J.; Lattimore, T.; Budden, D.; Bhoopchand, A.; Mattern, C.; Grabska-Barwinska, A.; Sezener, E.; Wang, J.; Toth, P.; Schmitt, S.; et al. Gated Linear Networks. arXiv 2019, arXiv:1910.01526. [Google Scholar] [CrossRef]
- Zhou, Z.W.; Siddiquee, M.M.R.; Tajbakhsh, N.; Liang, J.M. Unet++: Redesigning skip connections to exploit multiscale features in image segmentation. IEEE Trans. Med. Imaging 2019, 39, 1856–1867. [Google Scholar] [CrossRef]
Disclaimer/Publisher’s Note: The statements, opinions and data contained in all publications are solely those of the individual author(s) and contributor(s) and not of MDPI and/or the editor(s). MDPI and/or the editor(s) disclaim responsibility for any injury to people or property resulting from any ideas, methods, instructions or products referred to in the content. |
© 2024 by the authors. Licensee MDPI, Basel, Switzerland. This article is an open access article distributed under the terms and conditions of the Creative Commons Attribution (CC BY) license (https://creativecommons.org/licenses/by/4.0/).

