Abstract
Single-image dehazing is an ill-posed problem that has attracted a myriad of research efforts. However, virtually all methods proposed thus far assume that input images are already affected by haze. Little effort has been spent on autonomous single-image dehazing. Even though deep learning dehazing models, with their widely claimed attribute of generalizability, do not exhibit satisfactory performance on images with various haze conditions. In this paper, we present a novel approach for autonomous single-image dehazing. Our approach consists of four major steps: sharpness enhancement, adaptive dehazing, image blending, and adaptive tone remapping. A global haze density weight drives the adaptive dehazing and tone remapping to handle images with various haze conditions, including those that are haze-free or affected by mild, moderate, and dense haze. Meanwhile, the proposed approach adopts patch-based haze density weights to guide the image blending, resulting in enhanced local texture. Comparative performance analysis with state-of-the-art methods demonstrates the efficacy of our proposed approach.
1. Introduction
Digital cameras operating in outdoor environments are susceptible to performance degradation due to the presence of microscopic particles suspended in the atmosphere. As a result, images or videos captured under such conditions often suffer from reduced visibility and diminished contrast, which pose challenges for downstream applications such as pedestrian detection [,], automatic emergency braking [,], and particularly aerial surveillance [,].
Figure 1 illustrates the impact of haze and the application of dehazing algorithms in an aerial surveillance context. The first row displays a haze-free image (Figure 1a) from the Aerial Image Dataset [] alongside its corresponding synthetic hazy image (Figure 1c). Figure 1b,d present the dehazing results obtained using a deep-learning-based algorithm (MB-TaylorFormer []). The second row shows the corresponding object detection results for the four images in the first row, using the YOLOv9 object detection framework []. Notably, a haziness degree evaluator [] was employed to distinguish Figure 1a as haze-free and Figure 1c as hazy.
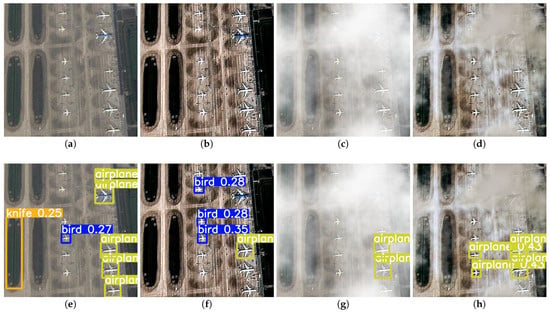
Figure 1.
Illustration of the effects of haze and dehazing algorithms on an aerial surveillance application. First row: (a) a clean image, (b) the dehazing result of that clean image, (c) a hazy image, and (d) the dehazing result of that hazy image. Second row: (e–h) the corresponding object detection results for each of the four images in the first row. The dehazing algorithm used is MB-TaylorFormer [], and the object detection algorithm used is YOLOv9 []. Notes: yellow labels represent airplanes, blue labels represent birds, and orange labels represent knifes.
As depicted in Figure 1e, YOLOv9 detected seven objects from the haze-free image, including five airplanes and two incorrect detections (knife and bird). The result in Figure 1b demonstrates that even an advanced deep learning method like MB-TaylorFormer struggles to process haze-free images. This limitation arises because MB-TaylorFormer, like most dehazing algorithms, was designed under the assumption that the input images are already affected by haze. Consequently, Figure 1f shows a significant drop in YOLOv9’s performance, highlighting the adverse effect of applying dehazing algorithms to haze-free images and underscoring the need for more autonomous and adaptive algorithms.
In the case of the hazy image, the presence of haze significantly impairs YOLOv9’s performance, with only two airplanes detected, as shown in Figure 1g. However, MB-TaylorFormer enhances YOLOv9’s performance in this scenario, as Figure 1h demonstrates, where four airplanes are detected ( improvement). This emphasizes the crucial role of dehazing algorithms in enhancing the effectiveness of aerial surveillance systems.
Recently, Lee et al. [] introduced an autonomous dehazing method that blends the input image with its dehazed counterpart, where the blending weights are determined based on the haziness degree of the input image. This method can be expressed as , where represents the blending output, is the input image, denotes the applied dehazing method, and is the blending weight. The autonomous dehazing process is defined as follows:
- If is haze-free, to ensure that no dehazing is applied.
- If is mildly or moderately hazy, to apply dehazing proportionally to the haziness degree.
- If is densely hazy, to perform full-scale dehazing.
Figure 2a presents a simplified block diagram of this algorithm. It is important to note that Lee et al. [] employed a global blending weight, which does not account for the local distribution of haze. To address this limitation, we propose the use of patch-based blending weights to enhance the local texture of the dehazed output. Additionally, we introduce an interpolation scheme to mitigate boundary artifacts that may arise from the use of patch-based weights. Figure 2b also illustrates the simplified block diagram of the proposed algorithm, with major contributions highlighted by pink boxes.
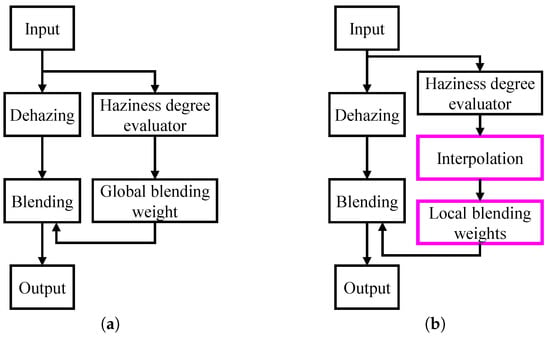
Figure 2.
Simplified block diagrams of autonomous dehazing algorithms. (a) Lee et al. []. (b) Proposed algorithm. Major contributions are highlighted by pink boxes.
2. Literature Review
The formation of hazy images is commonly described using the simplified Koschmieder model [], expressed as follows:
where represents the captured image, the clean image (or scene radiance), the global atmospheric light, the atmospheric scattering coefficient, d the scene depth, and the pixel coordinates. For simplicity, the pixel coordinates are omitted in subsequent expressions.
In this model, the term accounts for the multiplicative attenuation of light reflected from object surfaces as it travels to the camera aperture. Meanwhile, the term reflects the portion of atmospheric light scattered directly into the camera aperture. Single-image dehazing (SID) algorithms aim to recover the scene radiance from the observed image , which requires estimating , d, and . Consequently, SID is an inherently ill-posed problem. Existing SID methods can generally be categorized into two broad approaches: engineered methods and deep-learning-based methods.
2.1. Engineered Methods
To estimate , d, and from a single input image, leveraging prior knowledge is essential. He et al. [] introduced the dark channel prior (DCP), which posits that in most natural image patches (excluding sky or bright regions), there exist extremely dark pixels in at least one color channel. The DCP is an effective method for estimating the transmission map , relying on a channel-wise minimum operation followed by patch-based minimum filtering. He et al. [] suggested selecting as the brightest pixel within the top of pixels in the dark channel. Although DCP has been highly influential in single-image dehazing, DCP-based methods [,,] generally underperform in sky and bright regions.
Zhu et al. [] proposed the color attenuation prior (CAP), which asserts that scene depth is proportional to the difference between saturation and brightness. They employed a linear model for scene depth estimation, with model parameters derived via maximum likelihood estimation. The method for estimating global atmospheric light is similar to that of He et al. []. While this SID approach is computationally efficient and performs well, it can sometimes introduce color distortion and background noise, as noted in []. Consequently, CAP is often used to design fast and compact SID algorithms, as demonstrated in [,].
Berman et al. [] observed that pixels in haze-free images form tight clusters in RGB space, whereas under the influence of haze, pixels from the same cluster stretch into a line, referred to as a haze-line in []. This observation led to the haze-lines prior, wherein atmospheric light is estimated as the intersection of haze-lines in the RGB space using the Hough transform. To estimate the transmission map, pixels are clustered into haze-lines, and their distances to the origin are calculated. As pixels in the same cluster are dispersed throughout the image, the haze-lines prior is non-local and therefore more robust than local priors such as DCP and CAP. However, SID methods [,,] based on the haze-lines prior are susceptible to color distortion under non-homogeneous lighting conditions.
In addition to the aforementioned approaches, other effective and informative priors have been explored in the literature, including color ellipsoid [,], super-pixel [], and rank-one [] priors. Furthermore, SID can also be achieved through image enhancement techniques. Galdran [] proposed a method that fuses multiple under-exposed variants of the input image to perform SID. Specifically, the fusion is carried out in a multiscale manner, with the fusion weights derived from pixel-wise contrast and saturation. A subsequent study [] demonstrated that incorporating prior knowledge can further improve dehazing performance. Ancuti et al. [] combined multiscale image fusion and DCP to develop a SID method suitable for both day and night-time scenarios. They postulated that day and night-time images are captured under different lighting conditions, with the former under homogeneous and the latter under heterogeneous lighting. Accordingly, they generated two dehazing results: one using a large patch size to accommodate day-time homogeneous light and another using a small patch size to capture night-time heterogeneous light. These two results were then fused with a discrete Laplacian of the input to produce the final dehazed image.
In summary, engineered methods are computationally efficient and produce qualitatively favorable results, primarily due to their foundation in prior knowledge of the SID problem. This prior knowledge is derived from extensive engineering efforts and observations of real-world data. However, there are extreme cases where the prior knowledge may fail, leading to a sharp decline in the performance of engineered methods.
2.2. Deep-Learning Methods
One of the pioneering efforts in applying deep learning to the single-image dehazing problem is DehazeNet [], a convolutional neural network (CNN) comprising three stages: feature extraction, feature augmentation, and non-linear inference for transmission map estimation. The global atmospheric light is estimated using the method proposed by He et al. []. Compared to more recent deep learning models, DehazeNet is computationally efficient while delivering comparable performance. However, it suffers from the domain-shift problem due to the lack of real-world training data.
Ren et al. [] introduced a multiscale CNN (MSCNN) for transmission map estimation. Unlike DehazeNet, MSCNN employs a coarse-to-fine refinement approach, where a branch with large kernel sizes generates a coarse estimate, while another branch with small kernel sizes progressively refines the estimate to recover fine details. This refinement process is guided by holistic edges to ensure the smoothness of transmission map values within the same object. Despite its effectiveness, MSCNN was trained on a synthetic dataset where haze was artificially added to clean images, resulting in suboptimal performance on real-world images that significantly differ from the training data.
Dong et al. [] proposed a multiscale boosted dehazing network (MSBD) incorporating boosting and error feedback mechanisms to progressively refine the dehazing result and recover spatial image details. MSDB is a supervised network that requires a paired dataset for training, which leads to the same challenge of underperformance on real-world images due to the difficulty of obtaining real haze-free/hazy image pairs. In contrast, Li et al. [] developed an unsupervised model called “You Only Look Yourself” (YOLY). Inspired by the layer disentanglement principle in [], YOLY consists of three branches dedicated to estimating the scene radiance, transmission map, and global atmospheric light, respectively. By adhering to the simplified Koschmieder model, YOLY can reconstruct the input hazy image in a self-supervised manner.
Notably, YOLY relies solely on hazy images during the training phase, which Yang et al. [] argued leads to suboptimal performance due to the lack of information from haze-free images. To address this, they proposed a self-augmented unpaired image dehazing method (D4), which leverages both hazy and haze-free images in dehazing and rehazing cycles. D4’s training objectives include pseudo scattering coefficient supervision loss and pseudo depth supervision loss, aiming to learn physical properties that enhance the unpaired learning process. However, D4 tends to overestimate the transmission in bright regions of images. Subsequently, Yang et al. [] extended D4 to video dehazing, utilizing synthesized ego-motion and estimated depth information to improve spatial-temporal consistency.
Recently, recognizing the ill-posed nature of SID, researchers have focused on conditional variational autoencoders (CVAEs) [], vision transformers [,], and diffusion models []. Song et al. [] introduced DehazingFormer, which enhances the Swin Transformer with rescale layer normalization, soft ReLU, and spatial information aggregation. However, DehazingFormer demonstrated poor performance when tested on real-world datasets such as Dense-Haze [] and NH-Haze []. To improve the vision transformer, Qiu et al. [] employed Taylor series expansion to approximate softmax-attention, resulting in MB-TaylorFormer. They also introduced multiscale attention refinement modules to mitigate errors arising from Taylor expansion. Despite its innovations, MB-TaylorFormer is computationally inefficient and remains susceptible to the domain-shift problem.
Ding et al. [] utilized CVAEs to generate multiple dehazing results from a single input, which are then fused to produce a more accurate output. However, the high computational cost of generating multiple dehazing results and the limited generalization to real-world images are significant drawbacks. Huang et al. [] proposed a method that decomposes the image into null and range-space components and applies diffusion to non-overlapping image patches. This approach, however, suffers from boundary artifacts, necessitating additional computational resources for compensation. Other methods, such as those by Zheng et al. [] and Wu et al. [], sought to impose strict constraints on the generation of dehazed results. Zheng et al. [] applied curriculum constrastive regularization, categorizing negative samples into easy, hard, and ultra-hard based on PSNR values. Wu et al. [] considered various types of image degradation, including low-light illumination, color bias, and JPEG artifacts, to synthesize hazy images, aiming to learn high-quality priors for single-image dehazing. Despite these advancements, neither method achieves satisfactory dehazing performance on real-world images.
In conclusion, while deep learning methods offer potential, they often struggle with real-world generalization due to the complexities of training and dataset limitations.
3. Proposed Algorithm
Figure 3 presents the block diagram of the proposed algorithm. As outlined briefly in Section 1, the core idea is to blend the input image with its dehazed version based on the haze conditions, enabling autonomous single-image dehazing. The image is first processed through the following three modules:
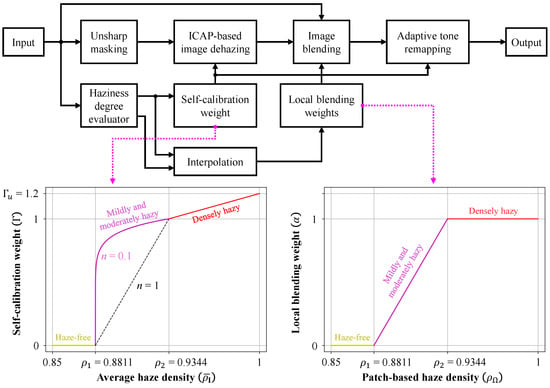
Figure 3.
Block diagram of the proposed algorithm. ICAP refers to the improved color attenuation prior. The bottom-left curve represents the self-calibration weight, calculated from the average haze density of the input image, which controls the dehazing strength to accommodate varying haze conditions. The bottom-right curve depicts the local blending weight, computed from the patch-based haze density map. This weight controls the blending process, where the algorithm fuses the input image and its dehazed version.
- Unsharp masking, which enhances edge details obscured by haze.
- Haziness degree evaluator, which computes the haze density map and the average haze density .
- Image blending, where the input image is combined with the dehazed result based on local haze conditions.
After the unsharp masking stage, the image undergoes dehazing based on the improved color attenuation prior (ICAP) []. The dehazing process is controlled by a self-calibration weight, derived from the average haze density. The image blending module then fuses the input image with the dehazed result using local weights calculated from the haze density map. Finally, the adaptive tone remapping module post-processes the blended result to compensate for dynamic range reduction, with guidance from the self-calibration weight.
3.1. Unsharp Masking
Unsharp masking is applied as a pre-processing step to enhance detail information obscured by haze. The process consists of four steps: RGB-to-YCbCr conversion, detail extraction, scaling factor calculation, and detail enhancement.
First, the input image is transformed from RGB to YCbCr color space, expressed as . Detail information, denoted as s, is extracted by convolving the luminance channel Y with the Laplacian operator , such that . To prevent over-enhancement, the scaling factor is calculated as a piecewise linear function of the local variance. The enhanced luminance is then obtained by adding the scaled detail information back to the original luminance, formulated as . Finally, the enhanced image is produced through YCbCr-to-RGB conversion. For a more detailed description, interested readers are referred to [] (Section III-A).
3.2. Adaptive Dehazing
Given the enhanced image , the scene radiance is computed by inverting the simplified Koschmieder model as follows:
where represents a lower bound derived from the no-black-pixel constraint. The derivation of and the transmission map estimation are detailed in []. The global atmospheric light is estimated using a quad-tree algorithm and compensated to prevent the false enlargement of bright objects, as described in [].
It follows from the relationship that the transmission map is exponentially related to scene depth. A previous study [] has demonstrated that scaling the scene depth according to the average haze density enhances dehazing performance. In this paper, we utilize the haziness degree evaluator [] to estimate the haze density map and the average haze density, with the scaling factor referred to as the self-calibration weight, as described in subsequent sections.
3.2.1. Haziness Degree Evaluator
In [], the haze density map was defined as the complement of the transmission map, expressed as . Thus, the task of finding the haze density map became equivalent to determining the optimal transmission map, which was obtained by optimizing the following objective function:
where represents the product of saturation and brightness, denotes sharpness, is the dark channel, is the regularization term, and is the regularization parameter. The regularization term was chosen as the reciprocal of t to ensure that could be solved analytically. As the result, the optimal transmission map , the haze density map , and the average haze density were defined as follows:
where represents the entire image domain and is the number of image pixels. Details regarding the expression for can be found in [] (Section 3.4).
3.2.2. Self-Calibration Weight
Given the average haze density , the self-calibration weight is computed as follows:
where the upper bound and the exponent n are both related to the dehazing power. To ensure that the proposed algorithm adapts to the haze conditions of the input image, is directly multiplied by the scene depth d. As depicted in the bottom left of Figure 3, the input image is classified into one of four categories–haze-free, mildly hazy, moderately hazy, and densely hazy–based on its average haze density. The threshold values and are adopted from [], where they were utilized to distinguish between hazy and haze-free images.
- If , the input image is classified as haze-free, and , indicating that no dehazing is required.
- If , the input image is classified as mildly or moderately hazy. Given that the average haze density varies exponentially, we set to ensure that also varies exponentially between zero and unity, signifying an exponentially increasing dehazing power.
- If , the input image is classified as densely hazy, and haze removal should be maximized. Consequently, is empirically configured to vary linearly from unity to an upper bound .
Once the self-calibration weight is calculated, the transmission map t is Equation (2) is updated to . With the global atmospheric light estimated via the quad-tree decomposition algorithm [], all variables on the right-hand side of Equation (2) are now known, enabling the computation of the dehazed result .
3.3. Image Blending
Following adaptive image dehazing, the input image is blended with the dehazed output , as expressed by . In the method proposed by Lee et al. [], a global blending weight was employed for simplicity, which facilitated the design of a hardware accelerator. However, this global blending approach does not adequately account for local variations, particularly in remote sensing applications, where images often contain regions with distinctly different characteristics (for example, urban versus rural areas). To address this limitation, we employ patch-based blending weights , as defined below, to achieve improved results.
where represents the interpolated patch-based haze density map, calculated from the haze density map . Blending weights are defined as a piecewise linear function of the patch-based haze density map, allowing the blending step to combine input patches with their corresponding dehazed versions based on local haze conditions, as follows:
- Haze-free patches are preserved in the blending result ().
- Mildly or moderately hazy patches are fused with their corresponding dehazed versions according to the blending weight .
- Densely hazy patches are fully dehazed (), meaning that only the dehazed information appears in the blending result.
However, performing image blending using patch-based weights may introduce boundary artifacts. Figure 4 presents a hazy image (sourced from the O-HAZE [] dataset) alongside the corresponding blending result obtained using patch-based weights. The image was divided into patches and overlaid with the average haze density values for each patch, calculated as:
where denotes a patch within the image, and represents the number of pixels within . In the blending result, two regions, marked by red rectangles, exhibit boundary artifacts. These artifacts arise from abrupt changes in patch-based haze densities, exemplified by transitions such as in the first region and in the second region. For clarity, these values were min-max normalized.
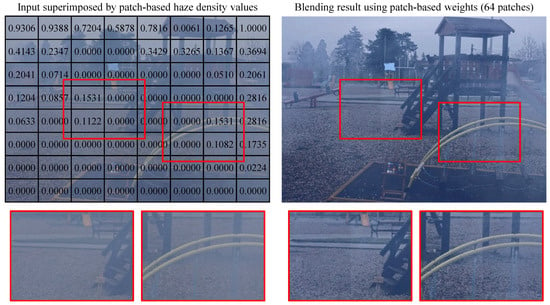
Figure 4.
Hazy image and the corresponding blending result using patch-based weights. The patch-based haze density values have been min-max normalized for clarity.
To address boundary artifacts, we propose an interpolation scheme wherein the patch-based haze density map is first passed through a low-pass filter and then subjected to bilinear interpolation. Figure 5 illustrates the proposed scheme using an image region from Figure 4, where abrupt changes in patch-based haze density values are observed, leading to boundary artifacts in the blending result.
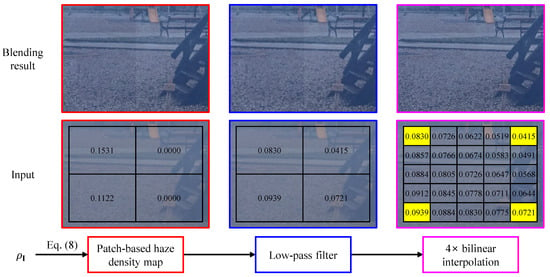
Figure 5.
Illustration of the proposed interpolation scheme. The patch-based haze density values have been min-max normalized for clarity.
The initial step of low-pass filtering involves convolving the patch-based haze density map with a moving average kernel. While this efficiently smooths transitions from to , boundary artifacts still persist. To further reduce these artifacts, we apply bilinear interpolation, which smooths the transitions in patch-based haze density values even more. As illustrated in Figure 5, the horizontal and vertical transitions in haze density values are now significantly more gradual, eliminating boundary artifacts in the blending result. This demonstrates the effectiveness of the proposed interpolation scheme.
3.4. Adaptive Tone Remapping
Dehazing, which fundamentally involves subtracting haze from the input image, inevitably results in a darker image. To counteract this, we applied adaptive tone remapping (ATR) to post-process the blending result, enhancing both luminance and chrominance. Details about ATR can be found in [] (Section III-C). In this paper, we introduce a slight modification to ATR, guiding the enhancement process using the self-calibration weight discussed in Section 3.2.2.
Let L and C represent the luminance and chrominance of the blending result, respectively. The enhanced luminance and chrominance are expressed as follows:
where and denote the luminance and chrominance gains, and and are the adaptive luminance and chrominance weights. We introduced in Equation (11) to implement the idea that the degree of enhancement should be proportional to the amount of haze removed. This concept is implicitly reflected in Equation (11), where the gain .
To verify the effectiveness of ATR, consider the hazy image in Figure 4. Histograms of the red, green, and blue channels for this image, as well as for the images immediately before and after ATR, are depicted in Figure 6. Note that the image immediately before ATR is the blending result, while the one after ATR is the final result. It is evident from Figure 6 that the histograms of the blending result were shifted toward the lower intensity region, indicating that haze was removed from the input image. This also suggests that the image was darkened. By applying ATR, the image intensities were spread out across the intensity range, as illustrated by the histograms in pink. This demonstrates the success of luminance and chrominance enhancement, as well as dynamic range expansion.

Figure 6.
Histograms of red, green, and blue channels for the input image, as well as the images before and after ATR (adaptive tone remapping).
We used the following metric the quantify the dynamic range:
where and represent the maximum and minimum intensities, respectively. Table 1 summarizes the dynamic range values in decibels (dB). The proposed autonomous dehazing algorithm blends the input image with its dehazing result, thereby retaining high image intensities, even though most image intensities are shifted toward zero. This process approximately doubles the values of the input image. ATR further extends the dynamic range, as shown in the “Improvement” column of Table 1.

Table 1.
Dynamic range quantification. ATR stands for adaptive tone remapping. The “Improvement” column indicates the increase in dynamic range from the “Before ATR” to the “After ATR” column.
4. Experimental Results
In this section, we present a comparative evaluation of the proposed algorithm against five benchmark algorithms: DCP [], CAP [], DehazeNet [], YOLY [], and MB-TaylorFormer []. Among these, DCP and CAP are engineered methods, while DehazeNet, YOLY, and MB-TaylorFormer are deep-learning-based approaches.
We employed five public datasets for evaluation: FRIDA2 [], D-HAZY [], O-HAZE [], I-HAZE [], and Dense-Haze []. The FRIDA2 dataset contains 66 haze-free images and 264 hazy images, all generated using computer graphics, depicting various road scenes from the driver’s point of view. D-HAZY is another synthetic dataset comprising 1472 pairs of haze-free and hazy images, where the hazy images are generated using scene depth information captured by a Microsoft Kinect camera. In contrast, O-HAZE, I-HAZE, and Dense-Haze are real-world datasets, consisting of 45, 30, and 55 pairs of indoor, outdoor, and mixed indoor/outdoor images, respectively. Table 2 provides a summary of these datasets.

Table 2.
Summary of evaluation datasets.
4.1. Qualitative Evaluation
Figure 7 demonstrates the dehazing performance of six methods on images with various haze conditions. The haze condition of each image was determined by comparing its average haze density, , against two thresholds, and . The last column, labeled “Failure”, corresponds to cases where the input image is haze-free but was misclassified as hazy by the proposed algorithm.
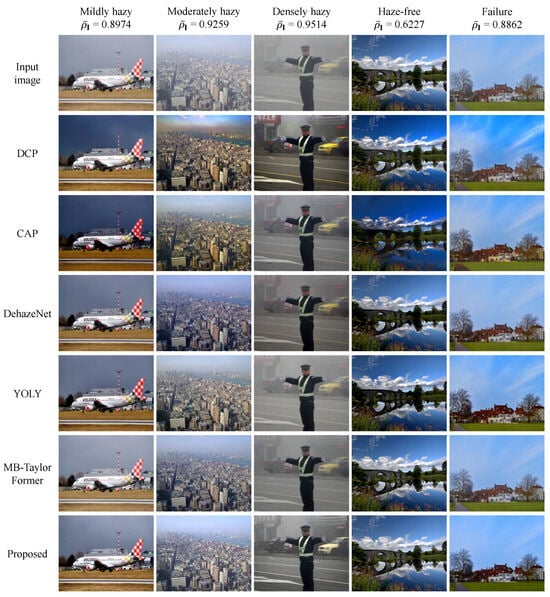
Figure 7.
Qualitative evaluation of the proposed algorithm compared to five benchmark methods on images with varying haze conditions. The haze condition was determined by comparing the average haze density, , against two thresholds, and .
It can be observed that engineered methods (DCP and CAP) tend to excessively dehaze input images, resulting in over-saturated outputs, as seen in the sky regions of mildly, moderately and haze-free images. In contrast, deep learning methods (DehazeNet, YOLY, and MB-TaylorFormer) produce more visually satisfying results without noticeable artifacts. However, they share a common limitation related to the domain-shift problem, meaning they may perform less effectively on images that differ from those used in their training. Among these methods, the recent MB-TaylorFormer exhibits the best performance across the five cases presented in Figure 7.
The proposed method performs comparatively to deep learning methods while clearly outperforming engineered methods. It effectively handles both haze-free and hazy images under different haze conditions. Notably, its dehazing performance is the most visually pleasing, attributed to the use of local blending weights and adaptive tone remapping. In the “Failure” column, although the proposed method misclassified a haze-free image as hazy and performed dehazing, the result did not exhibit any visual artifacts.
We also compared the dehazing performance on an airport aerial image and its hazy variants (created using the haze synthesis process presented in []). As depicted in Figure 8, DCP demonstrates strong dehazing power, which is beneficial for images with moderate and dense haze but may impair haze-free and mildly hazy images. CAP, DehazeNet, and YOLY perform fairly well on haze-free, mildly, and moderately hazy images; however, their performance on densely hazy images is less impressive. Similar to DCP, MB-TaylorFormer shows strong dehazing power, which may not be advantageous for haze-free and mildly hazy images.
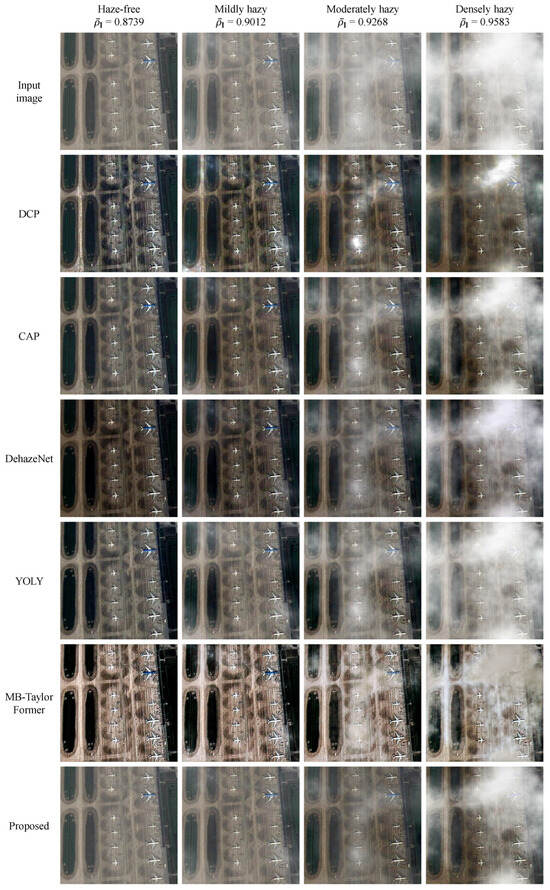
Figure 8.
Qualitative evaluation of the proposed algorithm and five benchmark methods on an airport aerial image under different haze conditions. The haze condition was determined by comparing the average haze density, , against two thresholds, and .
In contrast, the proposed method effectively handles varying haze conditions. It accurately classifies input images as haze-free, mildly, moderately, or densely hazy and processes them accordingly. The use of local blending weights, derived from local haze densities, enhances texture details and produces visually satisfying results. In Section 4.4, we will reuse the images from Figure 8 to analyze the object detection performance of the YOLOv9 algorithm.
4.2. Quantitative Evaluation
For quantitative assessment, we utilized two metrics: the feature similarity extended to color images (FSIMc) [] and the tone-mapped image quality index (TMQI) []. Both metrics range from zero to one, with higher values indicating better performance. To obtain FSIMc and TMQI results, we used the source code and pretrained model (for deep learning methods) provided by the respective authors. Notably, for MB-TaylorFormer, which has six different pretrained models, we selected the model that achieved the highest average score of .
Table 3 summarizes the average FSIMc and TMQI values across five datasets, with the best and second-best results boldfaced and italicized, respectively. In terms of FSIMc, the proposed method exhibits the best performance on FRIDA2 and I-HAZE, though the difference compared to the second-best deep learning methods (DehazeNet and MB-TaylorFormer) is marginal. On D-HAZY, O-HAZE, and Dense-Haze, the proposed method ranks fourth, third, and third, respectively, showing comparable performance to the top two methods. Regarding TMQI, the proposed method ranks first on O-HAZE and second on I-HAZE, but is ranked third, fourth, and third on FRIDA2, D-HAZY, and Dense-Haze, respectively.

Table 3.
Average quantitative results across different datasets. The best and second-best results are boldfaced and italicized, respectively. MB-TF is the shorthand notation for MB-TaylorFormer. The upward arrow indicates that higher values are better.
Overall, the proposed method ranks first or second in terms of FSIMc and TMQI, demonstrating its satisfactory dehazing performance relative to both engineered and deep learning benchmark methods.
The underperformance of YOLY is noteworthy. As discussed in Section 2, YOLY is an unsupervised method trained solely on hazy images, which limits its knowledge of the haze-free domain. This limitation affects the calculation of FSIMc and TMQI, which require haze-free images. Consequently, while YOLY performs reasonably in qualitative evaluations, it underperforms in quantitative assessments.
4.3. Execution Time Evaluation
Table 4 summarizes the execution time of six methods across different image resolutions, ranging from (VGA) to (8K UHD). The measurements were conducted on a host computer equipped with an Intel Core i9-9900K (3.6 GHz) CPU, 64 GB of RAM, and an Nvidia TITAN RTX.

Table 4.
Execution time in seconds of six methods on different image resolutions. The best and second-best results are boldfaced and italicized, respectively. NA stands for not available with the underlying cause, REx (RAM Exhaustion) or MEx (Memory Exhaustion), in parentheses.
As observed, two deep-learning-based methods, YOLY and MB-TaylorFormer, are the least efficient in terms of time and memory usage. This result aligns with the well-known drawback of deep learning methods: high computational cost. Notably, RAM and GPU memory were exhausted when these methods were applied to DCI 4K and 8K UHD images. Consequently, the execution time for these resolutions is marked as not available. Similarly, the DCP method is computationally inefficient, with its execution time increasing exponentially as image resolution increases, leading to RAM exhaustion during the processing of 8K UHD images.
The top three methods in terms of efficiency are CAP, our proposed algorithm, and DehazeNet. CAP, as discussed in Section 2, is a fast and compact algorithm for single-image dehazing, and this evaluation further supports that fact. Our proposed method ranks second in terms of processing speed, approximately twice as slow as CAP. However, it is important to note that the proposed method features autonomous dehazing capabilities and outperforms CAP in both qualitative and quantitative assessments.
4.4. Remote Sensing Application
Figure 9 illustrates and Table 5 summarizes the detection results of the YOLOv9 object detection algorithm on an airport aerial image under various haze conditions. In the case of the haze-free image, all five benchmark algorithms fail to recognize the haze-free status and attempt to remove haze, which degrades image quality and reduces YOLOv9’s performance. For example, the number of correctly detected airplanes decreases by 1, 2, 1, 5, and 4 for DCP, CAP, DehazeNet, YOLY, and MB-TaylorFormer, respectively.
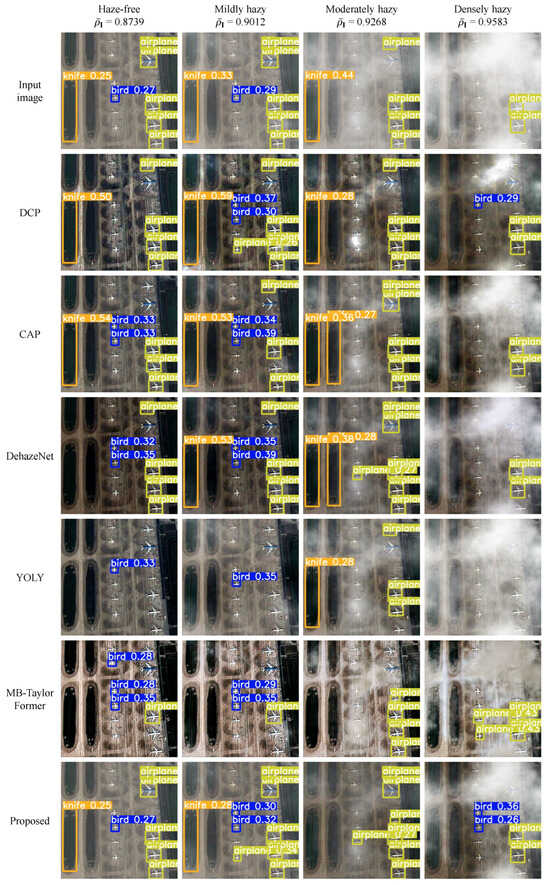
Figure 9.
Detection results of the YOLOv9 object detection algorithm on an airport aerial image under various haze conditions. The haze condition was determined by comparing the average haze density, , against two thresholds, and . Notes: yellow labels represent airplanes, blue labels represent birds, and orange labels represent knifes.

Table 5.
Summary of detection results for the YOLOv9 object detection algorithm.
A similar observation is noted for mildly hazy images. However, when the image is affected by moderate or dense haze, most benchmark algorithms, except for YOLY, begin to benefit YOLOv9, either by increasing the number of correctly detected airplanes or by decreasing the number of false detections.
In all scenarios, the proposed algorithm consistently enhances YOLOv9’s performance, particularly in moderately hazy conditions, where YOLOv9 demonstrates a improvement with no detection failures. However, for densely hazy images, while YOLOv9 detects four objects, two of them are misclassified as birds. In this situation, the proposed algorithm underperforms slightly compared to MB-TaylorFormer.
5. Conclusions
In this paper, we introduced an autonomous single-image dehazing algorithm consisting of four key steps: unsharp masking, adaptive dehazing, image blending, and adaptive tone remapping. Our primary contribution is the use of patch-based blending weights to merge the input image with its dehazed result, which enhances local textures and produces a more visually appealing output. To address boundary artifacts, we proposed an interpolation scheme to smooth out abrupt changes in the patch-based haze density map. We conducted a comparative evaluation against five benchmark methods, including both engineered and deep-learning-based approaches. Qualitative, quantitative, and execution time evaluations demonstrated the effectiveness of the proposed algorithm. Furthermore, an application of image dehazing in aerial object detection highlighted the crucial role of our autonomous dehazing method in remote sensing applications.
Author Contributions
Conceptualization, Y.C. and B.K.; methodology, Y.C. and B.K.; software, D.N. and S.H.; data curation, S.H.; writing—original draft preparation, D.N.; writing—review and editing, S.H., D.N., Y.C. and B.K.; visualization, D.N.; supervision, Y.C. and B.K. All authors have read and agreed to the published version of the manuscript.
Funding
This research was funded by research funds from Dong-A University, Busan, Korea.
Institutional Review Board Statement
Not applicable.
Informed Consent Statement
Not applicable.
Data Availability Statement
Data are available in a publicly accessible repository. The data presented in this study are openly available in [,,,,].
Conflicts of Interest
The authors declare no conflicts of interest.
References
- Chen, W.; Zhu, Y.; Tian, Z.; Zhang, F.; Yao, M. Occlusion and multi-scale pedestrian detection: A review. Array 2023, 19, 100318. [Google Scholar] [CrossRef]
- Park, S.; Kim, H.; Ro, Y.M. Robust pedestrian detection via constructing versatile pedestrian knowledge bank. Pattern Recognit. 2024, 153, 110539. [Google Scholar] [CrossRef]
- Milanés, V.; Llorca, D.F.; Villagrá, J.; Pérez, J.; Parra, I.; González, C.; Sotelo, M.A. Vision-based active safety system for automatic stopping. Expert Syst. Appl. 2012, 39, 11234–11242. [Google Scholar] [CrossRef]
- Socha, K.; Borg, M.; Henriksson, J. SMIRK: A machine learning-based pedestrian automatic emergency braking system with a complete safety case. Softw. Impacts 2022, 13, 100352. [Google Scholar] [CrossRef]
- Patil, P.W.; Dudhane, A.; Kulkarni, A.; Murala, S.; Gonde, A.B.; Gupta, S. An Unified Recurrent Video Object Segmentation Framework for Various Surveillance Environments. IEEE Trans. Image Process. 2021, 30, 7889–7902. [Google Scholar] [CrossRef]
- Patil, P.; Singh, J.; Hambarde, P.; Kulkarni, A.; Chaudhary, S.; Murala, S. Robust Unseen Video Understanding for Various Surveillance Environments. In Proceedings of the 2022 18th IEEE International Conference on Advanced Video and Signal Based Surveillance (AVSS), Madrid, Spain, 29 November–2 December 2022; pp. 1–8. [Google Scholar] [CrossRef]
- Xia, G.S.; Hu, J.; Hu, F.; Shi, B.; Bai, X.; Zhong, Y.; Zhang, L.; Lu, X. AID: A Benchmark Data Set for Performance Evaluation of Aerial Scene Classification. IEEE Trans. Geosci. Remote Sens. 2017, 55, 3965–3981. [Google Scholar] [CrossRef]
- Qiu, Y.; Zhang, K.; Wang, C.; Luo, W.; Li, H.; Jin, Z. MB-TaylorFormer: Multi-branch Efficient Transformer Expanded by Taylor Formula for Image Dehazing. In Proceedings of the 2023 IEEE/CVF International Conference on Computer Vision (ICCV), Paris, France, 1–6 October 2023; pp. 12756–12767. [Google Scholar] [CrossRef]
- Wang, C.Y.; Liao, H.Y.M. YOLOv9: Learning What You Want to Learn Using Programmable Gradient Information. arXiv 2024, arXiv:2402.13616. [Google Scholar] [CrossRef]
- Ngo, D.; Lee, G.D.; Kang, B. Haziness Degree Evaluator: A Knowledge-Driven Approach for Haze Density Estimation. Sensors 2021, 21, 3896. [Google Scholar] [CrossRef] [PubMed]
- Lee, S.; Ngo, D.; Kang, B. Design of an FPGA-Based High-Quality Real-Time Autonomous Dehazing System. Remote Sens. 2022, 14, 1852. [Google Scholar] [CrossRef]
- Lee, Z.; Shang, S. Visibility: How Applicable is the Century-Old Koschmieder Model? J. Atmos. Sci. 2016, 73, 4573–4581. [Google Scholar] [CrossRef]
- He, K.; Sun, J.; Tang, X. Single Image Haze Removal Using Dark Channel Prior. IEEE Trans. Pattern Anal. Mach. Intell. 2011, 33, 2341–2353. [Google Scholar] [CrossRef]
- Tang, Q.; Yang, J.; He, X.; Jia, W.; Zhang, Q.; Liu, H. Nighttime image dehazing based on Retinex and dark channel prior using Taylor series expansion. Comput. Vis. Image Underst. 2021, 202, 103086. [Google Scholar] [CrossRef]
- Dwivedi, P.; Chakraborty, S. Single image dehazing using extended local dark channel prior. Image Vis. Comput. 2023, 136, 104747. [Google Scholar] [CrossRef]
- Liang, S.; Gao, T.; Chen, T.; Cheng, P. A Remote Sensing Image Dehazing Method Based on Heterogeneous Priors. IEEE Trans. Geosci. Remote Sens. 2024, 62, 5619513. [Google Scholar] [CrossRef]
- Zhu, Q.; Mai, J.; Shao, L. A Fast Single Image Haze Removal Algorithm Using Color Attenuation Prior. IEEE Trans. Image Process. 2015, 24, 3522–3533. [Google Scholar] [CrossRef] [PubMed]
- Ngo, D.; Lee, G.D.; Kang, B. Improved Color Attenuation Prior for Single-Image Haze Removal. Appl. Sci. 2019, 9, 4011. [Google Scholar] [CrossRef]
- Ngo, D.; Lee, G.D.; Kang, B. Singe Image Dehazing With Unsharp Masking and Color Gamut Expansion. IEEE Access 2022, 10, 102462–102474. [Google Scholar] [CrossRef]
- Ngo, D.; Kang, B. A Symmetric Multiprocessor System-on-a-Chip-Based Solution for Real-Time Image Dehazing. Symmetry 2024, 16, 653. [Google Scholar] [CrossRef]
- Berman, D.; Treibitz, T.; Avidan, S. Single Image Dehazing Using Haze-Lines. IEEE Trans. Pattern Anal. Mach. Intell. 2020, 42, 720–734. [Google Scholar] [CrossRef]
- Zhu, Z.; Luo, Y.; Wei, H.; Li, Y.; Qi, G.; Mazur, N.; Li, Y.; Li, P. Atmospheric Light Estimation Based Remote Sensing Image Dehazing. Remote Sens. 2021, 13, 2432. [Google Scholar] [CrossRef]
- Ling, P.; Chen, H.; Tan, X.; Jin, Y.; Chen, E. Atmospheric Light Estimation Based Remote Sensing Image Dehazing. IEEE Trans. Image Process. 2023, 32, 3238–3253. [Google Scholar] [CrossRef] [PubMed]
- Xie, J.; Jin, X. Thermal Infrared Guided Color Image Dehazing. In Proceedings of the 2023 IEEE International Conference on Image Processing (ICIP), Kuala Lumpur, Malaysia, 8–11 October 2023; pp. 2465–2469. [Google Scholar] [CrossRef]
- Bui, T.M.; Kim, W. Single Image Dehazing Using Color Ellipsoid Prior. IEEE Trans. Image Process. 2018, 27, 999–1009. [Google Scholar] [CrossRef]
- Wang, Y.; Hu, J.; Zhang, R.; Wang, L.; Zhang, R.; Liu, X. Heterogeneity constrained color ellipsoid prior image dehazing algorithm. J. Vis. Commun. Image Represent. 2024, 101, 104177. [Google Scholar] [CrossRef]
- Qiu, Z.; Gong, T.; Liang, Z.; Chen, T.; Cong, R.; Bai, H.; Zhao, Y. Perception-Oriented UAV Image Dehazing Based on Super-Pixel Scene Prior. IEEE Trans. Geosci. Remote Sens. 2024, 62, 5913519. [Google Scholar] [CrossRef]
- Liu, J.; Liu, R.W.; Sun, J.; Zeng, T. Rank-One Prior: Real-Time Scene Recovery. IEEE Trans. Pattern Anal. Mach. Intell. 2023, 45, 8845–8860. [Google Scholar] [CrossRef] [PubMed]
- Galdran, A. Image dehazing by artificial multiple-exposure image fusion. Signal Process. 2018, 149, 135–147. [Google Scholar] [CrossRef]
- Ancuti, C.; Ancuti, C.O.; De Vleeschouwer, C.; Bovik, A.C. Day and Night-Time Dehazing by Local Airlight Estimation. IEEE Trans. Image Process. 2020, 29, 6264–6275. [Google Scholar] [CrossRef] [PubMed]
- Cai, B.; Xu, X.; Jia, K.; Qing, C.; Tao, D. DehazeNet: An End-to-End System for Single Image Haze Removal. IEEE Trans. Image Process. 2016, 25, 5187–5198. [Google Scholar] [CrossRef] [PubMed]
- Ren, W.; Pan, J.; Zhang, H.; Cao, X.; Yang, M.H. Single Image Dehazing via Multi-scale Convolutional Neural Networks with Holistic Edges. Int. J. Comput. Vis. 2020, 128, 240–259. [Google Scholar] [CrossRef]
- Dong, H.; Pan, J.; Xiang, L.; Hu, Z.; Zhang, X.; Wang, F.; Yang, M.H. Multi-Scale Boosted Dehazing Network With Dense Feature Fusion. In Proceedings of the 2020 IEEE/CVF Conference on Computer Vision and Pattern Recognition (CVPR), Seattle, WA, USA, 13–19 June 2020; pp. 2154–2164. [Google Scholar] [CrossRef]
- Li, B.; Gou, Y.; Gu, S.; Liu, J.Z.; Zhou, J.T.; Peng, X. You Only Look Yourself: Unsupervised and Untrained Single Image Dehazing Neural Network. Int. J. Comput. Vis. 2021, 129, 1754–1767. [Google Scholar] [CrossRef]
- Li, B.; Gou, Y.; Liu, J.Z.; Zhu, H.; Zhou, J.T.; Peng, X. Zero-Shot Image Dehazing. IEEE Trans. Image Process. 2020, 29, 8457–8466. [Google Scholar] [CrossRef] [PubMed]
- Yang, Y.; Wang, C.; Liu, R.; Zhang, L.; Guo, X.; Tao, D. Self-augmented Unpaired Image Dehazing via Density and Depth Decomposition. In Proceedings of the 2022 IEEE/CVF Conference on Computer Vision and Pattern Recognition (CVPR), New Orleans, LA, USA, 18–24 June 2022; pp. 2027–2036. [Google Scholar] [CrossRef]
- Yang, Y.; Guo, C.L.; Guo, X. Depth-Aware Unpaired Video Dehazing. IEEE Trans. Image Process. 2024, 33, 2388–2403. [Google Scholar] [CrossRef] [PubMed]
- Ding, H.; Xie, F.; Qiu, L.; Zhang, X.; Shi, Z. Robust Haze and Thin Cloud Removal via Conditional Variational Autoencoders. IEEE Trans. Geosci. Remote Sens. 2024, 62, 5604616. [Google Scholar] [CrossRef]
- Song, Y.; He, Z.; Qian, H.; Du, X. Vision Transformers for Single Image Dehazing. IEEE Trans. Image Process. 2023, 32, 1927–1941. [Google Scholar] [CrossRef]
- Huang, Y.; Lin, Z.; Xiong, S.; Sun, T. Diffusion Models Based Null-Space Learning for Remote Sensing Image Dehazing. IEEE Geosci. Remote Sens. Lett. 2024, 21, 8001305. [Google Scholar] [CrossRef]
- Ancuti, C.O.; Ancuti, C.; Timofte, R.; Van Gool, L.; Zhang, L.; Yang, M.H.; Guo, T.; Li, X.; Cherukuri, V.; Monga, V.; et al. NTIRE 2019 Image Dehazing Challenge Report. In Proceedings of the 2019 IEEE/CVF Conference on Computer Vision and Pattern Recognition Workshops (CVPRW), Long Beach, CA, USA, 16–17 June 2019; pp. 2241–2253. [Google Scholar] [CrossRef]
- Ancuti, C.O.; Ancuti, C.; Vasluianu, F.A.; Timofte, R.; Liu, J.; Wu, H.; Xie, Y.; Qu, Y.; Ma, L.; Huang, Z.; et al. NTIRE 2020 Challenge on NonHomogeneous Dehazing. In Proceedings of the 2020 IEEE/CVF Conference on Computer Vision and Pattern Recognition Workshops (CVPRW), Seattle, WA, USA, 14–19 June 2020; pp. 2029–2044. [Google Scholar] [CrossRef]
- Zheng, Y.; Zhan, J.; He, S.; Dong, J.; Du, Y. Curricular Contrastive Regularization for Physics-Aware Single Image Dehazing. In Proceedings of the 2023 IEEE/CVF Conference on Computer Vision and Pattern Recognition (CVPR), Vancouver, BC, Canada, 17–24 June 2023; pp. 5785–5794. [Google Scholar] [CrossRef]
- Wu, R.Q.; Duan, Z.P.; Guo, C.L.; Chai, Z.; Li, C. RIDCP: Revitalizing Real Image Dehazing via High-Quality Codebook Priors. In Proceedings of the 2023 IEEE/CVF Conference on Computer Vision and Pattern Recognition (CVPR), Vancouver, BC, Canada, 17–24 June 2023; pp. 22282–22291. [Google Scholar] [CrossRef]
- Ngo, D.; Lee, S.; Lee, G.D.; Kang, B. Single-Image Visibility Restoration: A Machine Learning Approach and Its 4K-Capable Hardware Accelerator. Sensors 2020, 20, 5795. [Google Scholar] [CrossRef] [PubMed]
- Ngo, D.; Lee, S.; Kang, U.J.; Ngo, T.M.; Lee, G.D.; Kang, B. Adapting a Dehazing System to Haze Conditions by Piece-Wisely Linearizing a Depth Estimator. Sensors 2022, 22, 1957. [Google Scholar] [CrossRef] [PubMed]
- Ancuti, C.O.; Ancuti, C.; Timofte, R.; De Vleeschouwer, C. O-HAZE: A Dehazing Benchmark with Real Hazy and Haze-Free Outdoor Images. In Proceedings of the 2018 IEEE/CVF Conference on Computer Vision and Pattern Recognition Workshops (CVPRW), Salt Lake City, UT, USA, 18–22 June 2018; pp. 867–8678. [Google Scholar] [CrossRef]
- Tarel, J.P.; Hautiere, N.; Caraffa, L.; Cord, A.; Halmaoui, H.; Gruyer, D. Vision Enhancement in Homogeneous and Heterogeneous Fog. IEEE Intell. Transp. Syst. Mag. 2012, 4, 6–20. [Google Scholar] [CrossRef]
- Ancuti, C.; Ancuti, C.O.; De Vleeschouwer, C. D-HAZY: A dataset to evaluate quantitatively dehazing algorithms. In Proceedings of the 2016 IEEE International Conference on Image Processing (ICIP), Phoenix, AZ, USA, 25–28 September 2016; pp. 2226–2230. [Google Scholar] [CrossRef]
- Ancuti, C.; Ancuti, C.O.; Timofte, R.; Van Gool, L.; Zhang, L.; Yang, M.H.; Patel, V.M.; Zhang, H.; Sindagi, V.A.; Zhao, R.; et al. NTIRE 2018 Challenge on Image Dehazing: Methods and Results. In Proceedings of the 2018 IEEE/CVF Conference on Computer Vision and Pattern Recognition Workshops (CVPRW), Salt Lake City, UT, USA, 18–22 June 2018; pp. 1004–100410. [Google Scholar] [CrossRef]
- Zhang, L.; Zhang, L.; Mou, X.; Zhang, D. FSIM: A Feature Similarity Index for Image Quality Assessment. IEEE Trans. Image Process. 2011, 20, 2378–2386. [Google Scholar] [CrossRef]
- Yeganeh, H.; Wang, Z. Objective Quality Assessment of Tone-Mapped Images. IEEE Trans. Image Process. 2013, 22, 657–667. [Google Scholar] [CrossRef] [PubMed]
Disclaimer/Publisher’s Note: The statements, opinions and data contained in all publications are solely those of the individual author(s) and contributor(s) and not of MDPI and/or the editor(s). MDPI and/or the editor(s) disclaim responsibility for any injury to people or property resulting from any ideas, methods, instructions or products referred to in the content. |
© 2024 by the authors. Licensee MDPI, Basel, Switzerland. This article is an open access article distributed under the terms and conditions of the Creative Commons Attribution (CC BY) license (https://creativecommons.org/licenses/by/4.0/).