Article

A General On-Orbit Absolute Radiometric Calibration Method Compatible with Multiple Imaging Conditions

Changguang Satellite Technology Co., Ltd., Changchun 130000, China
*
Author to whom correspondence should be addressed.
Remote Sens. 2024, 16(18), 3503; https://doi.org/10.3390/rs16183503
Submission received: 26 August 2024 / Revised: 10 September 2024 / Accepted: 19 September 2024 / Published: 21 September 2024
(This article belongs to the Special Issue Optical Remote Sensing Payloads, from Design to Flight Test)

Abstract

:
On-orbit absolute radiometric calibration is not only a prerequisite for the quantitative application of optical remote sensing satellite data but also a key step in ensuring the accuracy and reliability of satellite observation data. Due to the diversity of imaging conditions for optical remote sensing satellite sensors, on-orbit absolute radiometric calibration usually requires a large number of imaging tasks and manual labor to calibrate each imaging condition. This seriously limits the timeliness of on-orbit absolute radiometric calibration and is also an urgent problem to be solved in the context of the explosive growth of satellite numbers. Based on this, we propose a general on-orbit absolute radiometric calibration method compatible with multiple imaging conditions. Firstly, we use a large amount of laboratory radiometric calibration data to explore the mathematical relationship between imaging conditions (row transfer time, integration level and gain), radiance, and DN, and successfully build an imaging condition compatibility model. Secondly, we combine the imaging condition compatibility model with cross calibration to achieve a general on-orbit absolute radiometric calibration method. We use cross calibration to obtain the reference radiance and corresponding DN of the target satellites, which calculates the general coefficient by using row transfer time, integration level, and gain, and use the general coefficient to calibrate all imaging conditions. Finally, we use multiple imaging tasks of the JL1GF03D11 satellites to verify the effectiveness of the proposed method. The experiments show that the average relative difference was reduced to 2.79% and the RMSE was reduced to 1.51, compared with the laboratory radiometric calibration method. In addition, we also verify the generality of the proposed method by using 10 satellites of the Jilin-1 GF03D series. The experiment shows that the goodness of fit of the general coefficient is all greater than 95%, and the average relative difference between the reference radiance and the calibrated radiance of the proposed method is 2.46%, with an RMSE of 1.67. To sum up, by using the proposed method, all imaging conditions of optical remote sensing satellite sensor can be calibrated in one imaging task, which greatly improves the timeliness and accuracy of on-orbit absolute radiometric calibration.

Graphical Abstract

1. Introduction

The on-orbit absolute radiometric calibration of optical remote sensing satellites is an indispensable key step in the field of satellite remote sensing. Its main purpose is to convert DN by the satellite sensor into radiance, thereby eliminate the error of the sensor and ensure that remote sensing data can accurately reflect the radiometric characteristics of the surface features [1]. However, the diversity imaging conditions of sensors pose great challenges to on-orbit absolute radiometric calibration. Optical remote sensing satellite sensors are generally divided into Charge-Coupled Devices (CCDs) and Complementary Metal Oxide Semiconductors (CMOSs) [2]. In order to improve the image quality, the imaging conditions of sensors are usually adjusted to adapt to different surface features [3]. When the radiance and energy are the same, the DN of the sensor will change with the imaging conditions, and the response characteristics of the sensor will also change [4,5]. Therefore, each imaging condition of the sensor needs to be independently calibrated for on-orbit absolute radiation, which requires a lot of manual labor and satellite resource consumption [6]. This is also an urgent problem to be solved against the backdrop of the explosive growth in the number of satellites.
The imaging conditions generally have three parameters: row transfer time, integration level and gain [7]. Row transfer time represents the time it takes for a pixel’s charge packet to move to the next pixel. The charge packet of pixels needs to be moved out of the horizontal shift register, amplified, and digitized, all of which require time in CCDs [8]. Integration level is a key parameter that determines the time when a pixel collects photons, thereby affecting the brightness and contrast of the image. The higher the integration level, the more photons the pixels collect, and the stronger the generated charge signal, resulting in a brighter image. On the contrary, the lower the integration level, the fewer photons collected by pixels, and the image will be relatively darker. The integration level can be designed as 6/12/24/48/96, etc. This adjustable integration level makes the sensor have greater flexibility in exposure time, also improving imaging quality [9]. Gain refers to the process of electronically amplifying the image signal, which is the ratio of the output charge of the sensor to the input charge. It usually represents how many counts an electron corresponds to, or how many counts correspond to an electron. For example, high gain (high sensitivity) is suitable for weak light conditions, while low gain is suitable for strong light conditions. Increasing gain will increase digital noise, while reducing gain can minimize noise to achieve optimal resolution, but may result in a loss of well depth and sacrificing some sensitivity [10]. To sum up, due to factors such as dark current, noise, and manufacturing processes, the response characteristics of sensors vary with changes in imaging conditions. Therefore, each imaging condition need to be calibrated independently. This will require a significant number of imaging tasks, and it is not conductive to periodic on-orbit absolute radiometric calibration.
The traditional on-orbit absolute radiometric calibration methods mainly include on-board calibration, field calibration, lunar calibration, cross calibration, etc. [11]. The on-board calibration method calibrates the sensors by using a calibration light source such as standard lamps, sunlight, a black body, etc. [12]. Jin et al. developed a 430 mm × 430 mm large-sized Teflon diffuse reflection plate component to ensure a full path and full field of view for the calibration during deployment. The diffuse reflection plate has a hemispherical reflectance of over 95% in the spectral range of 420–2400 nm and a BRDF variation of better than 2.5% in the camera observation direction [13]. The advantages of on-board are high frequency, high efficiency, and high precision. The disadvantage is that the costs of the launch and operation are relatively high, and due to the complexity and technological limitations of satellites, periodic on-orbit absolute radiometric calibration is difficult and has low timeliness. Field calibration is achieved by selecting a field with specific characteristics on the ground (such as a deserts like the Gobi) as the reference point for radiometric calibration. When the satellite passes through, the ground observation equipment will synchronously measure the surface reflectance, atmospheric condition, and other parameters of the field, and input these parameters into the radiative transfer model to calculate the apparent radiance or apparent reflectance at the entrance pupil of the satellite sensor. Then, the apparent radiance or apparent reflectance calibration coefficients of each band of the satellite are obtained [14]. Tang et al. proposed that the absolute radiometric calibration of the Gaofen-7 satellite sensor was using the reflectivity-based method at Baotou Field, and the radiometric calibration coefficient was obtained, achieving high-precision radiometric calibration of the sensor throughout its full dynamic range [15]. The advantage of this method is that it can achieve high calibration accuracy under ideal conditions, has a certain long-term stability, and can provide continuous calibration services throughout the entire life cycle of satellite sensors. The drawback is that it is necessary to select a large-scale, uniform, and stable terrain scene as the calibration reference point, and it requires a significant investment of manpower, material resources, and time, including the selection of calibration points, the deployment of ground equipment, data analysis, etc. These costs may limit the frequency of field calibration and make it difficult to meet rapid on-orbit absolute radiometric calibration needs [16]. In recent years, lunar calibration has gradually emerged as a mainstream calibration method. It uses the moon as a stable radiometric source, observes the moon directly through optical remote sensing satellites, obtains radiometric data of the moon, and compares it with known lunar radiometric models to achieve the calibration of sensors [17]. Xiong et al. provide an overview of MODIS and VIIRS solar and lunar calibration methodologies applied for the RSB on-orbit calibration, and describe the approach developed for their calibration inter-comparisons using lunar observations, including corrections for the effects caused by differences in the relative spectral response and adopted solar spectra between individual sensors [18]. The positive aspect of the method is that the surface of moon has long-term stable reflectivity and spectral characteristics and has no atmosphere, so it is not affected by atmospheric absorption, scattering, and other factors. The shortcomings are that it requires high-precision radiometric instruments and complex radiative transfer models. The development and application of these technologies and equipment require high costs and investment. Cross calibration is an important calibration technique in the field of remote sensing. It uses a high-precision remote satellite (reference remote sensor) as a reference to observe the same ground targets as the target remote sensor at the same time. By comparing the radiance obtained from the observation of the two objects, calibration of the remote sensor to be calibrated can be achieved [19]. Dong et al.’s proposed radiometric cross calibration framework is based on Gaofen-1 and Gaofen-6 synergistic observation using the PSO algorithm, and addresses the issue of coarse spatial resolution for WFV sensors. Comparisons with official coefficients and the RTM-BRDF method utilizing MODIS BRDF products have demonstrated its superior calibration accuracy [20]. The strength of the method is that it is not limited by ground conditions, which reduces the cost of calibration, and it can achieve high-frequency calibration. The weakness is that the accuracy largely depends on the performance stability and calibration accuracy of the reference remote satellite, so more imaging iterations are needed to accumulate sufficient observational data.
In summary, the methods mentioned above all have common problems. The calibration cost is high, and there are high requirements for satellite hardware, the ground environment, and the number of imaging tasks. In addition, they do not consider the diversity of imaging conditions for optical remote sensing satellites. Therefore, more imaging tasks are required to calibrate every imaging condition, and a single on-orbit absolute radiometric calibration often takes several months. The above methods are not conducive to achieving low-cost, high-frequency, and periodic in-orbit absolute radiometric calibration under the explosive growth trend of satellite numbers.
Based on this, we propose a general on-orbit absolute radiometric calibration method compatible with multiple imaging conditions. Our key contributions in this paper are:
  • A general on-orbit absolute radiometric calibration method compatible with multiple imaging conditions is proposed, including an imaging condition compatibility model and cross calibration. By using the proposed method, all imaging conditions of optical remote sensing satellite sensors can be calibrated in one imaging task, which greatly improve the timeliness and accuracy of on-orbit absolute radiometric calibration.
  • A large amount of laboratory radiometric calibration data are used to explore the mathematical relationship between the imaging condition (row transfer time, integration level and gain), radiance, and DN to successfully build an imaging compatibility model, and we integrate row transfer time, integration level, gain, radiance, and DN into a uniform formula.
  • In cross calibration, we flexibly use the corresponding points-matching method based on different surface features to ensure the accuracy and effectiveness of the corresponding points. On the other hand, a more concise and effective method is proposed for calculating the spectral-matching factor, which simplifies the calculation process and improves the effectiveness of computation.
  • We used Sentinel-2 series satellites as the reference satellite and Jilin-1 GF03D series satellites as the target satellites for the experiment. Specifically, five imaging tasks of the JL1GF03D11 satellites with different imaging conditions are used to verify the effectiveness of the proposed method. The experiments show that the average relative difference is reduced to 2.79% and the RMSE is reduced to 1.51 compared with the laboratory radiometric calibration method. Similarly, 20 imaging tasks of the Jilin-1 GF03D series satellites with different imaging conditions and different surface features are used to validate the generality of the proposed method. The experimental results show that the goodness of fit of the general coefficient is all greater than 95%, and the average relative difference between the reference radiance and the calibrated radiance of the proposed method is 2.46%, with an RMSE of 1.67.

2. Methods

This paper introduces the proposed method, which aims at improving the timeliness and accuracy of on-orbit absolute radiometric calibration of optical remote sensing satellites. We explore the mathematical relationship between the different imaging conditions of the sensors by using a large amount of the laboratory radiometric calibration data. Based on this, we build an imaging condition compatibility model, which successfully integrates imaging conditions (row transfer time, integration level, and gain), radiance, and DN into a unified formula. In addition, we combine the model with cross calibration to achieve a general on-orbit absolute radiometric calibration method. By using the proposed method, all imaging conditions of optical remote sensing satellite sensors can be calibrated in one imaging task, which will greatly improve the timeliness and accuracy of on-orbit absolute radiometric calibration. The workflow of the proposed method is shown in Figure 1.

2.1. Imaging Condition Compatibility Model

The absolute radiometric calibration method is essentially to calibrate the relationship between the energy received by sensors and DN. But DN is not consistent when the sensor receives the same energy. The response of the sensors depends on the imaging conditions at the imaging time. The response characteristics of sensors also change with the imaging conditions. Therefore, in order to achieve high-precision absolute radiometric calibration, satellites need to use a large number of imaging tasks and calibrate the absolute radiometric calibration coefficient for each imaging condition. Based on this, we used laboratory radiometric calibration data to explore the mathematical relationship between the radiance and imaging conditions. We selected 11 different radiance levels, 13 imaging conditions, and 300 image tasks of the JL1GF03D11 satellites as the test samples; the information is shown in Table 1. The DN mean of those images was used to explore the mathematical relationship between the imaging condition, DN, and radiance, and the result is shown in Figure 2. We found that the gain, integration level, and row transfer time exhibited a basic linear relationship with DN at each radiance level.
In addition, we also explored the mathematical relationship between any two imaging condition parameters and DN under the same radiance level; the curves are shown in Figure 3. The results show that the relationship between the imaging conditions and DN was extremely complex. As a result, the traditional methods often independently calculated the absolute radiometric calibration coefficient for each imaging condition.
Based on this, we built an imaging condition compatibility model, which successfully integrates imaging conditions (row transfer time, integration level, and gain), radiance, and DN into a unified formula. Formula (1) is as follows:
f m , n = p r o f i t D N G , L × I × R ,
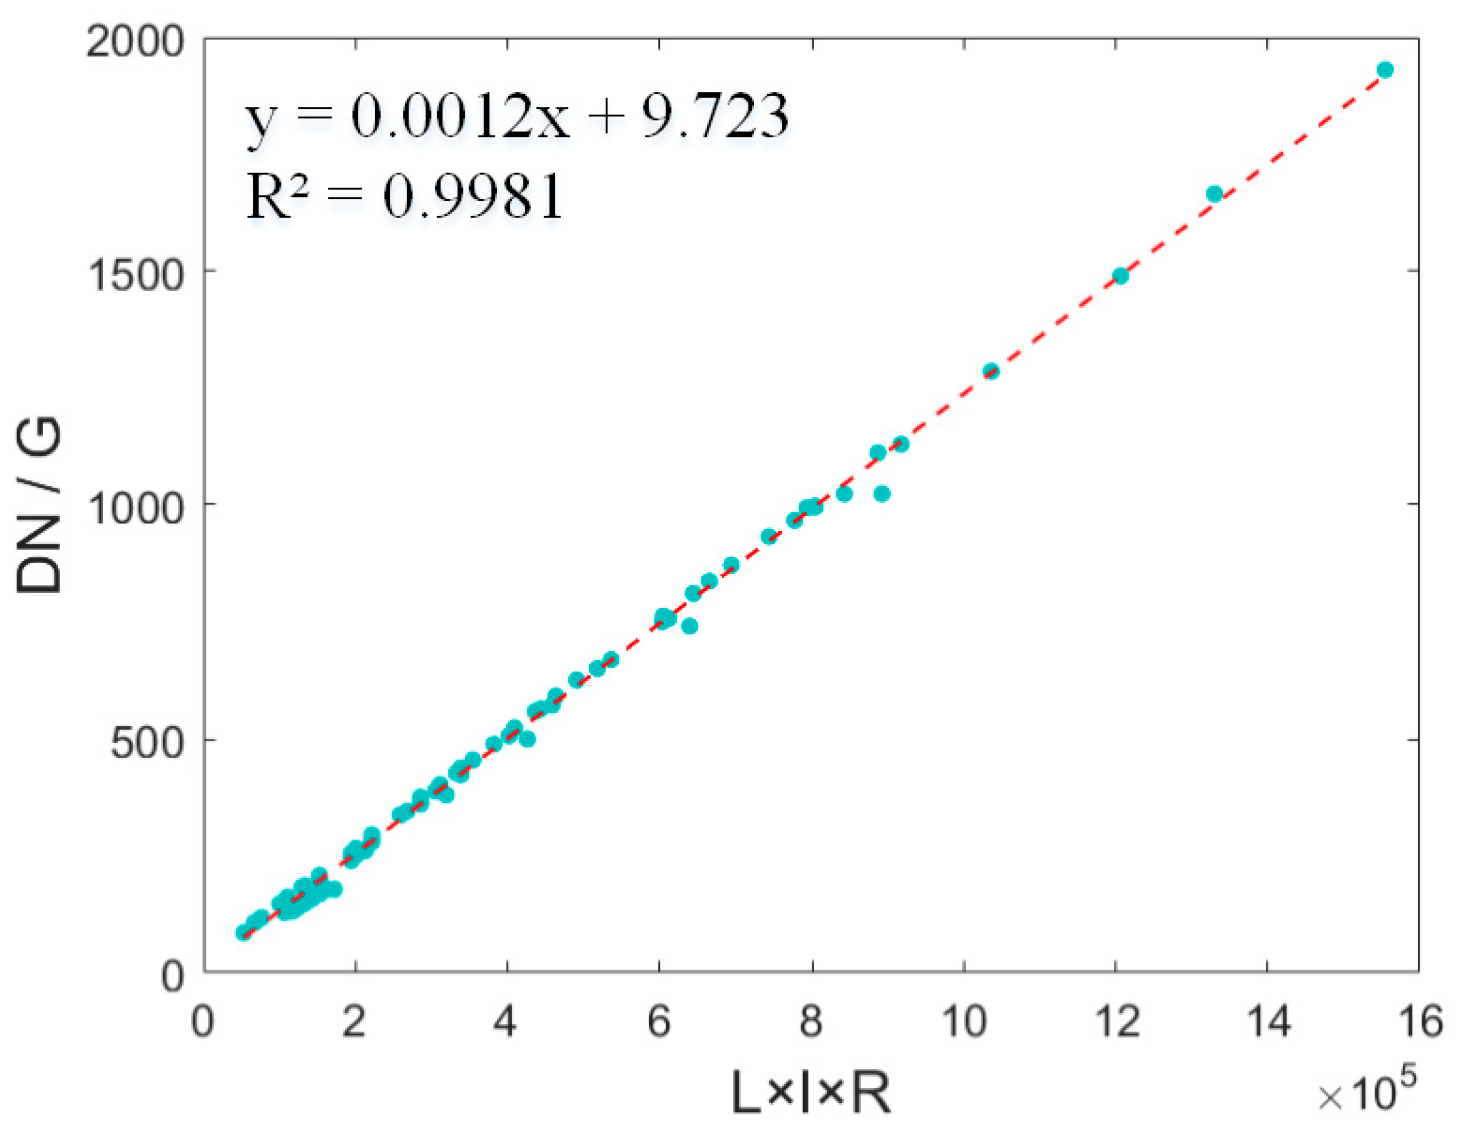
where m , n is the general coefficient, p r o f i t is the linear least squares method, D N is the response of each imaging condition of the sensors, G is the gain, L is the radiance, I is the integration level, and R is the row transfer time. The model was validated by using the above data, and the result is shown in Figure 4. The goodness of fit of the model was greater than 0.99, which preliminary proves its effectiveness.
According to Formula (1), the mathematical relationship between L and D N can be sequentially transformed into Formulas (2) and (3):
D N G = m × L × T × R + n ,
L = 1 m × G × T × R D N n m × T × R ,
The absolute radiometric calibration coefficients can be calculated by Formulas (4) and (5):
G a i n = 1 m × G × T × R ,
B i a s = n m × T × R ,
where G a i n is the gain, and B i a s is the offset of the absolute radiometric calibration coefficient at each imaging condition of each band.
In this section, we built the imaging condition compatibility model by using 11 different radiance levels, 13 imaging conditions, and 300 image tasks of laboratory radiometric calibration data, and calculated the general coefficient by using the gain, integration level, and row transfer time. The general coefficient of the model can calibrate every imaging condition by using one imaging task. The absolute radiometric calibration coefficient of each imaging condition of each band can be calculated by using the general coefficient.

2.2. Cross Calibration

Due to the influence of the space environment and aging of the instruments, the radiometric response characteristics of sensors may change. On-orbit absolute radiometric calibration can correct these changes in a timely manner, ensuring the long-term stability and reliability of the satellite. However, to calibrate every imaging condition of the sensor, a large number of satellite imaging tasks is essential when using traditional methods, which is not conducive to periodic in-orbit absolute radiometric calibration. In this section, we successfully integrate the imaging condition compatibility model into the cross calibration method, which greatly improves the accuracy and efficiency of on-orbit absolute radiometric calibration of optical remote sensing satellites. The cross calibration is used to obtain the reference radiance of the target satellites, and the general coefficient of the imaging condition compatibility model is calculated by using the imaging condition, reference radiance, and DN.

2.2.1. Calibration Field

In order to reduce the influence of the atmosphere and surface features, we selected the National High Resolution Remote Sensing Comprehensive Calibration Field (referred to as “Baotou Field”) and the Railroad Valley calibration field for the experiments.
Baotou Field is located 50 km northwest of Baotou city in Inner Mongolia (40.85°N, 109.62°E), with an average elevation of about 1270 m. It has diverse surface features, a dry climate, and little rainfall throughout the year, which is suitable for the calibration of remote sensing satellites and authenticity verification. In addition, Baotou Field has a uniform desert scene of about 300 m × 300 m, which can satisfy the absolute radiometric calibration of remote sensing satellites [21]. The proposed method mainly selected the uniform desert scene of Baotou Field as the ground reference target. An image of Baotou Field is shown in Figure 5. As shown in the figures, the surface features of Baotou Field are uniform and the atmospheric environment is good.
Railroad Valley Field is located in central Nevada between the towns of Ely and Tonopah (38.504°N, 115.692°W). The overall size of the field is approximately 15 km × 15 km, it is located at an elevation of approximately 1.50 km in a geographical region with typically low levels of aerosol loading, and the central area of the field is flat to higher than 100 m. The object feature of the field is composed of dry clay layers without vegetation, and it has a low aerosol content. The field has good uniformity at different times, with autumn being better [22]. The proposed method mainly selected the uniform desert scene of Railroad Valley Field as the ground reference. An image of Railroad Valley is shown in Figure 6.

2.2.2. Corresponding Points Matching

Spectral matching is an essential step in cross calibration, and corresponding points matching is an important factor affecting the accuracy of spectral matching. It needs to ensure the spatial alignment of the two satellite imaging tasks, laying the groundwork for subsequent spectral matching.
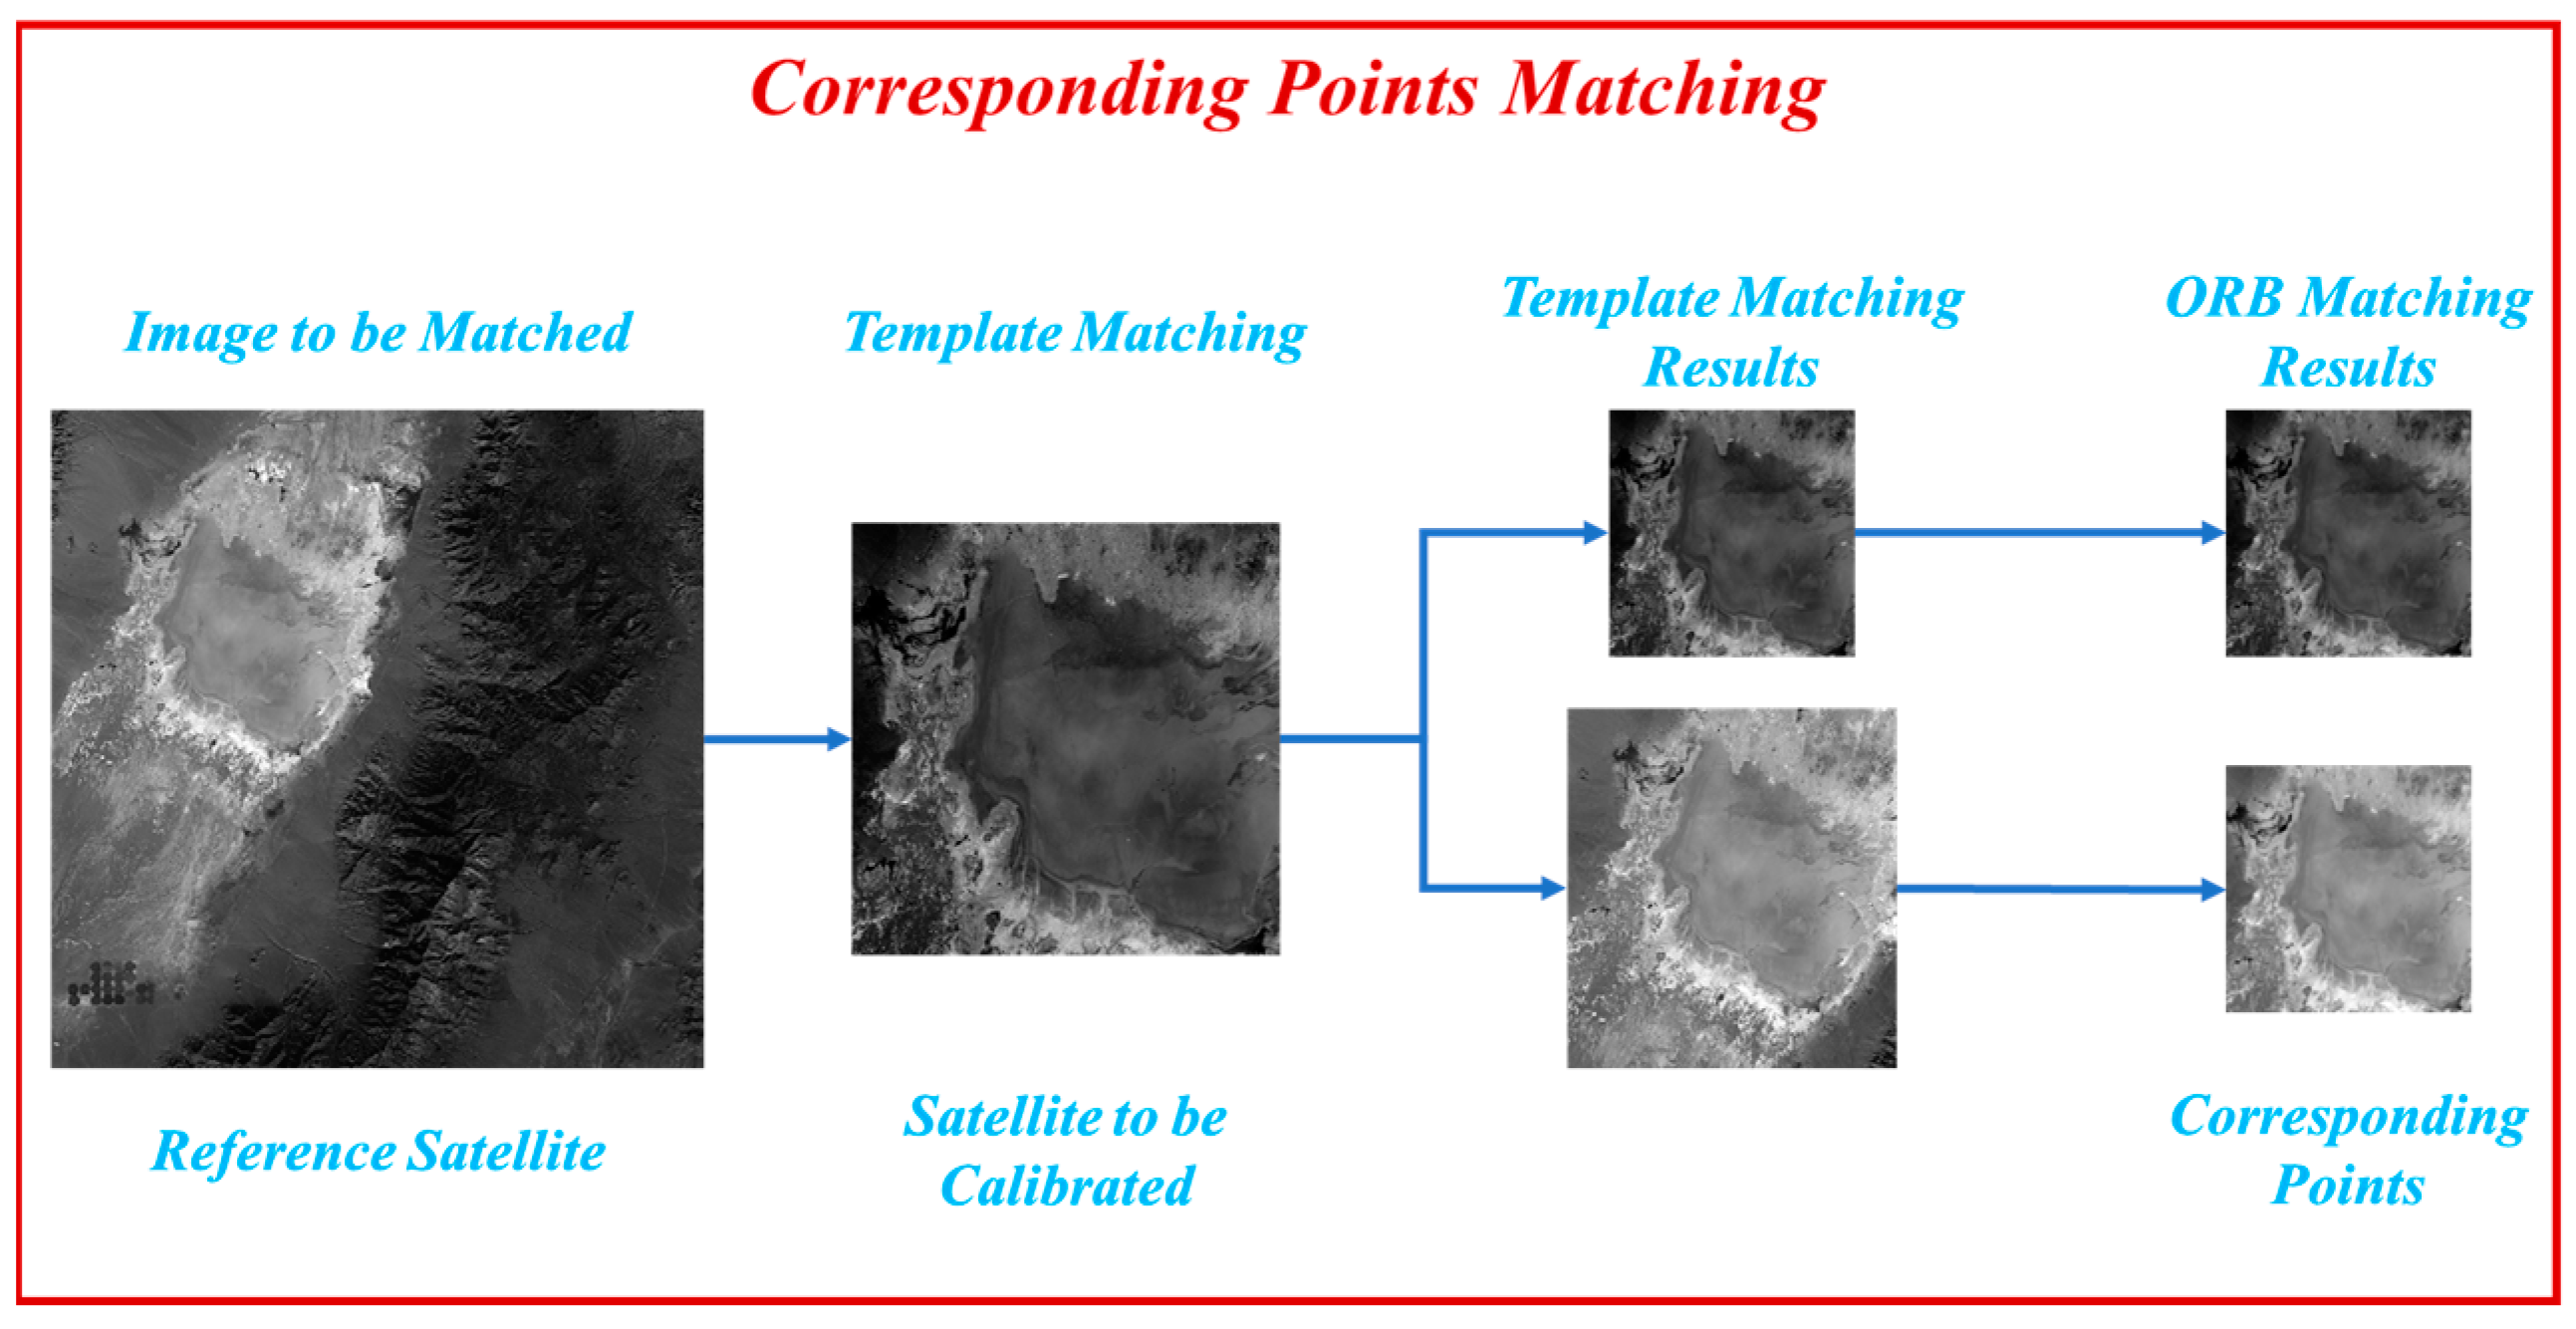
However, we used the uniform desert scene for on-orbit absolute radiometric calibration experiments, which posed a great challenge to the corresponding points-matching algorithm. The surface features of deserts are relatively uniform, and traditional methods often cannot achieve high-precision corresponding points matching. Based on this, we flexibly used the corresponding points-matching method based on different surface features to ensure the accuracy and effectiveness of the corresponding points. We first used template matching to roughly determine the homologous regions, followed by precise matching by using the Oriented FAST and Rotated BRIEF (ORB) algorithm, as illustrated in Figure 7. Template matching is a method based on image correlation, which registers by searching for areas in the target image that most closely resemble a predefined template [23]. The ORB algorithm is a widely used corresponding points extraction and points-matching algorithm in the computer vision field. It combines the advantages of the FAST feature point detection algorithm and the BRIEF feature description algorithm to achieve efficient and rotation invariant feature extraction and matching [24]. This approach does not rely on distinct corner or edge features, making it particularly suitable for images with indistinct features or high repetitiveness.
This strategy effectively solves the problem of the corresponding points matching with unclear features, ensuring accuracy and robustness. We can select the most appropriate algorithm based on the characteristics of different object features through the flexible corresponding points-matching strategy. This provides a reliable foundation for the subsequent spectral matching within the cross calibration method, ensuring the precision and effectiveness of the calibration process.

2.2.3. Spectral Matching

Spectral matching aims to establish the radiance relationship between the corresponding points in the images of the reference satellite and the satellite to be calibrated, enabling precise radiance calculation of the satellite to be calibrated [25]. We selected the uniformly reflective areas, typically deserts, to reduce the impact of BRDF on the accuracy of absolute radiometric calibration. The relationship between the entrance pupil radiance of the satellite and the apparent reflectance is defined as follows:
L = ρ × E S U N × c o s θ π × d 2 ,
where L is the entrance pupil radiance of the satellite, ρ is the apparent reflectance, E S U N is the solar spectral irradiance for a given spectral band, θ represents the solar zenith angle at the imaging time, and d is the earth–sun distance factor. Formula (6) establishes the relationship between the entrance pupil radiance and variables such as the apparent reflectance, taking into account spectral differences and imaging geometric discrepancies. The difference in the radiance between the reference satellite and the satellite to be calibrated can be calculated by Formula (7):
β = L 2 L 1 = ρ 2 × E S U N 2 × c o s θ 2 ρ 1 × E S U N 1 × c o s θ 1 .
where β is the spectral matching factor, L 1 and L 2 are the radiance of the reference satellite and the satellite to be calibrated, and ρ 1 , ρ 2 , E S U N 1 , E S U N 2 , c o s θ 1 , and c o s θ 2 are parameters. Significantly, these parameters can be obtained from the standard image data files, and the apparent reflectance can be simulated by using Second Simulation of the Satellite Signal in the Solar Spectrum (6S Model) to reduce experiential errors by atmospheric and surface parameters [26]. The spectral matching factor calculated by using Formula (2) takes into account the differences in apparent reflectance and solar spectral irradiance brought about by spectral discrepancies, as well as geometric imaging differences.
In summary, cross calibration often selects the uniform object feature as the target area, which poses a great challenge to obtaining the corresponding points. We first used template matching to obtain rough homologous regions, and then used the ORB algorithm to obtain more accurate corresponding points in the homologous regions. This flexible strategy ensures accuracy and effectiveness, and reduces the errors of the corresponding points matching. On the other hand, we proposed a more concise and effective method for calculating the spectral-matching factor. Compared with traditional methods, it simplifies the calculation process and improves computational efficiency while ensuring accuracy.

3. Results

The accuracy of cross calibration is mainly affected by the following factors. First is the absolute radiometric calibration accuracy of the reference satellite. Second is the error in matching observation elements, the difference in the illumination angle and observation angle between the reference satellite and target satellite, and the spatial matching accuracy of the images. Thirdly, the difference in spectral response functions can lead to different responses of remote satellites to the same target at different wavelengths, thereby affecting calibration accuracy. Fourthly, the variation in surface BRDF characteristics can also introduce errors. Finally, in the process of obtaining calibration coefficients, data-processing methods such as linear fitting may introduce errors.
Based on this, Sentinel-2 series satellites were used as reference satellites, with an absolute radiometric calibration accuracy of less than 5%. Then, we used Baotou Field and the Railroad Valley calibration field to reduce the impact of BRDF. Strict limitations were imposed on the solar azimuth angle, the observation of the zenith angle, and the solar zenith angle of the data to reduce observation errors. Thirdly, a more concise and effective method was proposed for calculating the spectral matching factor, which simplifies the calculation process and improves the effectiveness of computation. Finally, we selected a large number of corresponding matching points, and used the least squares method to fit the data to reduce the error in data processing.

3.1. Reference Satellite and Target Satellite

Sentinel-2 series satellites were used as the reference satellites, and Jilin-1 GF03D series satellites were the target satellites in the experiments to validate the proposed method. Sentinel-2A was launched on 23 June 2015, and Sentinel-2B was launched on 7 March 2017 [22,27]. Jilin-1 GF03D series satellites are mass-produced products of Changguang Satellite Technology Co., Ltd., which can provide static push scan images with a panchromatic resolution of 0.75 m, a multispectral resolution of 3 m, and a width of more than 17 km. The technical indicators of the R-G-B-NIR bands of the Sentinel-2 series satellites are shown in Table 2, and the spectral response curves are shown in Figure 8. Similarly, the technical indicators and spectral response curves of JL1GF03D are shown in Table 3 and Figure 9. The difference in multispectral resolution (R-G-B-NIR) between the Sentinel-2 series satellites and the Jilin-1 GF03D series satellites was small, and the absolute radiometric calibration accuracy of the Sentinel-2 series satellites was high. Therefore, the Sentinel-2 series satellites could be used as good reference satellites for the experiments.

3.2. Evaluation of Effectiveness

We selected five imaging tasks of the JL1GF03D11 satellites in November 2023 as the experimental sample set to verify the effectiveness of the proposed method. Baotou Field was imaged three times and Railroad Valley was imaged two times in the experimental sample. The information and thumbnails are shown in Figure 10 and Table 4. The imaging time between the Sentinel-2 series satellites and the JLGF03D11 satellites was less than 10 min. The thumbnails show that the weather during each imaging task was good and cloudless, and the imaging conditions for each imaging task were different. Therefore, we used the first imaging task as the calibration sample, and the remain four imaging tasks were used as the test samples.
Firstly, the calibration sample was used to calibrate the general coefficient of each band using the proposed method, and the remain four imaging tasks were used to obtain the reference radiance of each band. Then, we used each imaging condition and the general coefficient to calculate the absolute radiometric calibration coefficient and radiance for each band of each imaging task. Finally, we evaluated the effectiveness of the proposed method by comparing the calculated radiance and the calibrated radiance.
We used the goodness of fit of the least squares method to evaluate preliminarily the effectiveness of the proposed method [28], and the formula is as follows:
R 2 = i = 1 n ( y ^ i y ¯ ) 2 i = 1 n ( y i y ¯ ) 2 ,
where R 2 is the goodness of fit, n is the total number of fitting data, y ^ i is the i th calculation result after fitting, and y ¯ is the mean of the fitting data.
In order to reduce the impact of errors on the proposed method, we select 25 samples under different irradiance levels. Each sample was 9 × 9 pixels, and the average was taken as the DN and radiance. The calibration results are shown in Figure 11. The goodness of fit of each band was greater than 0.99, indicating that the cross calibration method was effective, and the sensor exhibited good linearity within its effective response range. Therefore, we calculated the general coefficient by using the DN and radiance of each band; the results are shown in Figure 12.
We calculated the absolute radiometric calibration coefficient and radiance for the remaining four image tasks by using the general coefficient. The selections of the samples were the same as the calibration sample, and the total number of samples of each band was 25. We used cross calibration to obtain the radiance as a reference radiance, and the experimental results are shown in Figure 13, Figure 14, Figure 15 and Figure 16.
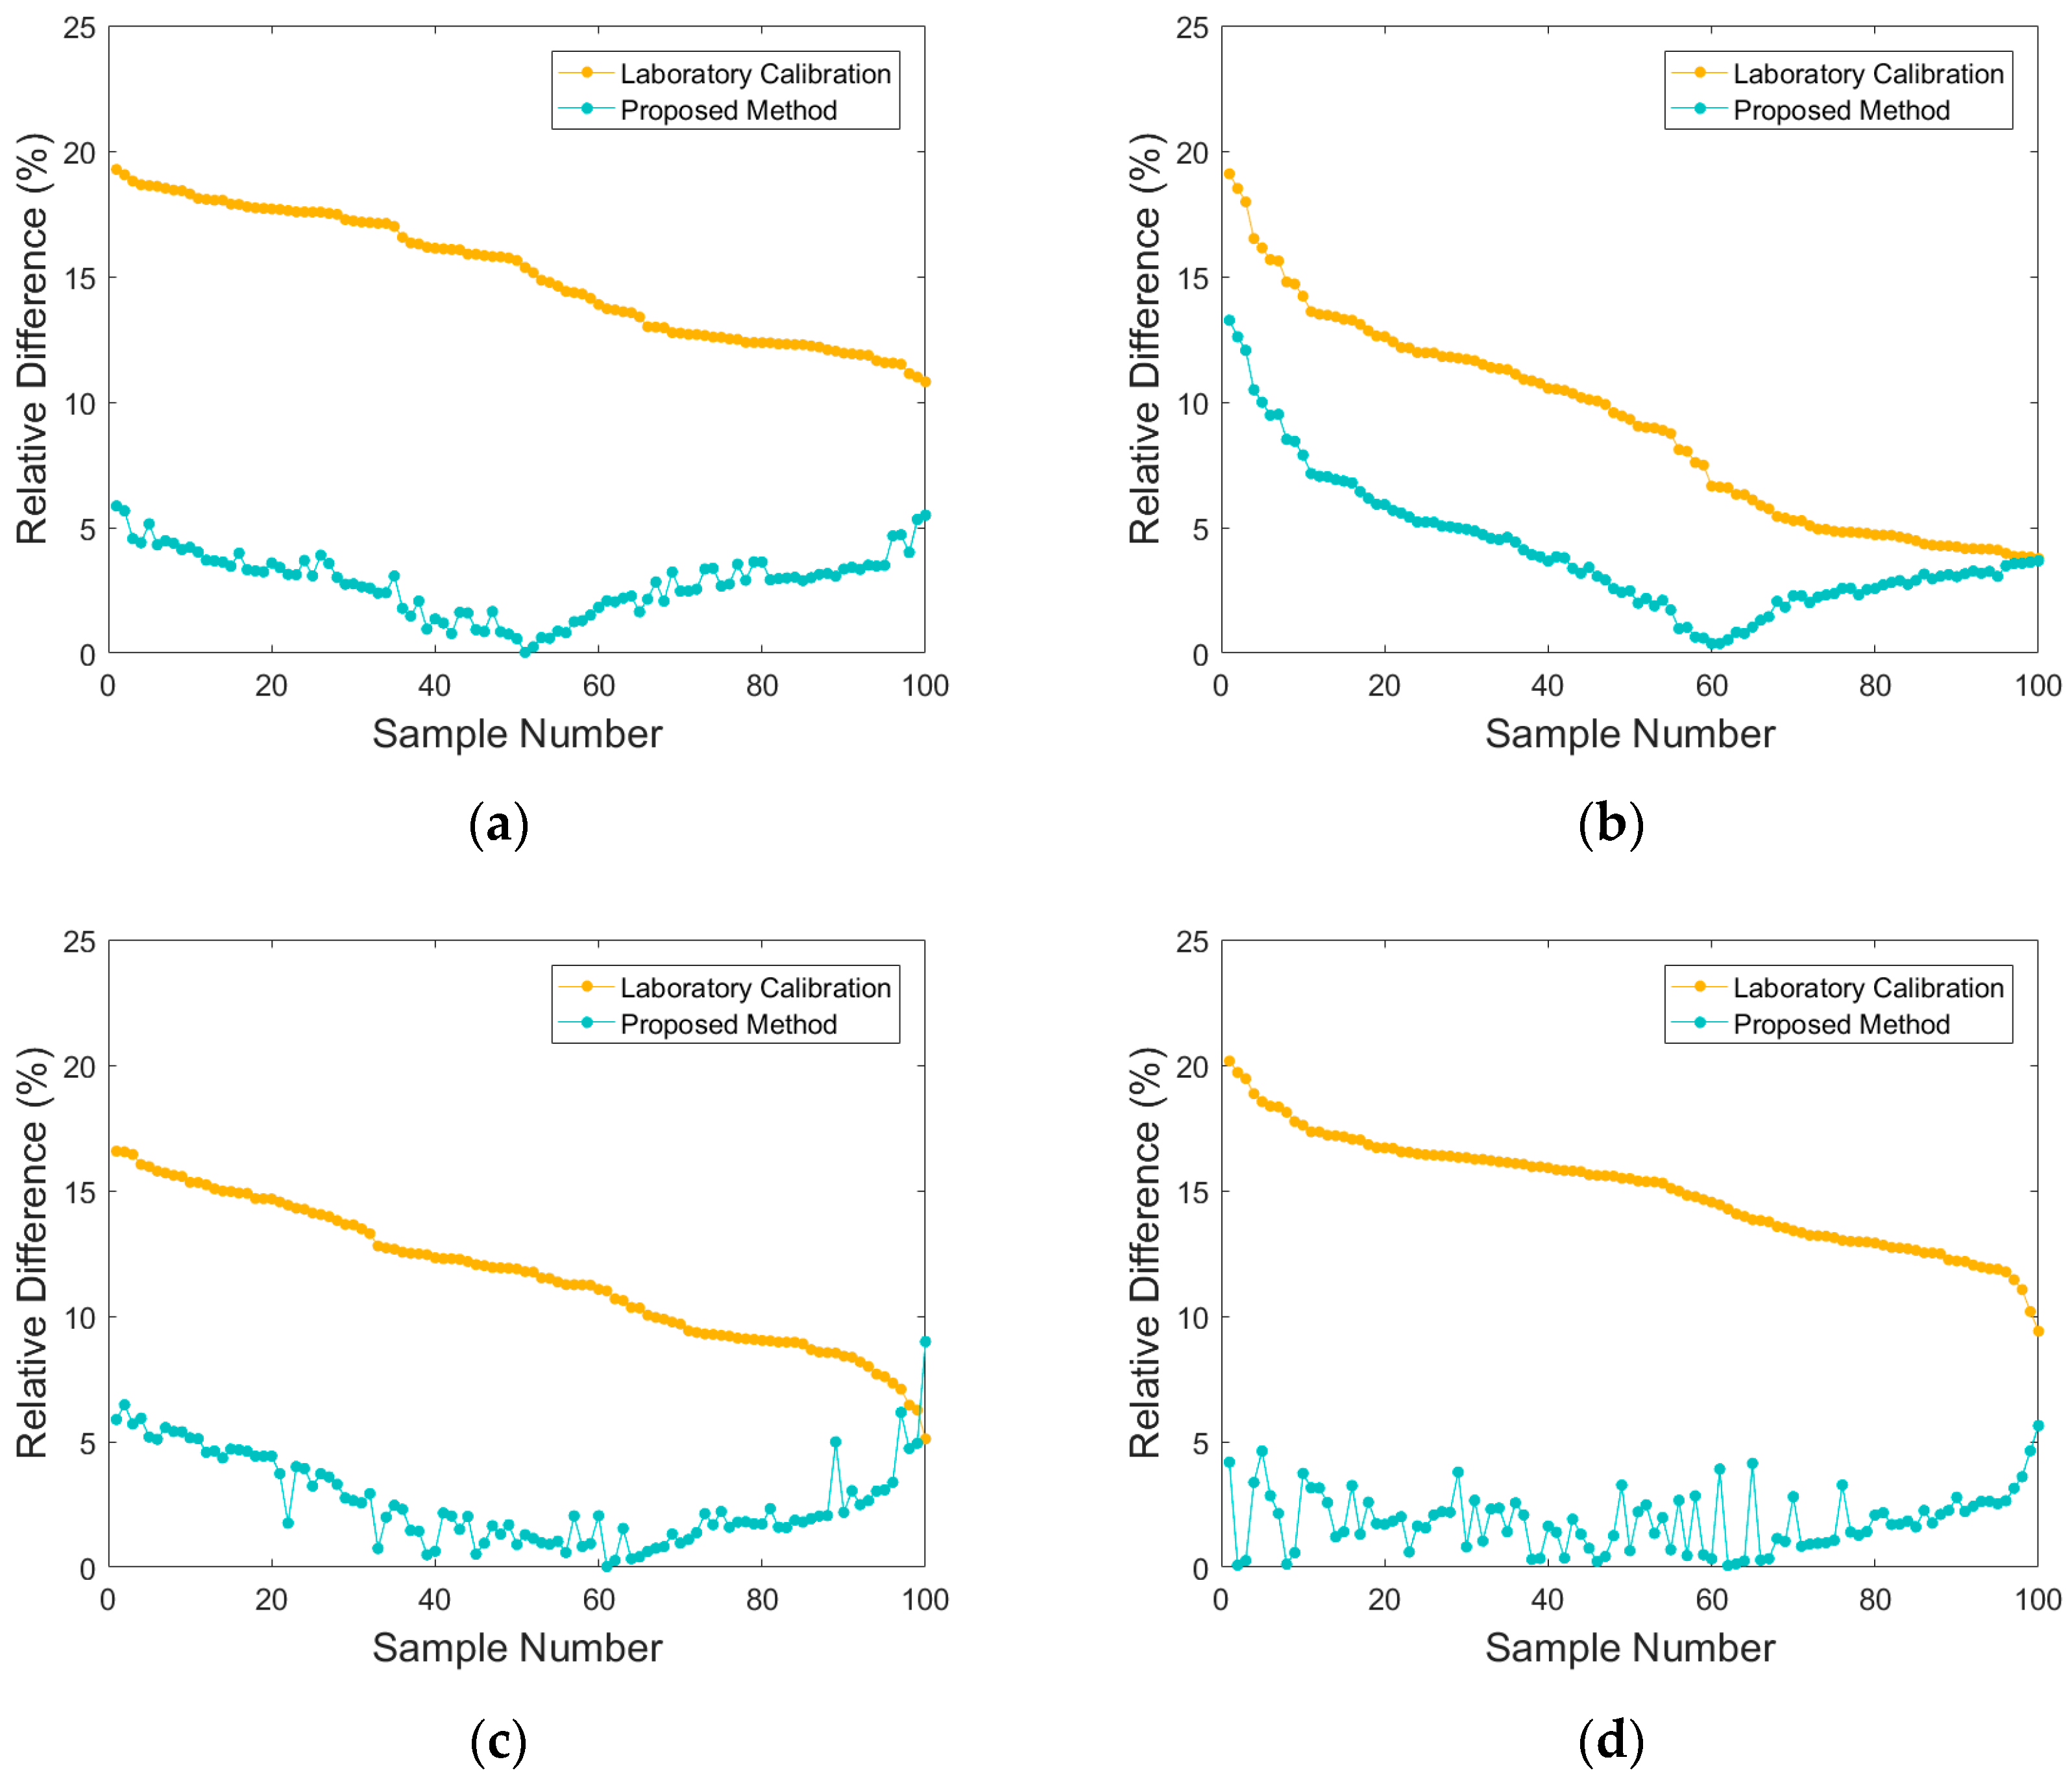
It can be seen that the proposed method was closer to the reference radiance, which was better than the laboratory calibration method at multiple radiance levels and imaging conditions. This indicates that the proposed method can achieve higher absolute radiometric calibration accuracy in multiple spectral bands and imaging conditions. Based on this, we quantitatively evaluated the effectiveness of the proposed method by using relative error ( L ) and root mean square error (RMSE) [29,30]. The L % was calculated by Formula (9), and the RMSE was calculated by Formula (10):
L = L r e f L c a l L r e f × 100 % ,
R M S E = i = 1 n L r e f L c a l 2 n ,
where L r e f is the reference radiance obtained by using cross calibration, L c a l is the radiance calculated by the proposed method or laboratory radiometric calibration method, and n is the number of samples. The total number of Test 1–Test 4 samples was 100. The result of the L is shown in Figure 17, and the mean of the L and the RMSE of the samples are shown in Table 5.
It can be seen that the L and RMSE of the proposed method were significantly reduced compared to the laboratory radiometric calibration method. The L of the blue band decreased from 16.88% to 2.60%, the green band decreased from 10.28% to 4.33%, the red band decreased from 12.62% to 2.54%, and the NIR band decreased from 15.78% to 1.68%, while the RMSE decreased to 1.44, 2.15, 1.51, and 0.96. The average L of each band was reduced to 2.79% while the average RMSE of each band was reduced to 1.51.
In summary, the proposed method can improve the absolute radiometric calibration accuracy, and is suitable for different image conditions and different bands. The experimental results prove that the proposed method was better than the laboratory radiometric calibration method in each band and each image condition. Most importantly, compared to traditional methods, the proposed method only requires one imaging task to achieve higher radiometric calibration accuracy and timeliness.

3.3. Evaluation of Generality

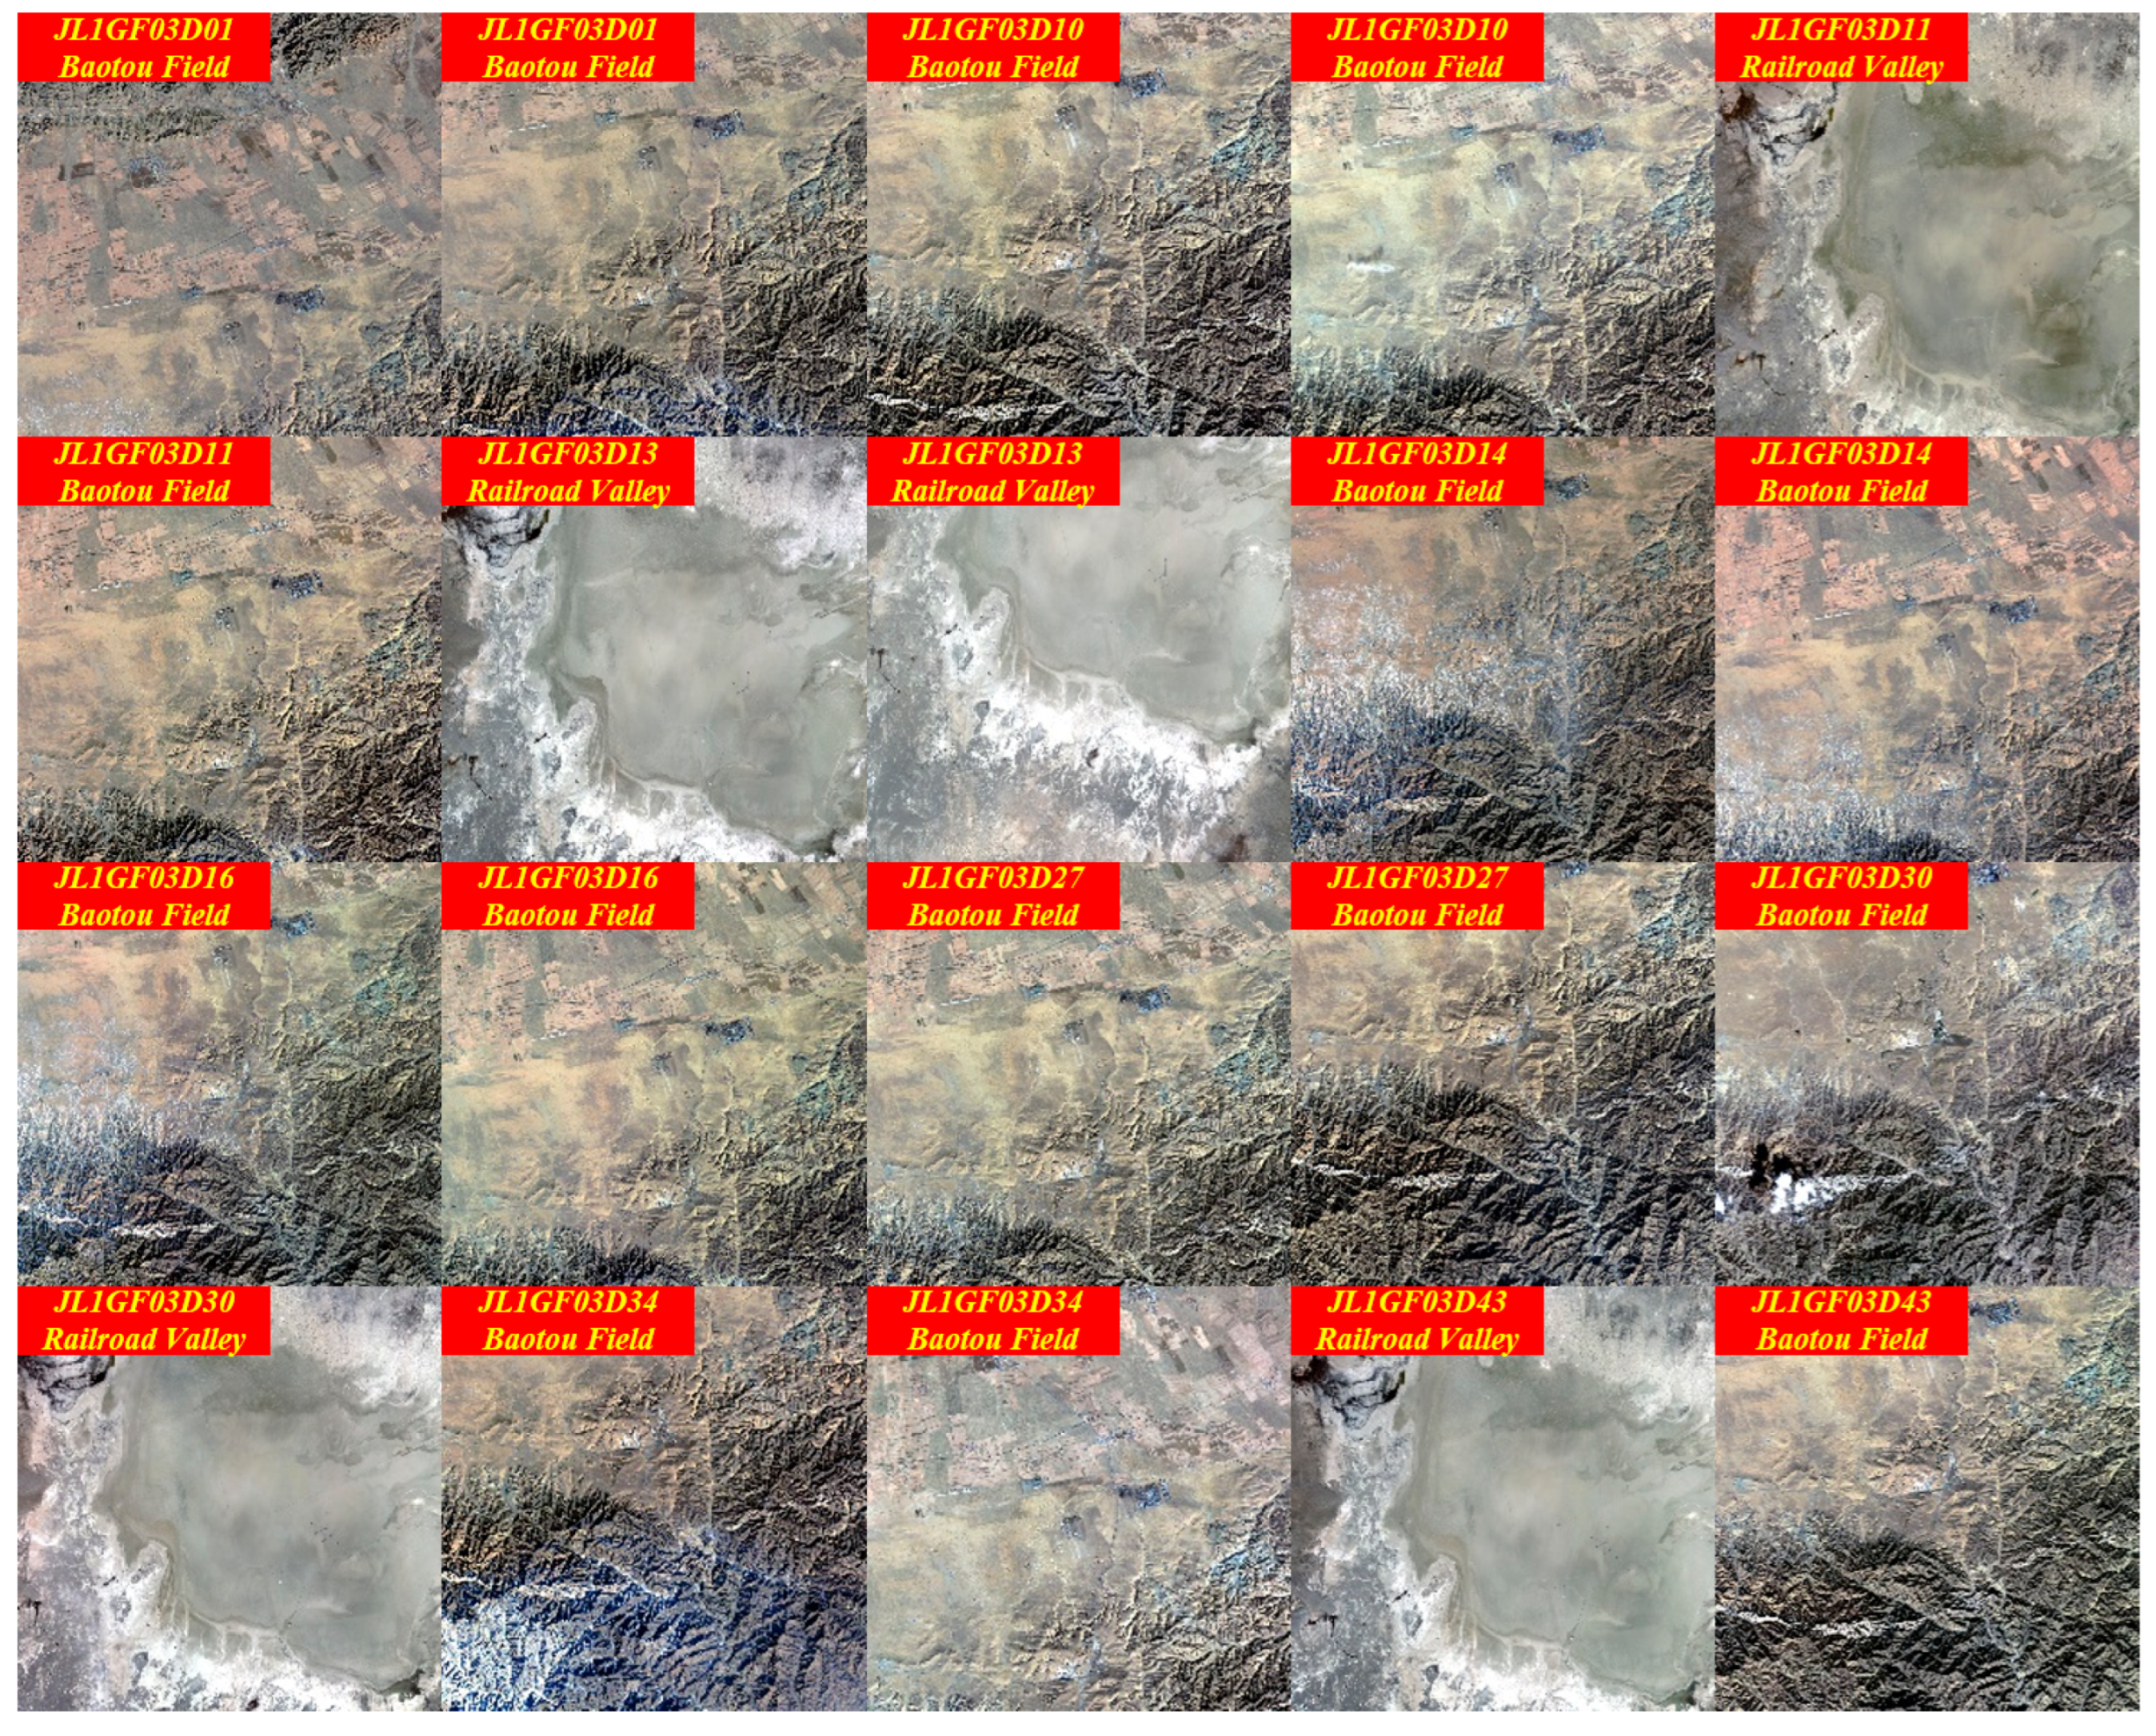
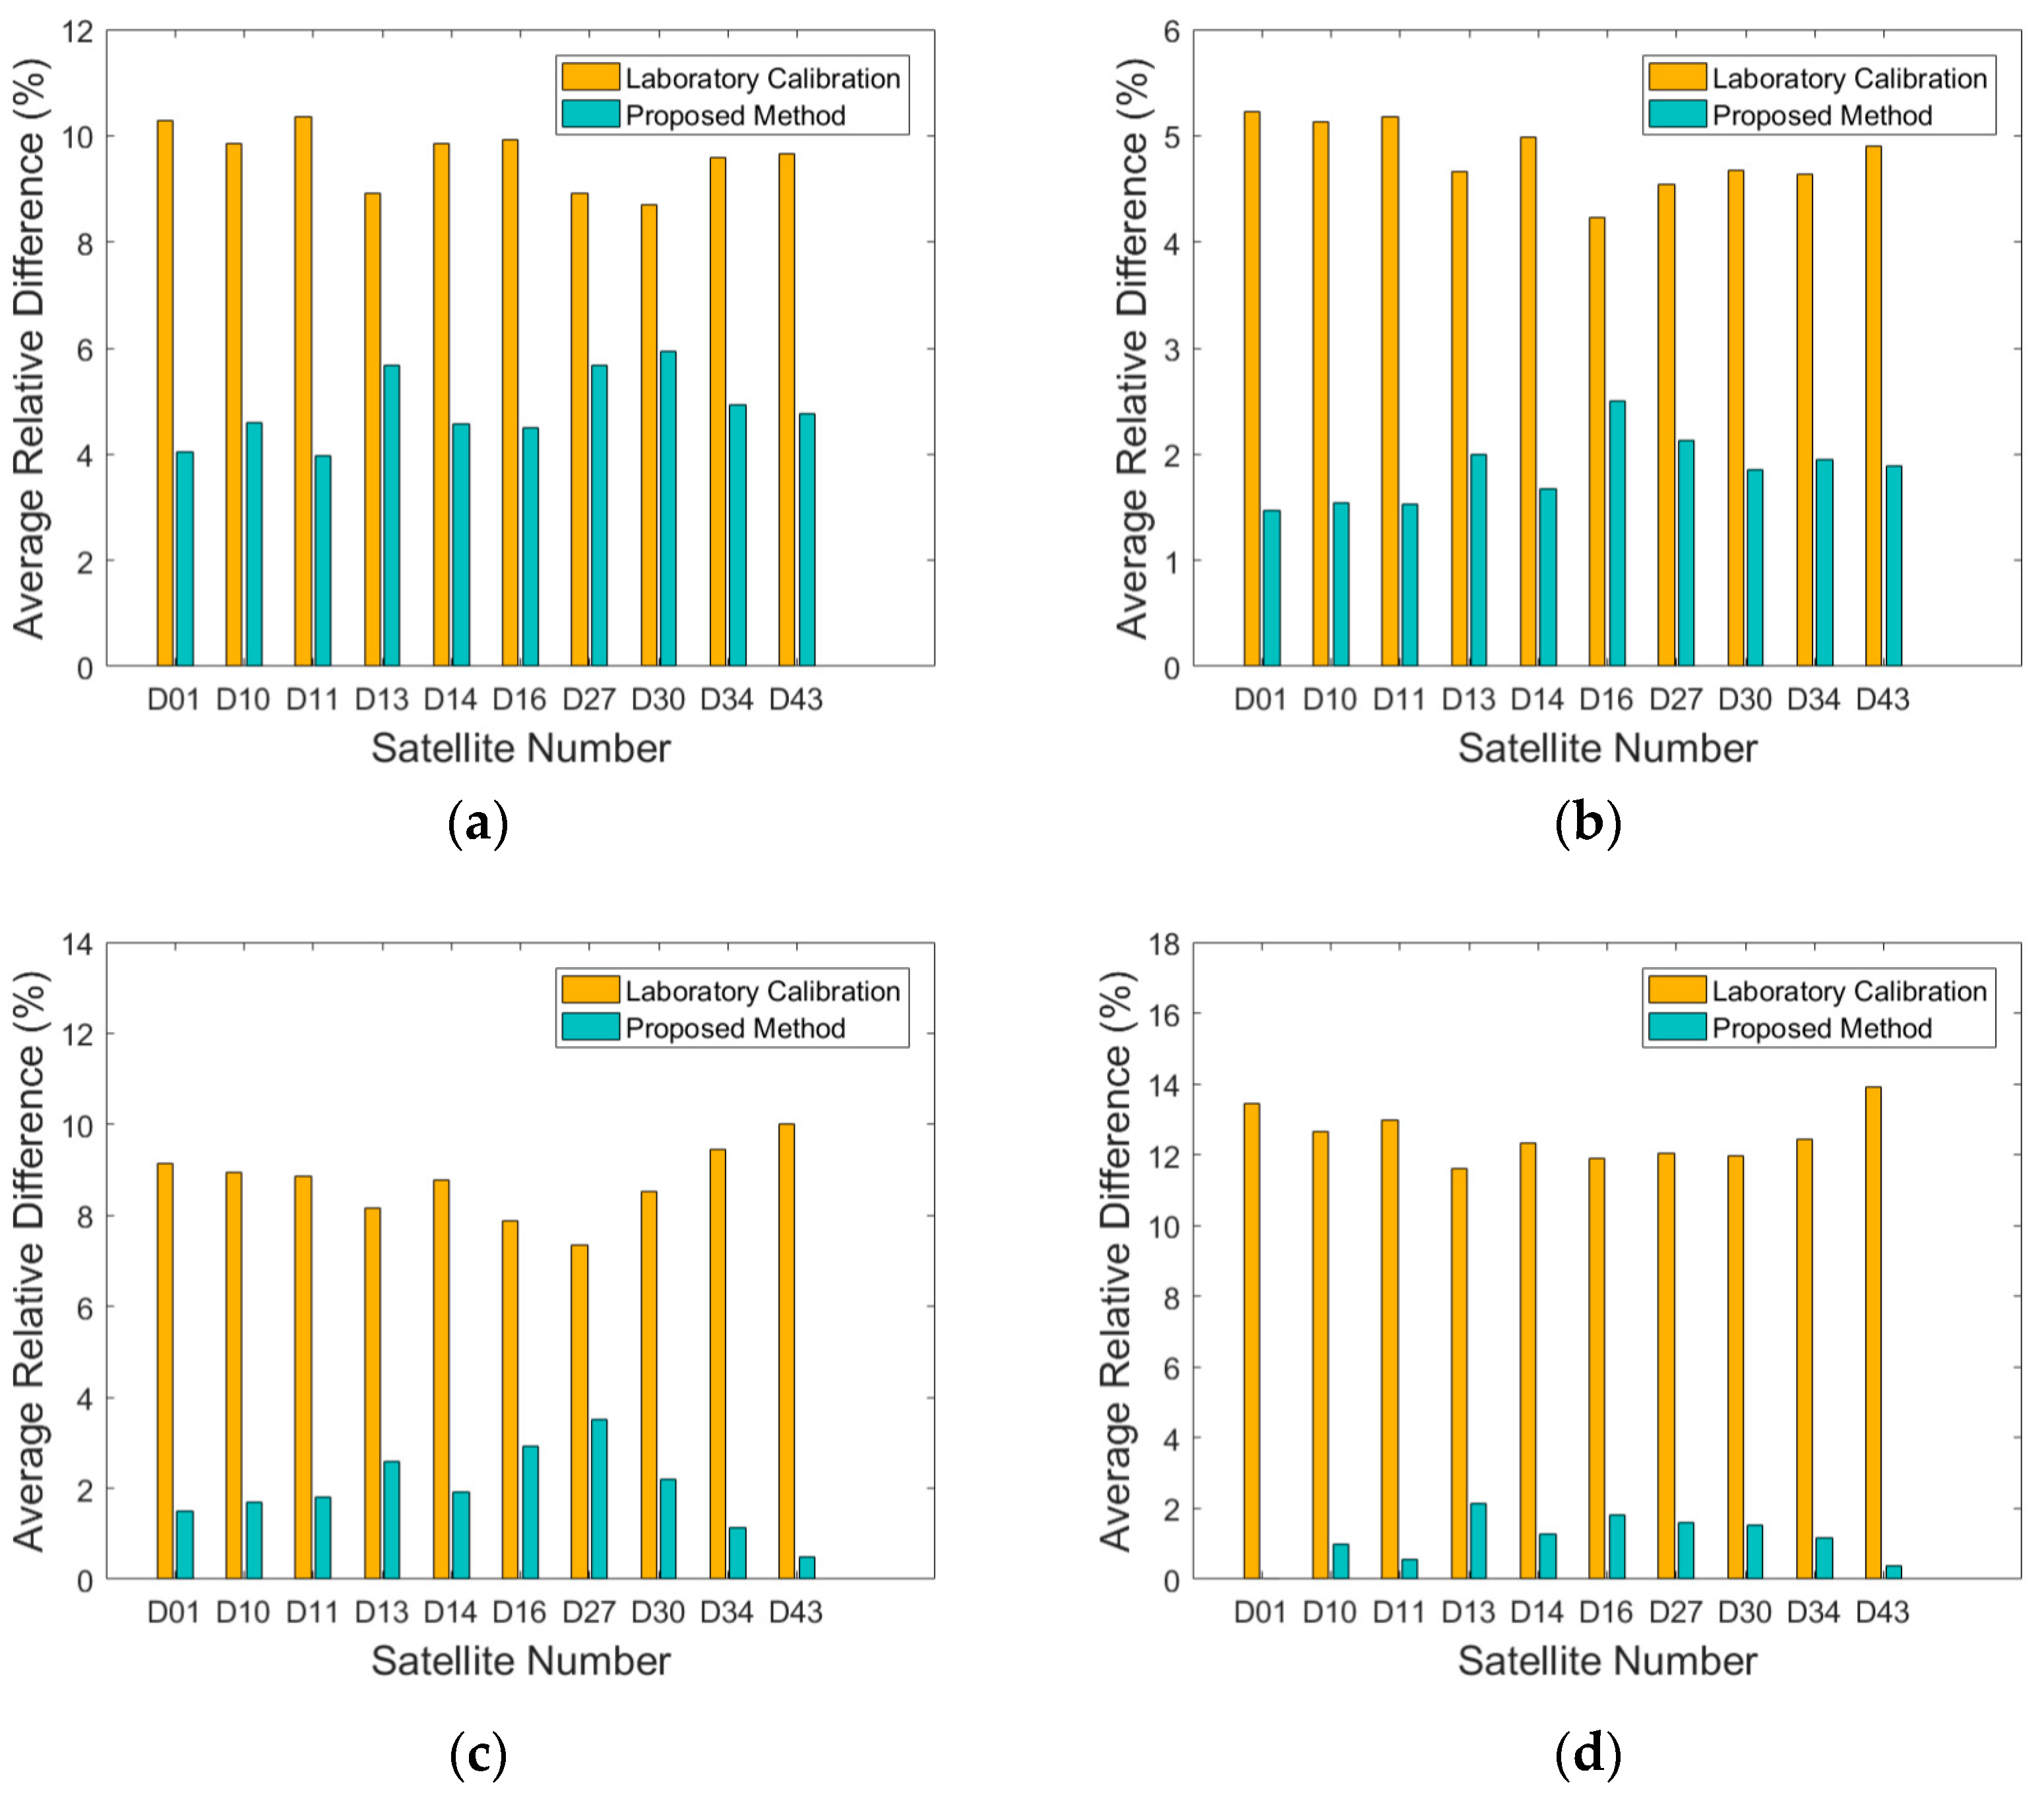
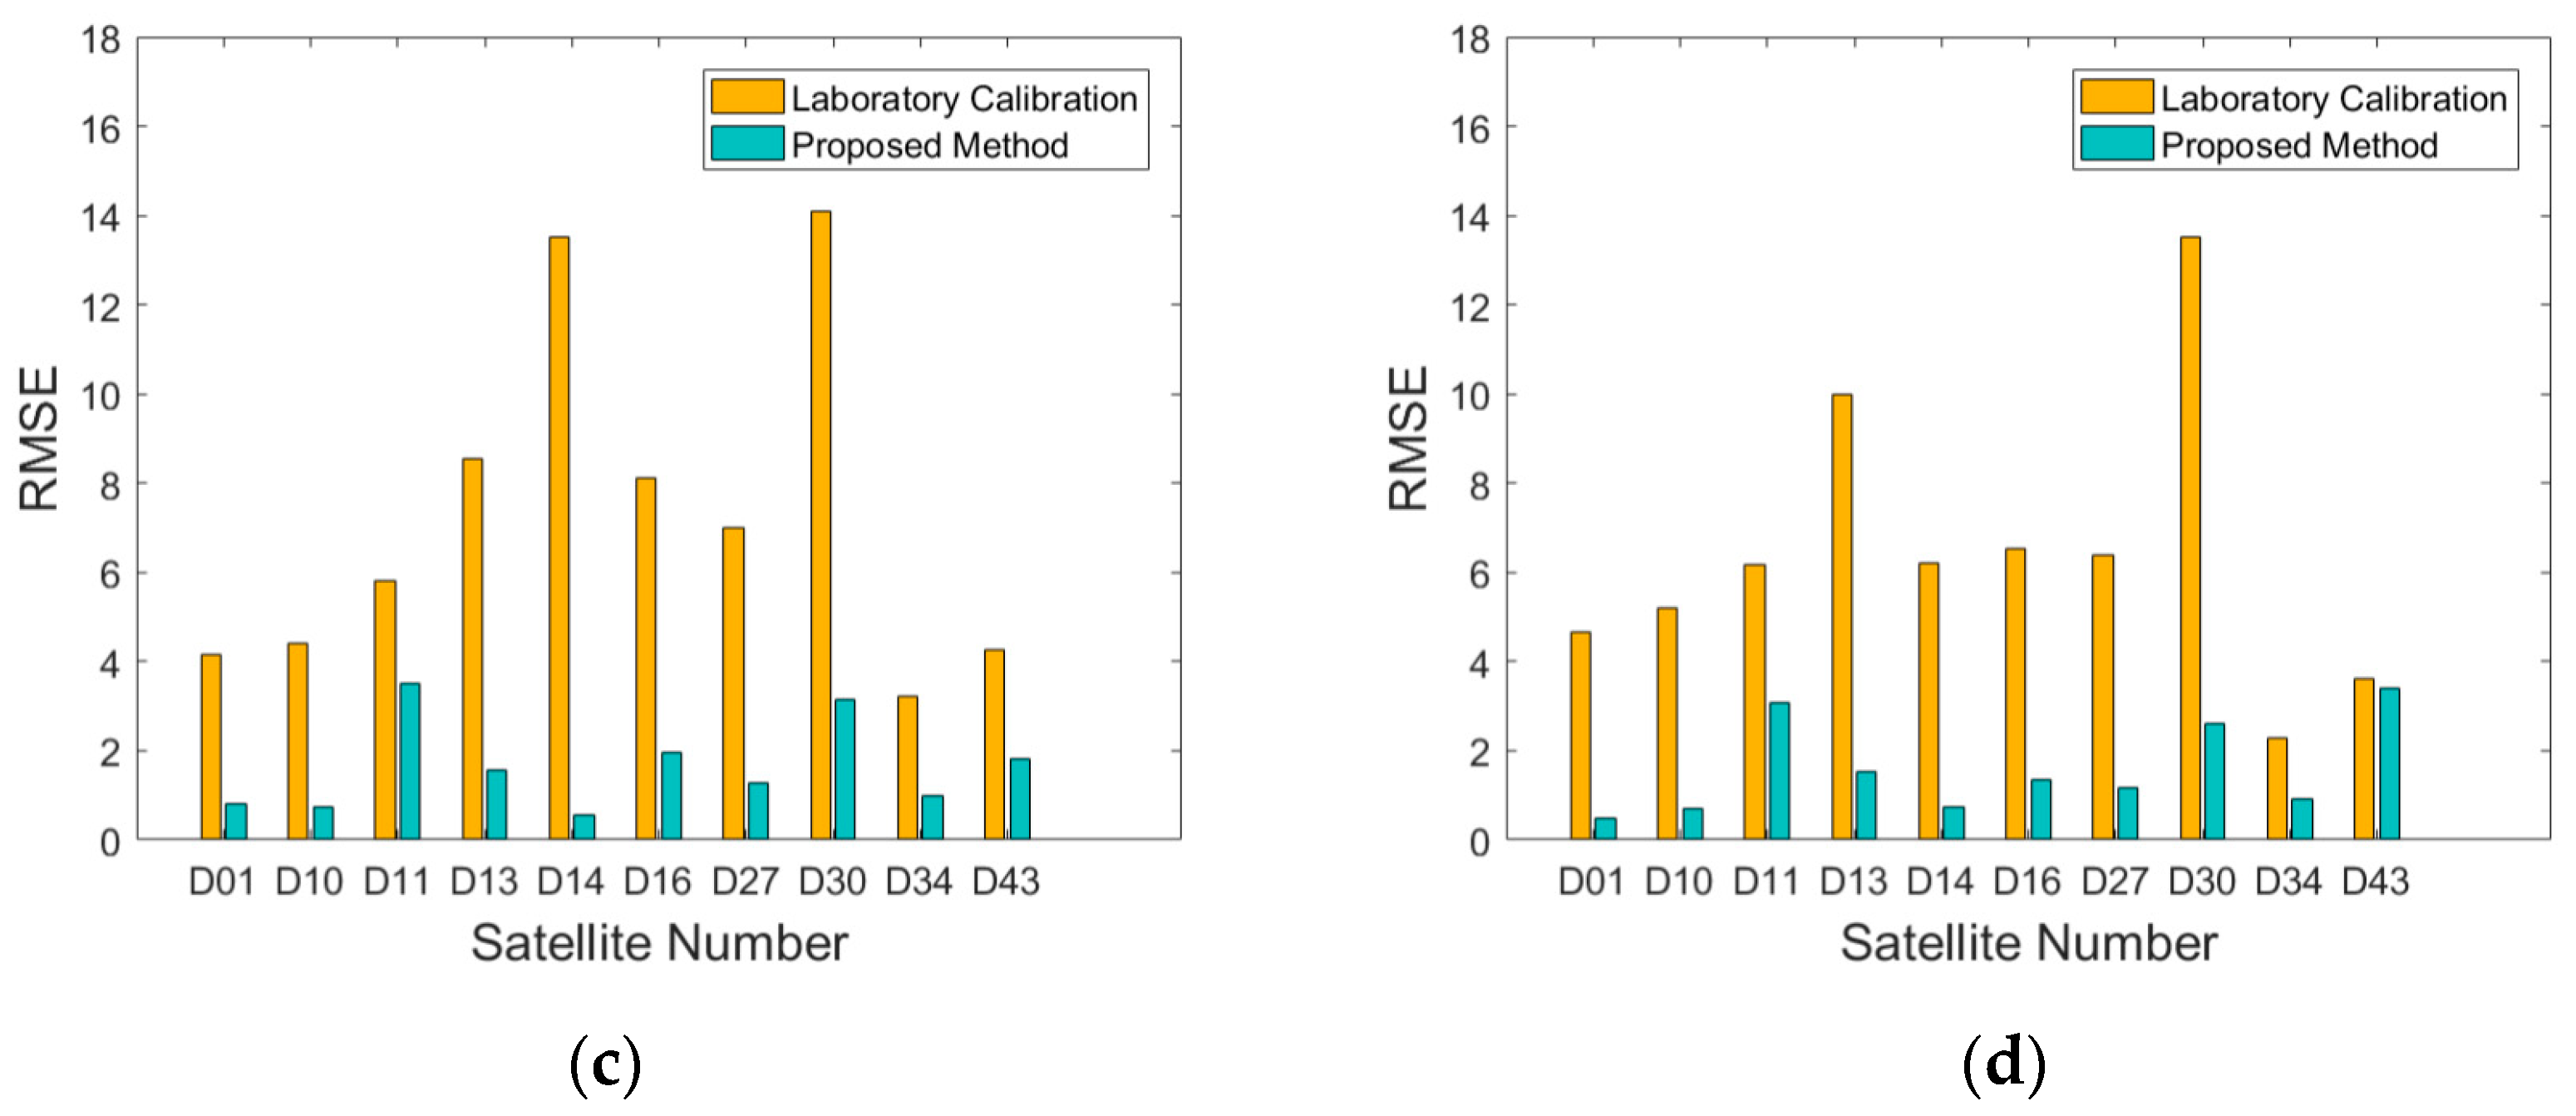
We selected 10 satellites from the GF03D series of the Jilin-1 satellites to evaluate the generality of the proposed method. Specifically, each satellite was imaged twice, with different imaging conditions. The thumbnail of 20 imaging tasks is shown in Figure 18 and the information of those imaging tasks is shown in Table 6. From the images, it can be seen that the weather was good and cloudless at the imaging time, and the imaging time interval of all imaging tasks between the JL1GF03D series satellites and Sentinel-2 series satellites was less than 1 h to ensure that the atmospheric conditions were basically the same, which can be considered a good data sample to verify the generality of the proposed method. We used one imaging task as a calibration sample to calculate the general coefficient of the imaging compatibility model and the other imaging task as a test sample to evaluate the difference from the reference radiance. The goodness of fit of each band of each satellite is shown in Table 7, and the strategy for selecting the samples is consistent with Section 3.2. The total number of samples of each band of each satellite was 20. The experimental results of L and RMSE are shown in Figure 19 and Figure 20. The results of the average RMSE and L of each band of each method are shown in Table 8.
The experimental results show that the goodness of fit of each band of each satellite was greater than 0.95, with a mean goodness of fit of 0.99, which preliminarily verifies the generality of the proposed method. The L and RMSE were all significantly lower than with the laboratory radiometric calibration method. The L of the blue band decreased from 9.61% to 4.86%, for the green band it decreased from 4.82% to 1.85%, for the red band it decreased from 8.71% to 1.98%, and for the NIR band it decreased from 12.53% to 1.15%. The average L of the four bands was reduced from 8.91% to 2.46. The RMSE of the four bands decreased from 8.12, 6.13, 7.32, and 6.46 to 1.72, 1.71, 1.64, and 1.60. The average RMSE of the four bands was reduced from 7.01 to 1.67.
To sum up, the experimental results show that the goodness of fit of the general coefficient was relatively high using the proposed method. Compared to the laboratory radiometric calibration method, the absolute radiometric calibration accuracy of 10 satellites of the Jilin-1 GF03D series satellites were significantly improved by using the proposed method, which showed good performance in different imaging conditions and with different bands. The generality of the proposed method is verified by the Jinlin-1 GF03D series satellites.

4. Discussion

This paper built an imaging condition compatibility model and proposed a general on-orbit absolute radiometric calibration method. However, our research still has certain limitations, which future studies will aim to solve.
The proposed method relies on the mathematical relationship between the reference radiance, imaging conditions, and DN. The reference radiance was obtained by cross calibration. Yet, the accuracy of the cross calibration was influenced by several factors. The imaging environment between the reference satellite and the target satellite is easily limited, such as atmospheric conditions, yaw angles, etc. These factors can lead to the differences in surface reflectance obtained by the two satellites, thereby affecting the accuracy of the radiance. In contrast, field calibration tends to be more accurate and effective, because field calibration can reduce errors with precise and controlled ground measurements.
To enhance the accuracy of the proposed method, future research will consider incorporating more field calibration data points. Despite the limitations posed by the geographical location and weather conditions, field calibration can provide precise calibration results. By establishing multiple calibration points across different geographical locations, more radiance data points can be obtained, thus improving the accuracy of the reference radiance.

5. Conclusions

This paper innovatively introduces a general on-orbit absolute radiometric calibration method compatible with multiple imaging conditions, which can significantly improve the timeliness and accuracy of absolute radiometric calibration. Firstly, we use a large amount of laboratory radiometric calibration data to explore the mathematical relationship between the imaging condition and radiance, and successfully build an imaging condition compatibility model that integrates the integral level, gain, row transfer time, DN, and radiance into a unified formula. Based on this, the absolute radiometric calibration of all imaging conditions only needs one image task. Secondly, we achieve a general on-orbit absolute radiometric calibration method by using the imaging condition compatibility model and cross calibration. A more concise and effective method is proposed for calculating the spectral-matching factor, which simplifies the calculation process and improves the effectiveness of computation. Finally, we select Sentinel-2 series satellites as the reference satellites and five imaging tasks of Jilin-1 GF03D11 satellites as the test samples. The experiment shows that the average relative difference is reduced to 2.79% and the RMSE is reduced to 1.51 compared with the laboratory radiometric calibration method. In addition, we use 10 Jilin-1 GF03D series satellites to verify the generality of the proposed method. The experiential results show that the goodness of fit of the general coefficient is greater than 95%, and the average relative difference between the reference radiance and the calibrated radiance of the proposed method is 2.46%, with an RMSE of 1.67. To sum up, by using the proposed method, all imaging conditions of optical remote sensing satellite sensors can be calibrated in one imaging task, which greatly improves the timeliness and accuracy of on-orbit absolute radiometric calibration.

Author Contributions

Conceptualization, Z.J. and L.F.; methodology, S.Y. and L.F.; software, Z.J. and S.Y.; validation, L.F. and S.Y.; formal analysis, Y.L. and D.W.; investigation, D.W. and M.C.; resources, M.C. and D.W.; data curation, D.W.; writing—original draft preparation, M.C. and L.F.; writing—review and editing, Z.J. and S.Y.; visualization, Y.L.; supervision, M.C.; project administration, Y.L.; funding acquisition, D.W. All authors have read and agreed to the published version of the manuscript.

Funding

This research was funded by the National Key Research and Development Programs of China, grant number 2020YFA0714104.

Data Availability Statement

Restrictions apply to the availability of these data.

Acknowledgments

We would like to thank the reviewers for their helpful comments.

Conflicts of Interest

All authors were employed by the company Changguang Satellite Technology Co., Ltd. The authors declare that the research was conducted in the absence of any commercial or financial relationships that could be construed as a potential conflict of interest.

References

  1. Wang, Z.; Thome, K.; Lockwood, R.; Wenny, B.N. Absolute radiometric calibration of an imaging spectroradiometer using a laboratory detector-based approach. Remote Sens. 2022, 14, 2245. [Google Scholar] [CrossRef]
  2. Hattori, T.; Dasai, F.; Sato, H.; Kato, R.; Sawada, K. CCD multi-ion image sensor with four 128 × 128 pixels array. Sensors 2019, 19, 1582. [Google Scholar] [CrossRef] [PubMed]
  3. Zhu, Y.; Yang, T.; Wang, M.; Hong, H.; Zhang, Y.; Wang, L.; Rao, Q. Jitter Detection Method Based on Sequence CMOS Images Captured by Rolling Shutter Mode for High-Resolution Remote Sensing Satellite. Remote Sens. 2022, 14, 342. [Google Scholar] [CrossRef]
  4. Li, J.; Dai, Y.; Su, X.; Wu, W. Efficient Dual-Branch Bottleneck Networks of Semantic Segmentation Based on CCD Camera. Remote Sens. 2022, 14, 3925. [Google Scholar] [CrossRef]
  5. Xu, J.; Sun, T. Study on Super-Resolution of Images Obtained by Micro Satellite with CMOS Sensor. In Proceedings of the 2019 IEEE 4th International Conference on Signal and Image Processing (ICSIP), Wuxi, China, 19–21 July 2019. [Google Scholar]
  6. Xie, Y.; Han, J.; Gu, X.; Liu, Q. On-Orbit Radiometric Calibration for a Space-Borne Multi-Camera Mosaic Imaging Sensor. Remote Sens. 2017, 9, 1248. [Google Scholar] [CrossRef]
  7. Liu, J.; Cui, Y.; He, H.; Yin, Y. Research on the Influence of Different Factors of Micro-Vibration on the Radiation Quality of TDICCD Images. In 5th International Symposium of Space Optical Instruments and Applications; Springer: Cham, Switzerland, 2020. [Google Scholar]
  8. Sun, Z.; Li, Z.; Li, W.; Wang, X.; Gao, Z.; Zhao, Y.; Liu, Y.; Zhang, H.; Liu, D. Design and Implementation of TDI CCD Imaging Circuits in Space Applications. J. Phys. Conf. Ser. 2022, 2201, 012001. [Google Scholar] [CrossRef]
  9. Yue, Q. Multi-view imaging simulation of a space born TDI CCD camera and a 3D geometric reconstruction estimate. IOP Conf. Ser. Earth Environ. Sci. 2022, 1004, 012013. [Google Scholar]
  10. Zhao, Y.; Gobbi, M.; Hueso, L.E.; Samorì, P. Molecular Approach to Engineer Two-Dimensional Devices for CMOS and beyond-CMOS Applications. Chem. Rev. 2022, 122, 50–131. [Google Scholar] [CrossRef]
  11. Czapla-Myers, J.S.; Thome, K.J.; Anderson, N.J.; Leigh, L.M.; Pinto, C.T.; Wenny, B.N. The Ground-Based Absolute Radiometric Calibration of the Landsat 9 Operational Land Imager. Remote Sens. 2024, 16, 1101. [Google Scholar] [CrossRef]
  12. Xiong, X.; Sun, J.; Xie, X.; Barnes, W.; Salomonson, V. On-Orbit Calibration and Performance of Aqua MODIS Reflective Solar Bands. IEEE Trans. Geosci. Remote Sens. 2010, 48, 535–546. [Google Scholar] [CrossRef]
  13. Jin, L.B.; Wang, H.; Zhao, Y.H.; Hu, B.; Shi, D.; Lian, M.L. Design of expandable diffuser board on GF-5 VIMI. Chin. Space Sci. Technol. 2020, 40, 81–87. [Google Scholar]
  14. Chen, Y.; Sun, K.; Li, W.; Hu, X.; Li, P.; Bai, T. Vicarious Calibration of FengYun-3D MERSI-II at Railroad Valley Playa Site: A Case for Sensors with Large View Angles. Remote Sens. 2021, 13, 1347. [Google Scholar] [CrossRef]
  15. Guo, Y.; Senthilnath, J.; Wu, W.; Zhang, X.; Zeng, Z.; Huang, H. Radiometric Calibration for Multispectral Camera of Different Imaging Conditions Mounted on a UAV Platform. Sustainability 2019, 11, 978. [Google Scholar] [CrossRef]
  16. Tang, H.F.; Tang, X.M.; Xie, J.F.; Chen, W.; Qian, Y.G. On-orbit radiometric calibration and validation of GF-7 satellite based on RadCalNet Baotou site. Natl. Remote Sens. Bull. 2023, 27, 1194–1204. [Google Scholar] [CrossRef]
  17. Stone, T.C. Acquisition of Moon Measurements by Earth Orbiting Sensors for Lunar Calibration. IEEE Trans. Geosci. Remote Sens. 2021, 60, 1001706. [Google Scholar] [CrossRef]
  18. Xiong, X.; Sun, J.; Angal, A.; Wilson, T. Calibration Inter-Comparison of MODIS and VIIRS Reflective Solar Bands Using Lunar Observations. Remote Sens. 2022, 14, 4754. [Google Scholar] [CrossRef]
  19. Chen, R.; Guan, L.; Liu, M.; Qu, L. Cross-Calibration of HY-1D/COCTS Thermal Emissive Bands in the South China Sea. Remote Sens. 2024, 16, 292. [Google Scholar] [CrossRef]
  20. Dong, J.; Chen, Y.; Chen, X.; Xu, Q. Radiometric Cross-Calibration of Wide-Field-of-View Cameras Based on Gaofen-1/6 Satellite Synergistic Observations Using Landsat-8 Operational Land Imager Images: A Solution for Off-Nadir Wide-Field-of-View Associated Problems. Remote Sens. 2023, 15, 3851. [Google Scholar] [CrossRef]
  21. Gao, C.; Liu, Y.; Liu, J.; Ma, L.; Wu, Z.; Qiu, S.; Li, C.; Zhao, Y.; Han, Q.; Zhao, E.; et al. Determination of the Key Comparison Reference Value from Multiple Field Calibration of Sentinel-2B/MSI over the Baotou Site. Remote Sens. 2020, 12, 2404. [Google Scholar] [CrossRef]
  22. Tao, Z.; Han, J.; Xie, Y.; Li, H.; Yi, H.; Guan, X. A TOA Spectral Reflectance Model of Railroad Valley Playa Site to Compensate the Missing RadCalNet Data. IEEE Trans. Geosci. Remote Sens. 2024, 62, 5629110. [Google Scholar] [CrossRef]
  23. Wang, S.; Wang, H.; Zhou, Y.; Liu, J.; Dai, P.; Du, X.; Wahab, M.A. Automatic laser profile recognition and fast tracking for structured light measurement using deep learning and template matching. Measurement 2021, 169, 108362. [Google Scholar] [CrossRef]
  24. Yakovleva, O.; Nikolaieva, K. Research of descriptor based image normalization and comparative analysis of SURF, SIFT, BRISK, ORB, KAZE, AKAZE descriptors. Adv. Inf. Syst. 2020, 4, 89–101. [Google Scholar] [CrossRef]
  25. Zhou, Q.; Tian, L.; Li, J.; Wu, H.; Zeng, Q. Radiometric cross-calibration of large-view-angle satellite sensors using global searching to reduce BRDF influence. IEEE Trans. Geosci. Remote Sens. 2020, 59, 5234–5245. [Google Scholar] [CrossRef]
  26. Antunes, M.A.H.; Gleriani, J.M.; Debiasi, P. Atmospheric effects on vegetation indices of TM and ETM+ images from a tropical region using the 6S model. In Proceedings of the 2012 IEEE International Geoscience and Remote Sensing Symposium, Munich, Germany, 22–27 July 2012. [Google Scholar]
  27. Belgiu, M.; Marshall, M.; Boschetti, M.; Pepe, M.; Stein, A.; Nelson, A. PRISMA and Sentinel-2 spectral response to the nutrient composition of grains. Remote Sens. Environ. 2023, 292, 113567. [Google Scholar] [CrossRef]
  28. Zhang, J.; Liu, J.; Fan, W.; Qiu, W.; Luo, J. Partial Hadamard encoded synthetic transmit aperture for high frame rate imaging with minimal l 2-norm least squares method. Phys. Med. Biol. 2022, 67, 105002. [Google Scholar] [CrossRef]
  29. Hu, Y.; Li, X.-M.; Dou, C.; Jia, G.; Hu, Z.; Xu, A.; Ren, Y.; Yan, L.; Wang, N.; Cui, Z.; et al. Absolute radiometric calibration evaluation of the thermal infrared spectrometer onboard SDGSAT-1. Int. J. Digit. Earth 2023, 16, 4492–4511. [Google Scholar] [CrossRef]
  30. Tang, H.; Xie, J.; Chen, W.; Zhang, H.; Wang, H. Absolute Radiometric Calibration of ZY3-02 Satellite Multispectral Imager Based on Irradiance-Based Method. Remote Sens. 2023, 15, 448. [Google Scholar] [CrossRef]
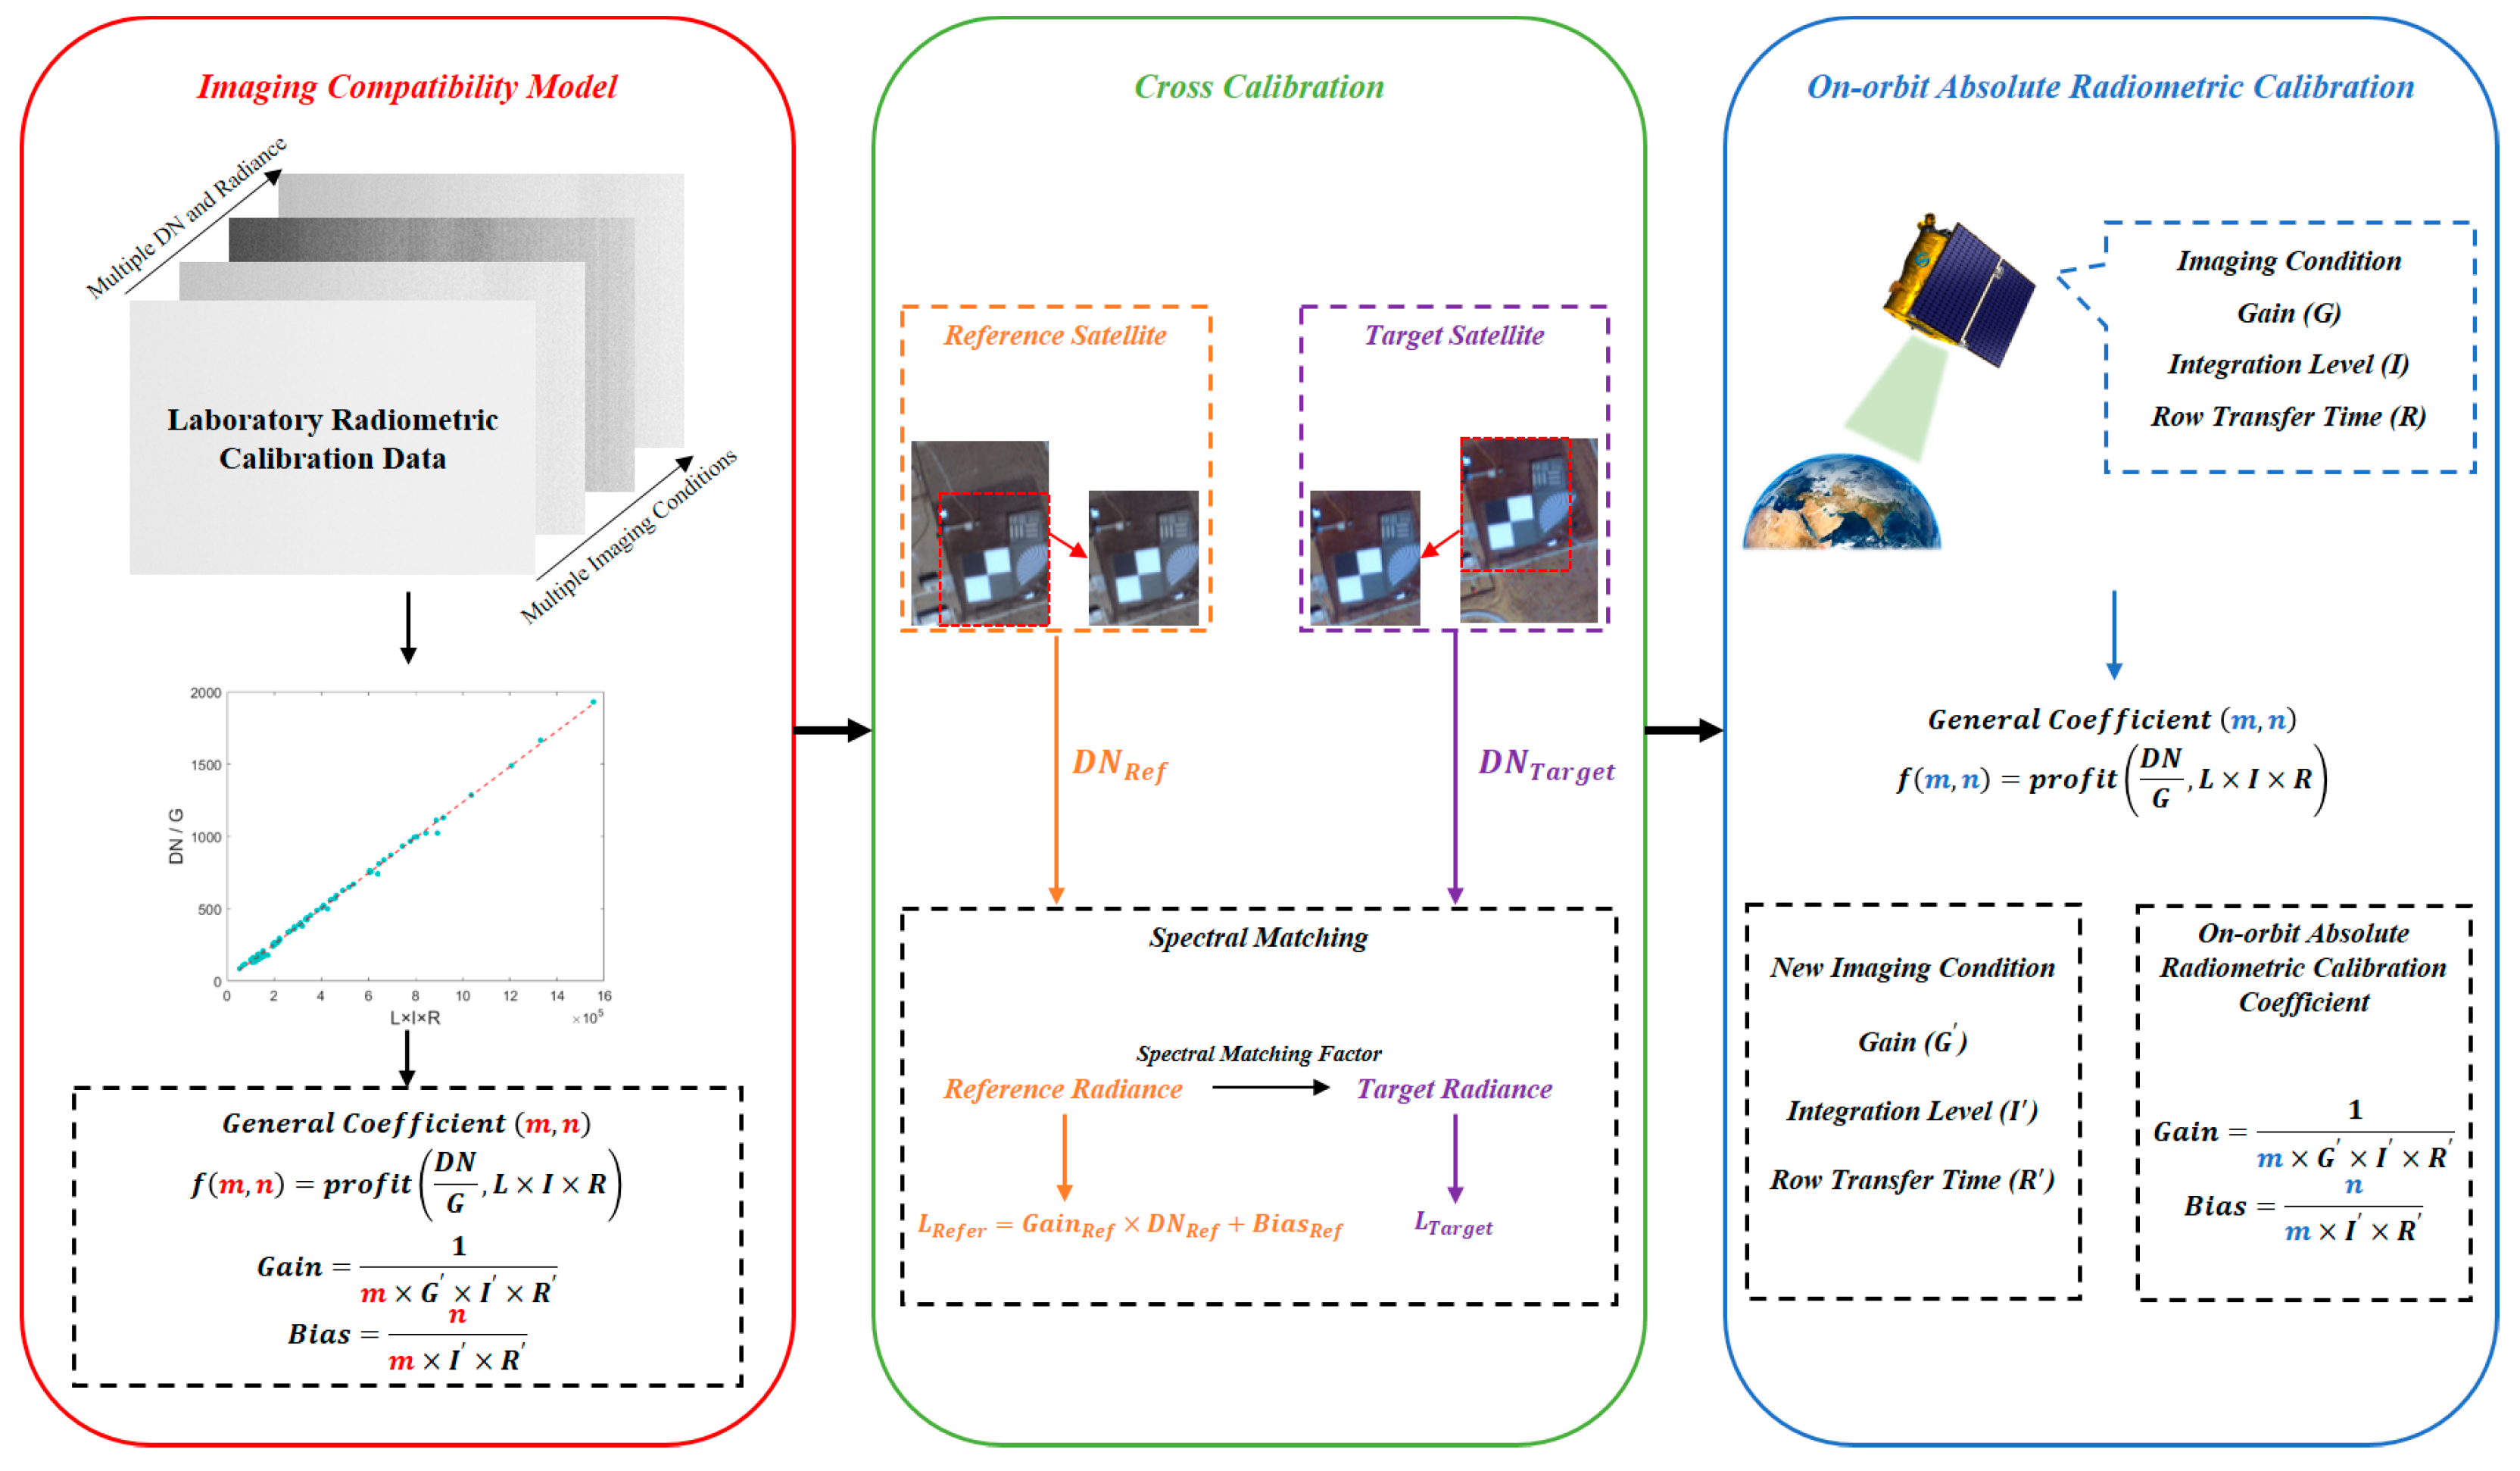
Figure 1. Workflow of on-orbit absolute radiometric calibration method compatible with multiple imaging conditions.
Remotesensing 16 03503 g001
Figure 2. Exploring the mathematical relationship between the radiance, DN, gain, row transfer time, and integration level by using multiple radiance levels of the experiments. L represents the radiance level of the integrating sphere light source used for laboratory radiometric calibration. (a) The relationship between DN and gain. (b) The relationship between DN and integration level. (c) The relationship between DN and row transfer time.
Remotesensing 16 03503 g002
Figure 3. The mathematical relationship between any two imaging condition parameters and DN under the same radiance level. (a) The relationship between gain, integration level, and DN. (b) The relationship between row transfer time, gain, and DN. (c) The relationship between row transfer time, integration level, and DN.
Remotesensing 16 03503 g003
Figure 4. The experimental results of the imaging condition compatibility model using 11 different radiance levels, 13 imaging conditions, and 300 image tasks of the JL1GF03D11 satellites. The red dashed line represents the fitting curve, and the blue points represent each sample.
Remotesensing 16 03503 g004
Figure 5. Thumbnails of Baotou Field from June to November 2023.
Remotesensing 16 03503 g005
Figure 6. Thumbnails of Railroad Valley Field from June to November 2023.
Remotesensing 16 03503 g006
Figure 7. The workflow of corresponding points matching in the uniform surface features of the imaging task, which first uses template matching to roughly determine the homologous regions, followed by precise matching with the ORB algorithm to accommodate rotational changes and other variances.
Remotesensing 16 03503 g007
Figure 8. The spectral response curve of the Sentinel-2 series satellites. (a) Sentinel-2A. (b) Sentinel-2B.
Remotesensing 16 03503 g008
Figure 9. The spectral response curve of the JL1GF03D series satellites.
Remotesensing 16 03503 g009
Figure 10. The thumbnails of each imaging task of the JL1GF03D11 satellites in November 2023.
Remotesensing 16 03503 g010
Figure 11. The results of DN and radiance. (a) Blue. (b) Green. (c) Red. (d) NIR. The red dashed line represents the fitting curve, and the blue points represent each sample.
Remotesensing 16 03503 g011
Figure 12. The results of the general coefficient. (a) Blue. (b) Green. (c) Red. (d) NIR. The red dashed line represents the fitting curve, and the blue points represent each sample.
Remotesensing 16 03503 g012
Figure 13. Comparison of the radiance for Test 1. (a) Blue. (b) Green. (c) Red. (d) NIR.
Remotesensing 16 03503 g013
Figure 14. Comparison of the radiance for Test 2. (a) Blue. (b) Green. (c) Red. (d) NIR.
Remotesensing 16 03503 g014
Figure 15. Comparison of the radiance for Test 3. (a) Blue. (b) Green. (c) Red. (d) NIR.
Remotesensing 16 03503 g015
Figure 16. Comparison of the radiance for Test 4. (a) Blue. (b) Green. (c) Red. (d) NIR.
Remotesensing 16 03503 g016
Figure 17. Comparison of L for Test 1–Test 4. (a) Blue. (b) Green. (c) Red. (d) NIR.
Remotesensing 16 03503 g017
Figure 18. The thumbnail of 20 imaging tasks from the JL1GF03D series satellites.
Remotesensing 16 03503 g018
Figure 19. Comparison of the average L for each satellite. (a) Blue. (b) Green. (c) Red. (d) NIR.
Remotesensing 16 03503 g019
Figure 20. Comparison of the average RMSE for each satellite. (a) Blue. (b) Green. (c) Red. (d) NIR.
Remotesensing 16 03503 g020aRemotesensing 16 03503 g020b
Table 1. The imaging condition information of laboratory radiometric calibration data.
Integration LevelGainRow Transfer Time (μs)Total Number
42560.1325
162487.9415
162519.9415
162560.1340
162600.0615
162640.0015
162560.1325
162560.1325
163560.1325
164560.1325
325560.1325
482560.1325
642560.1325
Table 2. Technical index of the Sentinel-2 series satellites.
BandResolution (m)Width (km)Center Wavelength (nm)Band Width (nm)
Blue1029049065
Green56035
Red66530
NIR842115
Table 3. Technical index of the JL1GF03D series satellites.
BandResolution (m)Width (km)Spectral Band (nm)
Blue3More than 17430–520
Green520–640
Red610–690
NIR770–895
Table 4. The information of the imaging conditions (B-G-R-NIR bands) of the JLGF03D11 and Sentinel-2 series satellites.
Target
Satellite
Imaging
Time
Reference
Satellite
Imaging
Time
Integration
Level
GainRow Transfer Time (μs)Calibration
Field
Sample
Index
JL1GF03D112023-11-12 02:29:05Sentinel-2A2023-11-12 02:26:0916-12-8-82-2-3-3407.23Railroad
Valley
Calibration
2023-11-17 02:34:53Sentinel-2B2023-11-17 02:26:3116-12-8-82-2-3-3404.74Railroad
Valley
Test 1
2023-11-19 11:27:27Sentinel-2A2023-11-19 11:30:3116-12-8-243-3-4-2411.07Baotou
Field
Test 2
2023-11-24 11:32:31Sentinel-2B2023-11-24 11:30:4016-12-8-243-3-4-2397.82Baotou
Field
Test 3
2023-11-29 11:36:45Sentinel-2A2023-11-29 11:31:0132-12-8-242-3-4-2399.36Baotou
Field
Test 4
Table 5. Compare of the mean of L and RMSE for Test 1–Test 4.
BandMethods L (%)RMSE
BlueLaboratory radiometric calibration16.887.44
Proposed method2.601.44
GreenLaboratory radiometric calibration10.284.42
Proposed method4.332.15
RedLaboratory radiometric calibration12.625.86
Proposed method2.541.51
NIRLaboratory radiometric calibration15.786.77
Proposed method1.680.96
Table 6. Information of the imaging tasks of multiple satellites.
Target
Satellite
Imaging
Time
Reference
Satellite
Imaging TimeIntegration
Level
GainRow Transfer Time (μs)Calibration
Field
JL1GF03D012023-11-24 11:30:49Sentinel-2B2023-11-24 10:48:0032-12-8-242-3-4-2405.50Baotou
2023-11-12 11:40:01Sentinel-2A2023-11-12 10:51:0016-12-8-243-3-4-2411.26Baotou
JL1GF03D102023-12-07 11:41:29Sentinel-2B2023-12-07 11:35:0016-12-8-83-2-3-3388.42Baotou
2023-12-02 11:41:11Sentinel-2A2023-12-02 11:32:0032-12-8-242-3-4-2389.57Baotou
JL1GF03D112023-11-17 02:26:31Sentinel-2A2023-11-17 02:35:0016-12-8-82-2-3-3404.74Railroad Valley
2023-11-24 11:30:49Sentinel-2B2023-11-24 11:32:0016-12-8-243-3-4-2397.82Baotou
JL1GF03D132023-11-22 02:26:49Sentinel-2B2023-11-22 02:27:0016-12-8-83-2-3-3402.62Railroad Valley
2023-11-27 02:27:11Sentinel-2A2023-11-27 02:32:0016-12-8-83-2-3-3393.41Railroad Valley
JL1GF03D142023-11-09 11:29:41Sentinel-2A2023-11-09 11:30:0016-12-8-83-3-3-3405.89Baotou
2023-11-14 11:30:09Sentinel-2B2023-11-14 11:37:0016-12-8-83-3-4-3409.54Baotou
JL1GF03D162023-11-14 11:30:09Sentinel-2B2023-11-14 11:27:0016-12-8-243-3-4-2417.98Baotou
2023-11-24 11:30:49Sentinel-2B2023-11-24 11:38:0016-12-8-243-3-4-2415.68Baotou
JL1GF03D272023-11-17 11:40:29Sentinel-2B2023-11-17 11:32:0016-12-8-243-3-4-2403.78Baotou
2023-12-04 11:31:19Sentinel-2B2023-12-04 11:36:0016-12-8-243-3-4-2405.50Baotou
JL1GF03D302023-11-12 02:26:09Sentinel-2A2023-11-12 02:31:0016-12-8-82-2-2-3414.91Railroad Valley
2023-09-13 11:35:41Sentinel-2A2023-09-13 11:28:0016-12-8-82-2-3-3399.55Baotou
JL1GF03D342023-11-24 11:30:49Sentinel-2B2023-11-24 11:15:0016-12-8-243-3-4-2383.42Baotou
2023-12-09 11:31:31Sentinel-2A2023-12-09 11:14:0332-12-8-242-3-4-2391.10Baotou
JL1GF03D432023-11-29 11:31:41Sentinel-2A2023-11-29 13:09:0016-12-8-82-2-3-3406.27Baotou
2023-11-15 02:36:29Sentinel-2B2023-11-15 03:10:0016-12-8-243-3-4-2405.89Railroad Valley
Table 7. Goodness of fit of each band of each satellite.
SatelliteBlueGreenRedNIRMean
JL1GF03D010.990.990.990.990.99
JL1GF03D100.990.980.990.980.99
JL1GF03D110.990.990.990.990.99
JL1GF03D130.990.990.990.990.99
JL1GF03D140.990.990.990.980.99
JL1GF03D160.990.990.990.990.99
JL1GF03D270.990.990.990.990.99
JL1GF03D300.990.990.990.990.99
JL1GF03D340.970.960.960.970.97
JL1GF03D430.990.990.990.990.99
Table 8. Comparison the average of L and RMSE for each band for each satellite.
BandMethods L (%)RMSE
BlueLaboratory radiometric calibration9.618.12
Proposed method4.861.72
GreenLaboratory radiometric calibration4.826.13
Proposed method1.851.71
RedLaboratory radiometric calibration8.717.32
Proposed method1.981.64
NIRLaboratory radiometric calibration12.536.46
Proposed method1.151.60
Disclaimer/Publisher’s Note: The statements, opinions and data contained in all publications are solely those of the individual author(s) and contributor(s) and not of MDPI and/or the editor(s). MDPI and/or the editor(s) disclaim responsibility for any injury to people or property resulting from any ideas, methods, instructions or products referred to in the content.