Abstract
Variations in vegetation composition and structure are significant signals of the succession of mudflat ecosystems and have important indicative roles in mudflat ecosystem degradation. Due to poor accessibility of vast even mudflat areas, variation in vegetation composition and structure across mudflat areas remains unclear in the Yellow River Delta (YRD), China. We provided an UAV multispectral orthomosaic with 10 cm ground sample distance to classify and compare the vegetation composition and structure across mudflat areas in the YRD. The vegetation classification overall accuracy achieved 95.0%. We found that although a significant difference (p < 0.05) was checked out in terms of the Shannon–Wiener diversity index (from 1.33 to 0.92) and evenness index (from 0.96 to 0.66) among the eight subareas from land to sea, all four dominant vegetation communities (S. salsa, L. bicolor, T. chinensis, and P. australis) were discovered at all eight subareas. Our findings support the idea that the regional environment and local microtopography are the predominant forces for variation in vegetation composition and structure across mudflat areas. From the perspective of vegetation restoration and conservation, changing the local microtopography will be an interesting way to enhance the vegetation diversity of the mudflat ecosystems in the YRD.
1. Introduction
Vegetation regulates the flux of carbon, water, energy, and sediment processes of the Earth system [1]. Vegetation in hyper-arid, arid, and semiarid regions occupying about 37% of the world-wide land area occurs as a pattern consisting of small vegetation patches alternated with bare soil areas [2,3,4], predominantly due to plant–soil feedback in scarce environments [2,3,5,6]. Vegetation composition and structure have been recognized as vital constituents for a long-term retention of ecosystem functionality [7,8], regulating water runoff, soil stability, carbon sink, wildlife habitat, and ecosystem resilience [9,10,11,12]. The persistent clearance of vegetation and the degradation of vegetation structure can result in catastrophic shifts in ecological structure and functionality, influencing the local economy, society, and environment [12,13,14,15]. Therefore, monitoring vegetation composition and structure is critical for quantifying ecosystem productivity and habitat suitability, evaluating structures necessary for ecosystem resilience, susceptibility to invasions, and response to anthropogenic factors, modeling patterns of vegetation diversity, understanding species distribution pattern, helping predict evolutionary pathways, determining biogeochemical cycles necessary for a long-term persistence of ecosystem functionality, and guiding potential management practices and restoration projects [1,8,16,17].
High-resolution remotely sensed imagery is widely utilized by ecologists to map vegetation composition and structure, greatly increasing the frequency and range of ecosystem monitoring [18,19]. However, there is considerable inconsistency between field-based and remotely sensed methods as the variables obtained from field investigation are very different in spatial and temporal scales from the parameters derived from the remotely sensed observation [20]. The limited data of vegetation composition and structure gathered in situ are required to link the broad-scale ecosystem attributes derived by remote sensing techniques to fully measure and understand ecosystem functionality from landscape to local scales [21].
Unmanned aerial vehicles (UAVs) can close the gap between field-based and remotely sensed data and reduce the limitations in limited-access and complex environments that have previously been laborious to survey as small instruments can image dangerous or remote regions for monitoring and management demands, in terms of higher spatial and temporal resolution, increased feasibility, and relatively low cost, especially when employed for small-scale regions [20,22,23,24]. UAVs are increasingly used in monitoring vegetation composition, structure, and patterns in population ecology, environmental biology, plant ecology, restoration ecology, and wetland and savanna ecosystems [24,25,26,27,28,29]. In semi-arid coastal zones, heterogeneous landscapes caused by factors such as water, salinity, microtopography, tides, and human activity make it challenging to use meter-level resolution remotely sensed data to monitor fine-scale vegetation composition and structure, an issue which may be addressed by UAV-captured decimeter-level and centimeter-level images which have been proven to be effective for quantifying fine-scale vegetation cover, composition, and structure [22,29,30].
The Yellow River Delta (YRD) is one of the fastest-growing estuary deltas on Earth [31], providing a crucial nursery, overwintering, and transfer place for migratory birds from Northeast Asia and the Western Pacific Rim [32]. Suaeda salsa, Tamarix chinensis, and Phragmites australis are the dominant native plants across vast even mudflat areas in the YRD, adapting to the semi-arid climate, soil salinity, shallow and salty groundwater, microtopography, and tidal current [33,34,35], and constitute suitable habitats for waterfowl, for example, the rare Oriental White Stork (Ciconia boyciana), Saunders’s Gull (Saundersilarus saundersi), and Red-crowned Crane (Grus japonensis).
Field-based approaches have been used to depict plant community succession (saline bare soil, S. salsa, T. chinensis, and meadow) in the modern YRD [35], investigate the effects of water table depth and soil salinity on T. chinensis [36,37], assess potential plant distribution influenced by soil salinity and underground water level [33], characterize a typical zonal vegetation distribution in shell ridge islands and habitats [38,39], analyze the relations between plant types and soil properties [40,41], and quantify the differences in soil physicochemical properties under different vegetation compositions within the quasi-circular vegetation patches (QVPs) [42,43].
Remotely sensed methods have been employed to depict a zonal vegetation distribution (community P. australis, community T. chinensis, community S. salsa, tidal flats, and sea) along the Yellow River towards both sides through Landsat Thematic Mapper (TM) data collected in 1995 [44], analyze land use changes from 1956 to 1996 and land cover dynamics from 1995 to 2010 using Landsat TM images [45,46], classify wetland compositions using Advanced Spaceborne Thermal Emission and Reflection Radiometer imagery and Landsat TM images [47,48], characterize vegetation pattern dynamic using landscape metrics derived from Landsat TM data from 1993 to 2005 [49], evaluate changes in ecosystem boundary types and conditions between 1992 and 2006 using Landsat TM images [50], monitor vegetation changes in wetlands from 2018 to 2020 using Sentinel-2 images and from 2020 to 2022 using Zhuhai-1 hyperspectral data [51,52], detect the distribution of QVPs using Systeme Probatoire d’Observation de la Terre (SPOT) 5 fusion-ready data [53], identify spatial-temporal features of native and invasive Spartina alterniflora using Sentinel-2 images [54], and map plant communities (community S. salsa, community T. chinensis, and community P. australis) arranged in ring structures within QVPs using GF-1 imagery [55].
The integration of remote sensing with field survey data is used to predict vegetation distribution based on sampling data, spectral data of SPOT 5, DEM data, and generalized additive models [56], to assess the effects of reclamation activities on vegetation cover using statistical data, SPOT 5 images, and structural equation models [57], to identify the steady-state transition of hydroclimatic vegetation systems from 1982 to 2015 based on meteorological data, hydrological data, land use data, and GIMMS3g NDVI data [58], to reveal the vegetation–hydrology interaction at multi-scales based on sampling data, spectral data and DEM derived from unmanned aerial images, and a hydrological connectivity framework [59], and to analyze spatial-temporal variation in vegetation cover and driving factors based on meteorological data, runoff data, and vegetation indices from Landsat TM and Medium-resolution Imaging Spectrometer (MODIS) data [60,61].
In the above-mentioned studies, the field-based approaches cover limited spatial scopes while the remote sensing-based approaches, with medium spatial resolutions (2 m–30 m), make it difficult to identify vegetation composition and structure. Due to the poor accessibility of vast even mudflat areas, there are few studies that have been carried out for fine-scale vegetation monitoring across mudflat areas in the YRD, and the variation in the composition and structure of vegetation across mudflat areas remains unclear. In view of significant ecological roles that vegetation across mudflat areas plays in ecosystem productivity and habitat suitability, there is a demand for data on the present situation and spatial variation of vegetation so as to suggest appropriate strategies for high-quality conservation and sustainability management of Shandong Yellow River Delta National Natural Reserve (SDYRDNR), included in a Ramsar Wetland of International Importance in 2013 and named a World Natural Heritage Site in 2024.
The overall aim of this study was to present and compare variation in vegetation composition and structure across mudflat areas using UAV decimeter-level imagery to aid in the biodiversity conservation of mudflats area in the YRD and provide data support for ongoing ecological restoration projects. The main objective was to determine, in quantitative terms, the vegetation composition and structure across mudflat areas. We expected to answer the question of how vegetation composition and structure are distributed geographically, and why?
2. Materials and Methods
2.1. Study Area
The YRD is created by the Yellow River since 1855 [31], and its main body is located in Dongying City, Shandong Province, China, with an aridity index of 3.56 [34]. The annual average precipitation and evaporation are 592 mm and 1962 mm, respectively. The SDYRDNR (118°33′E–119°20′E and 37°35′N–38°12′N), part of the YRD, includes the northern Yiqianer Management Station and the eastern Dawenliu Management Station (Figure 1a). An area of approximately 2.13 km2 at the Yiqianer Management Station was chosen as the study area, occupied by sparse vegetation patches scattered over a low and flat mudflat area (the area surrounded by the yellow line in Figure 1b).
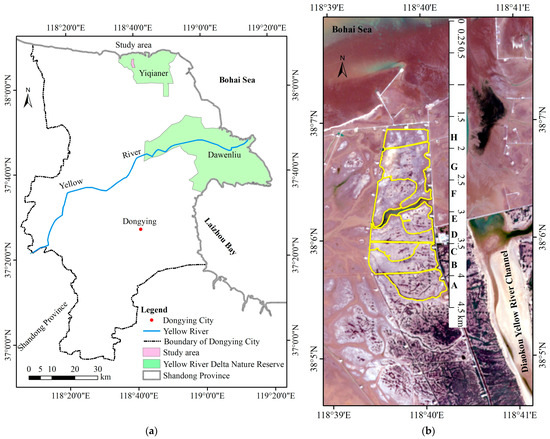
Figure 1.
Study area. (a) Geographic location of the study area; (b) Sentinel-2 imagery of the study area acquired on 24 June 2024 and the eight subareas surrounded by the yellow line (from A to H) from land to sea.
2.2. Platform and Sensors
A DJITM Phantom 4 Multispectral (DJI Sciences and Technologies Ltd., Shenzhen, China) was chosen for this study. It is outfitted with a RGB camera and a multispectral camera array and a built-in real-time kinematic (RTK) network for enhancing image positioning precision [62]. A single flight (using the battery from 100% to 30%) can image a maximum operational area of about 0.63 km2 at 180 m altitude (ground sample distance (GSD) is about 9.52 cm, and the forward and side overlap rates are 80% and 60%, respectively). The multispectral camera array collects narrowband imagery in blue (B, 450 ± 16 nm), green (G, 560 ± 16 nm), red (R, 650 ± 16 nm), red edge (RE, 730 ± 16 nm), and near-infrared (NIR, 840 ± 26 nm) portions of the electromagnetic spectrum.
2.3. Data Collection and Preprocessing
The resolution of the UAVs survey has to be determined according to the similarity of vegetation composition and heterogeneity component [20]. It is known that vegetation patches across mudflat areas have a zonal or ring structure distribution [38,39,42,44]. In general, the width of the area occupied by community S. salsa was less than 1.0 m and the width of an individual T. chinensis was less than 2.0 m within an individual vegetation patch, which led to a low accuracy (overall accuracy is 78%) in mapping vegetation communities using GF-1 imagery with 2 m spatial resolution in a previous study [55]. Inadequately coarse spatial resolution can obtain low detection accuracy; although excessive spatial resolution can be beneficial for identifying small vegetation patches or individual plants, it can greatly increase the data acquisition and processing time, data storage, and complexity, influencing the efficiency of vegetation classification [20]. Taking into account acquisition time, computational cost, the purpose of this study, and the interesting vegetation addressed, the GSD was set to 10 cm in this study.
The UAV was flown using the DJI GS Pro iPad app (DJI Sciences and Technologies Ltd., Shenzhen, China) with 75% forward overlap rate, 60% side overlap rate, and a GSD of 10 cm at a flight attitude of 233 m on 2 November 2023. In order to obtain training and validation samples, the UAV was flown over the middle part (covered 0.46 km2) of the study area with similar forward and side overlap ratios and a GSD of 2 cm at a flight attitude of 47 m on 1 November 2023. A total of 2280 images with a GSD of 10 cm and 5754 images with a GSD of 2 cm were acquired and saved with JPEG compression, from which the multispectral orthomosaics with a GSD of 2 cm and 10 cm were generated. In this season, S. salsa turns red, T. chinensis remains green, and P. australis withers and turns yellow (Figure 2), which can be easily distinguished from the UAV RGB true imagery of 2 cm/pixel by visual interpretation.
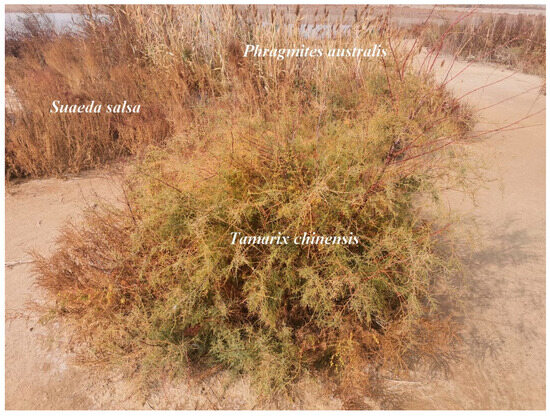
Figure 2.
Photo of community P. australis, T. chinensis, and S. salsa. Taken on 1 November 2023.
2.4. Vegetation Composition Identification
Many studies employed vegetation indices (Vis) derived from multispectral bands to identify vegetation composition and structure and highlighted the primary advantages and disadvantages of these indices [17,63,64,65,66,67,68]. The nineteen well-known and efficient Vis, capable of deriving data from the multispectral orthomosaic narrowband imagery from a DJITM Phantom 4 Multispectral, such as the Normalized Difference Vegetation Index (NDVI), Green Normalized Difference Vegetation Index (GNDVI), Normalized Difference Red Edge Index (NDRE), Optimized Soil Adjusted Vegetation Index (OSAVI), Leaf Chlorophyll Index (LCI), Normalized Green-Red Difference Index (NGRDI), Visible-band Difference Vegetation Index (VDVI), Colour Index Vegetation Extraction (CIVE), Excess Green Vegetation Index (ExG), Excess Red Vegetation Index (ExR), Vegetation (VEG), Green-Red Difference Index (GRDI), Normalized Green-Blue Difference Index (NGBDI), Excess Blue Vegetation Index (ExB), Excess Green-Excess Red Vegetation Index (ExGR), Triangular Greenness Index (TGI), Modified Excess Green Vegetation Index (MexG), Green-Blue Difference + Modified Excess Green Vegetation Index (GBDI + MexG), and Topsoil Grain Size Index (TGSI) [63,64,65,66,67,68,69], listed in Table 1, were calculated from the multispectral orthomosaic.

Table 1.
Vegetation indices in this study.
A certain vegetation index may overestimate vegetation in one application and underestimate vegetation in another application. The efficiency of the Vis in identifying vegetation composition varied considerably with imaging seasons, imaging conditions, shadows caused by vegetation itself or by other objects, background complexity, and targeted vegetation separability [20,65]. By repeatedly visually overlaying and comparing the above-mentioned Vis with the true color orthomosaic for the separability among community P. australis, community T. chinensis, community S. salsa + Limonium bicolor [Bunge] Kuntze, community S. salsa, and non-vegetation, the NDVI, NDRE, VEG, ExR, and TGSI were chosen to map vegetation composition and structure in this study.
In contrast to pixel-based approaches, the object-oriented approaches are more locally adaptive. The object-oriented example-based feature extraction (OEFE) with support vector machine approach, available in ENVI 5.5 software (Harris Inc., Boulder, CO, USA), was used to successfully identify the vegetation patches [70], which were then used to map vegetation composition in this study. To ensure the integrity of the identified vegetation and avoid the ‘salt-pepper’ effects in classification results, the NDVI, NDRE, VEG, ExR, and TGSI were first segmented using the edge algorithm at an appropriate scale and merge level. After repeated experiments and accuracy assessments, a scale level of 20 and a merge level of 90 were chosen to segment the NDVI, NDRE, VEG, ExR, and TGSI images. Based on the field survey data and the true color orthomosaic with a GSD of 2 cm and 10 cm, the multispectral orthomosaics were classified into five classes, community S. salsa, community S. salsa + L. bicolor, community T. chinensis, community P. australis, and non-vegetation (all the other land cover), using the OEFE with support vector machine approach. Then, the classification result was converted into vector data and imported into ArcGIS Desktop 10.7 software (Esri Inc., Redlands, CA, USA) and post-processed by visual interpretation to reduce obviously incorrect classifications.
The randomly sampled points were created by stratified random sampling method for post-classification accuracy assessment. Overall accuracy (OA), User’s accuracy (UA), and Producer’s accuracy (PA) derived from the confusion matrix were used for accuracy assessment.
All the processes in vegetation composition identification were performed using ENVI 5.5 software (Harris Inc., Boulder, CO, USA).
2.5. Spatial Analyses
The study area was divided into eight subareas (Subarea A, B, C, D, E, F, G, and H) across mudflats from land to sea based on the appearance of road, tidal creek, or ditch, distance to the sea, and vegetation cover (Figure 1b and Figure 3). The centers of Subarea A, Subarea B, Subarea C, Subarea D, Subarea E, Subarea F, Subarea G, and Subarea H were located at a distance of about 4.2 km, 3.8 km, 3.6 km, 3.3 km, 3.1 km, 2.7 km, 2.3 km, and 1.8 km from the northern coastline (Figure 1b and Figure 3), and covered an area of 31.8 × 10⁴ m2, 32.7 × 10⁴ m2, 15.2 × 10⁴ m2, 23.9 × 10⁴ m2, 17.8 × 10⁴ m2, 29.0 × 10⁴ m2, 45.7 × 10⁴ m2, and 16.9 × 10⁴ m2, respectively. Based on a survey of the literature [10,12,16,19,71,72] and the vegetation-related variables obtained from the multispectral orthomosaic, we chose these parameters (Table 2) to analyze the variation in vegetation composition and structure in this study. Analysis for parameters with significant differences among the different subareas was carried out using the multiple independent samples nonparametric Jonckheere–Terpstra test at 5% level of significance. The Jonckheere–Terpstra test is a non-parametric statistical test that is ideal for determining whether there is a significant difference among multiple groups of small sample sizes without requiring assumptions of normality and homogeneity of variance [73]. All statistical analyses were conducted in Statistical Package for Social Sciences (SPSS) version 19 for Windows (IBM Corp., Armonk, NY, USA).
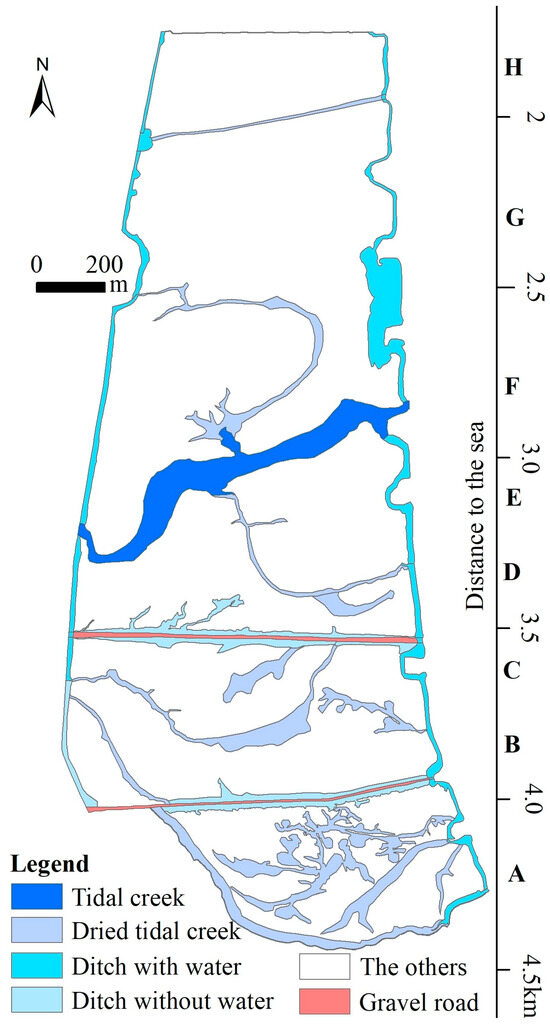
Figure 3.
The roads, tidal creeks, or ditches in the study area.

Table 2.
Parameters used to analyze vegetation composition and structure in this study.
3. Results
3.1. Vegetation Composition Classification and Accuracy Assessment
Table 3 summarizes the classification accuracy of the vegetation composition of the study area. The OA was 95.0%. The low PA values were 60.9% for the community S. salsa and 67.6% for the community T. chinensis, which could be mainly due to the confusion between the community S. salsa and non-vegetation and the omission of the communities T. chinensis due to their smaller sizes.

Table 3.
Confusion matrix and accuracy assessment for classification result of vegetation compositions of study area.
3.2. Vegetation Composition and Structure across Mudflat Areas
The UAV multispectral orthomosaic imagery and vegetation composition of Subarea A are illustrated in Figure 4, and the vegetation compositions of the other seven subareas (Subarea B to Subarea H) are shown in Figure A1, Figure A2, Figure A3, Figure A4, Figure A5, Figure A6 and Figure A7 from Appendix A. Subarea A, Subarea B, Subarea C, Subarea D, Subarea E, Subarea F, Subarea G, and Subarea H had 5308, 2046, 515, 1272, 1195, 1322, 688, and 145 vegetation patches, respectively, and the detailed vegetation community composition and structural characteristics of eight subareas are shown in Figure 5. Individual vegetation patches in study area often showed a ring-like structure where, from the edge to the center, there were community S. salsa, S. salsa + L. bicolor, T. chinensis, and P. australis (Figure 4 and Figure 6). The shape of the ring structure was mostly circular or striped (Figure 4, Figure 6, Figure A1, Figure A2, Figure A3, Figure A4, Figure A5, Figure A6 and Figure A7).
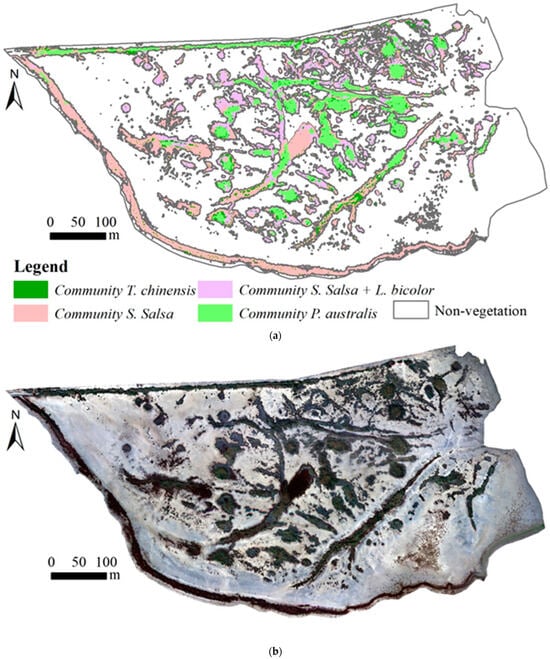
Figure 4.
The vegetation composition and the UAV multispectral orthomosaic imagery of Subarea A. (a) The vegetation composition; (b) the UAV multispectral orthomosaic RGB true color composite imagery.
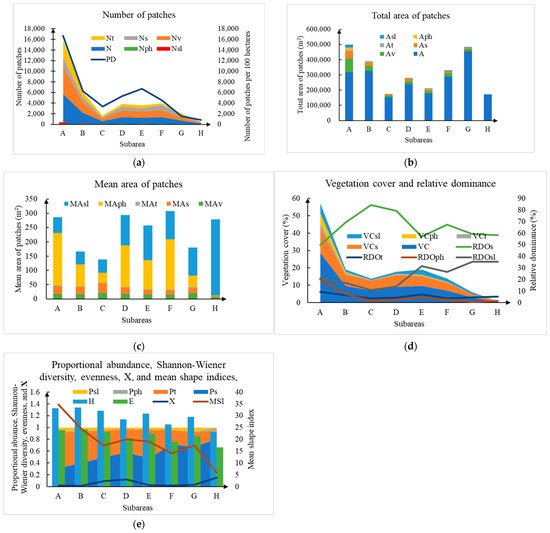
Figure 5.
Statistics on vegetation composition and structure across mudflat areas from Subarea A to Subarea H. (a) Number of patches (N), number of vegetation patches (Nv), number of community S. Salsa (Ns), number of community T. chinensis (Nt), number of community P. australis (Nph), number of community S. Salsa + community L. bicolor (Nsl), and number of vegetation patches per 100 hectares (PD); (b) Total area of patches (A), total area of vegetation patches (Av), total area of community S. Salsa (As), total area of community T. chinensis (At), total area of community P. australis (Aph), and total area of community S. Salsa + community L. bicolor (Asl); (c) Mean area of vegetation patches (MAv),mean area of community S. Salsa (MAs), mean area of community T. chinensis (MAt), mean area of community P. australis (MAph), and mean area of community S. Salsa + community L. bicolor (MAsl); (d) Vegetation cover (VC), vegetation cover of community S. Salsa (VCs), vegetation cover of community T. chinensis (VCt), vegetation cover of community P. australis (VCph), vegetation cover of community S. Salsa + community L. bicolor (VCsl), relative dominance of community S. Salsa (RDOs), relative dominance of community T. chinensis (RDOt), relative dominance of community P. australis (RDOph), and relative dominance of community S. Salsa + community L. bicolor (RDOsl); (e) The proportional abundance of community S. Salsa (Ps), proportional abundance of community T. chinensis (Pt), proportional abundance of community P. australis (Pph), proportional abundance of community S. Salsa + community L. bicolor Psl), Shannon-Wiener diversity index (H), Evenness index (E), an ecological variable (), and mean shape index (MSI).
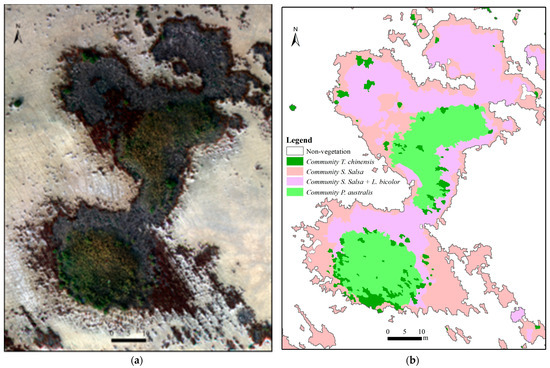
Figure 6.
The compositions and ring structures of individual vegetation patches in Subarea A. (a) The UAV multispectral orthomosaic RGB true color composite imagery; (b) the vegetation composition.
Regardless of differences in the number and size of vegetation patches, community S. salsa, community S. salsa + L. bicolor, community T. chinensis, and community P. australis were detected in all eight subareas. Along the tidal flats from land to sea, from Subarea A to Subarea H, a decreasing trend was presented in terms of the number of vegetation patches per hundred hectares from 16,688/100 ha to 857/100 ha, vegetation cover from 28.6% to 0.4%, Shannon–Wiener diversity index from 1.33 to 0.92, evenness index from 0.96 to 0.66, and mean shape index from 34.8 to 5.8 (Figure 5).
The vegetation communities with the highest relative dominance values in the study area were community S. salsa (greater than 50%) and community S. salsa + L. bicolor (greater than 11%), whereas the vegetation communities with the highest proportional abundance values were community S. salsa (greater than 0.31) and community T. chinensis (greater than 0.14).
3.3. Differences in Vegetation Composition and Structure between the Different Subareas
A significant difference (p < 0.05) was observed in terms of the number of vegetation patches, the number of community T. chinensis, vegetation cover, vegetation cover of community S. salsa, vegetation cover of community T. chinensis, vegetation cover of community P. australis, the number of vegetation patches per hundred hectares, area of vegetation patches, area of community S. salsa, area of community T. chinensis, area of community P. australis, mean area of community S. salsa, relative dominance of community P. australis, proportional abundance of community S. salsa, proportional abundance of community T. chinensis, Shannon–Wiener diversity index, evenness index, and the mean shape index.
Subareas A and B, which were farther from the northern shoreline, had a greater number of community T. chinensis, mean area of community S. salsa, and relative dominance of community P. australis than other subareas closer to the northern shoreline (Figure 5a–c). Subarea A had about 55, 117, and 954 times more vegetation cover of community S. salsa, community T. chinensis, and community P. australis than Subarea H, respectively (Figure 5d). The species with highest proportional abundance values in Subarea A was T. chinensis (0.60), whereas in Subarea H, it was community S. salsa (0.80), as shown in Figure 5e. The value of the Shannon–Wiener diversity index, the evenness index, and the mean shape index were greatest in Subarea A (Figure 5e), which showed that the values of vegetation diversity, evenness, and mean shape measure decreased with distance to the sea.
4. Discussion
Coastal zones are estimated to provide more than half of all global goods and services [74]. Mudflats are an important component of coastal zones, and the vegetation that grow there have a significant role in dissipating waves and resisting erosion, promoting sediment and land formation, improving ecology, and beautifying the environment [75]. Mudflats are subject to multiple influences from the ocean, land, rivers, climate, and human activities, and the strong water–salt exchange process means they have special soil–water–salt heterogeneity, which becomes the most significant factor influencing the construction, composition, structure, and function of vegetation communities. At the same time, variations in vegetation composition and structure are significant signals of the succession of mudflat ecosystems and have important indicative roles in mudflat ecosystem degradation.
4.1. Vegetation Classification
The UAV multispectral orthomosaics with a GSD of 10 cm were classified into five types using the OEFE with support vector machine approach. Although the OA achieved 95.0%, the low PA values of the community S. salsa (60.9%) and community T. chinensis (67.6%) indicated that higher spatial and spectral resolution UAV multispectral or hyperspectral data need to be applied to improve the classification accuracy of vegetation composition while considering cost-effectiveness in the future. In addition, due to the differences in canopy height among the four vegetation communities, high-resolution UAV laser radar data can be considered to assist in improving the accuracy of vegetation composition and structure identification.
4.2. Vegetation Composition
The dominant vegetation communities detected were S. salsa, S. salsa + L. bicolor, T. chinensis, and P. australis. Our results coincided with previous research in the YRD, China [38,44,49,51,52,55]. The predominance of the detected communities was typical of wetland ecosystems in the YRD [31,35,54], which had already been proven by vegetation predictive models [33,56], as these communities were adjusted to the shallow and highly mineralized groundwater, soil salinization, high aridity index, and tidal encroachment and retreat in the study area [33,41,42,56].
The vegetation community diversity, evenness, and proportional abundance were related with changes in the distance to the sea. Subarea H, closest to the sea, had the lowest diversity and evenness due to greater vulnerability to tidal wave and stronger soil salinization. The species with highest proportional abundance values in Subarea H was S. salsa (0.80), a pioneer species in mudflats due to its strong salt tolerance [33,56]. Away from the sea, the communities S. salsa at some places were gradually replaced by community S. salsa + L. bicolor, community T. chinensis, and community P. australis as soil salinity decreased; thus, the vegetation community diversity and evenness increased.
Although a significant difference (p < 0.05) was found in terms of the Shannon–Wiener diversity index and evenness index among the eight subareas, four dominant vegetation communities were discovered at all eight subareas (Figure 4, Figure A1, Figure A2, Figure A3, Figure A4, Figure A5, Figure A6 and Figure A7). This finding indicated that vegetation composition was influenced by both the regional environment, where the influences of soil salinity and tidal water gradually decreased from land to sea, and the localized environment controlled by micro-site factors. The localized environment (microtopography) had a greater influence on the composition of individual vegetation patches (Figure 6), indicating that the diversity of vegetation patches could be increased by changing the local microtopography. From the perspective of vegetation restoration and conservation, it would be an interesting way to enhance the vegetation diversity of the mudflats. The areas with high vegetation diversity may be more susceptible to changes in environmental conditions [7], and attention should be paid to strengthening protection.
4.3. Vegetation Structure
Vegetation cover is the measure of vegetation structures that varied quickly due to variation in soil salinity from land to sea. In the Yellow River estuary region, the vegetation pattern was striped, expanding landward from mudflats, community S. salsa, community T. chinensis, and eventually to community P. australis, influenced by soil salinization degrees and underground water levels [33,44,56], which was consistent with changes in vegetation cover of community S. salsa, community T. chinensis, and community P. australis from Subarea H to Subarea A. The vegetation cover value detected in Subarea A was lower than that detected in a similar area [55]. This difference could be attributed to the severity of tidal wave and micro-site features (e.g., soil physicochemical properties and groundwater levels).
The vegetation cover value in the study area was lower than 28.6%, and the values were smaller, which was consistent with results found in a semi-arid area in southern Spain [12]. These findings showed that vegetation patches were small, and contact between different vegetation patches was not likely in the study area, which indicated that at this phase, a possible way to increase vegetation cover in the study area was to increase the number of vegetation patches.
4.4. Vegetation Pattern
A mean shape index value of 1 indicated that all vegetation patches were circular in shape, whereas a large mean shape index value indicated that the vegetation patches were morphologically far from circles. Along the tidal flats from land to sea, the mean shape index values decreased from 34.8 to 5.8. This could be interpreted as due to the regional environment and micro-site features (e.g., soil physicochemical properties, and groundwater levels). On the east and west sides of the study area, there is a drainage ditch that enters the sea on each side and connects to a tidal creek in the center. As a result, vegetation is less distributed in the areas on both sides of the drainage ditch and the tidal creek (Figure 3 and Figure 4). The area of dried tidal creeks and ditches without water was about 31.7% of the total area of Subarea A, followed by 17.8% of Subarea B, 14.5% of Subarea C, 14.0% of Subarea D, and 7.8% of Subarea F, values which were consistent with changes in vegetation cover from Subarea A to Subarea H. In Subarea A, tidal water was mostly blocked due to wind power generation and road construction, and the remaining dried tidal creek provided the microtopographic conditions for the development of vegetation patches, which were striped in shape (Figure 3 and Figure 4). In Subarea H, there were few remaining dried tidal creeks, and the vegetation patches were formed only in the areas affected by the local microtopography, which were circular in shape (Figure A7). The mean shape index values in the study areas were much greater than those in similar area, ranging from 1.09 to 1.26, where vegetation patches were ring-structured [76]. This difference could be attributed to the remaining dried tidal creeks and ditches without water and greater soil–water–salt environmental heterogeneity due to the microtopography in the study area.
Individual vegetation patches in the study area often showed a ring-like structure, which was mostly circular or striped in shape (Figure 6, Figure A1, Figure A2, Figure A3, Figure A4, Figure A5, Figure A6 and Figure A7) and was consistent with those found in similar areas in the YRD, China [55,77]. In the slow-flat and low areas of the YRD, a difference of several meters in horizontal distance and only a few centimeters to a dozen centimeters in elevation can form a distinctly different water–salt environment, which in turn affects the spatial distribution and growth and development of plant communities [78]. The striped vegetation patches were often found near tidal creeks, the remaining dried tidal creeks, and ditches without water. The formation processes and mechanisms of vegetation patches with a ring-like structure could be explained by the water–salt thresholds of S. salsa, L. bicolor, T. chinensis, and P. australis and the micro-site features such as soil physicochemical properties, groundwater levels, and microtopography [78,79].
The findings of this study contribute to increasing our understanding of variations in vegetation composition and structure across mudflat areas and help us to comprehend the relevance between vegetation pattern and regional environment and micro-site features in the YRD. However, because soil salinity and groundwater levels could not be surveyed in this study, the relationships between vegetation community and soil characteristics could not be captured quantitatively. In addition, there were the low PA values of the community S. salsa, and T. chinensis. These aspects should be examined in future.
5. Conclusions
This study provided an UAV multispectral orthomosaic with a GSD of 10 cm to classify and compare the vegetation composition and structure across mudflat areas in the YRD, China. Comparative quantification of vegetation composition and structure will be invaluable to understanding the relationship between vegetation pattern and local environment and micro-sites factors in the YRD. The regional environment and local microtopography were the predominant forces for vegetation composition and structure across mudflat areas. From the perspective of vegetation restoration and conservation, changing the local microtopography will be an interesting way to enhance the vegetation diversity of the mudflats.
Author Contributions
Conceptualization, Q.L. and X.Z.; methodology, Q.L., H.L., C.H. and S.W.; validation, Q.L. and L.S.; investigation, Q.L., S.W. and W.W.; writing—original draft preparation, Q.L.; writing—review and editing, Q.L., H.L., C.H. and X.Z.; funding acquisition, Q.L. and X.Z.; All authors have read and agreed to the published version of the manuscript.
Funding
This research was funded by the Open Foundation of the Key Laboratory of Natural Resource Coupling Process and Effects, grant number 2023KFKTB003; the National Key Research and Development Program of China, grant number 2021YFB3901305; the QILU RESEARCH INSTITUTE, grant number QLZB76-2023-000059.
Data Availability Statement
Data is unavailable due to privacy or ethical restrictions.
Conflicts of Interest
The authors declare no conflicts of interest.
Appendix A. The Vegetation Composition of the Seven Subareas in the Study Area
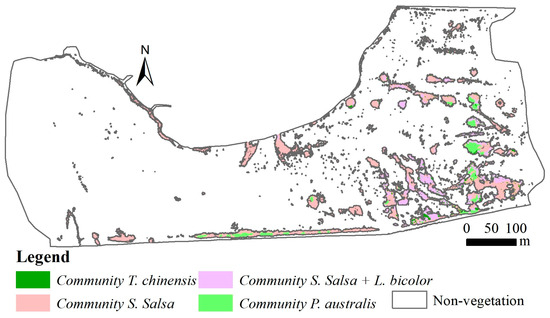
Figure A1.
The vegetation composition of Subarea B.
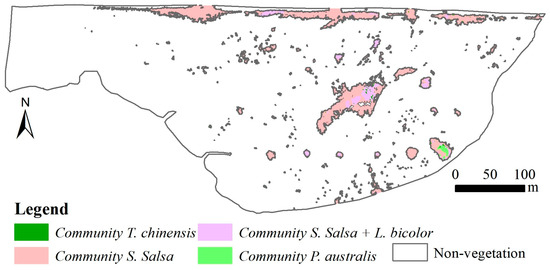
Figure A2.
The vegetation composition of Subarea C.
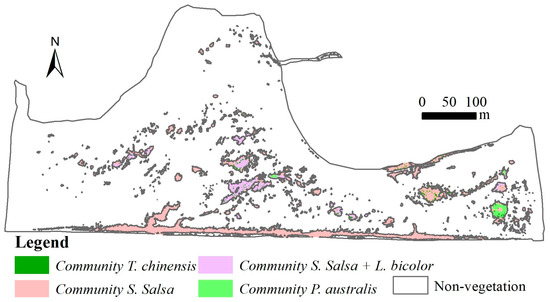
Figure A3.
The vegetation composition of Subarea D.
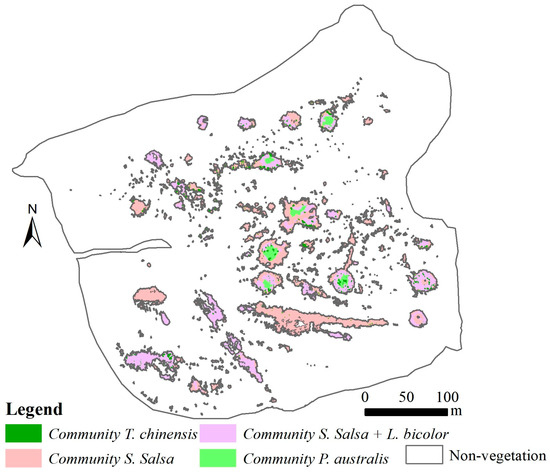
Figure A4.
The vegetation composition of Subarea E.
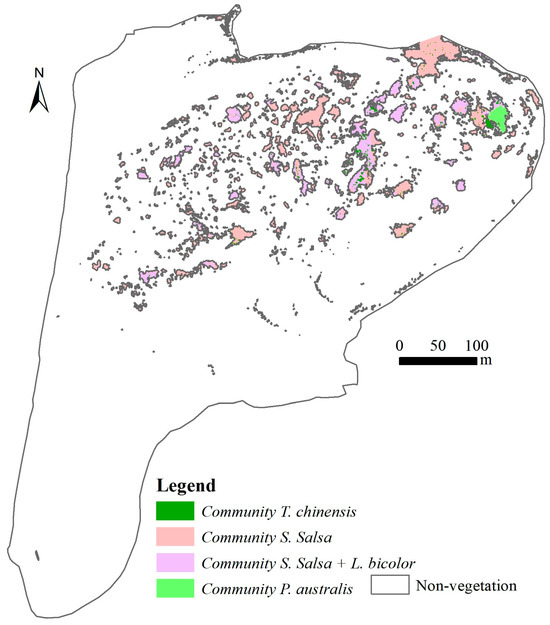
Figure A5.
The vegetation composition of Subarea F.
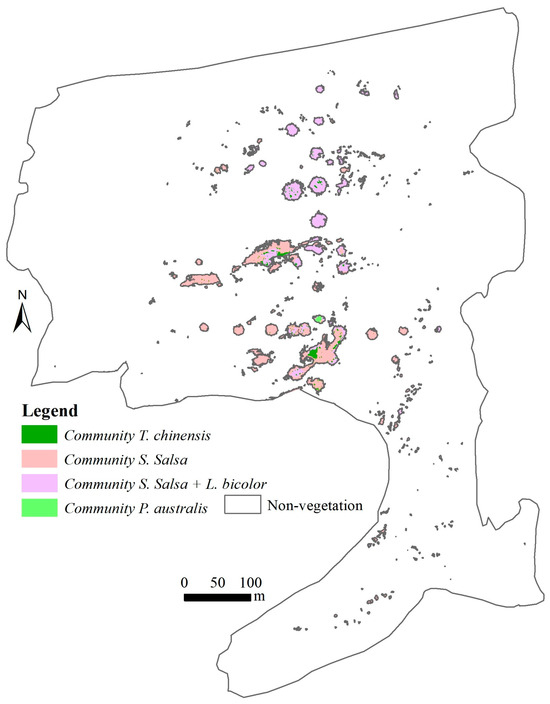
Figure A6.
The vegetation composition of Subarea G.
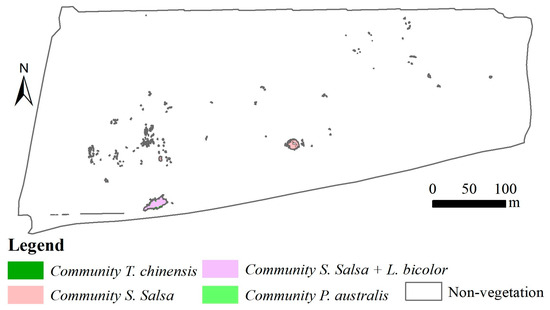
Figure A7.
The vegetation composition of Subarea H.
References
- Middleton, S.L. Automating image segmentation for vegetation monitoring. Nat. Rev. Earth Environ. 2023, 4, 807. [Google Scholar] [CrossRef]
- Bordeu, I.; Clerc, M.G.; Couteron, P.; Lefever, R.; Tlidi, M. Self-replication of localized vegetation patches in scarce environments. Sci. Rep. 2016, 6, 33703. [Google Scholar] [CrossRef] [PubMed]
- Berdugo, M.; Kefi, S.; Soliveres, S.; Maestre, F.T. Plant spatial patterns identify alternative ecosystem multifunctionality states in global drylands. Nat. Ecol. Evol. 2017, 1, 3. [Google Scholar] [CrossRef] [PubMed]
- Gandhi, P.; Iams, S.; Bonetti, S.; Silber, M. Vegetation Pattern Formation in Drylands. In Dryland Ecohydrology, 2nd ed.; D’Odoorico, P., Porporato, A., Runyan, C.W., Eds.; Springer Nature Switzerland AG: Cham, Switzerland, 2019; pp. 469–509. [Google Scholar]
- Pringle, R.M.; Tarnita, C.E. Spatial self-organization of ecosystems: Integrating multiple mechanisms of regular-pattern formation. Annu. Rev. Entomol. 2017, 62, 359–377. [Google Scholar] [CrossRef]
- Meron, E. Vegetation pattern formation: The mechanisms behind the forms. Phys. Today 2019, 72, 30–36. [Google Scholar] [CrossRef]
- Elmqvist, T.; Folke, C.; Nystrom, M.; Peterson, G.; Bengtsson, J.; Walker, B.; Norberg, J. Response diversity, ecosystem change, and resilience. Front. Ecol. Environ. 2003, 1, 488–494. [Google Scholar] [CrossRef]
- Ruiz-Jaen, M.C.; Aide, T.M. Vegetation structure, species diversity, and ecosystem processes as measures of restoration success. For. Ecol. Manag. 2005, 218, 159–173. [Google Scholar] [CrossRef]
- Bautista, S.; Mayor, A.G.; Bourakhouadar, J.; Bellot, J. Plant spatial pattern predicts hillslope runoff and erosion in a semiarid Mediterranean landscape. Ecosystems 2007, 10, 987–998. [Google Scholar] [CrossRef]
- DeMeo, T.E.; Manning, M.M.; Rowland, M.M.; Vojta, C.D.; McKelvey, K.S.; Brewer, C.K.; Kennedy, R.S.H.; Maus, P.A.; Schulz, B.; Westfall, J.A.; et al. Monitoring Vegetation Composition and Structure as Habitat Attributes. In A Technical Guide for Monitoring Wildlife Habitat; Rowland, M.M., Vojta, C.D., Eds.; General Technical Reports WO-89: Washington, DC, USA, 2013; pp. 4-1–4-63. [Google Scholar]
- Gaitan, J.J.; Oliva, G.E.; Bran, D.E.; Maestre, F.T.; Aguiar, M.R.; Jobbagy, E.G.; Nuono, G.G.; Ferrante, D.; Nakamatsu, V.B.; Ciari, G.; et al. Vegetion structure is as important as climate for explaining ecosystem function across Patagonian rangelands. J. Ecol. 2014, 102, 1419–1428. [Google Scholar] [CrossRef]
- Meloni, F.; Nakamura, G.M.; Granzotti, C.R.F.; Martinez, A.S. Vegetation cover reveals the phase diagram of patch patterns in drylands. Phys. A 2019, 534, 122048. [Google Scholar] [CrossRef]
- Kefi, S.; Rietkerk, M.; Alados, C.L.; Pueyo, Y.; Papanastasis, V.P.; Elaich, A.; de Ruiter, P.C. Spatial vegetation patterns and imminent desertification in Mediterranean arid ecosystems. Nature 2007, 449, 213–217. [Google Scholar] [CrossRef]
- Abu Hammad, A.; Tumeizi, A. Land degradation: Socioeconomic and environmental causes and consequences in the eastern Mediterranean. Land. Degrad. Dev. 2012, 23, 216–226. [Google Scholar] [CrossRef]
- Kefi, S.; Guttal, V.; Brock, W.A.; Carpenter, S.R.; Ellison, M.A.; Livina, V.N.; Seekell, D.A.; Scheffer, M.; van Nes, E.H.; Dakos, V. Early warning signals of ecological transitions: Methods for spatial pattern. PLoS ONE 2014, 9, e92097. [Google Scholar] [CrossRef]
- Giriraj, A.; Murthy, M.S.R.; Ramesh, B.R. Vegetation composition, structure and patterns of diversity: A case study from the tropical wet evergreen forests of the western Ghats, India. Edinb. J. Bot. 2008, 65, 447–468. [Google Scholar] [CrossRef]
- Tang, J.; Liang, J.; Yang, Y.; Zhang, S.; Hou, H.; Zhu, X. Revealing the structure and composition of the restored vegetation cover in semi-arid mine dumps based on LiDAR and hyperspectral images. Remote Sens. 2022, 14, 978. [Google Scholar] [CrossRef]
- James, K.; Bradshaw, K. Detecting plant species in the field with deep learning and drone technology. Methods Ecol. Evol. 2020, 11, 1509–1519. [Google Scholar] [CrossRef]
- Taddeo, S.; Dronova, I.; Depsky, N. Spectral vegetation indices of wetland greenness: Response to vegetation structure, composition, and spatial distribution. Remote Sens. Environ. 2019, 234, 111467. [Google Scholar] [CrossRef]
- Mullerova, J.; Gago, X.; Bucas, M.; Company, J.; Estrany, J.; Fortesa, J.; Manfreda, S.; Michez, A.; Mokros, M.; Pauluse, G.; et al. Characterizing vegetation complexity with unmanned aerial systems (UAV)-a framework and synthesis. Ecol. Indic. 2021, 131, 108156. [Google Scholar] [CrossRef]
- Cavender-Bares, J.; Schneider, F.D.; Santos, M.J.; Armstrong, A.; Carnaval, A.; Dahlin, K.M.; Fatoyinbo, L.; Hurtt, G.C.; Schimel, D.; Townsend, P.A.; et al. Integrating remote sensing with ecology and evolution to advance biodiversity conservation. Nat. Ecol. Evol. 2022, 6, 506–519. [Google Scholar] [CrossRef]
- Kolarik, N.E.; Gaughan, A.E.; Stevens, F.R.; Pricope, N.G.; Woodward, K.; Cassidy, L.; Salerno, J.; Hartter, J. A multi-plot assessment of vegetation structure using a micro-unmanned aerial system (UAS) in a semi-arid savanna environment. ISPRS J. Photogramm. Remote Sens. 2020, 164, 84–96. [Google Scholar] [CrossRef]
- Libran-Embid, F.; Klaus, F.; Tscharntke, T.; Grass, I. Unmanned aerial vehicles for biodiversity-friendly agricultural landscapes-a systematic review. Sci. Total Environ. 2020, 732, 139204. [Google Scholar] [CrossRef] [PubMed]
- Anderson, K.; Gaston, K.J. Lightweight unmanned aerial vehicles will revolutionize spatial ecology. Front. Ecol. Environ. 2013, 11, 138–146. [Google Scholar] [CrossRef] [PubMed]
- Nowak, M.M.; Dziob, K.; Bogawski, P. Unmanned aerial vehicles (UAVs) in environmental biology: A review. Eur. J. Ecol. 2018, 4, 56–74. [Google Scholar] [CrossRef]
- Sun, Z.; Wang, X.; Wang, Z.; Yang, L.; Xie, Y.; Huang, Y. UAVs as remote sensing platforms in plant ecology: Review of applications and challenges. J. Plant Ecol. 2021, 14, 1003–1023. [Google Scholar] [CrossRef]
- Robinson, J.M.; Harrison, P.A.; Mavoa, S.; Breed, M.F. Existing and emerging uses of drones in restoration ecology. Methods Ecol. Evol. 2022, 13, 1899–1911. [Google Scholar] [CrossRef]
- Dronova, I.; Kislik, C.; Dinh, Z.; Kelly, M. A review of unoccupied aerial vehicle use in wetland applications: Emerging opportunities in approach, technology, and data. Drones 2021, 5, 45. [Google Scholar] [CrossRef]
- Popp, M.R.; Kalwij, J.M. Consumer-grade UAV imagery facilitates semantic segmentation of species-rich savanna tree layers. Sci. Rep. 2023, 13, 13892. [Google Scholar] [CrossRef]
- Yan, G.; Li, L.; Coy, A.; Mu, X.; Chen, S.; Xie, D.; Zhang, W.; Shen, Q.; Zhou, H. Improving the estimation of fractional vegetation cover from UAV RGB imagery by colour unmixing. ISPRS J. Photogramm. Remote Sens. 2019, 158, 23–34. [Google Scholar] [CrossRef]
- Liu, G.; Drost, H.J. Atlas of the Yellow River Delta, 1st ed.; The Publishing House of Surveying and Mapping: Beijing, China, 1997; pp. 23–34. [Google Scholar]
- Cui, B.; Yang, Q.; Yang, Z.; Zhang, K. Evaluating the ecological performance of wetland restoration in the Yellow River Delta, China. Ecol. Eng. 2009, 35, 1090–1103. [Google Scholar] [CrossRef]
- Fan, X.; Pedroli, B.; Liu, G.; Liu, H.; Song, C.; Shu, L. Potential plant species distribution in the Yellow River Delta under the influence of groundwater level and soil salinity. Ecohydrology 2011, 4, 744–756. [Google Scholar] [CrossRef]
- Wang, H.; Gao, J.; Ren, L.; Kong, Y.; Li, H.; Li, L. Assessment of the red-crowned crane habitat in the Yellow River Delta Nature Reserve, East China. Reg. Environ. Chang. 2013, 13, 115–123. [Google Scholar] [CrossRef]
- Zhang, G.; Wang, R.; Song, B. Plant community succession in modern Yellow River Delta, China. Zhejiang Univ. Sci. B 2007, 8, 540–548. [Google Scholar] [CrossRef] [PubMed]
- Cui, B.; Yang, Q.; Zhang, K.; Zhao, X.; You, Z. Responses of saltcedar (Tamarix chinensis) to water table depth and soil salinity in the Yellow River Delta. Plant Ecol. 2010, 209, 279–290. [Google Scholar] [CrossRef]
- Liu, J.; Rong, Q.; Zhao, Y. Variations in soil nutrients and salinity caused by tamarisk in the coastal wetland of the Laizhou Bay, China. Ecosphere 2017, 8, e01672. [Google Scholar] [CrossRef]
- Zhao, Y.; Hu, X.; Liu, J.; Lu, Z.; Xia, J.; Tian, J. Vegetation pattern in shell ridge island in China’s Yellow River Delta. Front. Earth Sci. 2015, 9, 567–577. [Google Scholar] [CrossRef]
- Yang, W.; Li, X.; Sun, T.; Yang, Z.; Li, M. Habitat heterogeneity affects the efficacy of ecological restoration by freshwater releases in a recovering freshwater coastal wetland in China’s Yellow River Delta. Ecol. Eng. 2017, 104, 1–12. [Google Scholar] [CrossRef]
- Jiao, S.; Zhang, M.; Wang, Y.; Liu, J.; Li, Y. Variation of soil nutrients and particle size under different vegetation types in the Yellow River Delta. Acta Ecol. Sin. 2014, 34, 148–153. [Google Scholar] [CrossRef]
- Liu, S.; Hou, X.; Yang, M.; Cheng, F.; Coxixo, A.; Wu, X.; Zhang, Y. Factors driving the relationships between vegetation and soil properties in the Yellow River Delta, China. Catena 2018, 165, 279–285. [Google Scholar] [CrossRef]
- Liu, Q.; Liu, G.; Huang, C.; Li, H. Soil physicochemical properties associated with quasi-circular vegetation patches in the Yellow River Delta, China. Geoderma 2019, 227, 202–214. [Google Scholar] [CrossRef]
- Liu, Q.; Liu, G.; Huang, C.; Li, H. Variation in soil bulk density and hydraulic conductivity within a quasi-circular vegetation patch and bare soil area. J. Soils Sediments 2020, 20, 2019–2030. [Google Scholar] [CrossRef]
- Fang, H.; Xu, J. Land cover and vegetation change in the Yellow River Delta Nature Reserve analyzed with Landsat thematic mapper data. Geocarto Int. 2000, 15, 43–50. [Google Scholar] [CrossRef]
- Ye, Q.; Liu, G.; Tian, G.; Chen, S.; Huang, C.; Chen, S.; Liu, Q.; Chang, J.; Shi, Y. Geospatial-temporal analysis of land-use changes in the Yellow River Delta during the last 40 years. Sci. China Earth Sci. 2004, 47, 1008–1024. [Google Scholar] [CrossRef]
- Ottinger, M.; Kuenzer, C.; Liu, G.; Wang, S.; Dech, S. Monitoring land cover dynamics in the Yellow River Delta from 1995 to 2010 based on Landsat 5 TM. Appl. Geogr. 2013, 44, 53–68. [Google Scholar] [CrossRef]
- Wei, W.; Zhang, X.; Chen, X.; Tang, J.; Jiang, M. Wetland Mapping Using Subpixel Analysis and Decision Tree Classification in the Yellow River Delta Area. In Proceedings of the International Archives of the Photogrammetry, Remote Sensing and Spatial Information Sciences, Beijing, China, 3–11 July 2008; Volume XXXVII. Part B7. [Google Scholar]
- Huang, L.; Bai, J.; Chen, B.; Zhang, K.; Huang, C.; Liu, P. Two-decade wetland cultivation and its effects on soil properties in the Yellow River Delta, China. Ecol. Inform. 2012, 10, 49–55. [Google Scholar] [CrossRef]
- Song, C.; Liu, G. Application of remote sensing detection and GIS in analysis of vegetation pattern dynamics in the Yellow River Delta. Chin. J. Popul. Resour. Environ. 2008, 6, 62–69. [Google Scholar]
- Yang, M.; Liu, S.; Yang, Z.; Sun, T.; DeGloria, S.D.; Holt, K. Effect on soil properties of conversion of Yellow River Delta ecosystem. Wetlands 2009, 29, 1014–1022. [Google Scholar] [CrossRef]
- Chang, D.; Wang, Z.; Ning, X.; Li, Z.; Zhang, L.; Liu, X. Vegetation changes in Yellow River Delta wetlands from 2018 to 2020 using PIE-Engine and short time series Sentinel-2 images. Front. Mar. Sci. 2022, 9, 977050. [Google Scholar] [CrossRef]
- Jiang, J.; Tian, H.; Fu, P.; Meng, F.; Tong, H. Spatial and temporal changes of typical vegetation in the Yellow River Delta based on Zhuhai-1 hyperspectral data. Appl. Sci. 2023, 13, 12614. [Google Scholar] [CrossRef]
- Liu, Q.; Liu, G.; Huang, C.; Xie, C. Using SPOT 5 fusion-ready imagery to detect Chinese tamarisk (saltcedar) with mathematical morphological method. Int. J. Digit. Earth 2014, 7, 217–228. [Google Scholar] [CrossRef]
- Gong, Z.; Zhang, C.; Zhang, L.; Bai, J.; Zhou, D. Assessing spatiotemporal characteristics of native and invasive species with multi-temporal remote sensing images in the Yellow River Delta, China. Land Degrad. Dev. 2021, 32, 1338–1352. [Google Scholar] [CrossRef]
- Liu, Q.; Huang, C.; Li, H. Mapping plant communities within quasi-circular vegetation patches using tasseled cap brightness, greenness, and topsoil grain size index derived from GF-1 imagery. Earth Sci. Inform. 2021, 14, 975–984. [Google Scholar] [CrossRef]
- Song, C.; Huang, C.; Liu, H. Predictive vegetation mapping approach based on spectral data, DEM and generalized additive models. Chin. Geogra. Sci. 2013, 23, 331–343. [Google Scholar] [CrossRef]
- Wang, W.; Li, X.; Jin, Y.; Sun, T. The impact of multiple seashore reclamation activities on vegetation cover in the Yellow River Delta, China: Implications based on structural equation modeling. J. Coast. Conserv. 2018, 22, 283–292. [Google Scholar]
- Niu, B.; Zhang, Z.; Yu, X.; Li, X.; Wang, Z.; Loaiciga, H.A.; Peng, S. Regime shift of the hydroclimate-vegetation system in the Yellow River Delta of China from 1982 through 2015. Environ. Res. Lett. 2020, 15, 24017. [Google Scholar] [CrossRef]
- Liu, J.; Engel, B.A.; Wang, Y.; Zhang, G.; Zhang, Z.; Zhang, M. Multi-scale analysis of hydrological connectivity and plant response in the Yellow River Delta. Sci. Total Environ. 2020, 702, 134889. [Google Scholar] [CrossRef] [PubMed]
- Wei, S.; Dong, Y.; Qiu, X.; Li, B.; Li, S.; Dong, C. Temporal and spatial analysis of vegetation cover changge in the Yellow River Delta based on Landsat and MODIS time series data. Environ. Monit. Assess. 2023, 195, 1057. [Google Scholar] [CrossRef]
- Niu, B.; Si, B.; Li, D.; Zhao, Y.; Hou, X.; Li, L.; Wang, B.; Song, B.; Zhang, M.; Li, X.; et al. Spatiotemporal variation in driving factors of vegetation dynamics in the Yellow River Delta Estuarine wetlands from 2000 to 2020. Remote Sens. 2023, 15, 4332. [Google Scholar] [CrossRef]
- Li, H.; Wang, P.; Huang, C. Comparison of deep learning methods for detecting and counting sorghum heads in UAV Imagery. Remote Sens. 2022, 14, 3143. [Google Scholar] [CrossRef]
- Gujjarro, M.; Pajares, G.; Riomoros, I.; Herrera, P.J.; Burgos-Artizzu, X.P.; Ribeiro, A. Automatic segmentation of relevant textures in agricultural images. Comput. Electron. Agric. 2011, 75, 75–83. [Google Scholar] [CrossRef]
- Wang, X.; Wang, M.; Wang, S.; Wu, Y. Extraction of vegetation information from visible unmanned aerial vehicle images. Trans. Chin. Soc. Agric. Eng. 2015, 31, 152–159, (In Chinese with English Abstract). [Google Scholar]
- Hamuda, E.; Glavin, M.; Jones, E. A survey of image processing techniques for plant extraction and segmentation in the field. Comput. Electron. Agric. 2016, 125, 184–199. [Google Scholar] [CrossRef]
- Mardanisamani, S.; Eramian, M. Segmentation of vegetation and microplots in aerial agriculture images: A survey. Plant Phenome J. 2022, 5, e20042. [Google Scholar] [CrossRef]
- Turhal, U.C. Vegetation detection using vegetation indices algorithm supported by statistical machine learning. Environ. Monit. Assess. 2022, 194, 826. [Google Scholar] [CrossRef] [PubMed]
- Vegetation Mapping Using Multispectral UAV Images. Available online: https://www.gim-international.com/content/article/vegetation-mapping-using-multispectral-uav-images (accessed on 4 January 2024).
- Xiao, J.; Shen, Y.; Tateishi, R.; Bayaer, W. Development of topsoil grain size index for monitoring desertification in arid land using remote sensing. Int. J. Remote Sens. 2006, 27, 2411–2422. [Google Scholar] [CrossRef]
- Liu, Q.; Huang, C.; Liu, G.; Yu, B. Comparison of CBERS-04, GF-1, and GF-2 satellite panchromatic images for mapping quasi-circular vegetation patches in the Yellow River Delta, China. Sensors 2018, 18, 2733. [Google Scholar] [CrossRef]
- Sanou, L.; Brama, O.; Jonas, K.; Mipro, H.; Adjima, T. Composition, diversity, and structure of woody vegetation along a disturbance gradient in the forest corridor of the Boucle du Mouhoun, Burkina Faso. Plant Ecol. Divers. 2021, 13, 305–317. [Google Scholar] [CrossRef]
- Game, M.; Carrel, J.E.; Hotrabhavandra, T. Patch dynamics of plant succession on abandoned surface coal mines: A case history approach. J. Ecol. 1982, 70, 707. [Google Scholar] [CrossRef]
- Jonckheere, A.R. A distribution-free K-sample test against ordered alternatives. Biometrika 1954, 41, 133–145. [Google Scholar] [CrossRef]
- U.S. Global Change Research Program. Available online: https://www.globalchange.gov/highlights/supporting-sustainability-and-resilience-coastal-zones (accessed on 29 July 2024).
- Zhang, X.; Nepf, H. Wave damping by flexible marsh plants influenced by current. Phys. Rev. Fluids 2021, 6, 100502. [Google Scholar] [CrossRef]
- Shi, L.; Liu, Q.; Huang, C.; Gao, X.; Li, H.; Liu, G. Mapping quasi-circular vegetation patch dynamics in the Yellow River Delta, China, between 1994 and 2016. Ecol. Indic. 2021, 126, 107656. [Google Scholar] [CrossRef]
- Liu, Q.; Huang, C.; Gao, X.; Li, H.; Liu, G. Size distribution of the quasi-circular vegetation patches in the Yellow River Delta, China. Ecol. Inform. 2022, 71, 101807. [Google Scholar] [CrossRef]
- Wu, Z.; Zhao, S.; Zhang, X.; Sun, P.; Wang, L. Studies on interrelation between salt vegetation and soil salinity in the Yellow River Delta. Chin. J. Plant Ecol. 1994, 18, 184–193, (In Chinese with English abstract). [Google Scholar]
- Liu, Q.; Huang, C.; Li, H. Water-salt thresholds of Suaeda Salsa, Tamarix chinensis, and Phragmites australis on the interpretation of formation mechanism of quasi-circular vegetation patches. Chin. J. Ecol. 2023, 42, 2305–2313, (In Chinese with English Abstract). [Google Scholar]
Disclaimer/Publisher’s Note: The statements, opinions and data contained in all publications are solely those of the individual author(s) and contributor(s) and not of MDPI and/or the editor(s). MDPI and/or the editor(s) disclaim responsibility for any injury to people or property resulting from any ideas, methods, instructions or products referred to in the content. |
© 2024 by the authors. Licensee MDPI, Basel, Switzerland. This article is an open access article distributed under the terms and conditions of the Creative Commons Attribution (CC BY) license (https://creativecommons.org/licenses/by/4.0/).