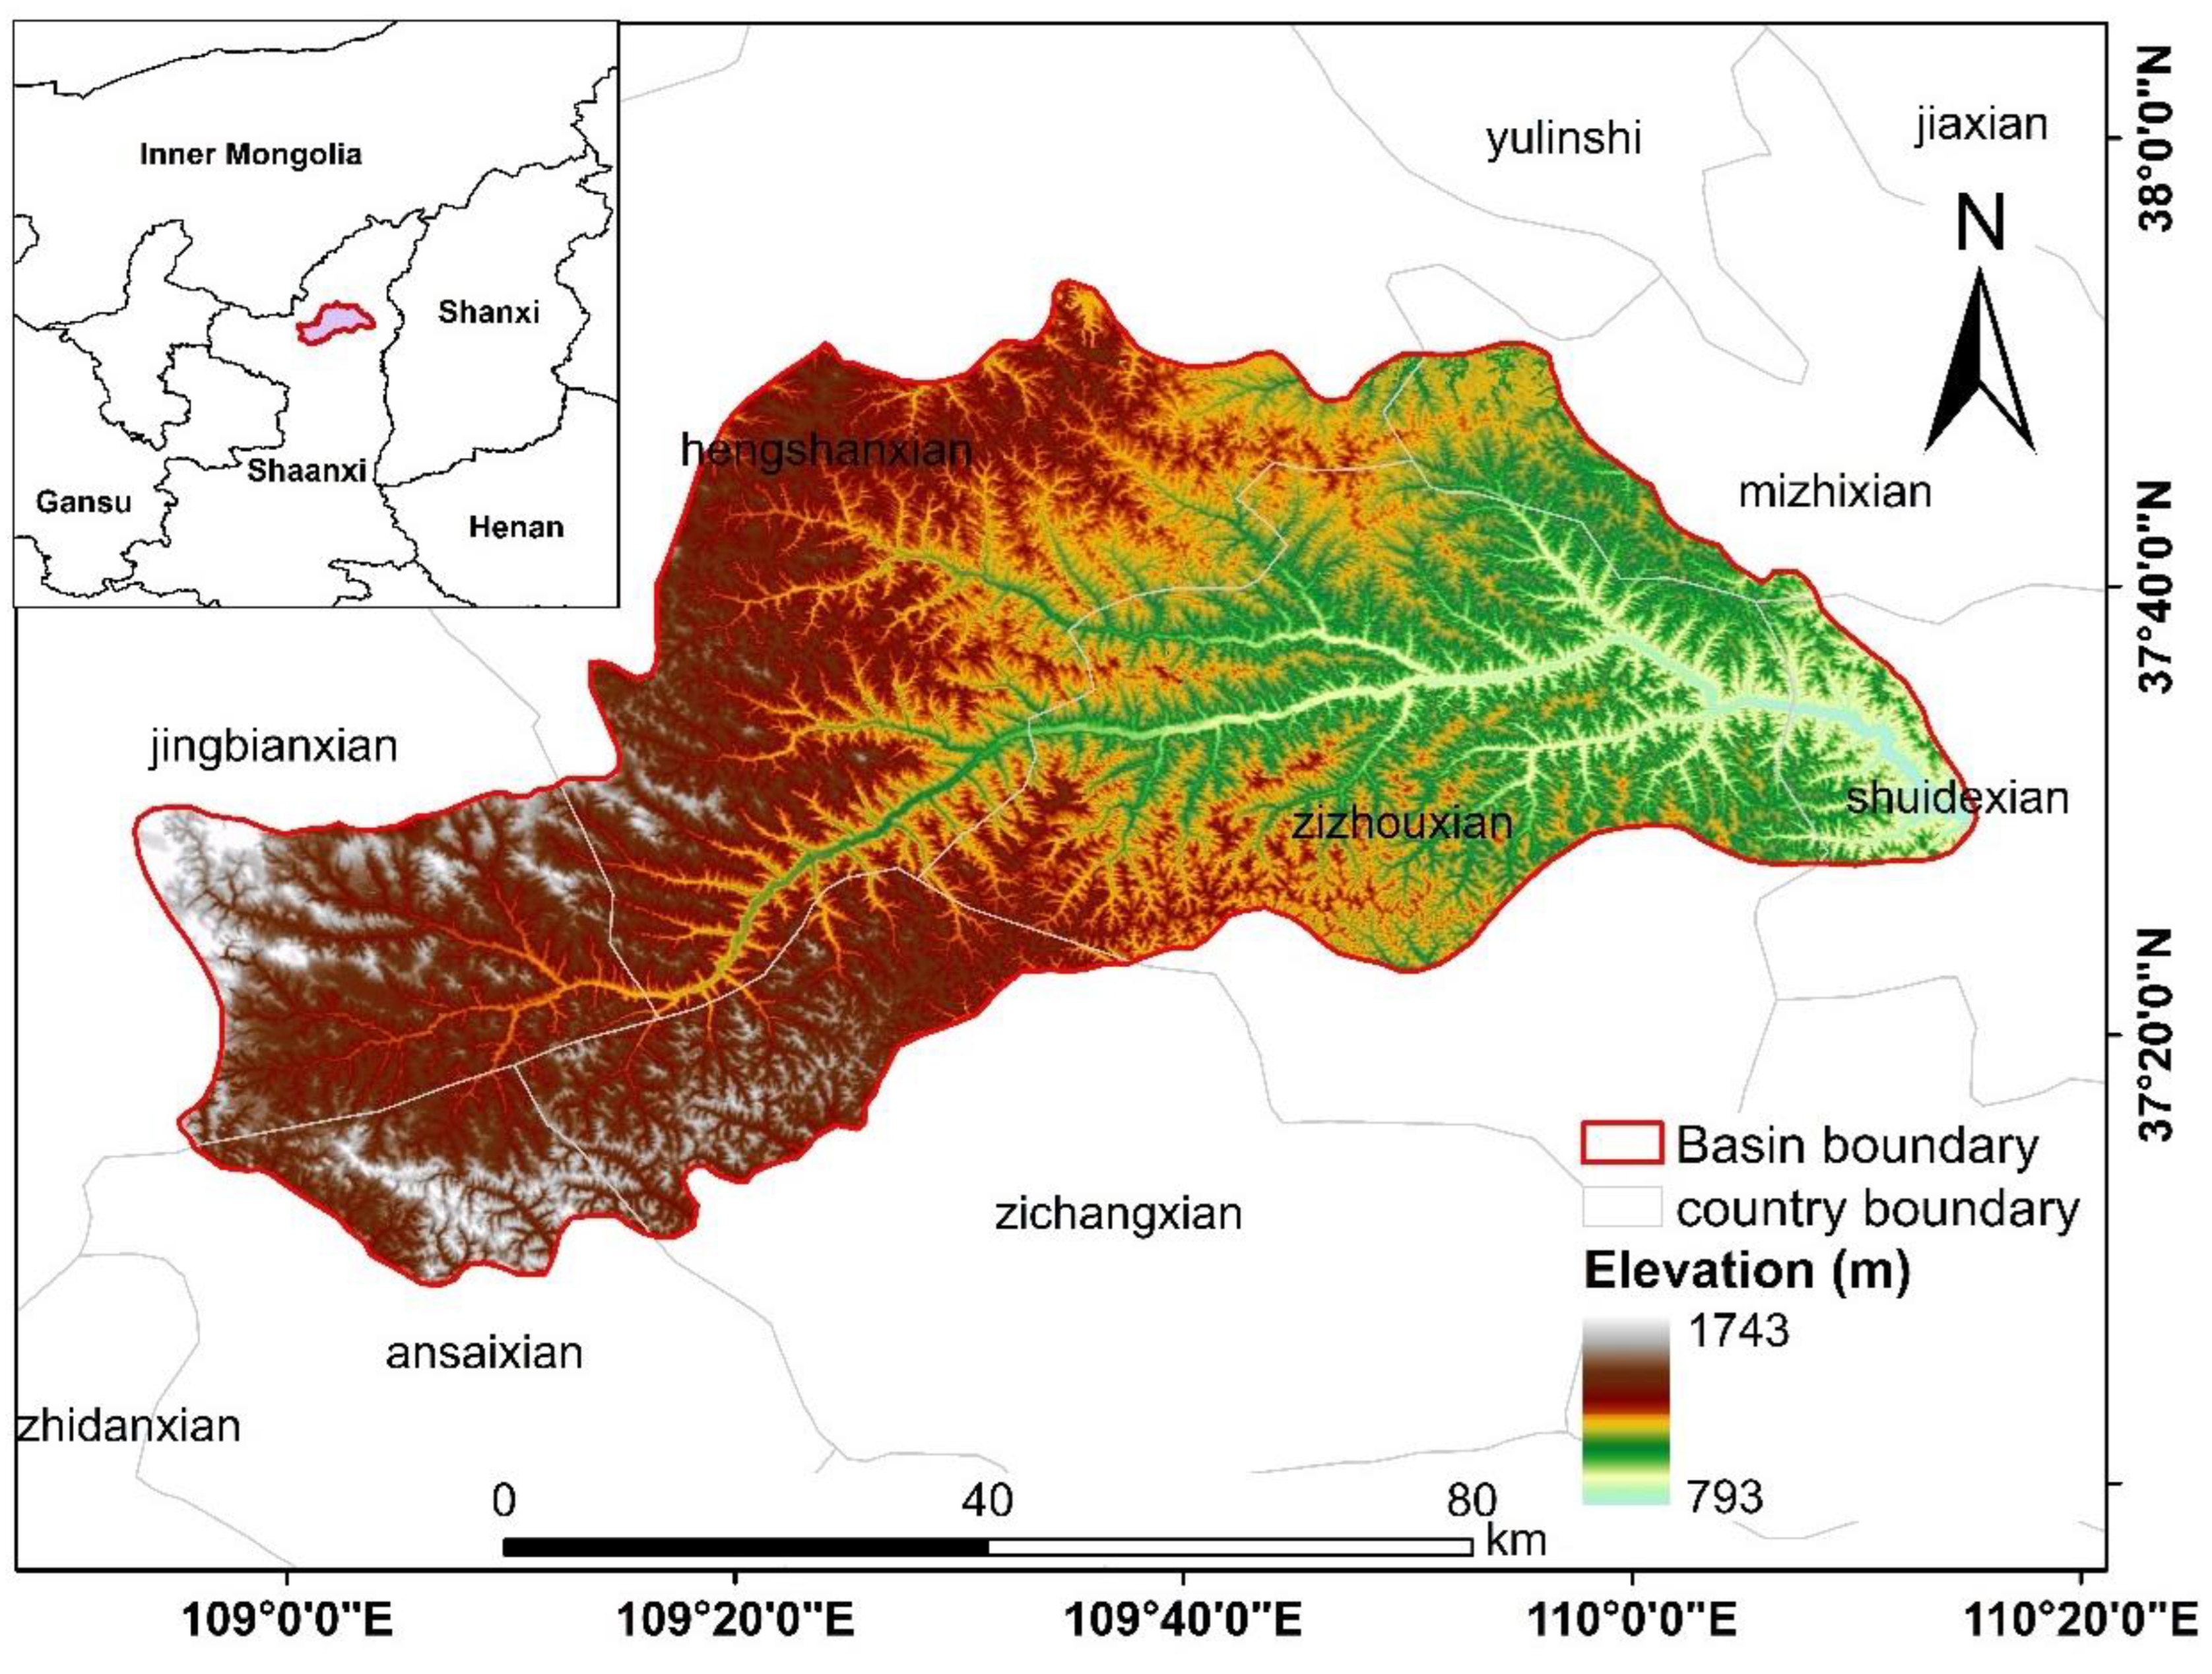
1. Introduction
Soil erosion is a natural event dominated by a diversity of factors including rainfall, surface runoff, ground cover, and land-use [
1,
2]. Soil erosion processes have largely shaped the Earth’s surface and have resulted in a number of environmental problems, ranging from soil degradation to contamination of soils and water bodies, increased flooding, and food production safety issues [
3,
4]. Soil erosion monitoring, assessment, and traceability are critical for regional ecological sustainability and economic development [
5].
The Loess Plateau is the area in China that is most seriously affected by soil erosion and wind-sand, with the ecological environment here having been under serious threat for a long time [
6]. The flow of the Yellow River through the Loess Plateau brings more sediment, leading to serious problems such as the siltation of reservoirs and the elevation of riverbeds downstream. To reduce and contain soil erosion on the Loess Plateau, the Government has conducted a series of eco-construction projects, such as the returning of farmland to forests, terracing projects, and the construction of sand barriers, which have significantly reduced the deterioration of the ecological environment on the Loess Plateau [
7,
8]. However, many soil erosion control projects take the watershed as the control area and base their control on the size of the watershed rather than the severity of the soil erosion risk, which can lead to wasted resources, to some extent, and may prevent high-risk areas from being prioritized for treatment [
9]. Assessment of the soil erosion risk can help to determine the focus of soil erosion control, leading to improved efficiency, optimized allocation of resources, and avoiding wasted manpower and material resources.
The concept of risk first appeared in the economic field, mainly referring to the uncertainty of the impacts of decision-making on future behavior and the consequences that may be caused by changes in objective conditions. It is a description of the possibility or probability of one or more hazardous events occurring in the future within a certain spatio-temporal range and is a measure of uncertainty [
10]. Risk contains two dimensions: the consequence of an event and the probability of that consequence occurring [
11]. This risk measure is the expected consequence of an event. Risk is often defined as the product of consequences and probability, also known as the expected loss, which is the most commonly used form of measurement in risk management [
12].
The history of soil erosion risk research can be traced back to the late 1970s, and the Global Land Degradation Risk Map (GLDRM), compiled by the International Soil Information Center (ISIC) in the course of the implementation of the Global Land Degradation Study (GLDS), is one of the major achievements in this field [
13]. Using topography, precipitation, and land-use data, researchers have mapped the soil erosion risk distribution in the U.K. and France [
14,
15,
16]. Existing methods for soil erosion risk assessment fall into two main categories: experience-based models and process-based models. Each model has its advantages and disadvantages and is suitable for different application scenarios. One of the common methods used in empirical-based models is the factor scoring method; for example, the CORINE model for soil erosion risk assessment in the Mediterranean region proposed by the European Union evaluates the potential erosion risk by scoring factors such as soil, precipitation, and topography, and further evaluates the actual soil erosion risk associated with the land-cover factors [
17]. Furthermore, Nigel and Rughooputh constructed the MauSERM model to consider multiple factors of soil erosion for soil erosion risk assessment in the Mauritius region in India [
18]; Huang et al. used an expert scoring method to assess the soil erosion risk in Southwest China [
19]; and the SEMMED model is another empirical model, which has been used by Jong et al. to analyze the risk of soil erosion in Southwest China [
20]. Process-based models include experimental models (e.g., the Revised Universal Soil Loss Equation, RUSLE) and physical process models. The RUSLE model has been widely used for soil erosion risk assessments; for example, in the central highlands of Kenya [
21]. Furthermore, Dou et al. combined RUSLE and the Modified Wind Erosion Equation (MWE) model to simulate soil erosion risk in Central Asia under the background of global warming [
22].
The existing soil erosion risk studies lack considerations of probability and uncertainty, and their main problem is the direct use of the soil erosion modulus or intensity to replace soil erosion risk, which has difficulty in truly reflecting the actual situation. However, the occurrence of soil erosion is not random, but closely related to the timing and concentration of erosive rainfall [
23]. Probabilistic statistical methods are commonly used in natural hazard risk assessment research, which take into account the randomness of the occurrence of a disaster, to a certain extent. Karimi and Lemaire (2007) have used a purely probabilistic risk analysis method based on fuzzy set theory to assess natural hazard-related risk [
24]. Zhuang et al. (2024), on the other hand, assessed the stability of cut slopes using a logistic regression approach integrating the probability of stability and resilience to reveal long-term degradation characteristics [
25]. To further the existing research on soil erosion risk, which does not fully consider the randomness of soil erosion and cannot truly reflect the problem, this study had the following main objectives: (1) proposing a new method for soil erosion risk assessment that comprehensively considers the consequences of soil erosion and its probability of occurrence; (2) evaluating the temporal and spatial allocation of soil erosion risk in the Dali River Basin and monitoring the associated variability in soil erosion risk; and (3) comparing the proposed method with the conventional assessment method and verifying its effectiveness.
3. Methods
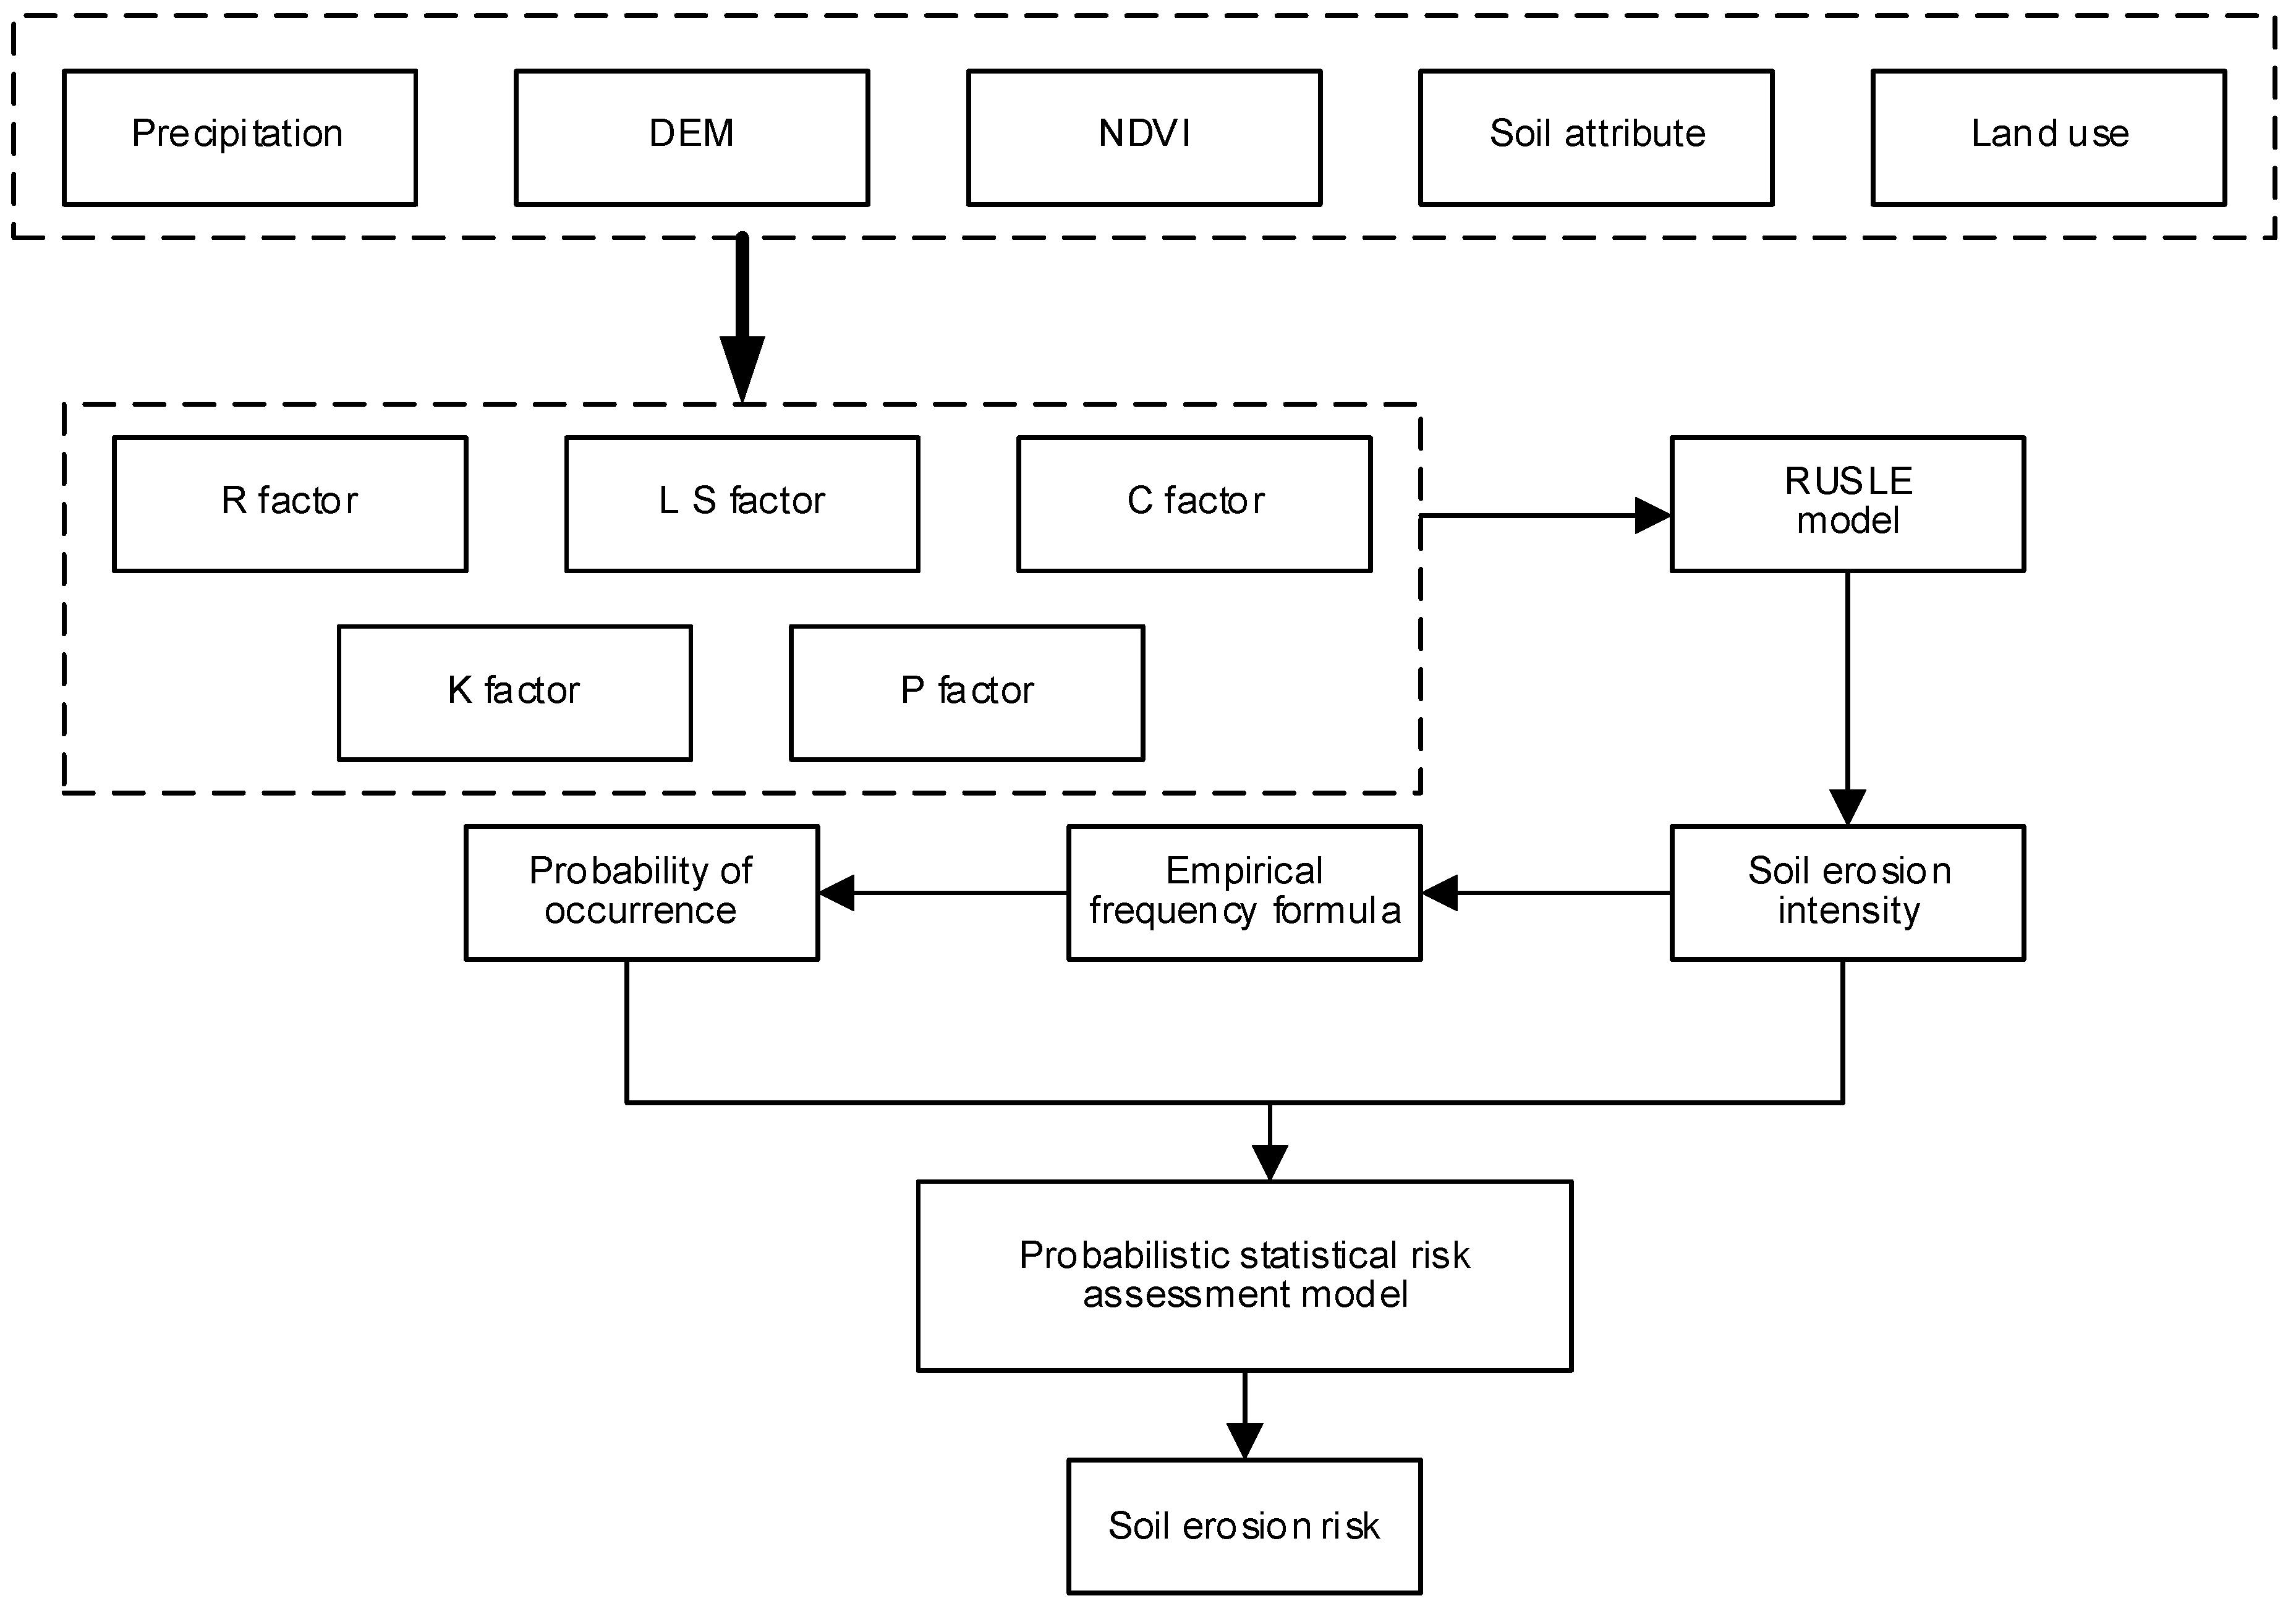
In this research, the probability of occurrence of different soil erosion intensities was calculated using probabilistic statistical methods on the basis of the RUSLE model. In order to evaluate the soil erosion risk of DRB, a soil erosion risk assessment method was developed. The specific technical route is shown in
Figure 2.
3.1. RUSLE Model
Data were calculated and analyzed using the ArcGIS, GEE, and SAGA-GIS platforms, and the grading was carried out in accordance with the grading criteria and Evaluation of Soil Erosion [
32]. The RUSLE model was used to estimate the modulus of soil erosion of the DRB and to analyze the spatial pattern of soil erosion intensity in the DRB. The soil erosion modulus A [t/(hm
2·a)] was obtained using the following calculation [
33].
where
R is the rainfall erosivity factor [MJ·mm/(hm
2·h·a)],
K is the soil erodibility factor [t·h/( MJ·mm)],
LS is the slope length and slope gradient factor,
C is the vegetation cover factor, and
p is the factor for soil conservation and management measures.
3.1.1. Factor R
Rainfall is one of the main drivers of soil erosion, and many relevant studies have characterized rainfall as a feature [
34]. The original approach of the RUSLE model requires high-frequency precipitation data to account for rainfall erosivity [
35]. In the absence of high-temporal-resolution precipitation data, monthly precipitation data can be used to account for rainfall erosivity. The model for estimating rainfall erosive power is as follows [
36]:
where
R is the rainfall erosivity factor, [MJ·mm/(hm
2·ha)],
Pi is the monthly precipitation [mm], and
P is the annual precipitation [mm].
3.1.2. Factor K
K represents the underlying erosion rates for diverse soil subtypes. Soil-specific information can be obtained from the Harmonized World Soil Database (HWSD), co-organized by the Food and Agriculture Organization of the United Nations (FAO) and the International Institute for Applied Systems Analysis (IIASA), which provides soil data from the Nanjing Institute of Soil Research (NISS) at a resolution of 1:1,000,000 [
30]. The dataset was generated using the Second National Soil Census of the Chinese Academy of Sciences (CAS). The soil classification system used was FAO-90. The K factor is calculated using the following formula [
37]:
where
a denotes the percentage of organic content (%) in the soil,
b denotes the soil structure level in the soil classification, and
c denotes the level of the soil profile parameter. The gravelly [
38], silt, and clay soil types are usually taken into account in the value of K. Soil construction and infiltration levels were determined on the basis of the corresponding levels of soil organic content and clay grain content, as shown in
Table 1 and
Table 2.
3.1.3. Factor LS
The slope algorithm has been relatively mature, and can be calculated in ArcGIS using the slope calculation tool; the calculation of the slope length factor is based on the DEM, according to the relationship between the incoming and outgoing water flow, defining the local high point as the starting point of the cumulative calculation of the slope length, and completing the calculation of the cumulative slope length by constantly seeking the end of the runoff point from the high to the low, utilizing the multiple loops and iterative methods [
39,
40]. We refer to the calculation method of (Yang, et al., 2010) [
41]: (1) Calculate the slope and the slope length of each grid. When runoff flows in the east–west or north–south direction, the raster slope length is equal to the size of the raster; when the runoff direction is northeast–southwest and northwest–southeast, the raster slope length is equal to √2 times the size of the raster. (2) The runoff source point is defined as a raster cell where no runoff converges. At the runoff source point, the initial slope length is set to one-half the slope length of the raster. The end point of runoff is defined as the point where the deposition of water occurs and is usually determined by setting a slope cutoff factor. (3) Calculate the cumulative slope length along the direction of runoff, from the runoff source to the runoff terminus. The cumulative slope length is the sum of the slope lengths of the grids.
The calculation of LS values based on slope gradient and cumulative slope length using the steep slope LS algorithm is as follows (4)–(6):
where
L is the slope length factor of the area,
m is the slope length index, and
S is the slope factor of the area.
3.1.4. Factor C
The C factor determines the effect of management practices and planting on soil loss rates. Satellite imagery is widely used to calculate the C factor, following the scaling factor between the C factor and vegetation cover established by Van Der Knijff to calculate C values [
42].
where α and β are the variables controlling the NDVI-C curve,
α = 2 and
β = 1.
3.1.5. Factor p
The
p factor denotes the ratio of soil runoff before and after the implementation of specialized methods; it ranges from 0 to 1, where 0 denotes an area where no soil runoff occurs and 1 denotes an area where no control measures have been implemented. The
p value for each land-use type in the DRB was determined by combining land-use information and referring to other studies [
43,
44]. The specific values are as follows: 1.0 for bare land, 0 for construction, 0.23 for forest, 0.24 for grassland, and 0 for water bodies. The results of soil and water conservancy protection measures for arable land are directly proportional to the slope, and the
p-values are as follows (
Table 3).
3.2. Soil Erosion Risk Assessment Method
Risk is defined based on risk management guidelines [
45] and reflects the effect of uncertainty on an objective, which can be positive, negative, or both. Risk is usually expressed in terms of consequences and their likelihood. The consequence is the result of an event affecting the objective, whereas the likelihood is the chance of the event occurring, usually as a probability or frequency over a given time period.
In accordance with the definition of risk, the amount of soil erosion can be considered as a consequence of one of the factors in the risk assessment and is expressed in terms of the intensity of soil erosion. In addition to determining the consequences of the occurrence of erosion, it is also crucial to determine the probability of the occurrence of the different consequences. In this study, the calculation of the probability of flood occurrence was used to determine the probability of occurrence of soil erosion intensity [
46,
47]:
where
Q represents the probability of occurrence of a particular soil erosion intensity,
n denotes the stage length of the study period, and
m denotes the descending order of soil erosion intensity over a long time-series for the same image, corresponding to the last intensity sequence number that occurred.
With the above definition of soil erosion risk and its measurement, for a given soil erosion consequence, the risk value can be formulated as
where
E refers to the consequence of soil erosion (i.e., the erosion intensity) and
Q is the probability of occurrence of the corresponding intensity.
For a certain regional soil erosion event, different soil erosion intensities may occur; therefore, the final soil erosion risk needs to accumulate the risk values of different consequences:
where
RISK is the regional erosion risk value corresponding to various soil erosion intensities, namely, the probability of occurrence of soil erosion intensities. Finally,
RISK was also normalized to derive an erosion risk score for the area (
Table 4).
The formula was derived on the basis of the multi-year soil erosion modulus calculated in
Section 3.1. Soil erosion intensity was categorized in accordance with the Standard for Classification and Evaluation of Soil Erosion [
32] of the Ministry of Water Resources of China.
3.3. Comparative Analysis Methods
In previous erosion risk evaluation studies, the most frequently used methods include the factor score method [
48] and the entropy value method.
The factor score method is an evaluation method based on expert knowledge. Experts score different factors according to their influence on soil erosion risk, following which the weight of each factor is obtained according to the expert scores, allowing for the calculation of the soil erosion risk.
The entropy method utilizes the message entropy to determine the weights of the evaluation indicators in a multi-indicator context [
49]. The basic principle is that, for a multi-indicator decision-making problem, the selection of the optimal solution from m feasible solutions depends on the decision-making information for each feasible solution, how much deterministic information is provided to the decision maker, and which indicator provides more decision-making information; therefore, the weight value of such an indicator is set to be larger. The weights of the factors are then used to evaluate erosion risk by superimposing the product of their attributes after normalization and homogenization.
The difference between these two methods is that the results of the factor score method are influenced by the subjective preferences of the decision maker, while the entropy method reduces the impact of subjective preferences on the evaluation results, to a certain extent.
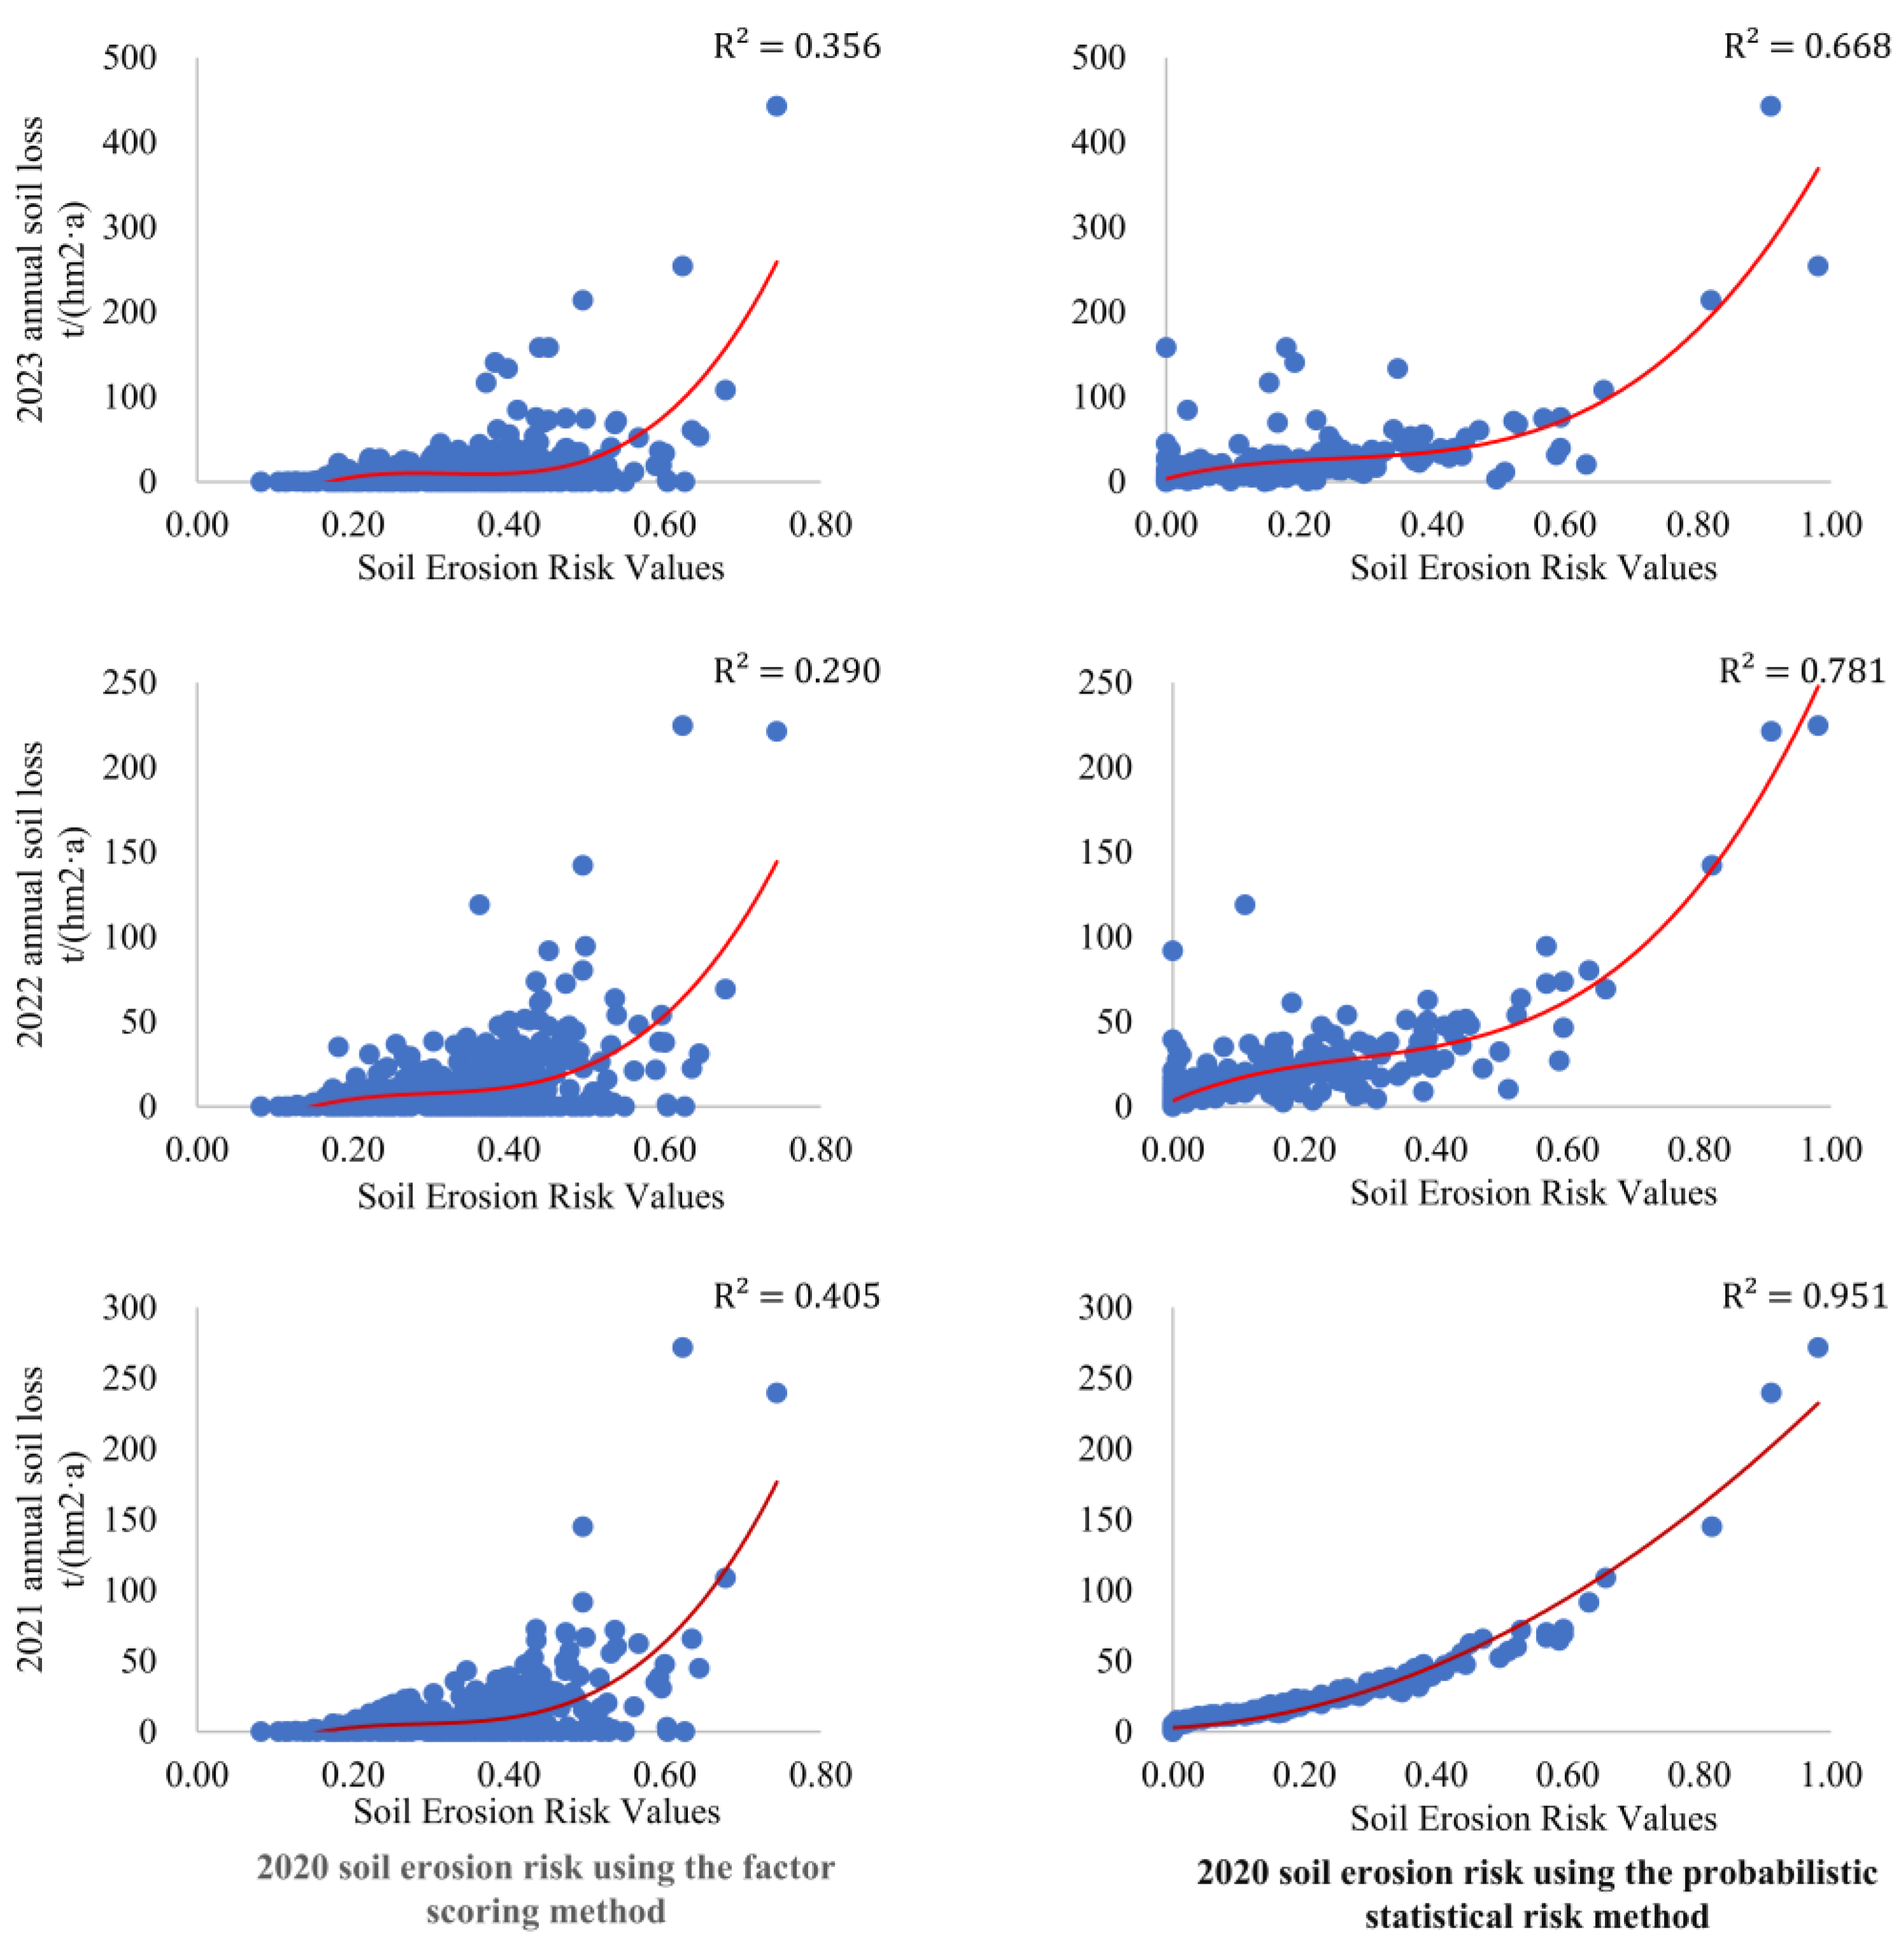
In terms of comparing the accuracy of the proposed soil erosion risk evaluation model with traditional assessment methods, the results obtained with the proposed model were compared with those of traditional assessment methods. In particular, soil erosion moduli were calculated for the DRB for the years 2021, 2022, and 2023 using the RUSLE model. Soil erosion risk values for 2020 calculated using both methods were analyzed via regression analysis, and the coefficient of determination (R2) was used to compare the effectiveness of the two methods.
The R
2 value reflects how closely the regression model fits the observed data and indicates the proportion of the variance of the dependent variable that is accounted for by the regression model. The ratio of R
2 ranges from 0 to 1; if the ratio is closer to 1, it means that the regression pattern fits the data properly. The formula for calculating R
2 is shown below:
where
prey represents the soil erosion modulus for 2021 obtained using soil erosion risk value regression,
y refers to the soil erosion modulus resulting from the use of the RUSLE formula, and
mean represents the mean soil erosion modulus calculated.
3.4. Geodetector
Geodetection is a novel method for detecting the spatial dissimilarity of geographic objects, which can not only quantify the weights of each factor but also help to detect the degree of multi-factor interaction with the dependent variable [
50]. In contrast to traditional statistical analyses, a geodetector can quantitatively identify coupled driving effects between single and multiple factors. Factor detection can be used to detect quantitative spatial differences in the dependent variable Y by means of q-value measurements, as follows:
where h = 1, …, ca is the categorization or partition of parameter Y or variable X; Nh and N are the counts of cells in partition h and the entire region, respectively; and σ
h2 and σ
2 are the variances of the values of Y in partition h and the whole region, respectively. q takes values from 0 to 1, where a higher value of q indicates higher spatial variance in Y.
4. Results
4.1. Spatial Pattern of Soil Erosion Factors
Rainfall erosion coefficients are influenced by precipitation, with more pronounced interannual variation [
51].
Figure 3 demonstrates the spatial pattern of rainfall erosivity factor over two decades in the DRB. In 2015, due to the lower precipitation in this year compared to other years, the R factor was lower and the rainfall erosivity factor was significantly higher than other years. Due to various factors, the variability of the R is more pronounced in different years, and therefore, the effect on soil erosion varies from year to year.
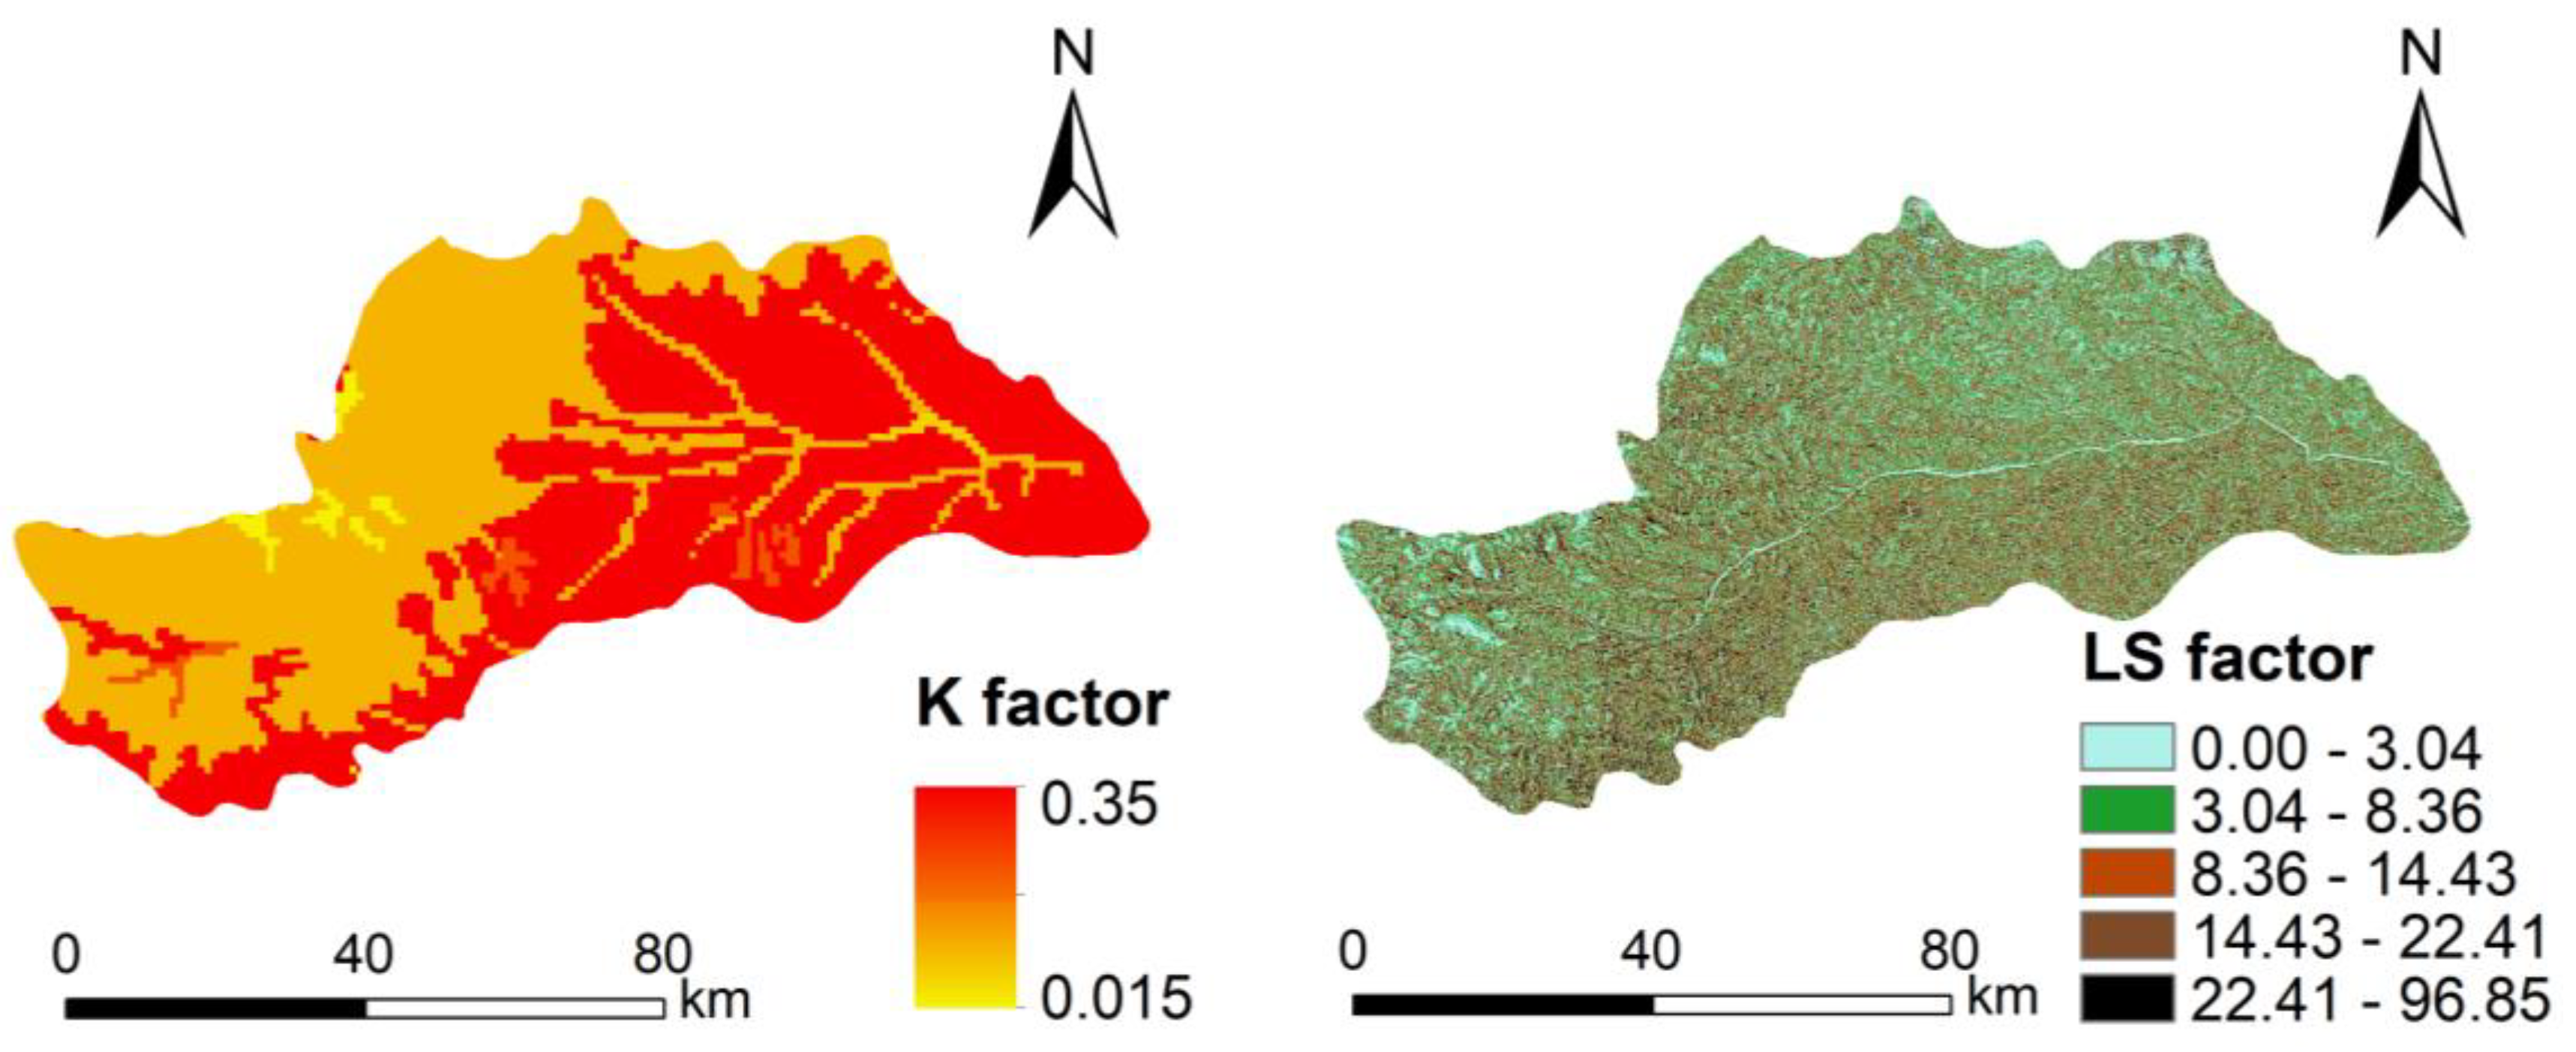
Figure 4 illustrates the distributions of the K and LS factors in the DRB. The high values of the K factor are dispersed in the east and south of the area, with the lowest values of the K factor in the northwestern part, which is largely related to the distribution of different soil types in the DRB. The LS factor is related to the terrain, and high LS factor values are dispersed in areas with high slopes.
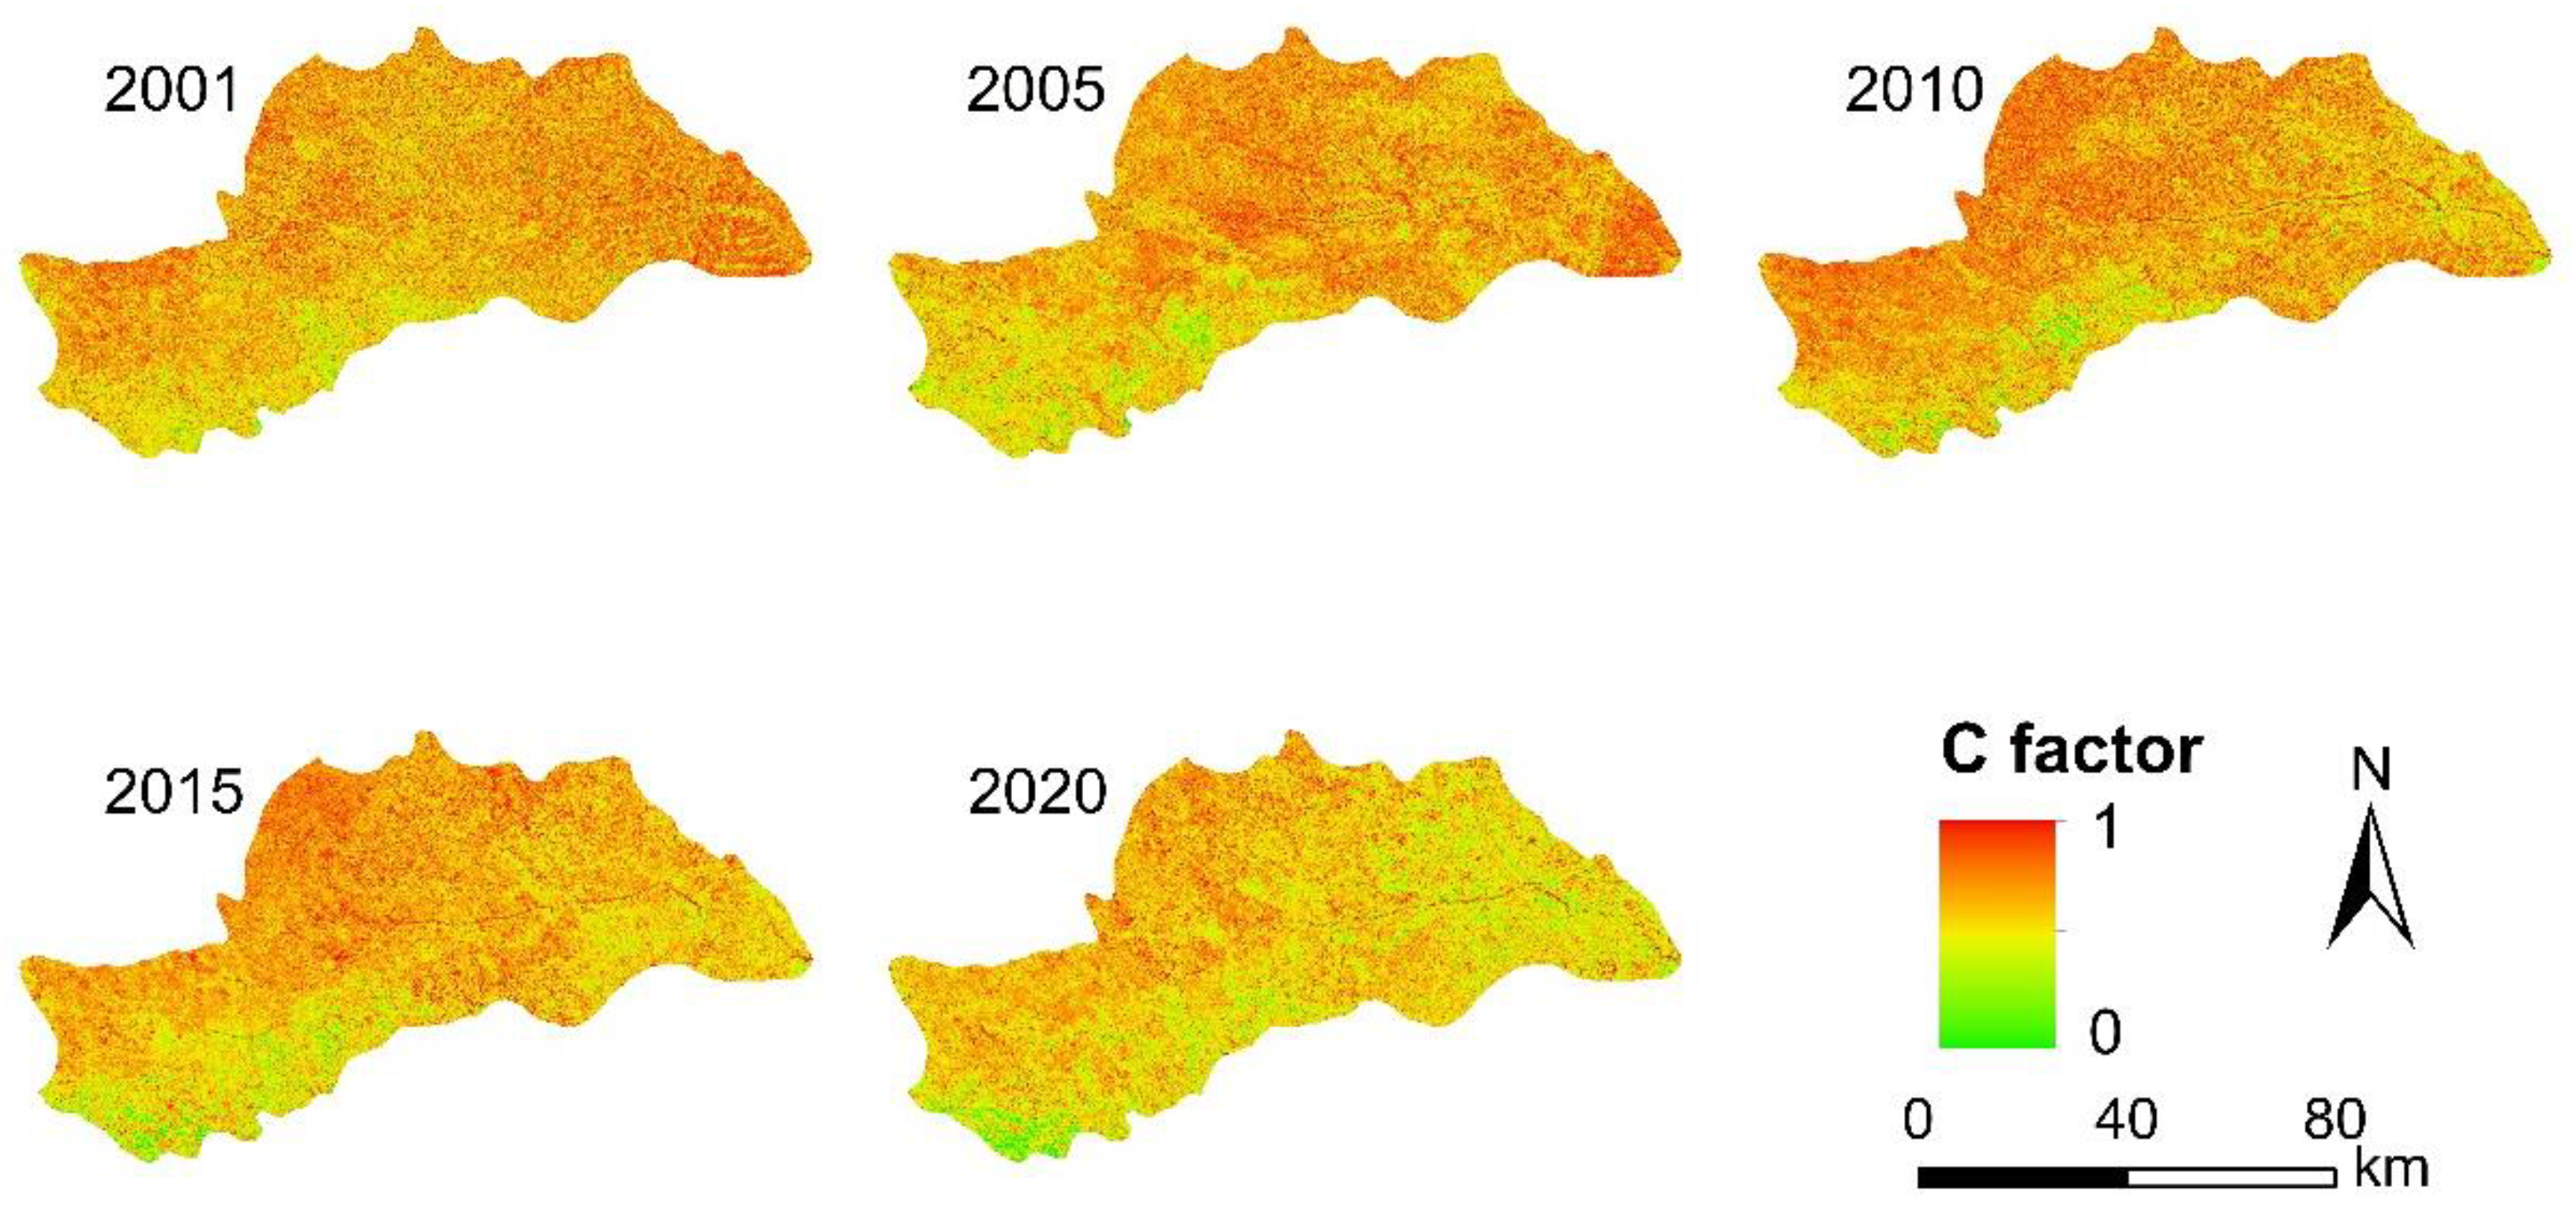
Figure 5 illustrates the spatial distribution of the vegetation cover factor C. In densely vegetated areas, the water storage effect of the plant canopy can reduce soil erosion. Overall, areas with higher C values were clustered in the northern and western regions. The C values in the DRB present a favorable trend, decreasing from an average of 0.85 in 2001 to 0.69 in 2020, which helps to prevent soil erosion.
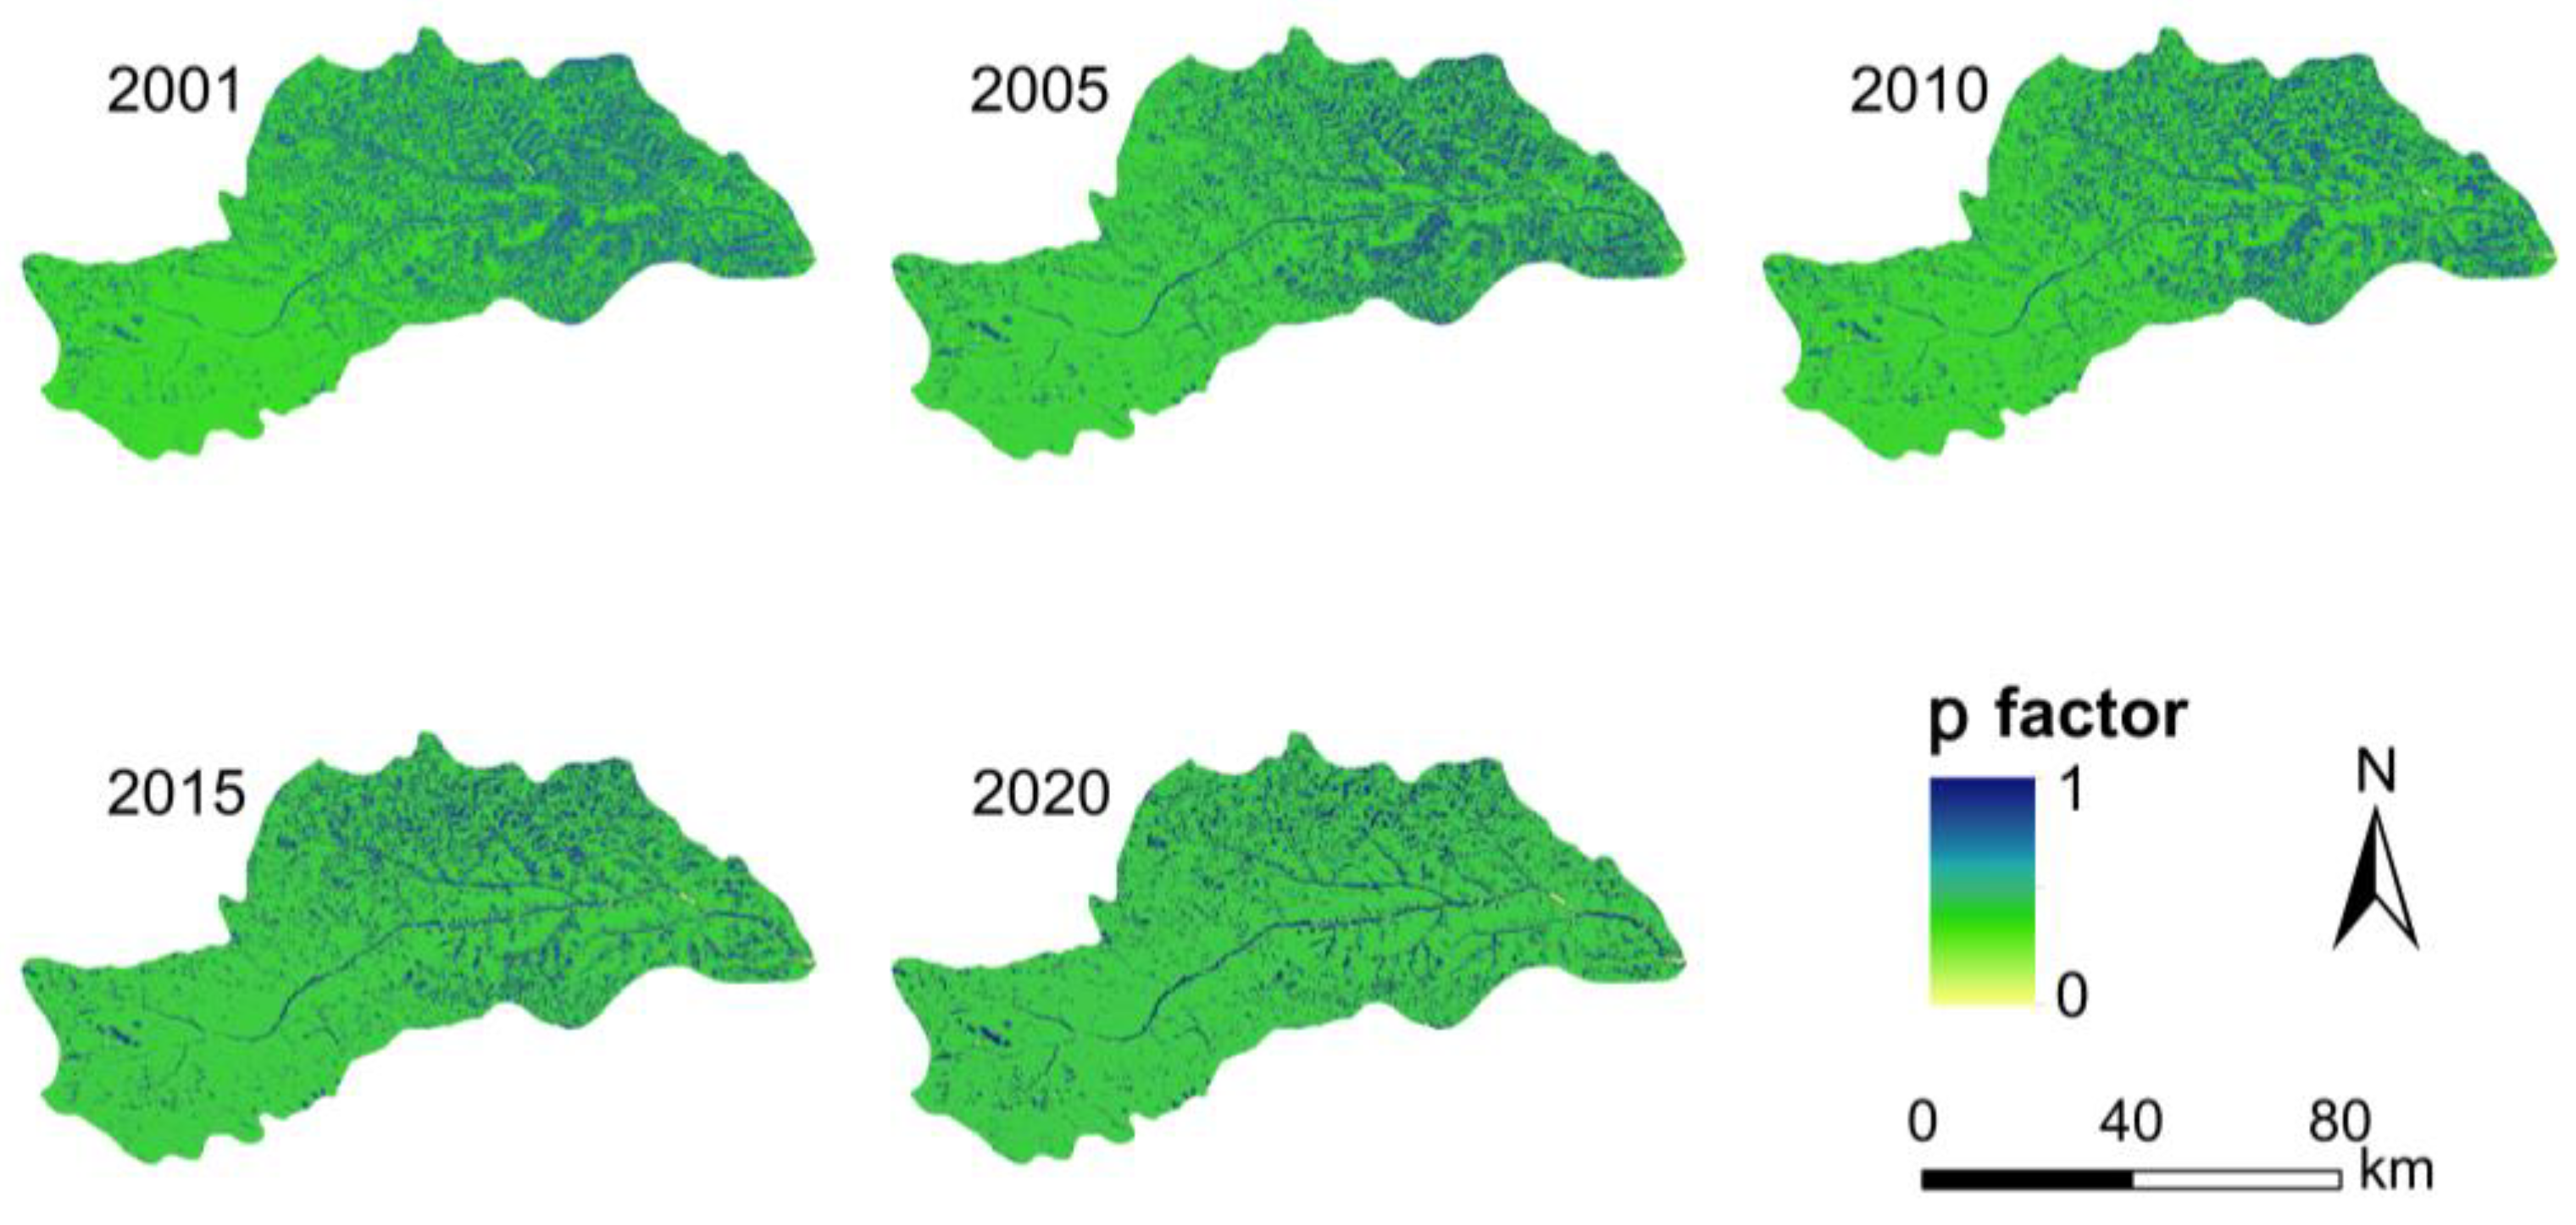
The distribution of the management measure factor
p is shown in
Figure 6. The change in
p is closely correlated with land-use change, and the mean level of
p in the DRB degraded from 0.27 in 2001 to 0.25 in 2020, which indicates that the vegetation condition of the area is changing in a good direction every year and, so, the management measures are effective.
4.2. Spatiotemporal Patterns of Soil Erosion Intensity
The spatial variability of the 20-year average soil erosion modulus estimated using the RUSLE model in the DRB ranged from 0 to 1732.11 t·hm−2·a−1, with a mean value of 34.17 t·hm−2·a−1.
Figure 7 shows a schematic diagram of the average soil erosion strength in the DRB for each five-year period from 2001 to 2020. The RUSLE-estimated severe and very severe soil erosion areas are clustered in the eastern and the southern portions of the DRB, which are predominantly agricultural areas located on slopes and peak locations. In contrast, the predominant type of erosion in the northern and western parts of the DRB is slight and weak erosion. This coincides with the distribution of low soil erodibility K factor values.
Soil erosion strength in the DRB first increased and then decreased. As influenced by precipitation, the five-year average soil erosion model in the DRB increased from 34.21 t·hm−2·a−1 from 2001 to 2005 to 46.37 t·hm−2·a−1 from 2011 to 2015, then decreased to 39.87 t·hm−2·a−1 from 2016 to 2020. The overall soil erosion intensity in the DRB showed an increasing and then decreasing trend. According to the average value of multi-year sand transport modulus of the catchment basin of Baijiachuan Hydrological Station of the Wuding River provided in the Yellow River Sediment Bulletin issued by the Yellow River Conservancy Commission of the Ministry of Water Resources (31.90 t·hm−2·a−1), compared with the soil erosion modulus from 2000 to 2020 computed by the RUSLE model, the result is 7.14% more, which indicates that the soil erosion modulus results computed by using the RUSLE model can be used for the further intensity grading analysis. The results of the soil erosion modulus can be used in the next step of intensity grading analysis.
4.3. Soil Erosion Risk
Figure 8 displays the probability of occurrence of soil erosion at different intensities in the DRB, calculated using Equation (11).
First, in terms of the incidence probability of different soil erosion intensities over a 20-year period, the probability of mild to moderate erosion was higher in the northern and western parts of the DRB. In contrast, the probability of occurrence of a higher than moderate level of erosion was higher in the southern and eastern parts of the DRB.
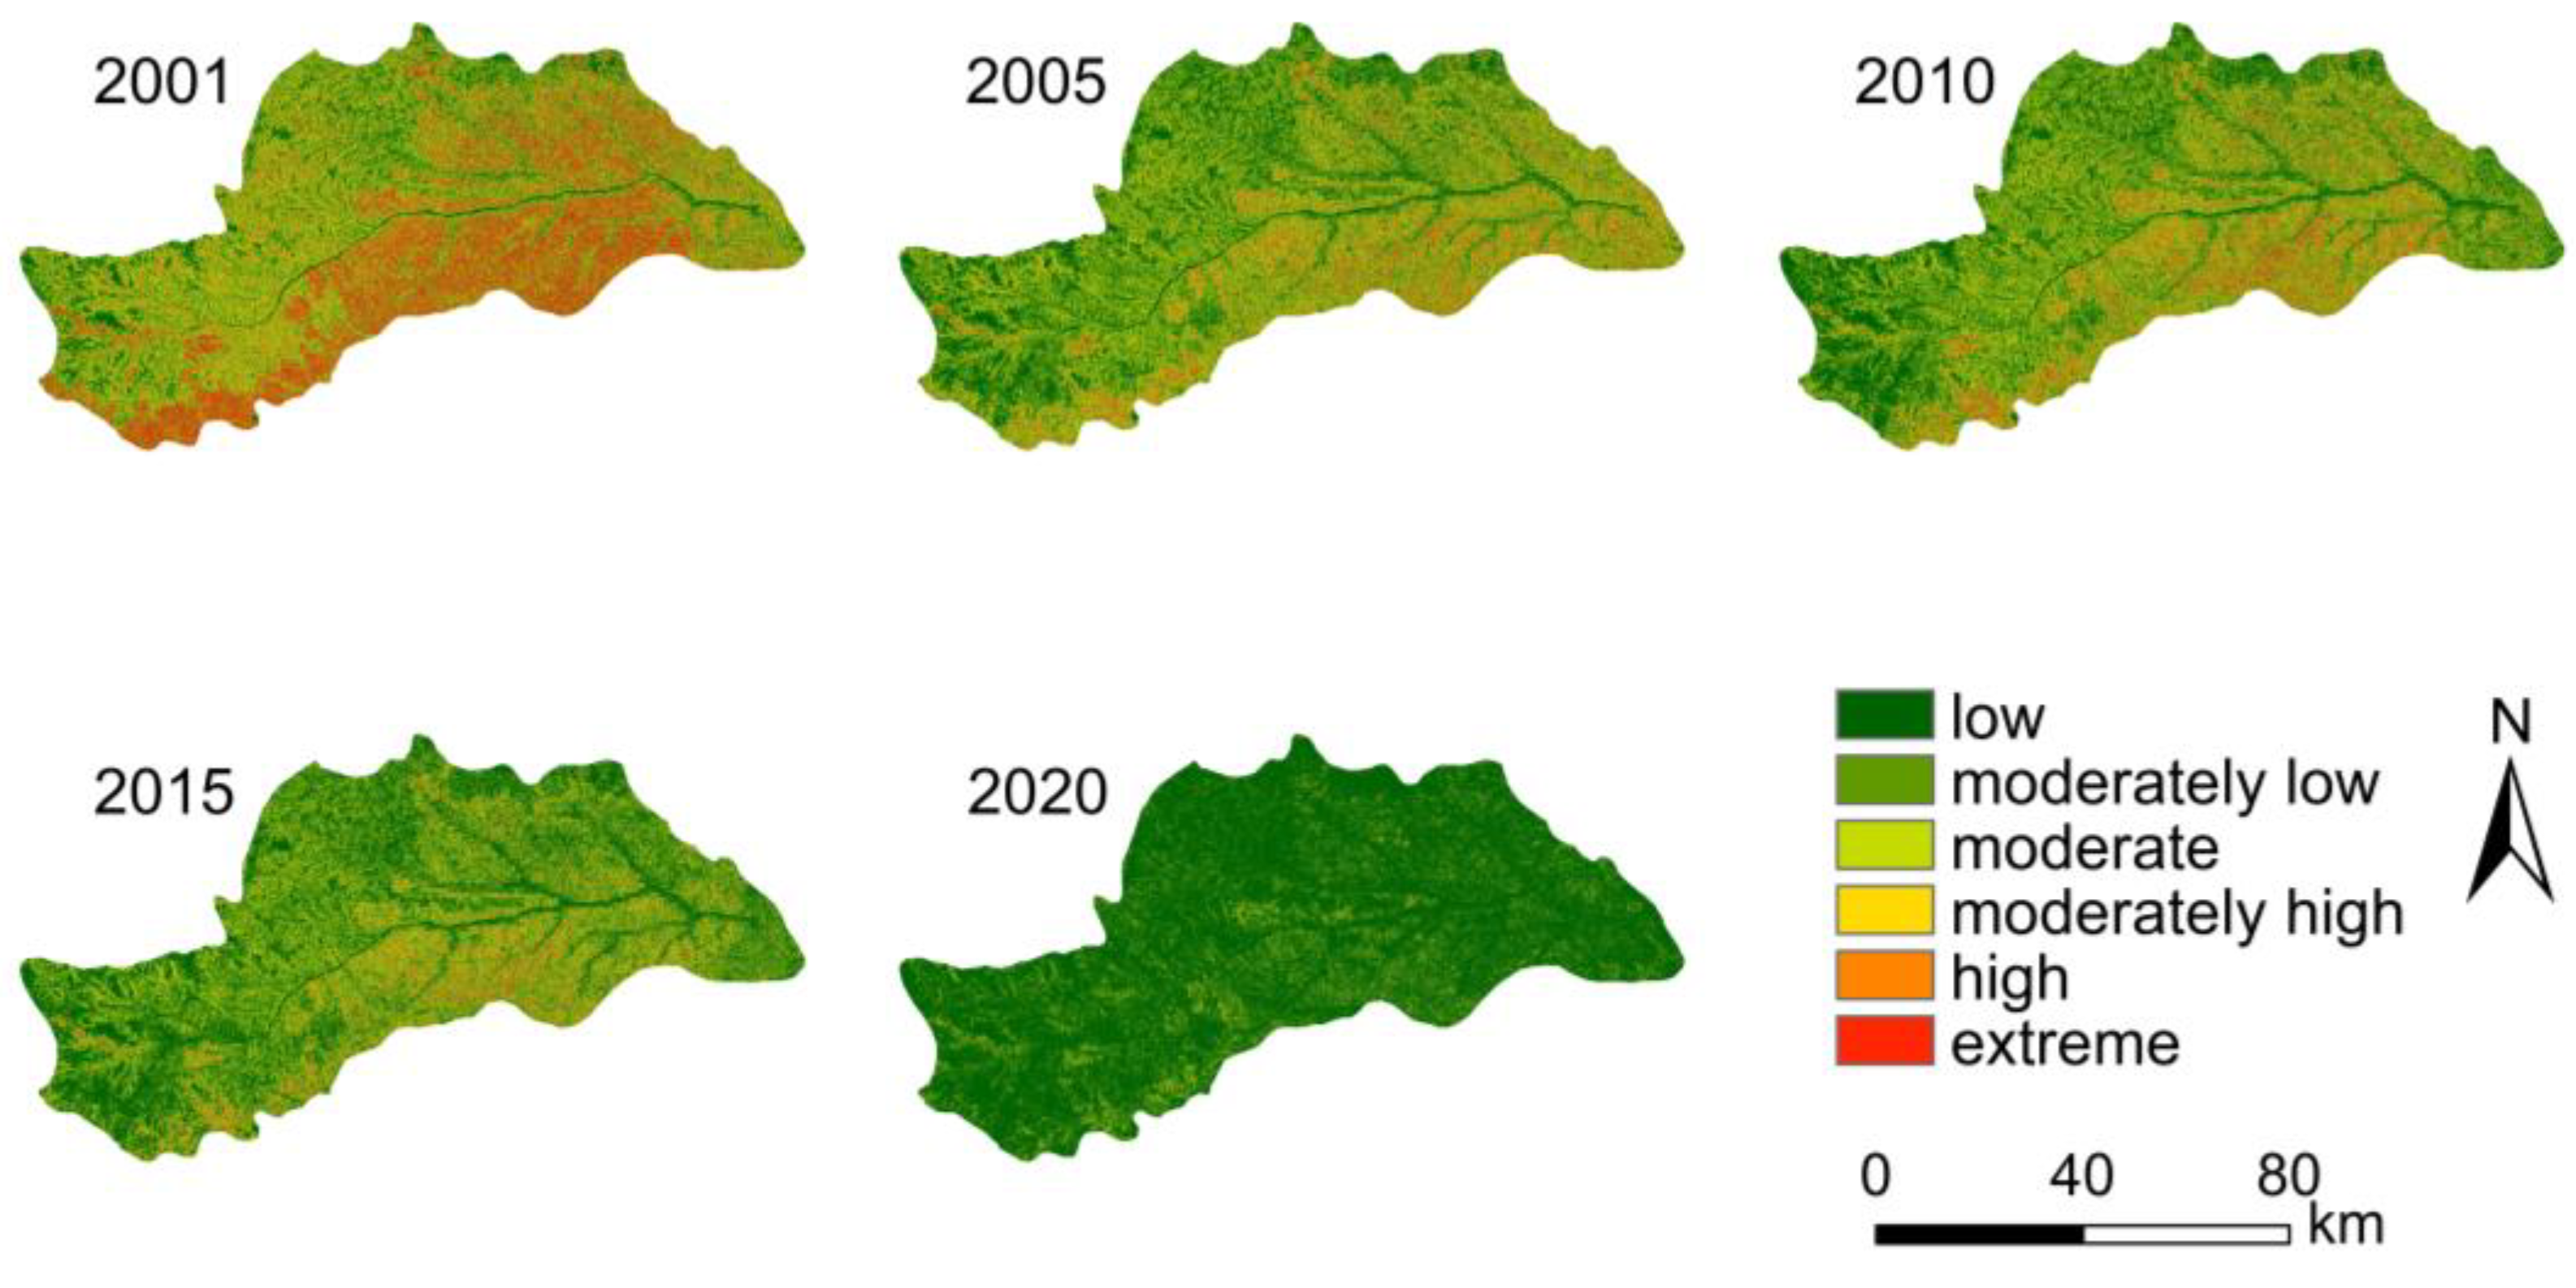
On the basis of the erosion probability map, the erosion risk of the DRB was calculated using Equation (10). The erosion risk was normalized to obtain an erosion risk value, where zero indicates that the region has no erosion risk in the area, and one indicates that the area has the highest erosion risk. The erosion risk values were categorized into six categories on the basis of the natural discontinuity point method, and their distribution maps are depicted in
Figure 9.
Table 5 shows the results of area statistics for each erosion risk level. The results indicate that, over the study period, low-risk areas occupied the largest proportion of the DRB and gradually increased, reaching 78.97% in 2020; meanwhile, moderate-risk areas gradually decreased, and extremely high-risk areas accounted for only 0.4% in 2020.
Prior to 2020, areas at moderate or moderately high risk of soil erosion existed in the central and southwestern portions of the DRB; whereas, by 2020, areas at moderate or moderately high risk of soil erosion comprised a smaller portion of the DRB and were predominantly located in the central portion of the DRB. The soil erosion intensity in the DRB from 2001 to 2023 was calculated using the RUSLE model, and the results were similar to those obtained in other studies conducted in nearby areas.
5. Discussion
5.1. Comparative Analysis
To address the impacts of subjective factors on the assessment results, the factor scoring method was chosen as a comparative soil erosion risk assessment method.
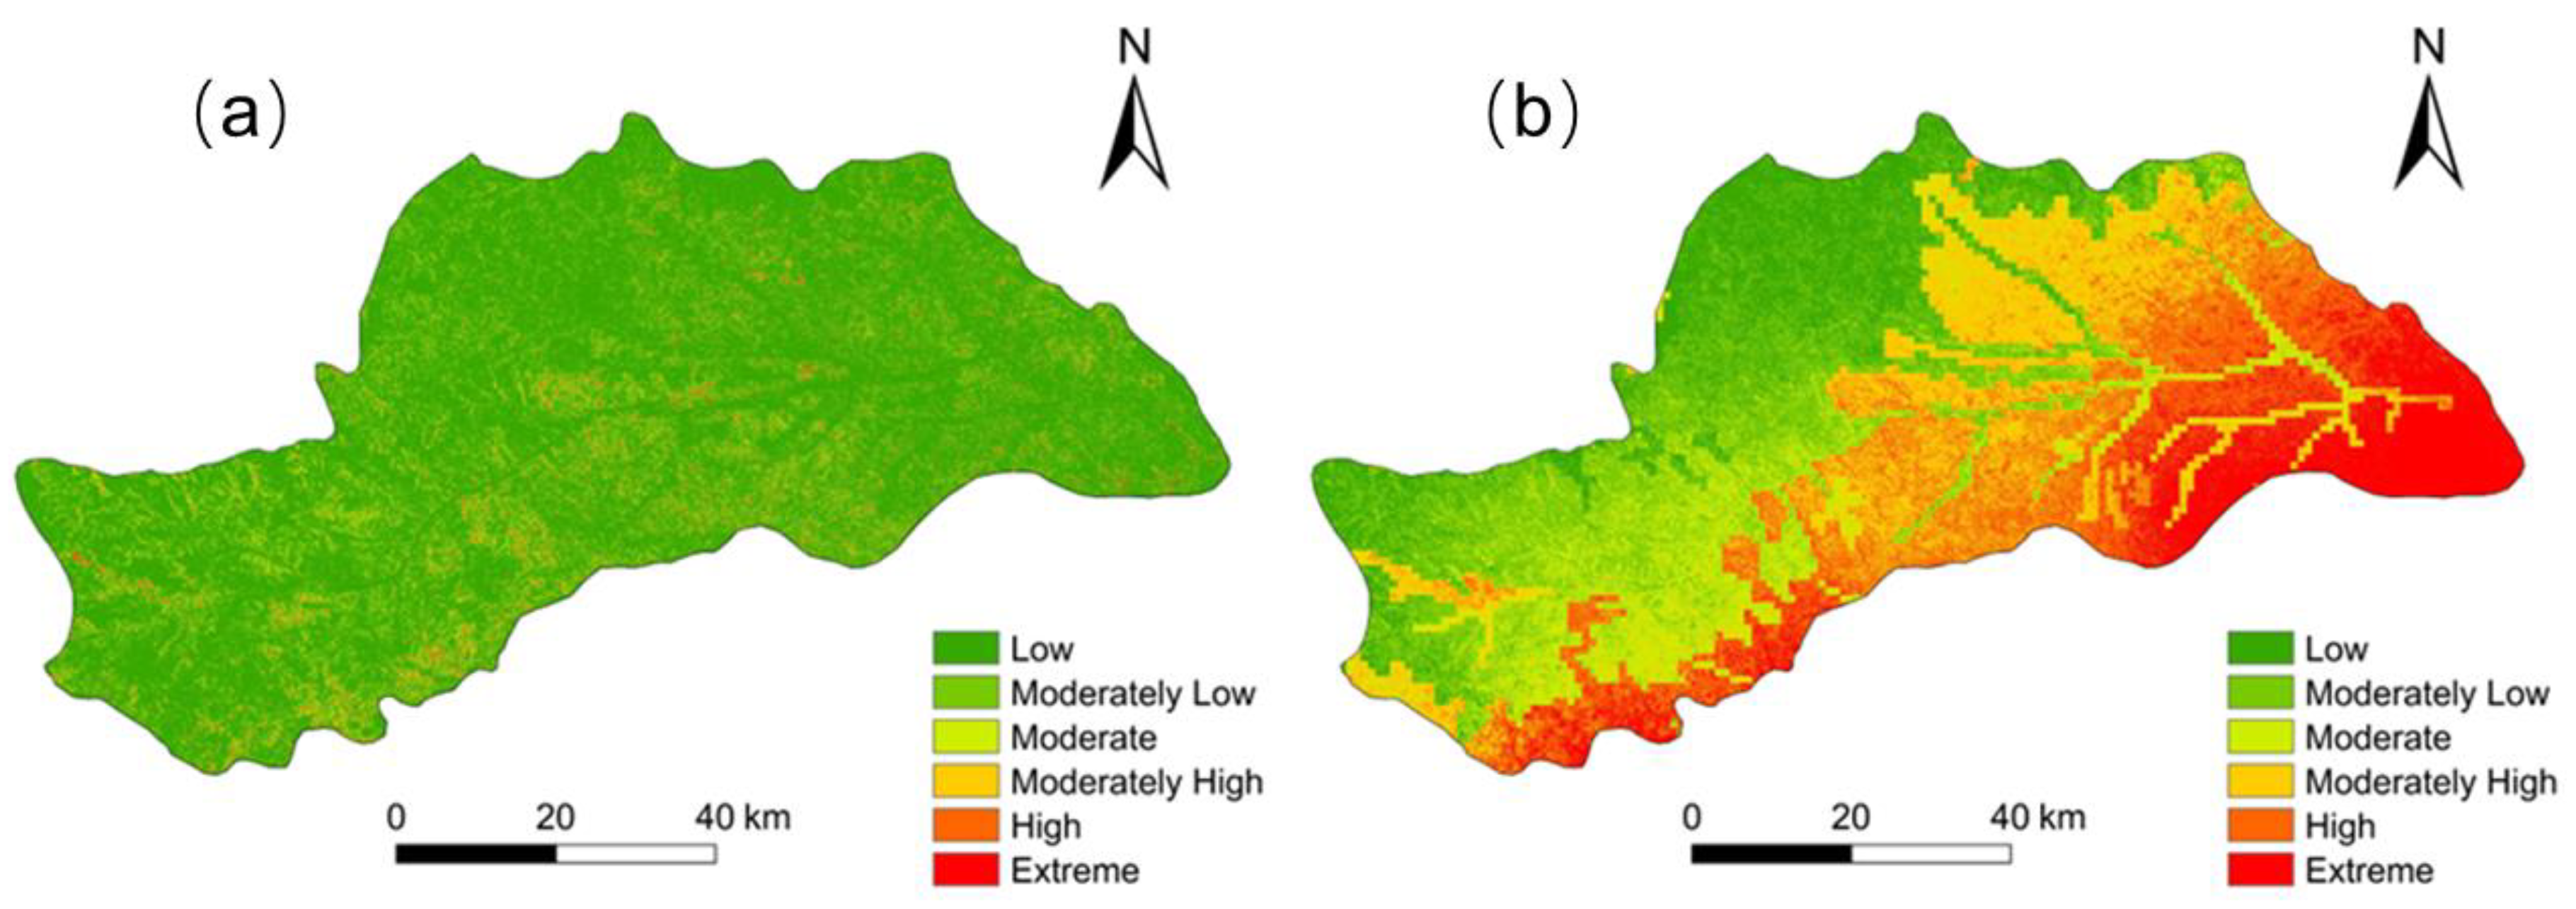
Figure 10 shows the outcomes of the erosion risk assessment for the DRB in 2020 using both methods.
The erosion risk in the DRB derived using the two methods was categorized into six categories based on the natural breakpoint method. The proportion of each category in the total region of the DRB is listed in
Table 6.
Both methods yielded the lowest proportion of extreme erosion risk in the DRB. The erosion risk in the DRB calculated using probabilistic statistics showed the largest percentage of low-risk areas at 78.97%, while the factor scoring method showed the largest percentage of moderately low-risk areas in the DRB with a soil erosion risk of 21.57%. To compare the accuracy of the results obtained using the two methods, we considered the results of erosion intensity in the DRB for the year 2021. The soil erosion intensity in the DRB from 2001 to 2023 was calculated using the RUSLE model, which was similar to the results obtained in other studies in nearby areas [
52].
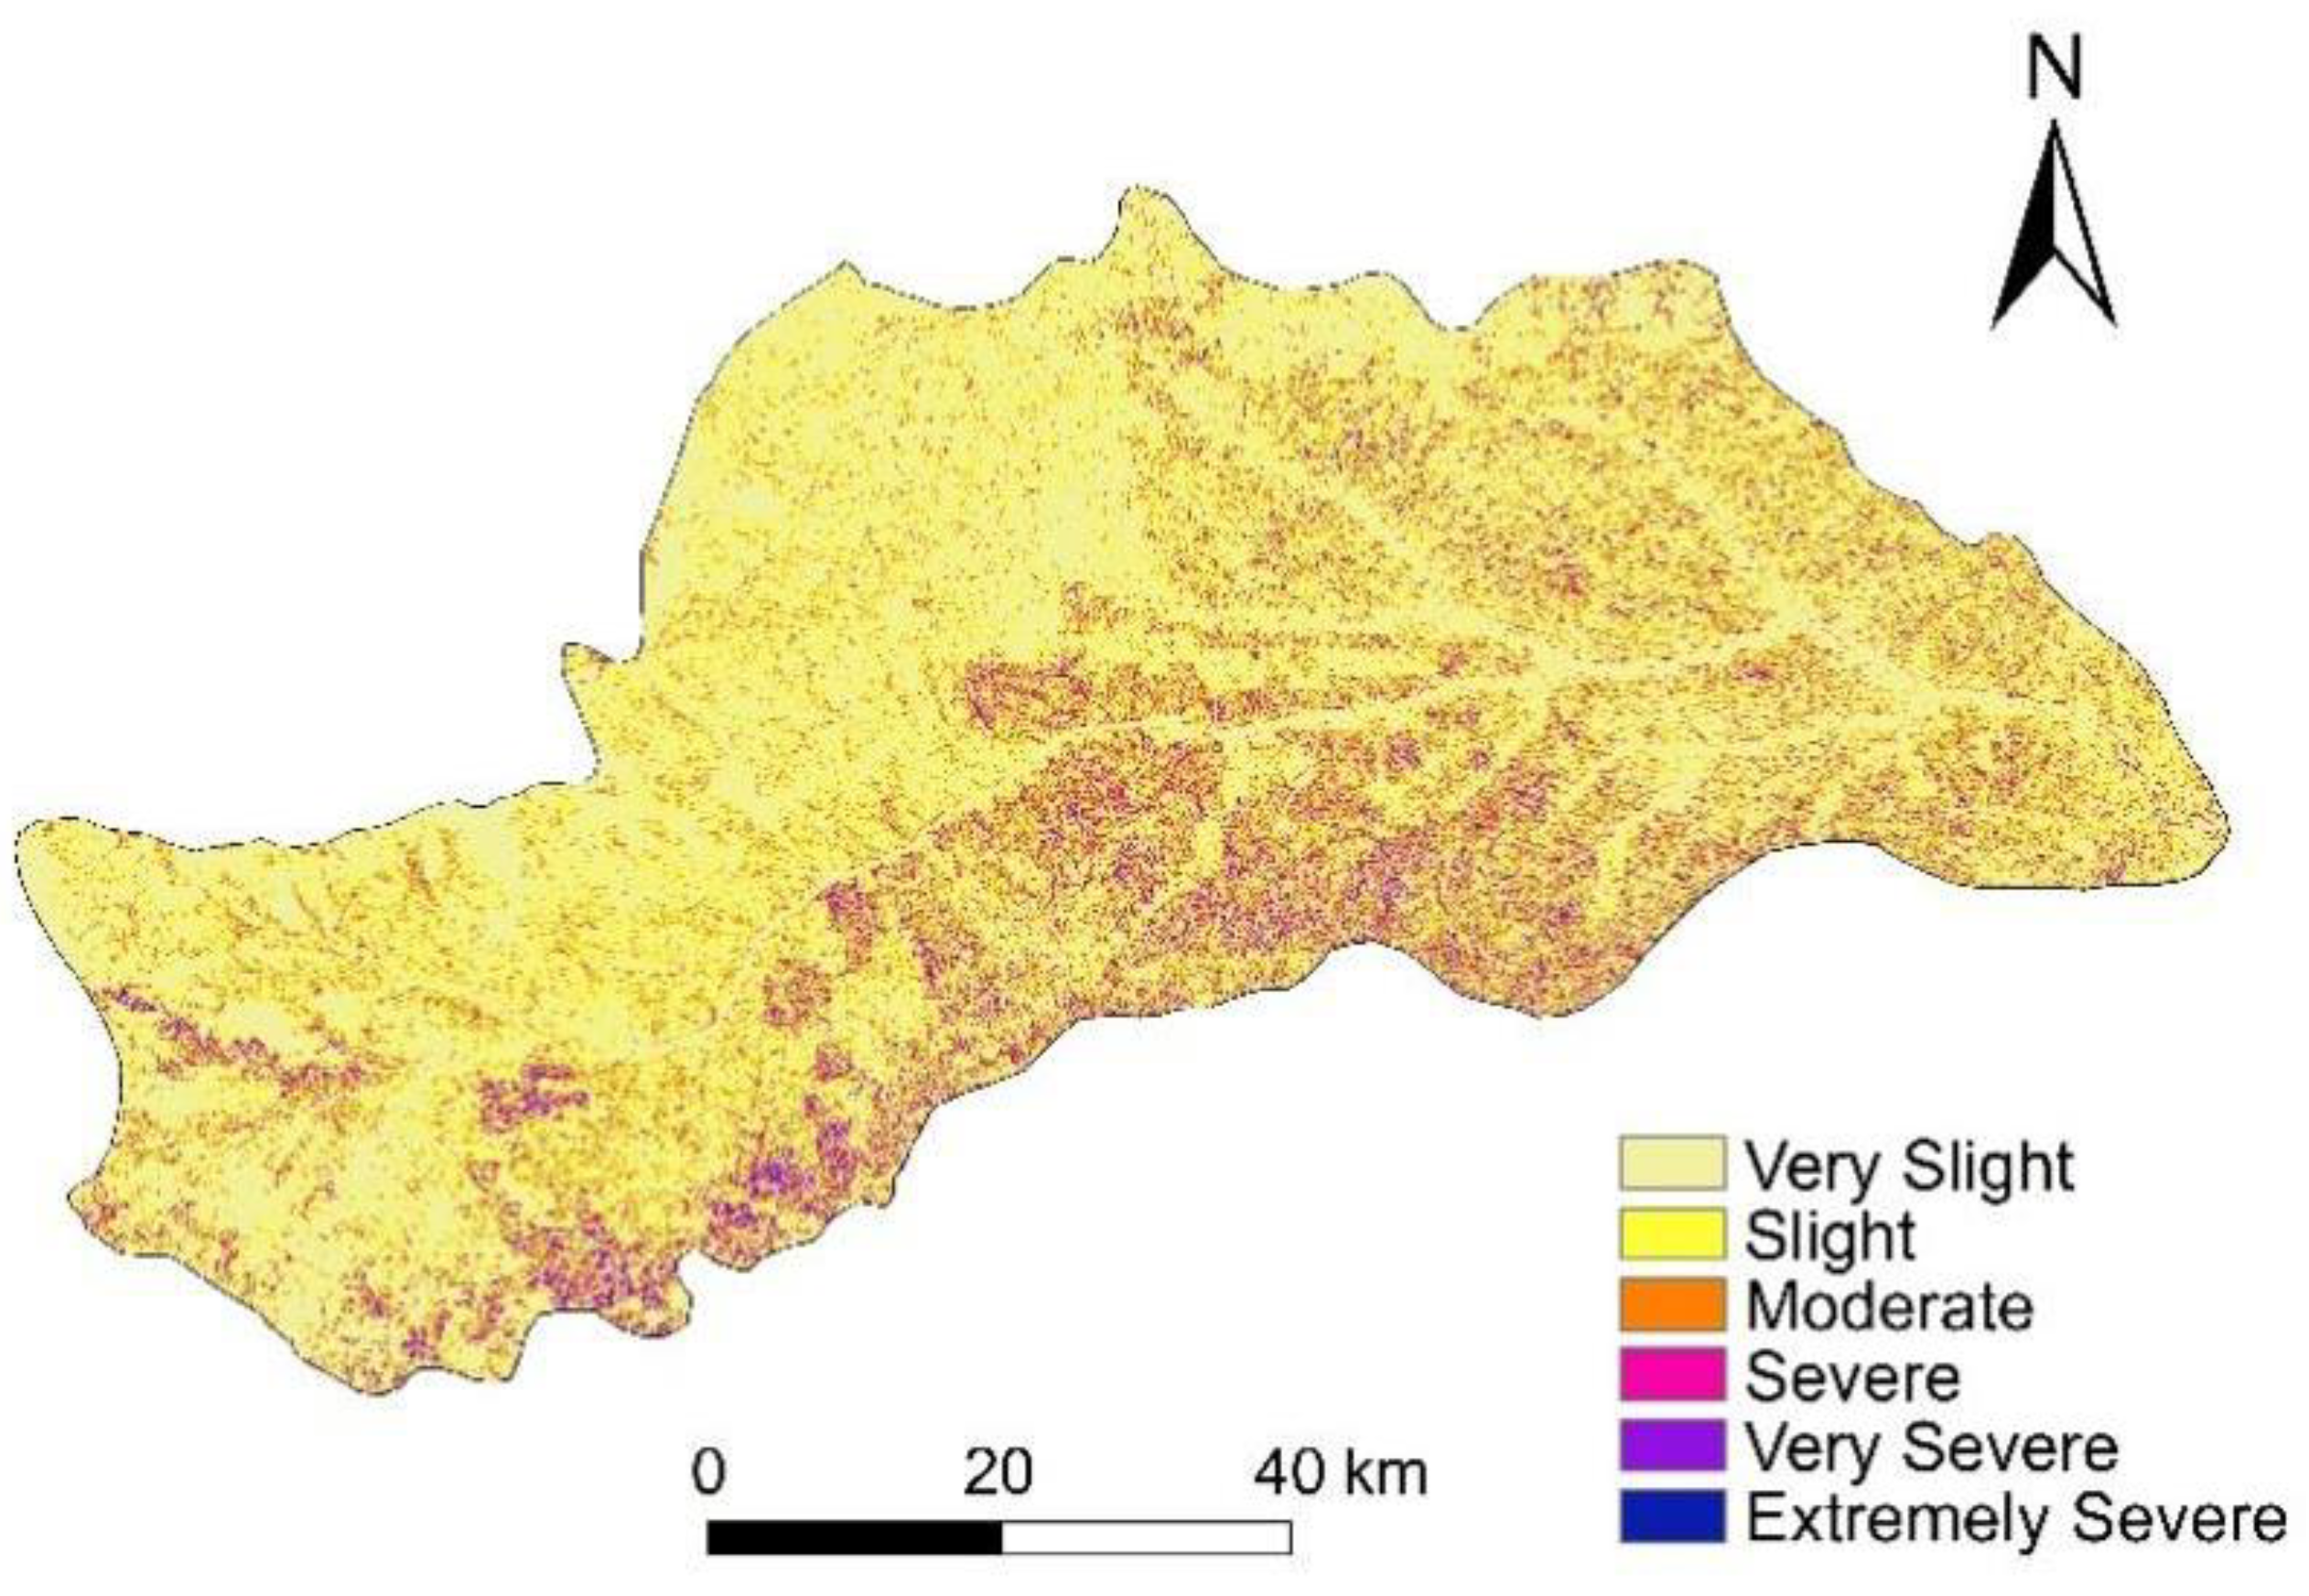
The distribution of the erosion intensity in 2021 is shown in
Figure 11.
The percentages of different soil erosion intensities in each class of erosion risk utilizing the probabilistic statistical risk method are shown in
Table 7.
Table 8 shows the percentage of various soil erosion intensities in each category of erosion risk using the factor scoring method.
The soil erosion risk results obtained using the probabilistic statistical method indicated that, in 2021, slight erosion dominated in low-risk areas, accounting for 65.70% of the entire low-risk area; in moderately low-risk areas, slight and moderate erosion dominates, accounting for 42.44% and 33.58%, respectively, and the percentage of the DRB with moderate and strong erosion is small; in moderate-risk areas, the percentage of the DRB with slight and moderate proportion is larger, accounting for 24.36% and 42.09%, respectively; and in high-risk and extremely high-risk areas, the area proportion of very severe erosion is the largest. Overall, the percentage of areas with high-intensity erosion increases with increasing erosion risk. The results calculated using the factor scoring method showed that the proportion of the slightly eroded area was the largest among all soil erosion risk areas, which may be due to the fact that the proportion of slightly eroded area was the largest in the DRB in 2020; therefore, the soil erosion risk calculated using the factor scoring method may not be a good indicator for the implementation of erosion control in the DRB.
Next, 500 random points were generated in the DRB using the ArcGIS 10.7. From these random points, soil erosion risk values obtained from factor scores and probabilistic calculations for the year 2020 and soil erosion moduli for the years 2021 to 2023 were extracted in order to study the relationship between the soil erosion modulus and the erosion risk values obtained using these two methods. The validation results are displayed in
Figure 12.
The relevant factors between the soil erosion modulus and risk values calculated using the probabilistic statistical method from 2021 to 2023 were 0.951, 0.781, and 0.668, respectively. In contrast, the correlation coefficients with the soil erosion risk values calculated using the factor scoring method were 0.405, 0.290, and 0.356, respectively, indicating that the probabilistic statistical risk assessment method is much more suitable than the factor scoring method for erosion risk assessment. This demonstrates that the probabilistic statistical risk assessment approach can better describe the soil erosion situation in the coming years.
5.2. Analysis of Impact Factors
In accordance with the reality of the DRB, 10 factors—including digital elevation model (DEM), slope, slope direction, normalized vegetation index (NDVI), chalk, sand, soil organic carbon (OC), clay, precipitation, and
p-factor—were selected to study their correlations with erosion risk. The resultant correlation coefficients are displayed in
Figure 13.
As illustrated in
Figure 13, erosion risk in the Dali River watershed was positively correlated with the digital elevation model (DEM), slope, sand, and factor
p, while being negatively correlated with aspect and NDVI, among which the correlation with slope was the strongest (with a correlation coefficient of 0.64), followed by factor
p (of 0.59). The slope and
p-factor were most strongly correlated with soil erosion risk, and both were positively related, which also indicates that erosion risk increases as the slope increases. Land-use also has a significant impact on soil erosion risk in the area, further indicating the importance of land and water conservation efforts.
In order to further analyze the dominant factors in the regional allocation of the risk of erosion and the importance of each affecting factor with respect to the spatial differences in the erosion risk, the risk of erosion and the related factors were analyzed using the geographical detector proposed by Wang Jinfeng [
49], implemented in python.
Table 9 shows that the factor with the most prominent influence on erosion risk in the DBR in 2020 was the normalized vegetation index (NDVI), with an explanatory value of 13.3%, indicating that NDVI dominated the spatial variation in soil erosion risk in 2020.
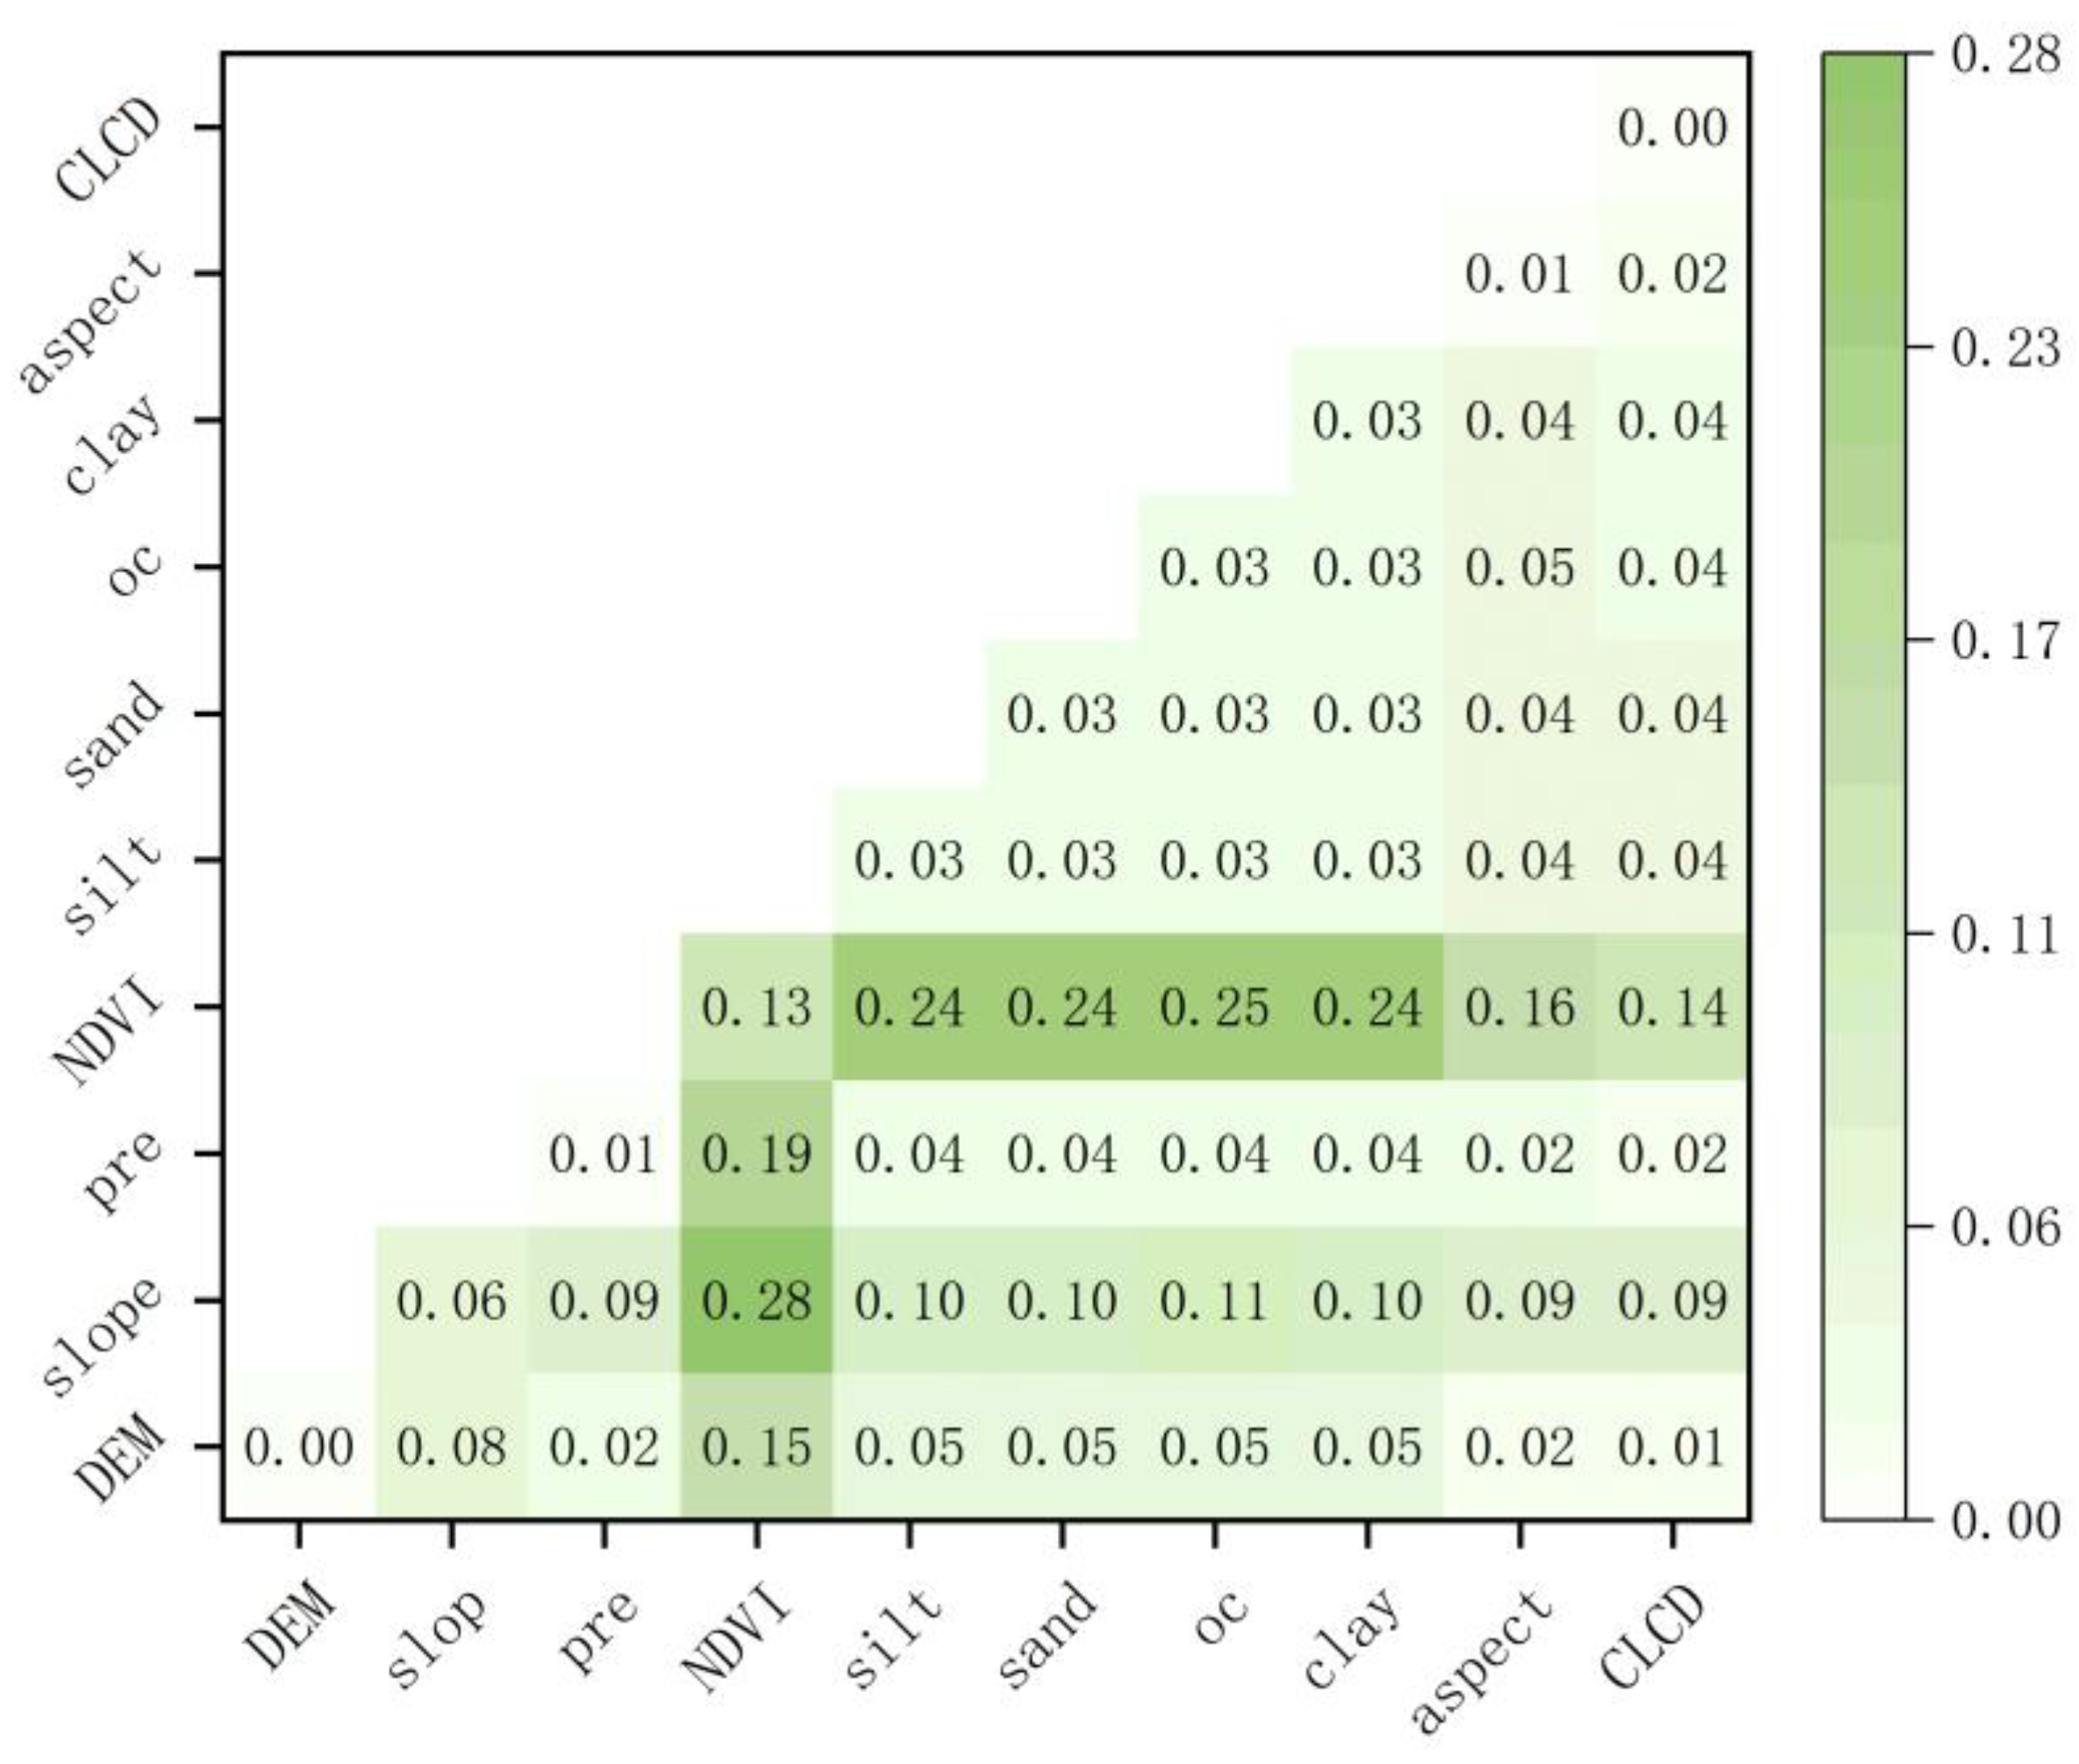
The outcome of the intervention test (
Figure 14) revealed that the interactions between factors explained the soil erosion risk significantly better than a single variable. The most significant interaction was between slope and normalized vegetation index (NDVI) and explained 28.3%, followed by the interaction between NDVI and soil organic carbon (OC) (24.6%), indicating that the interaction between NDVI and slope dominated the spatial variability of soil erosion risk in 2020.
6. Conclusions
Soil erosion has far-reaching and complex impacts on the environment and human society; thus, the accurate identification of soil erosion risks is essential for developing effective management strategies. Traditional studies have focused on the effect of erosion occurrence probability on risk. However, this study proposes a new approach to risk assessment that combines the probability of erosion occurrence with its consequences to reflect the actual risk more comprehensively. The conclusions of this study are as follows:
(1) This study introduces an innovative approach to soil erosion risk assessment that systematically assesses erosion risk by using the product of erosion consequences and occurrence probability as a quantitative indicator of risk. Specifically, the RUSLE model was used to assess the intensity of erosion, and the probability of occurrence of different intensities was calculated by means of an empirical frequency formula. The logic of this approach lies in the comprehensive consideration of the intensity of erosion and the probability of occurrence, making the risk assessment more precise and reliable.
(2) It was found that the proportion of low-risk areas in the DRB gradually increased, while the proportion of medium- and higher-risk areas gradually decreased, and these high-risk areas were mainly concentrated in the central and southwestern parts of the watershed. In 2020, the proportion of low-risk areas reached 78.97%, while the proportion of very high-risk areas only accounted for 0.40%. The interaction between the NDVI and the slope, which were identified as the main influencing factors, dominated the spatial differences in soil erosion risk. This result verifies that the probabilistic statistical risk assessment model is reasonable in practical application and can accurately reflect the spatial distribution of soil erosion risk.
(3) This study also explored the effectiveness of the probabilistic statistical risk assessment model combined with GIS technology for large-scale erosion risk assessment. The model provides a realistic and effective tool to clearly map the distribution of soil erosion risk, helping planners and decision makers to prioritize areas for protective measures. Comparing the current year’s soil erosion risk with the next year’s erosion conditions, the probabilistic statistical risk assessment model can predict future soil erosion trends more accurately than the traditional factor scoring method. This indicates the important application value of the proposed model regarding actual risk management and decision-making processes, providing a scientific basis and effective means for soil erosion control.
The probabilistic statistical risk assessment model has significant rationality in terms of both logical design and application results. By comprehensively considering the intensity and probability of occurrence of erosion, the proposed model provides a systematic and data-driven risk assessment method. In practical applications, the risk assessment tool combined with GIS technology not only improves the accuracy of the assessment, but also provides scientific support for effective soil protection measures.
Although the current soil erosion modulus interpretation of the factors increases the accuracy of the model, there are still some deficiencies, mainly focusing on data accuracy, spatial and temporal variations in the natural environment, and the long-term dynamics of management measures. For example, the influence of non-vegetation factors on erosion is neglected in the C factor [
53], and higher precision input data and application of dynamic modeling are needed to further improve the estimation of these factors.
