Article

Soil Moisture-Derived SWDI at 30 m Based on Multiple Satellite Datasets for Agricultural Drought Monitoring

1
State Key Laboratory of Remote Sensing Science, Faculty of Geographical Science, Beijing Normal University, Beijing 100875, China
2
Schmid College of Science and Technology, Chapman University, University Drive, Orange, CA 92866, USA
3
Jincheng Meteorological Administration, Jincheng 048026, China
4
Department of Infrastructure Engineering, Faculty of Engineering & IT, University of Melbourne, Melbourne, VIC 3010, Australia
5
Key Laboratory for Meteorological Disaster Monitoring and Early Warning and Risk Management of Characteristic Agriculture in Arid Regions, CMA, Yinchuan 750002, China
*
Author to whom correspondence should be addressed.
Remote Sens. 2024, 16(18), 3372; https://doi.org/10.3390/rs16183372
Submission received: 10 July 2024 / Revised: 16 August 2024 / Accepted: 9 September 2024 / Published: 11 September 2024
(This article belongs to the Special Issue Quantitative Remote Sensing of Vegetation and Its Applications)

Abstract

:
As a major agricultural hazard, drought frequently occurs due to a reduction in precipitation resulting in a continuously propagating soil moisture (SM) deficit. Assessment of the high spatial-resolution SM-derived drought index is crucial for monitoring agricultural drought. In this study, we generated a downscaled random forest SM dataset (RF-SM) and calculated the soil water deficit index (RF-SM-SWDI) at 30 m for agricultural drought monitoring. The results showed that the RF-SM dataset exhibited better consistency with in situ SM observations in the detection of extremes than did the SM products, including SMAP, SMOS, NCA-LDAS, and ESA CCI, for different land cover types in the U.S. and yielded a satisfactory performance, with the lowest root mean square error (RMSE, below 0.055 m3/m3) and the highest coefficient of determination (R2, above 0.8) for most observation networks, based on the number of sites. A vegetation health index (VHI), derived from a Landsat 8 optical remote sensing dataset, was also generated for comparison. The results illustrated that the RF-SM-SWDI and VHI exhibited high correlations (R ≥ 0.5) at approximately 70% of the stations. Furthermore, we mapped spatiotemporal drought monitoring indices in California. The RF-SM-SWDI provided drought conditions with more detailed spatial information than did the short-term drought blend (STDB) released by the U.S. Drought Monitor, which demonstrated the expected response of seasonal drought trends, while differences from the VHI were observed mainly in forest areas. Therefore, downscaled SM and SWDI, with a spatial resolution of 30 m, are promising for monitoring agricultural field drought within different contexts, and additional reliable factors could be incorporated to better guide agricultural management practices.

1. Introduction

Driven by the imbalance between rainfall and evapotranspiration, drought is a natural hazard associated with a lack of water resources [1], threatening the ecological environment, economic development, and even human existence [2]. Under the threat of global warming, the frequency and severity of drought have increased since the second half of the 20th century [3,4,5]. With the widespread effects of drought, agricultural systems are facing significant and intense shocks in both developed and developing countries [6,7,8,9]. Therefore, accurate monitoring and assessment of agricultural drought are of primary importance for promoting food security and social stability [10,11,12].
In the 20th century, academics in the U.S. initiated research on drought monitoring based on rainfall observations [13,14,15]. The proposal of the “Palmer index” [16] was a major milestone in drought monitoring research (Liu et al., 2016). The index collectively refers to three indices, namely the Palmer drought severity index (PDSI) [17,18,19], the Palmer hydrological drought index (PHDI) [20,21,22] and the Palmer Z index (ZIND) [23,24,25], and it has been widely applied in drought monitoring and assessment across various countries and fields. In the late 20th century, notable progress was achieved in the development of satellite-based technology for the spatiotemporal monitoring of drought [26], which benefits from remote sensing, a mainstream Earth observation tool that provides abundant contextual data and key variables related to drought occurrence mechanisms [27,28,29]. For instance, the evaporative drought index (EDI) is commonly used for drought monitoring based on the quantification of evapotranspiration anomalies in time series [30]; the normalized difference vegetation index (NDVI) and enhanced vegetation index (EVI) can effectively indicate drought conditions through vegetation growth conditions or productivity obtained by multispectral sensors [31,32,33]; and the standardized soil moisture index (SSI) and soil water deficit index (SWDI) can be used to assess the water stress in soil layers to characterize the intensity, frequency, and distribution of drought over a large geographic area [34,35,36]. With the focus and research of international organizations and domestic and foreign scholars regarding agricultural drought in recent years, the relevant monitoring indicators have become increasingly abundant [11]. The vegetation health index (VHI) quantifies agricultural drought stress using the function of crop water demand, and its ability to monitor drought has been recognized by many studies [37,38,39].
The disruption of the surface water balance due to precipitation deficits is the dominant factor in the uncertainty about changes and the evolution of drought [40]. This process is often manifested as agricultural drought reflected by soil moisture (SM) drought, in a narrow sense [2,11]. Therefore, the acquisition of a reliable SM dataset is the premise of drought monitoring at the field scale. Since the beginning of the 21st century, active aperture radar tools, such as the Advanced Scatterometer (ASCAT) [41], and passive microwave radiometers, such as the Soil Moisture Active Passive (SMAP) [42] and Soil Moisture and Ocean Salinity (SMOS) sensors [43], have been successfully launched, providing the continuous monitoring of global SM levels. Based on these single remote sensing SM datasets, more combination products and data assimilation products, such as the European Space Agency Climate Change Initiative (ESA CCI), or the longer time series [44] Global Land Data Assimilation System (GLDAS) [45] and the European Center for Medium-Range Weather Forecasting (ECMWF) system [46], have also been produced to meet the diversified needs of SM applications for generating more reliable SM datasets [47,48]. Nevertheless, the spatial resolution of these SM products reaches the level of tens of kilometers, which could be most commonly used for monitoring extensive drought trends and their evolution at continental and even global scales [49,50].
Surface SM, as a major factor limiting crop growth [51,52], can be applied to two types of indices, according to the emphasis on agricultural drought monitoring: a univariate statistical index based on time-series data and a comprehensive index based on soil hydraulic parameters [53,54]. The univariate statistical indices used for drought monitoring are based on the long-term average or percentile of SM data to determine whether the current SM level is normal; these indices include the soil moisture anomaly (SMA) [55], soil moisture percentile (SMP) [56], soil moisture deficit index (SMDI) [57], and SSI. Zeri et al. (2022) calculated the SMA based on simulated SM data for the 1979–2018 period over the Brazilian semiarid region and reported that this indicator exhibited notable negative values during El Niño years, performing similarly to the standard precipitation index (SPI) in identifying drought events during the rainy and cropping seasons [58]. Wambua (2019) analyzed the spatiotemporal characterization of agricultural drought by using SMDI based on hydrometeorological data from 1970 to 2010 at eight stream flow gauge stations in the upper Tana River basin and found an increasing rate in risk and severity of drought at high altitudes and during the dry seasons [59]. Zhang et al. (2021) evaluated the duration, severity, and frequency characteristics of drought in China from 1979 to 2014 according to the SSI using a grid derived from GLDAS and ESA CCI products, and the results suggested that the two SM datasets exhibited significantly correlated (p < 0.05) results over 70% of the regions, realizing the precise monitoring of extreme drought events reported around the country [60]. However, these indices can only indicate SM anomalies over a long time series and impose strict requirements on the quality and volume of the data. More importantly, these studies did not consider the physical mechanism involved in the drought process, resulting in a failure to explain the state of agricultural drought from a crop water stress perspective [61].
Comprehensive indices, including the soil moisture index (SMI) and SWDI, can be used to monitor drought conditions within the framework of soil available water by incorporating soil water dynamic parameters. Kędzior and Zawadzki (2017) mapped the spatial distributions of the SMI based on SMOS data across the Vistula catchment in Poland from 2010 to 2014, demonstrating the ability of the SMI to assess the risk of agricultural drought [62]. The SWDI, which is based on the field water capacity and wilting point, fully captures the relationship between SM and the plant physiological state and overcomes the limitation of the length of SM data time series; thus, the SWDI is more promising for describing short-term agricultural drought conditions [63,64]. Mishra et al. (2017) computed the SWDI derived from SMAP data and subsequently compared it to the in situ atmospheric water deficit (AWD) index, revealing high agreement between these two indices for drought monitoring across the U.S [65]. Martínez-Fernández et al. (2016) calculated the SWDI derived from SMOS products from 2010 to 2014 in Spain based on different approaches to obtain soil water dynamic parameters (including a long time series of SM data, in situ data parameters, and pedotransfer function estimates), demonstrating their ability to reflect SM balance dynamics and track agricultural drought via a comparison between the crop moisture index (CMI) and AWD [35]. However, previous studies on the SWDI have commonly been based on kilometer-scale SM products, which homogenize heterogeneous soil and land cover types within the same grid and fail to provide a detailed reference for monitoring agricultural field drought [66]. Zhu et al. (2019) calculated the SWDI derived from the L-band radiometer SMAP to monitor agricultural drought in the Xiang River Basin of China [67]. Although a relatively accurate distribution and temporal evolution of drought in the study area were obtained, the complex variations affected by surface heterogeneity were difficult to depict on a finer scale due to the limitation of the 36 km coarse spatial resolution [68,69].
The spatial resolution of SM products in agricultural application is required to be in the tens to hundreds of meters [70]. Global microwave SM products display coarse grids of tens of kilometers, making it difficult for them to provide detailed spatial variations of SM at local or even field scales [66]. Fang et al. (2021) used the SWDI and SMDI based on 1 km downscaled SMAP SM data to monitor drought in Australia, and the resulting maps not only showed the occurrence of drought in detail in the Murray–Darling River Basin, but also tracked the deterministic factors of the drought conditions [71]. Therefore, it is more beneficial to accurately analyze the influences of geographic factors [72] on agricultural drought events based on a surface SM dataset with a high spatial resolution. There are three kinds of SM downscaling methods, including satellite-based methods [73,74], geoinformation-based methods [75,76], and machine learning-based methods [77], according to an overview of previous studies. The complex nonlinear relationship between land-surface variables and SM can be described comprehensively by using machine learning methods [78]. Furthermore, the downscaling model, developed based on the use of an excellent algorithm, makes it possible to obtain a surface SM dataset at the tens of meters scale, thus achieving fine agricultural drought monitoring.
In this study, we monitored agricultural drought based on surface SM data with a spatial resolution of 30 m. The main objectives were threefold: (1) produce the surface SM dataset based on the random forest algorithm (RF-SM) and evaluate its performance using observational records from in situ SM stations and satellite-based SM products; (2) calculate the RF-SM-based agricultural drought index (RF-SM-SWDI) and compare it to the VHI derived from the optical remote sensing satellite observations; and (3) analyze the distribution and temporal evolution of drought in the substudy area in 2016.

2. Materials and Methods

2.1. In Situ SM Dataset

The International Soil Moisture Network (ISMN), established by the Vienna University of Technology and managed by the International Center for Water Resources and Global Change (ICWRGC) of the Federal Institute of Hydrology (FIH) of Germany, is a centralized data-hosting facility created for the calibration of remote sensing products and the validation of land surface models [79]. The ISMN provides the harmonized fractional volumetric SM (m3/m3), while preserving the measurement methods and depths used by the networks [80]. To obtain reliable surface SM, data from all networks and sites must be filtered by measuring the depth (0–5 cm) and then applying quality flags (“G”, which denotes good). With the use of the ISMN dataset (https://ismn.geo.tuwien.ac.at (accessed on 15 June 2023)), we selected 242 stations from five networks (i.e., 81 stations from SCAN, 60 stations from SNOTEL, 46 stations from SOILSCAPE, 53 stations from USCRN, and 2 stations from iRON) distributed across the U.S., based on the availability of in situ data. The locations of these stations, which maintain long-term hourly records of SM observation, are shown in Figure 1. To develop the downscaling framework of surface SM, all stations were divided into two parts: 170 stations were used as training models, and 72 stations were used for testing the performance of the method.
Moreover, we selected a substudy area with a size of 30 km × 30 km, located in California, to analyze the spatial variability of drought distribution, thus demonstrating the advantages of fine-scale drought monitoring. The substudy area covers most of western Amador County, portions of eastern Sacramento County and southern EI Dorado County, and smaller portions of northern San Joaquin County and Calaveras County. The stations in the substudy area are covered by the SOILSCAPE network and are mainly distributed in shrubland areas.

2.2. Optical Remote Sensing Dataset

The reflectance dataset derived from Landsat 8 was downloaded and processed using the Google Earth Engine (GEE) platform. The Landsat 8, Collection 2, Level-2 dataset includes complete preprocessing and definite information on cloud states, and it is widely used in land surface analysis and application. In this study, we obtained and computed the data and imagery from the red band, near-infrared band, two shortwave-infrared bands, and the surface temperature band, with a spatial resolution of 30 m, from the year 2016.

2.3. Soil Properties and Meteorological Dataset

Originally released as a “proof of concept” by the International Soil Reference Information Center (ISRIC), SoilGrids V2.0 was designed and refined by Hengl et al. (2017) and Poggio et al. (2021) to form a mature global standard soil profile dataset at a 250 m grid resolution, namely [81,82]. In this study, we obtained the mean clay, sand, silt, and organic matter contents at a depth of 5 cm from SoilGrids V2.0 (https://soilgrids.org (accessed on 10 November 2023)) and rescaled the data to 30 m using the bilinear interpolation algorithm.
ERA5 is a reanalysis dataset, released by the European Center for Medium-Range Weather Forecasts (ECMWF), that uses a four-dimensional variational (4D-var) assimilation scheme to produce data for atmospheric variables at 139 pressure levels, with a horizontal resolution of 31 km at a 1 h time step [83]. In this study, we obtained the data and imagery of the atmospheric temperature at 2 m, the 24 h total precipitation, the relative humidity, and the wind at 10 m for the year 2016 from ERA5 (https://cds.climate.copernicus.eu (accessed on 7 November 2023)).

2.4. Soil Moisture Products

The SMAP is a satellite mission launched by the National Aeronautics Space Administration (NASA) in 2015 to retrieve global SM levels based on the brightness temperature [84]. There are different levels of SMAP products, and at Level 3, which serves as a daily composite, the surface SM within the top 5 cm is retrieved, based on the brightness temperature derived from a passive L-band radiometer [85]. In this study, we obtained SMAP passive Level-3 product data and imagery with a grid resolution of 36 km for 2016 from the National Snow and Ice Data Center (https://nsidc.org/data/smap (accessed on 11 November 2023)).
The SMOS is a satellite mission launched by the European Space Agency (ESA) in 2009 specifically dedicated to obtaining high-accuracy global surface SM and sea surface salinity measurements [86]. Based on the L-band Microwave Emission of the Biosphere (L-MEB) model, SMOS-INRA-CESBIO (SMOS-IC) simplifies complex parameters and completes computations using the heterogeneous pixels to minimize the dependence on auxiliary information [87]. In this study, we obtained SMOS-IC data and imagery with a grid resolution of 25 km for 2016 from the Centre Aval de Traitement des Données SMOS (https://www.catds.fr (accessed on 14 November 2023)).
The NCA-LDAS is a data assimilation system developed by the U.S. Global Change Research Program (USGCRP) using the NASA Land Information System (LIS) in the North American Land Data Assimilation System (NLDAS) configuration [88]. The product including the environment data records from 1979 to the present was generated by applying the uncoupled Noah land surface model at 0.125° × 0.125° across the continental U.S. [89]. In this study, we obtained data and imagery of the “SoilMoist0_10cm” layer of the daily NCA-LDAS Noah-3.3 LSM with a spatial resolution of 0.125° for 2016 from the NASA Land Data Assimilation System (https://ldas.gsfc.nasa.gov/nca-ldas (accessed on 2 December 2023)).
The ESA CCI SM dataset is a multidecadal SM dataset derived from global satellite observations released by the ESA for the Climate Change Initiative (CCI) program [44]. The product harmonizes a merged active dataset, a merged passive dataset, and a combined active–passive dataset by integrating various single-sensor-derived SM products based on the microwave backscatter or brightness temperature [90]. In this study, we obtained combined ESA CCI V.06.1 data and imagery with a spatial resolution of 0.25° for 2016 from the Center for Environment Data Analysis (https://data.ceda.ac.uk (accessed on 20 November 2023)).

2.5. Methods

2.5.1. Surface Soil Moisture Derived from a Downscaling Framework (RF-SM)

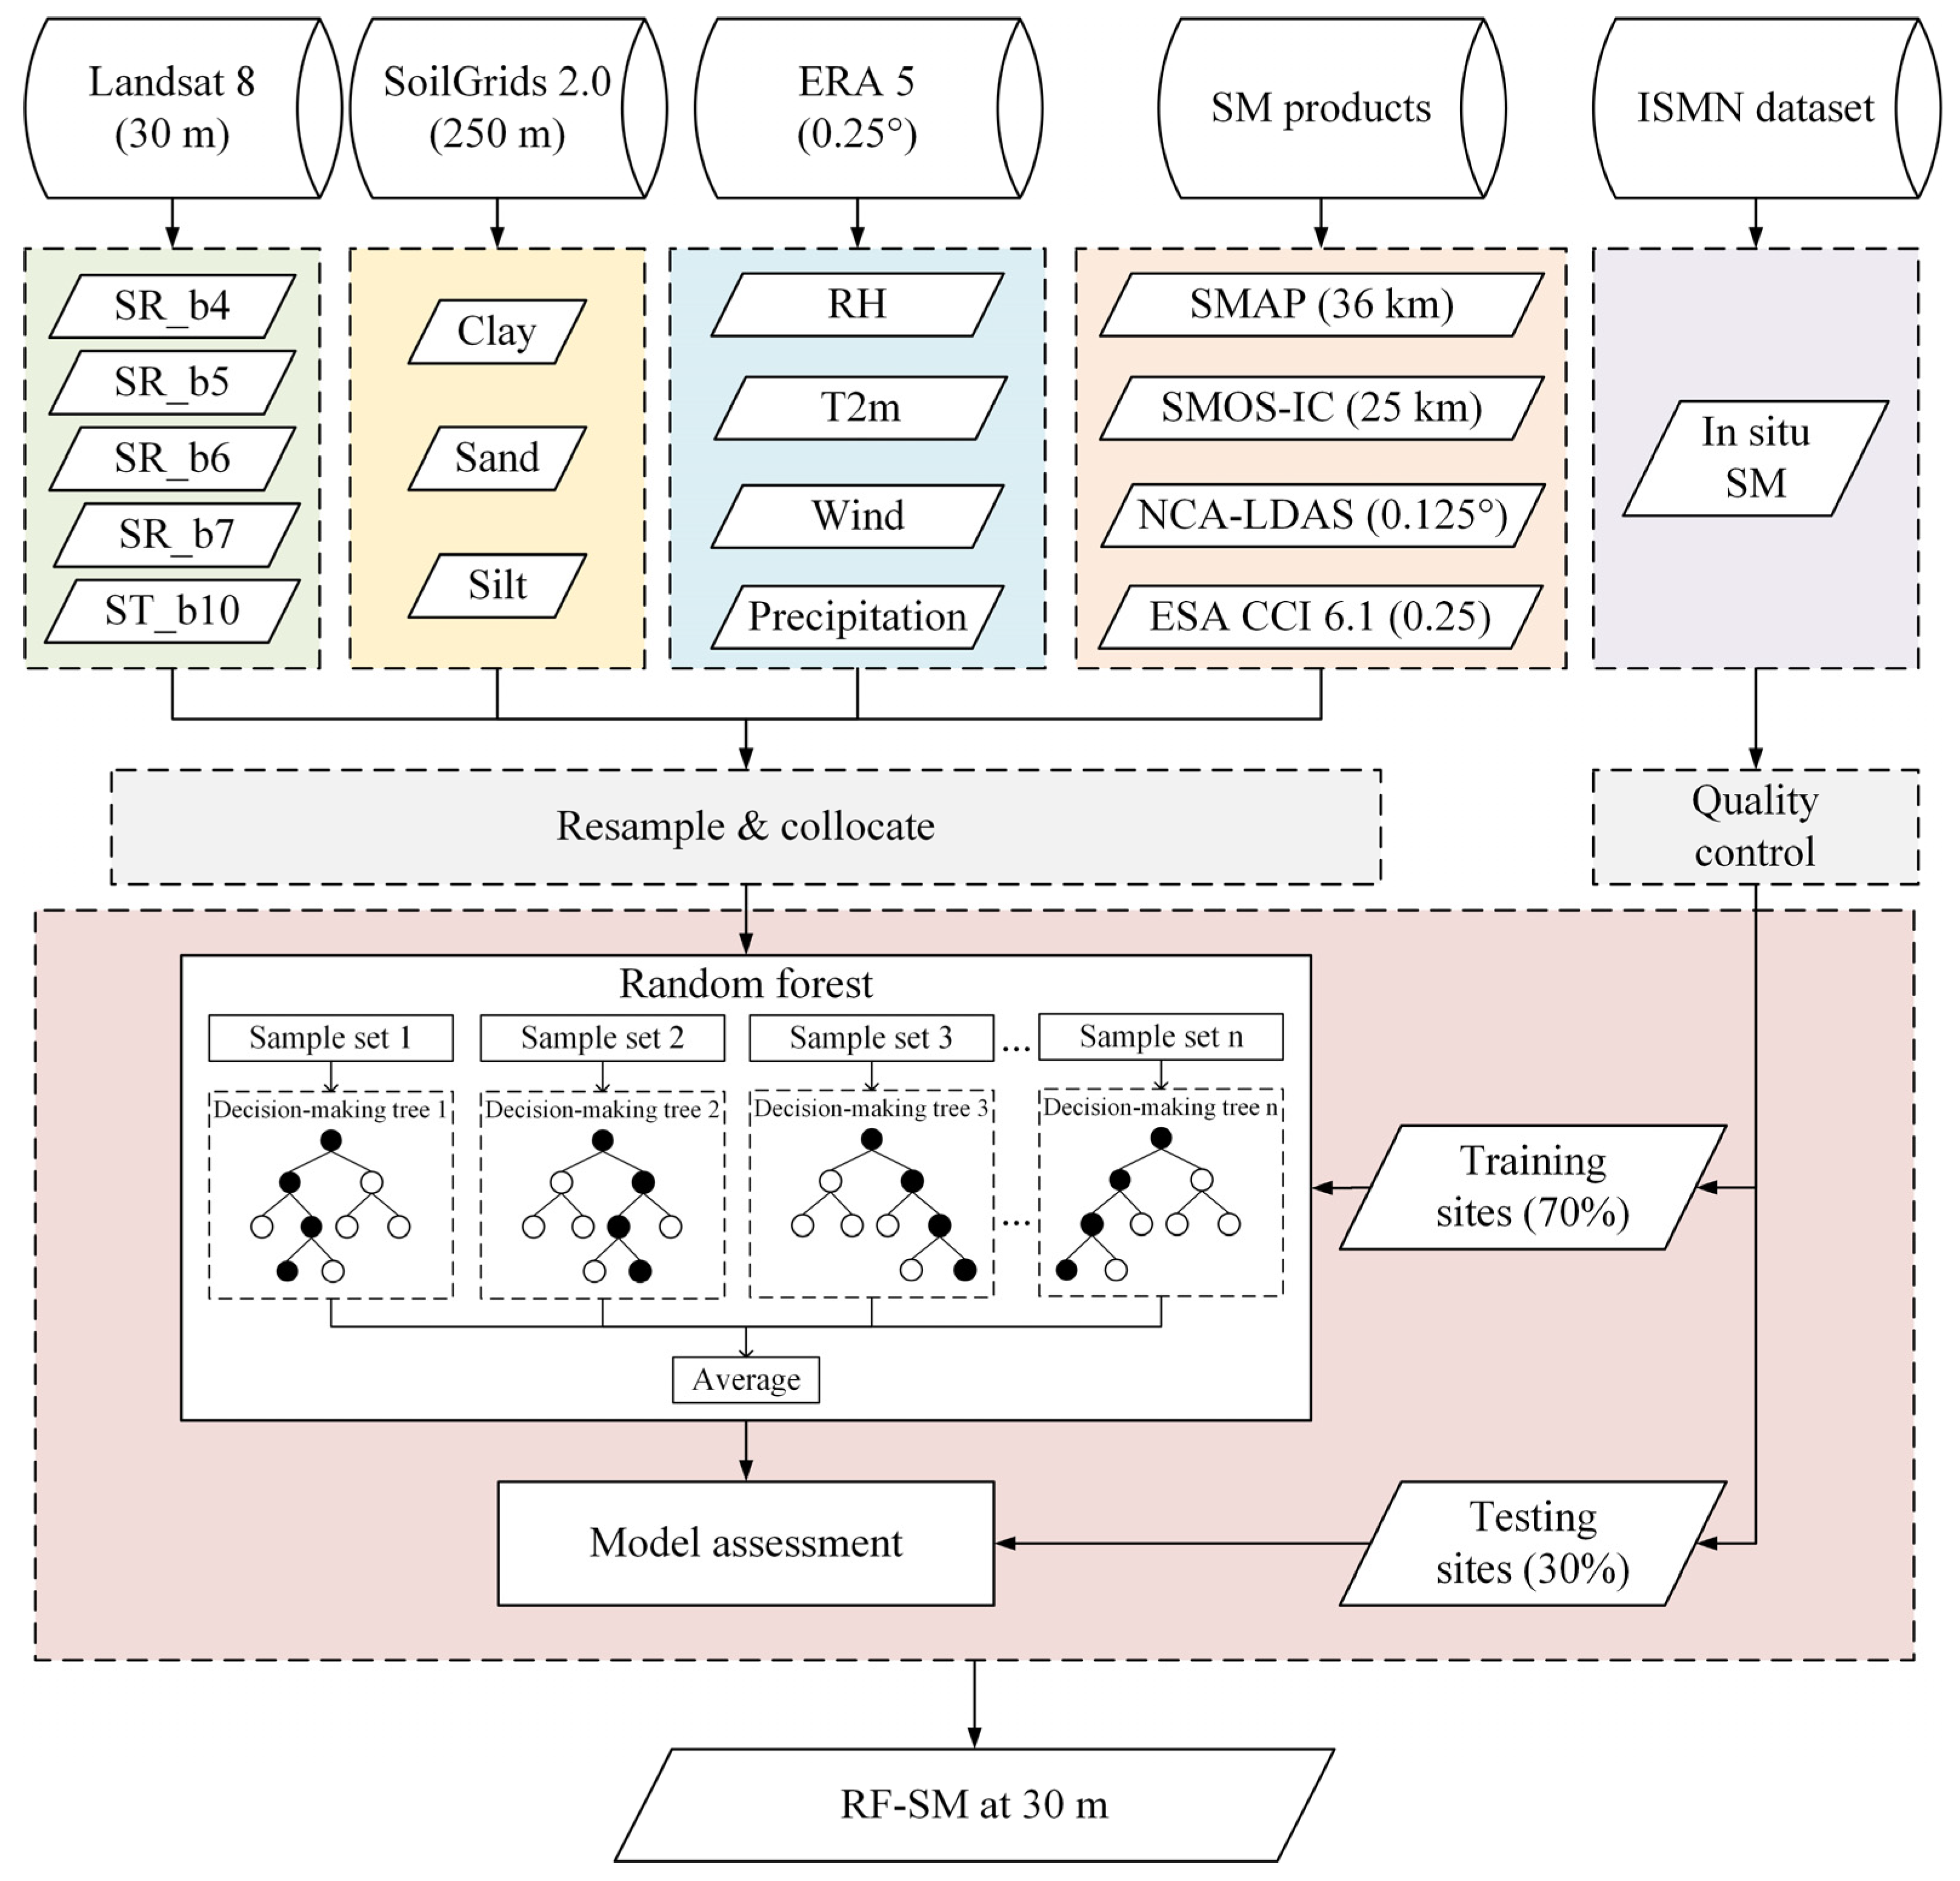
The downscaling framework for surface SM was established based on variables obtained from multiple satellite datasets, and the random forest (RF) algorithm was applied to deconstruct SM to a fine scale at a 30 m spatial resolution (Figure 2). The framework integrates four datasets into the model to accurately retrieve SM (Table 1). The first dataset includes reflectance data from the red, near-infrared (NIR), shortwave infrared (SWIR), and surface temperature (ST) bands from high spatial-resolution optical remote sensing, Landsat 8 OLI, and TIRS Level-2 images. Soil properties from SoilGrids V.2.0, including clay, sand, and silt, comprise the second dataset, which impact SM dynamics by influencing water infiltration. The third dataset indirectly reflects SM variation under the influence of land–air interactions and consists of meteorological data from ERA5, namely, atmospheric temperature (T2m), precipitation, relative humidity (RH), and wind. The last dataset comprises SMAP, SMOS, ESA CCI, and NCA-LDAS, four coarse-resolution SM products, and it plays a leading role in the model. In this study, an RF model was developed using in situ observations from the ISMN. The optimal parameters were obtained through the fivefold cross-validation method, based on the records from training stations and determined by accuracy control based on the records from testing stations. The RF-SM dataset was eventually generated for computing the SWDI.

2.5.2. Soil Water Deficit Index (SWDI)

Based on the effect of SM on agricultural drought, the SWDI accounts for water deficit accumulation and soil water storage [64] and has the potential to capture short-term SM variations and track drought dynamics [35]. In this study, we applied the SWDI based on surface SM, which has been proven to be a viable agricultural drought monitoring strategy [35,65]. The SWDI can be calculated as follows:
S W D I = θ θ F C θ A W C × 10
θ A W C = θ F C θ W P
where θ denotes SM; θ F C denotes the field water capacity, which is the maximum water capacity that the soil can maintain to be effective for crops; θ A W C denotes the available water capacity, which refers to the difference between θ F C and θ W P (wilting point) and can be calculated using Equation (2). In addition, the SWDI was proposed on the basis of the concept of the water deficit index [91], which can be multiplied by 10 to convert this fractional magnitude to a range of values with agricultural meaning [64].
The most critical issue in deriving the SWDI is the determination of the parameters θ F C and θ W P . However, these data are typically unavailable in standard soil databases. To address this issue, there are generally three ways for researchers to obtain or estimate θ F C and θ W P , i.e., using the SM time series [92,93], employing laboratory analysis [35], or through pedotransfer functions (PTFs) [94]. In fact, the first method requires SM data with a long enough time series to ensure the accuracy of these parameters, while the second method consumes large amounts of manpower and time. Therefore, we applied regression analysis-based PTFs to estimate θ F C and θ W P by using a soil property dataset. On the basis of previous research and prior achievements [65,95], the PTF regression equation developed by Saxton and Rawls (2006), using the soil physical properties (i.e., c l a y and s a n d ) and organic matter ( O M ) as independent variables, was applied in this study [96]. The predictive equations for these hydraulic parameters (i.e., θ F C and θ W P ) can be calculated as follows:
θ W P = θ W P * + ( 0.14 × θ W P * 0.02 )
θ W P * = 0.024 × s a n d + 0.487 × c l a y + 0.006 × O M + 0.005 s a n d × O M 0.013 × c l a y × O M + 0.068 × s a n d × c l a y + 0.031
θ F C = θ F C * + 1.283 × ( θ F C * ) 2 0.374 × θ F C * 0.015
θ F C * = 0.251 × s a n d + 0.195 × c l a y + 0.011 × O M + 0.006 s a n d × O M 0.027 × c l a y × O M + 0.452 × s a n d × c l a y + 0.299

2.5.3. Vegetation Health Index (VHI)

The VHI was first proposed by Kogan (1997), it and combines spectral and infrared channels to characterize the vegetation stress related to water and temperature during drought [97]. The VHI is derived from an integration of the vegetation condition index (VCI) and the temperature condition index (TCI) [98] and can be expressed by merging these, as defined in Equation (7), where α denotes the contribution of these two components to the total vegetation health.
V H I = α × V C I + ( 1 α ) × T C I
The VCI represents the vegetation growth state based on the moisture conditions in the visible and near-infrared bands and can be calculated as follows:
V C I = 100 × ( N D V I i N D V I m i n ) ( N D V I m a x N D V I m i n )
N D V I i = N I R i R E D i N I R i + R E D i
where N D V I i denotes the normalized difference vegetation index of pixel i and can be calculated by the reflectance in the red band ( R E D i ) and near-infrared band ( N I R i ) (Equation (9). N D V I m i n and N D V I m a x denote the minimum and maximum values of N D V I i in 2016, respectively. The TCI represents the surface temperature conditions in the thermal infrared band and can be calculated as follows:
T C I = 100 × ( L S T m a x L S T i ) ( L S T m a x L S T m i n )
where L S T i denotes the land surface temperature of pixel i , and L S T m a x and L S T m i n are the minimum and maximum values of L S T i in 2016, respectively.
To ensure the consistency of the data, the Landsat 8, Collection 2, Level-2 dataset was used as the basic information to calculate the NDVI and LST in this study. In addition, the VCI and TCI were assigned equal contributions (i.e., α = 0.5) [99]

2.5.4. Evaluation Methods

(1)
Model Evaluation Methods
To evaluate the performance of the RF-SM dataset, the coefficient of determination (R2), root mean square error (RMSE), bias (Bias), and Kling–Gupta efficiency (KGE) [100] were adopted as accuracy metrics. Each statistical indicator can be expressed as:
R 2 = i = 1 N S i S ¯ S i O ¯ 2 i = 1 N S i S ¯ 2 i = 1 N ( O i O ¯ ) 2
R M S E = 1 N i = 1 N S i O i 2
B i a s = 1 N i = 1 N S i O i
where N is the sample size, and O i and S i are the observed and simulated values of the i th sample, respectively. O ¯ and S ¯ are the average values of the observations and simulations, respectively, for the corresponding sample sets.
The KGE integrates the correlation ( r ), relative variability ( α , Equation (15)), and ratio of the mean ( β , Equation (16)) to provide a comprehensive model evaluation indicator (Equation (14)). σ O and σ S denote the standard deviations of the observations and simulations, respectively, for the corresponding sample sets. μ O and μ S denote the mean values of the observations and simulations, respectively, for the corresponding sample sets. The KGE is a measure of the Euclidean distance from a given point to the optimal point. Thus, the value of all three components of the KGE is equal to 1 under ideal conditions and without simulation errors.
K G E = 1 ( r 1 ) 2 + ( α 1 ) 2 + ( β 1 ) 2
α = σ S σ O
β = μ S μ O
(2)
Evaluation of the Drought Indices SWDI and VHI
As indicated in Equation (1), when the SWDI is 0 or greater, the SM content completely meets or even exceeds the field water capacity, and the soil exhibits no water deficit. A negative SWDI value indicates that the soil is under water stress, and once the value is below −10, the SM content dips below the lower limiting value of the available water capacity [101]. At this point, crops cannot absorb enough water from the soil to compensate for the transpiration loss, resulting in wilting of the leaves.
The VCI, TCI, and VHI are indices that represent the moisture, temperature, and vegetation health conditions, respectively, on a scale of 0 to 100. Normally, a lower value indicates higher stress and poorer vegetation health.
In this study, the following classification system was used for assessing agricultural drought conditions (Table 2). The SWDI was adapted from Martínez-Fernández et al. (2015) [64], and the VHI was obtained from Kogan (2002) [102].

3. Results

3.1. Evaluation of the RF-SM Dataset

In this study, we used SM records from 242 observation stations for model development and evaluation, based on the downscaling framework, to obtain RF-SM data. To evaluate the performance of the RF-SM data, we further verified the different SM products from two aspects at the point scale. The SM data from in situ stations were compared with the RF-SM data and the estimations of these four SM products from the corresponding pixels.
Figure 3 shows scatterplots between the RF-SM predictions and the in situ SM data. The samples used to develop the model mostly exhibited low SM levels, resulting in concentrations along the 1:1 line. We trained the SM downscaling framework based on the RF algorithm, using available SM records from 170 in situ stations. Figure 3a shows that the model exhibited favorable performance, with a high KGE value (0.85) and a low Bias value (0.001 m3/m3). The model was then validated based on in situ SM from the remaining 72 observation stations. Figure 3b shows that the RF-SM dataset yielded relatively accurate results, with a KGE value of 0.72 and a Bias value of 0.028 m3/m3, compared to the SM records from the observations. In addition, the downscaling framework might be slightly overestimated at low SM levels and slightly underestimated at high SM levels within the constraints of the sample distribution.
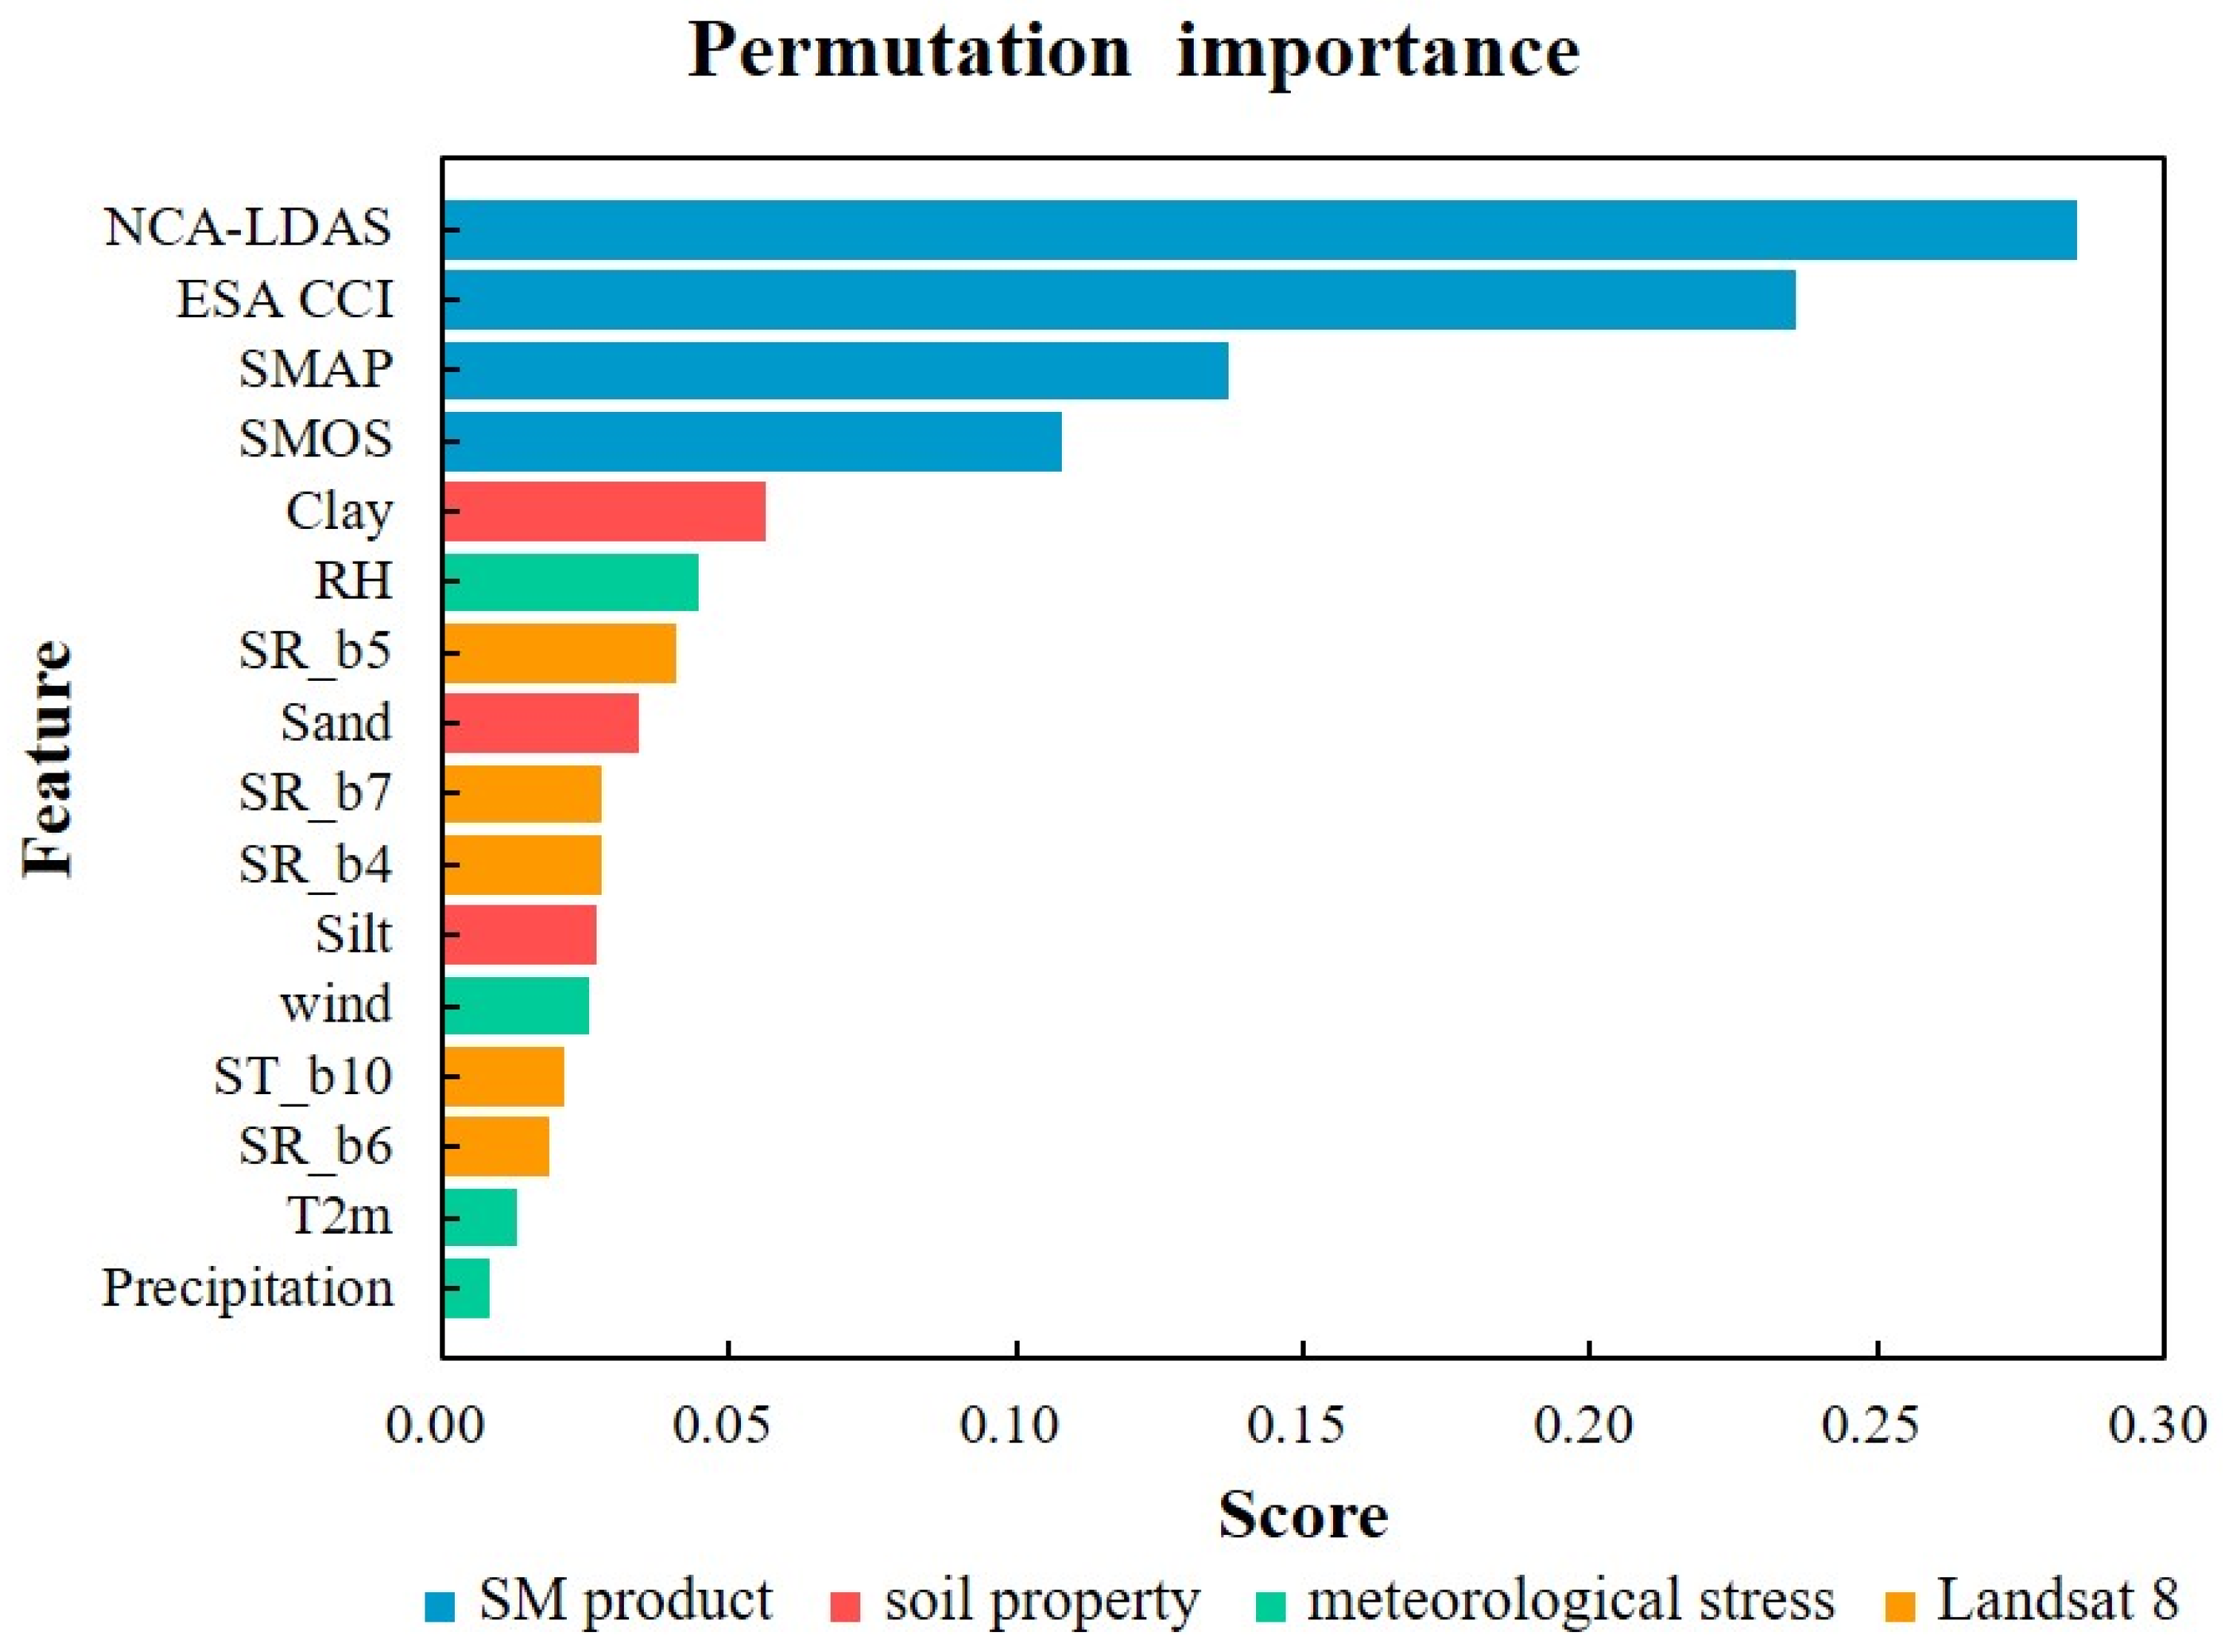
Figure 4 shows the permutation importance of RF-SM. The SM products achieved higher importance scores for all the input variables, with NCA-LDAS scoring the highest. The variables derived from the soil properties and the Landsat 8 dataset displayed moderate importance scores, and the meteorological reanalysis dataset exhibited the lower importance scores, except in the case of RH. This result suggests that coarse-scale SM products are important features in RF-SM, and that fine-scale soil properties contribute more significantly to the model than does surface reflectance. It is difficult to achieve a satisfactory model prediction by relying on a single dataset, while the integration of multiple auxiliary variables will generate reliable SM results.
We then described the distributions of SM derived from RF-SM, SMAP, SMOS, NCA-LDAS, ESA CCI, and ground observations under six land cover types using boxplots. Figure 5 shows lower SM values in the barren and shrubland types and higher SM values in the cropland and forest types. Among the types with low SM values, the four products exhibited specific errors and even produced overestimated values that significantly deviate from the observations, while the median and extreme SM values derived from the RF-SM dataset agree better with those derived from the in situ dataset. Among the types with high SM values, the RF-SM distribution also remained stable and concentrated, with fewer extreme values and results closer to the observed median. Compared with the in situ observations, the RF-SM data achieved better consistency in terms of the data range and distribution, especially for the grassland and savanna types.
We also compared the statistics (R2, RMSE, Bias, and KGE) of SM derived from the RF-SM dataset and the four SM products based on the in situ stations of five observation networks to evaluate the reliability of the dataset. Figure 6 shows that all the SM datasets exhibited the worst performance in the iRON network, with the lowest R2 (from 0.01 to 0.34, p < 0.01) and the highest Bias values (from −0.086 to 0.094 m3/m3). In the SOILSCAPE network, the RF-SM dataset and the four SM products all exhibited their best performance, with the highest KGE (from 0.14 to 0.86) and the lowest RMSE value (from 0.037 to 0.114 m3/m3). In addition, SM levels derived from RF-SM, SMAP, NCA-LDAS, and ESA CCI were higher than those derived from the observations (Bias > 0 in all networks), while SM derived from SMOS was lower than the actual value (negative Bias ranging from −0.086 to −0.015 m3/m3). Notably, the statistical metrics of the RF-SM dataset indicated better and more stable performance across the five networks, yielding an optimal performance, with favorable R2 values ranging from 0.34 to 0.86 ( p < 0.01), RMSE values ranging from 0.037 to 0.065 m3/m3, Bias values ranging from 0.004 to 0.025 m3/m3, and KGE values ranging from 0.28 to 0.86. Therefore, we could conclude that the RF-SM dataset exhibits relatively accurate SM estimates at 242 stations across the U.S., and therefore, it could be considered as the basis dataset for follow-up drought monitoring.
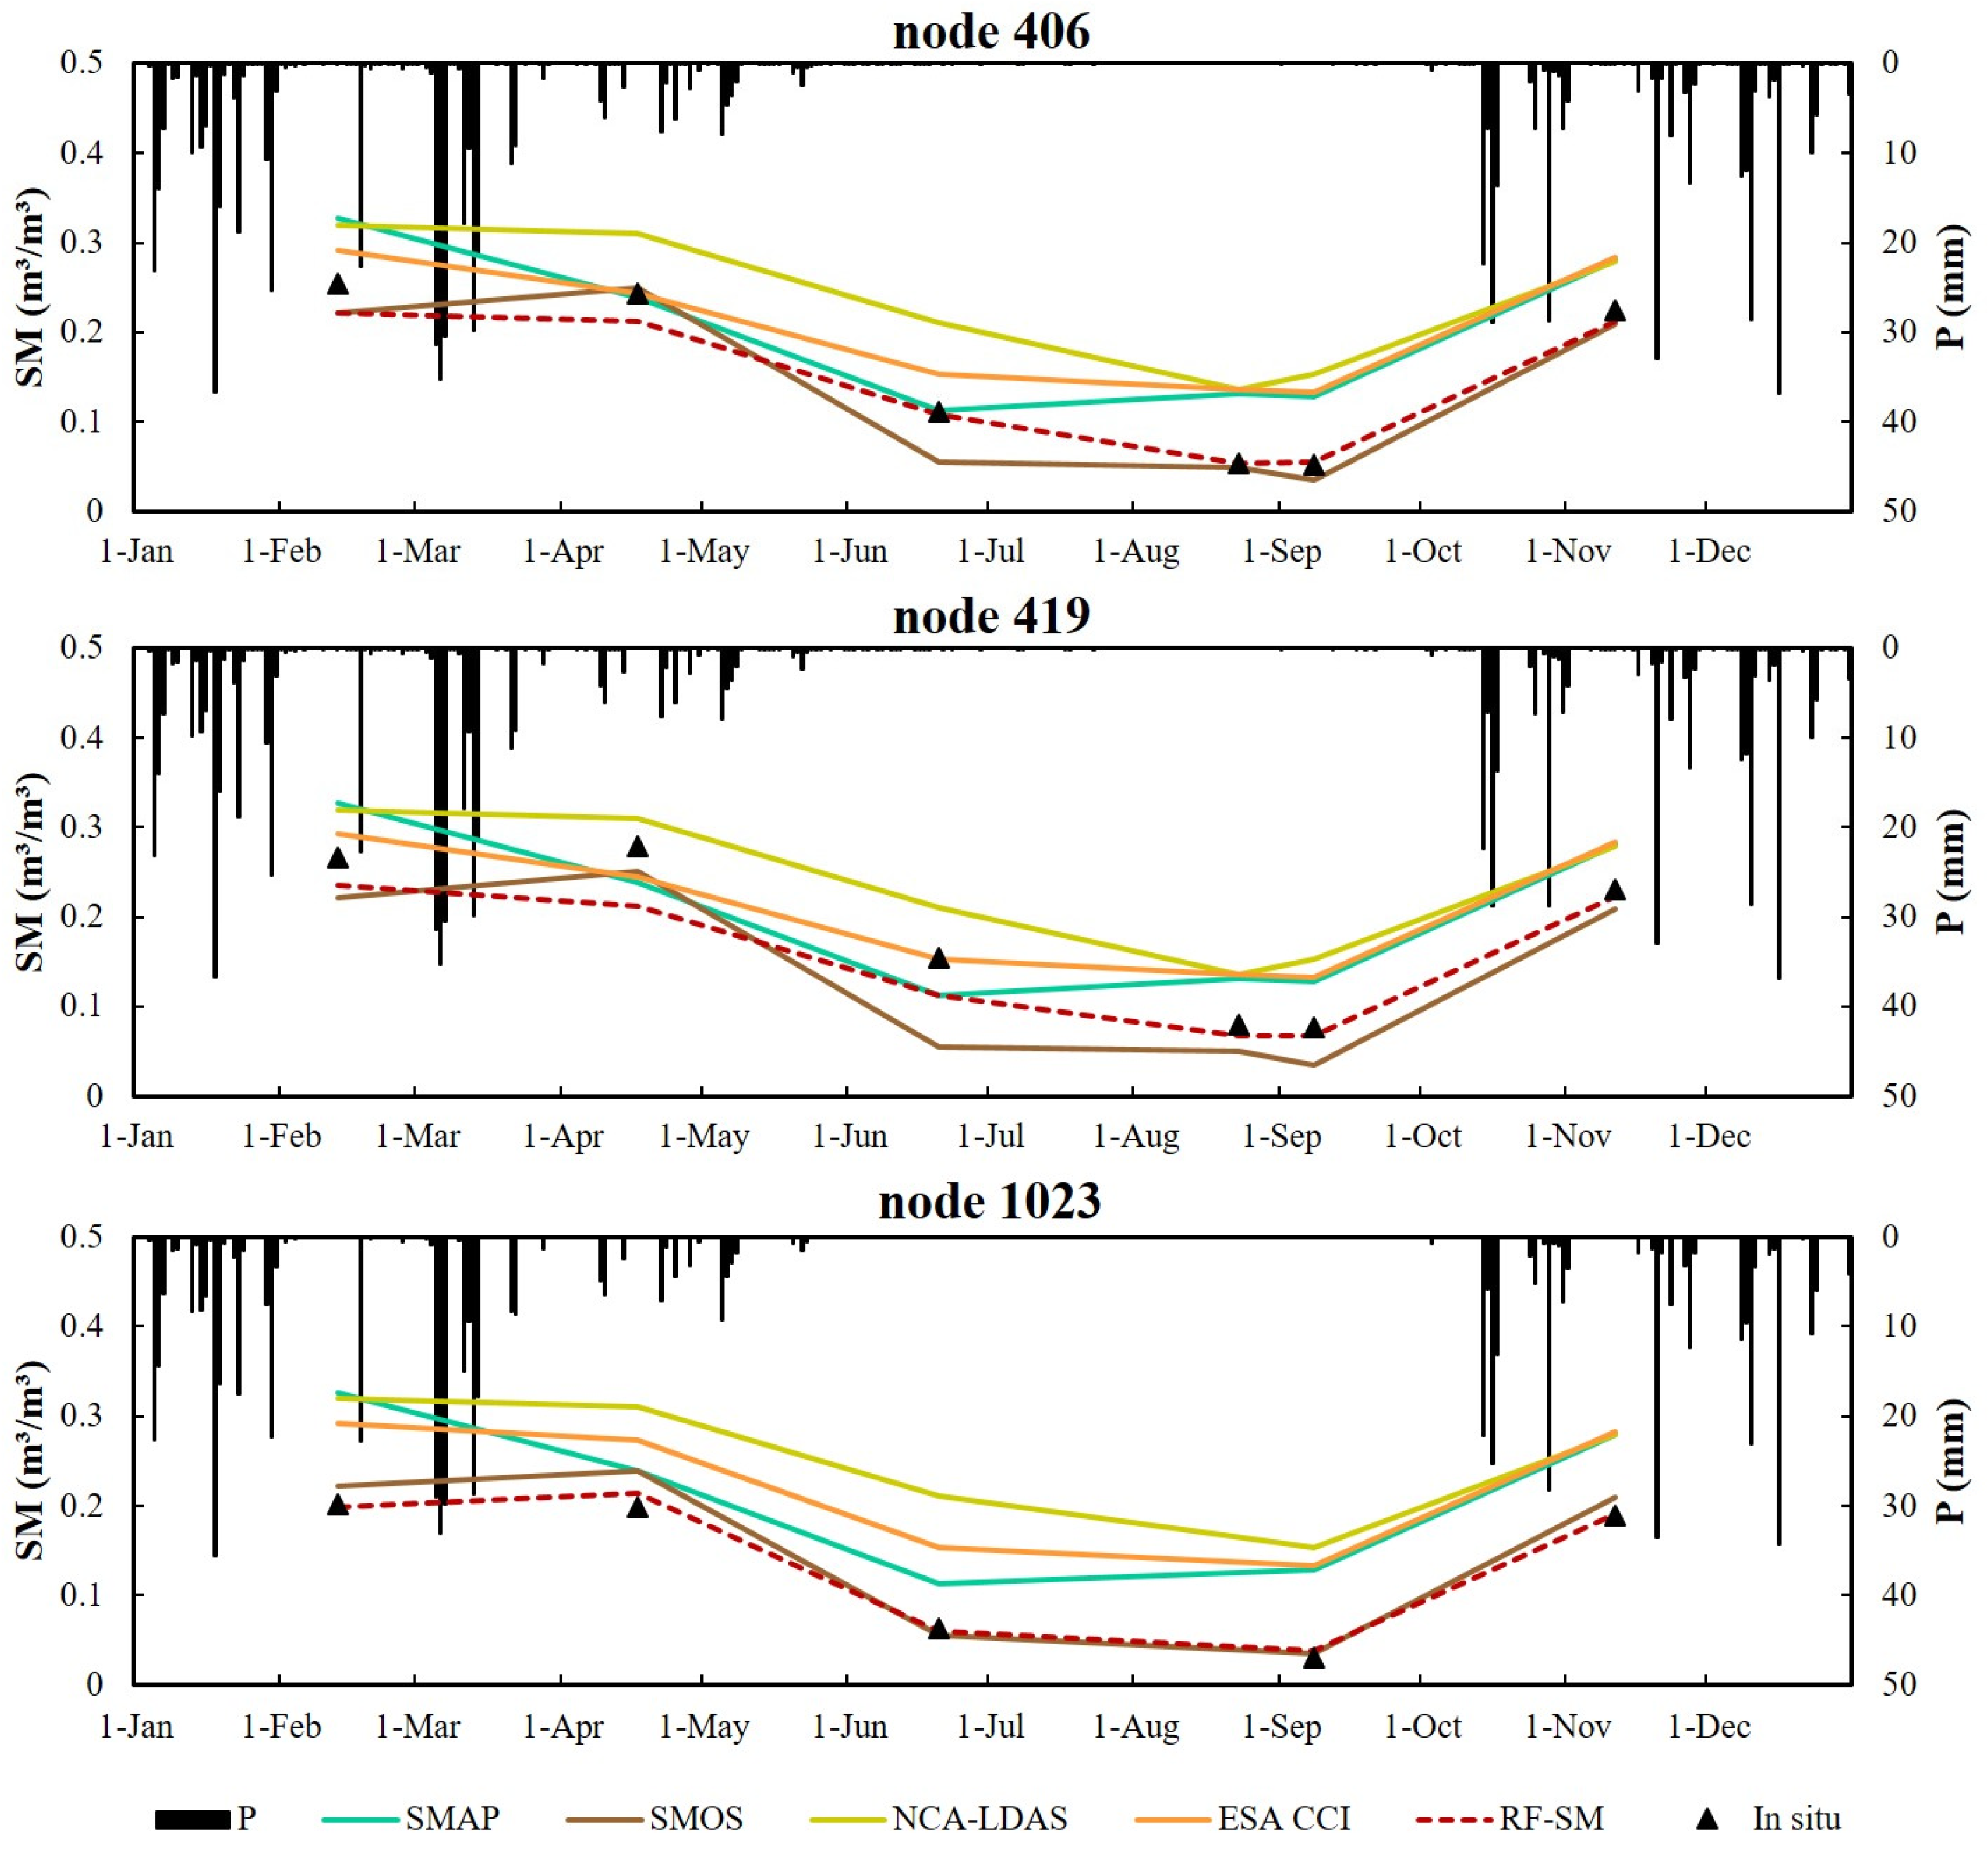
To further analyze the temporal variations of RF-SM, the line charts of SM derived from in situ measurements, microwave products, and RF-SM were plotted during 2016 at three representative stations in the substudy area (Figure 7). RF-SM could well capture the temporal variations in SM and respond to precipitation events. Although there is high consistency across all SM data in terms of trends, RF-SM efficiently simulated SM in summer and autumn, while coarse resolution products other than SMOS displayed significant overestimates. In addition, in regards to the overestimation of SMOS during the growing season and its underestimation under rainfall deficiency, RF-SM also improved in the integrated downscaling model using auxiliary variables.
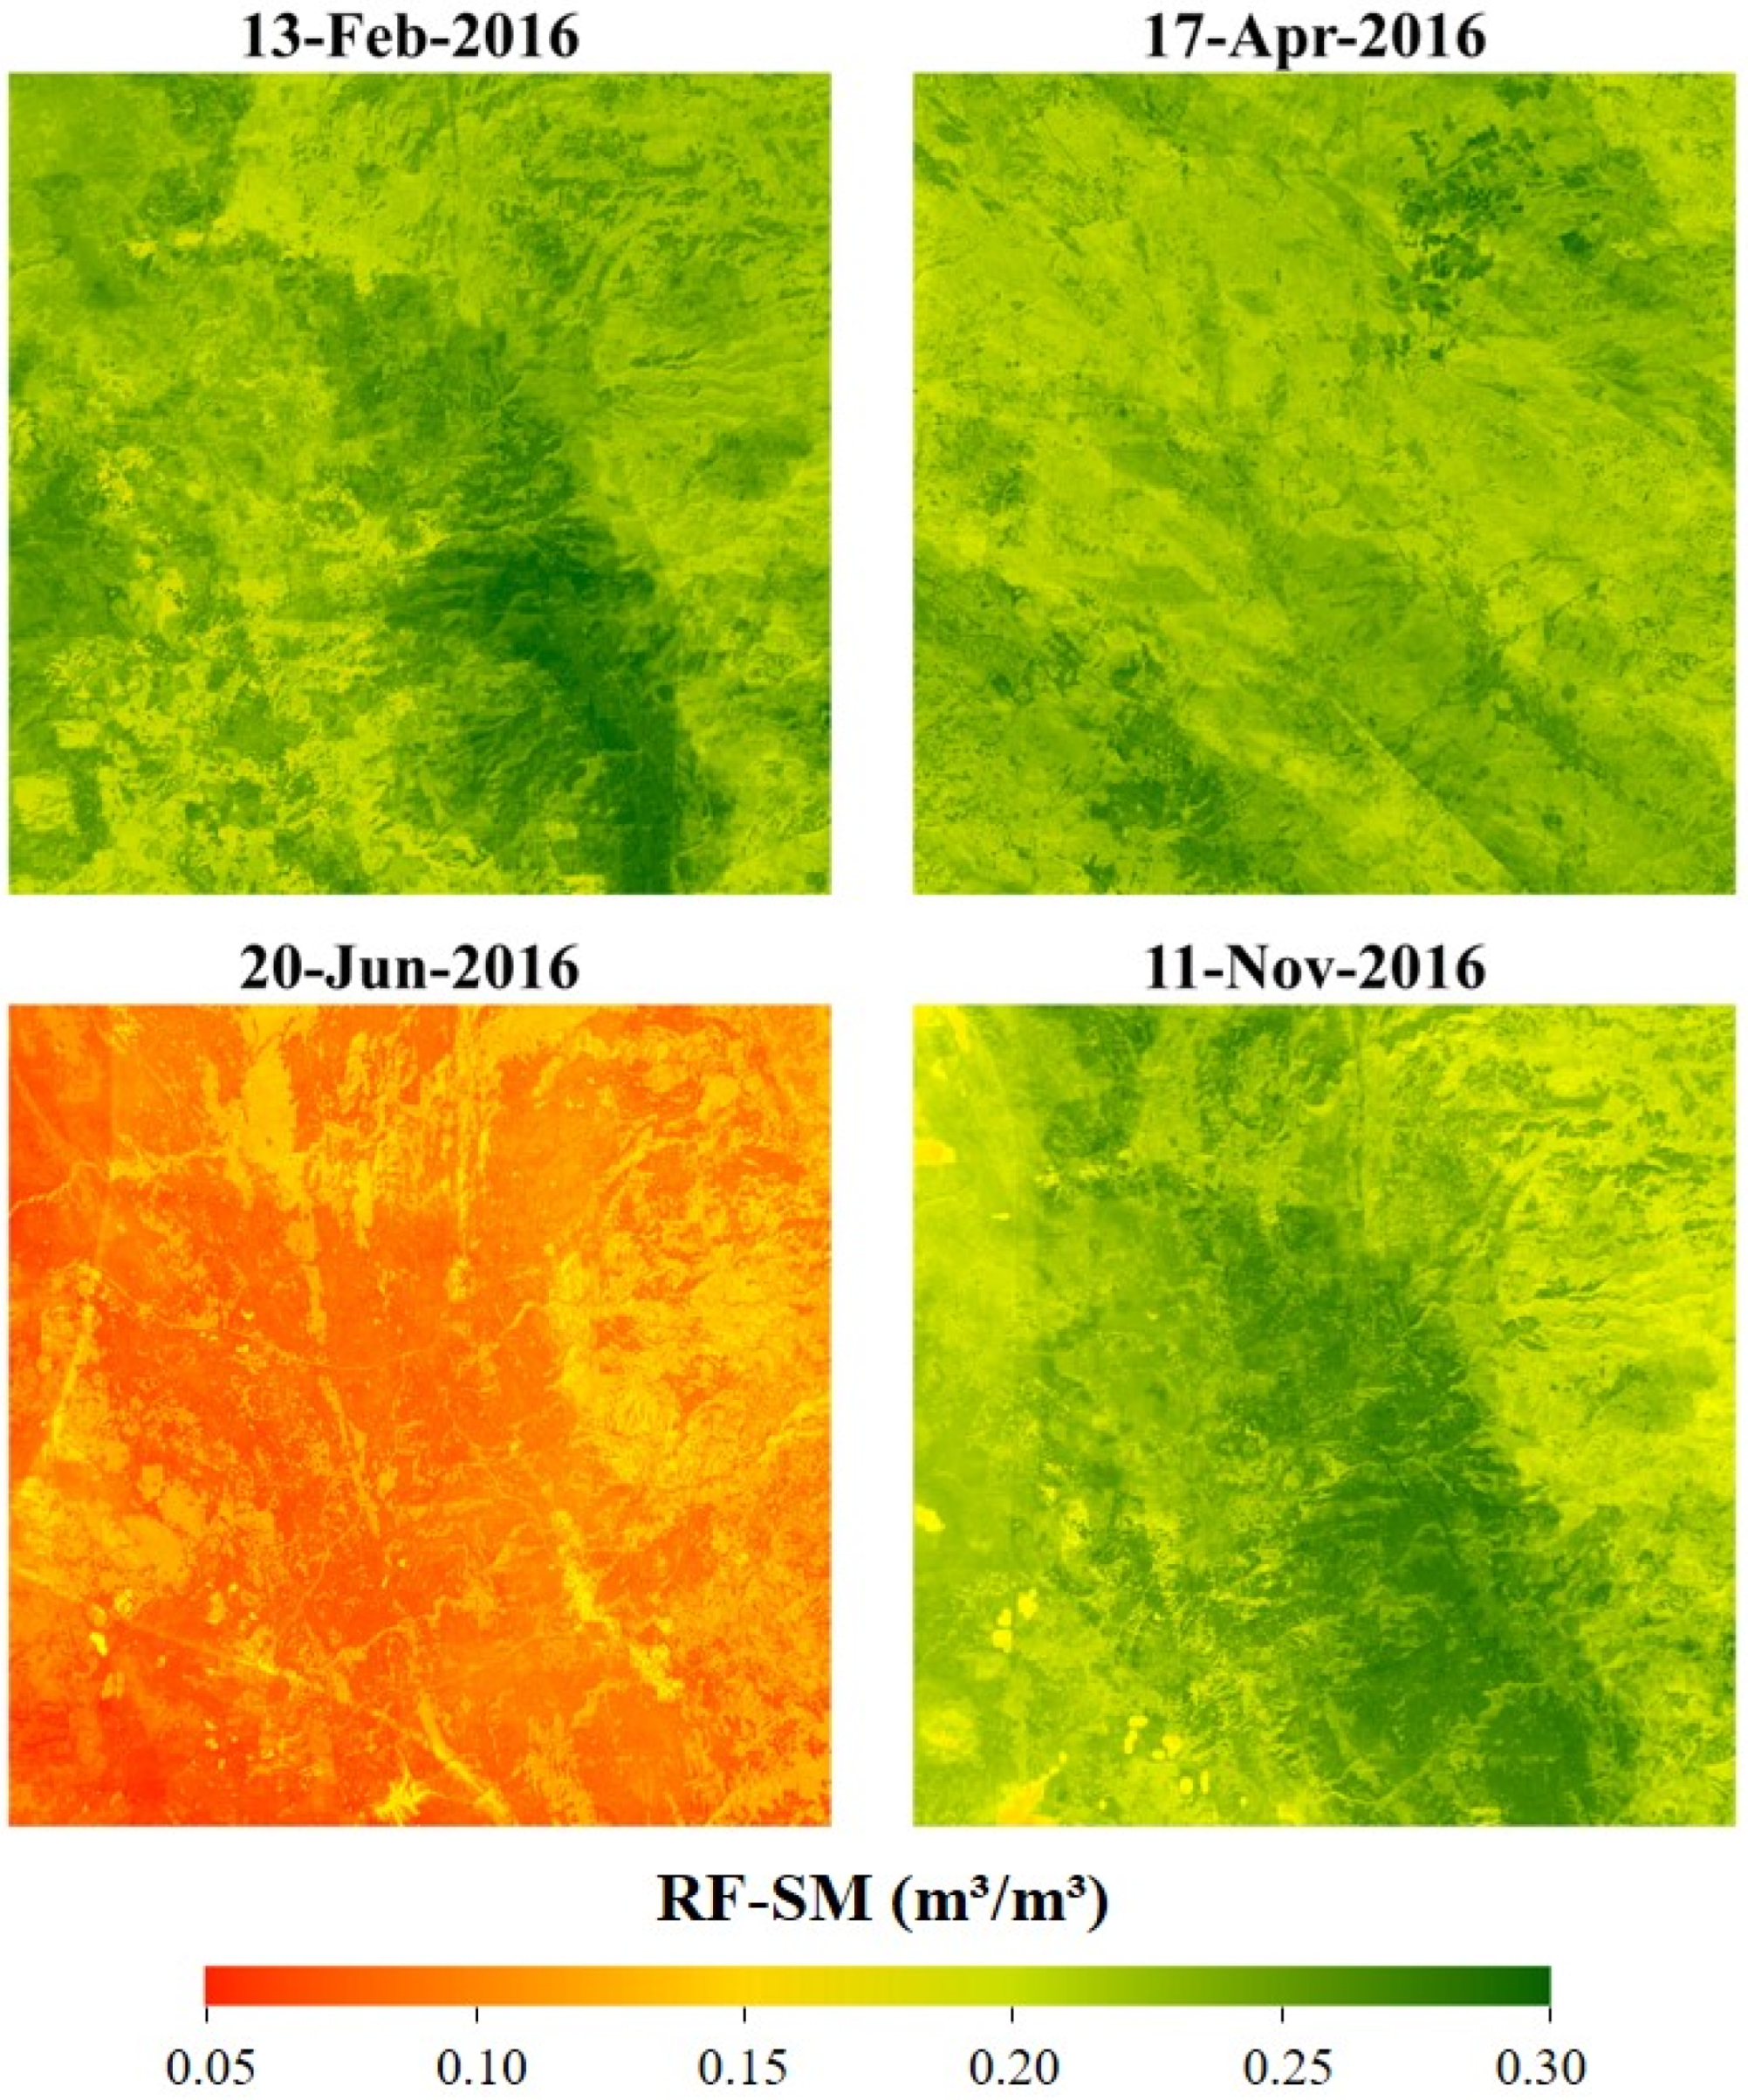
To discuss the performance of the spatial distribution evaluation in RF-SM, we mapped RF-SM in the substudy area during the four dates in 2016. Figure 8 showed the SM simulation capability for RF-SM at the field scale, clearly reflecting the spatial heterogeneity at 30 m × 30 m. Meanwhile, the spatial variation of SM was also affected by precipitation events, and the lowest SM value in the whole area on 20 June occurred in the summer drought period. The spatial features related to land cover types, such as higher SM levels in the center shrubland areas on 13 February and 11 November, and lower SM levels in the southwestern cropland areas on 20 June, which may be attributed to the varying degree of impacts of near-surface conditions, including precipitation and temperature, on ground vegetation, could be easily detected from the high-resolution SM maps.

3.2. Comparison between the RF-SM-SWDI and VHI

The SWDI derived from the RF-SM dataset (RF-SM-SWDI) and the VHI derived from the Landsat 8 data were calculated over the U.S. for 2016, and the two indices were subsequently compared for all 242 in situ stations in regards to the Pearson correlation coefficient (R). Figure 9 shows that the R values between the RF-SM-SWDI and VHI are greater than 0.5 at most stations in the western mountain areas and plateau basins, but below 0.2 at most stations in the Great Plains area and along the east coast of the U.S. Moreover, the R values were strongly influenced by the performance of the RF-SM dataset in the five ground observation networks (Figure 6), which exhibited obvious differences between the stations. The results from approximately 70% of the stations performed well (R ≥ 0.5), and those from more than 40% of the stations performed fairly well (R ≥ 0.7) in terms of the correlation between the RF-SM-SWDI and the VHI.
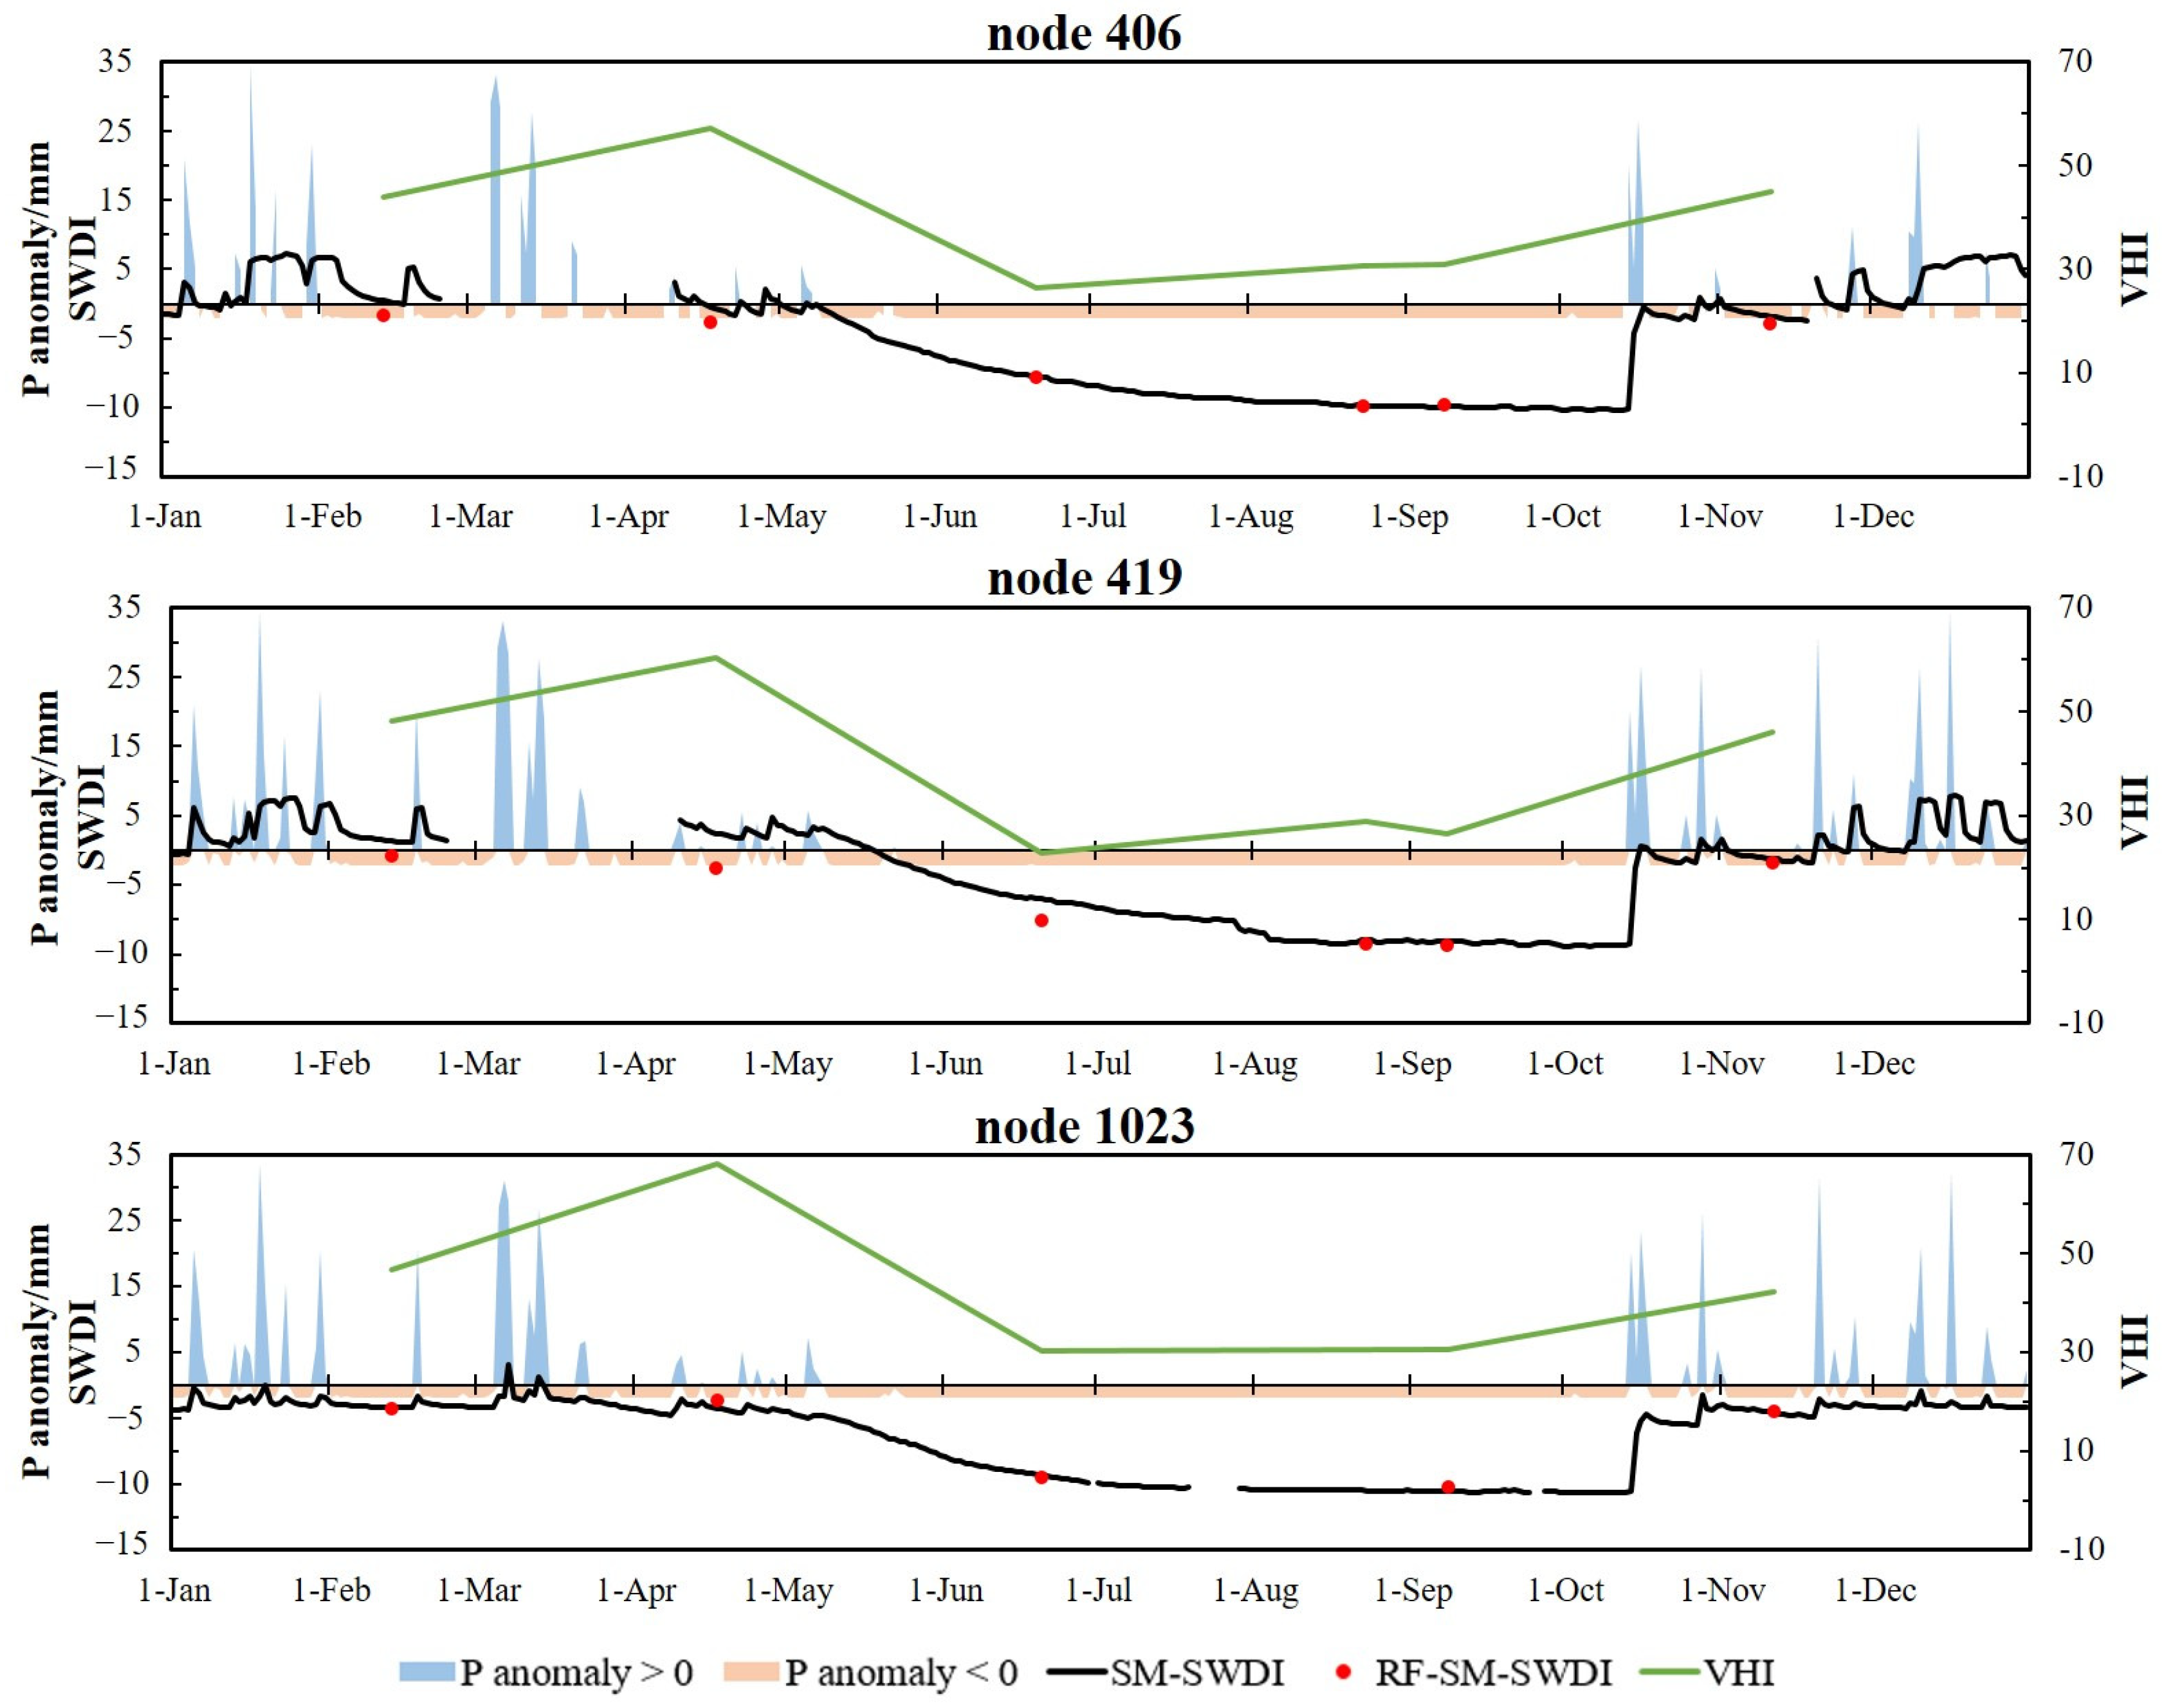
To analyze the temporal evolution of drought in 2016, we calculated the SWDI derived from the observations and the RF-SM data at the three representative in situ SM stations in the substudy area. Figure 10 shows the SWDI, based on in situ SM records (SM-SWDI) available throughout the year, and RF-SM-SWDI, VHI, and precipitation (P) anomalies extracted from the corresponding pixel values derived from the different datasets. The three stations all exhibited typical seasonal characteristics of wet and rainy springs and winters and dry and rainless summers and autumns. Drought occurred from May to November, and the drought severity increased (the SWDI remained below 0, and the VHI remained above 40), especially in September and October. Adequate rainfall in mid-October supplemented the SM deficit and notably relieved the drought. When comparing the different drought indices, the RF-SM-SWDI always agreed with the SM-SWDI, reflecting consistent drought conditions, and the method benefited from the highly accurate RF-SM data. In addition, the temporal variations of the VHI were also similar to those of the SWDI, with R values higher than 0.8 at all three stations.

3.3. Spatiotemporal Drought Monitoring at the Field Scale

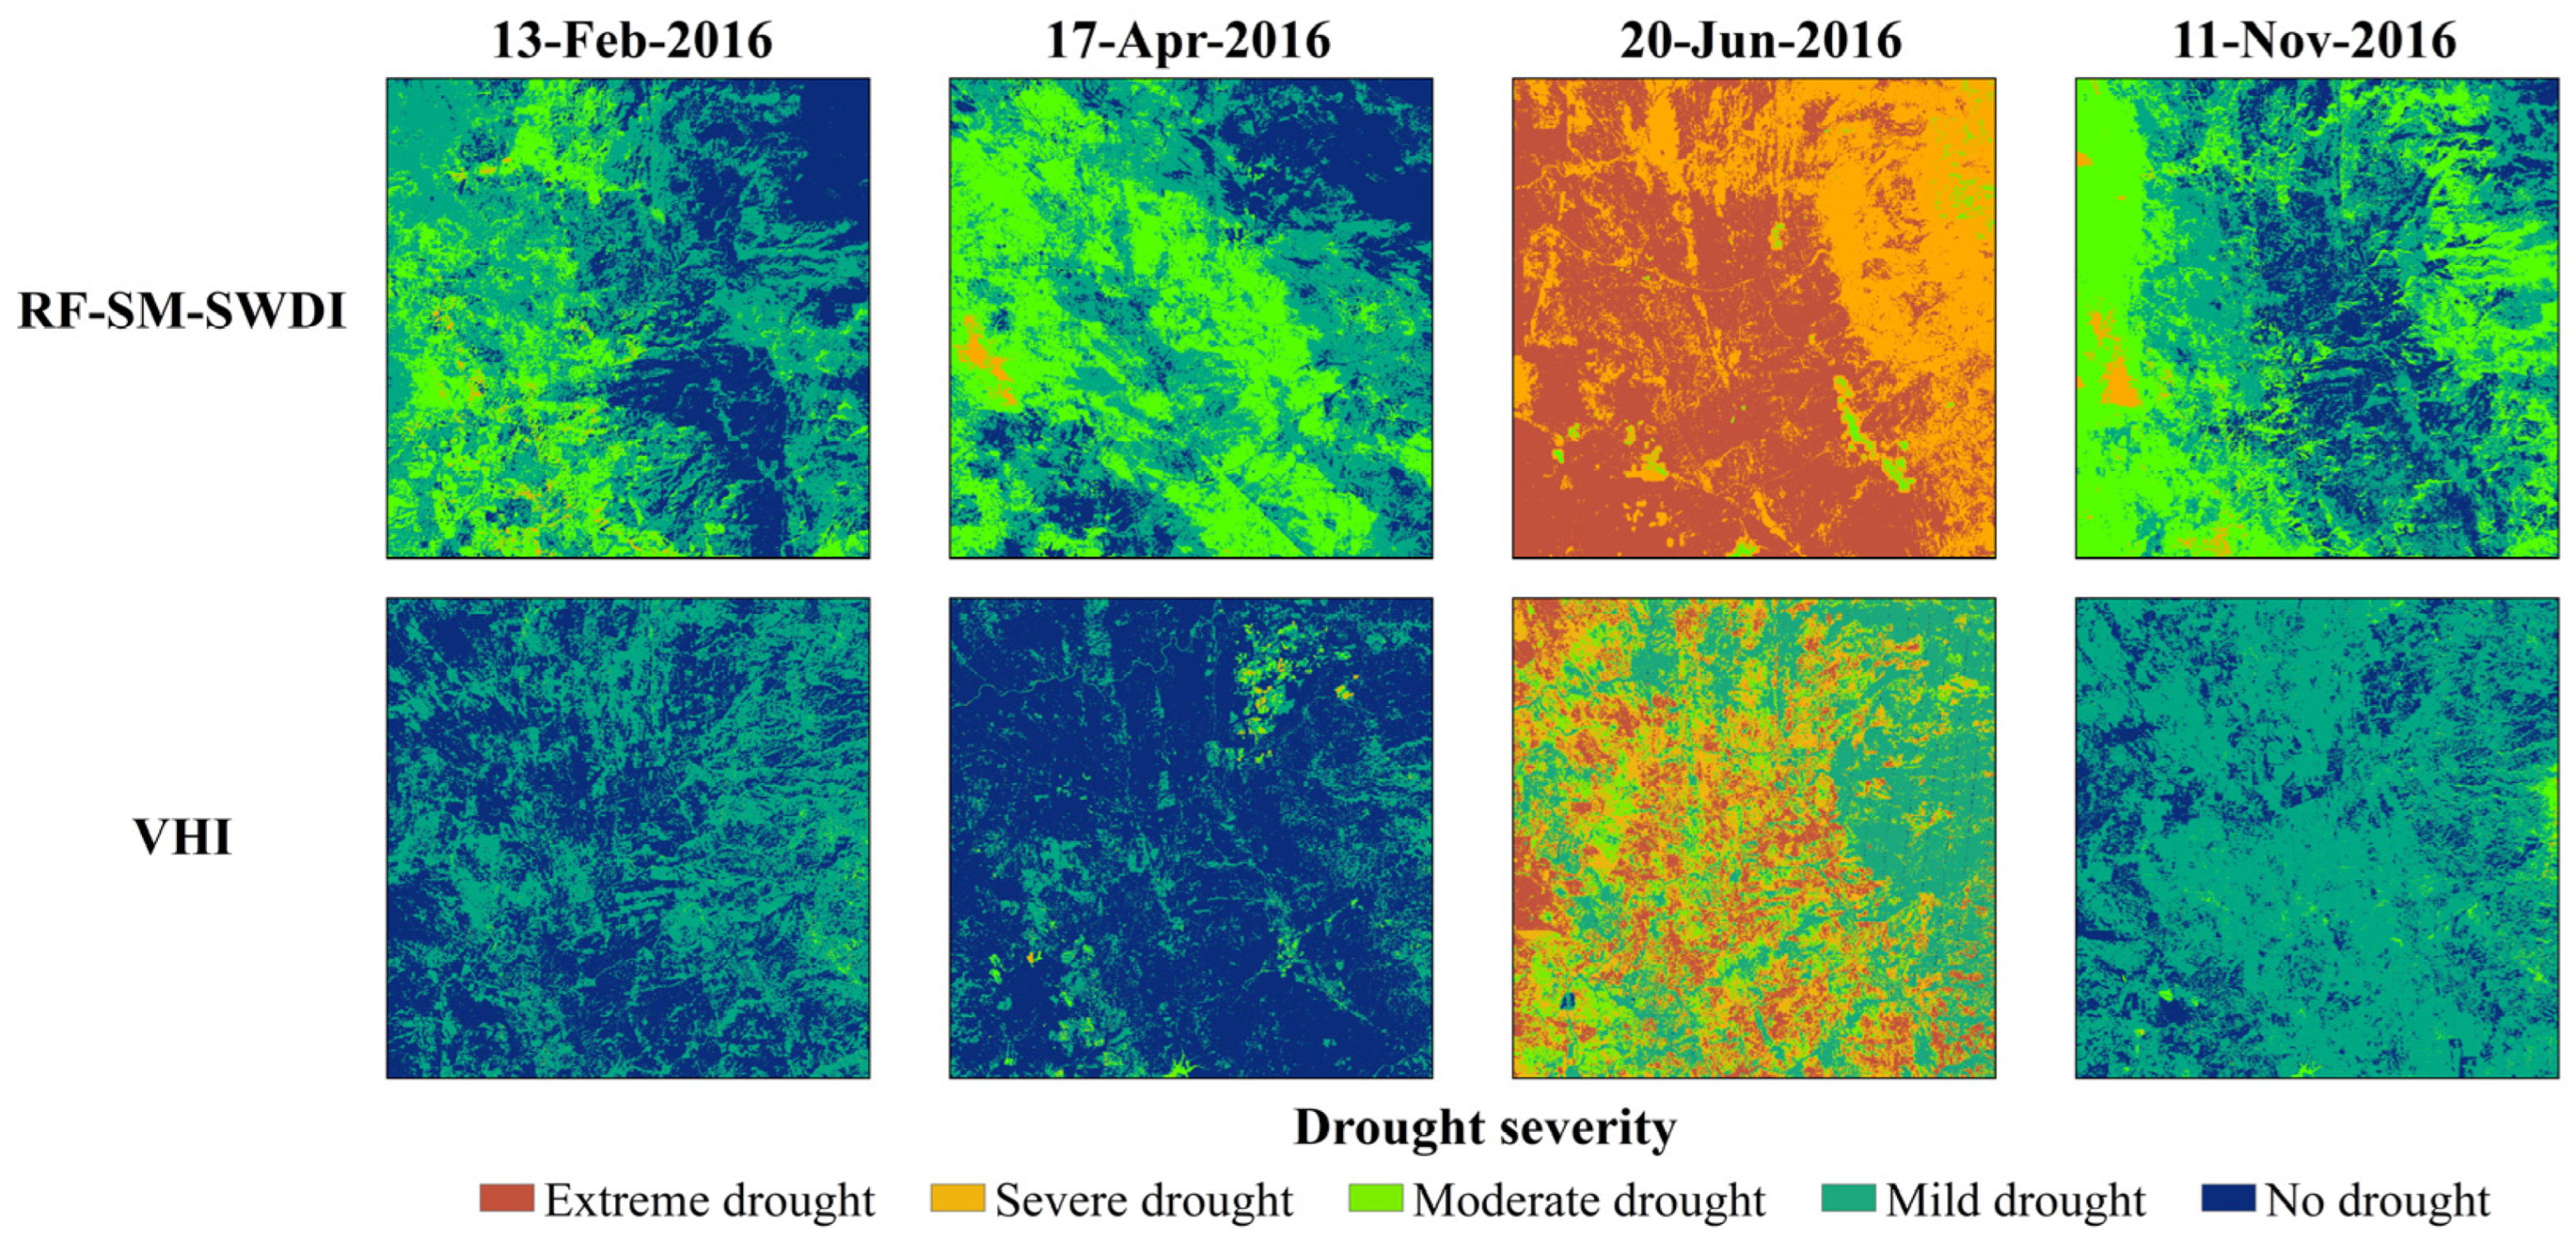
To achieve spatiotemporal drought monitoring at the field scale, we mapped the RF-SM-SWDI and VHI data at a spatial resolution of 30 m in the substudy area in 2016. Figure 11 shows that drought occurred in June, and the data revealed specific distribution patterns. According to the RF-SM-SWDI map, the frequency and severity of drought were low in the eastern forest areas, while the western and central grassland areas experienced mild to extreme drought. A few shrubland areas in the west revealed different drought areas from those of the surrounding locations, which may be influenced by inaccurate SM and soil hydraulic parameters. According to the VHI map, vegetation growth and surface temperature stresses only occurred in June and were correlated with the distribution of land cover types. Notably, there was mild drought in the forest areas with dense vegetation in the east, while moderate or even extreme drought occurred in the grasslands and shrublands in the western and central substudy areas. Moreover, the effect of the vegetation cover on the VHI was also notable during an unusual drought in the northeastern cropland areas in April, which may be related to crops exhibiting the early stages of growth.
In addition, Figure 12 shows the spatial distribution of correlation coefficients between the RF-SM-SWDI and VHI. There was a high correlation between these two drought indices in the substudy area, especially in the grassland cover areas (R > 0.7). Poor correlations (R < 0.2) occurred in the eastern and northern areas, possibly due to the complex topographic conditions, i.e., mountains and river valleys, as well as the vegetation conditions affecting the accuracy of the drought indices. Therefore, although both the RF-SM-SWDI and VHI provide evident potential for monitoring agricultural field drought, their consistency and differences should be further analyzed.

4. Discussion

4.1. Utility of Surface SM Metrics for Monitoring Drought

SM, which is mainly derived from rainfall, accounts for only 0.005% of the global water distribution [103] and is an important variable in meteorology, hydrology, and ecosystems [104,105]. Surface SM usually refers to water in the surface layer of the unsaturated soil zone [69]. This variable not only controls latent and sensible heat exchange between the surface and atmosphere [106,107,108], but also directly influences the exchange of trace gases on land [109], thereby regulating ecosystem dynamics and the terrestrial carbon balance [110,111,112].
Based on the work of Sehgal et al. (2017), drought response analysis of an in situ SM dataset for different soil layers showed that the surface SM is sensitive to short-term variations in the water regime caused by evaporation [113,114]. There is a strong interconnection between surface and root zone SM levels in soil hydrological processes such as infiltration and transport, resulting in severe SM stress in deeper soil profiles when surface soil is persistently deficient in water [115,116]. Qiu et al. (2014) used ten years of SM observations derived from the SCAN network to examine the impact of the vertical measurement depth on mutual information using NDVI anomalies, which indicated that surface SM can effectively duplicate the SM information content at a depth of 60 cm and suitably reflect the variability in vegetation [51]. It was suggested that the shallow penetration depth of microwave-based surface SM retrievals is no longer a major limitation for agricultural drought monitoring [117]. Moreover, SM and precipitation achieve a positive feedback mechanism in which dry soils limit precipitation and lead to even drier soils via atmosphere–land coupling [118,119], which is important for predicting extreme precipitation events and analyzing drought evolution in areas notably controlled by surface SM [120,121,122]. Therefore, surface SM exhibits certain agronomic significance and high application potential in short-term agricultural drought monitoring [123].
Furthermore, unlike the coarse grid of SM products, RF-SM enables fine agricultural drought monitoring at a higher spatial resolution. In the downscaling model, the introduction of SM products is critical. SMAP and SMOS, as representative products of L-band, have been proven in previous studies to exhibit comprehensive performance in medium vegetation cover areas [124,125], while NCA-LDAS and ESA CCI display higher spatial resolution based on multi-product fusion, which makes SM disaggregation more accurate at a fine scale [69]. Reflectance and ST variables from Landsat 8 are scale references for downscaling models, in which red band, NIR band, and ST are important for retrieving SM and related surface parameters [73], while the two SWIR bands can promote the development of SM indices by responding to water absorption [126]. Soil properties are the internal factors driving the spatial heterogeneity of SM, affecting the dynamic of surface SM by controlling water infiltration [127] and characterizing the SM variation in more detail under wet conditions [128]. Meteorological stress variables affect surface SM through the process of the land–air interaction [129]. Although their contribution is weakened due to the limitation of the coarse grid, the consideration of meteorological information helps to explain the SM variation under more complex conditions from the perspective of the water cycle [130]. Therefore, in collaboration with multiple datasets, RF-SM provides a highly accurate surface SM dataset, with reasonable representation at 30 m spatial scale.

4.2. Performance of the RF-SM-SWDI

This study focused on applying a typical index (SWDI) reflecting the distribution and temporal evolution of agricultural drought, which requires SM and soil properties and makes use of 30 m downscaled SM data derived from the RF model to achieve high-resolution drought monitoring at the field scale. Integrating multiple datasets through machine learning algorithms, the RF-SM dataset retains the advantages of the existing datasets (satellite-based products: SMAP, SMOS, and ESA CCI) and model-based products (NCA-LDAS) [131] in regards to accuracy and disaggregates SM in the original coarse grid on a finer scale, further meeting the monitoring and management needs for a small geographic area [132].

4.2.1. Comparison between the RF-SM-SWDI and VHI

Both the SWDI and VHI are important indices for drought monitoring and severity assessment [68]. On the basis of existing theories, the SWDI adopts the field water capacity ( θ F C ), which is considered to be the upper limit of the available water for crops [133], as the limit when the soil begins to be subjected to water stress by introducing information on soil properties. This suggests that once the SM content falls below θ F C , the optimal state for the growing environment will be disrupted, triggering a test of the ability of crops to take up water [61]. Moreover, the VHI severs as an indicator of the occurrence and severity of drought through the characterization of crop physiological conditions in the visible and near-infrared bands and the characterization of the canopy temperature in the thermal infrared bands [134], providing a reliable foundation for its application in agricultural drought monitoring [135].
Compared with the VHI, the RF-SM-SWDI showed substantial differences in the results for both the distribution and temporal variations. On the one hand, the correlation between the RF-SM-SWDI and VHI was poor in the forest area located in the eastern substudy area, which may have been affected by two factors. One is that the two drought indices are derived from different satellite sensors. The calculation of the RF-SM-SWDI and accuracy of the RF-SM data are closely related to the SM products derived from passive microwave remote sensing, and the ability of these sensors to penetrate clouds and fog is much greater than that of optical remote sensing products that generate the VHI [136]. Moreover, the error caused by the attenuation of microwave emissions from the vegetation to the soil [137] has been greatly improved in the RF-SM dataset [138], while the VHI mainly reflects canopy information [139], increasing the likelihood that vegetation health conditions are misrepresented. Another factor is that drought-resistant forests develop root systems that can absorb water in deeper soil layers to maintain vegetation health when SM is deficient [63]. Thus, the low correlation between the vegetation condition component of VHI (i.e., VCI) is particularly evident in forest areas (Figure 13a). On the other hand, the VHI was proposed with the underlying assumption that there is a negative correlation between the NDVI and LST; that is, the LST increases when drought occurs, while the NDVI decreases under stress [140]. There was a notable correction between the TCI and RF-SM-SWDI (R > 0.5) in most of the substudy area (Figure 13b), suggesting that the response of the temperature conditions to SM changes occurred faster than that of the vegetation conditions. Based on the temporal variation in the SWDI at the observation stations (Figure 10), a quick response to precipitation occurred, resulting in fluctuations in spring and winter that are consistent with the short-term heavy rainfall events. This instability may be responsible for the relatively obvious variation in the spatial distribution of the RF-SM-SWDI on different dates. Furthermore, the coupling relationship between the LST and surface SM has been confirmed in numerous studies [141,142,143], resulting in TCI achieving high correlation with SWDI, thus realizing the consistency between VHI and RF-SM-SWDI in regards to drought monitoring.

4.2.2. Spatiotemporal Consistency of Drought Monitoring

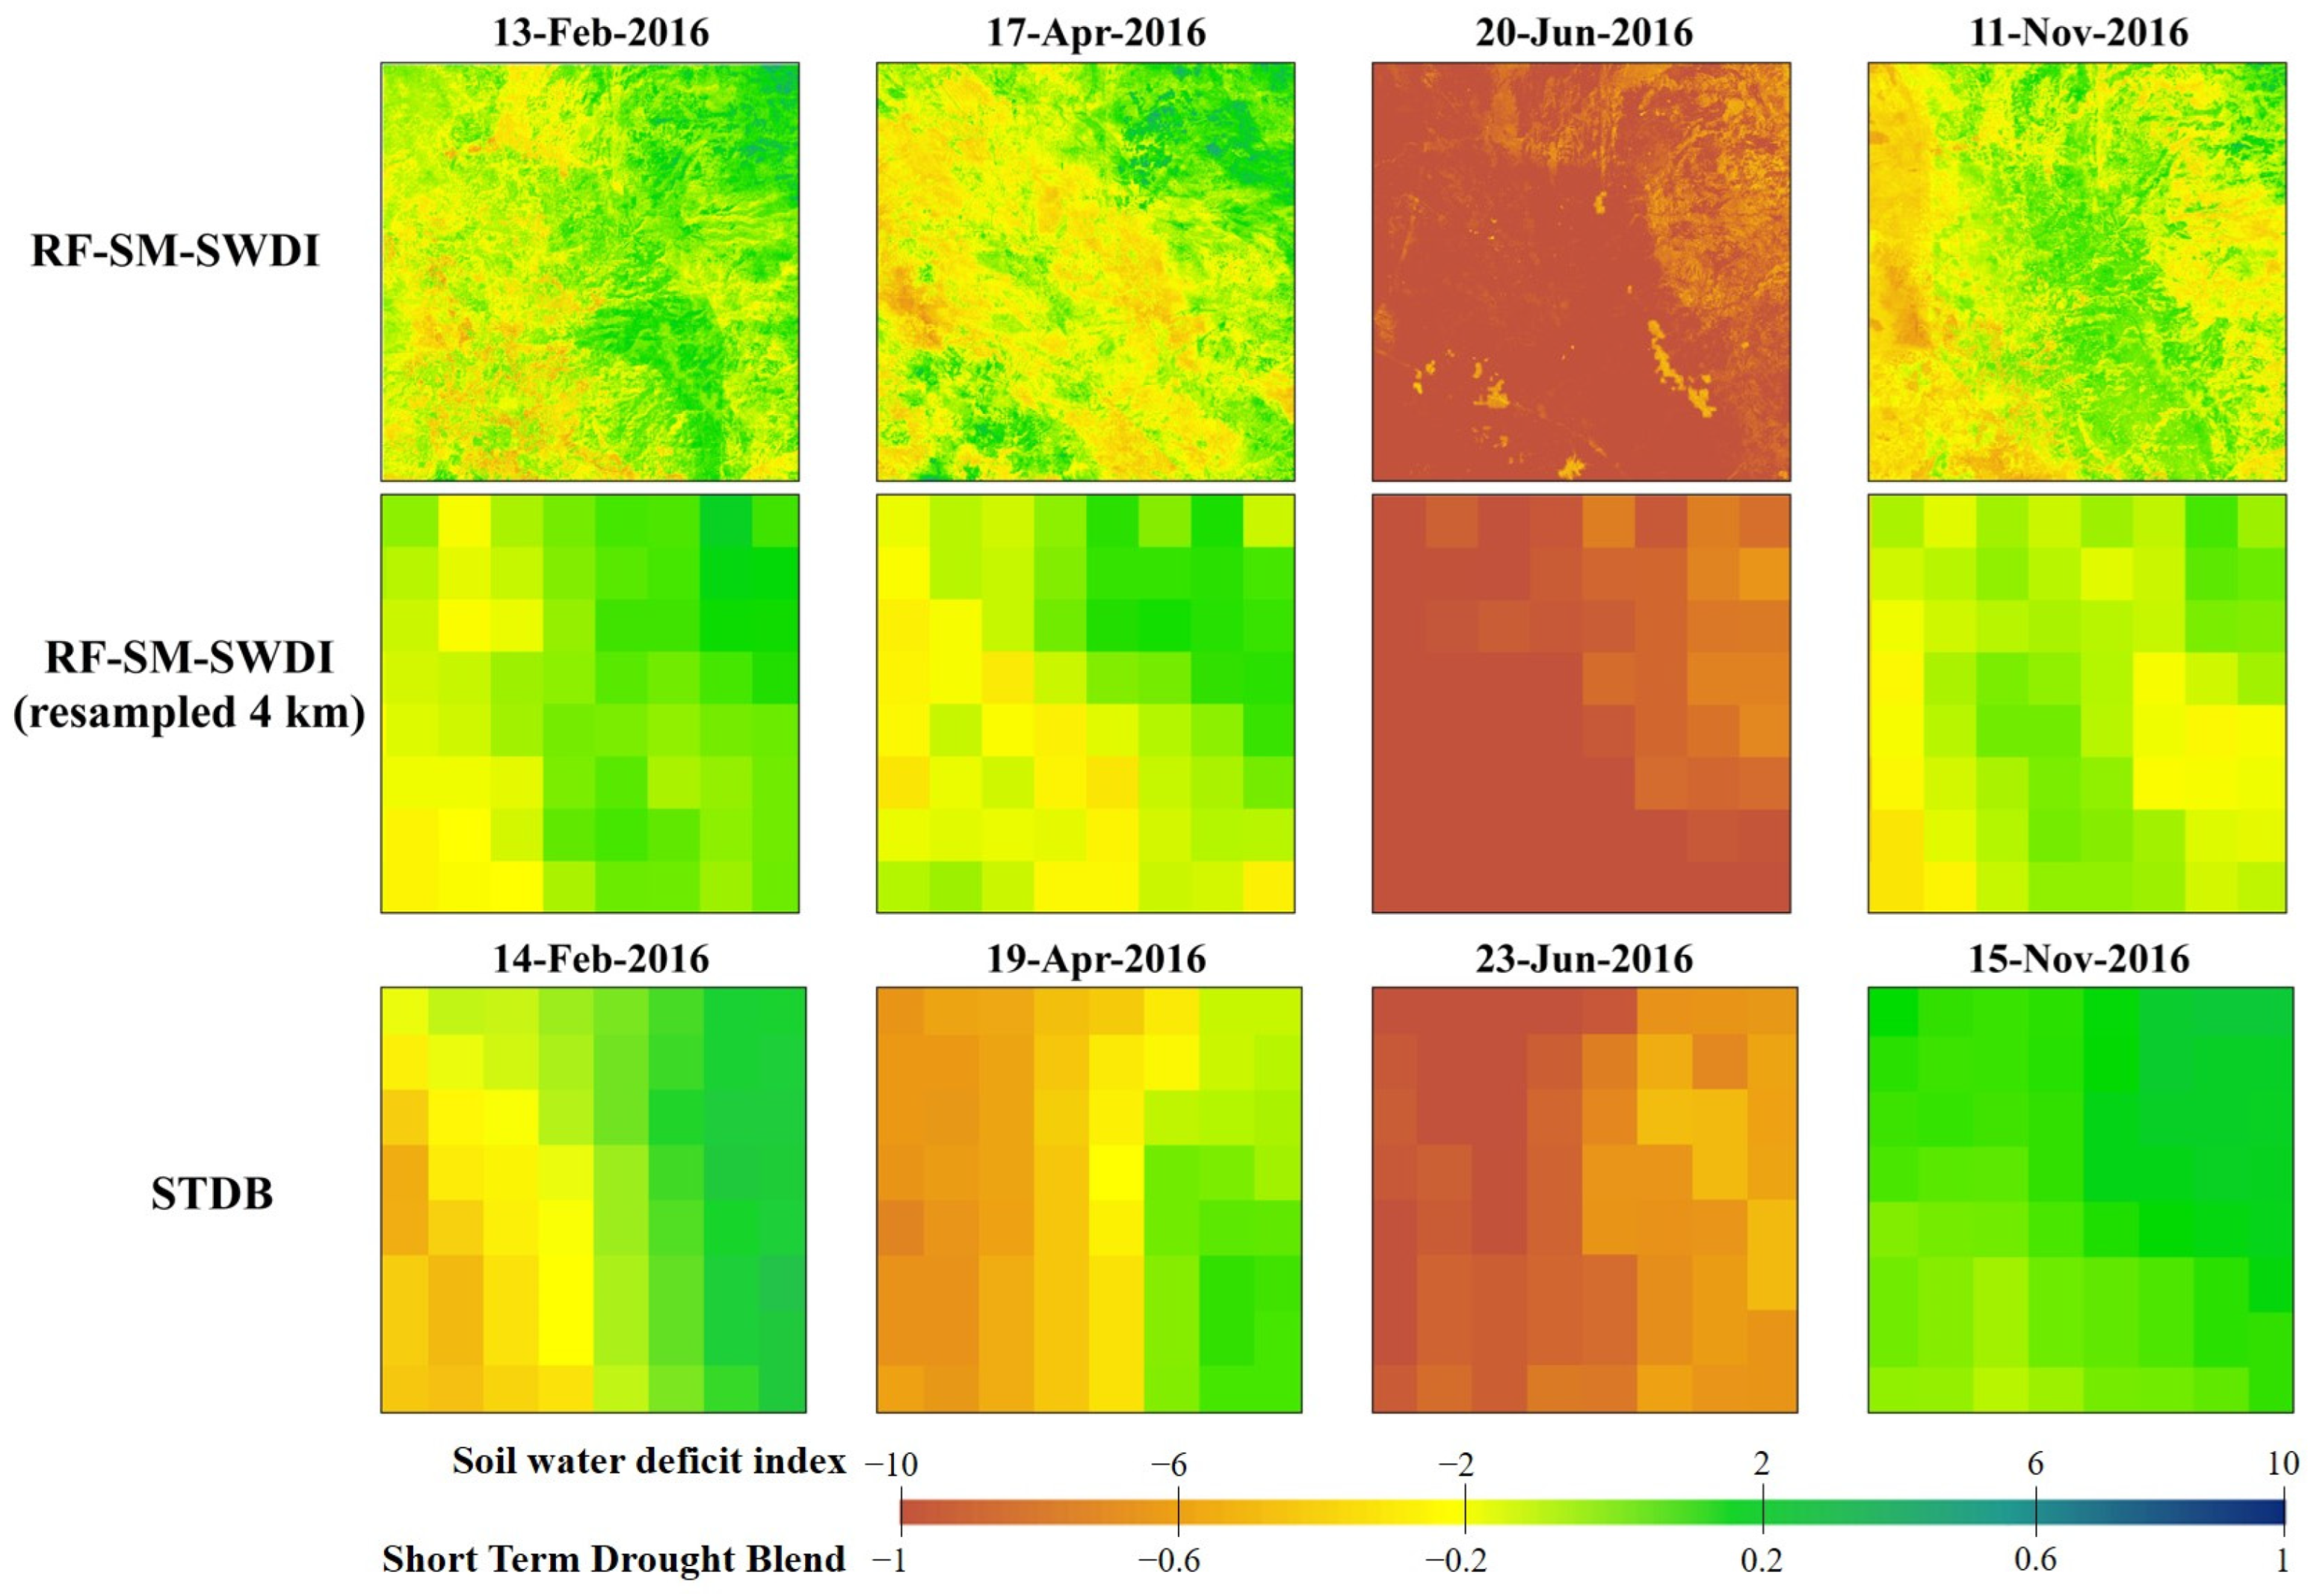
The occurrence of agricultural drought is often complicated by hydrological [2], meteorological [36], and physiological [11] factors that are difficult to monitor immediately and exhaustively in space and time. A universal multi-indicator weighted “blended approach” has been developed through coordinated monitoring efforts at the country level to address the limitations of a single index for a particular region and a particular drought event [144]. As one of the first entities to use hybrid indicators, the U.S. Drought Monitor (USDM) was founded in 1999 for assessing drought conditions across the U.S. [145]. With the development of gridded surface meteorological (gridMET) datasets [146], high-resolution (4-km) drought indices for the contiguous U.S. from 1979 to the present were produced by the University of California Merced and computed by the Climate Engine platform (https://app.climateengine.org/climateEngine (accessed on 20 December 2023)). The combination of these drought indices for short (ranging from several days to several weeks) and long (ranging from a few months to a few years) periods could provide targeted services to decision makers in different fields [147]. In this study, we used the short-term drought blend (STDB) variable from the gridMET Drought dataset, which combines PDSI (20%), 30-day SPI (20%), 90-day SPI (25%), and ZIND (35%), based on the professional judgment of drought experts for consistency analysis of drought monitoring by the RF-SM-SWDI.
Since the STDB dataset is updated every 5 days, representative drought monitoring maps at corresponding time intervals were selected for comparison (Figure 14). According to the comparison between the two indices at a grid scale of 4 km, the four days of drought severity in the substudy area exhibited a consistent trend of gradual decrease from west to east, which basically coincides with the RF-SM-SWDI results, particularly in regards to the drought maps of February and April. In addition, the extent of drought increased to the east, the drought severity increased from February to June, and the drought was relieved by precipitation in late fall, resulting in no or mild drought in the middle of November. The substudy area is located in the Mediterranean climate zone near the west coast of the continental U.S, characterized by cold and humid winters but hot and arid summers [148]. Encouragingly, the inevitability and severity of summer drought events [149] are reflected by the RF-SM-SWDI, VHI, and STDB. However, Figure 14 shows that the drought conditions in winter and spring (before May) are more serious than those in autumn (after October), which is not suitably reflected in the drought maps of the RF-SM-SWDI, especially in the western and southeastern areas of the substudy area, where the drought severity in mid-November was actually shown to increase. Moreover, a survey by the USDM of the counties primarily covered by the substudy area (Amador County and Sacramento County) also revealed extreme drought conditions during the first half of 2016 (https://droughtmonitor.unl.edu/DmData/TimeSeries.aspx (accessed on 20 December 2023)). This result was due to multiyear precipitation deficiencies and anomalously warm temperatures culminating in 2016, and these conditions were improved by the abundant precipitation received in the winter of 2016–2017 [150]. Therefore, the RF-SM-SWDI could yield a convincing spatial pattern, but there are still weaknesses in terms of the representation of the evolution of drought over time.

4.3. Issues of Drought Monitoring with High Spatial Resolution

Based on RF-SM-SWDI, this study achieved agricultural drought monitoring at a high spatial resolution of 30 m, which compensates for the lack of coarse grids containing composite SM and crop signals associated with terrestrial and atmospheric conditions. With the advances in remote sensing technology, the development of data fusion methods [78], and even hyper-resolution sensors [28], will provide more detailed information on the occurrence and evolution of drought. The RF-SM dataset not only fulfills the need to identify and assess the severity and extent of drought at the field scale, but also, more importantly, introduces various drought-related variables (e.g., spectral reflectance, LST, and precipitation) into the fusion process, providing reliable supporting data for computing relevant drought indices. Further, fine monitoring using a 30 m spatial resolution contributes to the differentiation of crop types and the management of water and land resources [151,152]. Therefore, the RF-SM-SWDI has the potential to become an effective reference tool for agricultural regionalization and policy formulation at the county level.
Due to the inevitable constraints, our study must still be improved upon for practical applications. First, it is difficult to track and monitor drought evolution with coordinated temporal resolution because the availability of RF-SM data is limited by the cloud state of the optical remote sensing dataset and the scanning mode of microwave remote sensors. The application of data fusion [153] and data assimilation [154] methods could help to generate both spatially and temporally continuous SM datasets in future research. Second, the RF-SM-SWDI yielded satisfactory spatial heterogeneity at small scales and exhibited differences in the impacts of microclimates on the severity of drought, but drought occurrence did not follow the defined scale [155]. It is necessary to comprehensively establish additional spatial units, such as climate divisions and crop districts, to achieve agricultural drought monitoring and early warning of drought conditions [156]. Finally, in addition to soil properties and land cover types, the analysis of topography, vegetation phenology, and agricultural management practices, such as irrigation, should be considered for accurate high-resolution agricultural drought monitoring and assessment [157].

5. Conclusions

In this study, two drought indices at a 30 m spatial resolution, the RF-SM-SWDI, which was calculated using an SM downscaling framework derived from multiple datasets, and the VHI, which was calculated using optical remote sensing dataset obtained by Landsat 8, were utilized to monitor agricultural drought conditions over a small geographic area in the U.S. in 2016. To conduct a comprehensive assessment, the RF-SM data was first evaluated based on in situ observations, and the RF-SM-SWDI was then compared with the VHI in terms of monitoring the drought distribution and evolution. In conclusion, the RF-SM-SWDI, with a high spatial resolution, could be a promising tool for drought monitoring, mainly due to the following:
(1)
The RF-SM dataset yielded better performance results than the four single SM products when compared with the observed SM at in situ stations, whether based on different land cover types or ISMN networks. When the utility of surface SM in agricultural drought monitoring is recognized, RF-SM data exhibit significant value in capturing drought conditions driven by SM because of their high spatial resolution.
(2)
The SWDI relies on SM estimation and corresponding soil hydraulic parameters, which effectively overcomes the limitations of drought research over certain time periods. The RF-SM-SWDI exhibited a favorable correlation with the VHI at approximately 70% of the stations. Further comparison of the substudy area showed that the coupling of the LST and SM produced a strong correlation between the TCI and SWDI, while the changes in vegetation conditions caused a significantly different spatial patterns for the VCI and SWDI, which ultimately affected the difference in the distribution and temporal variations of the RF-SM-SWDI and VHI related to the land cover types.
(3)
The RF-SM-SWDI provided data for drought conditions which included more detailed spatial information and demonstrated the seasonal evolution and patterns of the different land cover types. Compared with the results of the STDB, the RF-SM-SWDI recognized Mediterranean climate characteristics in the substudy area, accurately monitoring summer drought events and drought mitigation in winter, which made it possible to achieve real-time monitoring of short-term and flash droughts at the field scale.
(4)
Due to the limitations of the available datasets, the application of RF-SM-SWDI exhibits some difficulties in long-term agricultural drought monitoring on a larger geographical scale. Therefore, advanced data fusion and data assimilation technology, along with more drought-related surface information, will help to accurately analyze drought distribution and track drought evolution.
In the near future, we expect spatiotemporal SM datasets, with a high resolution, to be generated and applied in agricultural drought monitoring, resulting in meaningful indices. More importantly, accurate data regarding the extent and evolution of drought at multiple levels could be used in controlling the spread of drought, mitigating severe consequences, supporting agricultural policies and management practices, and ensuring crop yield and economic benefits.

Author Contributions

Conceptualization, Y.Y. and Y.L.; methodology, J.N.; software, R.Y.; validation, L.L., J.F. and L.Z.; formal analysis, Z.X.; investigation, J.X.; resources, B.J. and Y.L.; data curation, J.N.; writing—original draft preparation, J.N.; writing—review and editing, J.B.F.; visualization, X.Z. (Xiaotong Zhang); supervision, X.Z. (Xueyi Zhang); project administration, Y.Y.; funding acquisition, Y.Y. All authors have read and agreed to the published version of the manuscript.

Funding

This research was funded by the Natural Science Fund of China, under grant numbers 42192581, 42192580, and 42171310.

Data Availability Statement

The data presented in this study are available on request from the corresponding author. The data are not publicly available due to privacy considerations.

Acknowledgments

The in situ SM dataset was provided by the International Soil Moisture Network (https://ismn.geo.tuwien.ac.at (accessed on 15 June 2023)). Landsat 8 optical and thermal observations, provided by United States Geological Survey, were obtained online (https://earthexplorer.usgs.gov, accessed on 20 May 2023). The SoilGrids V.2.0 dataset was obtained from ISRIC (https://soilgrids.org (accessed on 10 November 2023)). The ERA5 reanalysis dataset was obtained from Copernicus Climate Change Service (https://cds.climate.copernicus.eu (accessed on 7 November 2023)). The SMAP product, provided by National Snow and Ice Data Center, was obtained online (https://nsidc.org/data/smap (accessed on 11 November 2023)). The SMOS product, provided by Centre Aval de Traitement des Donn’ees SMOS, was obtained online (https://www.catds.fr/Products/Available-products-from-CEC-SM/SMOS-IC (accessed on 14 November 2023)). The ESA CCI product, provided by the European Space Agency, was obtained online (https://www.esa-soilmoisture-cci.org (accessed on 20 November 2023)). The NCA-LDAS product, provided by NASA, was obtained online (https://disc.gsfc.nasa.gov (accessed on 2 December 2023)). The short-term drought blend variable from a gridded surface meteorological (gridMET) drought dataset was produced by the University of California Merced and was obtained from the Climate Engine platform (https://app.climateengine.org/climateEngine (accessed on 20 December 2023)).

Conflicts of Interest

The authors declare no conflicts of interest.

References

  1. Sheffield, J.; Andreadis, K.; Wood, E.F.; Lettenmaier, D. Global and continental drought in the second half of the twentieth century: Severity–area–duration analysis and temporal variability of large-scale events. J. Clim. 2009, 22, 1962–1981. [Google Scholar] [CrossRef]
  2. Mishra, A.K.; Singh, V.P. A review of drought concepts. J. Hydrol. 2010, 391, 202–216. [Google Scholar] [CrossRef]
  3. Dai, A. Characteristics and trends in various forms of the Palmer Drought Severity Index during 1900–2008. J. Geophys. Res. Atmos. 2011, 116, 1–26. [Google Scholar] [CrossRef]
  4. Damberg, L.; AghaKouchak, A. Global trends and patterns of drought from space. Theor. Appl. Climatol. 2014, 117, 441–448. [Google Scholar] [CrossRef]
  5. Song, X.; Song, Y.; Chen, Y. Secular trend of global drought since 1950. Environ. Res. Lett. 2020, 15, 094073. [Google Scholar] [CrossRef]
  6. Krishnamurthy, R.P.K.; Fisher, J.B.; Choularton, R.J.; Kareiva, P.M. Anticipating drought-related food security changes. Nat. Sustain. 2022, 5, 956–964. [Google Scholar] [CrossRef]
  7. Krishnamurthy, R.P.K.; Fisher, J.B.; Schimel, D.S.; Kareiva, P.M. Applying tipping point theory to remote sensing science to improve early warning drought signals for food security. Earth’s Future 2020, 8, e2019EF001456. [Google Scholar] [CrossRef]
  8. Lottering, S.; Mafongoya, P.; Lottering, R. Drought and its impacts on small-scale farmers in sub-Saharan Africa: A review. S. Afr. Geogr. J. 2021, 103, 319–341. [Google Scholar] [CrossRef]
  9. Sweet, S.K.; Wolfe, D.W.; DeGaetano, A.; Benner, R. Anatomy of the 2016 drought in the Northeastern United States: Implications for agriculture and water resources in humid climates. Agric. For. Meteorol. 2017, 247, 571–581. [Google Scholar] [CrossRef]
  10. Hazaymeh, K.; Hassan, Q.K. Remote sensing of agricultural drought monitoring: A state of art review. AIMS Environ. Sci. 2016, 3, 604–630. [Google Scholar] [CrossRef]
  11. Liu, X.; Zhu, X.; Pan, Y.; Li, S.; Liu, Y.; Ma, Y. Agricultural drought monitoring: Progress, challenges, and prospects. J. Geogr. Sci. 2016, 26, 750–767. [Google Scholar] [CrossRef]
  12. Watson, A.; Miller, J.; Künne, A.; Kralisch, S. Using soil-moisture drought indices to evaluate key indicators of agricultural drought in semi-arid Mediterranean Southern Africa. Sci. Total Environ. 2022, 812, 152464. [Google Scholar] [CrossRef] [PubMed]
  13. Blumenstock, G. Drought in the United States Analyzed by Means of the Theory of Probability; United States Department of Agriculture: Washington, DC, USA, 1942.
  14. McQuigg, J. A simple index of drought conditions. Weatherwise 1954, 7, 64–67. [Google Scholar] [CrossRef]
  15. Munger, T.T. Graphic method of representing and comparing drought intensities. Mon. Weather Rev. 1916, 44, 642–643. [Google Scholar] [CrossRef]
  16. Palmer, W.C. Meteorological Drought; US Department of Commerce, Weather Bureau: Washington, DC, USA, 1965.
  17. Barichivich, J.; Osborn, T.; Harris, I.; van der Schrier, G.; Jones, P. Drought: Monitoring global drought using the self-calibrating Palmer Drought Severity Index. Bull. Am. Meteorol. Soc. 2019, 100, S39–S40. [Google Scholar]
  18. Yan, H.; Wang, S.Q.; Wang, J.B.; Lu, H.Q.; Guo, A.H.; Zhu, Z.C.; Myneni, R.B.; Shugart, H.H. Assessing spatiotemporal variation of drought in China and its impact on agriculture during 1982–2011 by using PDSI indices and agriculture drought survey data. J. Geophys. Res. Atmos. 2016, 121, 2283–2298. [Google Scholar] [CrossRef]
  19. Zoljoodi, M.; Didevarasl, A. Evaluation of spatial-temporal variability of drought events in Iran using palmer drought severity index and its principal factors (through 1951–2005). Atmos. Clim. Sci. 2013, 3, 30772. [Google Scholar] [CrossRef]
  20. Ellis, S.L.; Lohman, M.G.; Sedinger, J.S.; Williams, P.J.; Riecke, T.V. Long-term trends and drought: Spatiotemporal variation in juvenile sex ratios of North American ducks. Ecol. Evol. 2022, 12, e9099. [Google Scholar] [CrossRef]
  21. Nie, N.; Zhang, W.; Chen, H.; Guo, H. A global hydrological drought index dataset based on gravity recovery and climate experiment (GRACE) data. Water Resour. Manag. 2018, 32, 1275–1290. [Google Scholar] [CrossRef]
  22. Shin, J.Y.; Chen, S.; Lee, J.-H.; Kim, T.-W. Investigation of drought propagation in South Korea using drought index and conditional probability. Terr. Atmos. Ocean. Sci. 2018, 29, 231–241. [Google Scholar] [CrossRef]
  23. Gilbert, P.-L.; Boyer, M. Palmer’s Z-Index as an Underlying Index for a Weather-based Crop Insurance Policy: Saskatchewan Study Case. Ph.D. Thesis, HEC Montréal, Montréal, BC, Canada, 2021. [Google Scholar]
  24. Ngarukiyimana, J.; Tan, G.; Ongoma, V.; Ogwang, B.; Vuguziga, F. Application of Z-Index in analysis of recent March–May Drought over Rwanda. Rom. J. Meteorol. 2016, 13, 1–16. [Google Scholar]
  25. Trnka, M.; Hlavinka, P.; Semerádová, D.; Dubrovsky, M.; Zalud, Z.; Mozny, M. Agricultural drought and spring barley yields in the Czech Republic. Plant Soil Environ. 2007, 53, 306. [Google Scholar] [CrossRef]
  26. Heim, R.R., Jr. A review of twentieth-century drought indices used in the United States. Bull. Am. Meteorol. Soc. 2002, 83, 1149–1166. [Google Scholar] [CrossRef]
  27. Choi, M.; Jacobs, J.M.; Anderson, M.C.; Bosch, D.D. Evaluation of drought indices via remotely sensed data with hydrological variables. J. Hydrol. 2013, 476, 265–273. [Google Scholar] [CrossRef]
  28. West, H.; Quinn, N.; Horswell, M. Remote sensing for drought monitoring & impact assessment: Progress, past challenges and future opportunities. Remote Sens. Environ. 2019, 232, 111291. [Google Scholar]
  29. Zhang, L.; Jiao, W.; Zhang, H.; Huang, C.; Tong, Q. Studying drought phenomena in the Continental United States in 2011 and 2012 using various drought indices. Remote Sens. Environ. 2017, 190, 96–106. [Google Scholar] [CrossRef]
  30. Yao, Y.; Liang, S.; Qin, Q.; Wang, K. Monitoring drought over the conterminous United States using MODIS and NCEP Reanalysis-2 data. J. Appl. Meteorol. Climatol. 2010, 49, 1665–1680. [Google Scholar] [CrossRef]
  31. Aulia, M.R.; Setiawan, Y.; Fatikhunnada, A. Drought detection of west java’s paddy field using MODIS EVI satellite images (case study: Rancaekek and rancaekek wetan). Procedia Environ. Sci. 2016, 33, 646–653. [Google Scholar] [CrossRef]
  32. Nanzad, L.; Zhang, J.; Tuvdendorj, B.; Nabil, M.; Zhang, S.; Bai, Y. NDVI anomaly for drought monitoring and its correlation with climate factors over Mongolia from 2000 to 2016. J. Arid. Environ. 2019, 164, 69–77. [Google Scholar] [CrossRef]
  33. Wagle, P.; Xiao, X.; Torn, M.S.; Cook, D.R.; Matamala, R.; Fischer, M.L.; Jin, C.; Dong, J.; Biradar, C. Sensitivity of vegetation indices and gross primary production of tallgrass prairie to severe drought. Remote Sens. Environ. 2014, 152, 1–14. [Google Scholar] [CrossRef]
  34. AghaKouchak, A. A baseline probabilistic drought forecasting framework using standardized soil moisture index: Application to the 2012 United States drought. Hydrol. Earth Syst. Sci. 2014, 18, 2485–2492. [Google Scholar] [CrossRef]
  35. Martínez-Fernández, J.; González-Zamora, A.; Sánchez, N.; Gumuzzio, A.; Herrero-Jiménez, C. Satellite soil moisture for agricultural drought monitoring: Assessment of the SMOS derived Soil Water Deficit Index. Remote Sens. Environ. 2016, 177, 277–286. [Google Scholar] [CrossRef]
  36. Zhu, Y.; Liu, Y.; Wang, W.; Singh, V.P.; Ren, L. A global perspective on the probability of propagation of drought: From meteorological to soil moisture. J. Hydrol. 2021, 603, 126907. [Google Scholar] [CrossRef]
  37. Amalo, L.F.; Hidayat, R.; Sulma, S. Analysis of agricultural drought in east java using vegetation health index. AGRIVITA J. Agric. Sci. 2017, 40, 63–73. [Google Scholar] [CrossRef]
  38. Jiang, R.; Liang, J.; Zhao, Y.; Wang, H.; Xie, J.; Lu, X.; Li, F. Assessment of vegetation growth and drought conditions using satellite-based vegetation health indices in Jing-Jin-Ji region of China. Sci. Rep. 2021, 11, 13775. [Google Scholar] [CrossRef]
  39. Kloos, S.; Yuan, Y.; Castelli, M.; Menzel, A. Agricultural drought detection with MODIS based vegetation health indices in southeast Germany. Remote Sens. 2021, 13, 3907. [Google Scholar] [CrossRef]
  40. Berg, A.; Sheffield, J. Climate change and drought: The soil moisture perspective. Curr. Clim. Chang. Rep. 2018, 4, 180–191. [Google Scholar] [CrossRef]
  41. Wagner, W.; Hahn, S.; Kidd, R.; Melzer, T.; Bartalis, Z.; Hasenauer, S.; Figa, J.; De Rosnay, P.; Jann, A.; Schneider, S. The ASCAT soil moisture product: A review of its. Meteorol. Z. 2013, 22, 1–29. [Google Scholar] [CrossRef]
  42. Entekhabi, D.; Njoku, E.G.; O’neill, P.E.; Kellogg, K.H.; Crow, W.T.; Edelstein, W.N.; Entin, J.K.; Goodman, S.D.; Jackson, T.J.; Johnson, J. The soil moisture active passive (SMAP) mission. Proc. IEEE 2010, 98, 704–716. [Google Scholar] [CrossRef]
  43. Kerr, Y.H.; Waldteufel, P.; Wigneron, J.-P.; Martinuzzi, J.; Font, J.; Berger, M. Soil moisture retrieval from space: The Soil Moisture and Ocean Salinity (SMOS) mission. IEEE Trans. Geosci. Remote Sens. 2001, 39, 1729–1735. [Google Scholar] [CrossRef]
  44. Dorigo, W.; Wagner, W.; Albergel, C.; Albrecht, F.; Balsamo, G.; Brocca, L.; Chung, D.; Ertl, M.; Forkel, M.; Gruber, A. ESA CCI Soil Moisture for improved Earth system understanding: State-of-the art and future directions. Remote Sens. Environ. 2017, 203, 185–215. [Google Scholar] [CrossRef]
  45. Rodell, M.; Houser, P.; Jambor, U.; Gottschalck, J.; Mitchell, K.; Meng, C.-J.; Arsenault, K.; Cosgrove, B.; Radakovich, J.; Bosilovich, M. The global land data assimilation system. Bull. Am. Meteorol. Soc. 2004, 85, 381–394. [Google Scholar] [CrossRef]
  46. De Rosnay, P.; Drusch, M.; Vasiljevic, D.; Balsamo, G.; Albergel, C.; Isaksen, L. A simplified extended Kalman filter for the global operational soil moisture analysis at ECMWF. Q. J. R. Meteorol. Soc. 2013, 139, 1199–1213. [Google Scholar] [CrossRef]
  47. Beck, H.E.; Pan, M.; Miralles, D.G.; Reichle, R.H.; Dorigo, W.A.; Hahn, S.; Sheffield, J.; Karthikeyan, L.; Balsamo, G.; Parinussa, R.M. Evaluation of 18 satellite-and model-based soil moisture products using in situ measurements from 826 sensors. Hydrol. Earth Syst. Sci. 2021, 25, 17–40. [Google Scholar] [CrossRef]
  48. Chen, Y.; Yang, K.; Qin, J.; Zhao, L.; Tang, W.; Han, M. Evaluation of AMSR-E retrievals and GLDAS simulations against observations of a soil moisture network on the central Tibetan Plateau. J. Geophys. Res. Atmos. 2013, 118, 4466–4475. [Google Scholar] [CrossRef]
  49. Sehgal, V.; Gaur, N.; Mohanty, B.P. Global flash drought monitoring using surface soil moisture. Water Resour. Res. 2021, 57, e2021WR029901. [Google Scholar] [CrossRef]
  50. Sheffield, J.; Wood, E.F. Characteristics of global and regional drought 1950–2000: Analysis of soil moisture data from off-line simulation of the terrestrial hydrologic cycle. J. Geophys. Res. Atmos. 2007, 112. [Google Scholar] [CrossRef]
  51. Qiu, J.; Crow, W.T.; Nearing, G.S.; Mo, X.; Liu, S. The impact of vertical measurement depth on the information content of soil moisture times series data. Geophys. Res. Lett. 2014, 41, 4997–5004. [Google Scholar] [CrossRef]
  52. Tebbs, E.; Gerard, F.; Petrie, A.; De Witte, E. Emerging and potential future applications of satellite-based soil moisture products. In Satellite Soil Moisture Retrieval; Elsevier: Amsterdam, The Netherlands, 2016; pp. 379–400. [Google Scholar]
  53. Wu, Z.; Qiu, J.; Liu, S. Advances in agricultural drought monitoring based on soil moisture. Prog. Geogr. 2020, 39, 1758–1769. [Google Scholar] [CrossRef]
  54. Zhou, H.; Wu, J.; Li, X.; Liu, L.; Yang, J.; Han, X. Suitability of assimilated data-based standardized soil moisture index for agricultural drought monitoring. Acta Ecol. Sin 2019, 39, 2191–2202. [Google Scholar]
  55. Champagne, C.; McNairn, H.; Berg, A. Monitoring agricultural soil moisture extremes in Canada using passive microwave remote sensing. Remote Sens. Environ. 2011, 115, 2434–2444. [Google Scholar] [CrossRef]
  56. Sheffield, J.; Goteti, G.; Wen, F.; Wood, E.F. A simulated soil moisture based drought analysis for the United States. J. Geophys. Res. Atmos. 2004, 109, 1–19. [Google Scholar] [CrossRef]
  57. Narasimhan, B.; Srinivasan, R. Development and evaluation of Soil Moisture Deficit Index (SMDI) and Evapotranspiration Deficit Index (ETDI) for agricultural drought monitoring. Agric. For. Meteorol. 2005, 133, 69–88. [Google Scholar] [CrossRef]
  58. Zeri, M.; Williams, K.; Cunha, A.P.M.; Cunha-Zeri, G.; Vianna, M.S.; Blyth, E.M.; Marthews, T.R.; Hayman, G.D.; Costa, J.M.; Marengo, J.A. Importance of including soil moisture in drought monitoring over the Brazilian semiarid region: An evaluation using the JULES model, in situ observations, and remote sensing. Clim. Resil. Sustain. 2022, 1, e7. [Google Scholar] [CrossRef]
  59. Wambua, R.M. Spatio-temporal characterization of agricultural drought using soil moisture deficit index (SMDI) in the upper Tana River basin, Kenya. Int. J. Eng. Res. Adv. Technol. 2019, 5, 93–106. [Google Scholar] [CrossRef]
  60. Zhang, G.; Su, X.; Ayantobo, O.O.; Feng, K. Drought monitoring and evaluation using ESA CCI and GLDAS-Noah soil moisture datasets across China. Theor. Appl. Climatol. 2021, 144, 1407–1418. [Google Scholar] [CrossRef]
  61. Torres, G.M.; Lollato, R.P.; Ochsner, T.E. Comparison of drought probability assessments based on atmospheric water deficit and soil water deficit. Agron. J. 2013, 105, 428–436. [Google Scholar] [CrossRef]
  62. Kędzior, M.; Zawadzki, J. SMOS data as a source of the agricultural drought information: Case study of the Vistula catchment, Poland. Geoderma 2017, 306, 167–182. [Google Scholar] [CrossRef]
  63. Bai, J.; Cui, Q.; Chen, D.; Yu, H.; Mao, X.; Meng, L.; Cai, Y. Assessment of the SMAP-derived soil water deficit index (SWDI-SMAP) as an agricultural drought index in China. Remote Sens. 2018, 10, 1302. [Google Scholar] [CrossRef]
  64. Martínez-Fernández, J.; González-Zamora, A.; Sánchez, N.; Gumuzzio, A. A soil water based index as a suitable agricultural drought indicator. J. Hydrol. 2015, 522, 265–273. [Google Scholar] [CrossRef]
  65. Mishra, A.; Vu, T.; Veettil, A.V.; Entekhabi, D. Drought monitoring with soil moisture active passive (SMAP) measurements. J. Hydrol. 2017, 552, 620–632. [Google Scholar] [CrossRef]
  66. Park, S.; Im, J.; Park, S.; Rhee, J. Drought monitoring using high resolution soil moisture through multi-sensor satellite data fusion over the Korean peninsula. Agric. For. Meteorol. 2017, 237, 257–269. [Google Scholar] [CrossRef]
  67. Zhu, Q.; Luo, Y.; Xu, Y.-P.; Tian, Y.; Yang, T. Satellite soil moisture for agricultural drought monitoring: Assessment of SMAP-derived soil water deficit index in Xiang River Basin, China. Remote Sens. 2019, 11, 362. [Google Scholar] [CrossRef]
  68. Mullapudi, A.; Vibhute, A.D.; Mali, S.; Patil, C.H. A review of agricultural drought assessment with remote sensing data: Methods, issues, challenges and opportunities. Appl. Geomat. 2023, 15, 1–13. [Google Scholar] [CrossRef]
  69. Peng, J.; Loew, A.; Merlin, O.; Verhoest, N.E. A review of spatial downscaling of satellite remotely sensed soil moisture. Rev. Geophys. 2017, 55, 341–366. [Google Scholar] [CrossRef]
  70. Peng, J.; Albergel, C.; Balenzano, A.; Brocca, L.; Cartus, O.; Cosh, M.H.; Crow, W.T.; Dabrowska-Zielinska, K.; Dadson, S.; Davidson, M.W. A roadmap for high-resolution satellite soil moisture applications–confronting product characteristics with user requirements. Remote Sens. Environ. 2021, 252, 112162. [Google Scholar] [CrossRef]
  71. Fang, B.; Kansara, P.; Dandridge, C.; Lakshmi, V. Drought monitoring using high spatial resolution soil moisture data over Australia in 2015–2019. J. Hydrol. 2021, 594, 125960. [Google Scholar] [CrossRef]
  72. Ganguli, P.; Raut, A.; Purushothaman, N.K.; Reddy, N.N.; Das, B.S. Climate-Catchment-Soil-and Land Use and Land Cover Controls on Streamflow Droughts in Tropical Catchments of Peninsular India. In Proceedings of the AGU Fall Meeting Abstracts, Chicago, IL, USA, 12–16 December 2022; p. H32E-06. [Google Scholar]
  73. Colliander, A.; Fisher, J.B.; Halverson, G.; Merlin, O.; Misra, S.; Bindlish, R.; Jackson, T.J.; Yueh, S. Spatial downscaling of SMAP soil moisture using MODIS land surface temperature and NDVI during SMAPVEX15. IEEE Geosci. Remote Sens. Lett. 2017, 14, 2107–2111. [Google Scholar] [CrossRef]
  74. Tomer, S.K.; Al Bitar, A.; Sekhar, M.; Zribi, M.; Bandyopadhyay, S.; Kerr, Y. MAPSM: A spatio-temporal algorithm for merging soil moisture from active and passive microwave remote sensing. Remote Sens. 2016, 8, 990. [Google Scholar] [CrossRef]
  75. Guevara, M.; Vargas, R. Downscaling satellite soil moisture using geomorphometry and machine learning. PLoS ONE 2019, 14, e0219639. [Google Scholar] [CrossRef]
  76. Sahoo, A.K.; De Lannoy, G.J.; Reichle, R.H.; Houser, P.R. Assimilation and downscaling of satellite observed soil moisture over the Little River Experimental Watershed in Georgia, USA. Adv. Water Resour. 2013, 52, 19–33. [Google Scholar] [CrossRef]
  77. Zhang, Y.; Liang, S.; Zhu, Z.; Ma, H.; He, T. Soil moisture content retrieval from Landsat 8 data using ensemble learning. ISPRS J. Photogramm. Remote Sens. 2022, 185, 32–47. [Google Scholar] [CrossRef]
  78. Abowarda, A.S.; Bai, L.; Zhang, C.; Long, D.; Li, X.; Huang, Q.; Sun, Z. Generating surface soil moisture at 30 m spatial resolution using both data fusion and machine learning toward better water resources management at the field scale. Remote Sens. Environ. 2021, 255, 112301. [Google Scholar] [CrossRef]
  79. Dorigo, W.; Van Oevelen, P.; Wagner, W.; Drusch, M.; Mecklenburg, S.; Robock, A.; Jackson, T. A new international network for in situ soil moisture data. Eos Trans. Am. Geophys. Union 2011, 92, 141–142. [Google Scholar] [CrossRef]
  80. Dorigo, W.; Wagner, W.; Hohensinn, R.; Hahn, S.; Paulik, C.; Xaver, A.; Gruber, A.; Drusch, M.; Mecklenburg, S.; van Oevelen, P. The International Soil Moisture Network: A data hosting facility for global in situ soil moisture measurements. Hydrol. Earth Syst. Sci. 2011, 15, 1675–1698. [Google Scholar] [CrossRef]
  81. Hengl, T.; Mendes de Jesus, J.; Heuvelink, G.B.; Ruiperez Gonzalez, M.; Kilibarda, M.; Blagotić, A.; Shangguan, W.; Wright, M.N.; Geng, X.; Bauer-Marschallinger, B. SoilGrids250m: Global gridded soil information based on machine learning. PLoS ONE 2017, 12, e0169748. [Google Scholar] [CrossRef]
  82. Poggio, L.; De Sousa, L.M.; Batjes, N.H.; Heuvelink, G.; Kempen, B.; Ribeiro, E.; Rossiter, D. SoilGrids 2.0: Producing soil information for the globe with quantified spatial uncertainty. Soil 2021, 7, 217–240. [Google Scholar] [CrossRef]
  83. Hersbach, H.; Bell, B.; Berrisford, P.; Hirahara, S.; Horányi, A.; Muñoz-Sabater, J.; Nicolas, J.; Peubey, C.; Radu, R.; Schepers, D. The ERA5 global reanalysis. Q. J. R. Meteorol. Soc. 2020, 146, 1999–2049. [Google Scholar] [CrossRef]
  84. O’Neill, P.; Entekhabi, D.; Njoku, E.; Kellogg, K. The NASA soil moisture active passive (SMAP) mission: Overview. In Proceedings of the 2010 IEEE International Geoscience and Remote Sensing Symposium, Honolulu, HI, USA, 25–30 July 2010; pp. 3236–3239. [Google Scholar]
  85. O’Neill, P.; Bindlish, R.; Chan, S.; Njoku, E.; Jackson, T. Algorithm Theoretical Basis Document Level 2 & 3 Soil Moisture (Passive) Data Products; California Institute of Technology: Pasadena, CA, USA, 2018. [Google Scholar]
  86. Kerr, Y.H.; Waldteufel, P.; Wigneron, J.-P.; Delwart, S.; Cabot, F.; Boutin, J.; Escorihuela, M.-J.; Font, J.; Reul, N.; Gruhier, C. The SMOS mission: New tool for monitoring key elements ofthe global water cycle. Proc. IEEE 2010, 98, 666–687. [Google Scholar] [CrossRef]
  87. Wigneron, J.-P.; Mialon, A.; De Lannoy, G.; Fernández-Morán, R.; Al-Yaari, A.; Ebrahimi, M.; Rodriguez-Fernandez, N.; Kerr, Y.; Quets, J.; Pellarin, T. SMOS-IC: Current status and overview of soil moisture and VOD applications. In Proceedings of the IGARSS 2018 IEEE International Geoscience and Remote Sensing Symposium, Valencia, Spain, 22–27 July 2018; pp. 1451–1453. [Google Scholar]
  88. Kumar, S.V.; Jasinski, M.; Mocko, D.M.; Rodell, M.; Borak, J.; Li, B.; Beaudoing, H.K.; Peters-Lidard, C.D. NCA-LDAS land analysis: Development and performance of a multisensor, multivariate land data assimilation system for the National Climate Assessment. J. Hydrometeorol. 2019, 20, 1571–1593. [Google Scholar] [CrossRef]
  89. Jasinski, M.F.; Borak, J.S.; Kumar, S.V.; Mocko, D.M.; Peters-Lidard, C.D.; Rodell, M.; Rui, H.; Beaudoing, H.K.; Vollmer, B.E.; Arsenault, K.R. NCA-LDAS: Overview and analysis of hydrologic trends for the national climate assessment. J. Hydrometeorol. 2019, 20, 1595–1617. [Google Scholar] [CrossRef] [PubMed]
  90. Gruber, A.; Scanlon, T.; van der Schalie, R.; Wagner, W.; Dorigo, W. Evolution of the ESA CCI Soil Moisture climate data records and their underlying merging methodology. Earth Syst. Sci. Data 2019, 11, 717–739. [Google Scholar] [CrossRef]
  91. Martinez-Fernandez, J.; Ceballos, A.; Casado, S.; Moran, C.; Hernandez, V. Runoff and soil moisture relationships in a small forested basin in the Sistema Central ranges (Spain). IAHS Publ. 2005, 299, 31. [Google Scholar]
  92. Hogg, E.; Barr, A.; Black, T. A simple soil moisture index for representing multi-year drought impacts on aspen productivity in the western Canadian interior. Agric. For. Meteorol. 2013, 178, 173–182. [Google Scholar] [CrossRef]
  93. Hunt, E.D.; Hubbard, K.G.; Wilhite, D.A.; Arkebauer, T.J.; Dutcher, A.L. The development and evaluation of a soil moisture index. Int. J. Climatol. A J. R. Meteorol. Soc. 2009, 29, 747–759. [Google Scholar] [CrossRef]
  94. Bouma, J. Transfer functions and threshold values: From soil characteristics to land qualities. In Quantified Land Evaluation; Proc. ISSS/SSSA Workshop; ITC Publication: Washington, DC, USA, 1987. [Google Scholar]
  95. Wösten, J.; Pachepsky, Y.A.; Rawls, W. Pedotransfer functions: Bridging the gap between available basic soil data and missing soil hydraulic characteristics. J. Hydrol. 2001, 251, 123–150. [Google Scholar] [CrossRef]
  96. Saxton, K.E.; Rawls, W.J. Soil water characteristic estimates by texture and organic matter for hydrologic solutions. Soil Sci. Soc. Am. J. 2006, 70, 1569–1578. [Google Scholar] [CrossRef]
  97. Kogan, F.N. Global drought watch from space. Bull. Am. Meteorol. Soc. 1997, 78, 621–636. [Google Scholar] [CrossRef]
  98. Kogan, F. Early drought detection, monitoring, and assessment of crop losses from space: Global approach. In Disaster Forewarning Diagnostic Methods and Management; SPIE: Cergy-Pontoise, France, 2006; pp. 56–60. [Google Scholar]
  99. Kogan, F.N. Operational space technology for global vegetation assessment. Bull. Am. Meteorol. Soc. 2001, 82, 1949–1964. [Google Scholar] [CrossRef]
  100. Gupta, H.V.; Kling, H.; Yilmaz, K.K.; Martinez, G.F. Decomposition of the mean squared error and NSE performance criteria: Implications for improving hydrological modelling. J. Hydrol. 2009, 377, 80–91. [Google Scholar] [CrossRef]
  101. Savage, M.J.; Ritchie, J.T.; Bland, W.L.; Dugas, W.A. Lower limit of soil water availability. Agron. J. 1996, 88, 644–651. [Google Scholar] [CrossRef]
  102. Kogan, F. World droughts in the new millennium from AVHRR-based vegetation health indices. Eos Trans. Am. Geophys. Union 2002, 83, 557–563. [Google Scholar] [CrossRef]
  103. Gleick, P.H. Water in Crisis: A Guide to the World’s Fresh Water Resources; Oxford University Press: Oxford, UK, 1993; pp. 1051–1761. [Google Scholar]
  104. Robinson, D.A.; Campbell, C.S.; Hopmans, J.W.; Hornbuckle, B.K.; Jones, S.B.; Knight, R.; Ogden, F.; Selker, J.; Wendroth, O. Soil moisture measurement for ecological and hydrological watershed-scale observatories: A review. Vadose Zone J. 2008, 7, 358–389. [Google Scholar] [CrossRef]
  105. Seneviratne, S.I.; Corti, T.; Davin, E.L.; Hirschi, M.; Jaeger, E.B.; Lehner, I.; Orlowsky, B.; Teuling, A.J. Investigating soil moisture–climate interactions in a changing climate: A review. Earth-Sci. Rev. 2010, 99, 125–161. [Google Scholar] [CrossRef]
  106. Purdy, A.J.; Fisher, J.B.; Goulden, M.L.; Colliander, A.; Halverson, G.; Tu, K.; Famiglietti, J.S. SMAP soil moisture improves global evapotranspiration. Remote Sens. Environ. 2018, 219, 1–14. [Google Scholar] [CrossRef]
  107. Sadeghi, M.; Ebtehaj, A.; Crow, W.T.; Gao, L.; Purdy, A.J.; Fisher, J.B.; Jones, S.B.; Babaeian, E.; Tuller, M. Global estimates of land surface water fluxes from SMOS and SMAP satellite soil moisture data. J. Hydrometeorol. 2020, 21, 241–253. [Google Scholar] [CrossRef]
  108. Yao, Y.; Zhang, Y.; Liu, Q.; Liu, S.; Jia, K.; Zhang, X.; Xu, Z.; Xu, T.; Chen, J.; Fisher, J.B. Evaluation of a satellite-derived model parameterized by three soil moisture constraints to estimate terrestrial latent heat flux in the Heihe River basin of Northwest China. Sci. Total Environ. 2019, 695, 133787. [Google Scholar] [CrossRef]
  109. Galbally, I.E.; Kirstine, W.V.; Meyer, C.; Wang, Y.P. Soil–atmosphere trace gas exchange in semiarid and arid zones. J. Environ. Qual. 2008, 37, 599–607. [Google Scholar] [CrossRef]
  110. Kolus, H.R.; Huntzinger, D.N.; Schwalm, C.R.; Fisher, J.B.; McKay, N.; Fang, Y.; Michalak, A.M.; Schaefer, K.; Wei, Y.; Poulter, B. Land carbon models underestimate the severity and duration of drought’s impact on plant productivity. Sci. Rep. 2019, 9, 2758. [Google Scholar] [CrossRef]
  111. Miller, D.L.; Wolf, S.; Fisher, J.B.; Zaitchik, B.F.; Xiao, J.; Keenan, T.F. Increased photosynthesis during spring drought in energy-limited ecosystems. Nat. Commun. 2023, 14, 7828. [Google Scholar] [CrossRef]
  112. Qiu, B.; Xue, Y.; Fisher, J.B.; Guo, W.; Berry, J.A.; Zhang, Y. Satellite chlorophyll fluorescence and soil moisture observations lead to advances in the predictive understanding of global terrestrial coupled carbon-water cycles. Glob. Biogeochem. Cycles 2018, 32, 360–375. [Google Scholar] [CrossRef]
  113. Sehgal, V.; Sridhar, V.; Tyagi, A. Stratified drought analysis using a stochastic ensemble of simulated and in-situ soil moisture observations. J. Hydrol. 2017, 545, 226–250. [Google Scholar] [CrossRef]
  114. Baldocchi, D.D.; Keeney, N.; Rey-Sanchez, C.; Fisher, J.B. Atmospheric humidity deficits tell us how soil moisture deficits down-regulate ecosystem evaporation. Adv. Water Resour. 2022, 159, 104100. [Google Scholar] [CrossRef]
  115. Pollacco, J.A.P.; Mohanty, B.P. Uncertainties of Water Fluxes in Soil-Vegetation-Atmosphere Transfer Models: Inverting Surface Soil Moisture and Evapotranspiration Retrieved from Remote Sensing. Vadose Zone J. 2012, 11, 1–21. [Google Scholar] [CrossRef]
  116. Sehgal, V.; Sridhar, V. Watershed-scale retrospective drought analysis and seasonal forecasting using multi-layer, high-resolution simulated soil moisture for Southeastern US. Weather Clim. Extrem. 2019, 23, 100191. [Google Scholar] [CrossRef]
  117. Velpuri, N.M.; Senay, G.B.; Morisette, J.T. Evaluating new SMAP soil moisture for drought monitoring in the rangelands of the US high plains. Rangelands 2016, 38, 183–190. [Google Scholar] [CrossRef]
  118. Alessi, M.J.; Herrera, D.A.; Evans, C.P.; DeGaetano, A.T.; Ault, T.R. Soil Moisture Conditions Determine Land-Atmosphere Coupling and Drought Risk in the Northeastern United States. J. Geophys. Res. Atmos. 2022, 127, e2021JD034740. [Google Scholar] [CrossRef]
  119. Zhou, S.; Williams, A.P.; Berg, A.M.; Cook, B.I.; Zhang, Y.; Hagemann, S.; Lorenz, R.; Seneviratne, S.I.; Gentine, P. Land–atmosphere feedbacks exacerbate concurrent soil drought and atmospheric aridity. Proc. Natl. Acad. Sci. USA 2019, 116, 18848–18853. [Google Scholar] [CrossRef]
  120. McColl, K.A.; Alemohammad, S.H.; Akbar, R.; Konings, A.G.; Yueh, S.; Entekhabi, D. The global distribution and dynamics of surface soil moisture. Nat. Geosci. 2017, 10, 100–104. [Google Scholar] [CrossRef]
  121. Qiu, S.; Williams, I.N. Observational evidence of state-dependent positive and negative land surface feedback on afternoon deep convection over the Southern Great Plains. Geophys. Res. Lett. 2020, 47, e2019GL086622. [Google Scholar] [CrossRef]
  122. Tuttle, S.; Salvucci, G. Empirical evidence of contrasting soil moisture–precipitation feedbacks across the United States. Science 2016, 352, 825–828. [Google Scholar] [CrossRef] [PubMed]
  123. Baik, J.; Zohaib, M.; Kim, U.; Aadil, M.; Choi, M. Agricultural drought assessment based on multiple soil moisture products. J. Arid Environ. 2019, 167, 43–55. [Google Scholar] [CrossRef]
  124. Cui, C.; Xu, J.; Zeng, J.; Chen, K.-S.; Bai, X.; Lu, H.; Chen, Q.; Zhao, T. Soil moisture mapping from satellites: An intercomparison of SMAP, SMOS, FY3B, AMSR2, and ESA CCI over two dense network regions at different spatial scales. Remote Sens. 2017, 10, 33. [Google Scholar] [CrossRef]
  125. Ma, H.; Zeng, J.; Chen, N.; Zhang, X.; Cosh, M.H.; Wang, W. Satellite surface soil moisture from SMAP, SMOS, AMSR2 and ESA CCI: A comprehensive assessment using global ground-based observations. Remote Sens. Environ. 2019, 231, 111215. [Google Scholar] [CrossRef]
  126. Yue, J.; Tian, J.; Tian, Q.; Xu, K.; Xu, N. Development of soil moisture indices from differences in water absorption between shortwave-infrared bands. ISPRS J. Photogramm. Remote Sens. 2019, 154, 216–230. [Google Scholar] [CrossRef]
  127. Chaney, N.W.; Roundy, J.K.; Herrera-Estrada, J.E.; Wood, E.F. High-resolution modeling of the spatial heterogeneity of soil moisture: Applications in network design. Water Resour. Res. 2015, 51, 619–638. [Google Scholar] [CrossRef]
  128. Baroni, G.; Ortuani, B.; Facchi, A.; Gandolfi, C. The role of vegetation and soil properties on the spatio-temporal variability of the surface soil moisture in a maize-cropped field. J. Hydrol. 2013, 489, 148–159. [Google Scholar] [CrossRef]
  129. Entekhabi, D.; Rodriguez-Iturbe, I.; Castelli, F. Mutual interaction of soil moisture state and atmospheric processes. J. Hydrol. 1996, 184, 3–17. [Google Scholar] [CrossRef]
  130. Cai, Y.; Zheng, W.; Zhang, X.; Zhangzhong, L.; Xue, X. Research on soil moisture prediction model based on deep learning. PLoS ONE 2019, 14, e0214508. [Google Scholar] [CrossRef]
  131. Al-Yaari, A.; Wigneron, J.-P.; Dorigo, W.; Colliander, A.; Pellarin, T.; Hahn, S.; Mialon, A.; Richaume, P.; Fernandez-Moran, R.; Fan, L. Assessment and inter-comparison of recently developed/reprocessed microwave satellite soil moisture products using ISMN ground-based measurements. Remote Sens. Environ. 2019, 224, 289–303. [Google Scholar] [CrossRef]
  132. Patzold, S.; Mertens, F.M.; Bornemann, L.; Koleczek, B.; Franke, J.; Feilhauer, H.; Welp, G. Soil heterogeneity at the field scale: A challenge for precision crop protection. Precis. Agric. 2008, 9, 367–390. [Google Scholar] [CrossRef]
  133. Cassel, D.; Nielsen, D. Field capacity and available water capacity. In Methods of Soil Analysis: Part 1 Physical and Mineralogical Methods; American Society of Agronomy, Inc.: Madison, WI, USA; Soil Science Society of America, Inc.: Madison, WI, USA, 1986; Volume 5, pp. 901–926. [Google Scholar]
  134. Kogan, F. Vegetation health method. In Remote Sensing for Food Security; Springer: Berlin/Heidelberg, Germany, 2019; pp. 51–73. [Google Scholar]
  135. Mu, L.L.; Wu, B.F.; Yan, N.N. Validation of Agricultural Drought Indices and Their Uncertainty Analysis. Bull. Soil Water Conserv. 2007, 27, 119–122. [Google Scholar]
  136. Lakhankar, T.; Krakauer, N.; Khanbilvardi, R. Applications of microwave remote sensing of soil moisture for agricultural applications. Int. J. Terraspace Sci. Eng. 2009, 2, 81–91. [Google Scholar]
  137. Colliander, A.; Cosh, M.H.; Kelly, V.R.; Kraatz, S.; Bourgeau-Chavez, L.; Siqueira, P.; Roy, A.; Konings, A.G.; Holtzman, N.; Misra, S. SMAP detects soil moisture under temperate forest canopies. Geophys. Res. Lett. 2020, 47, e2020GL089697. [Google Scholar] [CrossRef]
  138. Ning, J.; Yao, Y.; Tang, Q.; Li, Y.; Fisher, J.B.; Zhang, X.; Jia, K.; Xu, J.; Shang, K.; Yang, J. Soil moisture at 30 m from multiple satellite datasets fused by random forest. J. Hydrol. 2023, 625, 130010. [Google Scholar] [CrossRef]
  139. Qin, Q.; Wu, Z.; Zhang, T.; Sagan, V.; Zhang, Z.; Zhang, Y.; Zhang, C.; Ren, H.; Sun, Y.; Xu, W. Optical and thermal remote sensing for monitoring agricultural drought. Remote Sens. 2021, 13, 5092. [Google Scholar] [CrossRef]
  140. Karnieli, A.; Agam, N.; Pinker, R.T.; Anderson, M.; Imhoff, M.L.; Gutman, G.G.; Panov, N.; Goldberg, A. Use of NDVI and land surface temperature for drought assessment: Merits and limitations. J. Clim. 2010, 23, 618–633. [Google Scholar] [CrossRef]
  141. Sun, H.; Zhou, B.; Liu, H. Spatial evaluation of soil moisture (SM), land surface temperature (LST), and LST-derived SM indexes dynamics during SMAPVEX12. Sensors 2019, 19, 1247. [Google Scholar] [CrossRef]
  142. Tian, J.; Lu, H.; Yang, K.; Qin, J.; Zhao, L.; Jiang, Y.; Shi, P.; Ma, X.; Zhou, J. Improving Surface Soil Moisture Estimation through Assimilating Satellite Land Surface Temperature with a Linear SM-LST Relationship. IEEE J. Sel. Top. Appl. Earth Obs. Remote Sens. 2023, 16, 7777–7790. [Google Scholar] [CrossRef]
  143. Wei, W.; Pang, S.; Wang, X.; Zhou, L.; Xie, B.; Zhou, J.; Li, C. Temperature vegetation precipitation dryness index (TVPDI)-based dryness-wetness monitoring in China. Remote Sens. Environ. 2020, 248, 111957. [Google Scholar] [CrossRef]
  144. Sivakumar, M.; Stone, R.; Sentelhas, P.C.; Svoboda, M.; Omondi, P.; Sarkar, J.; Wardlow, B. Agricultural drought indices: Summary and recommendations. In Proceedings of the An Expert Meeting, Murcia, Spain, 2–4 June 2010; Agricultural Drought Indices. World Meteorological Organization: Geneva, Switzerland, 2011; pp. 2–4. [Google Scholar]
  145. Svoboda, M.; LeComte, D.; Hayes, M.; Heim, R.; Gleason, K.; Angel, J.; Rippey, B.; Tinker, R.; Palecki, M.; Stooksbury, D. The drought monitor. Bull. Am. Meteorol. Soc. 2002, 83, 1181–1190. [Google Scholar] [CrossRef]
  146. Abatzoglou, J.T. Development of gridded surface meteorological data for ecological applications and modelling. Int. J. Climatol. 2013, 33, 121–131. [Google Scholar] [CrossRef]
  147. Purdy, A.J.; Kawata, J.; Fisher, J.B.; Reynolds, M.; Om, G.; Ali, Z.; Babikian, J.; Roman, C.; Mann, L. Designing drought indicators. Bull. Am. Meteorol. Soc. 2019, 100, 2327–2341. [Google Scholar] [CrossRef]
  148. Deitch, M.J.; Sapundjieff, M.J.; Feirer, S.T. Characterizing precipitation variability and trends in the world’s Mediterranean-climate areas. Water 2017, 9, 259. [Google Scholar] [CrossRef]
  149. Lund, J.; Medellin-Azuara, J.; Durand, J.; Stone, K. Lessons from California’s 2012–2016 drought. J. Water Resour. Plan. Manag. 2018, 144, 04018067. [Google Scholar] [CrossRef]
  150. Abatzoglou, J.T.; McEvoy, D.J.; Redmond, K.T. The west wide drought tracker: Drought monitoring at fine spatial scales. Bull. Am. Meteorol. Soc. 2017, 98, 1815–1820. [Google Scholar] [CrossRef]
  151. Anderson, M.C.; Zolin, C.A.; Sentelhas, P.C.; Hain, C.R.; Semmens, K.; Yilmaz, M.T.; Gao, F.; Otkin, J.A.; Tetrault, R. The Evaporative Stress Index as an indicator of agricultural drought in Brazil: An assessment based on crop yield impacts. Remote Sens. Environ. 2016, 174, 82–99. [Google Scholar] [CrossRef]
  152. Duncan, L.L.; Perrone, D.; Jacobi, J.H.; Hornberger, G.M. Drought planning and management: Using high spatial resolution as part of the solution. Environ. Sci. Technol. 2015, 49, 2639–2647. [Google Scholar] [CrossRef]
  153. Long, D.; Bai, L.; Yan, L.; Zhang, C.; Yang, W.; Lei, H.; Quan, J.; Meng, X.; Shi, C. Generation of spatially complete and daily continuous surface soil moisture of high spatial resolution. Remote Sens. Environ. 2019, 233, 111364. [Google Scholar] [CrossRef]
  154. Xiao, Z.; Jiang, L.; Zhu, Z.; Wang, J.; Du, J. Spatially and temporally complete satellite soil moisture data based on a data assimilation method. Remote Sens. 2016, 8, 49. [Google Scholar] [CrossRef]
  155. Mardian, J. The role of spatial scale in drought monitoring and early warning systems: A review. Environ. Rev. 2002, 30, 438–459. [Google Scholar] [CrossRef]
  156. Sun, L.; Mitchell, S.W.; Davidson, A. Multiple drought indices for agricultural drought risk assessment on the Canadian prairies. Int. J. Climatol. 2012, 32, 1628–1639. [Google Scholar] [CrossRef]
  157. Hazaymeh, K.; Hassan, Q. A remote sensing-based agricultural drought indicator and its implementation over a semi-arid region, Jordan. J. Arid Land 2017, 9, 319–330. [Google Scholar] [CrossRef]
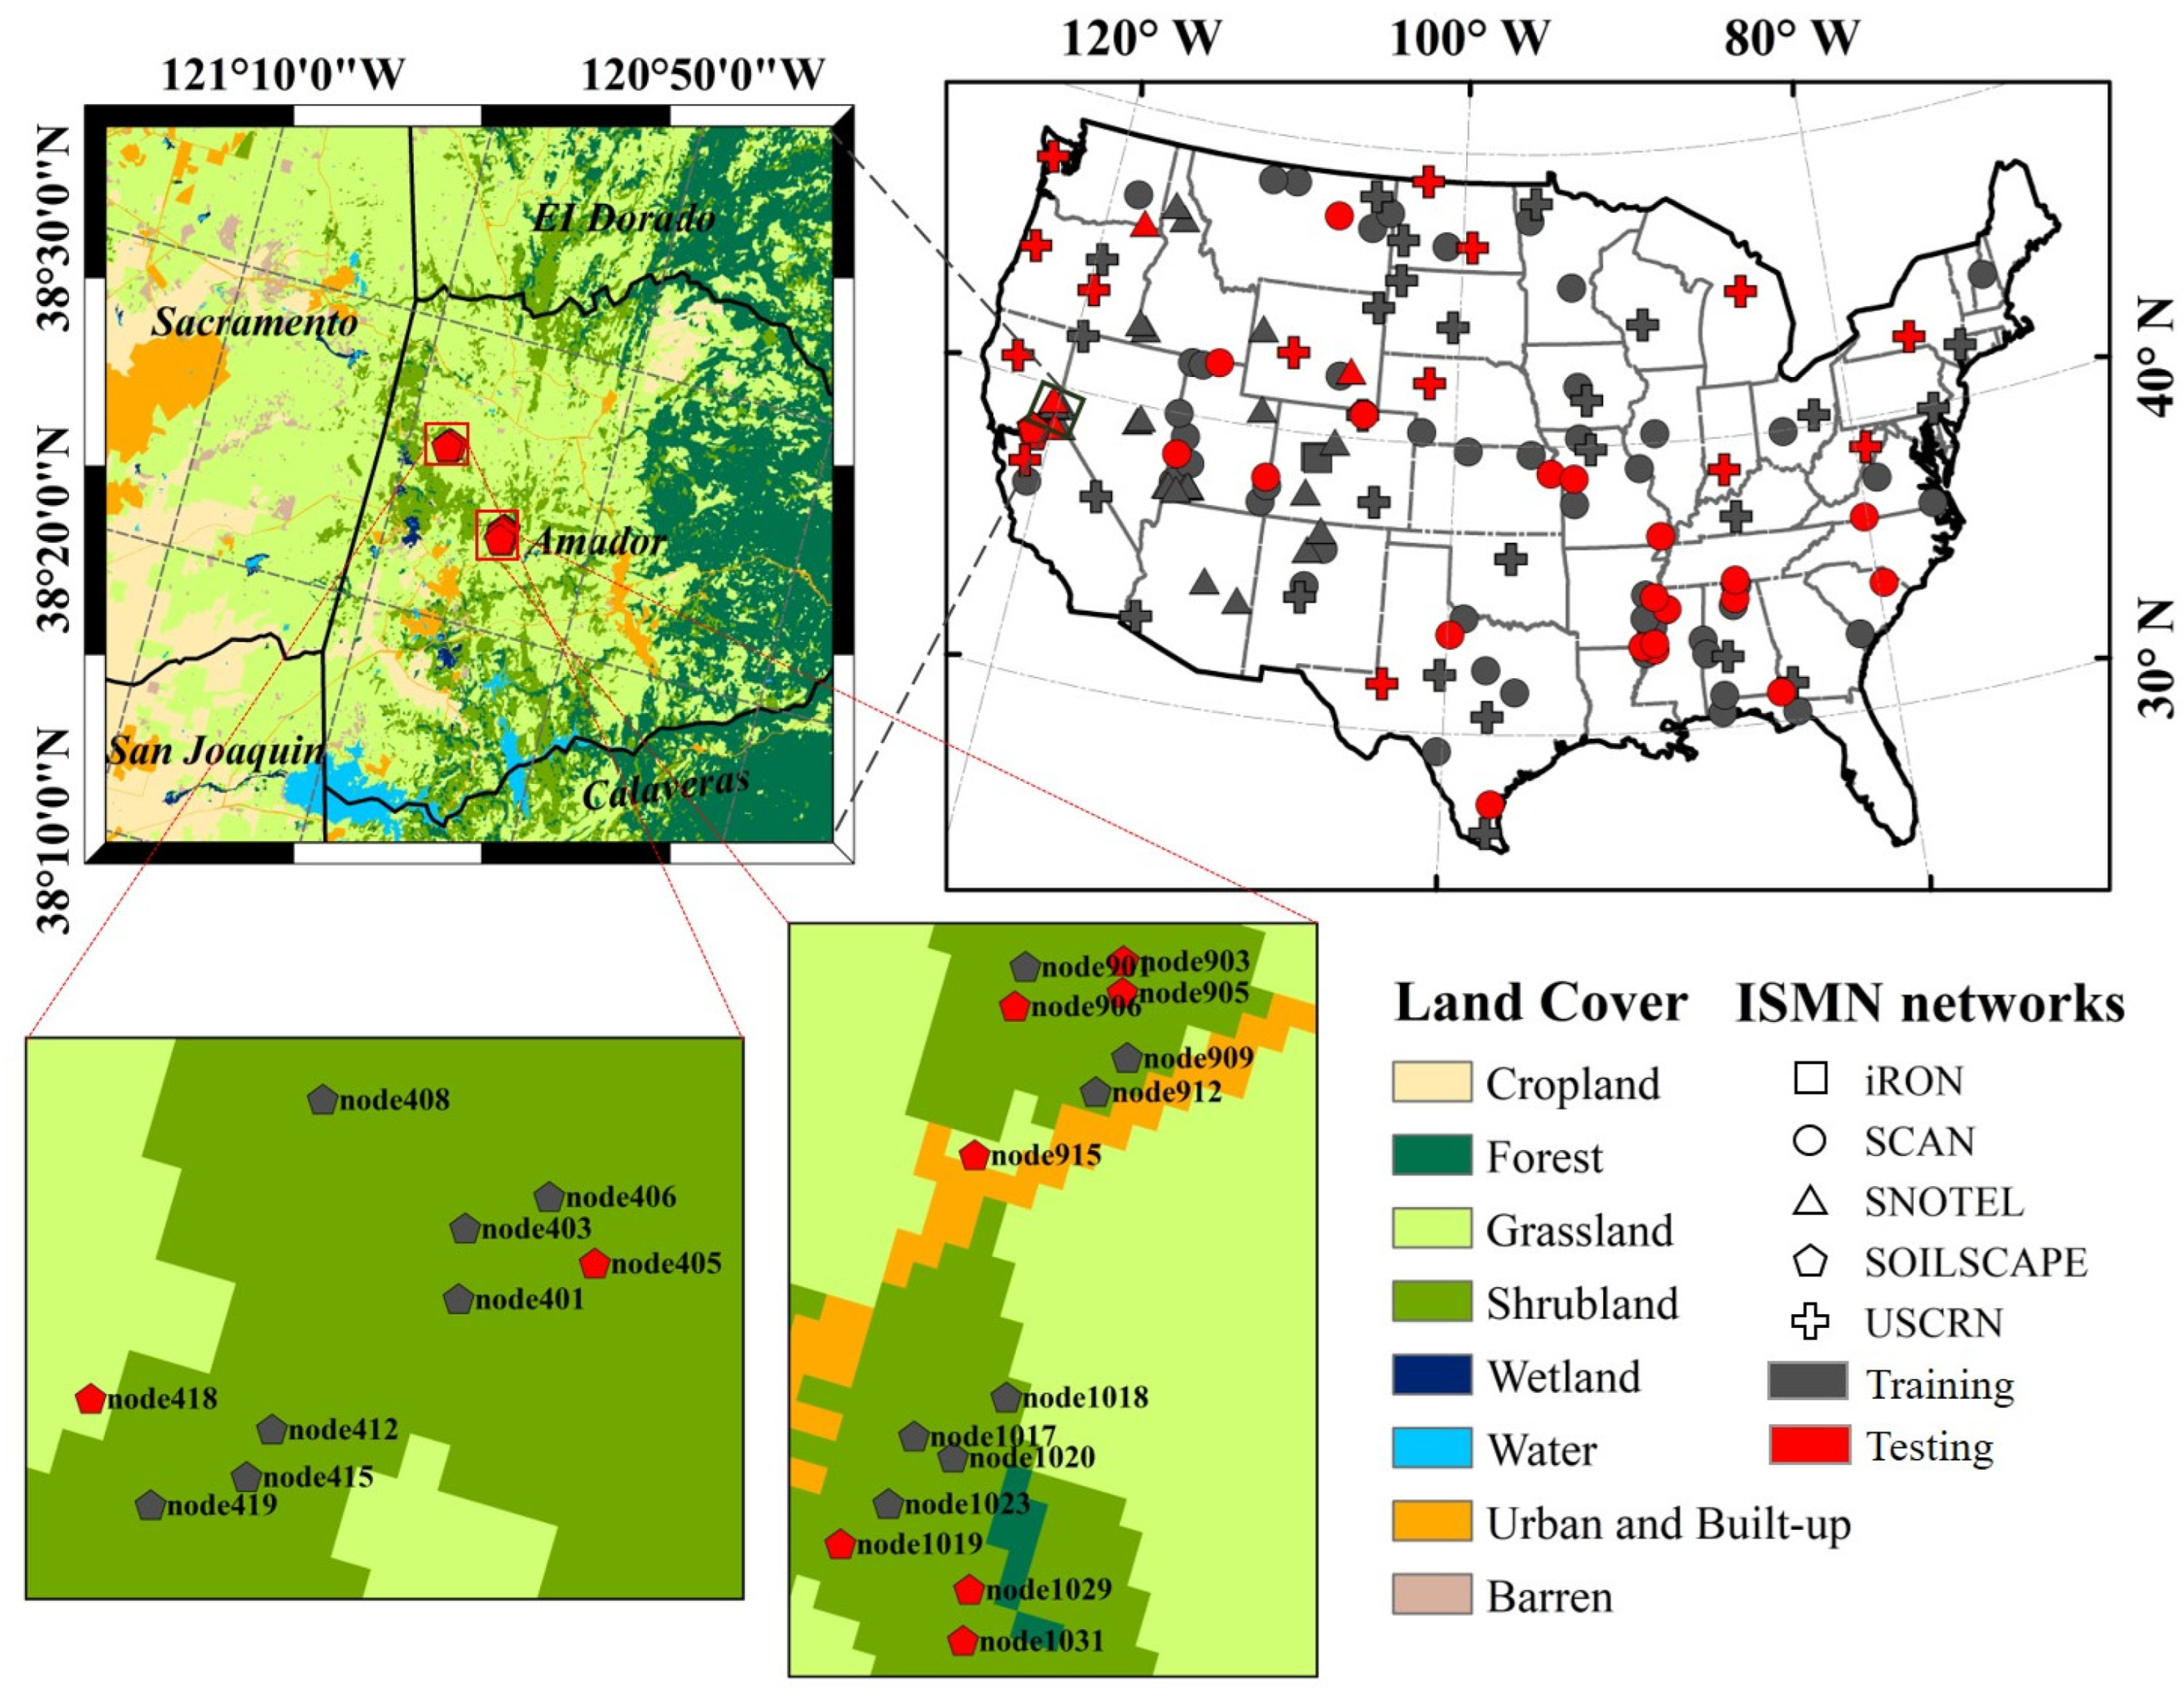
Figure 1. The spatial distribution of training and testing stations used in the downscaling framework. The map of land cover types of the substudy area and the locations of the in situ observation stations appear at the top left and bottom, respectively.
Remotesensing 16 03372 g001
Figure 2. Downscaling framework for the surface SM at 30 m through the integration of multiple datasets.
Remotesensing 16 03372 g002
Figure 3. Scatterplots of the comparison for the RF-SM data and SM derived from in situ observations at (a) 170 training stations and (b) 72 independent validation stations. The color indicates the density of the samples distributed in the area.
Remotesensing 16 03372 g003
Figure 4. Permutation importance of RF-SM. The features (i.e., input variables) include the SM products (SMAP, SMOS, ESA CCI, and NCA-LDAS), the soil properties (clay, sand, and silt), and the reflectance at visible and near-infrared bands (from SR_b4 to SR_b7), as well as the surface temperature (ST_b10) derived from Landsat 8.
Remotesensing 16 03372 g004
Figure 5. Boxplots of the in situ SM, RF-SM data, and the four SM products (SMAP, SMOS, NCA-LDAS, and KGE) for different land cover types. In the single boxplots, the red cross-dots denote outliers; the lowest and highest lines denote minimum and maximum results, respectively, except for extreme values (outliers); and the lower bound of the box, red line in the box, and upper bound of the box represent the lower quartile (25%), the median, and upper quartile (75%), respectively.
Remotesensing 16 03372 g005
Figure 6. Diagrams of the statistics (R2, RMSE, Bias, and KGE) for the comparison between the RF-SM dataset and the four SM products (SMAP, SMOS, NCA-LDAS, KGE) for the different observation networks.
Remotesensing 16 03372 g006
Figure 7. Temporal variations in precipitation (P) and surface SM derived from RF-SM and the four products at the representative stations in the substudy area during 2016.
Remotesensing 16 03372 g007
Figure 8. Spatial distributions of the RF-SM in the substudy area during 2016.
Remotesensing 16 03372 g008
Figure 9. Comparison between the RF-SM-SWDI and VHI based on the Pearson correlation coefficient (R) from 242 in situ stations in 2016.
Remotesensing 16 03372 g009
Figure 10. Temporal variations in SM-SWDI, RF-SM-SWDI, VHI, and precipitation (P) anomalies at the representative stations in the substudy area in 2016.
Remotesensing 16 03372 g010
Figure 11. Spatial distributions of the RF-SM-SWDI and VHI in the substudy area in 2016.
Remotesensing 16 03372 g011
Figure 12. Comparison between the RF-SM-SWDI and VHI based on the Pearson correlation coefficient (R) in the substudy area in 2016.
Remotesensing 16 03372 g012
Figure 13. Comparison between the RF-SM-SWDI and two VHI components: (a) VCI and (b) TCI, based on the Pearson correlation coefficient (R) in the substudy area in 2016.
Remotesensing 16 03372 g013
Figure 14. Spatial distributions of the RF-SM-SWDI, RF-SM-SWDI after resampling, and the short-term drought blend (STDB) in the substudy area in 2016.
Remotesensing 16 03372 g014
Table 1. The datasets used in the downscaling framework.
DatasetsDetailsDescriptionVariablesSpatial
Resolution
Temporal
Resolution
In situ datasetISMNIn situ SMSMPointHourly
Optical remote sensing datasetLandsat 8 surface reflectanceRed bandSR_b430 m16-day
NIR bandSR_b5
SWIR bandSR_b6
SWIR bandSR_b7
ST bandST_b10
Soil properties datasetSoilGrids V.2.0Clay contentClay250 mStatic
Sand contentSand
Silt contentSilt
Meteorological datasetERA 5Relative humidityRH0.25°3 h
Atmospheric temperatureT2m
WindWind
PrecipitationPrecipitation
Soil moisture productsSMAPSatellite-derivedSM36 kmDaily
SMOS-ICSatellite-derivedSM25 kmDaily
NCA-LDASModel-derivedSM0.125°Daily
ESA CCISatellite-derivedSM0.25°Daily
Table 2. SWDI and VHI classifications used in this study for different drought severities.
SWDI ValueVHI ValueDrought Severity
≤−100 to 10Extreme drought
−10 to −510 to 20Severe drought
−5 to −220 to 40Moderate drought
−2 to 040 to 60Mild drought
≥060 to 100No drought
Disclaimer/Publisher’s Note: The statements, opinions and data contained in all publications are solely those of the individual author(s) and contributor(s) and not of MDPI and/or the editor(s). MDPI and/or the editor(s) disclaim responsibility for any injury to people or property resulting from any ideas, methods, instructions or products referred to in the content.