Article

Cumulative and Lagged Effects: Seasonal Characteristics of Drought Effects on East Asian Grasslands

1
College of Forestry, The Northeast Forestry University, Harbin 150040, China
2
Mills College, Northeastern University, Oakland, CA 94613, USA
3
Soil and Water Conservation Monitoring Center of Songliao Basin, Songliao Water Resources Commission, Changchun 130021, China
*
Author to whom correspondence should be addressed.
Remote Sens. 2024, 16(18), 3478; https://doi.org/10.3390/rs16183478
Submission received: 25 July 2024 / Revised: 14 September 2024 / Accepted: 17 September 2024 / Published: 19 September 2024

Abstract

:
With the acceleration of global warming, droughts are expected to both intensify and become more frequent. More so than forests, the productivity of grasslands is largely controlled by soil moisture and is highly susceptible to drought. Drought can impact grasslands though the effects may lag and accumulate over time. Because prior research has mainly focused on the annual or growing season scale, it remains unclear whether there are seasonal differences in the cumulative and lagged effects (CALEs) of drought. This study uses Normalized Difference Vegetation Index (NDVI) and Standardized Precipitation Evapotranspiration Index (SPEI) data to explore the seasonal characteristics of the CALEs of drought on grassland growth in East Asia from 2001 to 2020. The main results include the following: (1) More than 40% of grasslands are significantly affected by the CALEs of drought for all three seasons (spring, summer, and autumn). (2) Grasslands are more sensitive to the CALEs of drought in summer. The spatial variability of the cumulative time scale is the greatest in spring, whereas the spatial variability of the lagged time scale is the greatest in summer. The lag time scale gradually shortens as moisture decreases in summer and autumn but shows an inverted U-shape in spring. As drought conditions intensify, the cumulative time scale gradually increases in spring and autumn, while gradually decreasing in summer. (3) The dominant drought effects vary among different seasons: the lagged effect (LE) predominates in spring and autumn, whereas in summer it is the cumulative effect (CE) that dominates. The LE exceeds the CE in 54.89% of the study area during the growing season. We emphasize that annual- or growing season-scale studies of drought CE and LE may obscure seasonal response characteristics. Given the seasonal nature of droughts and the seasonally varying sensitivities of grassland growth to these droughts, the impacts on vegetation fluctuate significantly across different seasons. The results help us more accurately predict grassland ecosystem changes under the background of global warming and the increasing probability of severe drought, providing important reference values for future grassland ecological protection and planning.

1. Introduction

Drought is a recurrent natural disaster characterized by prolonged water shortages that affect the growth of vegetation, potentially leading to vegetation death due to water stress. Under conditions of global warming, drought is increasing in both intensity and frequency in many parts of the world [1,2,3] and significantly affects worldwide land ecosystems [4]. Drought leads to reduced vegetation coverage, changes in species composition, altered soil texture, and reduced soil nutrients for grassland ecosystems, adversely affecting productivity and biodiversity and threatening the ecosystem services provided by grasslands [5]. Numerous studies indicate that, compared to other ecosystems such as forests, grassland ecosystems are more sensitive to drought [6], and their productivity is largely controlled by soil moisture. Grassland ecosystems are important carbon sinks, storing 34% of the total carbon in terrestrial ecosystems [7], and they play a crucial role in maintaining regional biological balance and regulating climate [8]. Studying the effects of drought on grasslands is of significant practical and scientific value, serving as a foundation for examining how forthcoming climate variations will affect grasslands and the carbon cycle [9].
There is an extensive literature of research on the responses of vegetation to drought. Many scholars find that vegetation growth may not be solely limited just by current moisture conditions but also by earlier drought events, demonstrating a significant lagged effect (LE) of drought on vegetation growth [10,11], The LE refers to the influence of prior drought conditions (excluding the current month) on current vegetation activity. Additionally, the persistent presence of soil moisture stress, known as the cumulative effect (CE) of drought, also plays a crucial role in vegetation activity [12]. The CE builds on and deepens the LE by considering the impact of drought conditions over continuous time spans on current vegetation growth [13]. Understanding the cumulative and lagged effects (CALEs) is essential for comprehending the interactions between drought and vegetation growth, assessing vegetation tolerance to drought, and implementing more effective strategies for vegetation management.
Recently, studies have directed more attention to the impacts of the effects, both lagged and cumulative, of drought on vegetation. For example, Vincente-Serrano et al. (2013) [14], employing the Standardized Precipitation Evapotranspiration Index (SPEI), found that more than 70% of terrestrial vegetation around the world is affected by persistent drought. J. Peng et al. (2019) [10] found that drought has a CE and LE on vegetation in the Northern Hemisphere. Wang et al. (2023) [6] analyzed the effects of drought and human activities on vegetation growth in China using the SPEI combined with the Normalized Difference Vegetation Index (NDVI) and a novel index of land use intensity, finding that drought has both an LE and CE on most vegetation. Researchers further studied the impact of the CALEs of drought on the growth of different types of vegetation. Gu et al. (2021) [15], using the SPEI and NDVI, found that in Inner Mongolia, the lag time scale of grasslands and farmlands is shorter than that of forests. Wei et al. (2023) [16] found that different vegetation types exhibit varying responses to the CALEs of drought, with grasslands being more susceptible to these effects than forests. Among studies focused on the drought response of grasslands, Zhao et al. (2020) [17] noted that the LE of drought affects half of the grasslands in the Loess Plateau of China; Liu et al. (2023) [18] indicated that under different available water conditions, the lagged months initially decrease and then increase with the increase in available water; and Wei et al. (2022) [19] found that globally, the CE of drought on grassland gross primary productivity (GPP) is greater than the LE.
However, to date, research on the CALEs of drought on the vegetation NDVI has been mainly based on annual or growing season scales. Studies have shown that the vegetation NDVI exhibits seasonal variations in response to climate conditions [20], but the characteristics of NDVI responses to drought LE and CE across different seasons remain largely unknown. In fact, the relationship between drought and vegetation varies across plants’ lifespans, primarily due to the differing climate conditions and growth stages [21,22,23]. Previous studies have indicated that forests and deserts are likely to expand globally at the expense of grasslands, particularly in the Northern Hemisphere [24]. Additionally, Wang et al. (2017) found that the most significant reductions in global productivity due to drought occurred in the mid-latitude regions of the Northern Hemisphere [25]. In recent decades, the frequency of summer heatwaves in inland East Asia has increased, and the compounded extremes of summer heatwaves and heatwave-droughts may occur more frequently and potentially become more severe in this region [26]. Therefore, it is necessary to further investigate the seasonal characteristics of the LE and CE of drought on mid-latitude grasslands in East Asia. This is crucial for understanding the complexity of drought impacts on ecosystems and implementing more effective vegetation management strategies [27,28,29].
The NDVI, the Normalized Difference Vegetation Index, is a good indicator of vegetation growth status and spatial distribution density obtained from infrared and near-infrared remote sensing data, and is linearly correlated with vegetation distribution density [30,31,32]. The NDVI is a widely used metric in analyses of changes in vegetation cover and growth conditions, as well as to study vegetation responses to climate change [33]. Moreover, the NDVI is highly sensitive to drought, effectively detecting and assessing vegetation drought conditions and establishing relationships with drought indices to reveal the relationship between vegetation and drought. This study also uses the Standardized Precipitation Evapotranspiration Index (SPEI) as a climate drought index to represent drought conditions. Using the Pearson correlations between the SPEI and NDVI, this study explores the response patterns of grassland NDVI to drought in East Asia from 2000 to 2020. This study aims to answer the following questions: Does drought have an LE or CE on the grassland NDVI in all seasons in East Asia? Do these effects show seasonal differences, and what determines these differences? Do the characteristics of these effects relate to spatial and seasonal differences in moisture conditions? Are the seasonal impacts of drought on grasslands primarily related to LEs or CEs? The results can provide insights into the response mechanisms of grassland vegetation to drought, offering a scientific basis for grassland ecosystem management and conservation. This has important reference value for maintaining the ecological service functions of East Asian grasslands, predicting future vegetation dynamics, and addressing global warming.

2. Materials and Methods

2.1. Study Area

The study area is located in eastern Asia, between 90° and 135°E longitude and 40° and 55°N latitude (Figure 1a,b). The area includes two main regions: the Northeast China region—including the Northeast China Plain, the Greater and Lesser Khingan (Xing’an) Mountains, and the Changbai Mountains —and the Mongolian Plateau—including both Inner and Outer Mongolia. This area exhibits diverse climate variations, changing from humid and semi-humid to semi-arid and arid from east to west. From south to north, it includes warm temperate, temperate, and cold temperate zones. The annual rainfall ranges from approximately 200 to 1000 mm, decreasing from east to west. And there are significant differences in seasonal water conditions in the region, with summer being drier compared to spring and autumn (Figure 1d). The northeast region, encompassing the Chinese provinces of Heilongjiang, Jilin, and most of Liaoning, is influenced by the East Asian monsoon, with long, cold winters and short, warm summers; the main grassland types are savanna and woody savanna, with forests primarily located in the northeastern mountainous area. The Mongolian Plateau, located in the interior of the Asian continent, is one of the largest inland plateaus in eastern Asia and is characterized by an arid to semi-arid climate, rarely affected by the monsoon; it includes the nation of Mongolia, the Inner Mongolia autonomous region in China, and portions of southern Siberia in Russia and is dominated by grasslands. The region is a typical ecologically sensitive area known for severe soil erosion.

2.2. Vegetation NDVI Data Source and Processing

The NDVI data from January 2001 to December 2020 were sourced from NASA’s MOD13A1 product (https://ladsweb.modaps.eosdis.nasa.gov/search/order/1/MOD13A1--61 (accessed on 1 October 2023)). The dataset features a spatial resolution of 500 m and a temporal resolution of 16 days. The Maximum Value Composite (MVC) method was used to generate monthly NDVI datasets from the two NDVI images within each month. We excluded areas with a mean NDVI value of less than 0.1 during the growing season, because studies have shown that such areas have essentially no vegetation cover [34,35]. To effectively express the relationship between drought and grassland NDVI, this study chose the growing season (April to October) to analyze the impact of drought on grassland NDVI. Following on previous studies [36,37], we defined April-May as spring, June-August as summer, and September-October as autumn.

2.3. Vegetation Type Data and Processing

The MCD12Q1 dataset (https://ladsweb.modaps.eosdis.nasa.gov/search/order/1/MCD12Q1-6 (accessed on 1 October 2023)) provides annual distributions of different types of land coverage worldwide, derived from MODIS imagery, with a spatial resolution of 500 m. Of the five classification schemes included, we adopted the IGBP scheme, and selected pixels with three of the 17 global land surface types, representing wooded grassland, savanna, and grassland, hereinafter collectively referred to as grassland [38] (Figure 1c). To minimize interference from changes in vegetation types, we used ArcGIS 10.8 software to analyze land use changes and extracted grassland areas with unchanged land cover types from 2000 to 2020 [39,40] (Figure 1c).

2.4. SPEI Data Source and Processing

The global SPEI database, SPEIbasev.2.8 (https://spei.csic.es/database.html (accessed on 15 August 2023)), identifies drought conditions with a time scale from 1 to 48 months and a 0.05° spatial resolution. We used the SPEI dataset to quantify the occurrence of drought in our study area in terms of severity and duration. The SPEI dataset has been proven reliable for evaluating the impact of drought on vegetation growth and the NDVI. We selected the SPEI dataset at a 1–12-month scale from 2001 to 2020 and resampled it using bilinear interpolation to achieve the same spatial resolution as the NDVI dataset [15].

2.5. Research Methods

2.5.1. Cumulative Effect of Drought on NDVI

The Pearson correlation coefficient (r) was employed to examine the extent and duration of the climatic effect of drought on the grassland NDVI in northeastern Asia [10,17] using monthly data during the entire seven-month growing season (April to October). This study selected monthly NDVI images during the growing season from 2001 to 2020 for the grassland area in northeastern Asia, forming a time series of 140 images, combined with the SPEI sequence at the i-month scale corresponding to each monthly NDVI (1 ≤ i ≤ 12). Then, the cumulative time scale r for i months was calculated, and 12 correlation coefficients were generated. Rmax-cum was determined as the CE magnitude. The SPEI cumulative months with the highest correlations with the NDVI, represented by Rmax-cum, are considered the time scale of the CE [18,41]. For example, if the highest correlation between the grassland NDVI and SPEI is at a 6-month scale, it indicates that the specific image element has a 6-month cumulative drought impact. This shows that the drought conditions accumulated over the previous 6 months have the greatest impact on vegetation photosynthesis.
The calculation equations are as follows:
r i = c o r r   ( N D V I ,   S P E I i ) 1     i   12
R max-cum = m a x   ( | r i   | )   1     i   12
where NDVI represents the monthly values during the growing seasons of all years, ri is the correlation coefficient between NDVI and SPEI, i is the cumulative SPEI scale from 1 to 12 months, SPEIi is the SPEI at a given scale, and Rmax-cum is the maximum value of ri.

2.5.2. Lagged Effect of Drought on the NDVI

The LE of drought on grassland the NDVI is also characterized by calculating the Pearson correlation coefficient. The NDVI time series for the growing season (April to October) from 2001 to 2020 was combined with the SPEI sequence for the previous j months to calculate the lag time scale r for j months (1 ≤ j ≤ 12). This process was repeated to generate 12 correlation coefficients for each month’s NDVI values as shown in Equations (3) and (4):
r j = c o r r   ( N D V I ,   S P E I j ) 1 j 12
R max-lag = m a x   ( | r j | ) 1 j 12
where NDVI represents the monthly values during the growing seasons of all years, rj is the correlation coefficient between NDVI and SPEI, j is the lag time scale of SPEI, SPEI is the SPEI lagged by j months, and Rmax-lag is the maximum value of rj.
For example, the spring sequence was defined as April-May, resulting in 40 calculations (2 months × 20 years), and so on. That is, if the lag scale is 2 months, the monthly SPEI data from February to August 2001–2020 can be correlated with the monthly NDVI during the growing season (April to October) from 2001 to 2020. This can be extended to a lag of up to 12 months. Finally, the highest correlation coefficient Rmax-lag was selected, and the corresponding lagged months were taken as the lag time scale for that specific pixel. For example, if the NDVI of grassland in July is most correlated with the 1-month scale SPEI of March, the lag response time scale of the grassland NDVI to drought is recorded as 4 months, indicating that the drought conditions 4 months earlier have a critical impact on changes in the grassland NDVI.
To assess how the LE and CE vary with different moisture conditions, this study selected the SPEI12 of December from 2001 to 2020 as the annual average water balance condition. The water balance gradient was determined using the annual average SPEI at 0.1 intervals. Then, the mean r j values and corresponding cumulative and lagged months of the CALEs were regressed against the annual average SPEI along the water balance gradient to evaluate the impact of moisture conditions [17].

3. Results

3.1. Cumulative Effect of Drought on the Grassland NDVI

3.1.1. Spatial Distribution Characteristics of the Cumulative Effect

From our correlation analysis of the cumulative SPEI and NDVI at different scales, we obtained the maximum correlation coefficient (Rmax_cum) and the cumulative months of the CE. During the growing season, positive correlations between the NDVI and SPEI appear in 64.62% of the study area, but negative correlations can be seen in semi-humid, high-altitude, and high-latitude areas (Figure 2a). The proportion of areas with a significant positive correlation was 49.88%, mainly concentrated in eastern Inner Mongolia and northeastern Mongolia, while significant negative correlations comprised 14.74% of the study area, concentrated in high-latitude, semi-humid regions (Figure 2a).
Overall, 66.52% of the grasslands in the study region were significantly affected by a CE (p < 0.05). In each season, there are differences in the areas significantly affected by a CE, but positive correlations dominate in all seasons. In spring, 42.71% of the grassland was significantly affected by a CE (p < 0.05), with 33.99% showing a significant positive correlation (Figure 2c). In summer, 75.00% of the grassland was significantly affected by a CE, with 73.49% showing a positive correlation (Figure 2e). In autumn, 41.37% of the grassland was significantly affected by a CE, with 28.67% showing a positive correlation (Figure 2g). In terms of area statistics and the mean values of the range of maximum correlation coefficients, the cumulative effect in summer is greater than in spring and autumn. (Table 1).
During the growing season, the average cumulative months was 5.67 months, which is close to the result of 5.28 months found by Zhang et al. (2022) [41] for grasslands globally. The accumulated drought over a 10-month time scale had the most widespread impact on grasslands in the study area (20.79%), mainly distributed in central and eastern Inner Mongolia and northern Mongolia, followed by droughts of 1 month (17.97%), 2 months (16.98%), and 3 months (11.08%) (Figure 2b). Additionally, the shorter drought time scales mainly occurred in northeastern and northwestern Mongolia and southern Siberia, while the longer drought time scales occurred in central and southeastern Inner Mongolia and northern Mongolia (Figure 2b). In spring, the average cumulative months was 7.56 months. Droughts accumulated over 9–10 months had the most widespread impact on grasslands in the study area (38.42%, Figure 2d). In summer, closer to the growing season, the average cumulative months was 5.98 months. The drought of 10 months affected the highest portion of the study area (20.38%), but nearly half of the grassland area showed effects in summer from shorter drought time scales, with 1- to 3-month droughts accounting for 47.05% (Figure 2f). In autumn, the average cumulative months was 3.3 months, with droughts of 1–4 months accounting for 86.23% of the grassland area that was largely affected (Figure 2h).

3.1.2. Temporal Characteristics of the Cumulative Effect

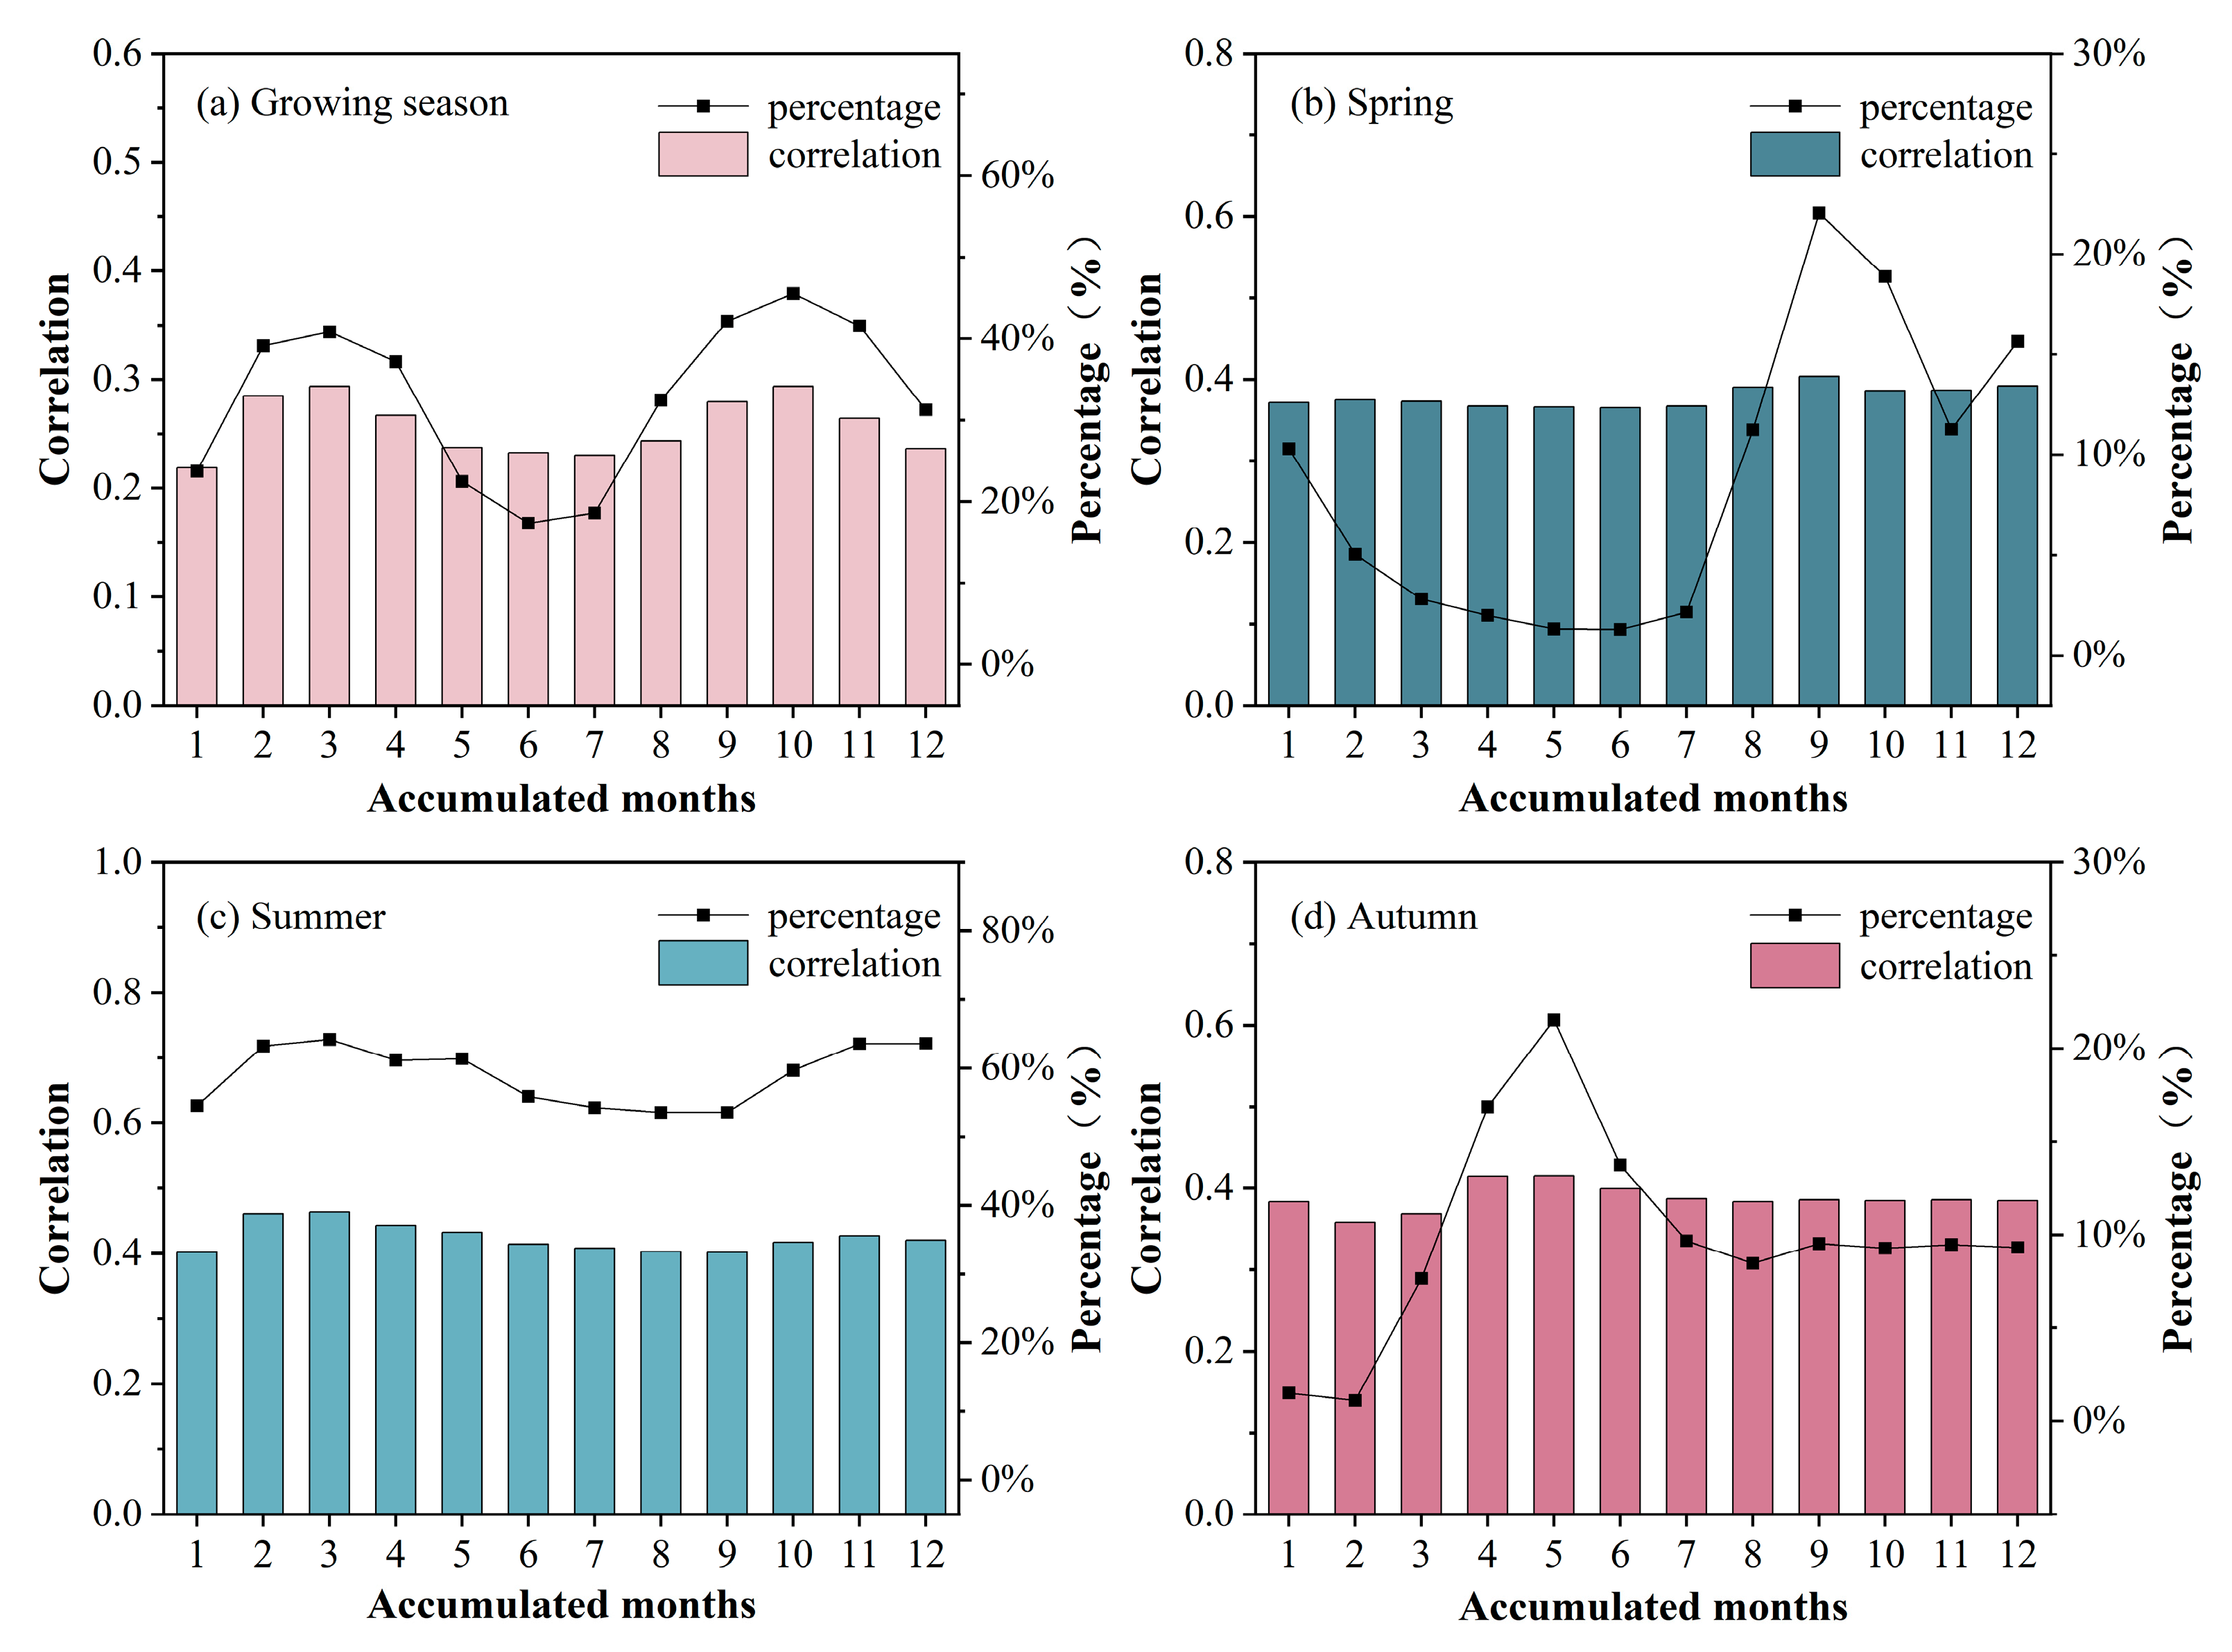
The correlation between the cumulative SPEI and NDVI varies significantly across different time scales, showing a bimodal pattern throughout the growing season (Figure 3a). The correlation between the NDVI and cumulative SPEI generally increases between 1 and 3 months, then decreases, rises again from 7 to 10 months, and then decreases again (Figure 3a). The maximum and minimum values occur, respectively, at 10 months (r = 0.29, p < 0.05) and 1 month (r = 0.219, p < 0.05). The areas with significant positive correlations between the NDVI and cumulative SPEI at 1, 5, 6, and 7 months are all below 30% (Figure 3a) and are mainly distributed in central Inner Mongolia and eastern Mongolia. As the cumulative time scale increases, the peaks at 3 months (41%) and 9–11 months (42%, 46%, 42%) are mainly distributed in southeastern and central Inner Mongolia and eastern and central Mongolia (Figure 3a).
Seasonally, the peak in spring occurs at 9 months, while the peak in autumn occurs at 5 months (Figure 3b,d). Summer is relatively stable with no obvious peak (Figure 3c). As can be seen from the figure, both the correlation and the area of each time scale are higher in summer than those in spring and autumn, but the overall fluctuations are relatively stable without obvious peaks in the summer, while in spring and autumn, they are more concentrated at certain time scales (Figure 3b–d). This suggests that the summer drought effect makes a significant contribution to the overall characteristic value of the growing season, for example, increasing the area of each cumulative time scale. However, the peaks observed in spring and autumn are more influential in contributing to the two respective fluctuations within this growing season time scale. Specifically, spring has a more substantial impact on the second peak of the growing season, whereas autumn significantly influences the first peak.

3.1.3. Cumulative Effect of Drought under Different Moisture Conditions

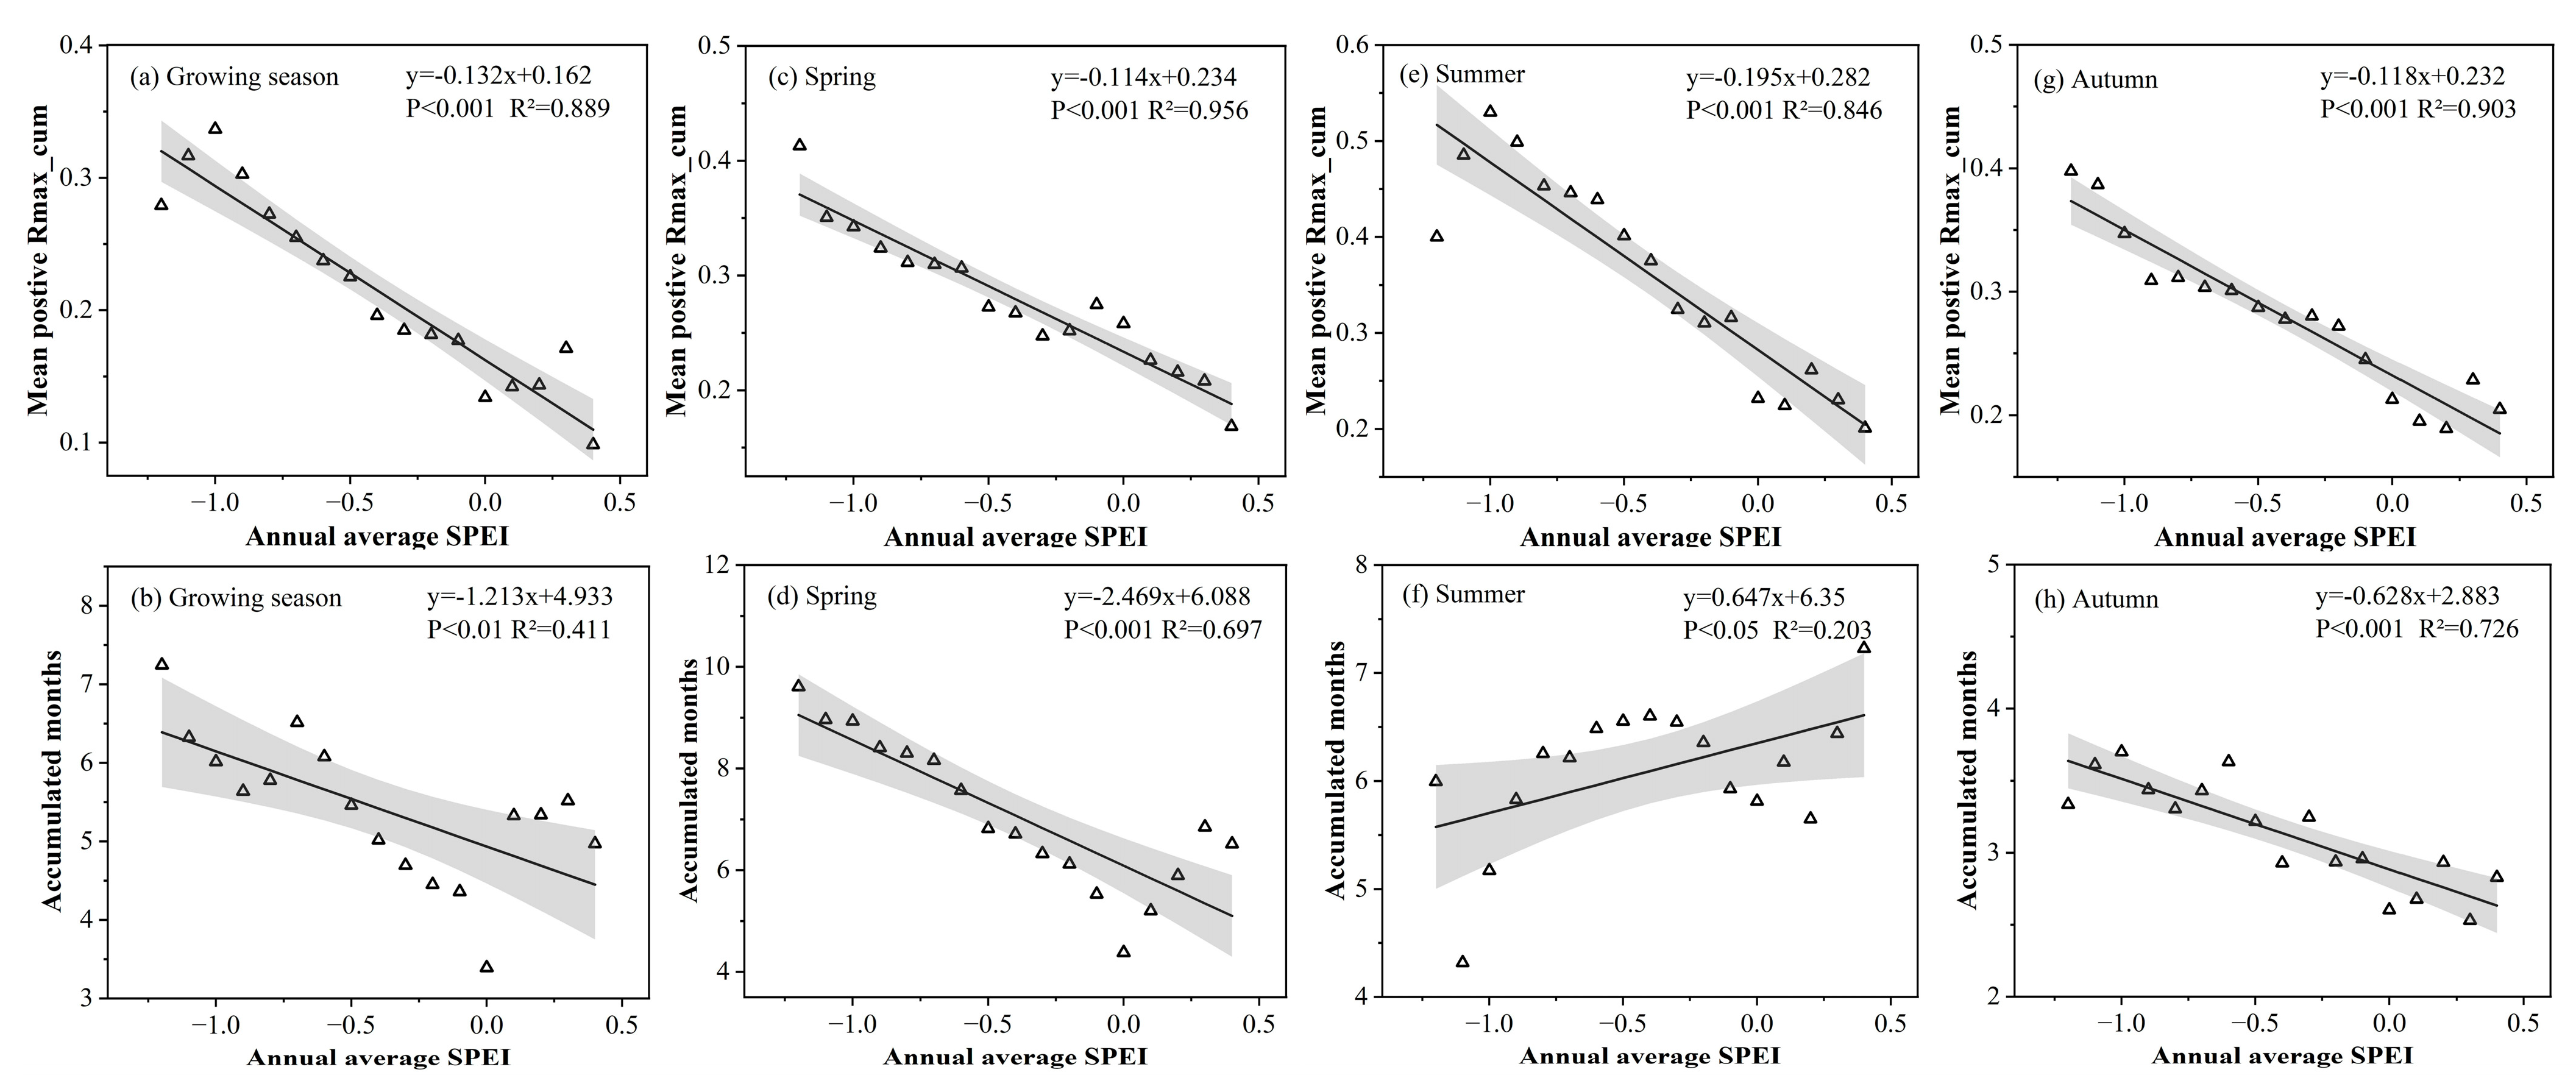
During the growing season, the correlation between the mean cumulative positive correlation coefficient and the annual average SPEI is negative, indicating that the grassland NDVI in arid regions generally experiences stronger drought accumulation (Figure 4a). This negative correlation is consistent in spring, summer, and autumn, contributing to a similar relationship for the growing season as a whole. Among the three seasons, the slope is 70% higher in summer than in spring and autumn, indicating that, in summer, grasslands are more sensitive or susceptible to the CE of drought (Figure 4c,e,g). This further elucidates why the area most significantly impacted by drought reaches its maximum extent in summer.
The correlation between the drought cumulative time scale and the annual average SPEI is negative. As the annual average SPEI value increases, the time scale of the CE shortens, indicating that the more abundant the water supply (i.e., the higher the annual average SPEI value), the shorter the accumulation time scale of drought (Figure 4b). In spring and autumn, the correlation between cumulative months and the annual average SPEI is negative, consistent with the trend during the growing season (Figure 4d,h). However, in summer, the correlation between cumulative months and the annual average SPEI is positive. As the annual average SPEI value increases, the time scale of the CE lengthens, indicating that in summer, the CE of drought on the grassland NDVI lasts longer in areas with better water conditions (Figure 4f). Among the three seasons, with the intensification of drought, the rate of increase in the cumulative time scale in spring is 280% higher than in summer and autumn, this means that the spatial variability of the CE time scale in spring is greater.

3.2. Lagged Effect of Drought on Grassland NDVI

3.2.1. Spatial Distribution Characteristics of the Lagged Effect

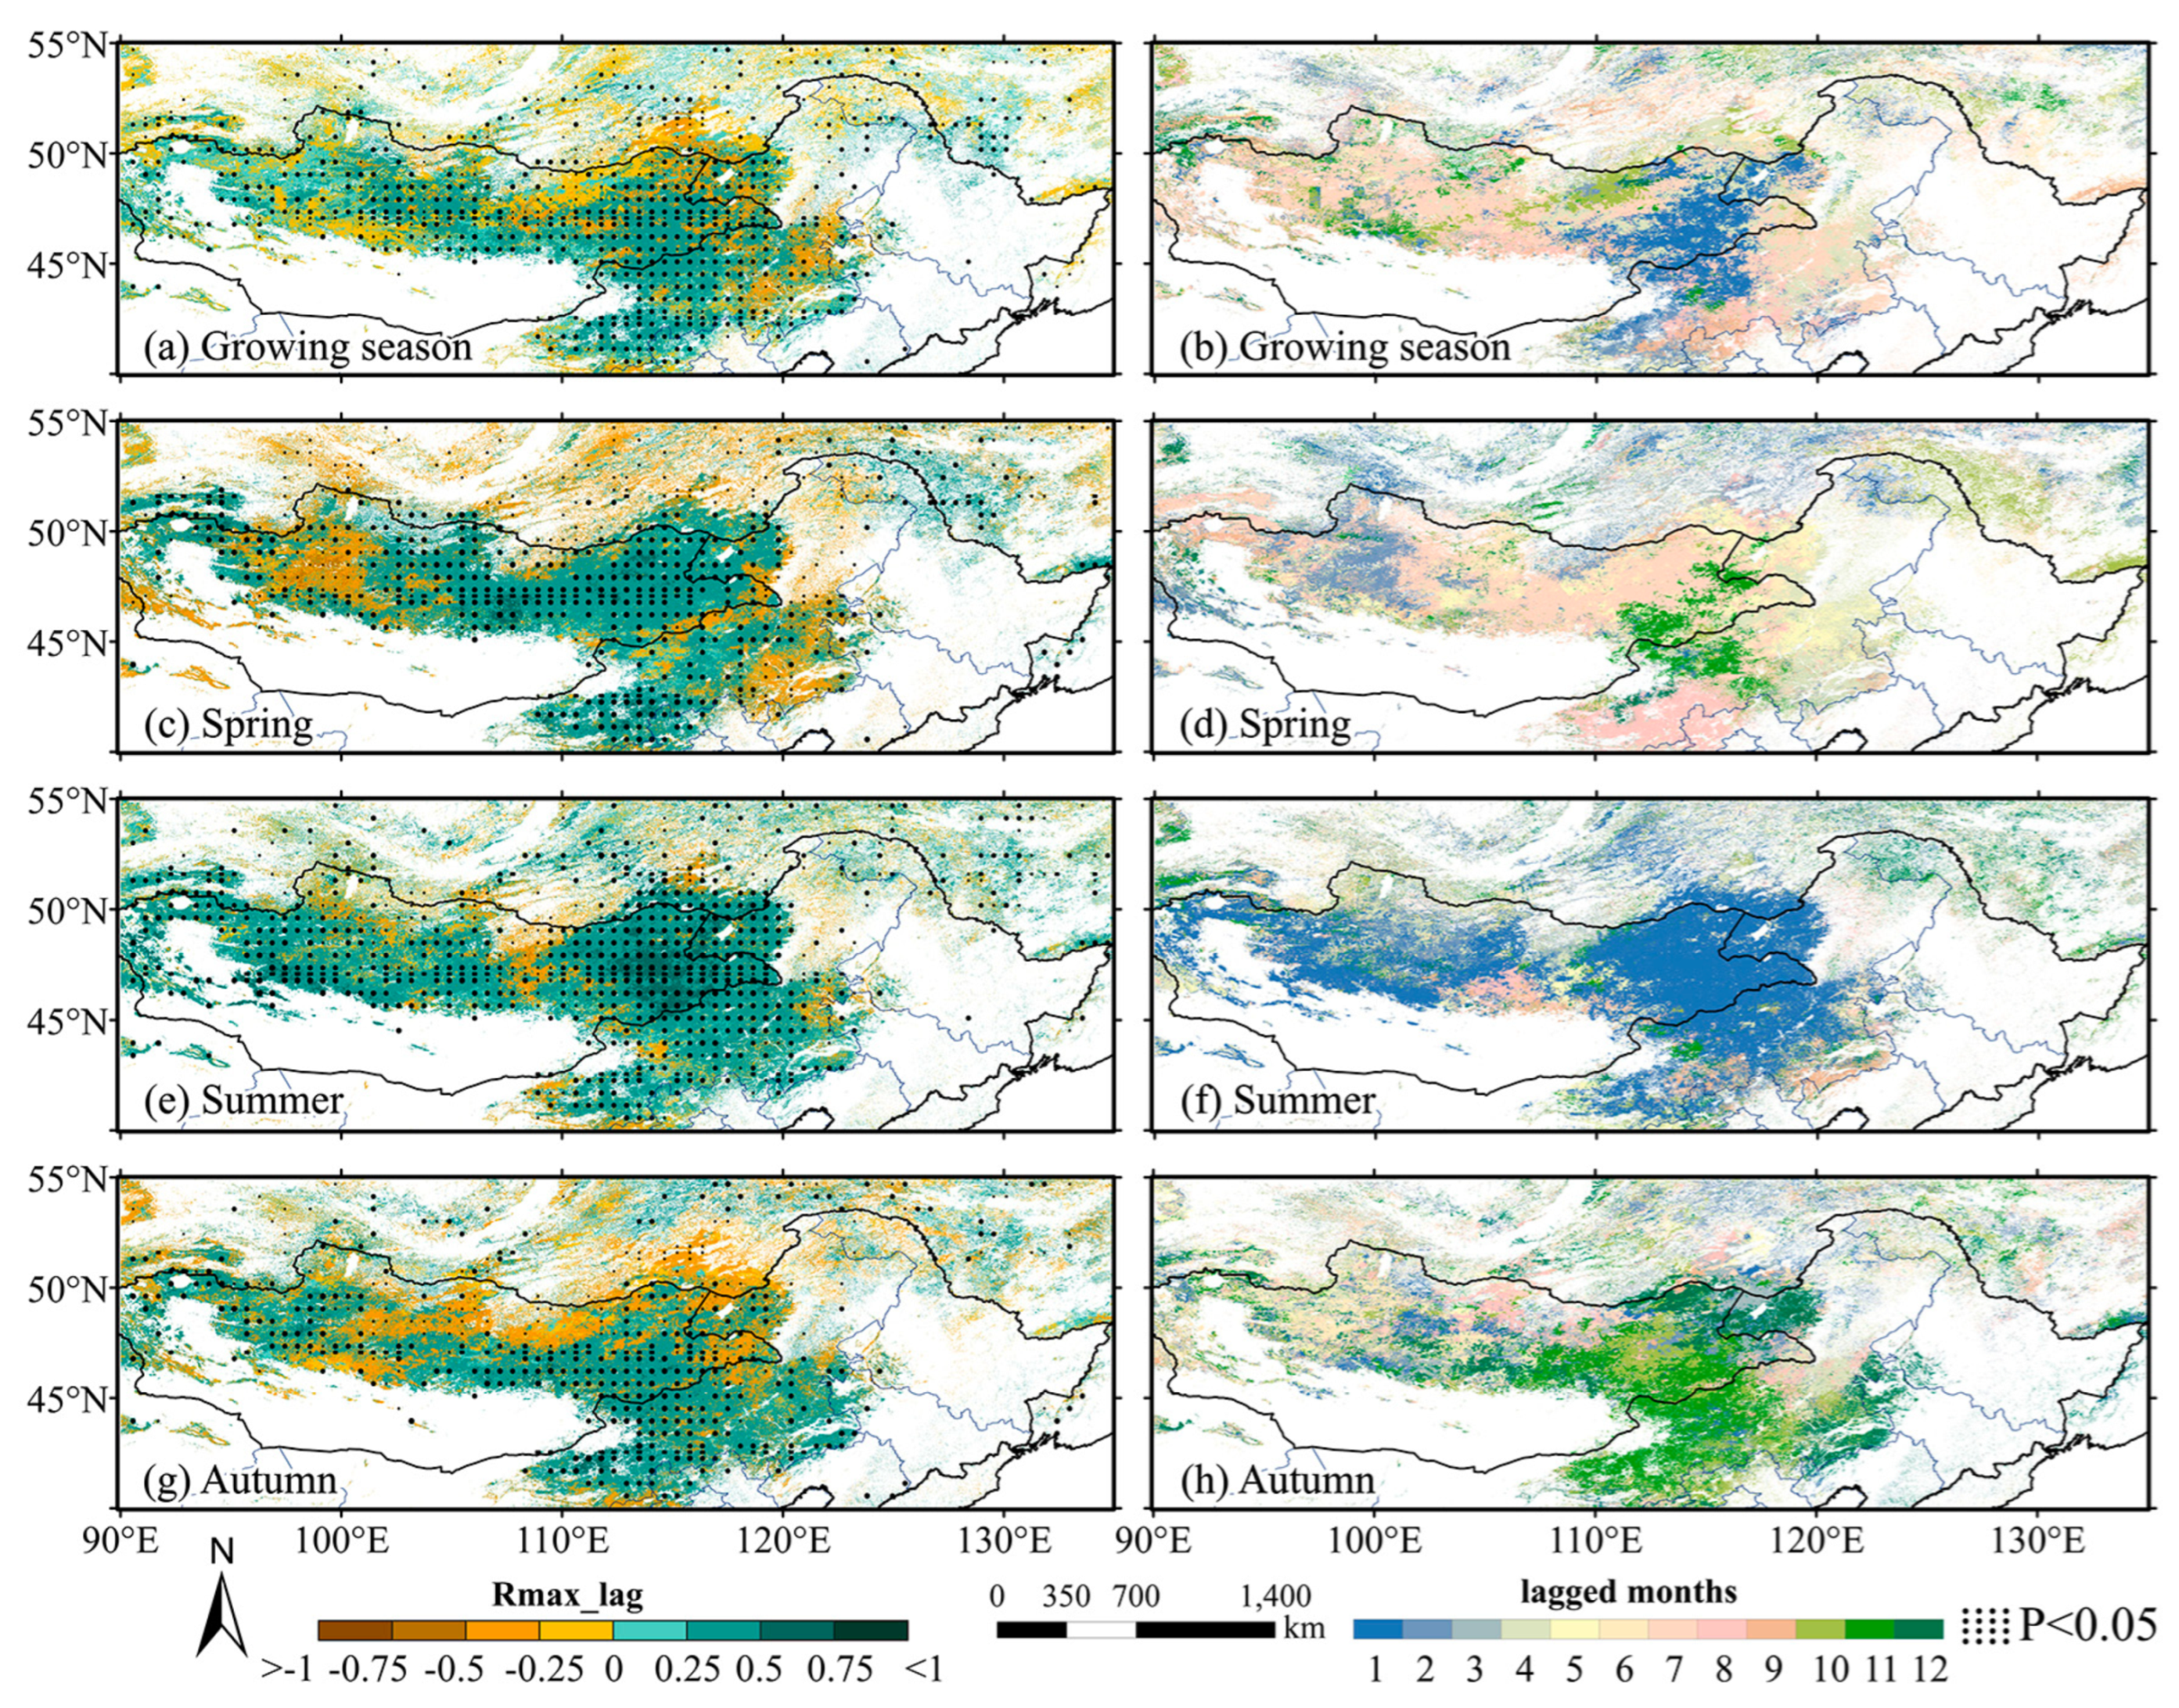
The spatial distribution of Rmax_lag between the grassland NDVI and one-month SPEI (SPEI01) is shown in Figure 5. During the growing season, the majority (63.81%) of the grassland NDVI is positively correlated with the SPEI, with 53.22% of the area showing a significant positive correlation, primarily concentrated in central and southeastern Inner Mongolia and northern Mongolia. The proportion of the area showing a significant negative correlation was 10.54%, mainly concentrated in the northern high-latitude regions (Figure 5a). In spring, 64.13% of the grassland area was significantly affected by a LE of drought, with 41.89% showing a significant positive correlation (Figure 5c). In summer, 76.99% of the grassland area was significantly affected by a LE, with 63.60% showing a positive correlation (Figure 5e). In autumn, 53.16% of the grassland area was significantly affected by a LE, with 36.88% showing a positive correlation (Figure 5g). In general, the mean Rmax-lag across seasons revealed no obvious differences between spring, summer, and autumn (Table 2).
The average lag time scale of drought affecting the grassland NDVI was 6.02 months, with 49.19% of the grasslands showing a lag response of 7–10 months. Drought lagged by 7 months had the largest widespread impact on grasslands in the study area (25.47% of the affected area), primarily in northern Mongolia and northeastern Inner Mongolia, followed by 1 month (14.84%) and 2 months (11.95%) (Figure 5a,b). In spring, the average lag time scale was 6.13 months, with 30.92% of the grasslands showing a lag response of 7–8 months. Drought lagged by 7 months affected 20.91% of the area. In summer, the average lag time scale was 4.02 months, with 47.59% of the grasslands most affected by a 1-month lagging drought. In autumn, the average lag time scale was 5.63 months, with 40.66% of the grasslands showing a lag response of 1–3 months (Figure 5d,f,h).

3.2.2. Temporal Characteristics of the Lagged Effect

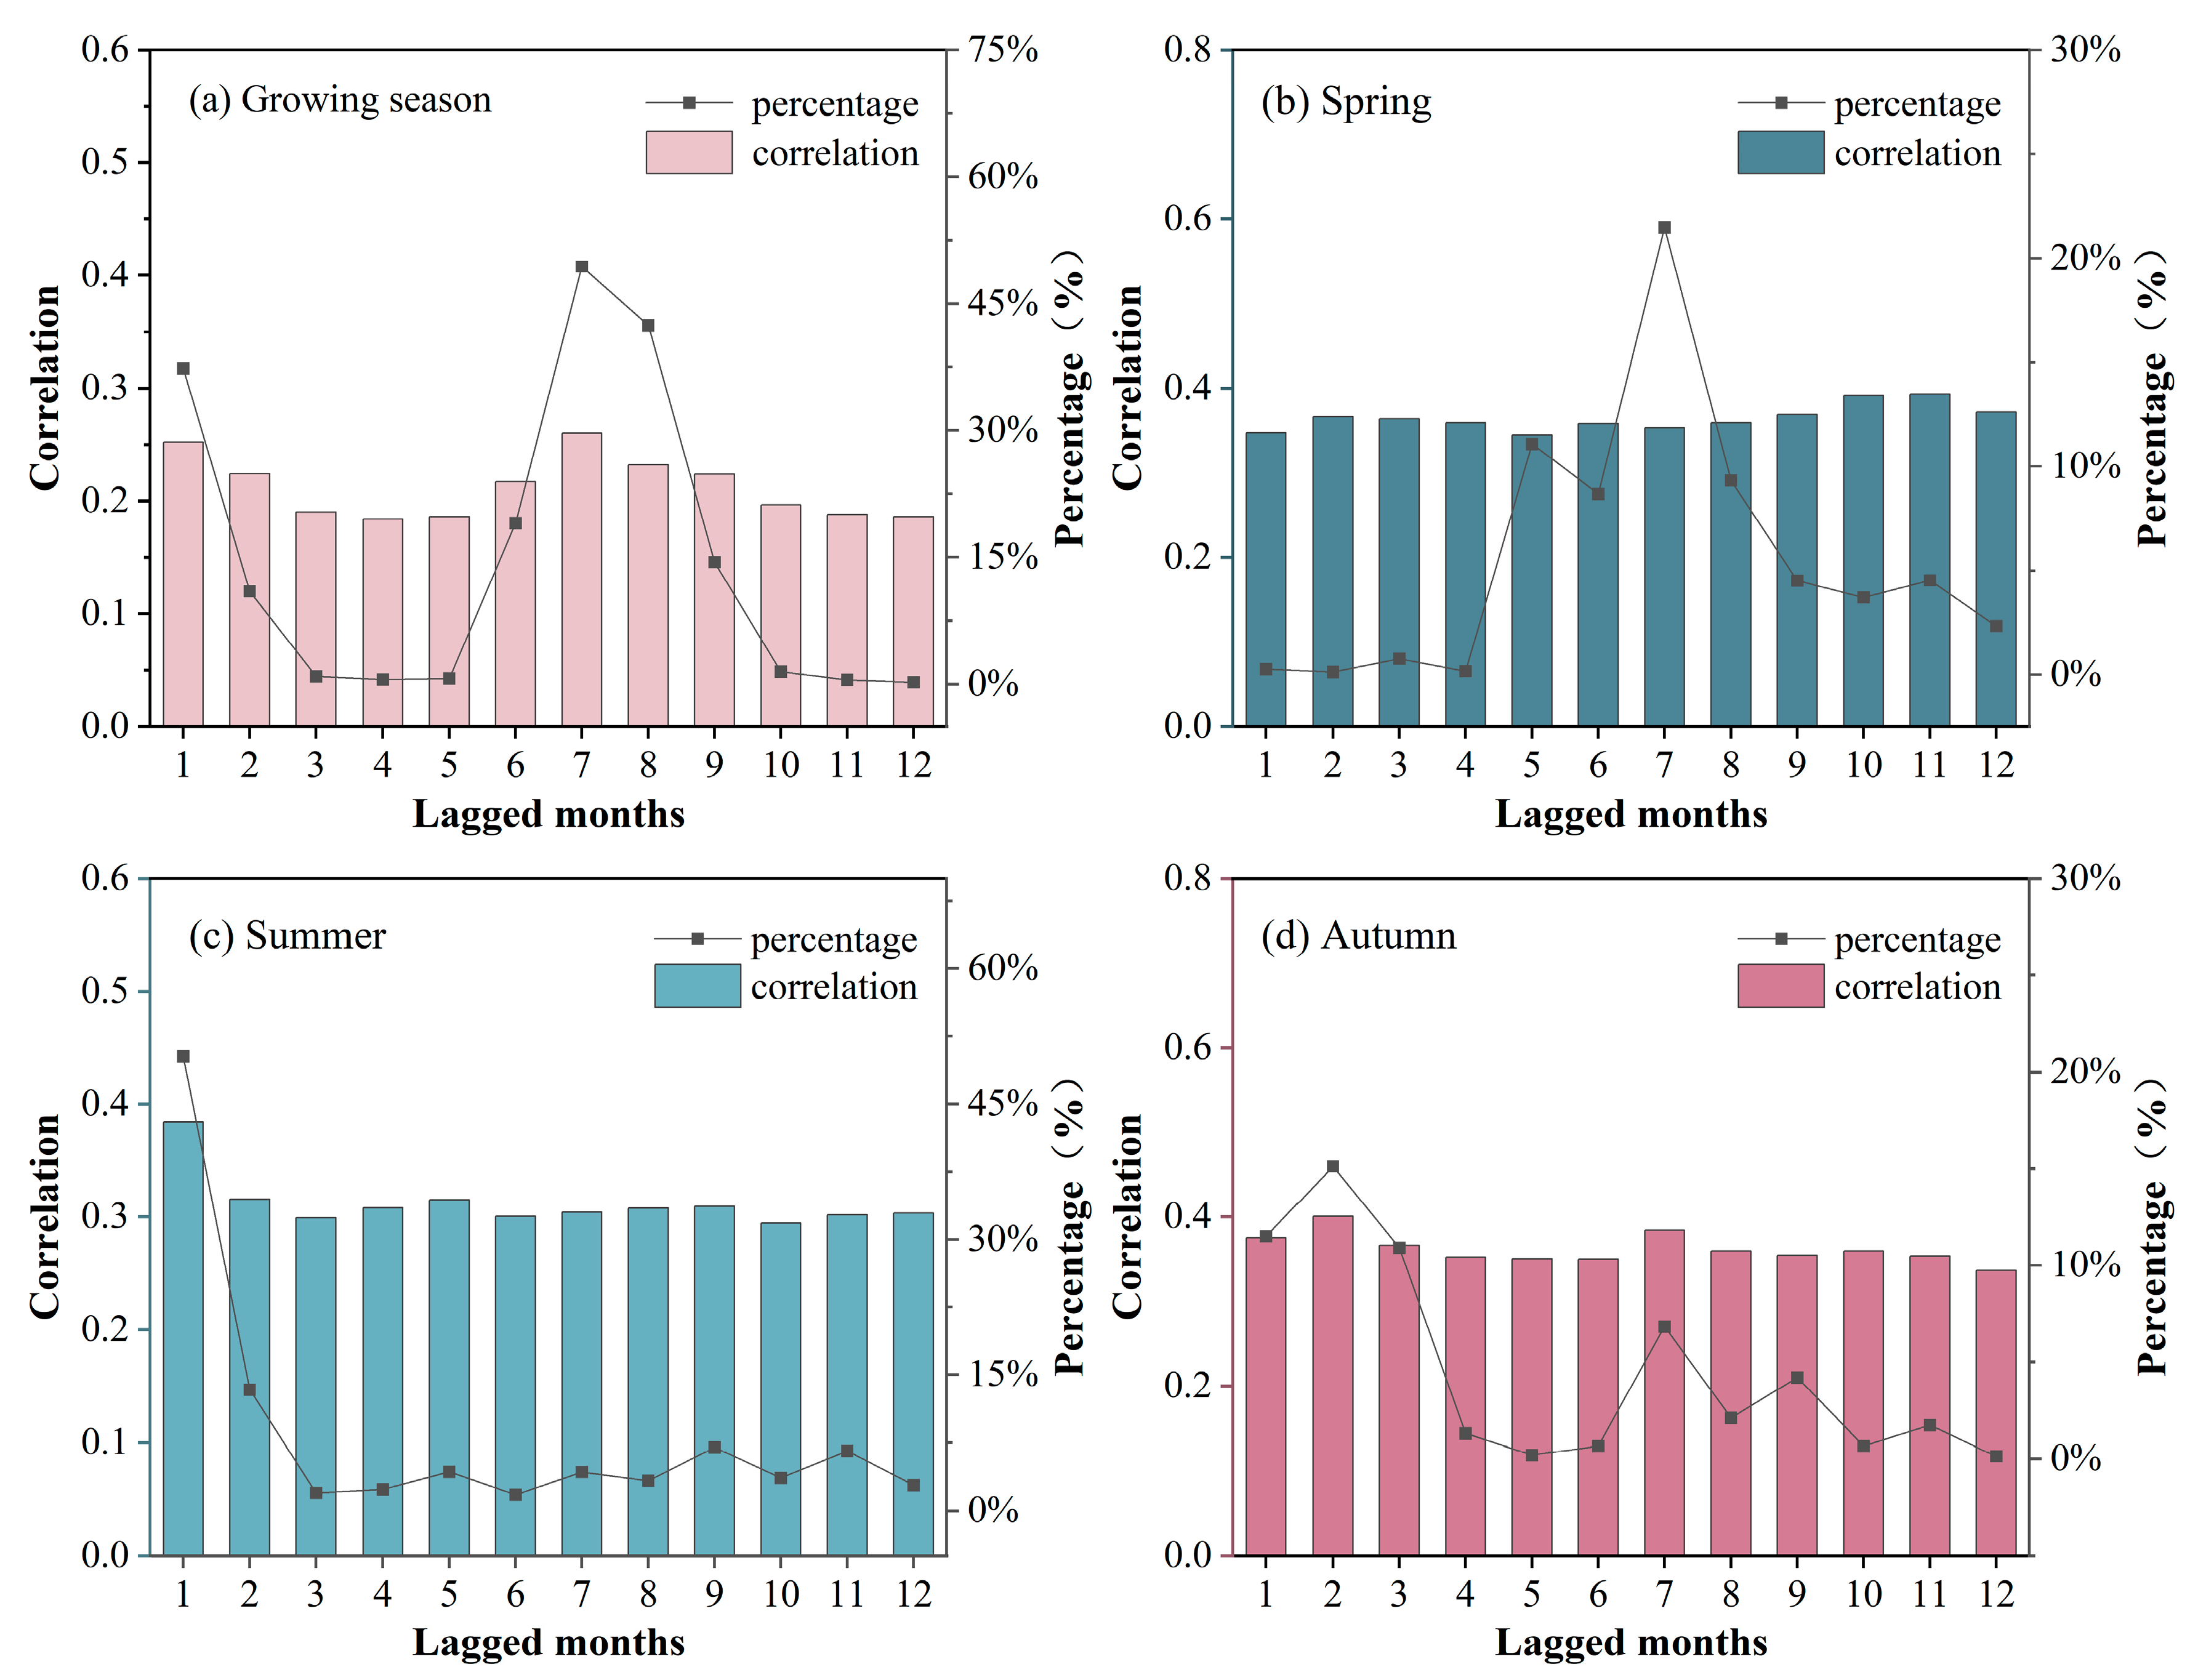
The time scale corresponding to the highest LE correlation coefficient indicates the speed of vegetation response to drought. We find that vegetation growth is more sensitive to shorter lags. The correlation between the one-month timescale SPEI and grassland NDVI varies significantly across different lagged time scales. During the growing season, the correlation values decrease from the 1-month lag to a minimum at 4 months (r = 0.18, p < 0.05). It then increases again, peaking at 7-months (r = 0.26, p < 0.05), and subsequently decreases again (Figure 6a). The proportion of significantly positively correlated areas first decreases and then increases. At the 7-month lagged time scale, the significant correlation between the grassland NDVI and drought is highest, covering 49% of the total area (Figure 6a), mainly distributed in eastern and central Inner Mongolia and eastern and central Mongolia. For the seasonal variation of the percentage of positively correlated areas, the peak in spring again occurs at 7 months (21.47%), while the peak occurs at 1 month (50.28%) in summer and at 2 months (15.11%) in autumn (Figure 6b–d). Figure 6 shows that spring contributes more to the second peak, while summer and autumn contribute more to the first peak. Overall, the LE in summer has a broader impact on the NDVI (Figure 6).

3.2.3. Lagged Effect of Drought under Different Moisture Conditions

During the growing season, the correlation between the mean lag positive correlation coefficient and the annual average SPEI is negative (Figure 7a). Under different moisture conditions, the grassland NDVI in relatively arid areas is more susceptible to the impact of drought LEs. The negative correlation holds for spring, summer, and autumn, consistent with the trend during the growing season. The relationship between water balance conditions and the average lagged time scale is shown in Figure 7; we note that the slope in summer is greater than that in spring and autumn at 83% (Figure 7c,e,g).
The growing season’s positive correlation between lagged months and the annual average SPEI means that, as the annual average SPEI value increases, the lagged months shortens, reflecting the higher drought sensitivity of the grassland NDVI in arid regions (lower annual average SPEI) compared to humid regions (Figure 7b). In summer and autumn, the correlation between lagged months and the annual average SPEI is positive (Figure 7f,h), consistent with the growing season. We observed that the growth rate is fastest in the summer, which means that the spatial variability of the lag time scale in summer is greater. However, in spring, the relationship between lagged months and the annual average SPEI is more complex, exhibiting a U-shaped relationship, with lagged months decreasing as the moisture conditions increase from −1.2 to −0.3. The minimum lagged months occur at a moisture condition of −0.3 (Figure 7d). As the moisture conditions continue to increase, the lagged months also increase. This indicates that in spring, the lagged months first decrease and then increase as moisture conditions improve.

3.3. Comparison of the Lag and Cumulative Effects of Drought on Grassland NDVI

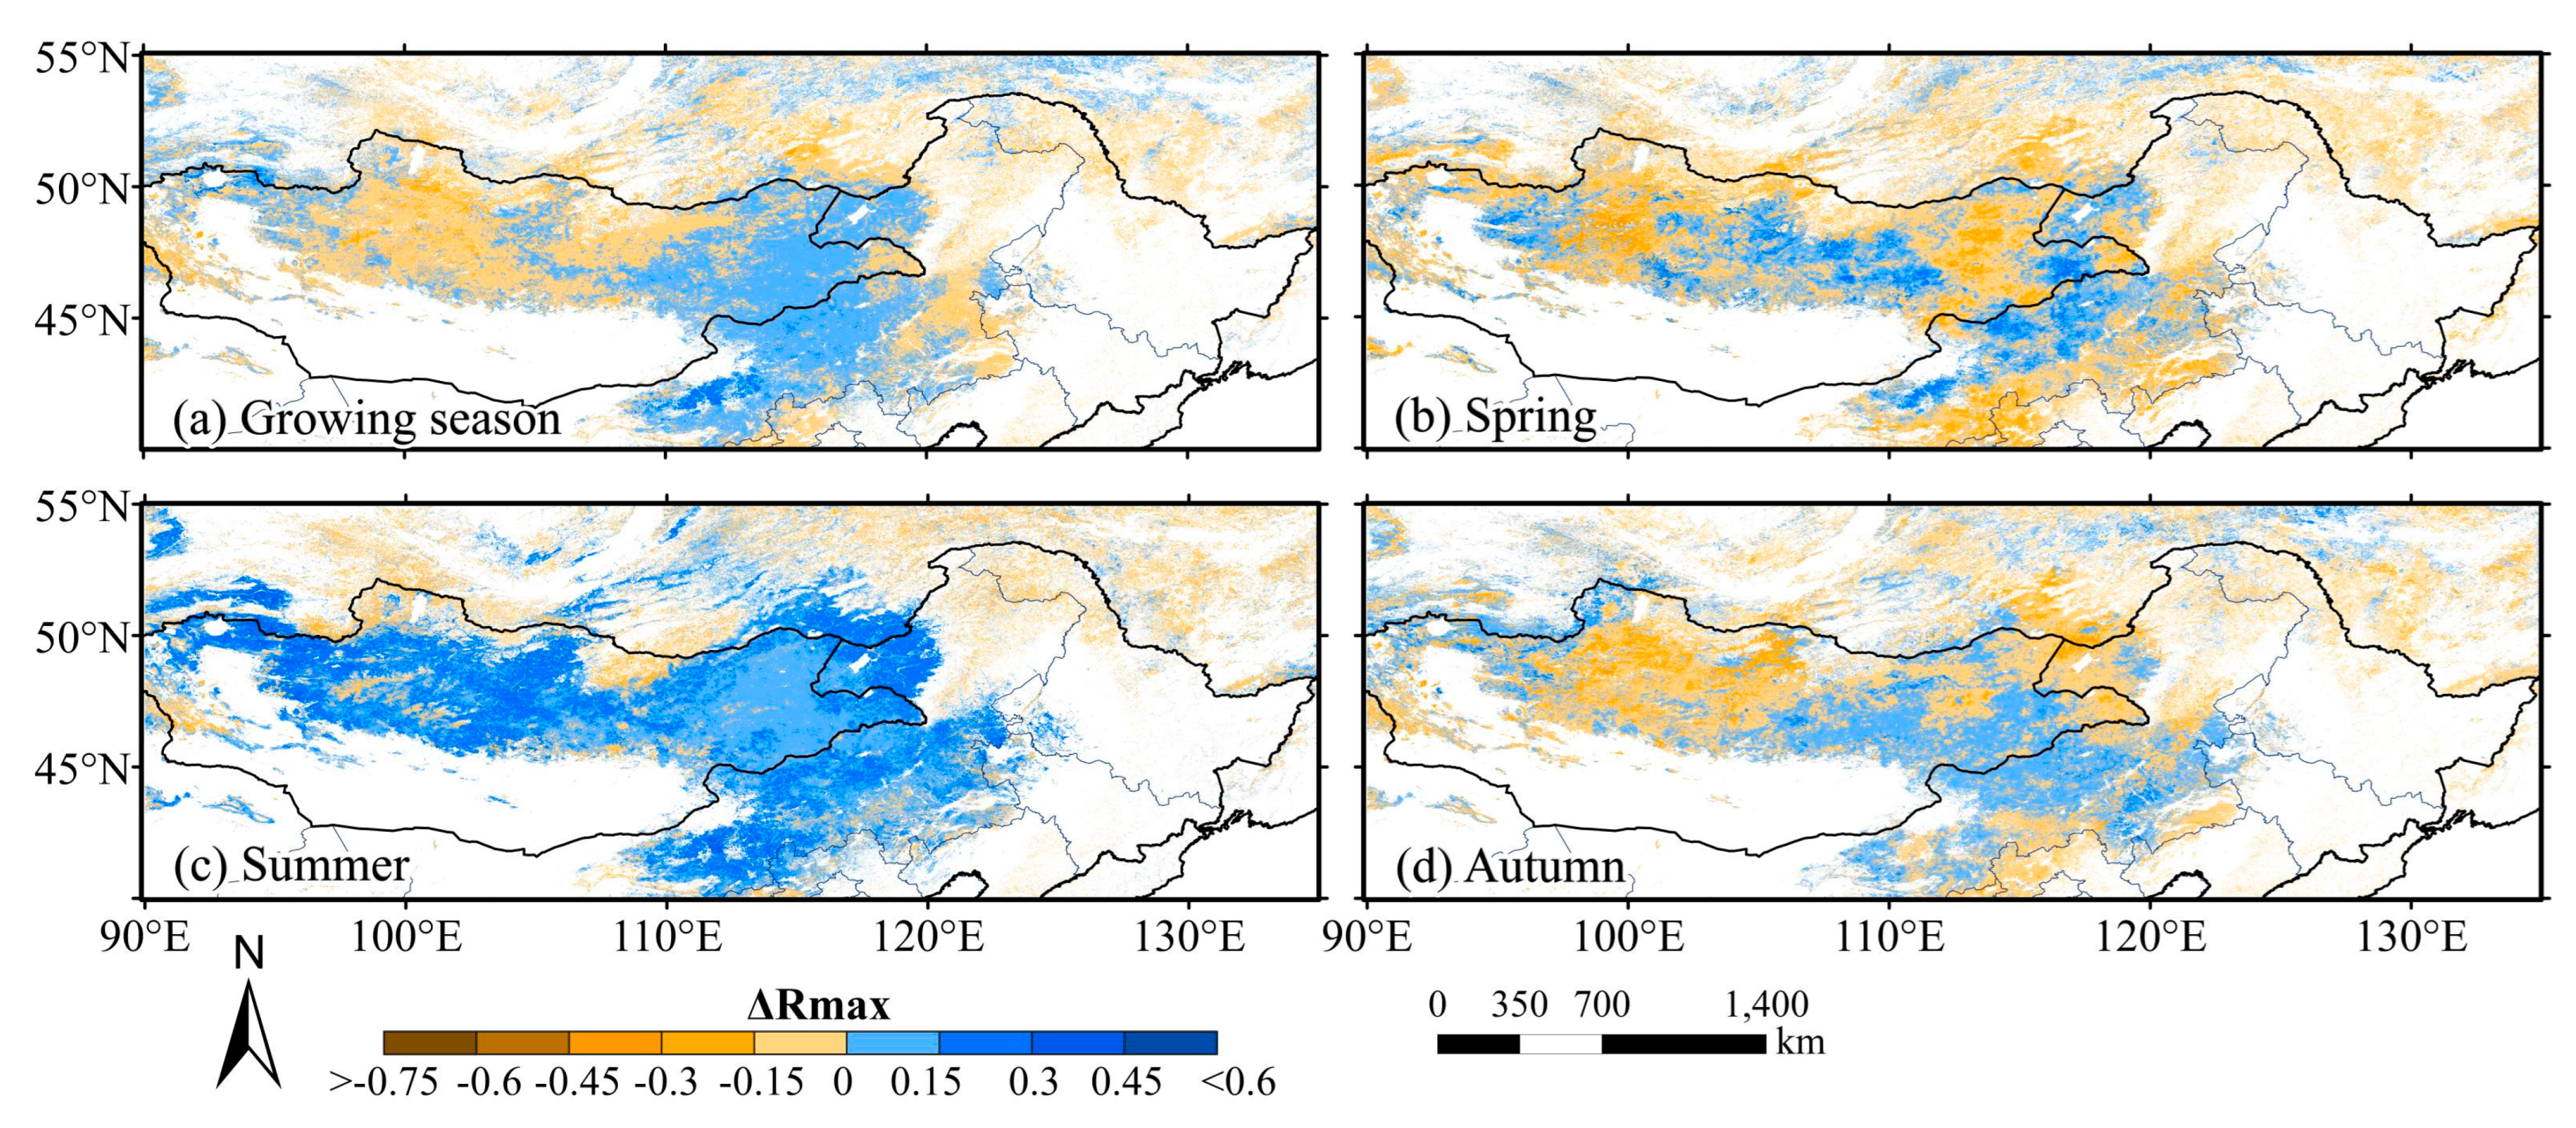
To determine the primary effect by which drought affects vegetation NDVI, this study performed a comparison between the magnitude of Rmax_cum and Rmax_lag (∆Rmax = |Rmax_cum| − |Rmax_lag|), where positive values indicate that the CE of drought dominates, and negative values indicate that the LE dominates. During the growing season, areas where the grassland NDVI is mainly affected by the LE of drought account for 54.89% of the study area (Figure 8a). Most areas have ΔRmax values in the range of −0.15 and 0 (49.95%), followed by 0 to 0.15 (43.5%), suggesting that the two effects are nearly balanced.
In spring, the grassland NDVI is mainly affected by the LE of drought, covering 65.87% of the study area, concentrated in southeastern Inner Mongolia, northern and northeastern Mongolia, and parts of eastern Siberia, but most of these areas have ΔRmax values between −0.15 and 0 (50.12%) (Figure 8b). By contrast, in summer, the grassland NDVI is more strongly affected by the CE of drought, covering 71.81% of the area, mainly in central and southeastern Inner Mongolia and much of Mongolia, with most areas having ΔRmax values between 0 and +0.3 (70.36%) (Figure 8c). In autumn, the grassland NDVI reverts to being more strongly affected by the LE of drought, covering 59.82% of the area, mainly in northeastern and southeastern Inner Mongolia, central Mongolia, and the Greater Khingan Mountains, with most areas having ΔRmax values between −0.15 and 0 (48.94%) (Figure 8d).

4. Discussion

We assessed the CALEs of drought on grassland growth using indices of vegetation and moisture conditions (NDVI and SPEI) over the period of 2001–2020. We found that grassland growth across most of the study area has a positive correlation with the SPEI. The areas showing a positive correlation with the SPEI are primarily distributed in regions that normally experience less rainfall.
However, at higher latitudes such as Siberia and the northwest lake regions of Mongolia, and in high-altitude areas like the Khangai Mountains in central Mongolia, there is a negative correlation. Studies have shown that in high-altitude and high-latitude areas, low temperatures resulting from these geographic factors are the foremost factors inhibiting vegetation growth. These areas are less restricted by moisture conditions, thus rendering vegetation less sensitive to drought, but more responsive to temperature changes [42,43]. Consequently, an increase in temperature and a reduction in precipitation tend to favor vegetation growth [44].
By assessing the CALEs of drought on grassland at different time scales, we found that there has been a degree of fluctuation in the changes in the time scale of effects on the growing season. These fluctuations may be related to differences in drought severity and seasonal distribution of precipitation in the study area. We further explored the changes in the cumulative and lagged time scales of drought across different seasons and found that in spring, the CALEs are dominated by longer time scales, while in summer and autumn, they are dominated by shorter time scales. These seasonal fluctuations are reflected throughout the growing season. Therefore, we speculate that certain characteristics of the growing season may be determined by moisture conditions in different seasons. This may be related to seasonal water balance conditions, vegetation growth processes, and the vegetation’s consumption of photosynthetic products.
Vegetation relies on photosynthesis to produce carbohydrates, some of which are stored as nonstructural carbohydrates (NSCs) in leaves and roots. These substances can help plants survive in drought conditions [45]. Under drought conditions, carbon assimilation decreases and plants consume NSC reserves to meet metabolic needs [7]. Vegetation NSC content varies seasonally, with a strong depletion of starch during the growing season and a general increase during winter months [46]. The seasonal fluctuations of vegetation NSC content is stronger under regions with significant seasonal features, often accumulating carbon during favorable periods to support carbon demands during unfavorable periods [46,47,48]. In spring, previously accumulated root materials are not yet consumed, allowing for resistance to longer-term drought. Meanwhile, in spring, the vegetation has not fully developed, and the leaf and root systems are still expanding. The lower leaf area index (LAI) also reduces the evaporation rate, which means that the plants’ ability to extract water from the soil and their overall water requirements has not yet reached its peak [49,50]. Additionally, even when spring precipitation is reduced, melting snow from earlier precipitation can replenish soil moisture to some extent, enabling vegetation to withstand longer-term drought in spring [51].
While grasslands have lower water requirements in the early growing season, resulting in slower drought response rates, by summertime, grassland vegetation grows rapidly. Biomass and leaf area index significantly increases, resulting in a high demand for water consumption and nutrients [52,53]. Increased summer drought severity more strongly inhibits photosynthesis and respiration. The plants’ water and nutrient absorption is limited by both soil moisture stress and physiological stress caused by high temperatures, and the high temperature further damages the soil’s water-holding capacity [54,55]. Vegetation uses accumulated NSC products from the previous stage to resist drought stress, resulting in a shorter cumulative time scale. Increased drought severity causes vegetation photosynthesis to respond more quickly to drought, shortening the lag time scale.
In autumn, the cumulative time scale shortens further, which is likely related to the large amount of NSCs consumed by summer vegetation to resist drought and growth. Additionally, in autumn, the vegetation’s growth activity decreases, and its biomass decreases [56]. As a result, the leaf area available for photosynthesis decreases. During this time, plants often increase their NSC storage, reducing growth rates to divert resources towards the accumulation of soluble sugars and starch [46], so their ability to maintain long-term drought resistance is poorer. As autumn drought alleviates, the lag time scale increases compared to summer. This is similar to the CALEs of precipitation at the end of the growing season [10]. Overall, the cumulative months may be related to the surplus of photosynthetic products from the previous season, while the lagged time scale is more influenced by the growth rate and water conditions of the current season.
On further examination, we find that under different water balance conditions, the CALEs of drought on grasslands show seasonal differences. During the spring and autumn, as well as the growing season as a whole, the CE lasts longer in the grasslands of relatively arid regions [57]. This is mainly because in relatively arid areas, grasslands have a stronger adaptability to longer-term, higher intensity droughts, and are better able to self-regulate their growth, morphology, and physiology in order to withstand drought stress on longer time scales [58]. However, the CE shows the opposite trend in summer. We speculate that this may be related to the greater disturbance of human activities in summer [59,60], which may need further research.
We found that as water conditions worsen, the cumulative time scale in spring exhibits an increasing trend, with a rate of change (slope) greater than that of summer and autumn. This also implies that the spatial variability of the cumulative time scale in spring is greater. In both summer and autumn, as drought conditions intensify, the lag time of drought effects on grasslands gradually shortens. This trend aligns with the growing season, similar to the annual scale result that arid areas respond more quickly to drought [61]. In areas that retain higher soil moisture (accumulated before a drought), the response of grasslands to the drought when it occurs can be delayed. However, the water storage in the grasslands of arid areas is generally poor, so vegetation tends to respond rapidly to changes in surface water availability [40]. By contrast, in humid areas, the soil is rich in water, and even during a drought, there is still some water available to ensure plant growth [62]. In the present study, as the water conditions increase in the spring, the lag time in months shows a trend of first decreasing and then increasing, this pattern may be related to differences in the sensitivity of various grassland species to drought, and further exploration is needed in the future.
The growth rate of lagged months is the fastest in summer which means that the spatial variability of the lagged time scale in summer is greater. However, compared with spring and autumn, summer grasslands are more susceptible to CALEs, the area significantly affected by the CALEs of drought is larger, and the intensity of the CE is stronger. We suggest that this may be related to the different levels of drought in the study area in different seasons. Droughts in the study area are most severe in summer, so the impacts of drought are stronger in summer. This is consistent with previous studies that found that the vegetation growth largely depends on moisture conditions [63]. In summary, changes in the correlation and cumulative or lagged time scale with moisture conditions in most seasons are generally consistent with the growing season characteristics, while the area significantly affected by moisture conditions in summer is closer to that during the growing season.
Exploring the relative effects of drought at the pixel scale, we found that the CE of drought during the growing season has a greater impact on grasslands than does the LE, consistent with the findings of Gu et al. (2021) [15]. However, there are seasonal differences: the CE of summer drought is stronger than the LE. But in spring and autumn, the LE is stronger than the CE, which is consistent with the characteristics of the growing season. This may be due to differences in growth rates and water and nutrient requirements at different stages of vegetation growth. Vegetation growth depends on specific levels of sunlight, water, and temperature to start its lifecycle [64,65], and higher growth rates need more accumulated support. As the frequency of compound extreme events, such as heatwaves and droughts, in the summer in East Asia is expected to increase in the future [26], future research should closely monitor grassland responses to drought across different seasons, especially in the summer, and focus on the interactions between climate and grassland in arid and semi-arid regions. This will help further assess the impact of drought on grassland ecosystems and provide a comprehensive, scientific basis for maintaining the sustainable development of grassland ecosystems.

5. Limitations and Prospects

This study only used the NDVI and SPEI datasets, with the aim of focusing on the relationship between vegetation growth and drought. This is because the NDVI, as a representative indicator of vegetation growth, when compared with the SPEI, can effectively reflect the direct impact of drought on vegetation. However, the interaction between drought and vegetation is complex, and the bivariate correlation between the two variables necessarily omits other possible factors. Vegetation growth may also be affected by other climate conditions, human activities, and other factors. Although these factors were not considered in this study, they will be more comprehensively considered in future studies by incorporating multiple environmental variables and optimizing the model to more deeply understand the mechanisms by which drought impacts vegetation growth.

6. Conclusions

In this study, we analyzed the relationships between the growth of grassland vegetation (represented by the NDVI) and moisture conditions (represented by the SPEI) at multiple time scales to assess the seasonal characteristics of the CALEs of drought on grassland from 2001 to 2020. We found the following:
(1)
There were differences in the response of grassland to drought CALEs in different seasons. The influence of CEs in summer was stronger than that in spring and autumn, and there was no obvious difference in LEs in the three seasons. Spatially, the area significantly affected by CALEs is greater in summer than spring and autumn. The cumulative and lagging time scale of spring is larger than that of summer and autumn;
(2)
Grasslands are most sensitive to drought in summer. As moisture decreases: the lag time scale gradually shortens in summer and autumn but shows an inverted U-shape in spring; the cumulative time scale gradually increases in spring and autumn while decreasing in summer. The spatial variability of the spring cumulative time scale is the largest, while that of the summer lag time scale is the largest;
(3)
For the growing season as a whole, the LE of drought on vegetation was greater than the CE in 54.89% of the study area. Different seasons had different dominant effects: in spring, the LE was dominant in 65.87% of the area; in summer, the CE was dominant in 71.81% of the area; and in autumn, the LE was dominant in 59.82% of the area.
Previous studies on the annual, or growing season, scale of drought accumulation and LE have obscured seasonal characteristics. The fluctuation in the time scale of drought CEs and LEs during the growing season is determined by the peaks of each season. The significantly affected area for the growing season is mainly determined by the summer characteristics. The dominant effect is mainly determined by spring and autumn. In summary, moisture conditions are the main reason for the seasonal differences in CALEs, and the drought response characteristics during the growing season are influenced by seasonal characteristics, especially the summer characteristics. Therefore, we speculate that as the intensity of drought increases in the future, the area of temperate grasslands affected by drought will further expand. Future efforts to manage drought in arid and semi-arid regions should focus on the differing effects of moisture conditions in each season.

Author Contributions

Conceptualization, W.H. and B.L.; methodology, W.H.; software, W.H.; validation, W.H. and B.L.; formal analysis, W.H.; investigation, W.H., Y.S., W.Z., R.M., M.C. and Z.Z.; resources, W.H.; data curation, W.H.; writing—original draft preparation, W.H.; writing—review and editing, B.L. and M.H.; visualization, W.H.; funding acquisition, B.L. All authors have read and agreed to the published version of the manuscript.

Funding

This research was funded by the National Natural Science Foundation of China, grant number 41877416.

Data Availability Statement

The original contributions presented in the study are included in the article, further inquiries can be directed to the corresponding author.

Acknowledgments

We appreciate the MODIS data support from NASA and the SPEI dataset from the Global SPEI database.

Conflicts of Interest

The authors declare no conflicts of interest.

References

  1. Kannenberg, S.A.; Novick, K.A.; Alexander, M.R.; Maxwell, J.T.; Moore, D.J.P.; Phillips, R.P.; Anderegg, W.R.L. Linking drought legacy effects across scales: From leaves to tree rings to ecosystems. Glob. Change Biol. 2019, 25, 2978–2992. [Google Scholar] [CrossRef]
  2. Liu, B.; Zhou, W.; Henderson, M.; Sun, Y.; Shen, X. Climatology of the Soil Surface Diurnal Temperature Range in a Warming World: Annual Cycles, Regional Patterns, and Trends in China. Earth’s Future 2022, 10, e2021EF002220. [Google Scholar] [CrossRef]
  3. Piao, S.; Mohammat, A.; Fang, J.; Cai, Q.; Feng, J. NDVI-based increase in growth of temperate grasslands and its responses to climate changes in China. Glob. Environ. Change 2006, 16, 340–348. [Google Scholar] [CrossRef]
  4. Anderegg, W.R.L.; Schwalm, C.; Biondi, F.; Camarero, J.J.; Koch, G.; Litvak, M.; Ogle, K.; Shaw, J.D.; Shevliakova, E.; Williams, A.P.; et al. Pervasive drought legacies in forest ecosystems and their implications for carbon cycle models. Science 2015, 349, 528–532. [Google Scholar] [CrossRef]
  5. Wang, Y.; Lv, W.; Xue, K.; Wang, S.; Zhang, L.; Hu, R.; Zeng, H.; Xu, X.; Li, Y.; Jiang, L.; et al. Grassland changes and adaptive management on the Qinghai–Tibetan Plateau. Nat. Rev. Earth Environ. 2022, 3, 668–683. [Google Scholar] [CrossRef]
  6. Wang, Y.; Chen, T.; Wang, Q.; Peng, L. Time-lagged and cumulative effects of drought and anthropogenic activities on China’s vegetation greening from 1990 to 2018. Int. J. Digit. Earth 2023, 16, 2233–2258. [Google Scholar] [CrossRef]
  7. Song, L.; Luo, W.; Griffin-Nolan, R.J.; Ma, W.; Cai, J.; Zuo, X.; Yu, Q.; Hartmann, H.; Li, M.H.; Smith, M.D.; et al. Differential responses of grassland community nonstructural carbohydrate to experimental drought along a natural aridity gradient. Sci. Total Environ. 2022, 822, 153589. [Google Scholar] [CrossRef]
  8. Liu, Y.; Liu, S.; Sun, Y.; Li, M.; An, Y.; Shi, F. Spatial differentiation of the NPP and NDVI and its influencing factors vary with grassland type on the Qinghai-Tibet Plateau. Environ. Monit. Assess. 2021, 193, 48. [Google Scholar] [CrossRef]
  9. Lu, J.; Peng, J.; Li, G.; Guan, J.; Han, W.; Liu, L.; Wang, R.; Zheng, J. Assessment of time-lag and cumulative effects of drought on gross primary productivity of grassland in Central Asia from 1982 to 2018. Acta Ecol. Sin. 2023, 43, 9745–9757. [Google Scholar] [CrossRef]
  10. Peng, J.; Wu, C.; Zhang, X.; Wang, X.; Gonsamo, A. Satellite detection of cumulative and lagged effects of drought on autumn leaf senescence over the Northern Hemisphere. Glob. Change Biol. 2019, 25, 2174–2188. [Google Scholar] [CrossRef] [PubMed]
  11. Vicente-Serrano, S.M.; Beguería, S.; López-Moreno, J.I. A Multiscalar Drought Index Sensitive to Global Warming: The Standardized Precipitation Evapotranspiration Index. J. Clim. 2010, 23, 1696–1718. [Google Scholar] [CrossRef]
  12. Ivits, E.; Horion, S.; Erhard, M.; Fensholt, R. Assessing European ecosystem stability to drought in the vegetation growing season. Glob. Ecol. Biogeogr. 2016, 25, 1131–1143. [Google Scholar] [CrossRef]
  13. Ding, Y.; Li, Z.; Peng, S. Global analysis of time-lag and -accumulation effects of climate on vegetation growth. Int. J. Appl. Earth Obs. Geoinf. 2020, 92, 102179. [Google Scholar] [CrossRef]
  14. Vicente-Serrano, S.M.; Gouveia, C.; Camarero, J.J.; Begueria, S.; Trigo, R.; Lopez-Moreno, J.I.; Azorin-Molina, C.; Pasho, E.; Lorenzo-Lacruz, J.; Revuelto, J.; et al. Response of vegetation to drought time-scales across global land biomes. Proc. Natl. Acad. Sci. USA 2013, 110, 52–57. [Google Scholar] [CrossRef]
  15. Gu, X.; Guo, E.; Yin, S.; Wang, Y.; Na, R.; Wan, Z. Assessment of the Cumulative and Lagging Effects of Drought on Vegetation Growth in Inner Mongolia. Acta Agrestia Sin. 2021, 29, 1301–1310. [Google Scholar] [CrossRef]
  16. Wei, W.; Liu, T.; Zhou, L.; Wang, J.; Yan, P.; Xie, B.; Zhou, J. Drought-Related Spatiotemporal Cumulative and Time-Lag Effects on Terrestrial Vegetation across China. Remote Sens. 2023, 15, 4362. [Google Scholar] [CrossRef]
  17. Zhao, A.; Yu, Q.; Feng, L.; Zhang, A.; Pei, T. Evaluating the cumulative and time-lag effects of drought on grassland vegetation: A case study in the Chinese Loess Plateau. J. Environ. Manag. 2020, 261, 110214. [Google Scholar] [CrossRef]
  18. Liu, L.; Guan, J.; Zheng, J.; Wang, Y.; Han, W.; Liu, Y. Cumulative effects of drought have an impact on net primary productivity stability in Central Asian grasslands. J. Environ. Manag. 2023, 344, 118734. [Google Scholar] [CrossRef]
  19. Wei, X.; He, W.; Zhou, Y.; Ju, W.; Xiao, J.; Li, X.; Liu, Y.; Xu, S.; Bi, W.; Zhang, X.; et al. Global assessment of lagged and cumulative effects of drought on grassland gross primary production. Ecol. Indic. 2022, 136, 108646. [Google Scholar] [CrossRef]
  20. Kong, D.; Zhang, Q.; Singh, V.P.; Shi, P. Seasonal vegetation response to climate change in the Northern Hemisphere (1982–2013). Glob. Planet. Change 2017, 148, 1–8. [Google Scholar] [CrossRef]
  21. Li, L.; Qian, R.; Liu, W.; Wang, W.; Biederman, J.A.; Zhang, B.; Kang, X.; Wen, F.; Ran, Q.; Zheng, Z.; et al. Drought timing influences the sensitivity of a semiarid grassland to drought. Geoderma 2022, 412, 115714. [Google Scholar] [CrossRef]
  22. Hahn, C.; Lüscher, A.; Ernst-Hasler, S.; Suter, M.; Kahmen, A. Timing of drought in the growing season and strong legacy effects determine the annual productivity of temperate grasses in a changing climate. Biogeosciences 2021, 18, 585–604. [Google Scholar] [CrossRef]
  23. Dietrich, J.D.; Smith, M.D. The effect of timing of growing season drought on flowering of a dominant C4 grass. Oecologia 2016, 181, 391–399. [Google Scholar] [CrossRef]
  24. Gang, C.; Zhang, Y.; Wang, Z.; Chen, Y.; Yang, Y.; Li, J.; Cheng, J.; Qi, J.; Odeh, I. Modeling the dynamics of distribution, extent, and NPP of global terrestrial ecosystems in response to future climate change. Glob. Planet. Change 2017, 148, 153–165. [Google Scholar] [CrossRef]
  25. Yu, Z.; Wang, J.; Liu, S.; Rentch, J.S.; Sun, P.; Lu, C. Global gross primary productivity and water use efficiency changes under drought stress. Environ. Res. Lett. 2017, 12, 014016. [Google Scholar] [CrossRef]
  26. Zhang, P.; Jeong, J.-H.; Yoon, J.-H.; Kim, H.; Wang, S.-Y.S.; Linderholm, H.W.; Fang, K.; Wu, X.; Chen, D. Abrupt shift to hotter and drier climate over inner East Asia beyond the tipping point. Science 2020, 370, 1095–1099. [Google Scholar] [CrossRef]
  27. De Boeck, H.J.; Dreesen, F.E.; Janssens, I.A.; Nijs, I. Whole-system responses of experimental plant communities to climate extremes imposed in different seasons. New Phytol. 2011, 189, 806–817. [Google Scholar] [CrossRef]
  28. Denton, E.M.; Dietrich, J.D.; Smith, M.D.; Knapp, A.K. Drought timing differentially affects above- and belowground productivity in a mesic grassland. Plant Ecol. 2017, 218, 317–328. [Google Scholar] [CrossRef]
  29. Xu, X.; Liu, H.; Wang, W.; Hu, G.; Wu, X.; Song, Z. Effects of manipulated precipitation on aboveground net primary productivity of grassland fields: Controlled rainfall experiments in Inner Mongolia, China. Land Degrad. Dev. 2021, 32, 1981–1992. [Google Scholar] [CrossRef]
  30. Huete, A.; Didan, K.; Miura, T.; Rodriguez, E.P.; Gao, X.; Ferreira, L.G. Overview of the radiometric and biophysical performance of the MODIS vegetation indices. Remote Sens. Environ. 2002, 83, 195–213. [Google Scholar] [CrossRef]
  31. Huang, S.; Tang, L.; Hupy, J.P.; Wang, Y.; Shao, G. A commentary review on the use of normalized difference vegetation index (NDVI) in the era of popular remote sensing. J. For. Res. 2021, 32, 1–6. [Google Scholar] [CrossRef]
  32. Meng, X.; Gao, X.; Li, S.; Lei, J. Spatial and Temporal Characteristics of Vegetation NDVI Changes and the Driving Forces in Mongolia during 1982–2015. Remote Sens. 2020, 12, 603. [Google Scholar] [CrossRef]
  33. Luo, N.; Mao, D.; Wen, B.; Liu, X. Climate Change Affected Vegetation Dynamics in the Northern Xinjiang of China: Evaluation by SPEI and NDVI. Land 2020, 9, 90. [Google Scholar] [CrossRef]
  34. Chu, H.; Venevsky, S.; Wu, C.; Wang, M. NDVI-based vegetation dynamics and its response to climate changes at Amur-Heilongjiang River Basin from 1982 to 2015. Sci. Total Environ. 2019, 650, 2051–2062. [Google Scholar] [CrossRef]
  35. Zhang, F.; Su, Y.; Liu, B. Response characteristics of NDVI to asymmetric diurnal temperature increase and precipitation changes during the forest growing season in Northeast China. J. Beijing For. Univ. 2023, 45, 34–48. [Google Scholar] [CrossRef]
  36. Luo, X.; Li, Y.; Yin, H.; Sui, M. Response of NDVI to SPEI at different temporal scales in Northeast China. Chin. J. Ecol. 2020, 39, 412–421. [Google Scholar] [CrossRef]
  37. Ma, R.; Zhang, J.; Shen, X.; Liu, B.; Lu, X.; Jiang, M. Impacts of climate change on fractional vegetation coverage of temperate grasslands in China from 1982 to 2015. J. Environ. Manag. 2024, 350, 119694. [Google Scholar] [CrossRef]
  38. Cao, S.; Zhang, L.; He, Y.; Zhang, Y.; Chen, Y.; Yao, S.; Yang, W.; Sun, Q. Effects and contributions of meteorological drought on agricultural drought under different climatic zones and vegetation types in Northwest China. Sci. Total Environ. 2022, 821, 153270. [Google Scholar] [CrossRef]
  39. Shen, X.; Liu, B.; Henderson, M.; Wang, L.; Jiang, M.; Lu, X. Vegetation Greening, Extended Growing Seasons, and Temperature Feedbacks in Warming Temperate Grasslands of China. J. Clim. 2022, 35, 5103–5117. [Google Scholar] [CrossRef]
  40. Sun, S.; Du, W.; Song, Z.; Zhang, D.; Wu, X.; Chen, B.; Wu, Y. Response of Gross Primary Productivity to Drought Time-Scales Across China. J. Geophys. Res. Biogeosciences 2021, 126, e2020JG005953. [Google Scholar] [CrossRef]
  41. Zhang, Z.; Ju, W.; Zhou, Y.; Li, X. Revisiting the cumulative effects of drought on global gross primary productivity based on new long-term series data (1982–2018). Glob. Chang Biol. 2022, 28, 3620–3635. [Google Scholar] [CrossRef] [PubMed]
  42. Gu, X.; Guo, E.; Yin, S.; Wang, Y.; Mandula, N.; Wan, Z.; Yun, X.; Li, H.; Bao, Y. Differentiating cumulative and lagged effects of drought on vegetation growth over the Mongolian Plateau. Ecosphere 2022, 13, e4289. [Google Scholar] [CrossRef]
  43. Zhao, G.; Han, Y.; Liu, M.; Zhao, S.; Liu, W. Characteristics of temporal and spatial variations of extreme temperature events in Inner Mongolia during 1951–2014. J. Arid Land Resour. Environ. 2017, 31, 110–116. [Google Scholar] [CrossRef]
  44. Ge, W.; Deng, L.; Wang, F.; Han, J. Quantifying the contributions of human activities and climate change to vegetation net primary productivity dynamics in China from 2001 to 2016. Sci. Total Environ. 2021, 773, 145648. [Google Scholar] [CrossRef]
  45. Zwicke, M.; Picon-Cochard, C.; Morvan-Bertrand, A.; Prud’homme, M.P.; Volaire, F. What functional strategies drive drought survival and recovery of perennial species from upland grassland? Ann. Bot. 2015, 116, 1001–1015. [Google Scholar] [CrossRef]
  46. Martínez-Vilalta, J.; Sala, A.; Asensio, D.; Galiano, L.; Hoch, G.; Palacio, S.; Piper, F.I.; Lloret, F. Dynamics of non-structural carbohydrates in terrestrial plants: A global synthesis. Ecol. Monogr. 2016, 86, 495–516. [Google Scholar] [CrossRef]
  47. Chapin, F.S.; Schulze, E.; Mooney, H.A. The Ecology and Economics of Storage in Plants. Annu. Rev. Ecol. Evol. Syst. 1990, 21, 423–447. [Google Scholar] [CrossRef]
  48. Piispanen, R.; Saranp, P. Variation of non-structural carbohydrates in silver birch (Betula pendulaRoth) wood. Trees 2001, 15, 444–451. [Google Scholar] [CrossRef]
  49. Sagar, G.R.; Salter, P.J.; Goode, J.E. Crop Responses to Water at Different Stages of Growth. J. Ecol. 1968, 56, 626. [Google Scholar] [CrossRef]
  50. Sullivan, C.Y.; Eastin, J.D. Plant physiological responses to water stress. Agric. Meteorol. 1974, 14, 113–127. [Google Scholar] [CrossRef]
  51. Fang, W.; Huang, S.; Huang, Q.; Huang, G.; Wang, H.; Leng, G.; Wang, L.; Guo, Y. Probabilistic assessment of remote sensing-based terrestrial vegetation vulnerability to drought stress of the Loess Plateau in China. Remote Sens. Environ. 2019, 232, 111290. [Google Scholar] [CrossRef]
  52. You, C.; Wang, Y.; Tan, X.; Zhang, B.; Ren, T.; Chen, B.; Xu, M.; Chen, S. Seasonal and interannual variations of ecosystem photosynthetic characteristics in a semi-arid grassland of Northern China. J. Plant Ecol. 2022, 15, 961–976. [Google Scholar] [CrossRef]
  53. Peng, F.; Sun, G. Variation of Leaf Area Index in China from 1982 to 1999 and Its Relationship with Climate Change. Clim. Environ. Res. 2017, 22, 162–176. [Google Scholar]
  54. Knapp, A.K.; Smith, M.D. Variation Among Biomes in Temporal Dynamics of Aboveground Primary Production. Science 2001, 291, 481–484. [Google Scholar] [CrossRef] [PubMed]
  55. Sippel, S.; Reichstein, M.; Ma, X.; Mahecha, M.D.; Lange, H.; Flach, M.; Frank, D. Drought, Heat, and the Carbon Cycle: A Review. Curr. Clim. Change Rep. 2018, 4, 266–286. [Google Scholar] [CrossRef]
  56. Chen, Z.; Wang, H.; Wang, J.; Shi, H.; Liu, H.; He, J. Estimation on seasonal dynamics of alpine grassland aboveground biomass using phenology camera-derived NDVI. Chin. J. Plant Ecol. 2021, 45, 487–495. [Google Scholar] [CrossRef]
  57. Zhou, R.; Liu, Y.; Cui, M.; Lu, J.; Shi, H.; Ren, H.; Zhang, W.; Wen, Z. Global Assessment of Cumulative and Time-Lag Effects of Drought on Land Surface Phenology. GIScience Remote Sens. 2022, 59, 1918–1937. [Google Scholar] [CrossRef]
  58. Peguero-Pina, J.J.; Vilagrosa, A.; Alonso-Forn, D.; Ferrio, J.P.; Sancho-Knapik, D.; Gil-Pelegrín, E. Living in Drylands: Functional Adaptations of Trees and Shrubs to Cope with High Temperatures and Water Scarcity. Forests 2020, 11, 1028. [Google Scholar] [CrossRef]
  59. Wei, D.; Zhao, H.; Zhang, J.; Qi, Y.; Wang, X. Human activities alter response of alpine grasslands on Tibetan Plateau to climate change. J. Environ. Manag. 2020, 262, 110335. [Google Scholar] [CrossRef]
  60. Xue, L.; Kappas, M.; Wyss, D.; Wang, C.; Putzenlechner, B.; Thi, N.P.; Chen, J. Assessment of Climate Change and Human Activities on Vegetation Development in Northeast China. Sensors 2022, 22, 2509. [Google Scholar] [CrossRef]
  61. Xu, H.-j.; Wang, X.-p.; Zhao, C.-y. Drought sensitivity of vegetation photosynthesis along the aridity gradient in northern China. Int. J. Appl. Earth Obs. Geoinf. 2021, 102, 102418. [Google Scholar] [CrossRef]
  62. Barnes, M.L.; Moran, M.S.; Scott, R.L.; Kolb, T.E.; Ponce-Campos, G.E.; Moore, D.J.P.; Ross, M.A.; Mitra, B.; Dore, S. Vegetation productivity responds to sub-annual climate conditions across semiarid biomes. Ecosphere 2016, 7, e01339. [Google Scholar] [CrossRef]
  63. Tong, S.; Bao, G.; Bao, Y.; Huang, X. Monitoring of long-term vegetation dynamics and responses to droughts of various timescales in Inner Mongolia. Ecosphere 2023, 14, e4415. [Google Scholar] [CrossRef]
  64. Busetto, L.; Colombo, R.; Migliavacca, M.; Cremonese, E.; Meroni, M.; Galvagno, M.; Rossini, M.; Siniscalco, C.; Di Cella, U.M.; Pari, E. Remote sensing of larch phenological cycle and analysis of relationships with climate in the Alpine region. Glob. Change Biol. 2010, 16, 2504–2517. [Google Scholar] [CrossRef]
  65. Zhang, H.; Liu, S.; Regnier, P.; Yuan, W. New insights on plant phenological response to temperature revealed from long-term widespread observations in China. Glob. Change Biol. 2018, 24, 2066–2078. [Google Scholar] [CrossRef]
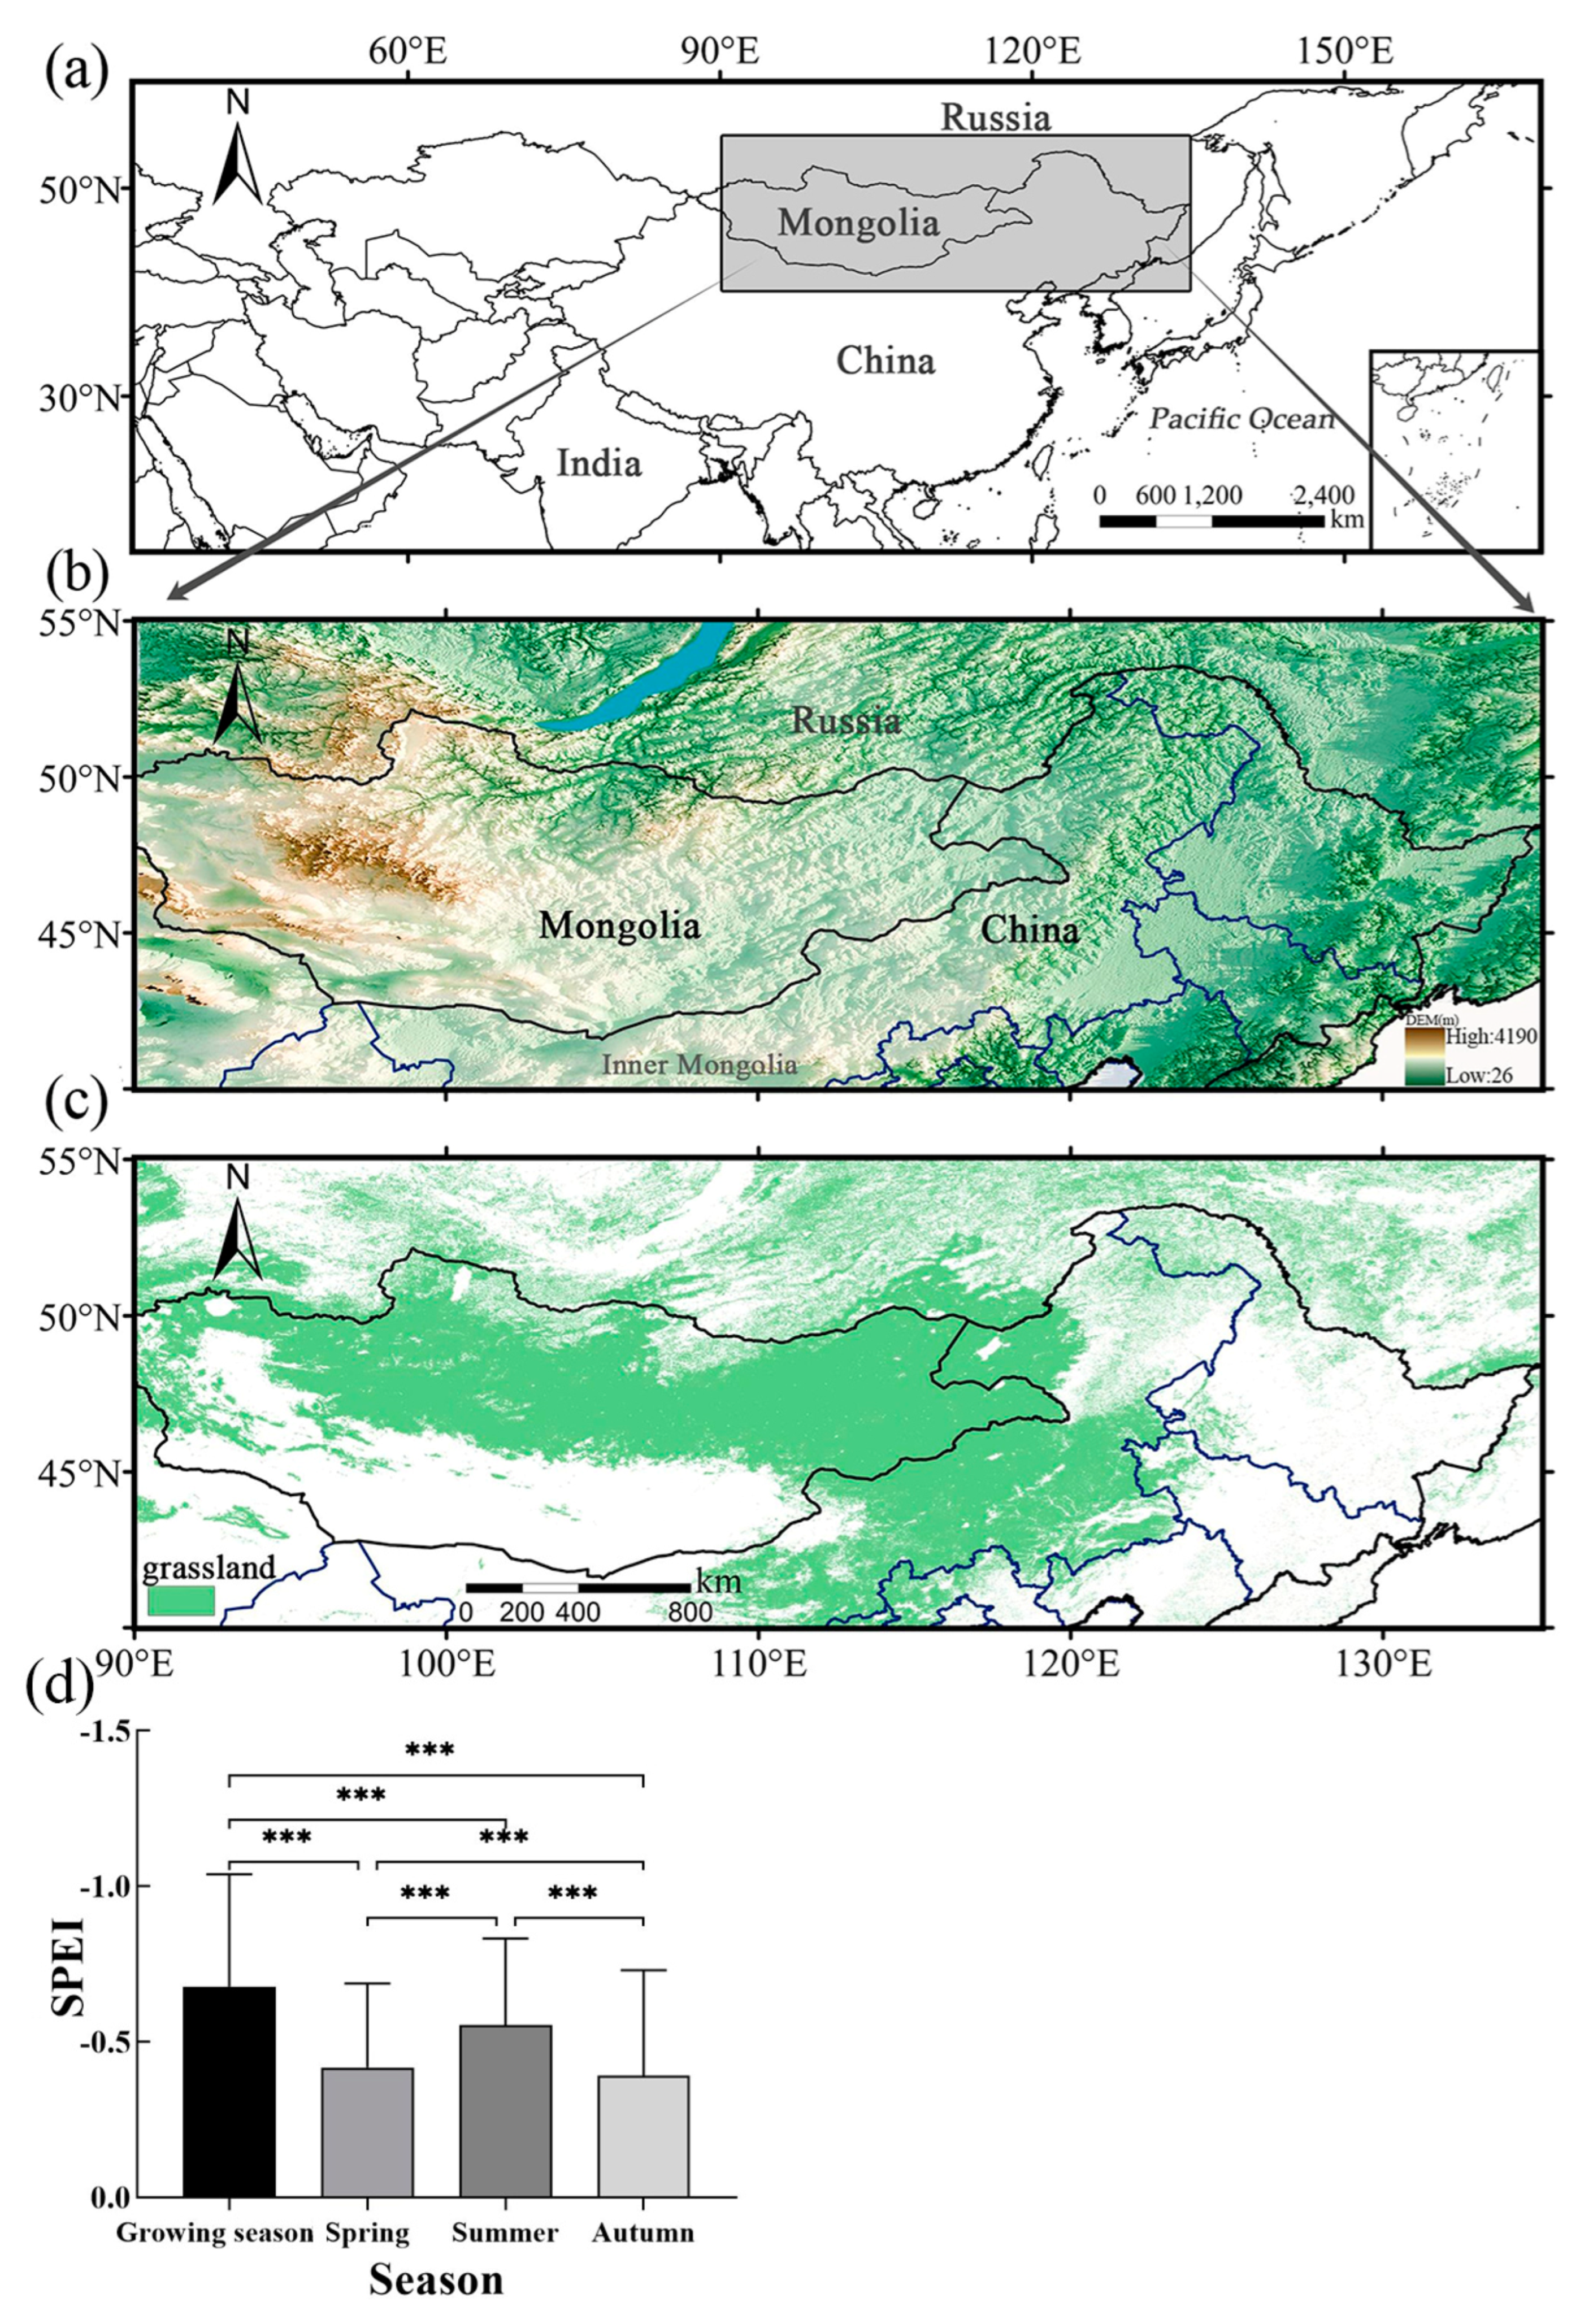
Figure 1. (a,b) Schematic diagram of the research area; (c) spatial distribution of grasslands; (d) SPEI (Standardized Precipitation Evapotranspiration Index) values in the research area in different seasons (triple asterisks indicate highly significant differences, p < 0.001).
Remotesensing 16 03478 g001
Figure 2. (a,c,e,g) Spatial distribution of maximum correlation coefficients (Rmax_cum) and (b,d,f,h) cumulative months by season.
Remotesensing 16 03478 g002
Figure 3. Positive correlations between the grassland NDVI and SPEI, by season, at cumulative time scales of 1 to 12 months (p < 0.05) and the percentage of the study area affected. (Note: these results were extracted from the correlation analysis between the NDVI and SPEI at the 12 timescales before selecting the maximum r-max).
Remotesensing 16 03478 g003
Figure 4. Relationship of annual average SPEI with the (a,c,e,g) mean maximum correlation coefficient and (b,d,f,h) corresponding mean accumulated months. Gray shading indicates the 95% confidence interval.
Remotesensing 16 03478 g004
Figure 5. (a,c,e,g) Spatial distribution of maximum correlation coefficients (Rmax_lag) and (b,d,f,h) lagged months.
Remotesensing 16 03478 g005
Figure 6. Positive correlations between the grassland NDVI and SPEI, by season, at lag times of 1 to 12 months (p < 0.05) and the percentage of the study area affected. (Note: these results were extracted from the correlation analysis between the NDVI and SPEI at the 12 timescales before selecting the maximum r-max.).
Remotesensing 16 03478 g006
Figure 7. Relationship of annual average SPEI with the (a,c,e,g) mean maximum correlation coefficient and (b,d,f,h) corresponding mean lagged months. Gray shading indicates the 95% confidence interval.
Remotesensing 16 03478 g007
Figure 8. Comparison of the maximum correlations between lagged cumulative effects, by season. Positive values indicate that the cumulative effect of drought dominates; negative values indicate that the lagged effect dominates.
Remotesensing 16 03478 g008
Table 1. Area statistics (%) of the range of maximum positive correlation coefficients between normalized difference vegetation index (%) and SPEI.
Season0–0.150.15–0.30.3–0.450.45–0.6>0.6Mean
Growing season6.75%37.44%19.54%0.06%0.00%0.262
Spring3.34%34.48%28.86%7.71%0.54%0.309
Summer5.36%16.78%24.07%31.40%12.63%0.424
Autumn4.26%25.68%21.83%8.16%0.83%0.314
Table 2. Percentages of the total area by range of maximum lagged effect positive correlation coefficients (R-lag) between the SPEI and NDVI.
Season0–0.150.15–0.30.3–0.450.45–0.6>0.6Mean
Growing season4.71%32.91%25.91%0.27%0.01%0.256
Spring0.06%17.81%38.73%6.78%0.09%0.349
Summer0.43%28.90%36.77%11.97%0.51%0.341
Autumn0.09%21.22%35.03%5.63%0.18%0.338
Disclaimer/Publisher’s Note: The statements, opinions and data contained in all publications are solely those of the individual author(s) and contributor(s) and not of MDPI and/or the editor(s). MDPI and/or the editor(s) disclaim responsibility for any injury to people or property resulting from any ideas, methods, instructions or products referred to in the content.