Article

CPINet: Towards A Novel Cross-Polarimetric Interaction Network for Dual-Polarized SAR Ship Classification

1
Xi’an Key Laboratory of Image Processing Technology and Applications for Public Security, School of Communications and Information Engineering, Xi’an University of Posts and Telecommunications, Xi’an 710121, China
2
Key Laboratory of Radar Imaging and Microwave Photonics, Ministry of Education, Nanjing University of Aeronautics and Astronautics, Nanjing 210016, China
3
Xi’an Xiangteng Microelectronics Technology Co., Ltd., Xi’an 710068, China
*
Author to whom correspondence should be addressed.
Remote Sens. 2024, 16(18), 3479; https://doi.org/10.3390/rs16183479
Submission received: 18 July 2024 / Revised: 9 September 2024 / Accepted: 17 September 2024 / Published: 19 September 2024
(This article belongs to the Special Issue SAR in Big Data Era III)

Abstract

:
With the rapid development of the modern world, it is imperative to achieve effective and efficient monitoring for territories of interest, especially for the broad ocean area. For surveillance of ship targets at sea, a common and powerful approach is to take advantage of satellite synthetic aperture radar (SAR) systems. Currently, using satellite SAR images for ship classification is a challenging issue due to complex sea situations and the imaging variances of ships. Fortunately, the emergence of advanced satellite SAR sensors has shed much light on the SAR ship automatic target recognition (ATR) task, e.g., utilizing dual-polarization (dual-pol) information to boost the performance of SAR ship classification. Therefore, in this paper we have developed a novel cross-polarimetric interaction network (CPINet) to explore the abundant polarization information of dual-pol SAR images with the help of deep learning strategies, leading to an effective solution for high-performance ship classification. First, we establish a novel multiscale deep feature extraction framework to fully mine the characteristics of dual-pol SAR images in a coarse-to-fine manner. Second, to further leverage the complementary information of dual-pol SAR images, we propose a mixed-order squeeze–excitation (MO-SE) attention mechanism, in which the first- and second-order statistics of the deep features from one single-polarized SAR image are extracted to guide the learning of another polarized one. Then, the intermediate multiscale fused and MO-SE augmented dual-polarized deep feature maps are respectively aggregated by the factorized bilinear coding (FBC) pooling method. Meanwhile, the last multiscale fused deep feature maps for each single-polarized SAR image are also individually aggregated by the FBC. Finally, four kinds of highly discriminative deep representations are obtained for loss computation and category prediction. For better network training, the gradient normalization (GradNorm) method for multitask networks is extended to adaptively balance the contribution of each loss component. Extensive experiments on the three- and five-category dual-pol SAR ship classification dataset collected from the open and free OpenSARShip database demonstrate the superiority and robustness of CPINet compared with state-of-the-art methods for the dual-polarized SAR ship classification task.

1. Introduction

With the increasing development of remote sensing technologies, satellites are becoming more and more able to provide rich ocean data and information. As frequent carriers at sea, ships play a very important role in transportation, trade and defense; therefore, the great surveillance ability of remote sensing systems represents a convenient way to detect and classify ships using remote sensing imagery [1]. In recent decades, benefiting from the 24/7 all-weather monitoring capability of synthetic aperture radar (SAR) systems, it is more prevalent to conduct ship detection and classification using satellite SAR images [2,3,4]. Specifically, with the availability of more and more benchmark datasets such as the OpenSARShip [2] and FUSAR-Ship [3], SAR ship classification has received increasing attention in the SAR remote sensing community.
OpenSARShip is a widely used dataset for SAR ship classification established by the Shanghai Key Laboratory of Intelligent Sensing and Recognition, Shanghai Jiaotong University [2]. The SAR ship images in this dataset are characterized by medium to high resolution, large intra-class variation, and small inter-class separation [2,4]. At the same time, imaging interference in the images of this dataset, including common speckle noise, sidelobes, and smearing effects, make it challenging to classify ships using this dataset [2]. Currently, classification of ship targets using only single-polarized SAR images ignores, for example, the complementary features between dual-polarized images (i.e., SAR ship images in the polarization combinations of vertical–vertical (VV) and vertical–horizontal (VH)/horizontal–horizontal (HH) and horizontal–vertical (HV)) [2]. However, it is very important and conducive to making full use of the complementary information of dual-polarized SAR images to suppress noise interference and improve the classification performance; therefore, in this paper we aim to deeply explore dual-polarized SAR images as a way to achieve high-performance SAR ship classification. Experimental validations are performed on the OpenSARShip dataset [2], which provides more paired polarimetric data (e.g., VV-VH/HH-HV SAR ship images) compared to the FUSAR-Ship dataset [3].
Regarding the SAR ship classification task in the current literature, a few existing methods mainly use handcrafted features for SAR ship representation, for instance geometric features (e.g., length, width, aspect ratio) [5,6,7,8], scattering features (e.g., radar cross section, RCS) [5,6,7], and other widely used traditional features [9,10]. In an important work, Huang et al. [2] first explored the effectiveness of using different manual features for ship classification based on the OpenSARShip dataset using the classic k-nearest neighbor (KNN) algorithm [11]. Salerno et al. [7] extensively validated the significant contribution of the geometric and scattering features for acquiring promising overall ship classification accuracy using low-resolution SAR images. To mitigate the deficiency of single classifiers for ship type prediction, Yan et al. [8] proposed the multiple classifiers ensemble learning (MCEL) method to improve the utility of geometric features for ship classification in SAR images with limited samples. Despite the impressive advances of handcrafted features for SAR ship target classification, there are still a number of challenges. Most importantly, obtaining such manually designed features requires expert knowledge, which is time-consuming and labor-intensive. Moreover, it is always a nontrivial and complex work to perform the training and testing processes incorporating the feature extraction and classifier design. Thus, more efficient feature extraction schemes and classification strategies for SAR ship targets need to be developed.
Recently, deep learning technology has developed rapidly and achieved state-of-the-art (SOTA) performance on many tasks. Motivated by achievements in the computer vision (CV) field, many high-performance convolutional neural networks (CNNs) [12] have been applied to remote sensing image interpretation tasks, including SAR automatic target recognition [13]. Compared with traditional manual features, CNNs can extract deeper and more semantically meaningful features, which endows them with much power to improve the performance of SAR ship classification. On the one hand, to mitigate the issue of deep features’ unexplainability and the issue of sample scarcity in practice, researchers have made efforts to add traditional manual features to CNNs for both SAR ship detection [14] and classification [15,16,17]. For example, Zhang et al. [15,16] proposed integrating some manual features, such as the histogram of oriented gradient (HOG) feature [15,16], the naive geometric feature (NGF) [6], the local radar cross section (LRCS) feature [15], etc., with advanced CNNs, then fused the features to improve network performance. Similarly, Zheng et al. [17] proposed a multi-feature collaborative fusion network framework to explore the interaction between deep features and the handcrafted features. On the other hand, specifically modifying advanced CNNs is another promising way to improve the accuracy of SAR ship classification. He et al. [4] proposed a densely connected triplet CNN model and introduced the Fisher discriminant regularization metric learning to help the network extract more robust features. Dong et al. [18] achieved promising results with high-resolution SAR images by using a residual network [19]. Zhao and Lang [20] and Zhao et al. [21] respectively used transfer learning and domain adaptation technologies to cope with SAR ship classification using an unlabeled target dataset. As these methods are all based on single-polarization (single-pol) SAR images and ignore the complementary information between dual-polarization (dual-pol) images, their performance improvements are undoubtedly limited, especially when dealing with low-resolution SAR images.
Considering the abundant polarimetric information contained in dual-pol SAR imagery, several works have attempted to use this kind of data to obtain better ship classification performance. Xi et al. [22] proposed a novel feature loss double-fusion Siamese network (DFSN). Their approach first uses a detection network to extract the ship area, eliminating the impact of sea clutter and noise, then uses a twin network to extract deep features of the cropped images (mainly composed of the ship targets), and finally uses multiple losses to jointly supervise the network learning process. However, their network is not end-to-end, and needs to first extract the main ship area in the image, which is time-consuming and laborious compared with direct end-to-end classification schemes. Zeng et al. [23] proposed a novel CNN method equipped with the hybrid channel feature loss (HCFL) to sufficiently explore the information contained in dual-polarized SAR ship feature maps at the last layer of the network. Zhang et al. [24] proposed a squeeze-and-excitation Laplacian pyramid network with dual-pol feature fusion (SE-LPN-DPFF). In this method, the dual-pol information and fusion strategy are both studied. Specifically, the deep feature maps from the VV and VH polarized images and their coherence image are concatenated on channel dimension and processed by the attention mechanism and multiscale mechanism to improve performance. He et al. [25] also validated the effectiveness of using polarization for SAR ship classification, and further proposed a group bilinear pooling CNN (GBCNN) [26] with an improved bilinear pooling operation to fuse the dual-pol information, thereby reducing computation complexity and improving classification performance. Xu et al. [27] used a contrastive learning framework to explore the rich dual-polarized information. They regarded the VV and VH SAR images as positive sample pairs to strengthen the classifiers. Additionally, in accordance with the single-pol processing paradigm, Xie et al. [28] and Zhang et al. [29] respectively attempted to fuse the HOG features and the comprehensive geometric features (CGFs) with the deep features from dual-pol SAR ship images for further performance improvement. Recently, He et al. [30] introduced a multiscale deep feature fusion framework applied to a GBCNN [26], based on which the present paper conducts further exploration to boost SAR ship classification performance.
In summary, the above-mentioned methods have two defects. First, existing dual-polarized SAR ship classification methods generally only use the last feature layer of CNNs for fusion processing, ignoring the abundant feature information of the previous layers. Although the last layer of convolution features can represent the most discriminative semantic features, they do not have semantic integrity [31]. Second, simple methods (e.g., concatenation, summation, or convolution) used for feature fusion cannot take full advantage of the complementary information between dual-pol SAR images. Meanwhile, when using second-order bilinear pooling operations, the features will contain redundant information, resulting in limited performance. To address these limitations, there is an urgent need to use multiscale features to obtain richer representations and more deeply explore the complementary information of dual-pol SAR images so as to reduce redundant information and suppress as much noise as possible.
Motivated by the above-mentioned analysis, we propose a novel cross-polarimetric interaction network, dubbed CPINet, to deal with the dual-polarized SAR ship classification task. Specifically, we first elaborate the SAR-DensnNet-v1 [26] backbone network tailored for medium-resolution SAR images and use it to extract the multiscale features of SAR ships. Second, in order to make full use of the complementary information between dual-pol SAR images, we improve the squeeze–excitation (SE) attention block [32] and propose a mixed-order SE (MO-SE) attention module applied to the last feature layer of CNNs. Third, to restrain the effect of noise as much as possible, factorized bilinear coding (FBC) [33] is introduced to fuse the deep features of dual-pol SAR ship images. FBC is an improved method of bilinear pooling [34] that can reduce the number of parameters and computation; it performs a low-value suppression operation after the feature fusion operation, which can help to suppress the effect of noise in SAR images. Finally, in order to obtain more complete semantic information and deeply supervise the network training, the multiscale fused features of the internal and last convolutional layers are sent to the classifier for classification processing, and the GradNorm algorithm [35] is introduced to learn the weight hyperparameter of each loss component, ensuring that the network is better trained.
The main contributions of this paper are as follows:
(1)
We propose CPINet to obtain more complete semantic information by fusing the feature representations at different scales and inherently suppressing the noise interference when making full use of the complementary information between dual-pol SAR ship images.
(2)
A novel mixed-order squeeze–excitation (MO-SE) attention augmentation module is proposed, which is applied on the last feature layer of the CNNs. In this way, the dual-polarized deep features can guide each other, allowing the complementary information between them to be fully mined.
(3)
The GradNorm algorithm is developed for the dual-polarized SAR ship classification; to the best of our knowledge, this is the first time this method has been extended to adaptively balance multiple losses for a single classification task.
(4)
Comprehensive experiments demonstrated that the proposed CPINet is superior to other compared methods and achieves SOTA performance for the challenging SAR ship classification task based on the commonly used OpenSARShip dataset.
The remainder of this paper is organized as follows: related work is reviewed in Section 2; Section 3 describes the proposed method in detail; Section 4 presents the experiments and analysis; finally, Section 5 concludes the paper.
2. Related Works

Recent years have seen many SAR ship classification methods being developed, benefiting from the explosion of research into deep learning techniques; in this section, we review those works most relevant to our proposed method in detail, particularly those for curating the characteristics of SAR ship images.

2.1. Backbone Network for SAR Ship Representation

Thanks to increasing breakthroughs, deep learning techniques, especially CNNs, have developed rapidly and achieved excellent results in the field of CV. Classical networks such as the AlexNet [36], GoogLeNet [37], ResNet [19], DenseNet [38], and others all take the convolution as the core operation, which is quite suitable for image data processing. Therefore, many researchers have tried to introduce CNNs into SAR ship image classification. However, SAR ship data are always faced with a relatively limited number of samples compared to other data modalities, and are usually imbalanced among different categories. If classical deep networks are employed directly, this can easily lead to network overfitting. Thus, researchers have proposed elaborations of classical networks incorporating specific backbone networks designed for SAR images, such as SAR-DenseNet [4,26], fine-tuned VGGNet16 [23], and SE-LPN-DPFF [24]. Compared to traditional networks, these well-designed networks are readily applicable to SAR ship classification owing to their light weight and data adaptation merits.

2.2. Multiscale Deep Feature Fusion

When using CNNs to extract deep features, feature representations from different scales indicate different information levels, i.e., shallow features represent location and appearance information and deep features represent abstract semantic information [36,39]. To sufficiently mine the information, it is better to aggregate contextual information from multiscale deep features, not just the features from the last convolutional layer. At present, fusion methods for multiscale deep features are mainly divided into two aspects. The first involves fusing feature maps from different stages of the network. For example, Cheng et al. [40] proposed a cross-scale feature fusion framework to merge the feature maps from multiple CNN scales, leading to better feature enhancement and fusion. The second involves the processing scheme of GoogLeNet [37], which uses convolution kernels of different sizes to generate features of different scales. Wang et al. [41] and Gao et al. [42] extended this scheme to design further task-specific multiscale feature extraction modules for SAR target classification and hyperspectral image classification applications, respectively.
For SAR ship imagery, only a limited amount of information can be used due to the available data volume and resolution. Therefore, it is important to make full use of the multiscale information to capture multilevel contextual information. Currently, there are few works using multiscale information for SAR ship classification. The representative works are presented as follows. Xu et al. [43] flattened the features at different scales and fused them through the corresponding fully connected layers, which were then input to a softmax layer for the final prediction. Similarly, Wang et al. [44] developed a new attention scheme to improve the discrimination of convolutional features from different scales. In our previous work [30], a multiscale version of the GBCNN model [26], i.e., MS-GBCNN, was developed to fuse the internal convolutional feature maps for dual-polarized SAR ship classification, which laid the foundation for us to explore the feature representation of dual-polarized SAR ship images in depth in the current paper.
2.3. Attention Mechanism

At present, a variety of attention mechanisms have been explored [45]. The core idea of the attention mechanism is to enhance favorable information and inhibit ineffective information by learning features of interest. Considering the prevalence and prominent performance of attention mechanisms in the CV field, a number of scholars have introduced them into the remote sensing regime. Zhang et al. [24] used SE [32] to capture important features and significantly improved the network performance by learning the distribution of different channels. Li et al. [31] enhanced the features along the channel and spatial dimensions by passing the fused high-level features through the convolutional block attention module (CBAM) [46]. For SAR ship imagery, it is highly necessary to enhance the useful features and suppress noise interference with the aid of an attention mechanism. For example, Zhou et al. [47] directly applied SE attention and self-attention in a sequential manner to capture the rich contextual information of SAR ship images. In this paper, we make further improvements to the SE module in order to deeply mine the discriminative information of the ship targets in SAR images for better classification performance.

2.4. Deep Feature Integration for Dual-Polarized SAR Images

The dual-pol mode used in this paper includes a VH cross-polarized channel and VV co-polarized channel, which are combinations of the polarization states in the horizontal–vertical (H-V) basis [48]. VH polarization has a higher signal-to-noise-ratio (SNR) and the volume scattering dominates the power returns of the ships, while in VV polarization the ships in SAR images usually have higher backscattering and commonly present direct reflections from metallic constructions as well as the double-bounce effect between the superstructure and deck [24,49]. Hence, there is a need to fully utilize the advantages of dual-pol SAR images and explore the complementary information between them to boost ship classification performance. Previous works [23,24] have directly concatenated the feature maps along the channel dimension, which is insufficient for exploring the complementary information between dual-pol images. Fortunately, many studies have shown that bilinear pooling [34] outperforms simple fusion techniques such as direct concatenation and addition [25,26]. However, despite the obvious advantages of bilinear pooling, it has two problems, namely, redundancy and burst [33]. In SAR ship classification, there is less information representing the ship part itself due to the limited proportion of ships in the imagery. Thus, using bilinear pooling for fusion results in more redundant information and leads to marginal performance gains, inducing more challenges when deeply exploring both dual-pol information and interference suppression. To address the above issues, we introduce an alternative bilinear pooling method, i.e., the FBC algorithm [33], to facilitate deep integration of dual-pol information.

3. Proposed Methodology

In this section, we first introduce the overall architecture of the proposed CPINet in Section 3.1. The following Section 3.2 and Section 3.3 present the details of each module in the CPINet. Finally, Section 3.4 describes the corresponding optimization objective.

3.1. Overall Architecture

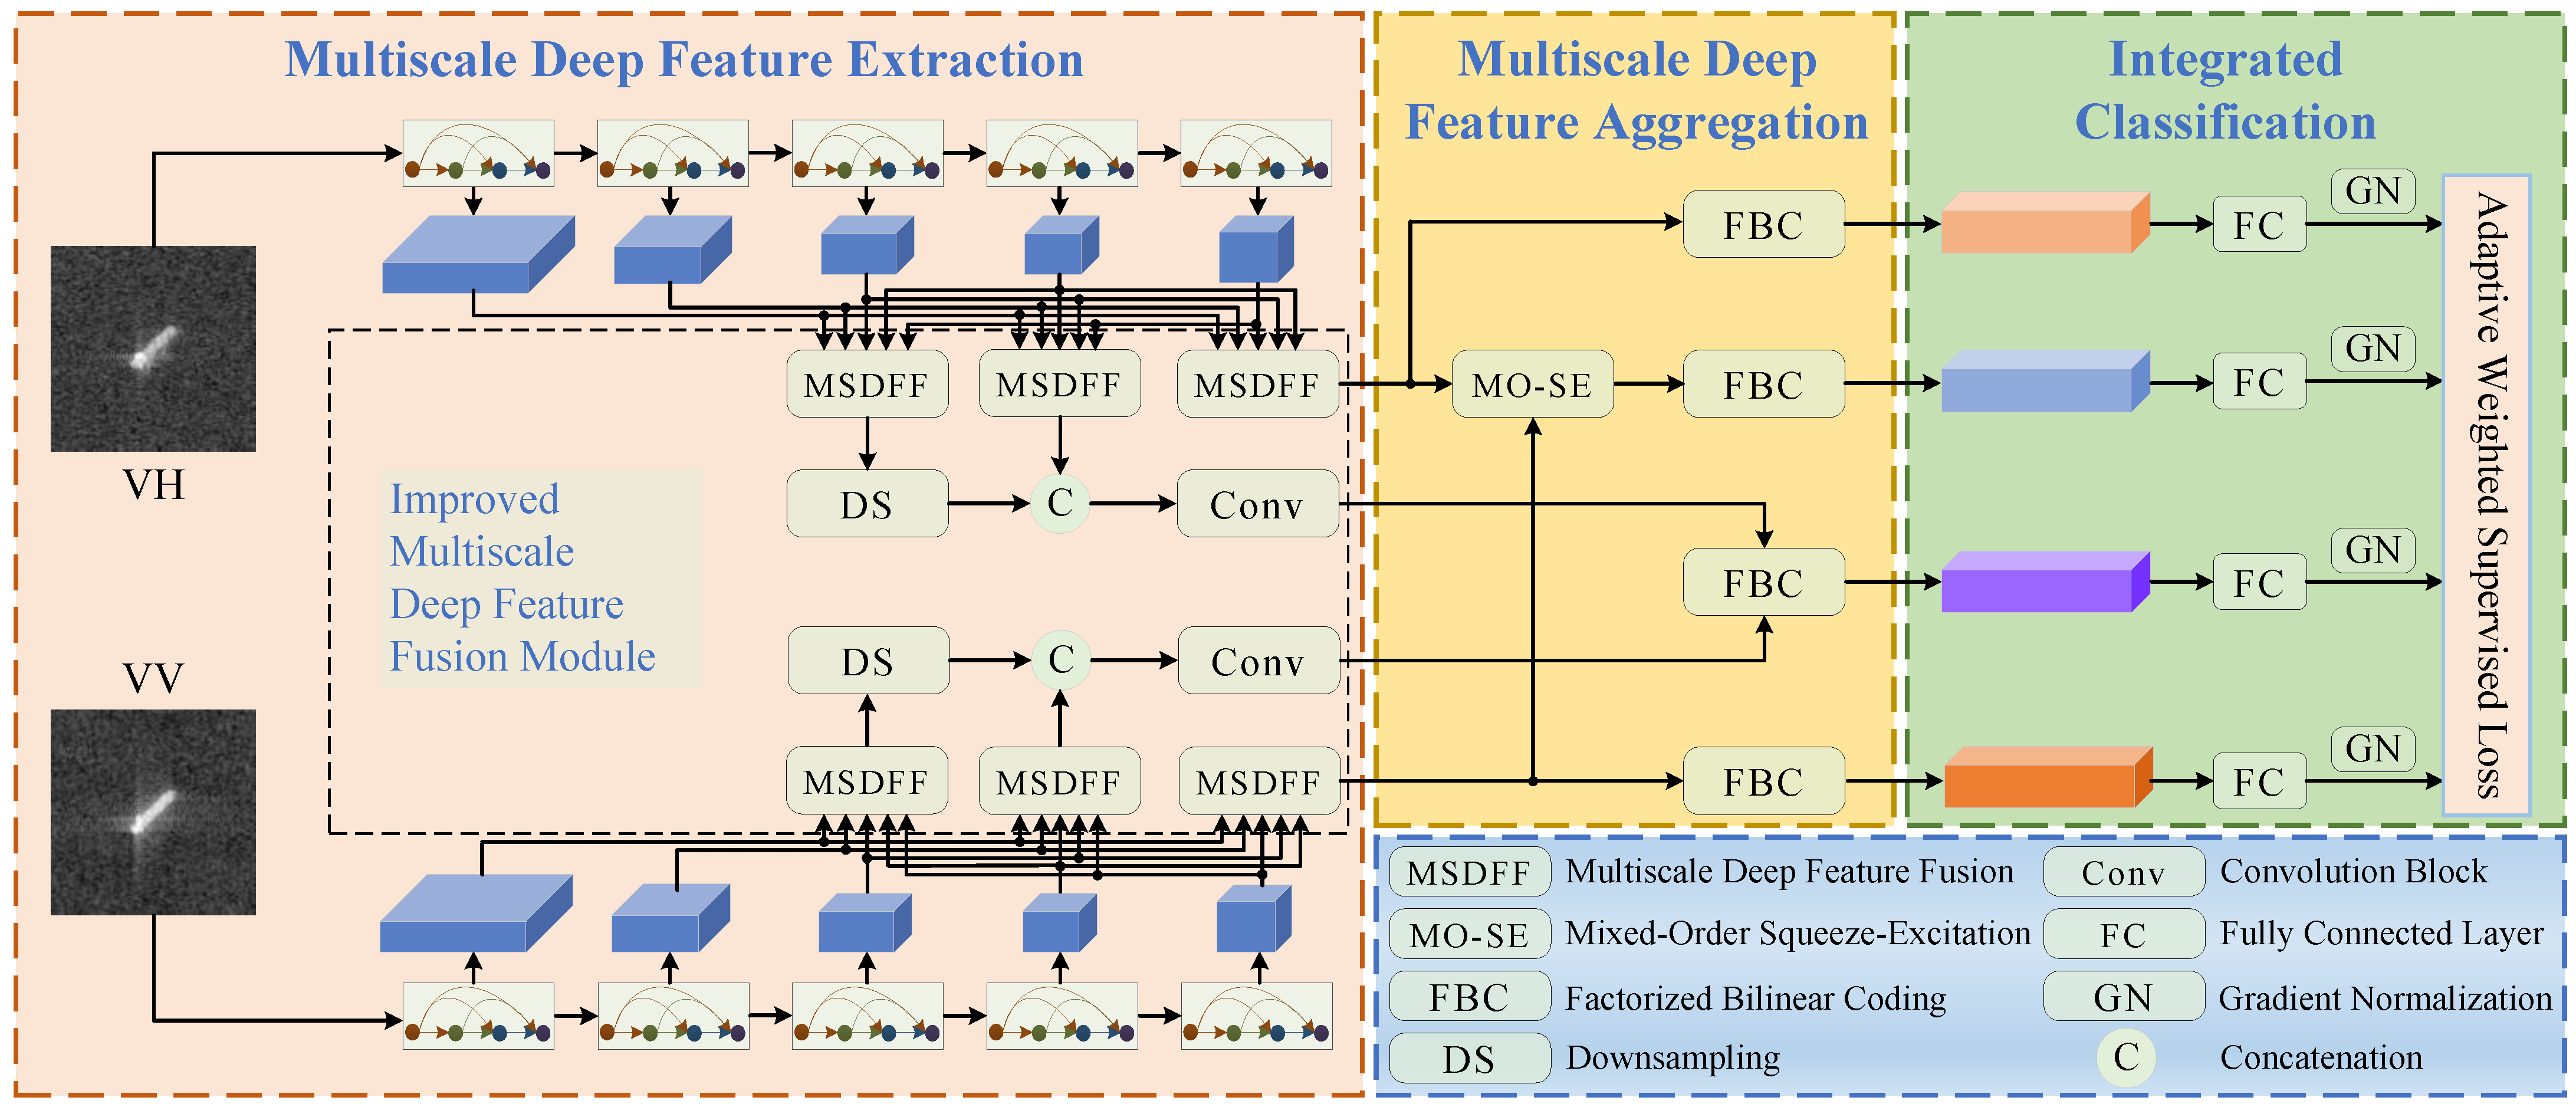
CPINet is an end-to-end fully supervised network. It aims to enhance the representation ability of the deep features and deeply mine the complementary information between the dual-pol SAR images. As shown in Figure 1, the CPINet mainly comprises three successive processes, i.e., multiscale deep feature extraction, multiscale deep feature aggregation, and integrated classification. To be specific, first, dual-polarized SAR ship images are respectively fed into the pseudo-Siamese network model, which is based on our previously proposed backbone, SAR-DenseNet-v1 [26], to generate multilevel feature maps. The improved multiscale deep feature fusion (IMDFF) module, which is based on the preliminary version of multiscale deep feature fusion (MSDFF) proposed in our previous work [30], is developed to fuse features at different scales to acquire rich contextual information. Second, to further enhance the discriminative power of the deep features and deeply mine the complementary information between dual-pol SAR images, the newly proposed MO-SE augmentation module is introduced in the last feature layer of the backbone network. Subsequently, the FBC [33] method is applied to fuse the multiscale feature maps as well as the MO-SE augmented feature maps generated from the dual-polarized SAR ship images. Meanwhile, the highest-level feature maps processed by the MSDFF of the dual-polarized SAR ship images are individually self-fused by the FBC. Finally, the resulting four bilinear vectors obtained by the FBC are transformed using the parameter-shared embedding layer to further extract much more discriminative semantic information, which is then processed by the softmax function [4] for category prediction and loss computation. Additionally, for better network optimization, we propose an extension to the GradNorm [35] method to the single classification task in order to adaptively balance the multiple losses.

3.2. Multiscale Deep Feature Extraction

3.2.1. Backbone Network Architecture

Due to the low resolution of the OpenSARShip dataset, most existing classification methods [22,23,24,25,26,27,30] strive to adaptively design CNN models to extract discriminative convolution features. A common characteristic of these models is that the convolutional kernel and the number of channels in the feature maps are both relatively small. In order to inherit these performance advantages, our previous proposed SAR-DenseNet-v1 [26] model is preferably utilized as the backbone of CPINet. Specifically, it has five dense blocks (DBs) [38], each of which contains three densely connected convolutional layers. After the first four DBs, a transition layer (TL) downsamples the feature maps using 2 × 2 average pooling [38]. The growth rates [38] for the five DBs are 3, 6, 9, 12, and 15, respectively. The size of all convolution kernels is set to 3 × 3 . More details can be found in [4,26,38]. The feature maps from the first four TLs and the last DB, denoted as F DB 1 , F DB 2 , F DB 3 , F DB 4 , and F DB 5 , respectively, are subsequently passed to the IMDFF module.

3.2.2. Improved Multiscale Deep Feature Fusion

Generally speaking, features extracted from different levels comprise fruitful contextual information. The low-level features are rich in appearance information, while the high-level features better represent semantic information. Thus, existing works [50,51] have tended to explore hierarchical feature fusion in pursuit of improved performance. Inspired by this paradigm, we extend the multiscale feature fusion method proposed in our previous work [30] to the IMDFF module in order to enhance the representation ability of the network even under the critical conditions of low resolution and various ship sizes. As shown in Figure 1, similar to [30], the feature maps of different levels are processed by the IMDFF module to generate multiscale deep features at the resolutions of the last three DBs, which are denoted as F DB 3 , F DB 4 , and F DB 5 , respectively. Unlike [30], the multiscale features F DB 3 and F DB 4 are further concatenated in the IMDFF module and fused by a convolution block for better model performance and efficiency. For clarity, an instantiation of the MSDFF in Figure 1 is illustrated in more detail in Figure 2.
Similar to [30], we take the scale of DB3 for brevity, with an example shown in Figure 2. Given the feature maps F DB 3 - VH of the VH polarization SAR ship image extracted from the TL of DB3, we downsample the low-level features F DB 1 - VH and F DB 2 - VH by max pooling (MaxPool) [12] to make their resolution the same as F DB 3 - VH (i.e., a MaxPool layer with a window size of 4 × 4 and step size of 4 is used for F DB 1 - VH and a MaxPool layer with a window size of 2 × 2 and step size of 2 is used for F DB 2 - VH ). Meanwhile, we upsample the high-level features F DB 4 - VH and F DB 5 - VH by deconvolution [30] to change their resolution to be the same as F DB 3 - VH . Next, the rescaled feature maps are concatenated along the channel dimension, then transformed to the same dimension as F DB 3 - VH by the convolution block and subsequently added to F DB 3 - VH through the powerful residual structure [19,30]. In this way, the contextual information is fully explored and strengthened. The above-mentioned process is formulated as follows:
F DB 1 - VH ¯ = MaxPool 4 × 4 ( F DB 1 - VH ) F DB 2 - VH ¯ = MaxPool 2 × 2 ( F DB 2 - VH ) F DB 4 - VH ¯ = ConvT ( F DB 4 - VH ) F DB 5 - VH ¯ = ConvT ( F DB 5 - VH ) F DB 3 - VH = F DB 3 - VH + f 1 × 1 Concat [ F DB 1 - VH ¯ , F DB 2 - VH ¯ , F DB 4 - VH ¯ , F DB 5 - VH ¯ ]
where MaxPool n × n denotes the max pooling operation with kernel size n × n , ConvT denotes the transposed convolution [52], and F DB 1 - VH ¯ , F DB 2 - VH ¯ , F DB 4 - VH ¯ , and F DB 5 - VH ¯ represent the feature maps obtained by the downsampling and upsampling operations, respectively, which are then concatenated using the Concat operation, transformed by the convolution block f 1 × 1 comprising sequential operations of 1 × 1 convolution, batch normalization (BN) [53], and ReLU [36], and finally added in residual to derive the fused feature maps of F DB 3 - VH .
Additionally, as mentioned above, the output feature maps F DB 3 - VH and F DB 4 - VH are further fused. As shown in Figure 1, we downsample F DB 3 - VH by max pooling to make its resolution the same as F DB 4 - VH . Then, we perform the Concat and convolution block f 1 × 1 operations to integrate the multiscale deep features. The final obtained feature maps are denoted as F MS - VH . Meanwhile, the above operations are also applied to the VV polarization SAR ship images. The computation processes are formally expressed as follows:
F MS - VH = f 1 × 1 Concat [ MaxPool 2 × 2 ( F DB 3 - VH ) , F DB 4 - VH ] F MS - VV = f 1 × 1 Concat [ MaxPool 2 × 2 ( F DB 3 - VV ) , F DB 4 - VV ] .
To sum up, it can be observed that the MSDFF module is a component of the newly proposed IMDFF module. There are two main improvements of the IMDFF compared with the MSDFF. First, the multiscale deep features of the DB3 and DB4 derived by the MSDFF submodule are further fused in the IMDFF module, which can effectively strengthen the multiscale deep features and suppress the redundant information. Second, the deep features of the DB5 also undergo a multiscale feature fusion operation through the MSDFF, allowing much more high-level semantic information to be extracted. Thanks to the above-mentioned modifications, the multiscale deep features from the IMDFF module are more compact and discriminative than the intermediate ones simply obtained by the MSDFF. The improvements of the IMDFF with regard to the MSDFF are validated in depth in the ablation study part of the Experiments section.

3.3. Multiscale Deep Feature Augmentation and Aggregation

Given the multiscale deep features of dual-polarized SAR ship images, it is paramount to acquire more discriminative high-level semantic representations. To this end, we proposed the MO-SE attention mechanism to enhance the interaction benefit of the dual-polarized high-level multiscale fused features. In addition, the multiscale deep features, either with or without MO-SE augmentation, are further integrated using the FBC method [33] in the form of dual-polarized cross-aggregation and single-polarized self-aggregation, respectively. The diagram is briefly illustrated in Figure 1 and more details are introduced below.

3.3.1. Mixed-Order Squeeze–Excitation Attention Augmentation

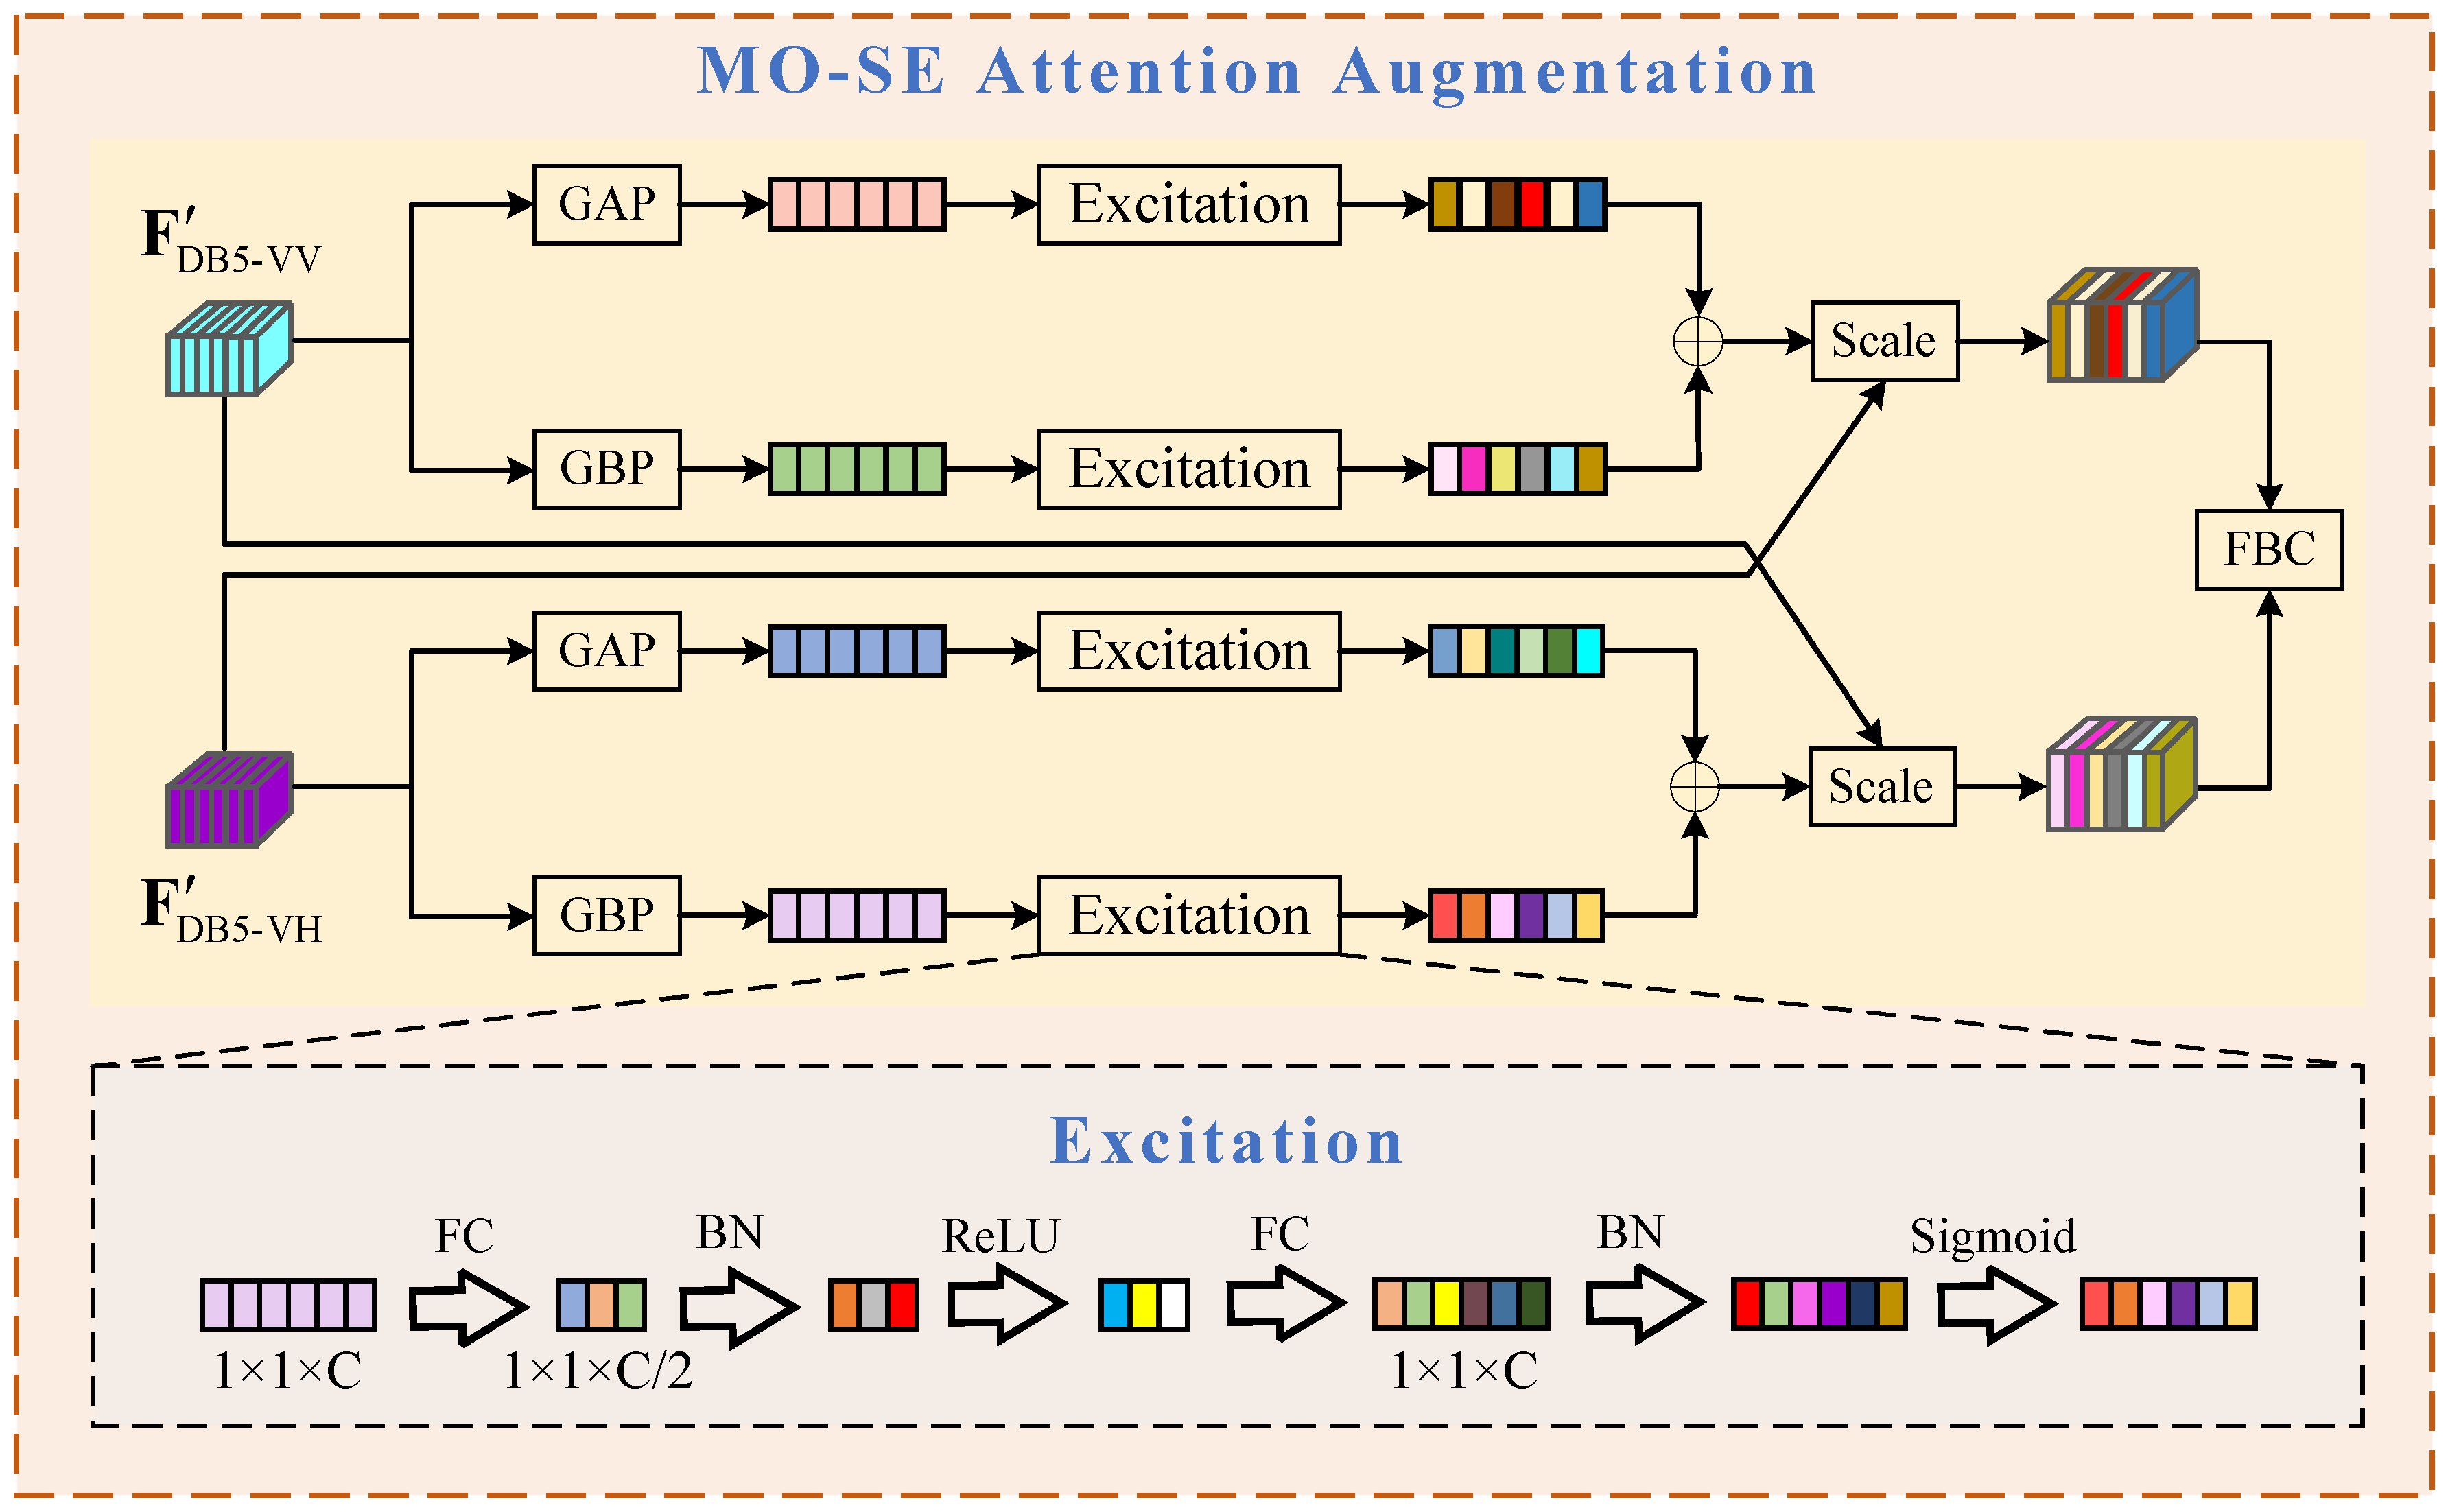
The proposed MO-SE module was designed to fully explore the complementary information between the dual-polarized high-level deep features, which was motivated by the original SENet [32]. As the SE module was developed to model the semantic relationship among the feature channels, MO-SE is properly performed on the most high-level dual-pol multiscale deep features F DB 5 for semantic information augmentation.
The classical SENet [32] has excellent performance, and has previously been introduced into the SAR ship classification [24]. It can effectively capture important features and suppress useless features by modeling the correlation dependency among channels and adaptively learning the importance of each channel. The general SE block consists of an average pooling layer, two fully connected (FC) layers, and two activation functions [32]. The expression of the process can be written as follows:
s = F e x ( F DB 5 , W 1 , W 2 ) = σ ( BN ( W 2 δ ( BN ( W 1 F s q ( F DB 5 ) ) ) ) )
X = F scale ( F DB 5 , s )
where F DB 5 indicates one single-polarized feature map of the last DB5 block resulting from the IMDFF module, which is then aggregated by the squeeze operation F s q ; W 1 and W 2 are the filter weights of the two FC layers, δ and σ are the ReLU [36] and sigmoid [32] activation functions, respectively, and the above processes comprise the excitation operation F e x . Note that unlike the excitation in the original SE block and similar to [51,54], we propose easing the optimization process by employing the BN operation [53] prior to each activation function. The resulting weight vector s is finally used to recalibrate the original input features by the channel-wise multiplication operation F scale . As can be seen, one key operation of the SE block is the squeeze phase, where the channelwise features are aggregated using global average pooling (GAP) [32]. However, GAP can only capture the first-order statistics of the feature maps, which is insufficient to extract more discriminative deep features. Thus, inspired by the work of [55], we propose introducing second-order pooling to the SE block for more informative feature extraction, naturally resulting in the novel MO-SE block. The overall diagram of the proposed MO-SE module is summarized in Figure 3, which is interpreted in the following part.
The core characteristic of the MO-SE module is to comprehensively consider the multiple-order statistics of the multiscale deep features. As shown in Figure 3, in addition to the first-order statistics z GAP obtained by GAP aggregation in the SE block, our previously proposed group bilinear pooling (GBP) [26] method is also employed to extract the second-order statistics of the feature maps. GBP is an improved version of bilinear pooling [34] in terms of model efficiency and effectiveness. In practice, GBP for single-polarized feature maps is implemented as follows [26]:
z pol GBP = B F pol i , F pol j 1 i G i j G
where F pol i and F pol j are two channel-equal subgroups of the multiscale deep features in polarization mode pol (i.e., VH or VV), B indicates the original bilinear pooling operation [34], and G means the subgroup number of the feature maps. The operation [ · ] is used to concatenate the vectorized sublinear vectors. Consequently, the first- and second-order statistics of the deep features are obtained, upon which the excitation process F e x in Equation (3) is then performed.
Through the above process, two gated vectors from one single-polarized feature map (e.g., F DB 5 - VV ) are obtained using Equation (3), then directly added and channel-wise multiplied to another single-polarized feature map (e.g., F DB 5 - VH ) using Equation (4) to acquire the reweighted multiscale deep features. In this way, each polarization channel achieves the corresponding MO-SE augmented high-level deep features that are aggregated by the FBC method.

3.3.2. Factorized Bilinear Coding Aggregation

Given the deep features augmented by the IMDFF and MO-SE modules, an imperative task is to further develop highly discriminative representations for superior classification. Recently, the bilinear pooling method [34] applied to deep feature maps has received increasing attention and achieved promising performance for fine-grained classification tasks. However, the original bilinear CNN models are blamed for several issues, e.g., information redundancy and burstiness (i.e., less discrimination) in feature distribution [33]. As such, considering the ability to generate compact and discriminative representations, we duly employ the FBC method [33] on the resulting deep feature maps.
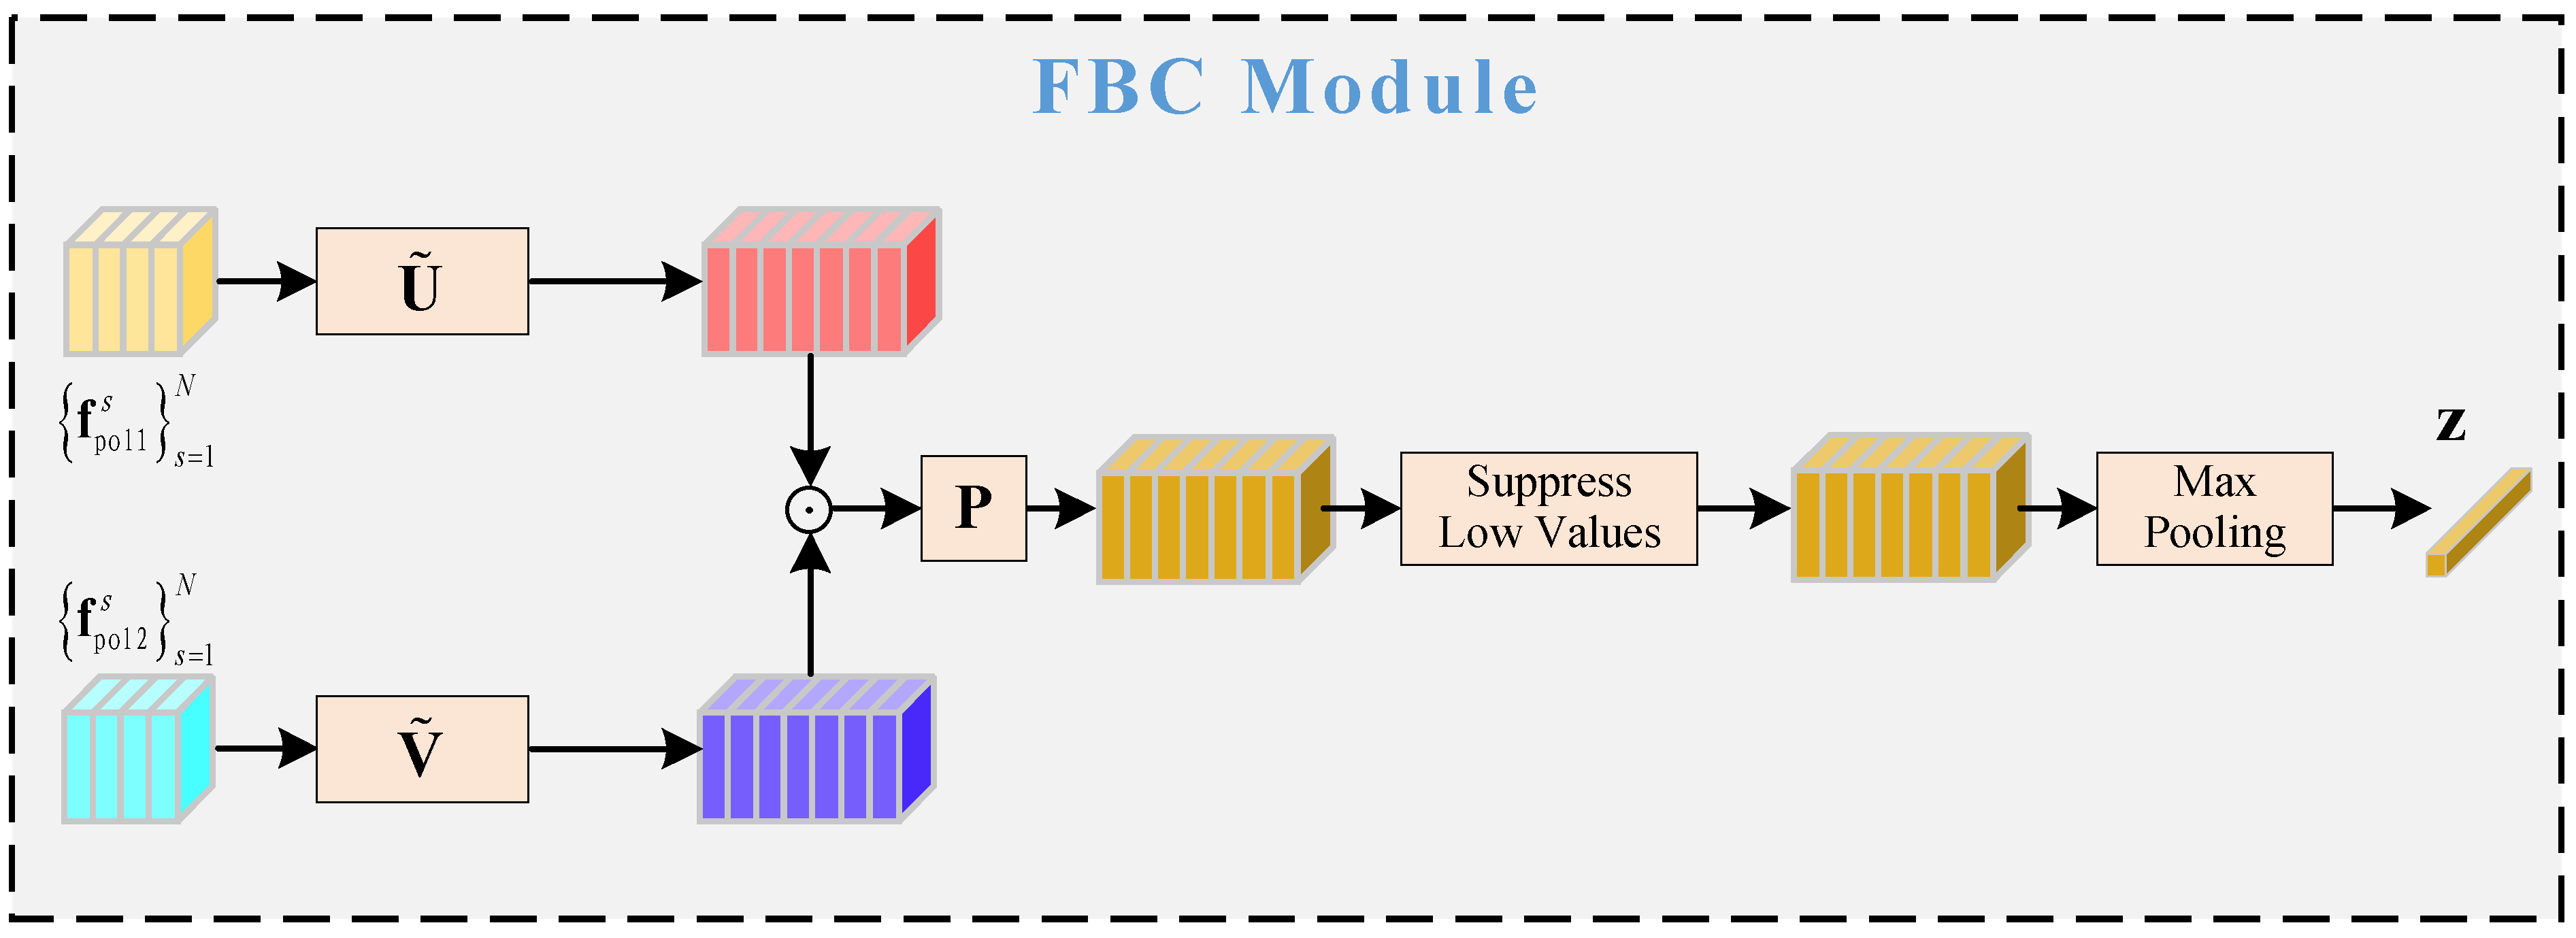
In the FBC method, a coding perspective is developed to reformulate the bilinear pooling as a similarity-based coding process. Consequently, we propose using factorized bilinear pooling, in which sparse coding is introduced to obtain compact representations [33]. Specifically, in the context of SAR ship classification, the FBC method aims to encode feature vectors { f pol s 1 R p , f pol s 2 R p } obtained from a specific spatial location s of the resulting multiscale deep features, either from only the same single-pol mode (VH or VV) or from the pairwise dual-pol mode (VH and VV), into sparse codes c s R k by solving the following optimization problem [33]:
min c s f pol s 1 f pol s 2 T l = 1 k c s l U l V l T 2 2 + λ c s 1
where pol 1 and pol 2 are the abovementioned polarization modes, T is the transpose operation, and λ is a trade-off parameter. The bilinear features f pol s 1 f pol s 2 T are reconstructed by the low-rank factorization U l V l T for the l-th atom b l of the dictionary B = [ b 1 , b 2 , , b k ] , where U l R p × r , V l R p × r , k is the number of atoms, and r is the rank of decomposition, properly set to 1 as indicated in [33]. The L 2 -norm · 2 and L 1 -norm · 1 are used to perform the reconstruction and sparsity constraint, respectively.
According to [33], the LASSO method [56] and some workarounds are used to derive the final solution of Equation (6), as follows:
c s = P ( U ˜ T f pol s 1 V ˜ T f pol s 2 ) c s = sign ( c s ) max abs ( c s ) λ 2 , 0
where U ˜ R p × r k and V ˜ R p × r k are two learnable filter parameters, ∘ denotes the Hadamard product, P R k × r k is a constant binary matrix with the elements indexed by [ l , ( l 1 ) × r + 1 : l r ] being “1”, and l varies from 1 to k. The sign function sign ( · ) , maximum operation max ( · ) , and absolute value function abs ( · ) are applied elementwise to the codes c s . Finally, the codes c s from all the spatial locations of the feature maps are fused by a max pooling operation, as in [33]. The whole diagram of the FBC module is illustrated in Figure 4. Through the above process, the compact and discriminative bilinear features z are obtained, which are further processed by the integrated classification module.

3.4. Optimization Objective

Thus, after the FBC module we have four global bilinear feature vectors for the dual-polarized SAR ship images. Similar to previous works [26,30], we further employ a parameter-shared embedding layer (i.e., the FC layer; see Figure 1) to transform the bilinear features into highly discriminative semantic representations, which are then passed to the Softmax classifier [4] for category prediction. For optimization of the network parameters, we follow the paradigm of loss construction in [22,26,30] to compute the following overall loss L ( t ) :
L ( t ) = i S w i ( t ) L i ( t ) , S = { DB 34 , MO - SE , DB 5 - VH , DB 5 - VV }
where L i ( t ) is the cross entropy (CE) loss [4] computed from the i-th embedding at the training epoch t, i.e., the fused dual-polarized multiscale features from DB3 and DB4 ( i = DB 34 ) , the fused dual-polarized multiscale features augmented by the MO-SE ( i = MO - SE ) , the VH-polarized multiscale features from DB5 ( i = DB 5 - VH ) , and the VV-polarized multiscale features from DB5 ( i = DB 5 - VV ) . The single loss term L i ( t ) is adaptively weighted by w i ( t ) at the training epoch t. In most of the literature, the weights of the multiple losses are tuned manually, which is labor-intensive and may lead to suboptimal performance. In this paper, we propose adaptively selecting the weight for each loss term in the training process, which is inspired by the loss balancing strategy in multitask networks, i.e., the GradNorm [35] method.
In effect, the combined loss in Equation (8) is a specific case of GradNorm when the tasks are highly symmetric, that is to say, there are a total of four similar classification tasks in the proposed method, all of which are supervised by the CE loss. Specifically, to balance the contribution of each single CE loss and modulate the training rate of each classification task, GradNorm aims to minimize the following gradient magnitude regularization L 1 loss function summed over all tasks:
L G r a d ( t ; w i ( t ) ) = i S G W ( i ) ( t ) G ¯ W ( t ) × [ r i ( t ) ] α 1
where G W ( i ) ( t ) is the gradient’s L 2 -norm of the i-th weighted CE loss w i ( t ) L i ( t ) with respect to the filter weights W of the shared FC layer; the averaged gradient norm G ¯ W ( t ) across all classification tasks is the common scale, which is further tuned by the α -exponentiated relative inverse training rate r i ( t ) of the i-th task to balance the corresponding gradient norm. The relative inverse training rate r i ( t ) of the i-th task is obtained via normalizing the loss ratio L ˜ i ( t ) = L i ( t ) / L i ( 0 ) , then the averaged value of this ratio across all tasks at training epoch t and L i ( 0 ) is computed as the first epoch’s loss value for each task [35]. Here, α is a hyperparameter that controls the strength of training rate balancing, with higher values needed for highly complex multitasks and lower values preferred for more symmetric tasks [35]. Because the multiple classification task in Equation (8) is the symmetric case of GradNorm, we set α to a relatively small value of 0.12, as indicated in [35].
After implementing GradNorm, the training rate is balanced by minimizing Equation (9) with respect to w i ( t ) , that is, a single task with a larger gradient norm (i.e., larger degree of parameter update) or lower loss ratio (i.e., faster training rate) is penalized in order to decrease the gradient norm to lower the training speed while speeding up the corresponding task. In the end, all of the tasks converge to a similar training rate with a common gradient magnitude.
In summary, the training processes of the overall network’s parameters and loss weights w i ( t ) are performed in sequence at every epoch. Specifically, in each training epoch t we first minimize Equation (9) with respect to the weights w i , then minimize the integrated CE loss L ( t ) with respect to the overall network’s parameters. Note that when updating the loss weights, the target gradient norm of the subtrahend in Equation (9) is fixed as a constant for robust training and the updated weights of each epoch are renormalized to the number of total tasks [35]. Interested readers may refer to [35] for more details. After convergence of the overall network, the predictions from the four symmetric classification branches are assembled for final inference, as indicated in [16,26].

4. Experiments

In this section, we perform a series of experiments and analyses to validate the effectiveness of the proposed CPINet.

4.1. Dataset and Experimental Setup

As described in Section 1, we utilized the OpenSARShip dataset [2] for experimental verification. Specifically, consistent with our previous work in [4,26], the three- and five-category dual-pol (VH and VV) ground range detected (GRD) SAR ship images in the interferometric wide swath mode (IW) were selected. The three categories are tanker, container ship, and bulk carrier. The five categories additionally contain another two ship types: cargo and general cargo. The SAR ship images are all in sizes of 64 × 64 . For better model training and evaluation, the strategies of data augmentation, data normalization, and training–testing set split were all in accordance with those in [4,26]. Specifically, the training samples were simply augmented by flipping, rotation, translation, and adding noise interference [4,26], which are summarized in Table 1. The augmented data size of each class in the three- or five-category classification task were determined by the class with the fewest samples, i.e., equal to augmenting the samples seven times and adding the corresponding initial ones. Each image was normalized using the mean and standard deviation of its pixel values [4,26]. More details about the training–testing set split can be found in Section 4.2.
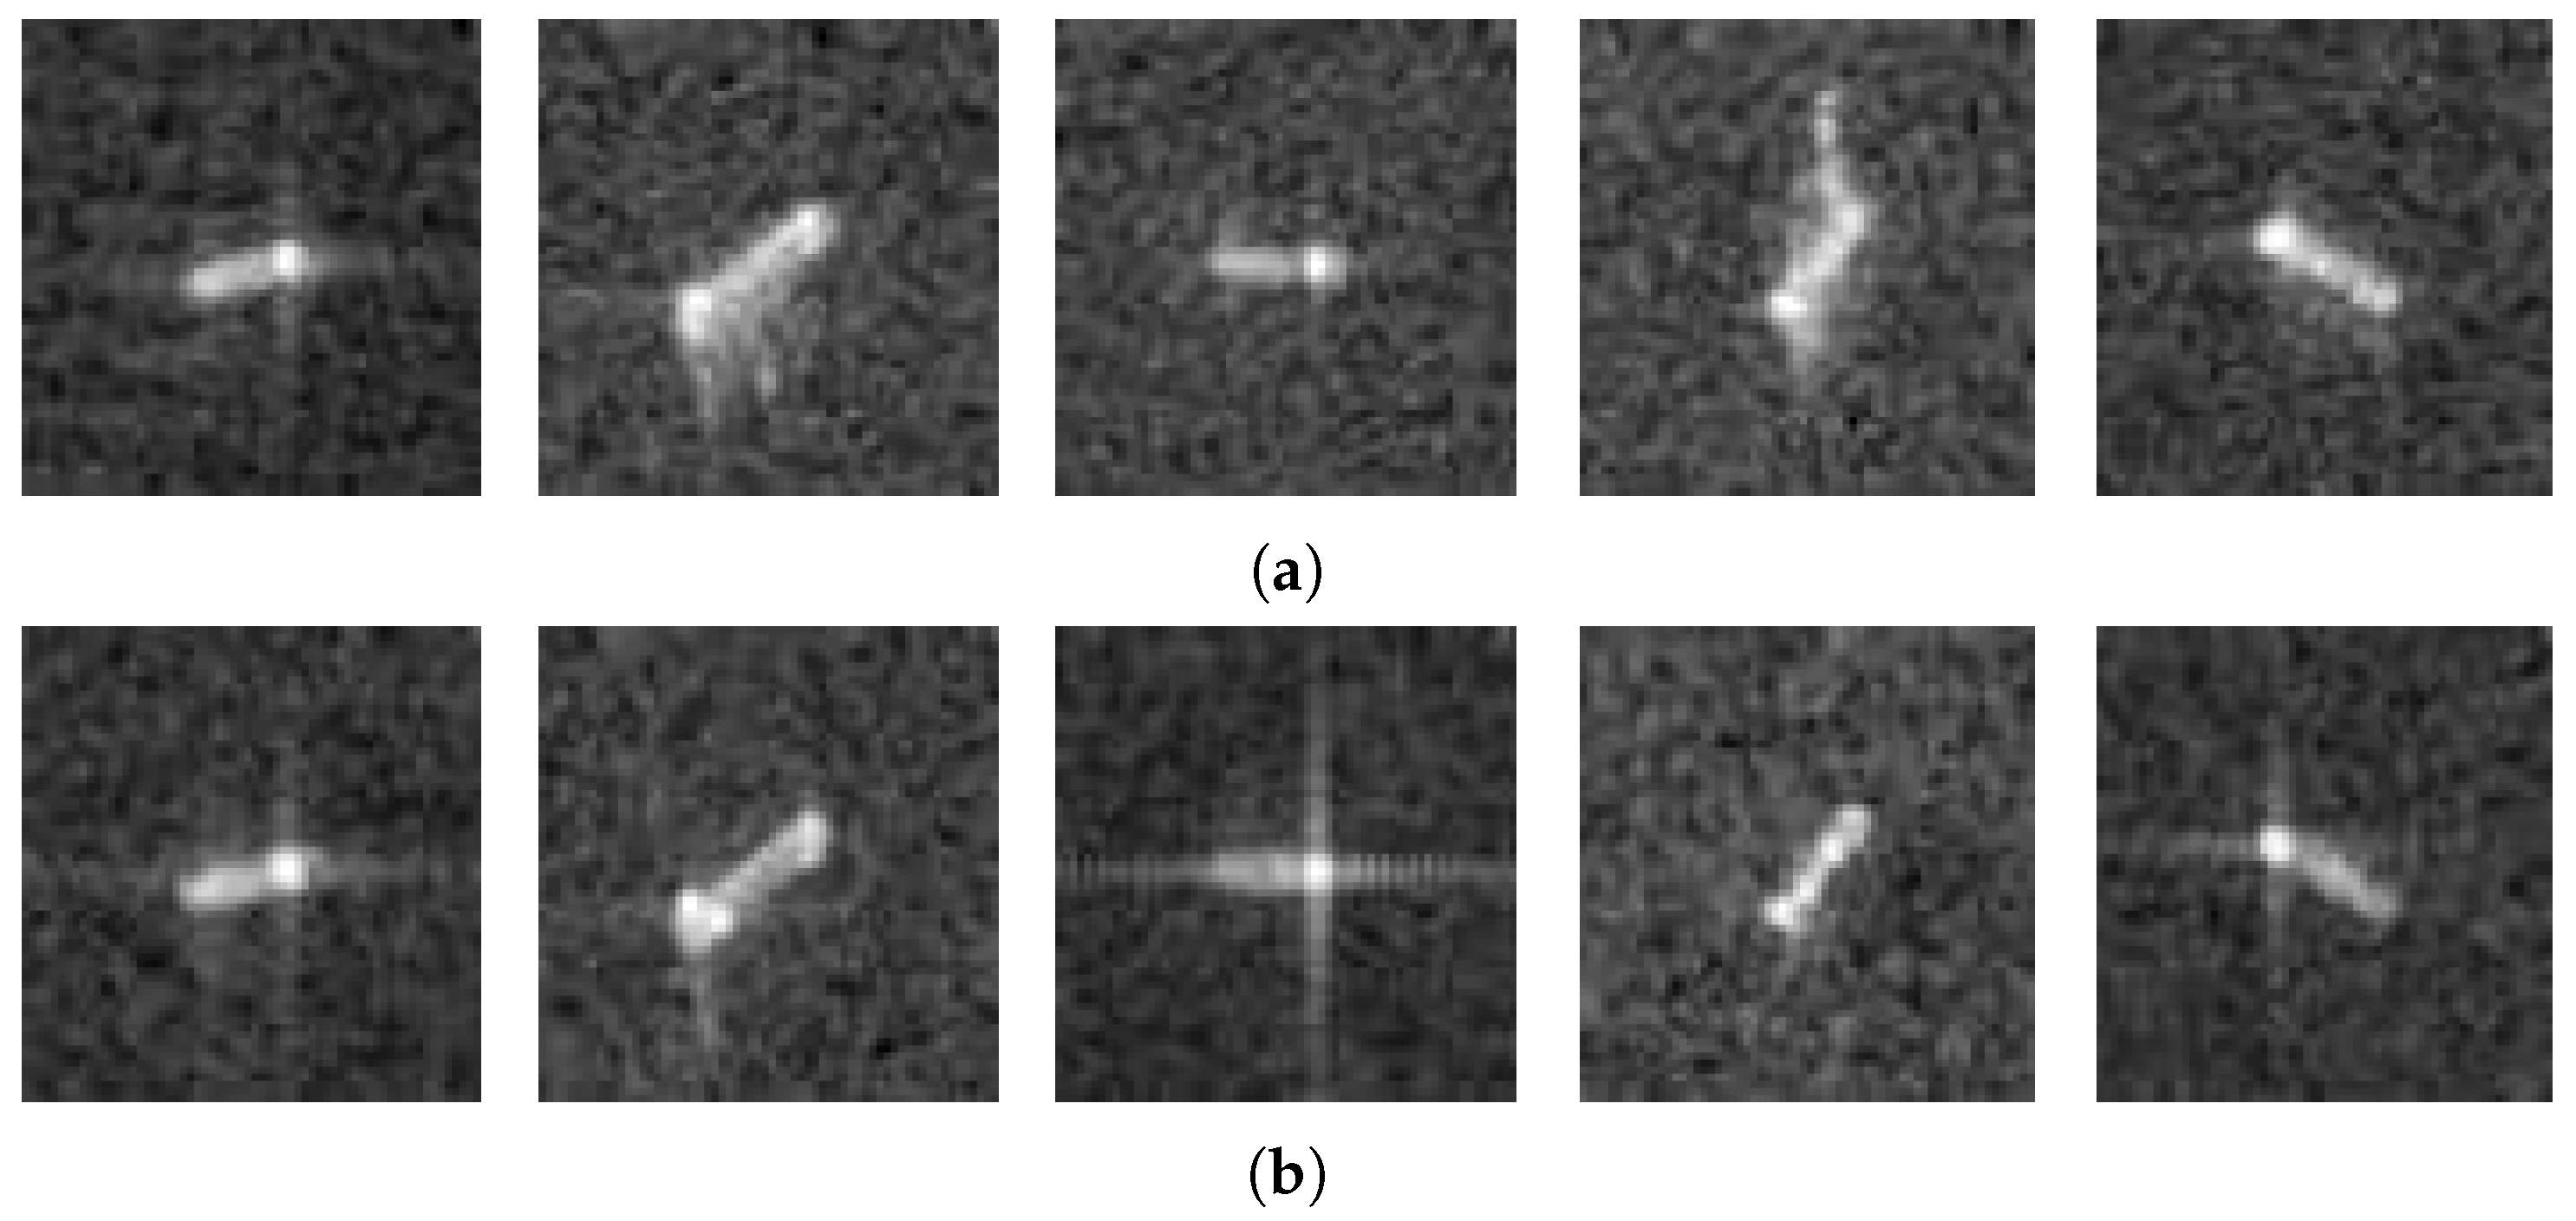
The statistics of the initial pairwise dual-pol SAR ship samples and the augmentation results are summarized in Table 2. In addition, Figure 5 intuitively presents the five-category dual-pol SAR ship images, from which it can be observed that there is serious interference present in the dataset and that it is challenging to acquire promising classification performance.
The experimental environment and parameter setup are concisely listed in Table 3. The network parameters and multiple loss weights were optimized using the stochastic gradient descent (SGD) [4] algorithm with momentum of 0.9. The initial learning rate was set as 0.01, which was divided by 10 at each of epochs 150, 200, and 250. To alleviate overfitting, we set the weight decay parameter and dropout rate to 5 × 10 4 and 0.2, respectively.

4.2. Evaluation Metrics

For fair and statistical performance comparison, as in [26], we conducted the data split for each classification task five times by randomly selecting the training–testing sets. Three experimental runs were conducted for each data split and the median evaluation value was recorded. The mean and standard deviation of the five testing groups were reported for final evaluation. Similar to the works of [16,24,26,30,44], the common evaluation metrics were the overall accuracy (OA), precision (P), recall (R), F 1 score, and confusion matrix. To calculate these metrics, it is first necessary to determine the following quantities: for a specific category, TP (true positive) and FN (false negative) are respectively used to represent the numbers of samples correctly classified and wrongly classified as belonging to the current category, FP (false positive) indicates the number of samples from other categories classified as belonging to the current category, and TN (true negative) indicates the number of samples that are correctly classified as being from other categories. Therefore, the correlated evaluation metrics can be defined as follows [57]:
R = TP TP + FN
P = TP TP + FP
F 1 = 2 × P × R P + R
OA = TP + TN TP + FP + TN + FN .
Note that in order to demonstrate the statistical stability of the proposed model, the evaluation metrics defined above are all presented in the form of “mean ± standard deviation” derived from the five testing groups, calculated as follows:
mean = 1 n i = 1 n M i , standard deviation = 1 n i = 1 n ( M i mean ) 2
where n = 5 and M is a specific evaluation metric. The confusion matrix is a contingency table in which the rows indicate the ground truth labels and the columns indicate the predicted labels. Note that for greater clarity the entries of the confusion matrix are represented by the values of the TP, FN, and FP metrics for each category instead of by the common probabilities of the ground truth labels predicted for several categories.

4.3. Comparison with State-of-the-Art Methods

In this subsection, we present a comprehensive comparison between the proposed CPINet and the most closely related dual-pol SAR ship classification methods. As in [26], the compared DFSN [22], HCFL [23], and SE-LPN-DPFF [24] methods are directly applied here. The experimental details were consistent with the original literature and the adaptive modification in GBCNN [26]. As additional related methods, the MS-CNN [43] and MS-GBCNN [30] multiscale feature fusion based methods were included in the comparison. Additionally, the recently proposed DPIG-Net [58] was used for comparison due to its dual-pol SAR ship classification style. The comparison experiments were conducted on the three- and five-category classification tasks, the quantitative evaluation results of which are summarized in Table 4 and Table 5, respectively.
As can be seen from Table 4 and Table 5, our proposed CPINet is able to achieve overwhelming ship classification performance in comparison to the SOTA methods. Additional conclusions can be drawn as follows: for the three-category classification task, almost all of the methods can achieve evaluation metrics over 80 % . CPINet achieves the best performance in terms of F 1 and OA, which are as high as 86.89 % and 89.40 % , respectively. It is worth noting that the SE-LPN-DPFF [24] and DPIG-Net [58] methods take the polarimetric coherence feature as input for deep model learning, which may be deficient in situations involving GRD amplitude data [26], resulting in inferior performance. The MS-CNN method simply integrates the multiscale features from different stages of a backbone model, which is insufficient to fully explore the contextual information in the network. Based on the same backbone network, our CPINet can obtain much better performance than DFSN [22], HCFL [23], GBCNN [26], and MS-GBCNN [30], which demonstrates that the improved modules in our model have large potential to achieve promising performance. For the five-category classification task, the proposed CPINet is able to reach an OA of 67.83 % even in the situations involving low-resolution data and more complex scenarios, outperforming the second optimal method by 0.80 % . Therefore, the newly proposed CPINet has an outstanding advantage in learning more discriminative deep representations, making for superior SAR ship classification.

4.4. Parameter Sensitivity Analysis

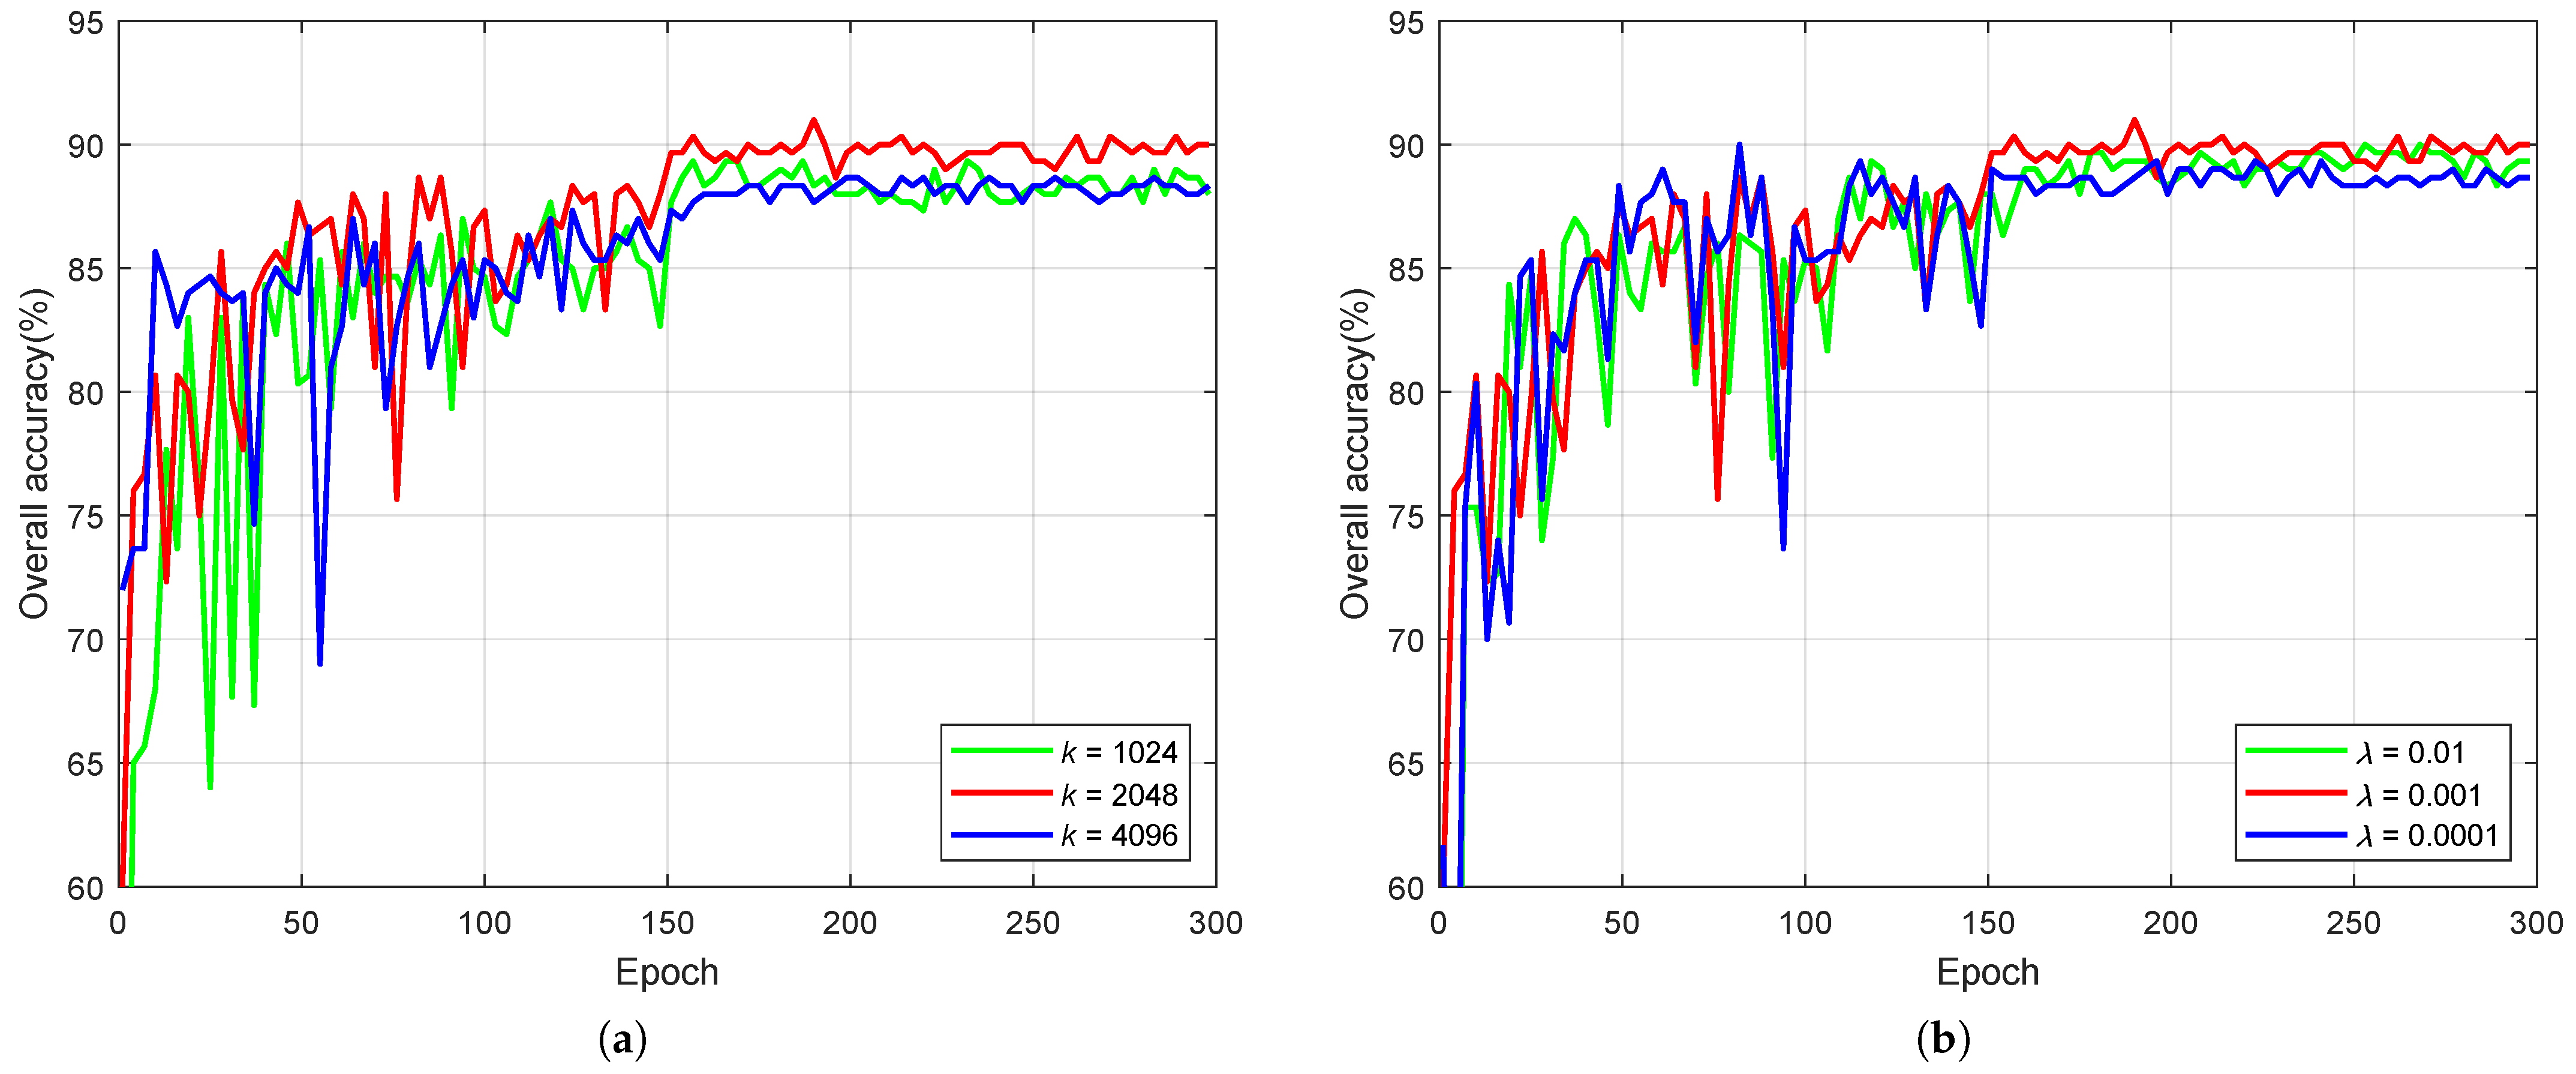
In this subsection, we validate the sensitivity and effectiveness of several important parameters in specific model components. As mentioned above, in order to remain consistent with the experiments reported in the related literature, the hyperparameters and training tricks were generally selected according to the original settings [26,30,33,35]. Specifically, we carried out a detailed analysis of the k and λ parameters in the FBC aggregation module. The values of the k and λ parameters were selected from the sets of {1024, 2048, 4096} and {0.01, 0.001, 0.0001}, respectively. The experiments were conducted on the first training–testing group of the three-category classification task. For each value of one parameter, three experimental runs were conducted and the result with the median final evaluation performance was reported for comparison. This experimental convention was also applied to the other verifications. The varying OA curves of these two hyperparameters are shown in Figure 6. Observing the training OA curves, it can be concluded that the overall model performance is sensitive to the values of the hyperparameters k and λ to a certain extent, and as such moderate values should be selected. Concretely, for hyperparameter k, a moderate value of 2048 was determined in order to achieve the most compact and discriminative global bilinear representations. Because the hyperparameter λ controls the sparsity of the global representations, a value that is too large or too small is detrimental to obtaining discriminative global representations. Therefore, a moderate value of 0.001 selected as an appropriate value to boost the overall performance.

4.5. Ablation Study

In order to comprehensively evaluate the effectiveness of distinct components comprising the proposed CPINet, we conducted a series of ablation experiments. Because CPINet is built upon our previously proposed GBCNN [26] and MS-GBCNN [30] models, respectively trained using the L MPFL and L MSDFF loss functions, we set these two models as the baselines for comparison and progressively integrates the improved modules. Specifically, we first replaced the GBP module in GBCNN with the FBC [33]; for fair comparison, the two models were both trained using the L MPFL loss function. Then, we integrated the IMDFF module to introduce the new CE loss. For brevity, the multiple CE losses were added directly for model training without optimizing the loss weights from this point in the experiment up until the introduction of the GradNorm [35] method. This loss function is indicated as L SUM , while L GN represents the loss function balanced using GradNorm [35]. The ablation study was conducted on the three-category classification task, as in Section 4.4; Table 6 shows the quantitative results in terms of the OA values, wherein each improved module is represented as “w/ module name”.
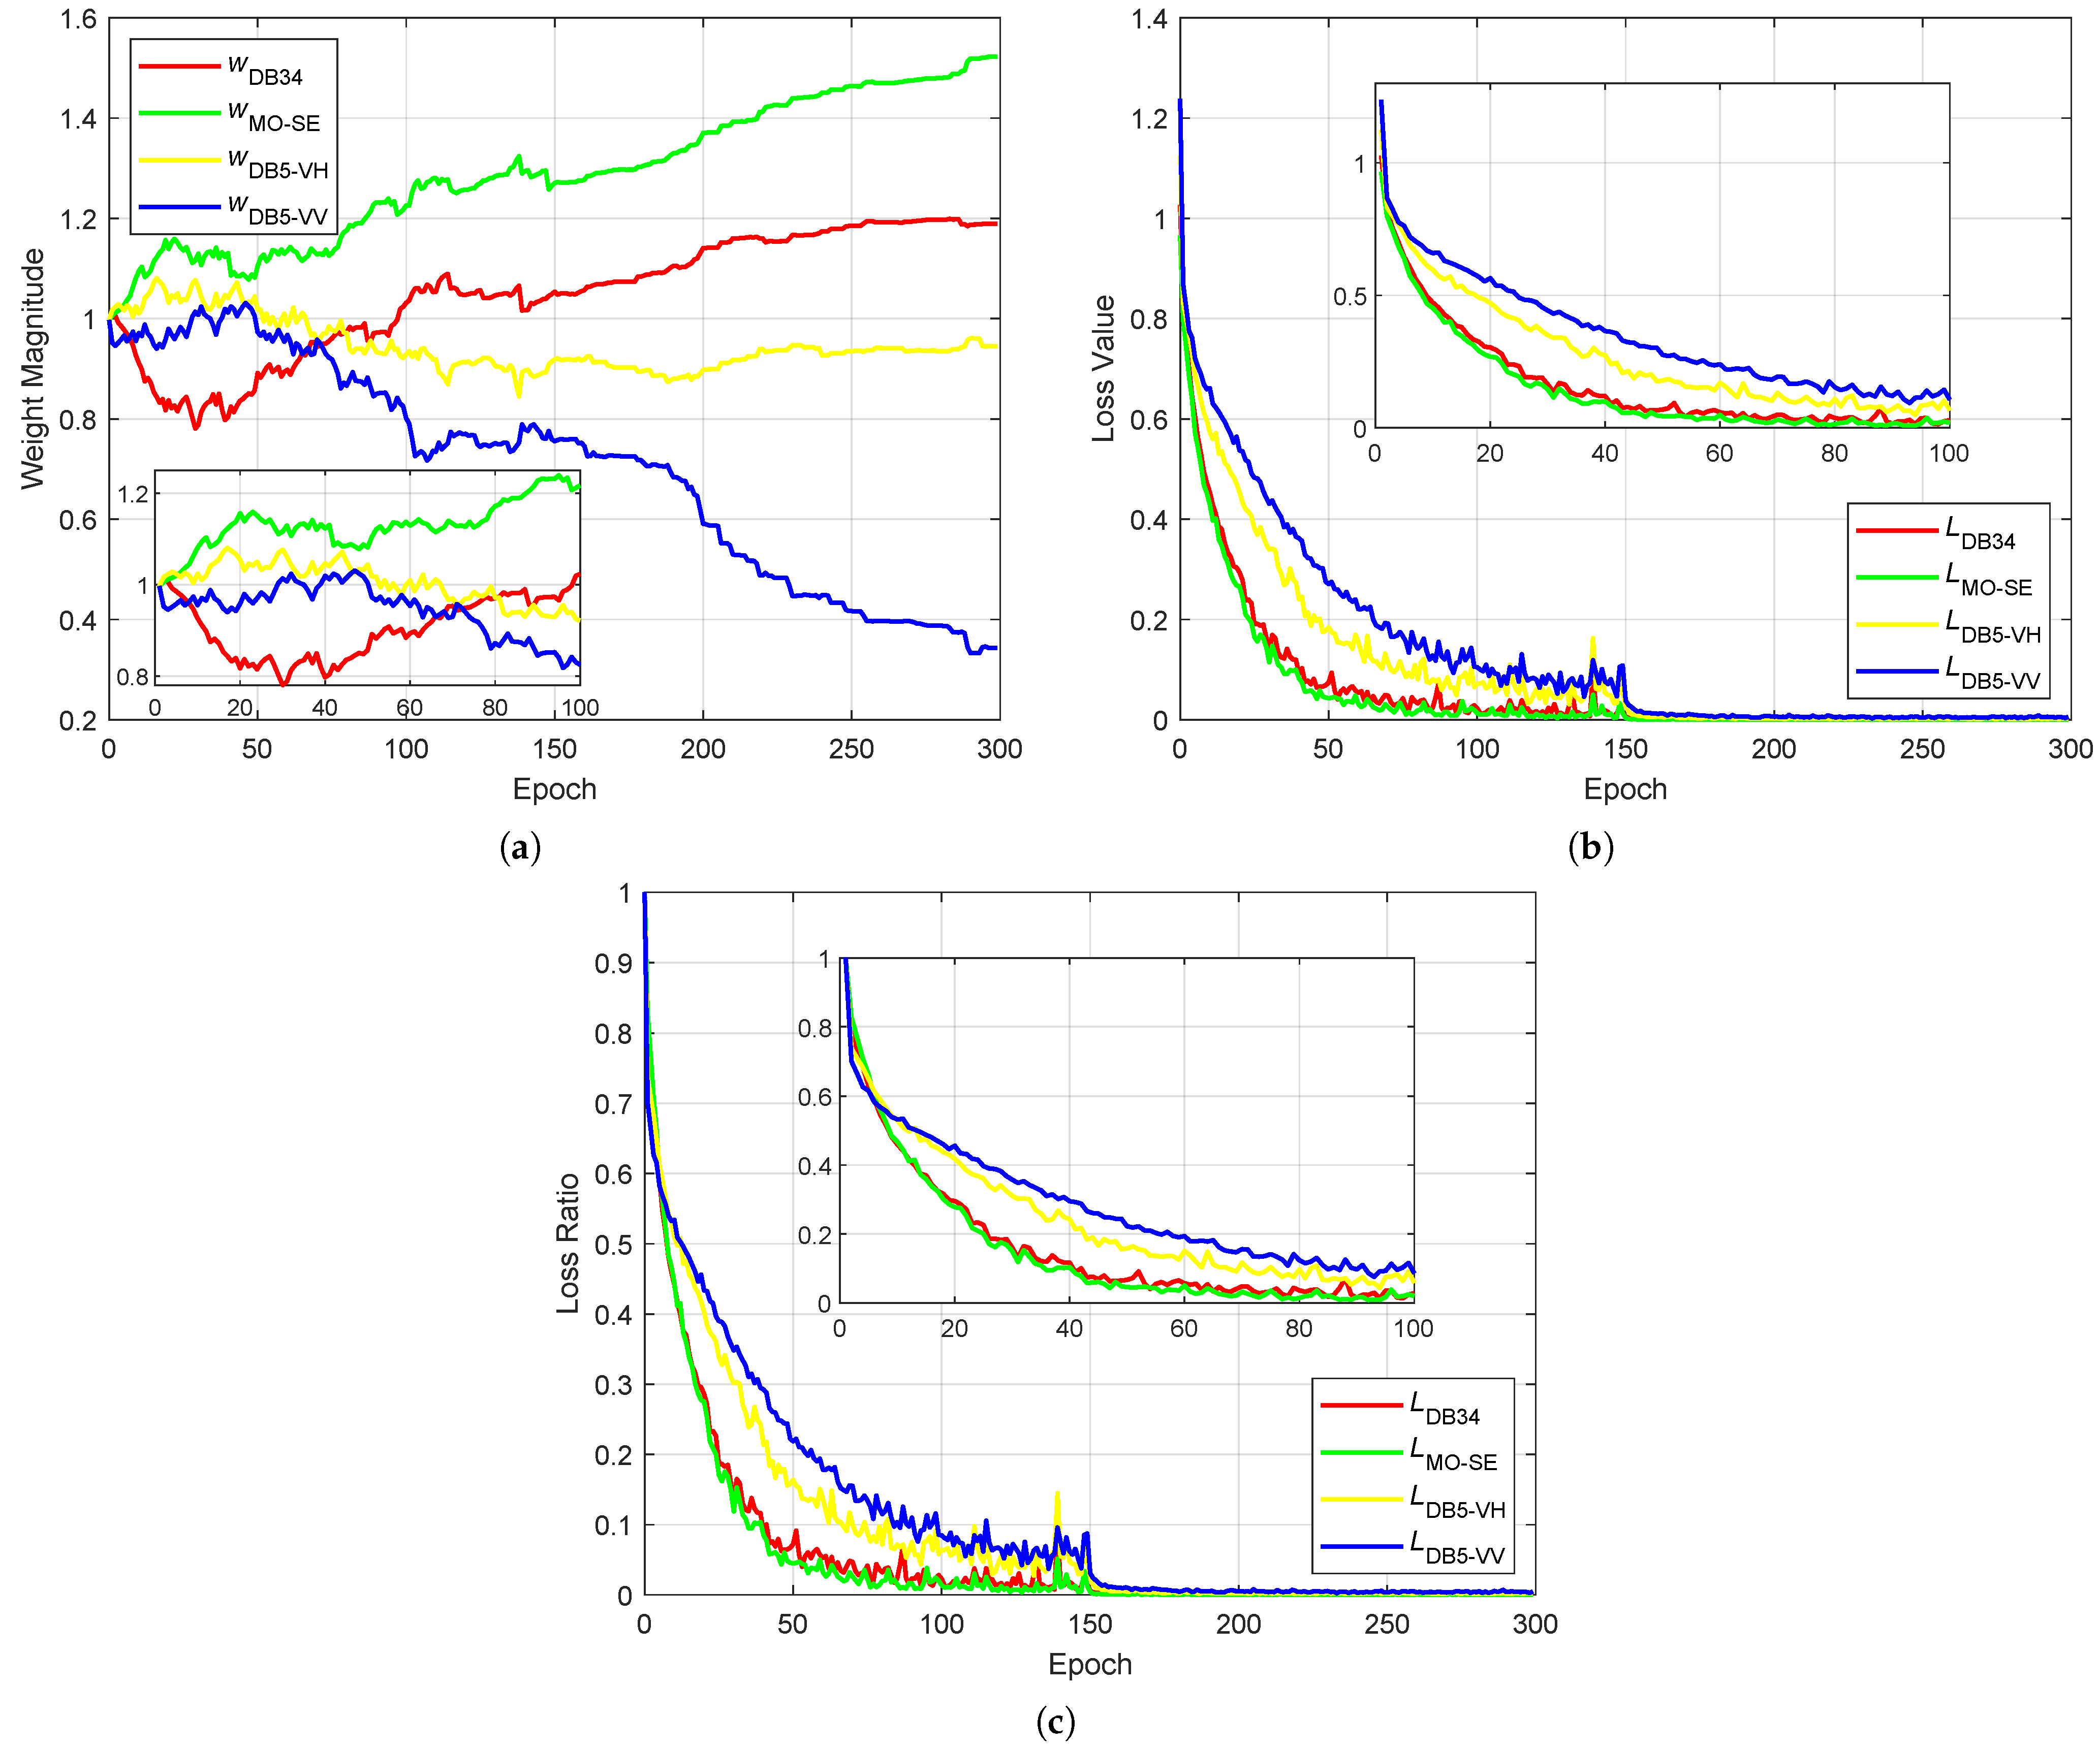
From Table 6, it can be observed that a marginal performance gain is achieved when introducing each module progressively. Therefore, it is conducive to introduce the multiscale information, multiple order attention mechanism, and adaptive loss balancing training strategy to boost SAR ship classification performance. More specifically, the FBC method can achieve a slight improvement and more robust performance than the GBP method [26], and can also avoid the outer product operation in the common bilinear pooling method for computation efficiency. However, FBC cannot achieve better performance than MS-GBCNN, which indicates that the intermediate multiscale deep feature fusion strategy has more potential to improve the classification performance than some high-level feature aggregation methods. This is further validated by introducing the more advanced IMDFF module, which can achieve better performance than the MSDFF module. Note that for the attention mechanism modules we also introduced the CBAM [46] attention module for dual-pol multiscale deep feature augmentation. It can be observed that there is almost no performance improvement when introducing the CBAM module. This may be due to the resolution of the dataset being limited, meaning that there is little benefit from directly applying the spatial attention operation to the high-level deep features. Moreover, adverse effects may be introduced compared to the SE channel attention mechanism. Finally, to fully explore the superiority of the GradNorm method [35], we further illustrate some visual results in Figure 7, including the varying curves of the weight magnitude, CE loss, and the loss ratio for multiple classification branches.
From Figure 7a, the following conclusions can be drawn. First, looking at the convergence values of the four loss weights, it is apparent that the weight magnitudes of the dual-pol cross-fused deep features tend to be larger than those of the single-pol self-fused deep features, while the weight magnitudes corresponding to the VH polarization are larger than those of the VV polarization. It is important to bear in mind that for different classification branches, larger weight magnitudes indicate a greater contribution to network training; in other words, the dual-pol deep features contain much more discriminative information for outstanding SAR ship classification and the VH polarization channel is much more important than the VV polarization channel for classification. These conclusions are confirmed by those of the previous works [22,23,24,25,26,27,30]. Second, considering the varying traces of the loss weights, it can be clearly seen that in about the first 50 training epochs the varying trends of the weight magnitude are mainly affected by the loss ratio, while in the following epochs the weight magnitudes are greatly influenced by the scales of the loss values. For instance, in the first couple of epochs (i.e., less than 10), the loss ratios of the VV polarization channel and the dual-pol fused multiscale deep features channel have a relatively sharp decline whose weight magnitudes become lower through minimizing Equation (9). When passing about 50 training epochs, the loss scales of the dual-pol cross-fused internal multiscale deep features and MO-SE augmented high-level deep features become dramatically lower, and the corresponding weight magnitudes become larger to increase these two tasks’ gradients for training speed balance. In a nutshell, these experimental results are highly consistent with the rationality of the GradNorm method in terms of the symmetric multitask situation [35].

4.6. Additional Evaluation of the Proposed CPINet

For a more comprehensive verification, we conducted a further analysis of CPINet, using the confusion matrix and the gradient-weighted class activation mapping (Grad-CAM) [59] algorithm to respectively illustrate the detailed prediction results and visualize the learning effect for dual-pol SAR ship images. The confusion matrices of CPINet for the three- and five-category classification tasks are presented in Figure 8.
For the three-category classification task, the results of the confusion matrix in Figure 8a demonstrate that the three ship types can be well distinguished from each other, even with only a few confusion samples between different categories. This is mainly because the three-category ship classification task is a relatively easy one. Even though the container ship has a fewer number of samples, CPINet can still obtain promising classification performance, as the ship’s size is relatively large and its appearance is quite distinct. This is also verified by the results of the five-category classification task in Figure 8b. Note that the appearance of the bulk carrier and cargo ship are very similar, making it easy for them to be confused with one another. The general cargo category has the lowest classification performance due to the significantly lower number of initial samples and the fact that it is very similar to the bulk carrier and cargo ship categories.
To further validate the effectiveness of the proposed CPINet for high performance dual-pol SAR ship classification, we present the results of experiments comparing the single-pol and dual-pol SAR ship classification tasks both quantitatively and qualitatively, respectively shown in Table 7 and Table 8.
For a quantitative comparison, Table 7 summarizes the single-pol SAR ship classification results in [26] obtained using the SAR-DenseNet-v1 backbone network as well as the dual-pol SAR ship classification results using GBCNN [26] and CPINet. It can be seen that there is a significant performance improvement when introducing the dual-pol information. For example, the mean OA value of CPINet is larger than that of the backbone network on VV polarization by almost 6 % . Comparing the results of GBCNN and CPINet, it can be concluded that the SAR ship classification performance can be further improved if the more advanced dual-pol information fusion method is applied, validating the advantages of using dual-pol information for high-performance SAR ship classification.
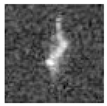
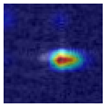
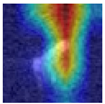
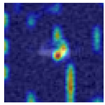
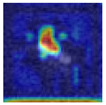
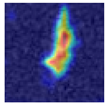
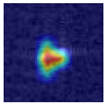
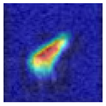
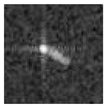
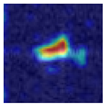
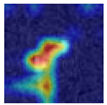
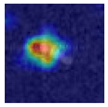
For a qualitative comparison, Table 8 shows the activation maps of the final classification results on the original SAR ship amplitude images using the Grad-CAM [59] method. The dual-pol SAR ship images utilized for visualization are shown in Figure 5, all of which are challenging samples to classify. The class activation maps consist of two cases: CPINet trained on dual-pol SAR ship images and applied to paired dual-pol SAR ship images, and the backbone network of CPINet trained on single-pol SAR ship images and applied to the corresponding single-pol SAR ship images. From the visual results, it can be seen that CPINet tends to place more attention on the main parts of the ship targets, making for more discriminative feature extraction. On the other hand, the backbone network trained on single-pol SAR ship images is more likely to focus on interference and sea clutter, which prevents the network from effectively classifying SAR ship images. In a nutshell, the proposed CPINet is able to leverage the complementary information of dual-pol SAR ship images to alleviate interference and imaging noise, which is significantly conducive to boosting the network’s SAR ship classification performance.

5. Conclusions

In the field of SAR ship classification, it is challenging to achieve good classification performance when dealing with resolution-limited SAR ship data in complex scenarios. To address this issue, in this paper we have proposed a novel cross-polarimetric interaction network (CPINet) to deeply explore the complementary information between dual-polarized SAR ship images for improved ship classification performance. First, an improved multiscale deep feature fusion (IMDFF) framework is constructed to enhance different levels of convolutional features in a coarse-to-fine fusion approach. In this way, an abundance of contextual information and more discriminative features are obtained, allowing for effective SAR ship representation. Then, we develop a novel multiscale deep feature aggregation module to further improve the ability to discriminate multiscale deep features. More specifically, a mixed-order squeeze–excitation (MO-SE) attention mechanism is proposed in order to simultaneously take full advantage of the first- and second-order statistics of the deep feature maps. Subsequently, the factorized bilinear coding (FBC) method is used to aggregate the IMDFF and MO-SE augmented deep feature maps to acquire high-level global feature representations. Finally, an adaptive loss balancing strategy based on the GradNorm method is introduced to dynamically optimize the network parameters and objective weights. Through all of the above components, our proposed CPINet can achieve highly effective SAR ship representations along with improved classification performance. The superiority and robustness of CPINet were extensively validated by properly designed experiments on the three- and five-category OpenSARShip datasets.

Author Contributions

Conceptualization, J.H.; methodology, J.H., Y.K. and W.C.; software, J.H., R.S. and W.C.; validation, J.H., R.S. and W.C.; formal analysis, J.H., R.S. and W.C.; data curation, J.H. and R.S.; writing—original draft preparation, R.S., W.C. and C.S.; writing—review and editing, J.H., Y.K., G.C., Y.L. and Z.M.; supervision, J.H. and Y.K.; project administration, J.H. and F.W.; funding acquisition, J.H. and Z.M. All authors have read and agreed to the published version of the manuscript.

Funding

This work was supported in part by the National Natural Science Foundation of China under Grant 62301427, in part by the Open Project Fund for the Key Laboratory of Radar Imaging and Microwave Photonics (Nanjing University of Aeronautics and Astronautics) of the Ministry of Education under Grant NJ20240002, and in part by the Scientific Research Program Funded by Shaanxi Provincial Education Department under Grant 22JK0556.

Institutional Review Board Statement

Not applicable.

Informed Consent Statement

Not applicable.

Data Availability Statement

The SAR ship datasets used in this study are curated from the free and open data resources of the OpenSARShip database and the Sentinel-1 SAR satellite.

Acknowledgments

The authors would like to thank the European Space Agency (Paris, France) and Shanghai Jiao Tong University (Shanghai, China) for providing the Sentinel-1 and OpenSARShip database freely online. They would also like to thank the anonymous reviewers for their dedicated comments and suggestions.

Conflicts of Interest

C.S. has received research grants from Xi’an Xiangteng Microelectronics Technology Co., Ltd. All the authors declare that they have no financial and personal relationships with other people or organizations that can inappropriately influence this work. The funding sponsors had no role in the design of the study; in the collection, analyses, or interpretation of data; in the writing of the manuscript, and in the decision to publish the results.

References

  1. Kanjir, U.; Greidanus, H.; Oštir, K. Vessel Detection and Classification from Spaceborne Optical Images: A Literature Survey. Remote Sens. Environ. 2018, 207, 1–26. [Google Scholar] [CrossRef] [PubMed]
  2. Huang, L.; Liu, B.; Li, B.; Guo, W.; Yu, W.; Zhang, Z.; Yu, W. OpenSARShip: A Dataset Dedicated to Sentinel-1 Ship Interpretation. IEEE J. Sel. Top. Appl. Earth Obs. Remote Sens. 2018, 11, 195–208. [Google Scholar] [CrossRef]
  3. Hou, X.; Ao, W.; Song, Q.; Lai, J.; Wang, H.; Xu, F. FUSAR-Ship: Building a High-Resolution SAR-AIS Matchup Dataset of Gaofen-3 for Ship Detection and Recognition. Sci. China Inf. Sci. 2020, 63, 140303. [Google Scholar] [CrossRef]
  4. He, J.; Wang, Y.; Liu, H. Ship Classification in Medium-Resolution SAR Images via Densely Connected Triplet CNNs Integrating Fisher Discrimination Regularized Metric Learning. IEEE Trans. Geosci. Remote Sens. 2021, 59, 3022–3039. [Google Scholar] [CrossRef]
  5. Margarit, G.; Tabasco, A. Ship Classification in Single-Pol SAR Images Based on Fuzzy Logic. IEEE Trans. Geosci. Remote Sens. 2011, 49, 3129–3138. [Google Scholar] [CrossRef]
  6. Lang, H.; Wu, S. Ship Classification in Moderate-Resolution SAR Image by Naive Geometric Features-Combined Multiple Kernel Learning. IEEE Geosci. Remote Sens. Lett. 2017, 14, 1765–1769. [Google Scholar] [CrossRef]
  7. Salerno, E. Using Low-Resolution SAR Scattering Features for Ship Classification. IEEE Geosci. Remote Sens. Lett. 2022, 19, 4509504. [Google Scholar] [CrossRef]
  8. Yan, Z.; Song, X.; Yang, L.; Wang, Y. Ship Classification in Synthetic Aperture Radar Images Based on Multiple Classifiers Ensemble Learning and Automatic Identification System Data Transfer Learning. Remote Sens. 2022, 14, 5288. [Google Scholar] [CrossRef]
  9. Wu, F.; Wang, C.; Jiang, S.; Zhang, H.; Zhang, B. Classification of Vessels in Single-Pol COSMO-SkyMed Images Based on Statistical and Structural Features. Remote Sens. 2015, 7, 5511–5533. [Google Scholar] [CrossRef]
  10. Li, Y.; Lai, X.; Wang, M.; Zhang, X. C-SASO: A Clustering-Based Size-Adaptive Safer Oversampling Technique for Imbalanced SAR Ship Classification. IEEE Trans. Geosci. Remote Sens. 2022, 60, 5231112. [Google Scholar] [CrossRef]
  11. Altman, N.S. An Introduction to Kernel and Nearest-Neighbor Nonparametric Regression. Am. Stat. 1992, 46, 175–185. [Google Scholar] [CrossRef]
  12. Liu, Z.; Mao, H.; Wu, C.Y.; Feichtenhofer, C.; Darrell, T.; Xie, S. A ConvNet for the 2020s. In Proceedings of the 2022 IEEE/CVF Conference on Computer Vision and Pattern Recognition (CVPR), New Orleans, LA, USA, 18–24 June 2022; pp. 11966–11976. [Google Scholar] [CrossRef]
  13. Zhu, X.X.; Tuia, D.; Mou, L.; Xia, G.S.; Zhang, L.; Xu, F.; Fraundorfer, F. Deep Learning in Remote Sensing: A Comprehensive Review and List of Resources. IEEE Geosci. Remote Sens. Mag. 2017, 5, 8–36. [Google Scholar] [CrossRef]
  14. Ke, H.; Ke, X.; Yan, Y.; Luo, D.; Cui, F.; Peng, H.; Hu, Y.; Liu, Y.; Zhang, T. Laplace & LBP Feature Guided SAR Ship Detection Method with Adaptive Feature Enhancement Block. In Proceedings of the 2024 IEEE 6th Advanced Information Management, Communicates, Electronic and Automation Control Conference (IMCEC), Chongqing, China, 24–26 May 2024; pp. 780–783. [Google Scholar] [CrossRef]
  15. Zhang, T.; Zhang, X. Injection of Traditional Hand-Crafted Features into Modern CNN-Based Models for SAR Ship Classification: What, Why, Where, and How. Remote Sens. 2021, 13, 2091. [Google Scholar] [CrossRef]
  16. Zhang, T.; Zhang, X.; Ke, X.; Liu, C.; Xu, X.; Zhan, X.; Wang, C.; Ahmad, I.; Zhou, Y.; Pan, D.; et al. HOG-ShipCLSNet: A Novel Deep Learning Network with HOG Feature Fusion for SAR Ship Classification. IEEE Trans. Geosci. Remote Sens. 2022, 60, 5210322. [Google Scholar] [CrossRef]
  17. Zheng, H.; Hu, Z.; Yang, L.; Xu, A.; Zheng, M.; Zhang, C.; Li, K. Multifeature Collaborative Fusion Network with Deep Supervision for SAR Ship Classification. IEEE Trans. Geosci. Remote Sens. 2023, 61, 5212614. [Google Scholar] [CrossRef]
  18. Dong, Y.; Zhang, H.; Wang, C.; Wang, Y. Fine-Grained Ship Classification Based on Deep Residual Learning for High-Resolution SAR Images. Remote Sens. Lett. 2019, 10, 1095–1104. [Google Scholar] [CrossRef]
  19. He, K.; Zhang, X.; Ren, S.; Sun, J. Deep Residual Learning for Image Recognition. In Proceedings of the 2016 IEEE Conference on Computer Vision and Pattern Recognition (CVPR), Las Vegas, NV, USA, 27–30 June 2016; pp. 770–778. [Google Scholar] [CrossRef]
  20. Zhao, S.; Lang, H. Improving Deep Subdomain Adaptation by Dual-Branch Network Embedding Attention Module for SAR Ship Classification. IEEE J. Sel. Top. Appl. Earth Obs. Remote Sens. 2022, 15, 8038–8048. [Google Scholar] [CrossRef]
  21. Zhao, S.; Xu, Y.; Luo, Y.; Guo, W.; Cai, B.; Zhang, Z. A Domain Adaptation Network for Cross-Imaging Satellites SAR Image Ship Classification. In Proceedings of the 2022 IEEE International Geoscience and Remote Sensing Symposium (IGARSS), Kuala Lumpur, Malaysia, 17–22 July 2022; pp. 1580–1583. [Google Scholar] [CrossRef]
  22. Xi, Y.; Xiong, G.; Yu, W. Feature-Loss Double Fusion Siamese Network for Dual-polarized SAR Ship Classification. In Proceedings of the 2019 IEEE International Conference on Signal, Information and Data Processing (ICSIDP), Chongqing, China, 11–13 December 2019; pp. 1–5. [Google Scholar] [CrossRef]
  23. Zeng, L.; Zhu, Q.; Lu, D.; Zhang, T.; Wang, H.; Yin, J.; Yang, J. Dual-Polarized SAR Ship Grained Classification Based on CNN with Hybrid Channel Feature Loss. IEEE Geosci. Remote Sens. Lett. 2022, 19, 4011905. [Google Scholar] [CrossRef]
  24. Zhang, T.; Zhang, X. Squeeze-and-Excitation Laplacian Pyramid Network with Dual-Polarization Feature Fusion for Ship Classification in SAR Images. IEEE Geosci. Remote Sens. Lett. 2022, 19, 4019905. [Google Scholar] [CrossRef]
  25. He, J.; Chang, W.; Wang, F.; Wang, Q.; Li, Y.; Gan, Y. Polarization Matters: On Bilinear Convolutional Neural Networks for Ship Classification From Synthetic Aperture Radar Images. In Proceedings of the 2022 4th International Conference on Natural Language Processing (ICNLP), Xi’an, China, 25–27 March 2022; pp. 315–319. [Google Scholar] [CrossRef]
  26. He, J.; Chang, W.; Wang, F.; Liu, Y.; Wang, Y.; Liu, H.; Li, Y.; Liu, L. Group Bilinear CNNs for Dual-Polarized SAR Ship Classification. IEEE Geosci. Remote Sens. Lett. 2022, 19, 4508405. [Google Scholar] [CrossRef]
  27. Xu, Y.; Cheng, C.; Guo, W.; Zhang, Z.; Yu, W. Exploring Similarity in Polarization: Contrastive Learning with Siamese Networks for Ship Classification in Sentinel-1 SAR Images. In Proceedings of the 2022 IEEE International Geoscience and Remote Sensing Symposium (IGARSS), Kuala Lumpur, Malaysia, 17–22 July 2022; pp. 835–838. [Google Scholar] [CrossRef]
  28. Xie, H.; He, J.; Lu, Z.; Hu, J. Two-Level Feature-Fusion Ship Recognition Strategy Combining HOG Features with Dual-Polarized Data in SAR Images. Remote Sens. 2023, 15, 4393. [Google Scholar] [CrossRef]
  29. Zhang, T.; Zhang, X. A Polarization Fusion Network with Geometric Feature Embedding for SAR Ship Classification. Pattern Recognit. 2022, 123, 108365. [Google Scholar] [CrossRef]
  30. He, J.; Chang, W.; Wang, F.; Liu, Y.; Sun, C.; Li, Y. Multi-Scale Dense Networks for Ship Classification Using Dual-Polarization SAR Images. In Proceedings of the 2023 IEEE Radar Conference (RadarConf23), San Antonio, TX, USA, 1–5 May 2023; pp. 1–6. [Google Scholar] [CrossRef]
  31. Li, M.; Lei, L.; Tang, Y.; Sun, Y.; Kuang, G. An Attention-Guided Multilayer Feature Aggregation Network for Remote Sensing Image Scene Classification. Remote Sens. 2021, 13, 3113. [Google Scholar] [CrossRef]
  32. Hu, J.; Shen, L.; Albanie, S.; Sun, G.; Wu, E. Squeeze-and-Excitation Networks. IEEE Trans. Pattern Anal. Mach. Intell. 2020, 42, 2011–2023. [Google Scholar] [CrossRef] [PubMed]
  33. Gao, Z.; Wu, Y.; Zhang, X.; Dai, J.; Jia, Y.; Harandi, M.T. Revisiting Bilinear Pooling: A Coding Perspective. In Proceedings of the 34th AAAI Conference on Artificial Intelligence (AAAI-20), New York, NY, USA, 7–12 February 2020; pp. 3954–3961. [Google Scholar] [CrossRef]
  34. Lin, T.Y.; RoyChowdhury, A.; Maji, S. Bilinear CNN Models for Fine-Grained Visual Recognition. In Proceedings of the 2015 IEEE International Conference on Computer Vision (ICCV), Santiago, Chile, 7–13 December 2015; pp. 1449–1457. [Google Scholar] [CrossRef]
  35. Chen, Z.; Badrinarayanan, V.; Lee, C.Y.; Rabinovich, A. GradNorm: Gradient Normalization for Adaptive Loss Balancing in Deep Multitask Networks. In Proceedings of the 35th International Conference on Machine Learning (ICML), Stockholm, Sweden, 10–15 July 2018; pp. 794–803. Available online: https://proceedings.mlr.press/v80/chen18a.html (accessed on 11 July 2023).
  36. Krizhevsky, A.; Sutskever, I.; Hinton, G.E. ImageNet Classification with Deep Convolutional Neural Networks. In Proceedings of the Advances in Neural Information Processing Systems (NIPS), Lake Tahoe, NV, USA, 3–8 December 2012; pp. 1–9. [Google Scholar] [CrossRef]
  37. Szegedy, C.; Liu, W.; Jia, Y.; Sermanet, P.; Reed, S.; Anguelov, D.; Erhan, D.; Vanhoucke, V.; Rabinovich, A. Going Deeper with Convolutions. In Proceedings of the 2015 IEEE Conference on Computer Vision and Pattern Recognition (CVPR), Boston, MA, USA, 7–12 June 2015; pp. 1–9. [Google Scholar] [CrossRef]
  38. Huang, G.; Liu, Z.; Van Der Maaten, L.; Weinberger, K.Q. Densely Connected Convolutional Networks. In Proceedings of the 2017 IEEE Conference on Computer Vision and Pattern Recognition (CVPR), Honolulu, HI, USA, 21–26 July 2017; pp. 2261–2269. [Google Scholar] [CrossRef]
  39. Sermanet, P.; Eigen, D.; Zhang, X.; Mathieu, M.; Fergus, R.; LeCun, Y. Overfeat: Integrated Recognition, Localization and Detection Using Convolutional Networks. In Proceedings of the 2nd International Conference on Learning Representations (ICLR), Banff, AB, Canada, 14–16 April 2014; pp. 1–16. [Google Scholar]
  40. Cheng, G.; Si, Y.; Hong, H.; Yao, X.; Guo, L. Cross-Scale Feature Fusion for Object Detection in Optical Remote Sensing Images. IEEE Geosci. Remote Sens. Lett. 2021, 18, 431–435. [Google Scholar] [CrossRef]
  41. Wang, D.; Song, Y.; Huang, J.; An, D.; Chen, L. SAR Target Classification Based on Multiscale Attention Super-Class Network. IEEE J. Sel. Top. Appl. Earth Obs. Remote Sens. 2022, 15, 9004–9019. [Google Scholar] [CrossRef]
  42. Gao, H.; Yang, Y.; Li, C.; Gao, L.; Zhang, B. Multiscale Residual Network with Mixed Depthwise Convolution for Hyperspectral Image Classification. IEEE Trans. Geosci. Remote Sens. 2021, 59, 3396–3408. [Google Scholar] [CrossRef]
  43. Xu, X.; Zhang, X.; Zhang, T. Multi-Scale SAR Ship Classification with Convolutional Neural Network. In Proceedings of the 2021 IEEE International Geoscience and Remote Sensing Symposium (IGARSS), Brussels, Belgium, 11–16 July 2021; pp. 4284–4287. [Google Scholar] [CrossRef]
  44. Wang, C.; Pei, J.; Luo, S.; Huo, W.; Huang, Y.; Zhang, Y.; Yang, J. SAR Ship Target Recognition via Multiscale Feature Attention and Adaptive-Weighed Classifier. IEEE Geosci. Remote Sens. Lett. 2023, 20, 4003905. [Google Scholar] [CrossRef]
  45. Guo, M.H.; Xu, T.X.; Liu, J.J.; Liu, Z.N.; Jiang, P.T.; Mu, T.J.; Zhang, S.H.; Martin, R.R.; Cheng, M.M.; Hu, S.M. Attention Mechanisms in Computer Vision: A Survey. Comput. Vis. Media 2022, 8, 331–368. [Google Scholar] [CrossRef]
  46. Woo, S.; Park, J.; Lee, J.Y.; Kweon, I.S. CBAM: Convolutional Block Attention Module. In Proceedings of the 15th European Conference on Computer Vision (ECCV), Munich, Germany, 8–14 September 2018; pp. 3–19. [Google Scholar] [CrossRef]
  47. Zhou, G.; Zhang, G.; Fang, Z.; Dai, Q. A Multiscale Dual-Attention Based Convolutional Neural Network for Ship Classification in SAR Image. In Proceedings of the 2021 IEEE International Conference on Signal Processing, Communications and Computing (ICSPCC), Xi’an, China, 17–19 August 2021; pp. 1–5. [Google Scholar] [CrossRef]
  48. Lee, J.S.; Pottier, E. Polarimetric Radar Imaging: From Basics to Applications, 1st ed.; CRC Press: Boca Raton, FL, USA, 2009; pp. 53–100. [Google Scholar] [CrossRef]
  49. Velotto, D.; Bentes, C.; Tings, B.; Lehner, S. First Comparison of Sentinel-1 and TerraSAR-X Data in the Framework of Maritime Targets Detection: South Italy Case. IEEE J. Ocean. Eng. 2016, 41, 993–1006. [Google Scholar] [CrossRef]
  50. Yu, C.; Zhao, X.; Zheng, Q.; Zhang, P.; You, X. Hierarchical Bilinear Pooling for Fine-Grained Visual Recognition. In Proceedings of the 15th European Conference on Computer Vision (ECCV), Munich, Germany, 8–14 September 2018; pp. 574–589. [Google Scholar] [CrossRef]
  51. Yu, D.; Guo, H.; Xu, Q.; Lu, J.; Zhao, C.; Lin, Y. Hierarchical Attention and Bilinear Fusion for Remote Sensing Image Scene Classification. IEEE J. Sel. Top. Appl. Earth Obs. Remote Sens. 2020, 13, 6372–6383. [Google Scholar] [CrossRef]
  52. Dumoulin, V.; Visin, F. A Guide to Convolution Arithmetic for Deep Learning. arXiv 2018, arXiv:1603.07285. [Google Scholar] [CrossRef]
  53. Ioffe, S.; Szegedy, C. Batch Normalization: Accelerating Deep Network Training by Reducing Internal Covariate Shift. In Proceedings of the 32nd International Conference on Machine Learning (ICML), Lille, France, 6–11 July 2015; pp. 448–456. [Google Scholar]
  54. Cao, Y.; Xu, J.; Lin, S.; Wei, F.; Hu, H. GCNet: Non-Local Networks Meet Squeeze-Excitation Networks and Beyond. In Proceedings of the 2019 IEEE/CVF International Conference on Computer Vision Workshop (ICCVW), Seoul, Republic of Korea, 15–20 June 2019; pp. 1971–1980. [Google Scholar] [CrossRef]
  55. Gao, Z.; Xie, J.; Wang, Q.; Li, P. Global Second-Order Pooling Convolutional Networks. In Proceedings of the 2019 IEEE/CVF Conference on Computer Vision and Pattern Recognition (CVPR), Long Beach, CA, USA, 27–28 October 2019; pp. 3019–3028. [Google Scholar] [CrossRef]
  56. Tibshirani, R. Regression Shrinkage and Selection via the Lasso. J. R. Stat. Soc. Ser. B (Methodol.) 1996, 58, 267–288. [Google Scholar] [CrossRef]
  57. Fawcett, T. An Introduction to ROC Analysis. Pattern Recognit. Lett. 2006, 27, 861–874. [Google Scholar] [CrossRef]
  58. Shao, Z.; Zhang, T.; Ke, X. A Dual-Polarization Information-Guided Network for SAR Ship Classification. Remote Sens. 2023, 15, 2138. [Google Scholar] [CrossRef]
  59. Selvaraju, R.R.; Cogswell, M.; Das, A.; Vedantam, R.; Parikh, D.; Batra, D. Grad-CAM: Visual Explanations from Deep Networks via Gradient-Based Localization. In Proceedings of the 2017 IEEE International Conference on Computer Vision (ICCV), Venice, Italy, 22–29 October 2017; pp. 618–626. [Google Scholar] [CrossRef]
Figure 1. Overall architecture of the proposed CPINet.
Remotesensing 16 03479 g001
Figure 2. Structure of the MSDFF module as shown in our previous work [30]; Conv , DS , US , and C indicate the convolution block, downsampling, upsampling, and concatenation, respectively.
Remotesensing 16 03479 g002
Figure 3. Structure of the MO-SE attention augmentation module.
Remotesensing 16 03479 g003
Figure 4. Diagram of the FBC pooling method.
Remotesensing 16 03479 g004
Figure 5. Illustration of the five-category SAR ship samples in (a) VH polarization and (b) VV polarization, as also shown in [26,30]. From left to right are ship samples from the tanker, container ship, bulk carrier, general cargo, and cargo categories, respectively.
Remotesensing 16 03479 g005
Figure 6. Parameter setting analysis of hyperparameters (a) k and (b) λ .
Remotesensing 16 03479 g006
Figure 7. Training dynamics of the GradNorm method for (a) weight magnitude, (b) loss value, and (c) loss ratio.
Remotesensing 16 03479 g007
Figure 8. Confusion matrices for (a) the three-category classification task and (b) the five-category classification task. The green entries indicate the TPs for each category.
Remotesensing 16 03479 g008
Table 1. Data augmentation methods applied to the training samples.
Augmentation TypeParameters
FlipHorizontal, Vertical
Rotate 90 , 180 , 270
TranslateOffset randomly belongs to [ 5 , 5 ]
Gaussian Noise mean = 0 , standard deviation = 0.001
Table 2. Statistics of the dual-pol SAR ship samples; 3C Aug and 5C Aug mean the data augmentation results for the three- and five-category classification tasks, respectively.
ItemTankerContainer ShipBulk CarrierCargoGeneral Cargo
Training28016763270791
Testing805017027030
Total360217802977121
3C Aug133613361336--
5C Aug728728728728728
Table 3. Experimental environment and parameter setup.
ItemParameter Setup
SystemUbuntu 16.04
RAM32 GB
CPUIntel Core i7-9700k CPU @ 3.60 GHz (Intel Corporation, Santa Clara, CA, USA)
GPUNVIDIA RTX 2080 Ti (Nvidia Corporation, Santa Clara, CA, USA)
PlatformPyTorch 1.3.0
ProgrammePython 3.5
FrameworkCUDA 10.0/cuDNN 7.6.5
Epochs300
Batch size32
Momentum0.9
Learning rate0.01
Table 4. Evaluation metrics (%) for SOTA three-category classification comparison in the form of “mean ± standard deviation”.
MethodRP F 1 OA
DFSN [22] 82.73 ± 1.35 86.41 ± 2.86 84.51 ± 1.89 86.80 ± 1.32
HCFL [23] 83.08 ± 1.70 85.08 ± 0.79 84.06 ± 1.02 86.60 ± 0.86
SE-LPN-DPFF [24] 69.51 ± 1.84 62.38 ± 1.33 65.76 ± 1.56 63.87 ± 1.30
DPIG-Net [58] 80.85 ± 1.73 80.27 ± 1.56 80.37 ± 1.50 83.27 ± 1.12
MS-CNN [43] 76.67 ± 2.52 74.07 ± 1.84 73.71 ± 2.21 77.67 ± 1.06
GBCNN [26] 85.25 ± 2.04 88.04 ± 2.04 86.61 ± 1.77 88.80 ± 1.15
MS-GBCNN [30] 85.34 ± 1.75 87.78 ± 1.97 86.54 ± 1.55 88.93 ± 1.09
CPINet (Ours) 85 . 73 ± 1 . 51 88 . 78 ± 0 . 91 86 . 89 ± 0 . 86 89 . 40 ± 0 . 53
Table 5. Evaluation metrics (%) for SOTA five-category classification comparison in the form of “mean ± standard deviation”.
MethodRP F 1 OA
DFSN [22] 55.07 ± 2.51 56.11 ± 2.22 55.57 ± 2.07 64.53 ± 1.88
HCFL [23] 56.05 ± 1.86 54.51 ± 2.69 55.25 ± 2.02 64.00 ± 2.66
SE-LPN-DPFF [24] 38.56 ± 1.49 32.99 ± 1.12 35.55 ± 1.15 33.20 ± 1.30
DPIG-Net [58] 54.13 ± 1.40 52.59 ± 0.86 53.09 ± 1.16 64.47 ± 1.02
MS-CNN [43] 59.55 ± 3.76 51.03 ± 1.55 52.96 ± 1.60 55.34 ± 1.55
GBCNN [26] 57.79 ± 2.03 57.33 ± 1.93 57.54 ± 1.66 66.90 ± 1.20
MS-GBCNN [30] 57.65 ± 1.43 58.14 ± 1.84 57.89 ± 1.57 67.03 ± 1.06
CPINet (Ours) 57 . 94 ± 0 . 70 58 . 69 ± 0 . 84 58 . 01 ± 0 . 67 67 . 83 ± 0 . 53
Table 6. Results of the ablation study on the improved modules in terms of the OA values (%) in the form of “mean ± standard deviation”.
ModelLossOA
GBCNN L MPFL 88.80 ± 1.15
w/ MSDFF L MSDFF 88.93 ± 1.09
w/ FBC L MPFL 88.87 ± 0.69
w/ IMDFF L SUM 89.07 ± 0.77
w/ CBAM L SUM 89.07 ± 0.85
w/ SE L SUM 89.13 ± 0.86
w/ MO-SE L SUM 89.27 ± 0.74
w/ GradNorm L GN 89 . 40 ± 0 . 65
Table 7. Ablation study on the effectiveness of dual-pol information for SAR ship classification.
ModelPolarizationOA
Backbone Network [26]VH 85.47 ± 1.95
Backbone Network [26]VV 83.53 ± 2.14
GBCNN [26] VH + VV 88.80 ± 1.15
CPINet (Ours) VH + VV 89 . 40 ± 0 . 53
Table 8. Grad-CAM visualization results for the proposed CPINet and the backbone network with regard to dual-pol SAR ship images.
Model TypeTankerContainer ShipBulk CarrierCargoGeneral Cargo
SAR Image in VH PolarizationRemotesensing 16 03479 i001Remotesensing 16 03479 i002Remotesensing 16 03479 i003Remotesensing 16 03479 i004Remotesensing 16 03479 i005
Backbone NetworkRemotesensing 16 03479 i006Remotesensing 16 03479 i007Remotesensing 16 03479 i008Remotesensing 16 03479 i009Remotesensing 16 03479 i010
CPINetRemotesensing 16 03479 i011Remotesensing 16 03479 i012Remotesensing 16 03479 i013Remotesensing 16 03479 i014Remotesensing 16 03479 i015
SAR Image in VV PolarizationRemotesensing 16 03479 i016Remotesensing 16 03479 i017Remotesensing 16 03479 i018Remotesensing 16 03479 i019Remotesensing 16 03479 i020
Backbone NetworkRemotesensing 16 03479 i021Remotesensing 16 03479 i022Remotesensing 16 03479 i023Remotesensing 16 03479 i024Remotesensing 16 03479 i025
CPINetRemotesensing 16 03479 i026Remotesensing 16 03479 i027Remotesensing 16 03479 i028Remotesensing 16 03479 i029Remotesensing 16 03479 i030
Disclaimer/Publisher’s Note: The statements, opinions and data contained in all publications are solely those of the individual author(s) and contributor(s) and not of MDPI and/or the editor(s). MDPI and/or the editor(s) disclaim responsibility for any injury to people or property resulting from any ideas, methods, instructions or products referred to in the content.