Article

Utilizing Multi-Source Geospatial Big Data to Examine How Environmental Factors Attract Outdoor Jogging Activities

1
College of Art and Science, New York University, New York, NY 11201, USA
2
Guangzhou Urban Planning & Design Survey Research Institute Co., Ltd., Guangzhou 510060, China
3
Guangzhou Collaborative Innovation Center of Natural Resources Planning and Marine Technology, Guangzhou 510060, China
4
Guangdong Enterprise Key Laboratory for Urban Sensing, Monitoring and Early Warning, Guangzhou 510060, China
*
Author to whom correspondence should be addressed.
Remote Sens. 2024, 16(16), 3056; https://doi.org/10.3390/rs16163056
Submission received: 14 June 2024 / Revised: 19 August 2024 / Accepted: 19 August 2024 / Published: 20 August 2024

Abstract

:
In the post-pandemic era, outdoor jogging has become an increasingly popular form of exercise due to the growing emphasis on health. It is essential to comprehensively analyze the factors influencing the spatial distribution of outdoor jogging activities and to propose planning strategies with practical guidance. Using multi-source geospatial big data and multiple models, this study constructs a comprehensive analytical framework to examine the association between environmental variables and the frequency of outdoor jogging activities in Guangzhou. Firstly, outdoor jogging trajectory data were collected from a fitness app, and potential influencing factors were selected based on multi-source big data from the perspectives of the built environment, street perception, and natural environment. For example, using the street-view imagery, objective environmental elements such as greenery and subjective elements such as safety perception were extracted from a human-centric perspective. Secondly, the framework included three models: a backward stepwise regression, an optimal parameters-based geographical detector, and a geographically weighted regression (GWR) model. These models served, to screen significant variables, identify the synergistic effects among the variables, and quantify the spatial heterogeneity of the effects, respectively. Finally, the study area was clustered based on the results of the GWR model to propose urban planning strategies with clear spatial positions and practical significance. The results indicated the following: (1) Factors related to the built environment and street perception significantly influence jogging frequency distribution. (2) Public sports facilities, the level of greenery, and safety perception were identified as key factors influencing jogging activities, representing the three aspects of service facilities, objective perception, and subjective perception, respectively. (3) Specifically, the influence of each factor on jogging activities displayed significant spatial variation. For instance, sports facilities and greenery level were positively correlated with jogging frequency in the city center. (4) Lastly, the study area was divided into four clusters, each representing different local associative characteristics between variables and jogging activities. The zonal planning recommendations have significant implications for urban planners and policymakers aiming to create jogging-friendly environments.

Graphical Abstract

1. Introduction

Sedentary lifestyles characterized by prolonged physical inactivity have severely impacted the health of urban residents [1,2]. Adequate physical exercise can effectively enhance both physical and mental well-being, reducing the risks of chronic diseases such as cardiovascular conditions and asthma [3,4]. Among the various types of physical exercise, outdoor jogging is often regarded as an effective means of improving overall health due to its comprehensive aerobic benefits [5,6,7]. The most significant difference between outdoor jogging and other forms of exercise is its low technical barrier and minimal costs, as it does not require specialized equipment or facilities. Consequently, outdoor jogging has become a widely popular physical activity among urban residents, with large-scale participation [8].
To encourage greater public participation in outdoor physical activities and inform relevant planning strategies, numerous studies have examined the relationship between various environmental factors and the frequency of physical activity. Traditionally, such research has predominantly focused on active transportation behaviors, such as cycling [9,10] and walking [11,12] and their associations with the attributes of the built environment, including the population density [13,14], transport accessibility [15,16], service facilities [17], and visual perceptions [18,19]. In recent years, particularly following the COVID-19 pandemic, an increasing body of the literature has investigated the relationship between outdoor physical activities, such as outdoor jogging and hiking, and various environmental factors. Among these, the spatial characteristics of outdoor jogging and the factors influencing them have emerged as a prominent research focus within the field [20,21,22,23].
Regarding data sources, the relevant literature can be categorized into two types: “small data” derived from field surveys and questionnaires and “big data” based on large-scale jogging trajectory samples. Studies utilizing “small data” from field surveys and questionnaires adopt traditional methods, offering advantages in terms of capturing the subjective experiences of joggers and their socioeconomic attributes with detailed granularity [7,12,24,25]. However, these methods are costly, time-consuming, limited in coverage and sample size, and generally lack efficiency [26]. Moreover, with the advancement of the volunteered geographic information and spatiotemporal data, big data provides a transformative paradigm for the accurate recording of jogging behaviors and the detailed characterization of street environments, offering high precision, extensive coverage, and comprehensive samples. Consequently, the literature related to outdoor physical activities, including jogging, cycling, and walking, has increasingly leveraged the advantages of big data [27]. In terms of recording outdoor physical activities, the related studies have obtained data from fitness mobile applications (apps) such as MapMyRun [28], Strava [18,19,27], and Edooon [20,21,22,23], which are commonly used data sources in the UK, the USA, and China, respectively. These trajectory data, which are voluntarily recorded by users via fitness apps, offer the advantages of high precision and extensive spatial coverage. However, they also suffer from the common big data issue of difficulty in evaluating the sample’s representativeness [21,22]. In terms of the detailed characterization of environmental features, the relevant studies often build upon the “5D” built environment elements, enriching environmental indicators by leveraging spatiotemporal big data. For instance, remote sensing data of nighttime lights (NTLs) are used to reflect the degree of outdoor illumination, while street-view imagery (SVI) data are used to capture both the objective elements and subjective perceptions of street environments from a human-eye perspective [18,19].
Regarding modeling, the existing literature typically employs various types of linear models to quantify the factors influencing the distribution of outdoor jogging activities. Linear regression models assume a linear relationship between the dependent and explanatory variables. This approach commonly uses logistic regression [29], ordinary least squares (OLS), and multilevel regression models [20] to determine the linear impacts of various environmental factors on jogging activities. Additionally, spatial models that consider spatial heterogeneity in the computation process or results, such as geographically weighted regression (GWR), have been utilized to explore the effects of spatial autocorrelation and spatial influence. For instance, some studies apply a spatial autoregressive combined model and a GWR model to investigate the potential impacts of built environment elements on jogging activities in Boston and London [18,19]. However, the results of these linear or non-linear models only reflect the various forms of influence or explanatory power that each variable has on jogging behavior [20,21,22,23]. That is to say, the synergistic effects between variables influencing jogging behavior have rarely been addressed.
Despite the substantial contributions made by numerous related studies, certain limitations remain to be addressed. First, most of the existing research employs a single type of linear or non-linear model to analyze the factors influencing the distribution of jogging behavior [18,19,20,21,22,23], lacking a multi-model analysis from different perspectives. This can lead to a partial and limited interpretation of the influencing mechanisms. Each model involved in current research has its strengths and limitations; thus, integrating models with hierarchical relationships into a multi-model analytical framework will help to overcome these limitations and expand the interpretation of the factors influencing outdoor jogging activities. Second, after modeling and interpreting the results, the existing studies often conclude with urban planning recommendations or strategies. However, these strategies or recommendations tend to be overly general, merely extending from model interpretations without spatial specificity or practical guidance [18,19,20,23,27]. For example, based on the model’s results, a study that used Boston as a case study suggested improving accessibility and public transportation coverage and having wider streets and more streetlights to effectively increase jogging frequency [18]. However, the generalizability of these recommendations to the entire study area is unlikely. Therefore, planning strategies and recommendations derived from modeling results need to have spatial specificity.
To address the aforementioned limitations and to develop a more comprehensive understanding of the environmental factors influencing jogging activities, this study constructed an integrated analysis framework based on multi-source geospatial data and multiple models. Firstly, using the central area of Guangzhou as a case study, user-uploaded jogging trajectory data were provided by a locally representative fitness app and subjected to a series of preprocessing steps. Second, in conjunction with the related literature, potential influencing factors were selected from the three aspects of the built environment, street perception, and natural environment, based on multi-source geospatial big data. For example, nighttime street lighting conditions were characterized using remote sensing data from NTLs, and both objective environmental elements (such as greenery) and subjective elements (such as perceptions of safety) were extracted from the SVI dataset from a human-centric perspective. Third, the modeling framework for influencing factors specifically included three models: the backward stepwise regression (BSR) model, the optimal parameters-based geographical detector (OPGD) model, and the GWR model. These models served to screen significant variables, identify the synergistic effects of variables on jogging activity frequency, and quantify the spatial heterogeneity of the variables’ influence on jogging activities, respectively. Finally, based on the local coefficients of significant variables from the GWR model results, the study area was divided into several clusters using the k-means clustering method. For each region’s local associative characteristics, urban planning and management strategies with clear spatial positions and practical guidance were proposed.

2. Materials and Methods
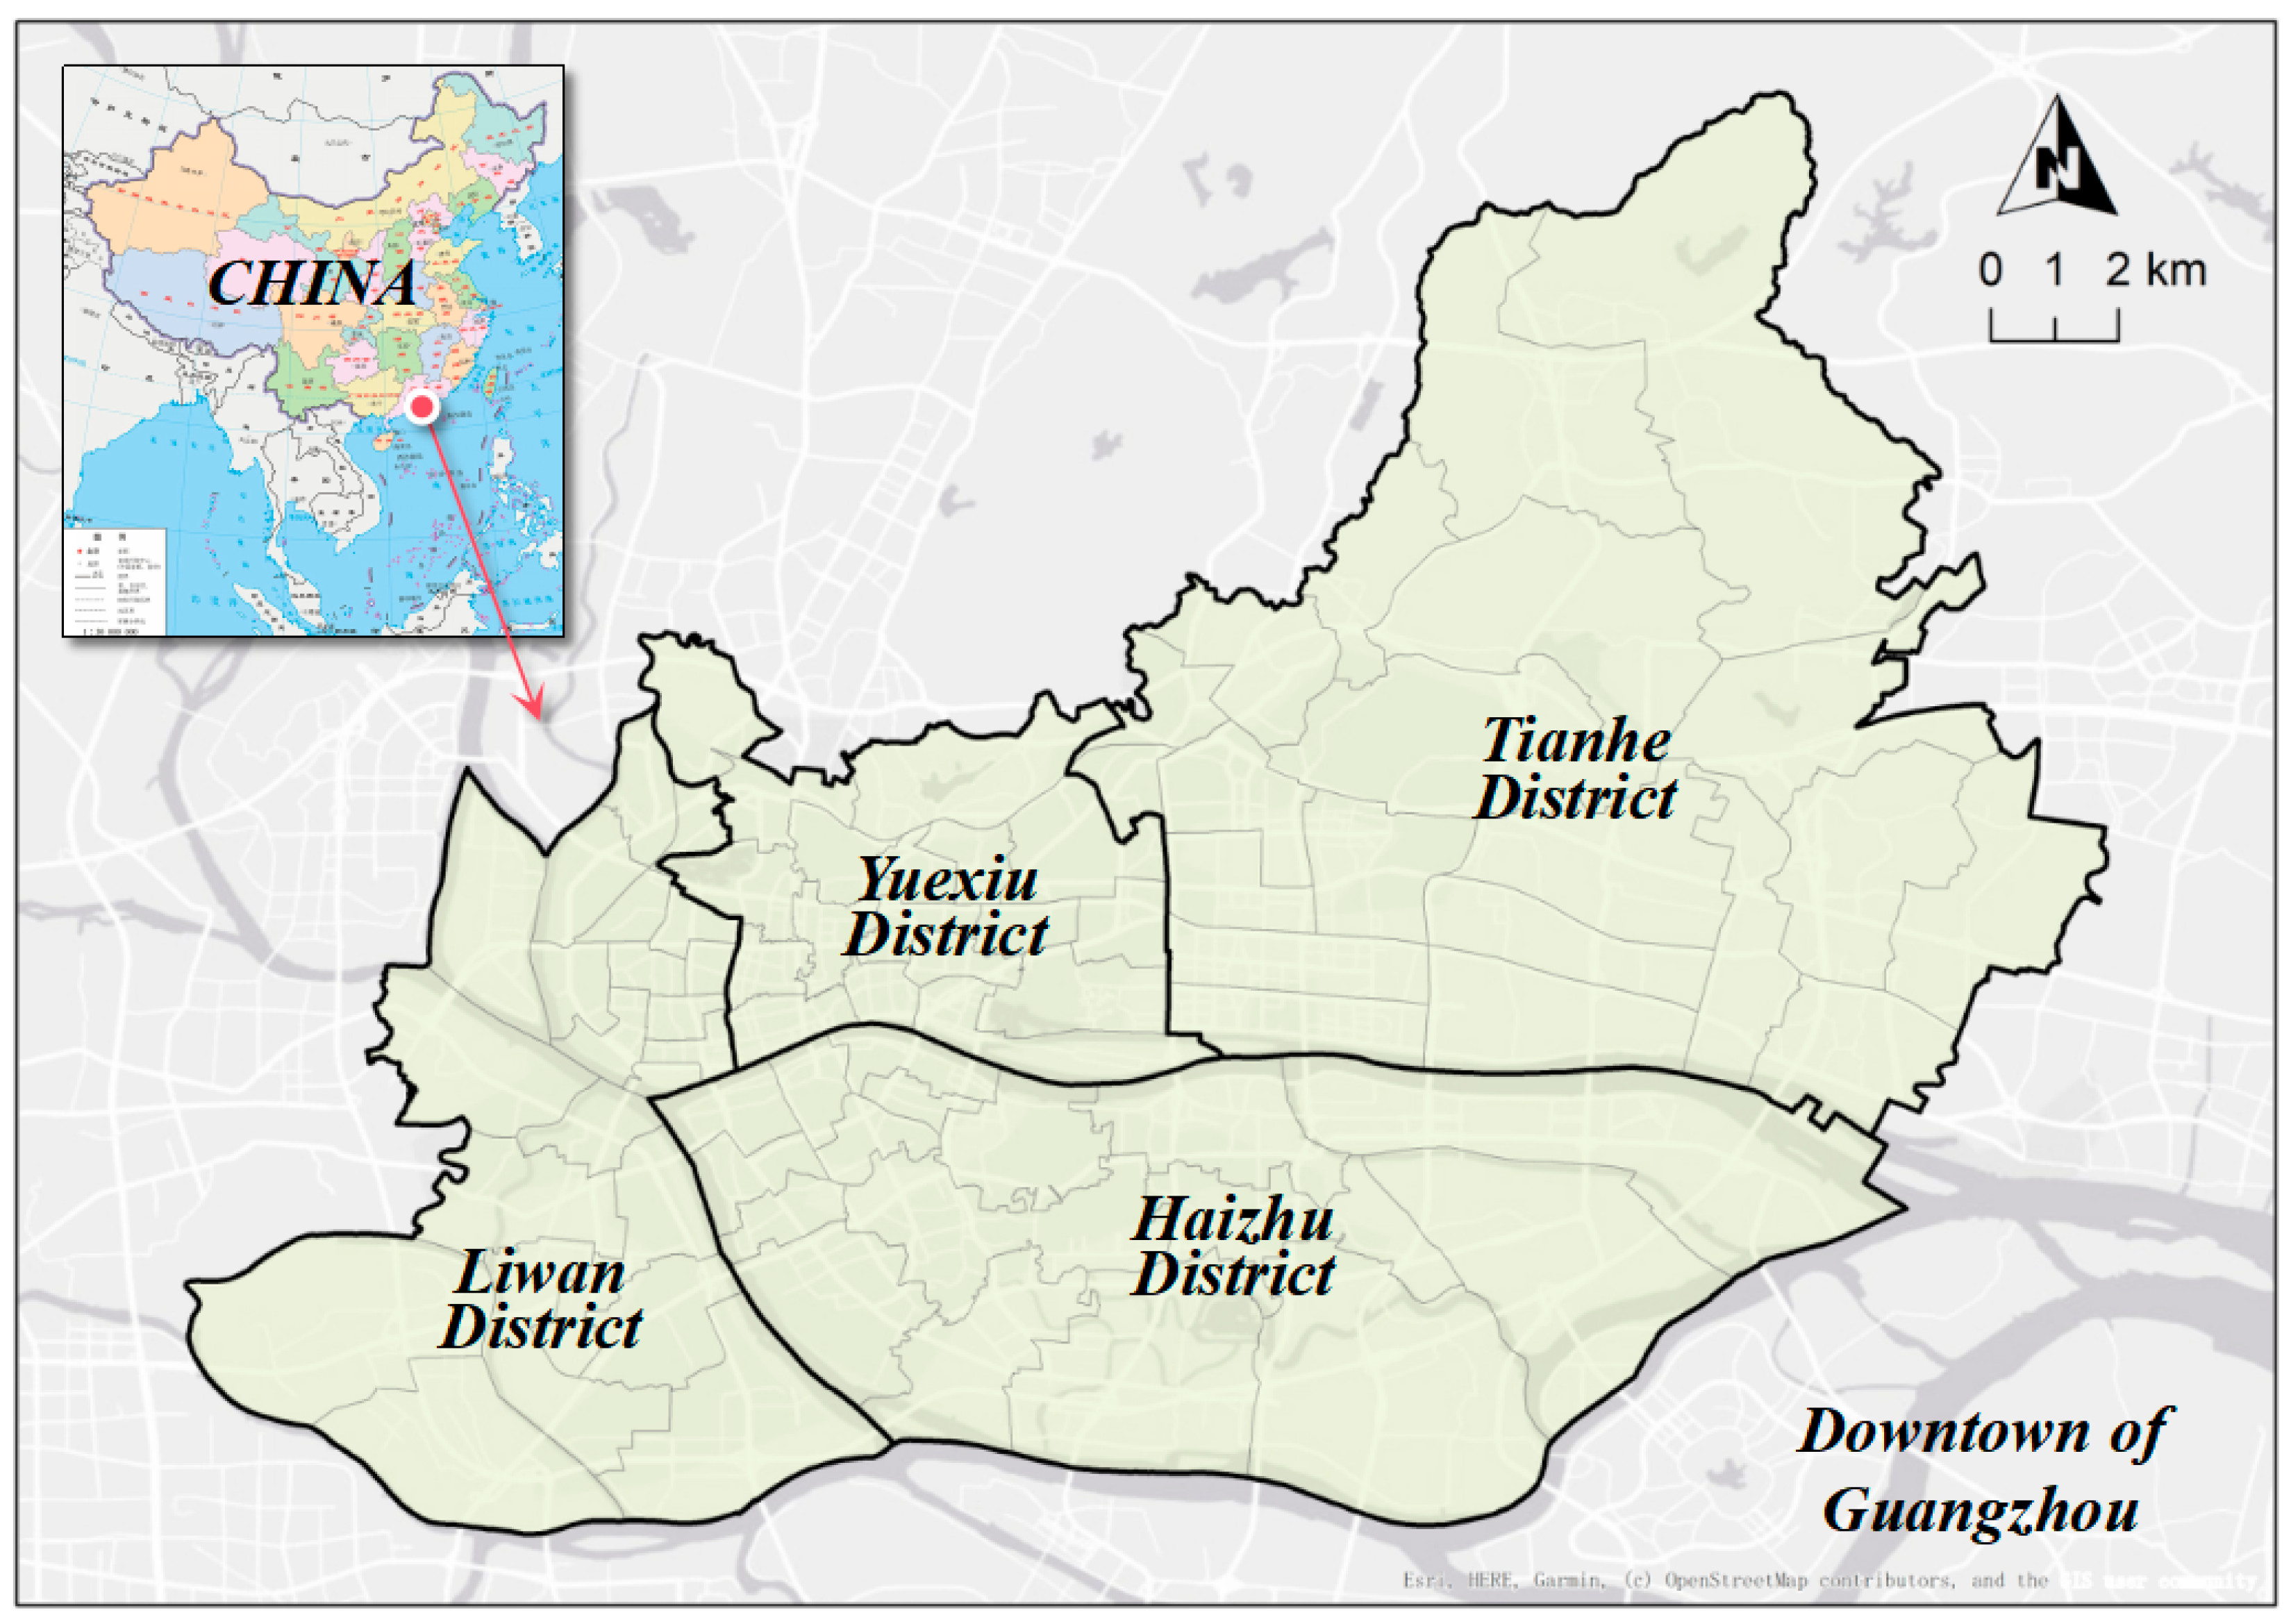
2.1. Study Area

This study selected the downtown area of Guangzhou, China, the host city of the renowned Guangzhou International Marathon, as the study area; it includes the Tianhe, Yuexiu, Liwan, and Haizhu districts (Figure 1). The study area features flat terrain surrounded by water systems and has a comfortable subtropical climate, providing favorable conditions for outdoor activities [30].

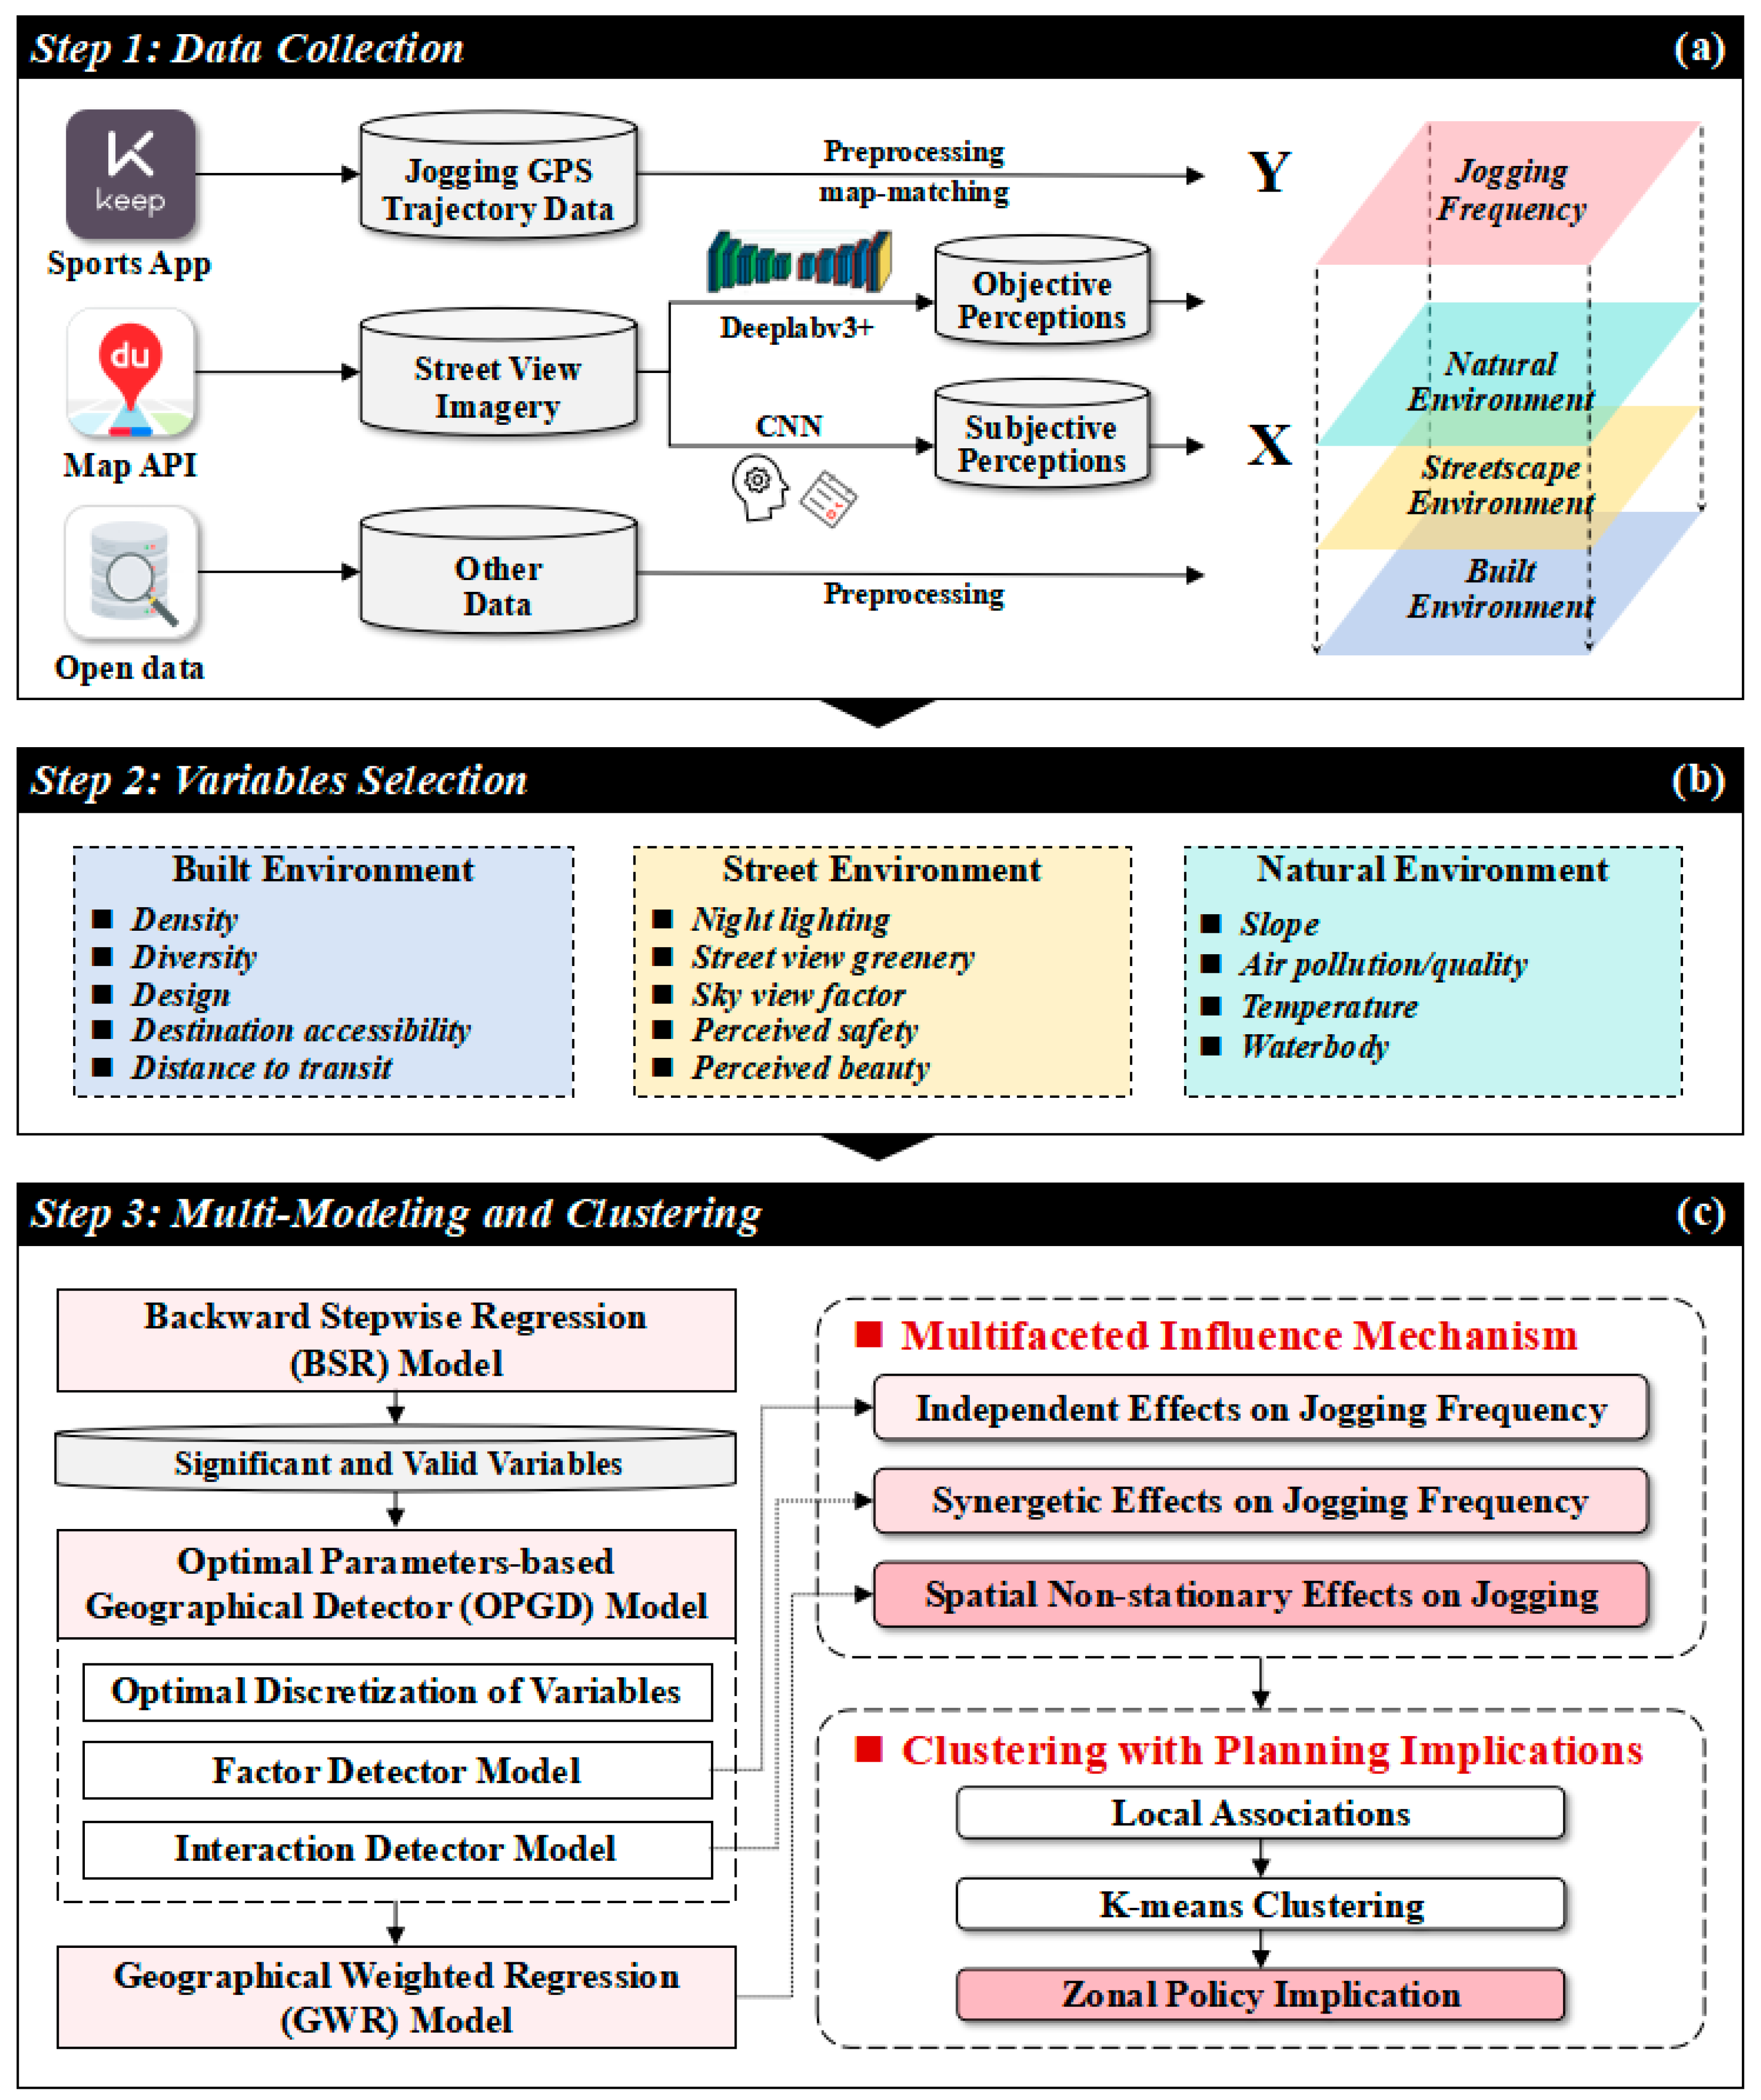
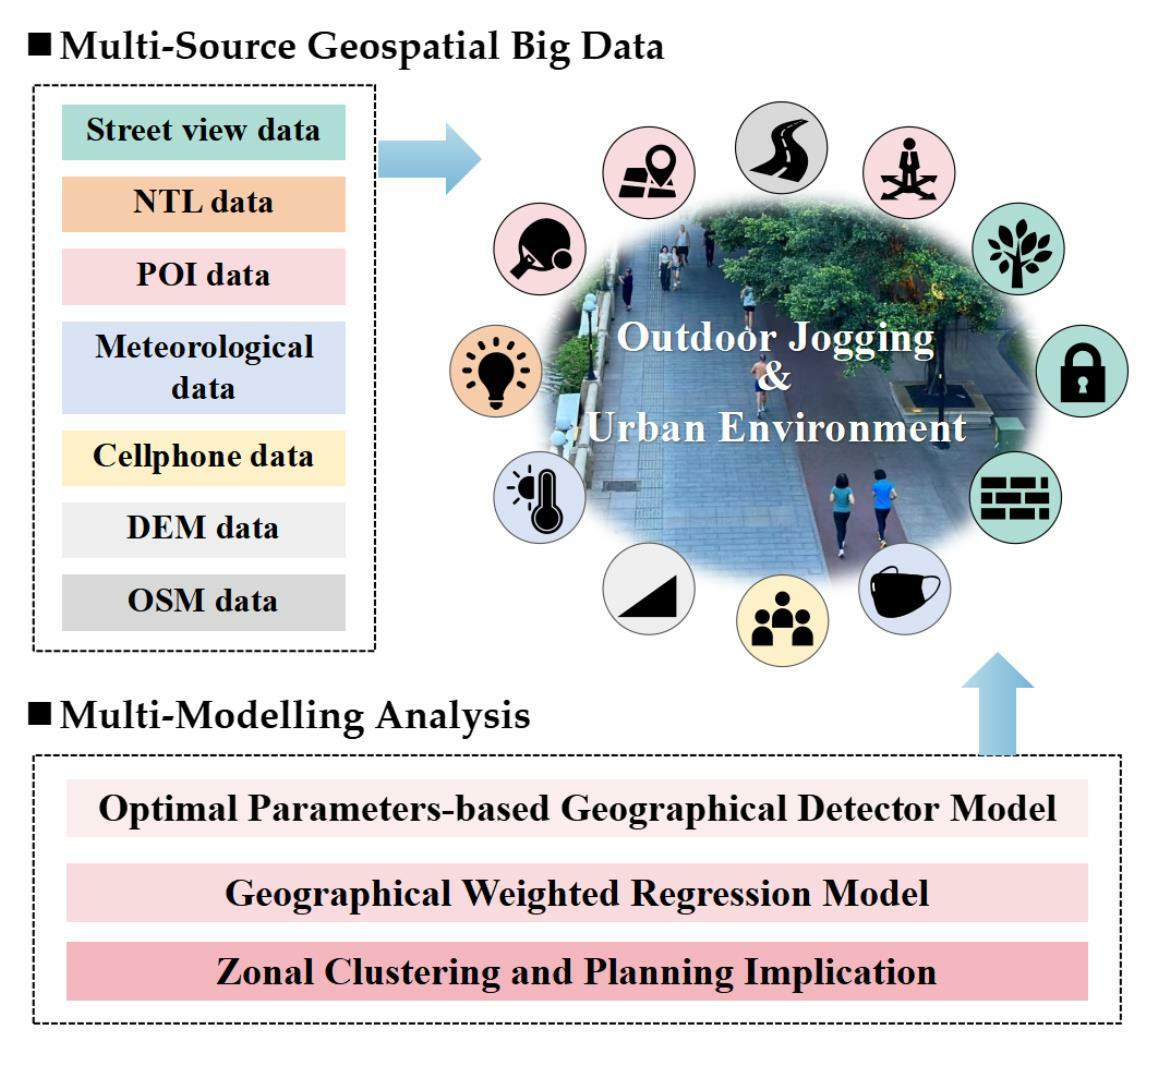
2.2. Analytical Framework

The framework and technical workflow of this study, as depicted in Figure 2, include three main steps: data collection and preprocessing, variable selection, and multi-model analysis with clustering. First, we processed the outdoor jogging GPS data which were provided by China’s largest fitness app. Next, we obtained remote sensing from NTLs and SVI data from various geospatial sources, including Baidu Maps API for the SVI data. The PSPNet model identified street-view elements such as the greenery ratio and sky openness. Pre-trained convolutional neural network (CNN) models and human–computer interaction scoring frameworks were then used to assess street-view perceptions such as aesthetic appeal and affluence.
Second, potential influencing factors affecting the distribution of urban outdoor jogging behaviors were comprehensively selected based on relevant studies, taking into consideration the area’s characteristics in relation to the following four aspects: socio-economic conditions, the built environment, the street environment, and the natural environment.
Third, using jogging frequency as the dependent variable and the potential influencing factors as independent variables, a BSR model was generated to address multicollinearity. Significant variables were then input into the OPGD model. This involved comparing spatial discretization schemes to address the modifiable areal unit problem (MAUP) using an interaction detector to analyze impacts and applying the GWR model for spatial heterogeneity. The k-means method divided the study area into sub-regions based on local correlations, facilitating the proposal of urban planning strategies. The framework integrates urban perception analysis, including SVI data, remote sensing data from NTLs, deep learning, and spatial statistical models using diverse geospatial big data sources.

2.3. Data Collection and Preprocessing

2.3.1. Jogging GPS Trajectory Data
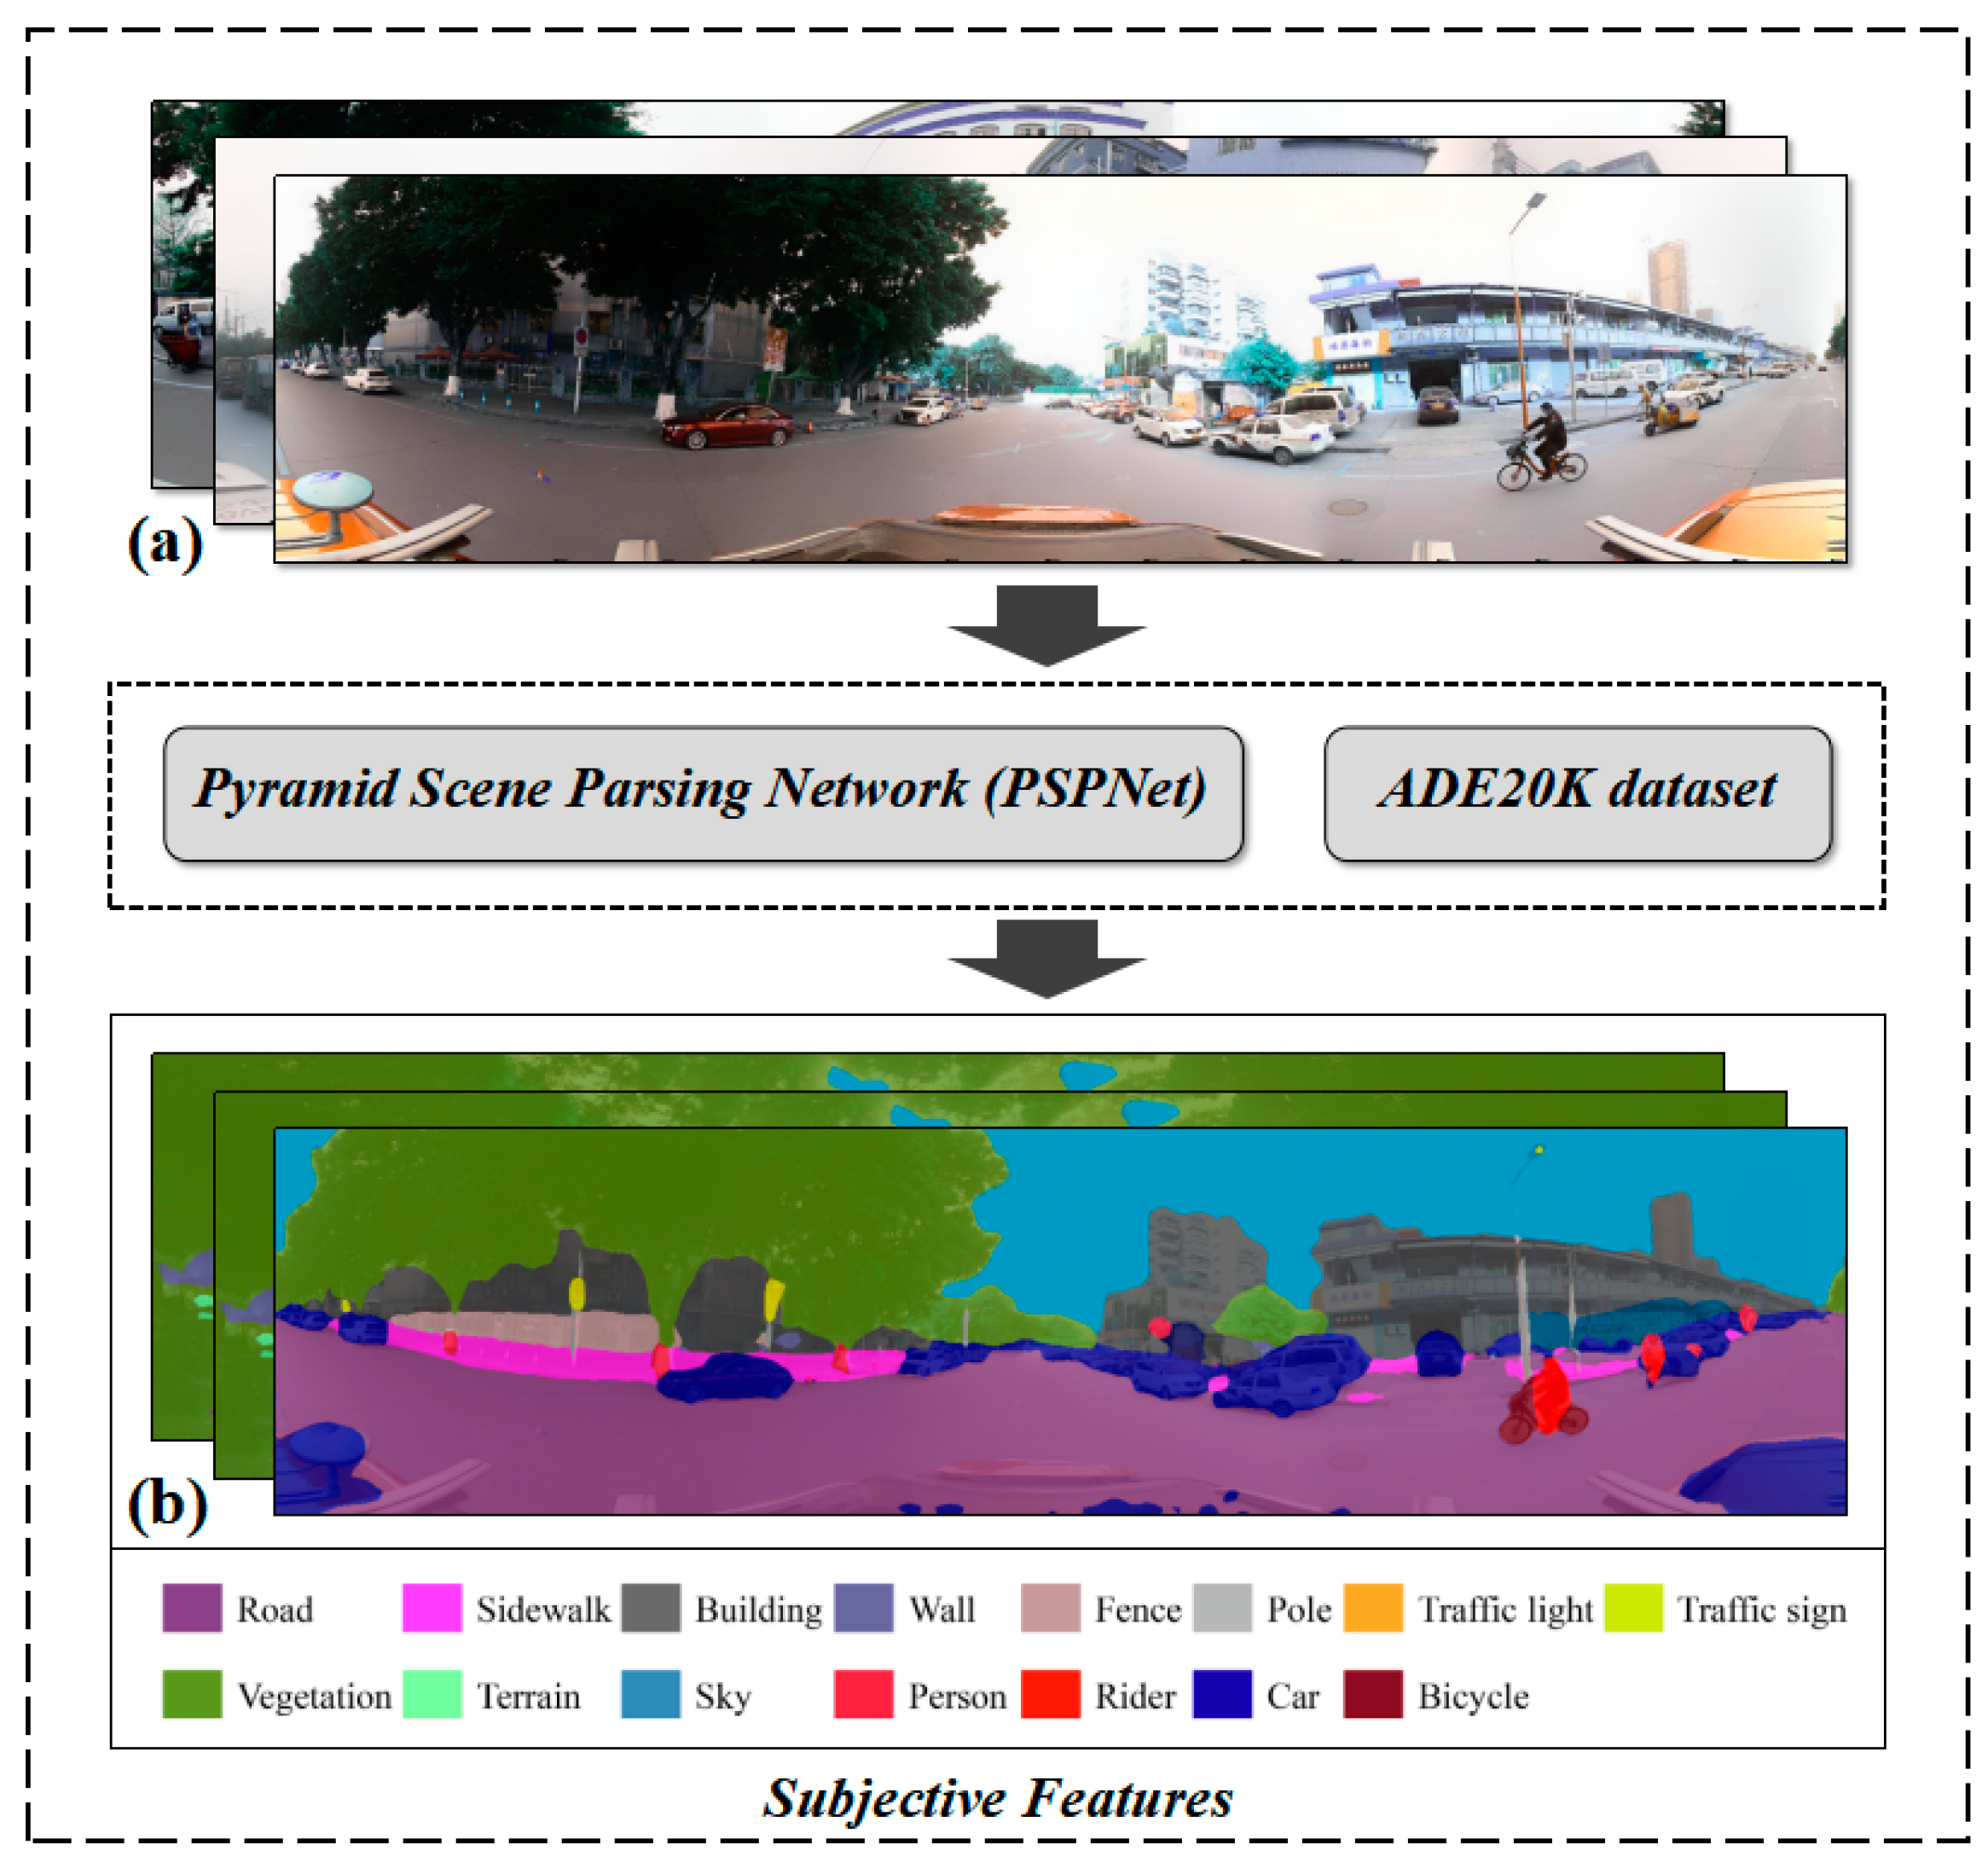
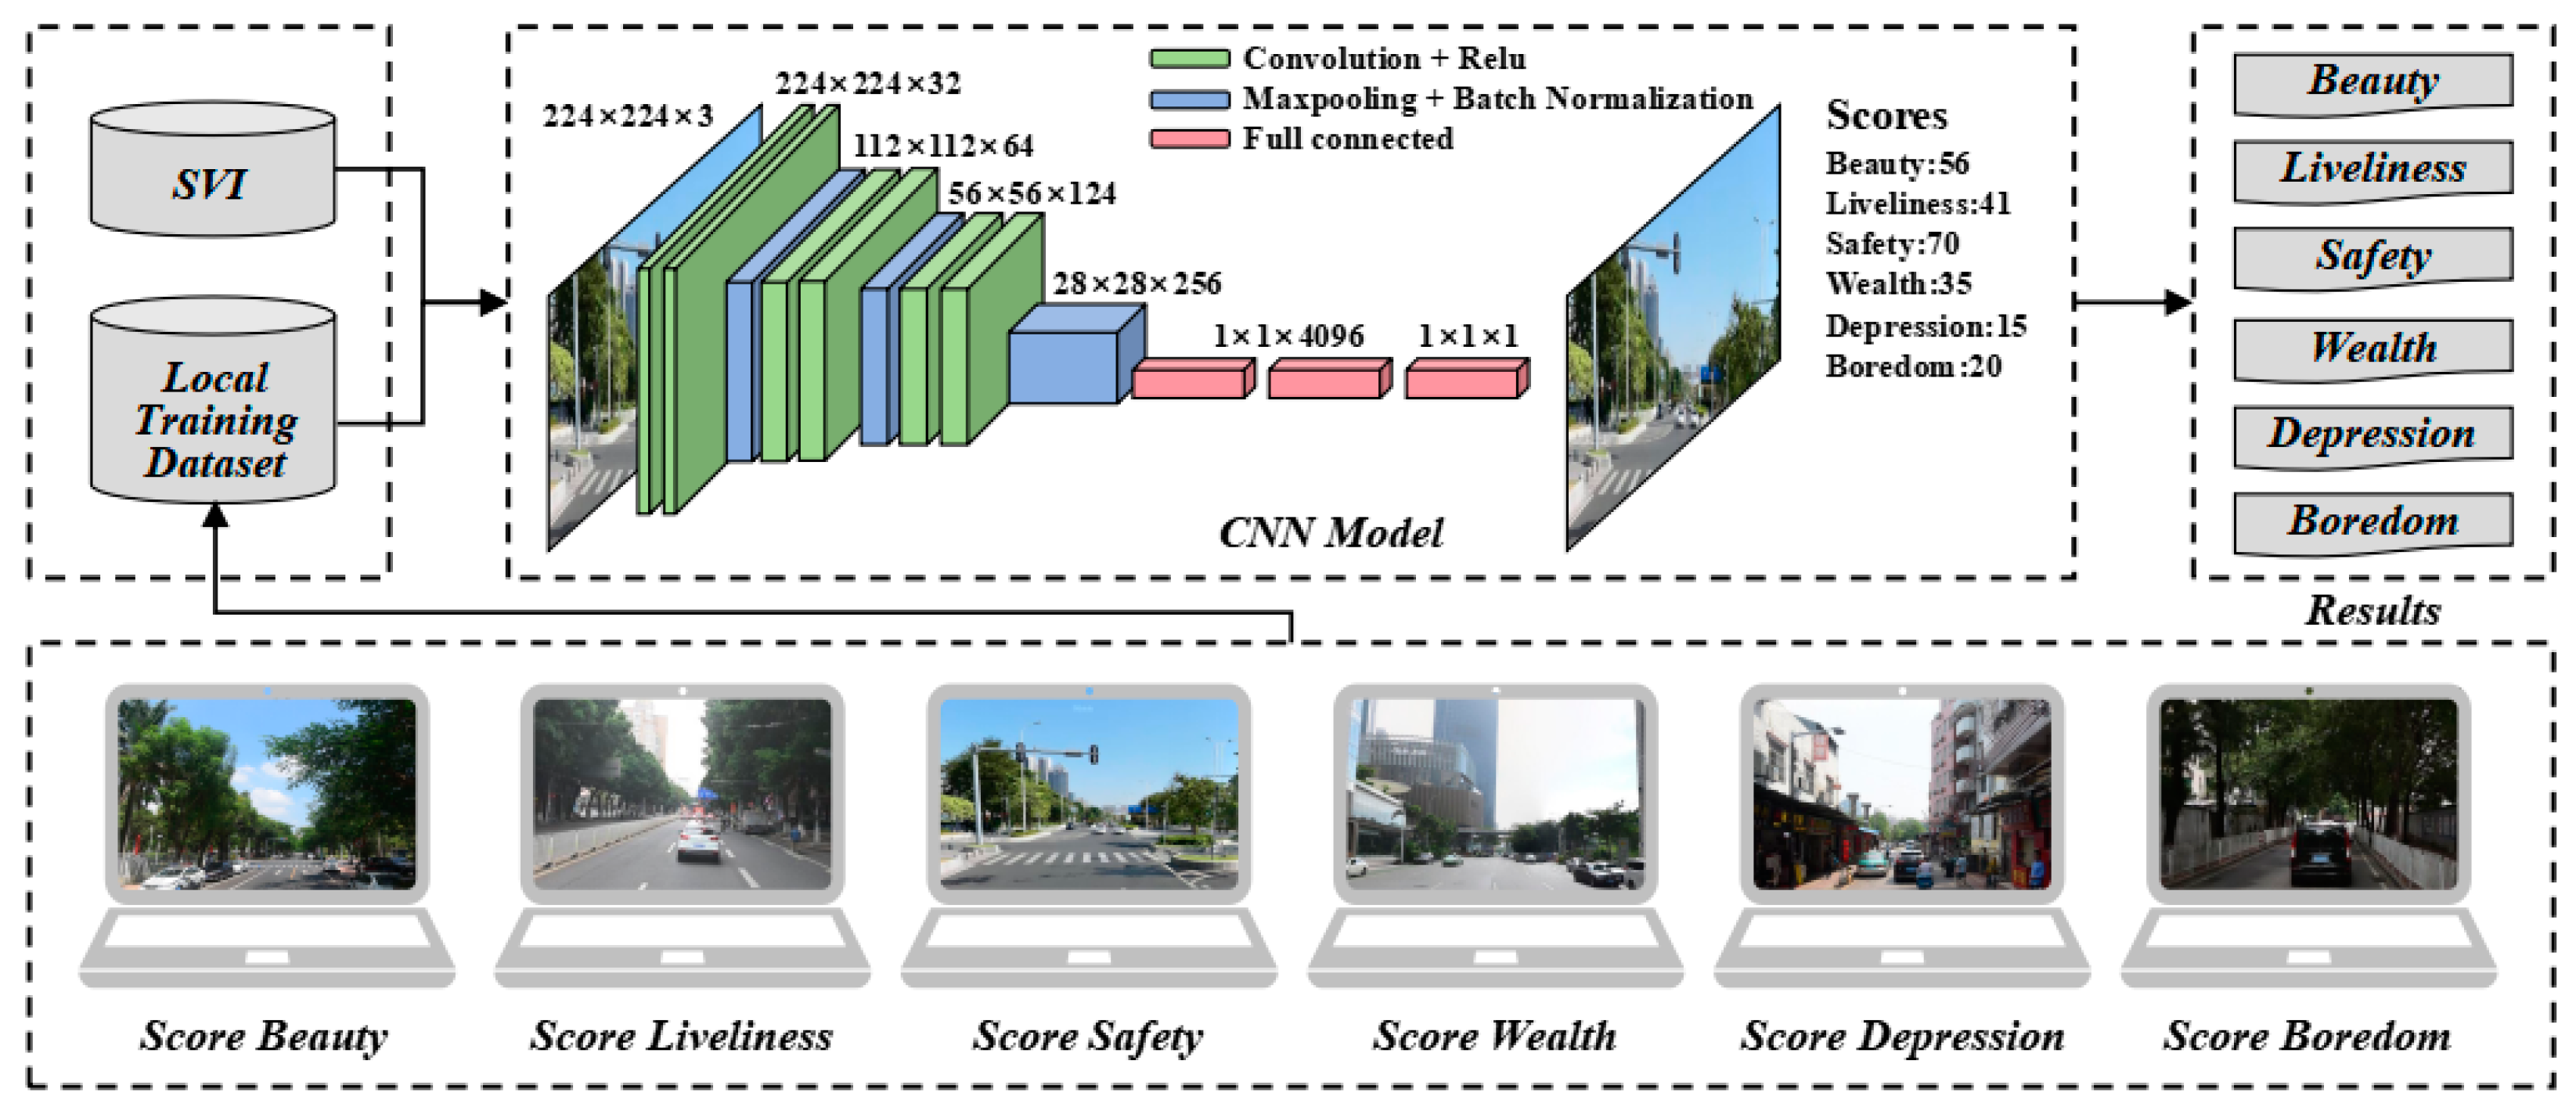
The jogging GPS trajectory data were obtained from the Keep app (http://api.gotokeep.com, accessed on 31 December 2019), which record users’ voluntarily uploaded jogging records. A total of 94,578 anonymous jogging trajectories were collected in 2019, recording anonymous IDs and the latitude/longitude coordinates of the routes. Due to limitations in the acquisition method, specific time information for the trajectories could not be obtained [18,19]. However, all trajectory data for the year 2019 were acquired to compensate for these limitations and increase the sample size. Due to signal and hardware differences, the temporal resolution of the trajectory data averaged 3–7 s, with a spatial error range between 10 and 50 m. Following methods outlined in the relevant literature [31], after undertaking data deduplication and cleaning, which included excluding erroneous data, a total of 56,471 valid jogging GPS trajectory data were obtained (Figure 3). To ensure the homogeneity of the analysis units in the subsequent spatial modeling analysis and considering the coverage of trajectory data with different grid sizes [32], a grid size of 300 m was chosen as the spatial unit, counting the frequency of trajectories within each grid as the frequency indicator.

2.3.2. SVI Data

The SVI data sampling was performed at 100-m intervals [9,33] along road segments to simulate a jogger’s perspective, capturing images from six orientations (0°, 60°, 120°, 180°, 240°, 360°) to achieve comprehensive panoramic coverage with a 90° field of view (FOV) and 0° pitch (Figure 4). The SVI images were obtained using the HTTP Baidu Map API, resulting in the collection of 140,508 images from 23,418 points after excluding null data points.

2.3.3. Luojia 1-01 NTLs Data

The Luojia 1-01 NTLs dataset was acquired from Wuhan University (http://59.175.109.173:8888/index.html, accessed on 31 December 2019), featuring a spatial resolution of 130 m. When compared to other NTLs datasets, including DMSP/OLS and VIIRS, the Luojia 1-01 data demonstrates significant enhancements in temporal resolution, spatial resolution, and spectral resolution [34]. NTLs data not only directly reflect the local nighttime light intensity but also indicate regional variations in economic development [35,36,37,38].
Initially, Luojia 1-01 NTLs data within Guangzhou’s administrative boundary were extracted using this boundary as a mask. Landsat 8 imagery, with superior spatial resolution, served as the reference for geometric calibration. Road intersections and building corners were used as feature points, with errors controlled to within 0.5 pixels. Figure 5 shows that before calibration, the Luojia 1-01 data exhibited spatial misalignment, but post-calibration, the illuminated areas better matched the locations of buildings and roads. Lastly, a radiation adjustment was carried out using the radiation correction formula provided for the Luojia 1-01 satellite product, as detailed below:
L = D N 3 / 2 × 10 10
where L represents the radiance value after absolute radiation correction; DN represents the image gradation value.

2.3.4. Other Data

The other data used primarily included road network data, point of interest (POI) data, and building data, which were obtained from Baidu Map (https://map.baidu.com/, accessed on 31 December 2019). Data related to sports facilities, such as jogging tracks, pull-up bars, and ping-pong tables, were acquired from the urban planning department. Population data were extracted from mobile signaling data provided by the leading local telecommunications operator. DEM data with a 30 m resolution were obtained from the gscloud platform (www.gscloud.cn, accessed on 31 December 2019). Data about the annual average temperature and air quality from ground observation stations were sourced from the local meteorological department.

2.4. Variables Selection and Extraction

Drawing on the relevant literature and considering data availability, potential factors influencing the spatial distribution of jogging routes were selected from three aspects: the built environment, street perception, and natural environment (Table 1). The extraction and computation of potential influencing factors were based on multi-source geospatial big data, including POI data and SVI data.

2.4.1. Built Environment Factors

Based on prior research [18,19,20,21,22,23] and the “5D” framework [10,42,43], we selected nine widely recognized built environment factors. For the density dimension, population density (PopDen), building density (BldDen), and facility density (PoiDen) were identified as key indicators of the built environment’s impact on outdoor jogging, as established in previous studies [5,6,7,8]. In terms of diversity, the land-use mix (PoiMix) was chosen, as it has been shown to significantly influence outdoor physical activities [18,19]. For the design dimension, road density (RoadDen) was selected to assess street connectivity and directness [6,20,22]. Considering the importance of sports amenities in encouraging outdoor jogging, the destination dimension was evaluated using the density of sports facilities (such as table tennis tables, horizontal bars, or jogging tracks) (Sports) and distance to parks (PARK) [41]. To measure the distance to transit, the distance to the nearest bus stop and metro stop (Trans) was employed to capture travel convenience and accessibility. Considering the travel convenience of joggers, the density of residential areas (Resi) was selected as a potential variable. Additionally, the nighttime light (NTL) intensity was included to assess the brightness of outdoor lighting at night.

2.4.2. Street Perception Factors

Street perception factors are divided into subjective and objective parts. First, the objective view index is commonly delineated as the pixel ratio of visual elements within an SVI image; it is frequently employed to highlight the importance of eye-level perspectives in research on physical activity [18,19]. To classify and compute 45 distinct physical features of SVI images, we utilized the Pyramid Scene Parsing Network (PSPNet), a computer vision model renowned for its precision and efficacy in extracting and quantifying the objective view index [44]. With the ADE20K dataset, PSPNet achieved a pixel accuracy surpassing 93.4% for the semantic segmentation of urban scenes [45,46]. Subsequently, the pixel ratios of each objective feature in the six-direction SVI images for each sample point were averaged. This procedure resulted in the acquisition of view indexes for all sample points (Figure 6). Based on previous studies related to jogging behavior, this research selected greenery, sky, and walls from 45 objective streetscape elements as potential influencing factors. Green and Sky, identified through the semantic segmentation of streetscape data, are considered to play a promoting and attractive role in outdoor sports [20,21,23,47]. In contrast, Walls are thought to provide a sense of enclosure and are detractive for outdoor exercisers [47,48,49].
Wang et al. developed a CNN model to predict perception scores for SVI images, utilizing the Visual Geometry Group network (VGGNet) architecture [50]. This network comprises three convolutional layers and three fully connected layers interspersed with 2 × 2 max-pooling layers (Figure 7). Each convolutional layer contains a dual layer of 3 × 3 convolutional filters. Unlike the typical softmax layer used for multiclass classification, a one-dimensional fully connected layer was employed to preserve image features. Max pooling was utilized to reduce data dimensionality and facilitate the learning of high-level feature maps. To mitigate overfitting, dropout was implemented, and batch normalization was employed to normalize hidden layer outputs. For the effective training of the VGGNet, an appropriate dataset is crucial for exploring complex perceptions. The local training dataset was used to train six models corresponding to perceptual dimensions: beauty, boredom, depression, safety, vitality, and wealth. Local volunteers scored each SVI image in the training dataset, reflecting the genuine urban perceptions of the environment of Chinese cities. Compared to the human–machine adversarial framework proposed by Yao et al. [51], the CNN–VGGNet-based models effectively extracted image features and quantified urban perceptions of the SVI images [50]. The Pearson correlation coefficient between the model predictions and actual values for the testing dataset exceeded 0.9, indicating high accuracy [50]. Significantly, unlike models trained on the MIT Media Lab’s Place Pulse dataset [52,53,54,55], the model trained with the local dataset provided more accurate predictions of Chinese cities’ perception scores due to the influence of residents’ sociocultural backgrounds [51,56]. Consequently, we applied the collected SVI data to the pre-trained model to measure six perceptual metrics—beauty, boredom, depression, safety, liveliness, and wealth—encompassing both positive and negative dimensions of human perceptions. Based on the relevant studies, there is a high degree of correlation between the subjective perceptions identified through SVI data [53,54], and it has been found that safety (Safe) and liveliness (Live) play crucial roles in outdoor activities [18]. Therefore, we selected Safe and Live as independent variables.

2.4.3. Natural Environmental Factors

The relevant studies indicate that factors related to the natural environment do not significantly influence the distribution of outdoor exercise behaviors, as such activities are more heavily dependent on built environment factors, such as sports facilities, running tracks, and public transport accessibility [18,19,20,21,22]. However, it remains necessary to investigate whether natural environmental factors have a significant impact on jogging activities in the context of this study. Therefore, drawing on the relevant literature, we selected the annual average temperature, annual average air quality, distance to water, and ground slope as independent variables.

2.5. Methods

2.5.1. Backward Stepwise Regression Model

This study began with 19 potential influencing factors as independent variables and used the BSR model to streamline the model by removing insignificant variables [57,58]. The final model retains only those variables with a significant impact on predicting the length of jogging tracks, enhancing the model’s simplicity, interpretability, and predictability.

2.5.2. Optimal Parameters-Based Geographical Detector Model

The OPGD model is an enhanced version of the geographic detector model, incorporating optimal parameter solutions [59]. The geographic detector model, a spatial statistical approach based on variance analysis, offers the advantage of quantifying not only the individual impact but also the interactive effects of factors [60]. The OPGD model addresses the MAUP by generating model outputs based on optimal parameters [59]. In this study, it was utilized to quantify the influence of factors on jogging activities, considering both independent and synergistic effects. The factor detector model is expressed by the following formula:
q = 1 h = 1 L N h σ h 2 N σ 2
where N refers to the N units of the study, which are stratified into an h =1, 2, …, L stratum; and the stratum h consists of N h units; σ 2 and σ h 2 refer to the global variance of the jogging activities and the variance in the sub-areas, respectively; the independent effect of each factor can be expressed by the q value, ranging from 0 to 1.
Additionally, the interaction detector was utilized to quantify the synergistic impacts between factors on jogging activities. This method identifies whether a pair of factors exhibit enhancement or attenuation effects by comparing their combined q value with each of their individual q values. The interactions are then classified into the following categories:
N o n l i n e a r - e n h a n c e :   q A B > q A + q B Independent :   q A B = q A + q B Bi - enhance :   M a x q A ,   q B < q A B < q A + q B Uni - enhance / weaken :   M i n q A ,   q B < q A B < M a x q A ,   q B N o n l i n e a r - w e a k e n :   q A B < M i n q A ,   q B
The OPGD model requires categorizing numerical variables [60] significantly influenced by the MAUP, including discretization methods and interval numbers. To optimize results, the model automatically selects the best combination from methods like equal intervals, natural breaks, and quantiles. Studies recommend using three to six intervals to balance spatial heterogeneity and data scatter [61,62,63]. The optimal discretization for each variable is determined by maximizing the q value.

2.5.3. Geographical Weighted Regression Model

The BSR model mitigates multicollinearity by retaining significant variables, which are then analyzed with the GWR model to assess spatial heterogeneity in jogging activity distribution. This study reveals spatial variation and nonstationarity in the relationship between jogging activities and influencing factors, demonstrating the GWR model’s advantage in modeling local parameters over traditional linear regression methods [64]. The GWR model estimates a local coefficient for each specific location, denoted as the ith location as follows:
y i = j = 0 j = n β i j x i j + ε i
where y i is the dependent variable at the ith location, x i j is the independent variable, β i j is the coefficient of the jth independent variable at the ith location, and ε i is the error term. Considering the spatial variability of jogging activities, an adaptive spatial kernel was utilized in the GWR modeling process, with the optimal bandwidth determined using the Akaike Information Criterion (AICc) method.

2.5.4. Clustering Based on the Local Association

The models were applied to examine factors affecting jogging distribution, with the GWR model specifically addressing spatial heterogeneity. To group regions with similar jogging influence mechanisms, k-means clustering was employed based on coefficients from the GWR model. This method effectively partitions data into distinct clusters by minimizing intra-cluster variance and maximizing inter-cluster differences [65]. The evaluation metric typically used is the sum of squared errors within the clusters, denoted as E, and it can be calculated as follows:
E = i = 1 k x C i x μ i 2
where x is the value of the sample object, and μ i is the mean value of the cluster C i , which is calculated as follows:
μ i = 1 C i x C i x

3. Results

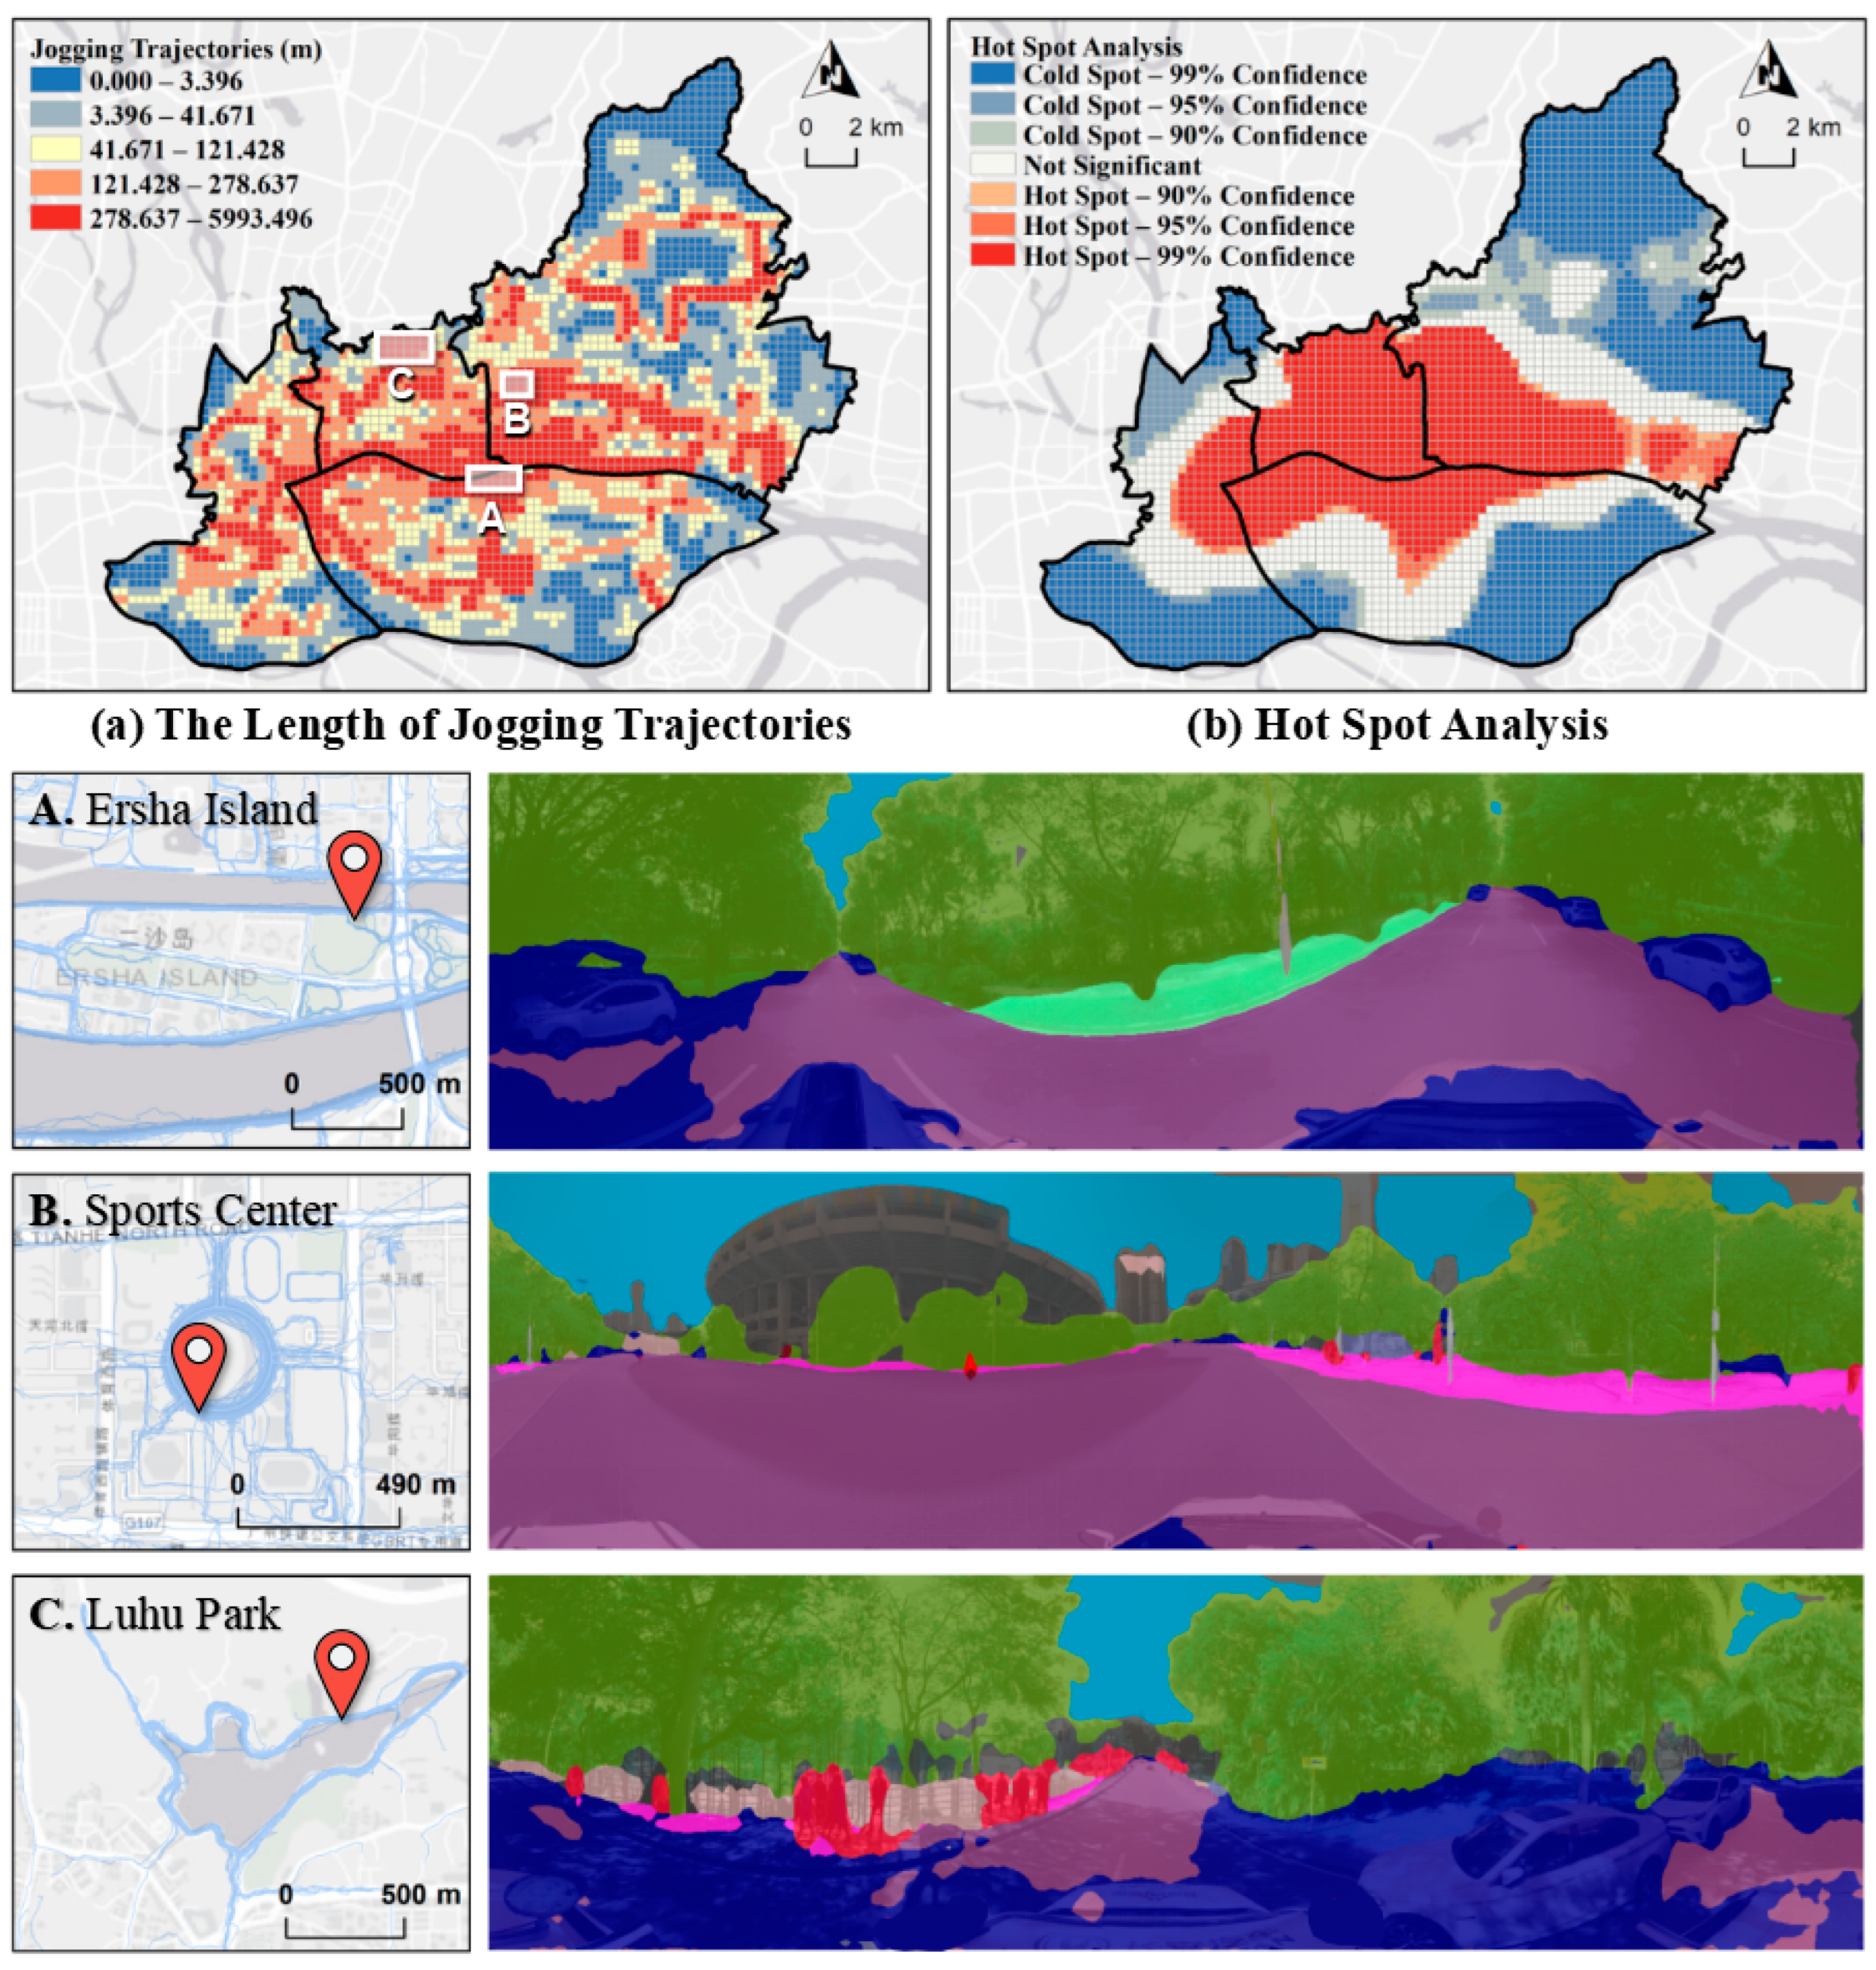
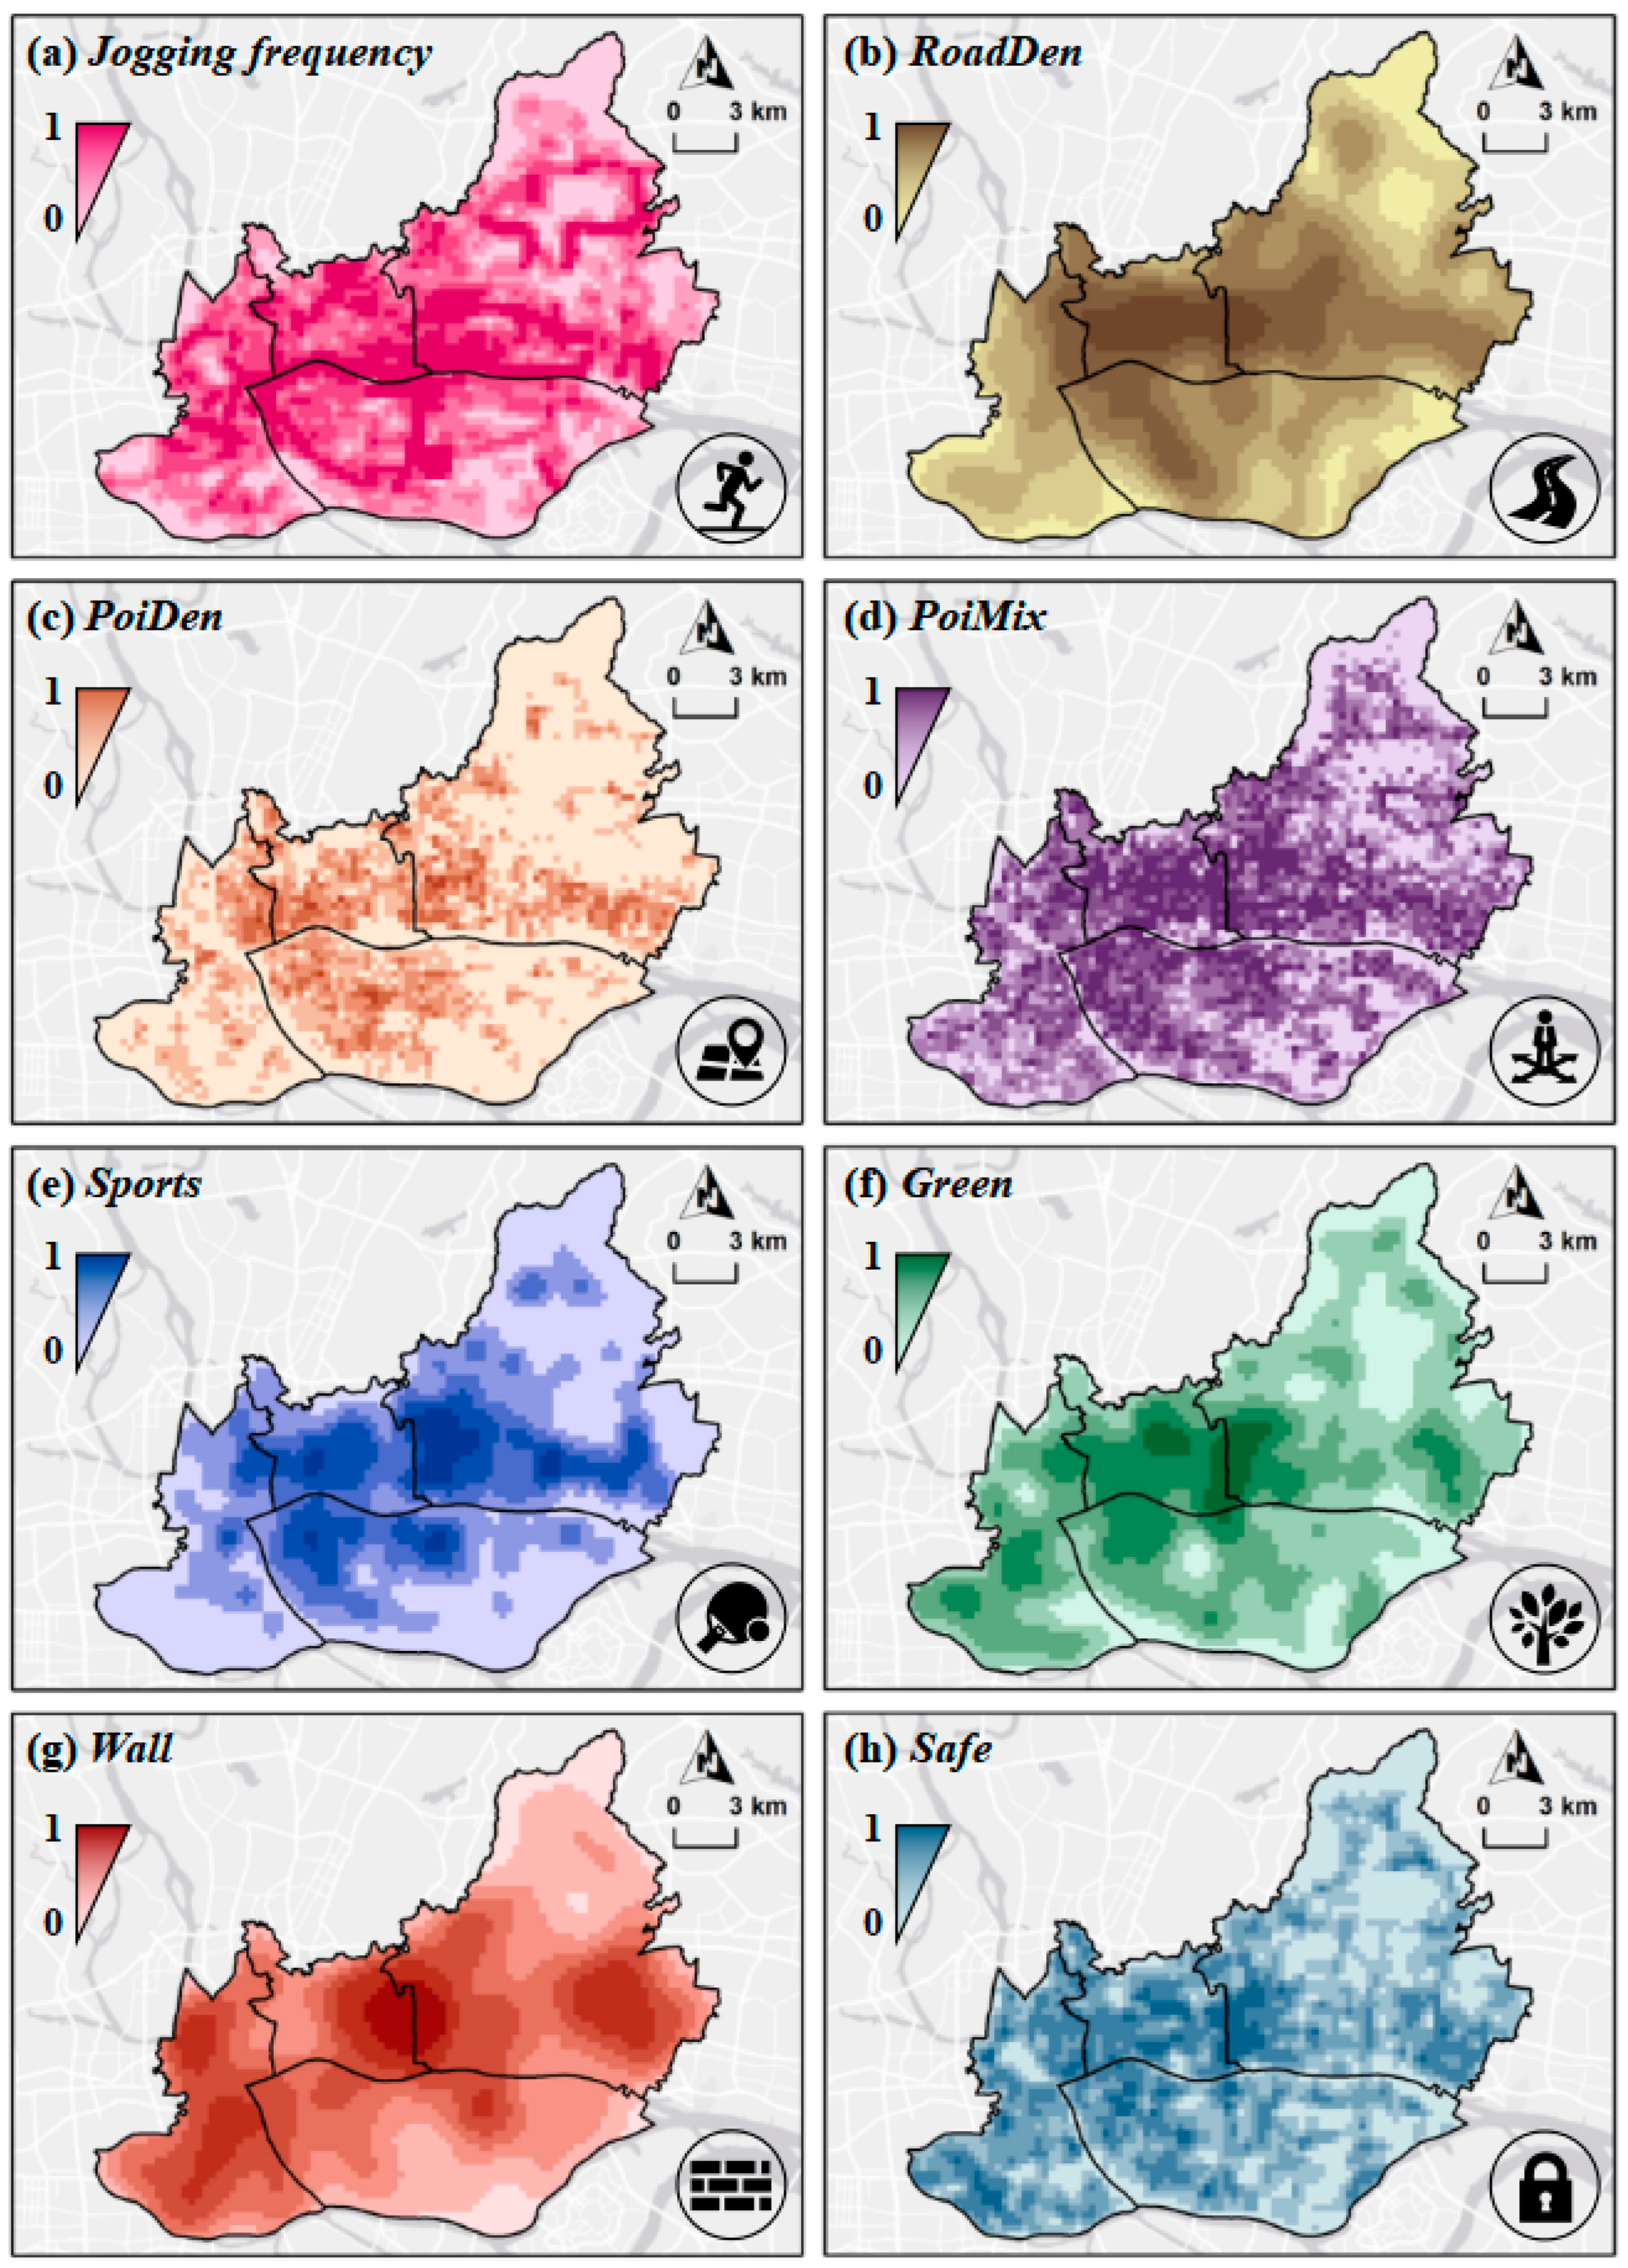
3.1. Descriptive Analysis

Figure 8 shows the spatial distribution and hotspot analysis of jogging trajectory lengths. Figure 8a presents the 2019 jogging trajectory lengths across 3738 grids (300 m each), with an average of 205.2 m and a standard deviation of 342.7 m. Jogging was concentrated in an east–west strip through the central area, with notable hotspots at Ersha Island, Luhu Park, and the Tianhe Sports Center. Ersha Island and Luhu Park benefit from natural environments, while the Tianhe Sports Center offers advanced facilities. The lower part of Figure 8 shows SVI data indicating high greenery at these hotspots, potentially influencing jogging distribution. Subsequent modeling analyses explored these spatial patterns and factors, with descriptive statistics for all variables provided in Table 2.

3.2. Variable Selection Based on the BSR Model

Due to the presence of multicollinearity among the variables, we initially employed the BSR model to mitigate this issue and to identify significant variables with robust explanatory power [9,57,58]. Prior to using the BSR model, the candidate variables were subjected to a zero-mean standardization, ensuring that their means were zero and their standard deviations were one. The results of the BSR model are presented in Table 3. From the 18 candidate variables, 7 significant and highly explanatory independent variables were selected. For the built environment category, the retained effective variables included RoadDen, PoiDen, PoiMix, and Sports. For the street perception category, the effective variables retained were Green, Walls, and Safe. However, the variables related to the category of the natural environment category were excluded by the model. The spatial distribution of the seven significant and highly explanatory variables is shown in Figure 9.

3.3. Independent and Synergistic Impacts of Factors on Jogging Based on the OPGD Model

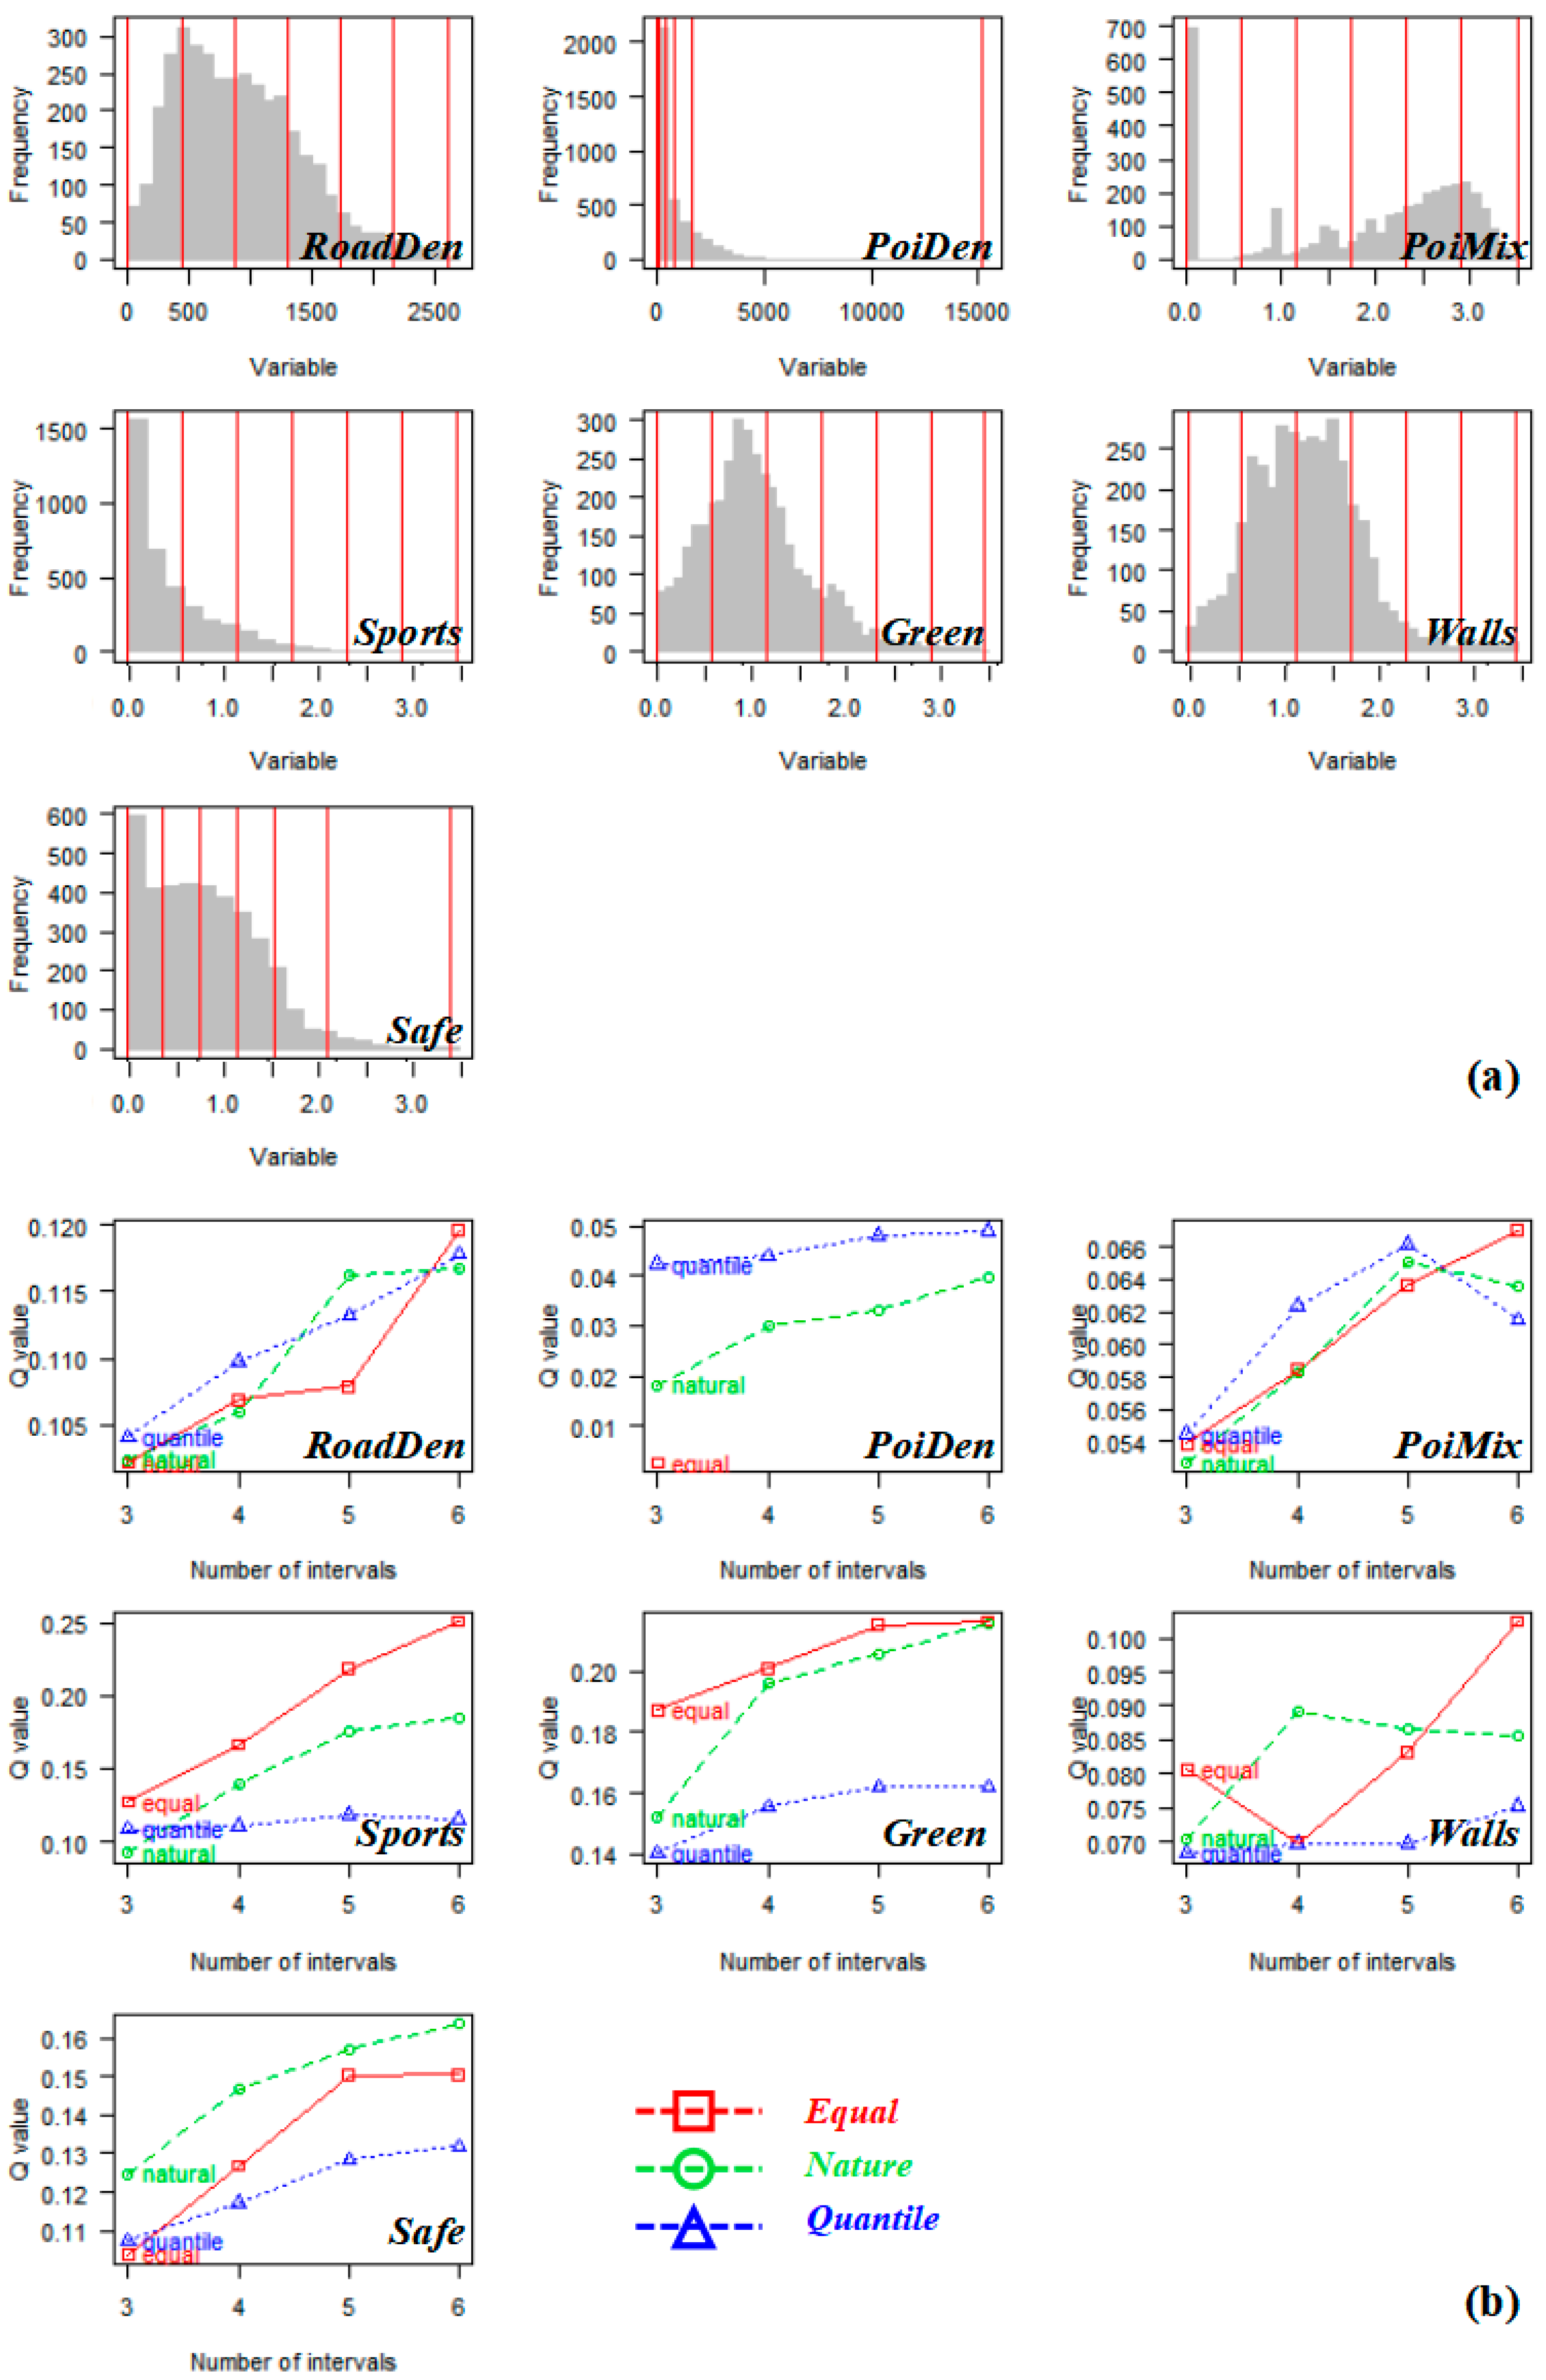
3.3.1. Optimal Discretization of Variables

The discretization process utilized in this study is illustrated in Figure 10. For each variable, we evaluated 12 combinations, encompassing three discretization methods and four interval numbers. The combination yielding the highest q value was identified as the optimal choice. Figure 10b and Table 4 display the discretization outcomes along with the optimal combinations of discretization methods and interval numbers. It is important to note that the discretization results, including the choice of method and interval numbers, are influenced by the data distribution and the similarity to the spatial distribution of jogging activities, rather than by the absolute q value.

3.3.2. Independent and Synergistic Impacts of Factors on Jogging Activities

The results of the OPGD model, encompassing the factor detector sub-model and the interaction detector sub-model, are shown in Figure 11. These sub-models represent the independent effects of factors on the distribution of jogging activities (Figure 11a) and their synergistic effects (Figure 11b), respectively.
First, the results of the factor detector sub-model indicate that the average q value for the independent effects of seven significant variables on the distribution of jogging activities was 0.138, implying that these variables, on average, explain 13.8% of the variance in the distribution of jogging activities (Figure 11a). Referring to related studies that apply the OPGD model, variables with independent effect q values higher than the average level are considered key variables, indicating their relatively high importance among all variables [61,62,66]. In this study, the variables Sports, Green, and Safe were identified as key variables, explaining 25.1%, 21.6%, and 16.1% of the variance in the distribution of jogging activity, respectively. These identified key variables represent different aspects: built environmental elements, objective street-view perception elements, and subjective street-view perception elements. This also suggests that the spatial distribution pattern of outdoor jogging activities is influenced by a combination of multiple factors, including both macro built environment elements and micro street-view perception elements, which is consistent with the existing research [18,19].
Second, the results of the interaction detector sub-model indicate that the 21 pairwise combinations of the seven significant variables exhibited an average q value of 0.271 for their synergistic effects on the distribution of jogging activities, nearly double the average q value of the independent effects (Figure 11b). This suggests that the synergistic explanatory power of these variable pairs on the distribution of jogging activities was substantially greater than that of individual factors, indicating that the spatial distribution of outdoor jogging activities is not influenced by a single factor. Instead, it is comprehensively influenced by multiple factors.
Table 5 lists the top five factor pairs from the results of the interaction detector sub-model, along with the changes in their synergistic q values compared to their independent q values. Notably, the top four factor pairs all involved combinations of Sports with other variables. Integrating the results from the factor detector sub-model, it is evident that Sports was the most crucial variable influencing the distribution of outdoor jogging activities. This conclusion is supported both by the independent explanatory power of Sports and by the synergistic explanatory power of its combinations with other variables. This finding aligns with previous studies, which have demonstrated a strong positive correlation between public outdoor sports facilities and outdoor sports activities, particularly jogging [20,21,22,23]. Specifically, the top-ranked variable pair was SportsGreen, with a synergistic explanatory power of 0.477 for the distribution of jogging activities, followed by SportsSafe, SportsPoiMix, SportsWalls, and GreenPoiDen. The changes in synergistic q values compared to independent q values further illustrate that the synergistic explanatory power of the influencing factors on jogging activities was significantly stronger than the independent explanatory power of each factor.

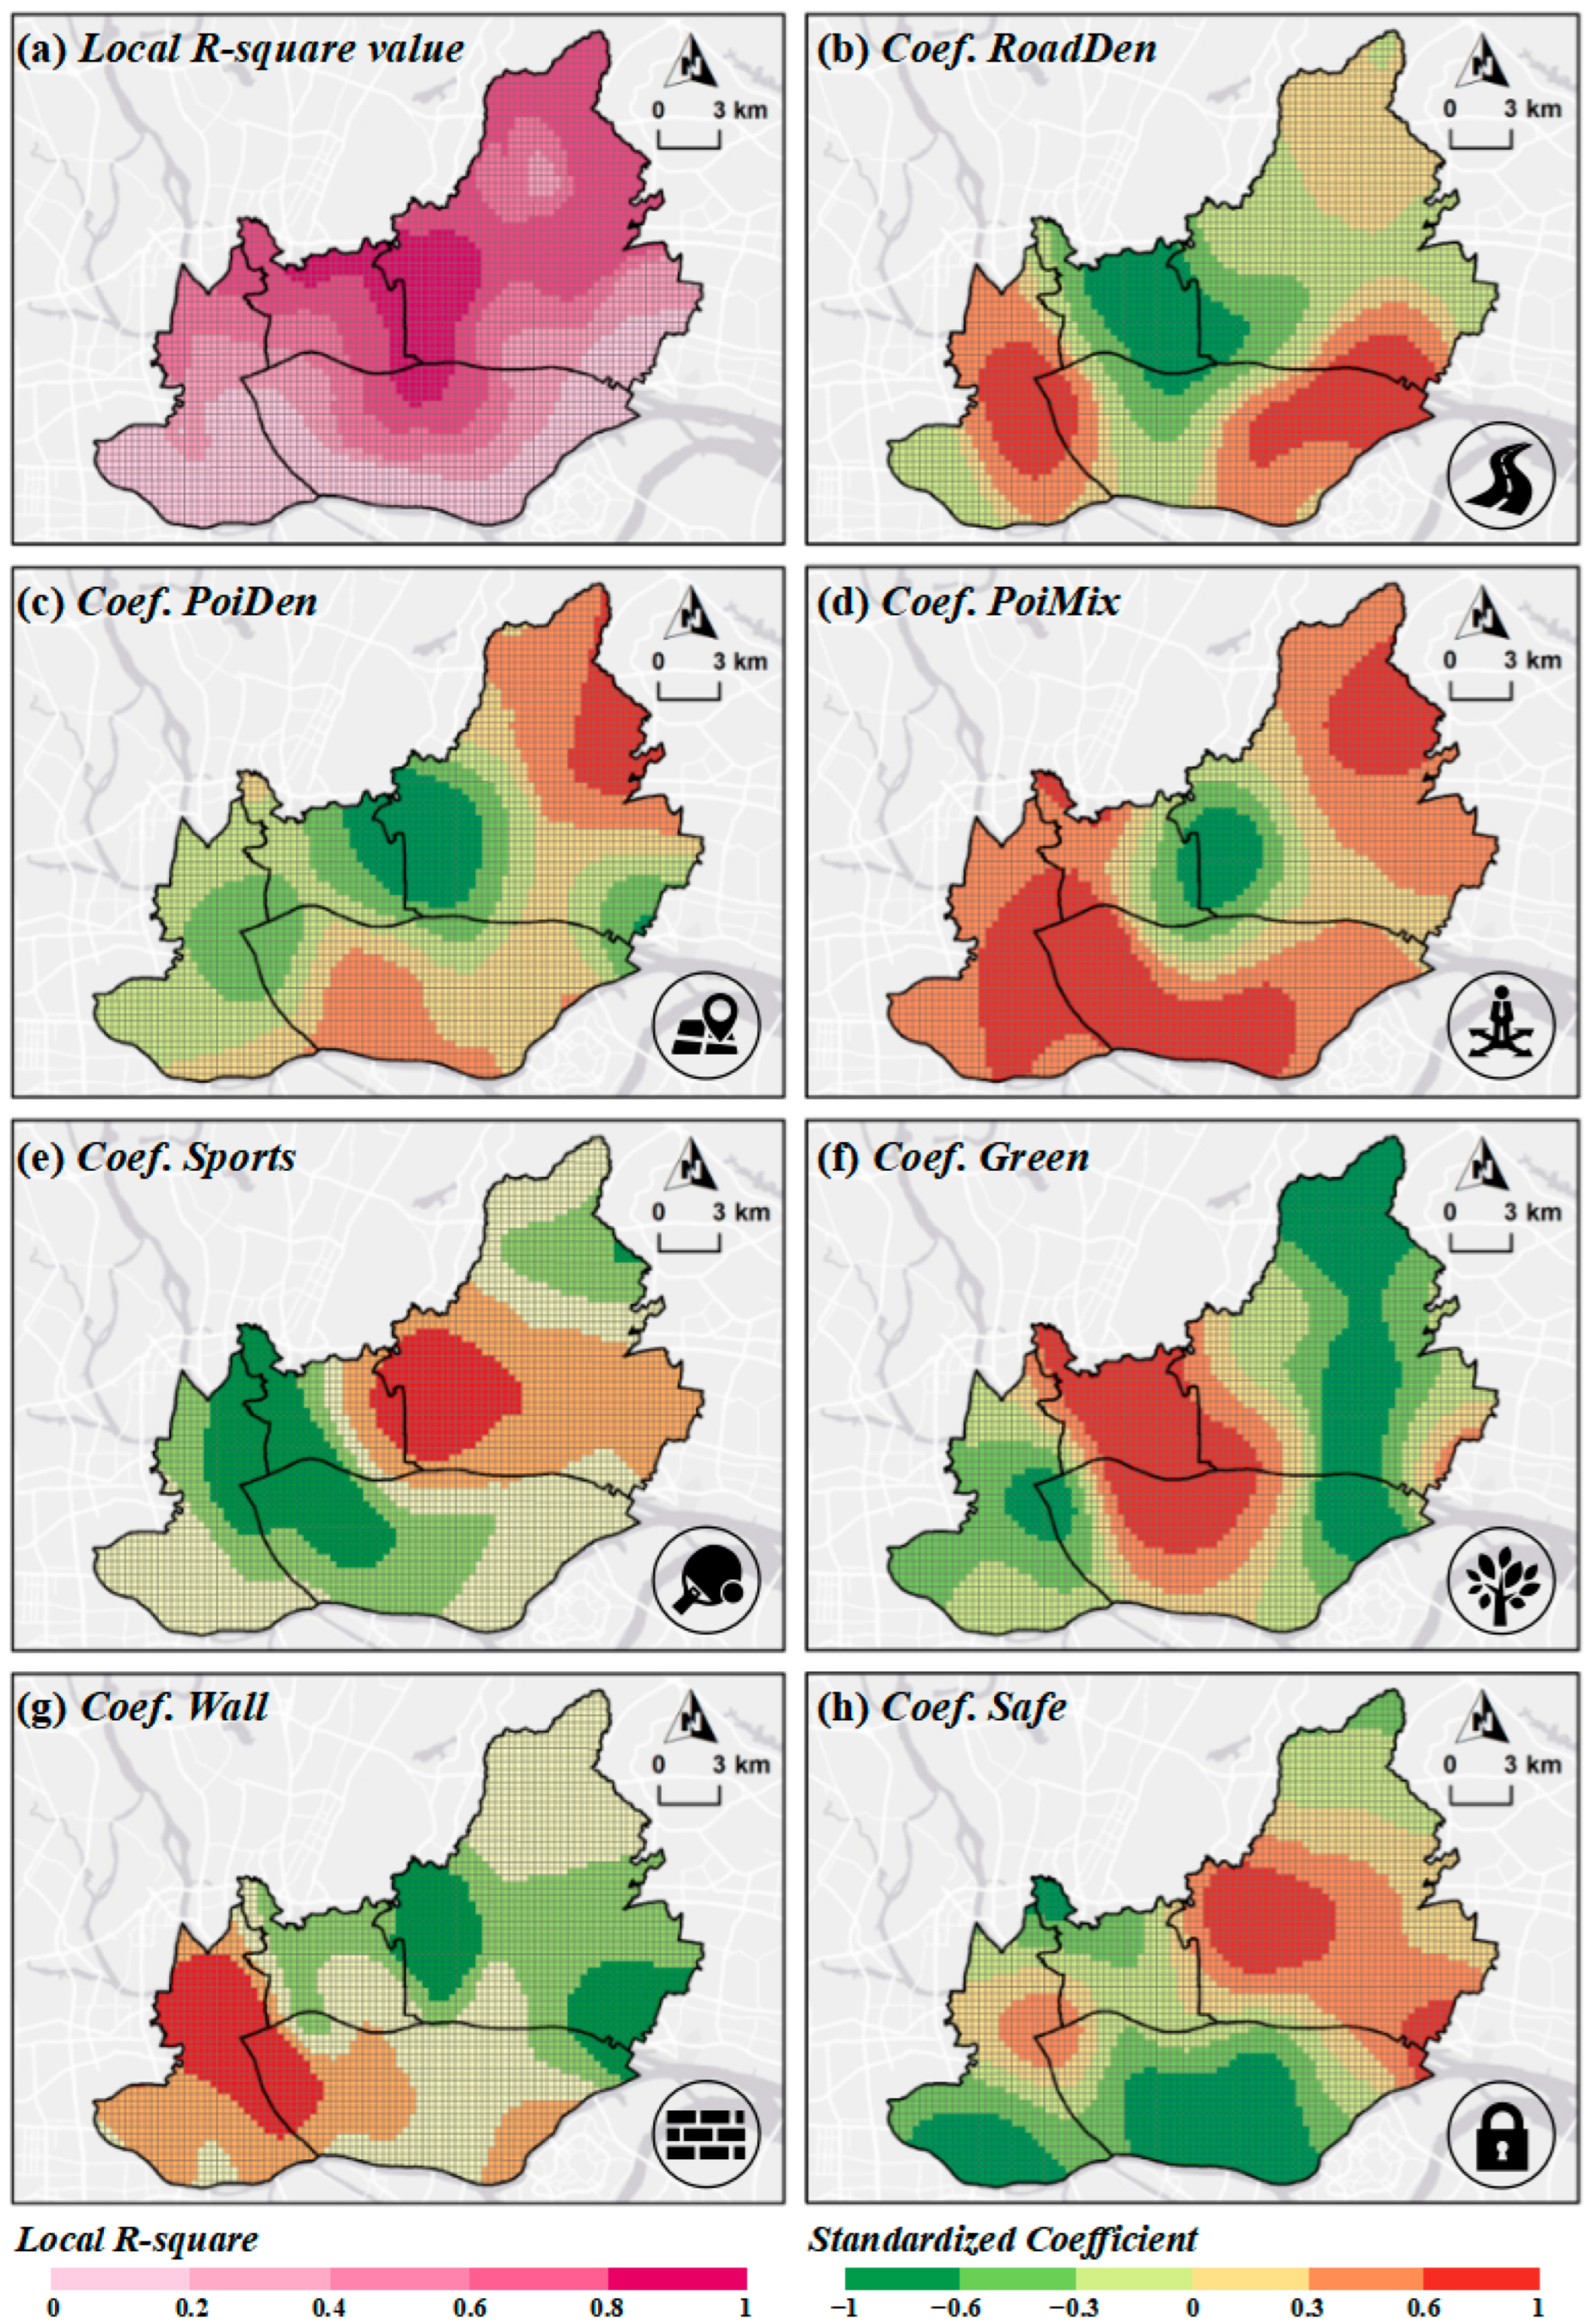
3.4. Spatial Heterogeneity of the Impacts of Factors on Jogging Activities Based on the GWR Model

The previous sections utilized the BSR model and the OPGD model to analyze the differences in the impact of factors on the distribution of outdoor jogging activities from different perspectives. However, these analyses did not address the spatial variations in these impacts. Therefore, this study further introduced a GWR model to explore the spatial heterogeneity of the influencing factors on the distribution of jogging activities. The parameters estimated by the global BSR model and the local GWR model are detailed in Table 6. First, it was noted that the global model’s residuals did not satisfy the assumption of independence, as indicated by a significantly positive Moran’s I (Moran’s I > 0.3, p-value = 0.001). To correct this issue, the GWR model was utilized. Implementing the GWR model resulted in remarkable enhancements. First, the adjusted R2 values rose from 0.574 to 0.635, demonstrating the inclusion of neighboring observations in the regression process, which is a key feature of the GWR model. Furthermore, the AICc decreased from 265.124 in the global model to 260.017 in the local model, confirming the superiority of the GWR model over the traditional global regression model.
Figure 12a illustrates the spatial distribution of the local R2 value in downtown Guangzhou, ranging from 0.197 to 0.854. Notably, the areas with higher R2 values are concentrated in the southwestern part of the Tianhe District, the eastern and northern parts of the Yuexiu District, and the northern part of the Haizhu District. These regions also correspond to higher dependent variable values (jogging frequency), indicating that the selected variables exhibited a higher model fit and explanatory power for the dependent variable in these areas. Additionally, Figure 12b–h displays the local coefficients of seven significant influencing factors, all reflecting varying degrees of spatial non-stationarity. For instance, in the western part of the Tianhe District and the eastern part of the Yuexiu District, the density of outdoor sports facilities (Sports) showed a positive correlation with jogging frequency, while in the western part of the Yuexiu District, the northeastern part of the Liwan District, and the northwestern part of the Haizhu District, this relationship was negative (Figure 12e). The diversity of facility distribution (PoiMix) exhibited the opposite pattern. The results indicate that the spatial non-stationarity effects of significant factors on jogging frequency are significant, suggesting that the influence of various environmental elements on joggers should be further explored based on the specific local characteristics of different regions.
The local correlation between Road and jogging frequency exhibited a negative association in the central areas (primarily the Yuexiu District and the southwestern part of the Tianhe District), whereas a positive correlation was observed in the peripheral regions (the central area of the Liwan District, the northeastern part of the Haizhu District, and the southeastern part of the Tianhe District) (Figure 12b). On the one hand, the central areas are characterized by the highest road network density within the study area, which is typically accompanied by increased traffic flow and congestion [67,68]. Joggers may avoid these areas to circumvent congestion and mitigate the risk of accidents with motor vehicles. On the other hand, in contrast to the city center, the peripheral regions experience relatively low traffic volume and land-use density, creating a more favorable overall environment that is conducive to joggers utilizing roads and sidewalks.
The local associations of PoiDen and PoiMix with jogging frequency exhibited similarities, showing significant negative correlations in the central areas, where PoiDen and PoiMix are relatively higher (Figure 12c,d). On the one hand, higher PoiDen and PoiMix values indicate the presence of various types of facilities and commercial activities, attracting large crowds and traffic. These commercial and social activities may disrupt the rhythm of joggers and cause discomfort [2,19,23]. On the other hand, the spatial planning in areas with high PoiMix may prioritize commercial and residential needs over sports and leisure activities, meaning that these areas potentially lack suitable facilities for jogging, such as jogging paths and safe pedestrian zones. This finding is consistent with related studies [46,47,48].
The central areas, including the southwestern part of the Tianhe District and the eastern part of the Yuexiu District, were densely packed with Sports facilities and exhibited a clear positive correlation with jogging activities. For instance, the Tianhe Sports Center and its surroundings not only have well-developed jogging paths but also various types of sports facilities. This area is known for having the strongest sports atmosphere and the most comprehensive sports facilities in Guangzhou. This is consistent with the findings of related studies [20,21,22,41]. While they mainly rely on jogging paths, both pre-jogging warm-ups and post-jogging stretching exercises still require the support of sports facilities. Moreover, areas with a variety of sports facilities tend to attract more joggers [22].
In terms of street perception, Green, Walls, and Safe exhibited spatially differentiated local associations with jogging frequency (Figure 12f–h). First, a significant positive correlation between Green and jogging frequency was primarily observed in the Yuexiu District, the southwestern part of the Tianhe District, and the northern part of the Haizhu District. These areas are characterized by higher levels of greenness, suggesting that areas with more vegetation cover are more attractive for jogging activities; a finding consistent with the related studies [18,19,23]. Second, the positive association between Walls and jogging frequency was mainly distributed in the Liwan District and western Haizhu District, which are old urban areas of Guangzhou, whereas a negative correlation was observed in the more urbanized Tianhe District. According to the related research, Walls identified through SVI often provide a sense of enclosure in jogging activities [47,48,49]. A certain degree of enclosure can create a sense of security for joggers, but excessive enclosure can result in oppressive negative feelings [18]. The negative correlation found in the central Tianhe District might be due to the presence of more commercial and office areas where high walls may be concentrated, leading to an overly enclosed environment. In contrast, as older urban areas, the Liwan District and western Haizhu District have relatively lower walls values compared to the Tianhe District and are likely predominantly residential areas, thus providing a higher sense of security. Third, a significant local positive correlation between Safe and jogging frequency was observed in the central area, specifically in the southwestern part of the Tianhe District, which is the CBD of Guangzhou. Additionally, a secondary positive local association was observed in the secondary central area, at the junction of the districts of Liwan, Yuexiu, and Haizhu. This is consistent with the spatial distribution characteristics of perceived safety. These findings suggest that the higher perceived safety in the CBD provides outdoor joggers with a sense of security from a visual perception standpoint, a finding that aligns with related studies [18,49]. For example, the perception of environmental safety has long been acknowledged as a critical factor affecting not only physical activity but also public mental health [69,70].

4. Discussion

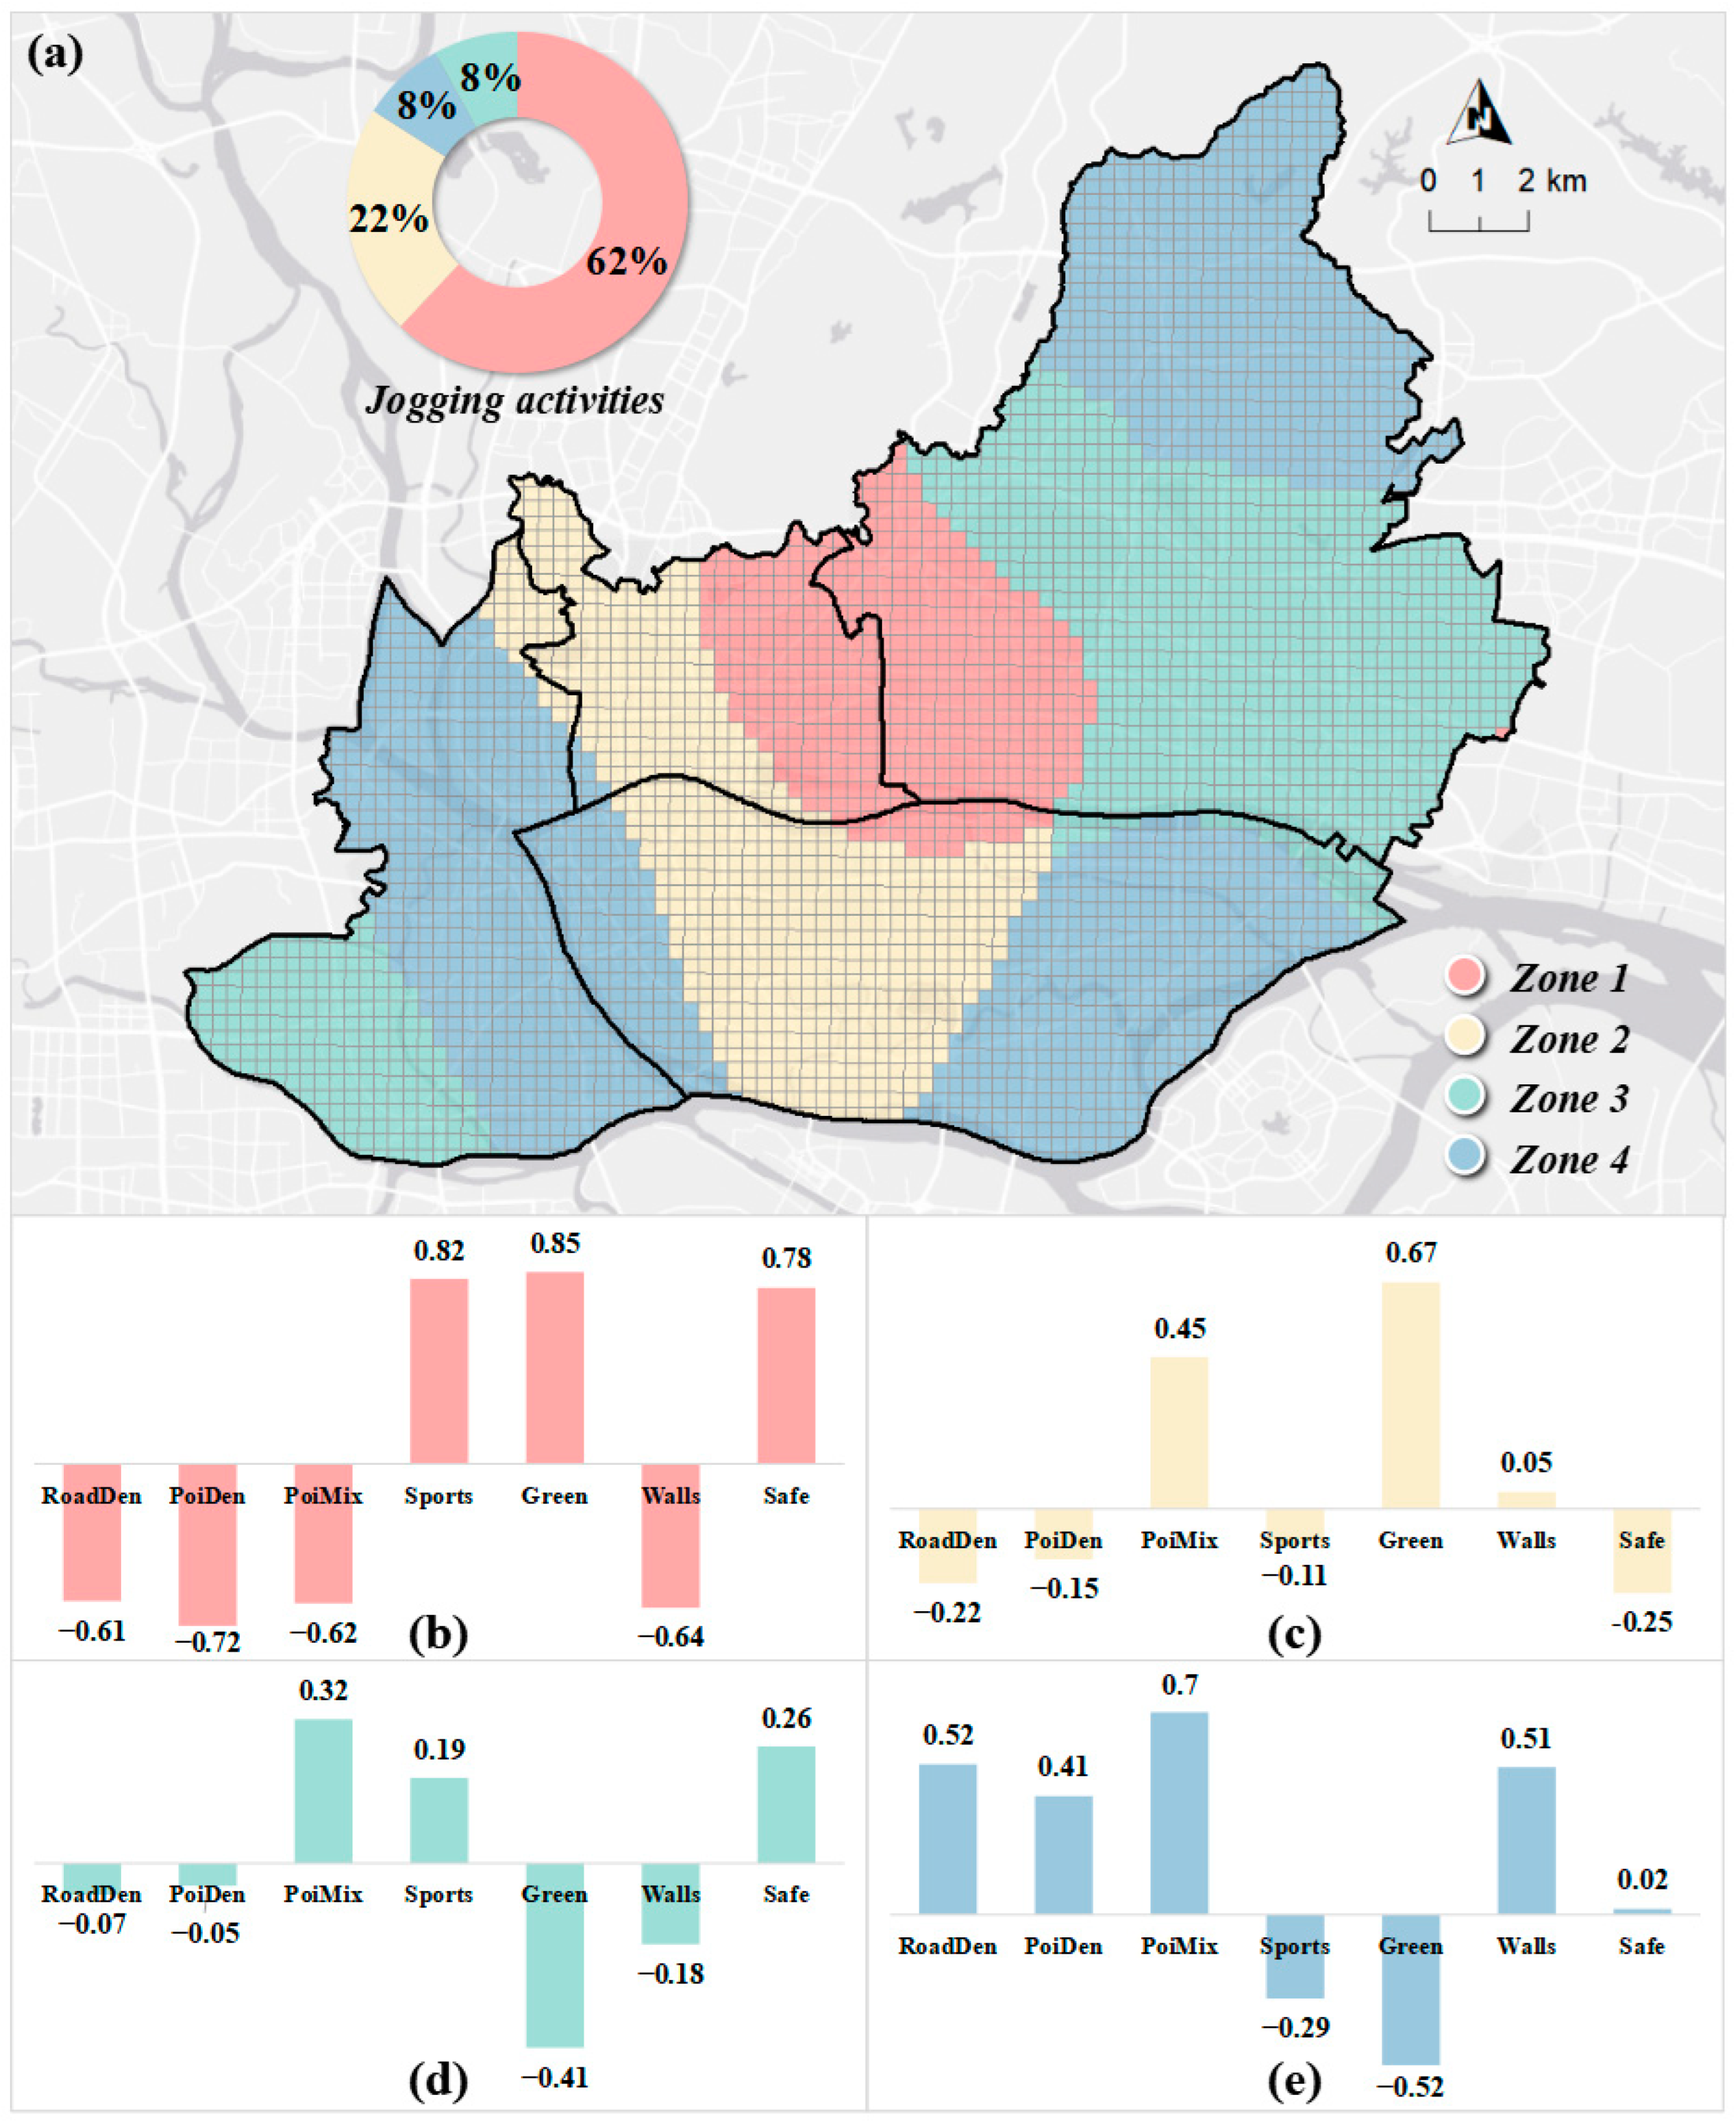
4.1. Urban Planning Implications Based on Zonal Clustering

The previous section explored spatial variations in factors influencing jogging frequency, and they were consistent with previous spatial regression studies [18,21,23]. Due to significant spatial heterogeneity, local coefficient maps alone provide limited insight. To improve understanding, we clustered the study area based on local factor associations with jogging frequency. Using k-means clustering, we determined that four clusters best summarized the GWR model results, leading to the classification of the study area into four distinct zones (Figure 13).
The analysis of Figure 13 should focus on jogging activity frequency and key positive correlations within each cluster. Zones 1 and 2, located centrally, account for 84% of jogging activities. Strategic planning should prioritize enhancing street jogging conditions by improving greenery, diversifying sports facilities, and increasing perceived safety. Studies suggest that both horizontal and vertical greenery enhance street appeal [39,40,45,46]. Despite a high density of sports facilities, Zone 1 needs a better distribution and variety of facilities. Addressing street order and appearance issues, such as illegal parking and deteriorating pavements, will improve safety perception [71,72]. Zone 2, with 22% of jogging activities, requires similar greenery enhancements. Additionally, increased land-use diversity in Zone 2 correlates with higher jogging activity.
Jogging in Zones 3 and 4 accounts for 16% of the total, indicating less popularity. To attract more joggers, Zone 3 should add sports facilities, improve land-use diversity, and enhance street safety perception. Zone 4, further from the city center, benefits from a denser road network, suggesting jogging along roadsides. Strategies here include improving the road network, increasing road density in older and renewing areas, and enhancing land-use diversity. The significant correlation between walls and jogging in Zone 4 indicates the importance of maintaining clean, uniform walls for improved jogger safety.

4.2. Multi-Model Factor Analysis Framework

Current research on jogging behavior often uses single models to analyze factors affecting jogging distribution, which limits comprehensive analysis. This study introduces a multi-model framework combining the strengths of the BSR, OPGD, and GWR models. This approach allows for a more thorough examination by selecting key variables, identifying synergistic effects, and understanding spatial differentiation in jogging behavior.
The BSR model in this study retained only 7 out of 19 initial variables, fewer than in related research [18,19,20,21,22,41], due to its rigorous feature selection process which prioritized variables with substantial impact on the dependent variable. This led to a more concise and explanatory model. Notably, all natural environment variables were excluded, likely because the study area’s flat terrain and joggers’ preference for visible, immediate environmental factors like street greenery and safety outweighs long-term climatic conditions [18,19]. This finding aligns with other studies that also omitted natural environment variables [20,21,41,73].
Most studies on jogging behavior mechanisms typically conclude with model interpretations and broad policy implications, often lacking specificity and practical utility, especially when the spatial context is not considered. To address this limitation, after analyzing spatial effects on jogging distribution using the GWR model, this study introduces a k-means clustering method based on local variables. This approach categorizes the study area into clusters with similar influencing factors, enabling the formulation of more targeted and effective planning and management strategies.

4.3. Integrating Remote Sensing and Social Sensing in Healthy and Sustainable Urban Planning

The integration of multi-source spatiotemporal geographic big data, driven by advancements in technology and interdisciplinary research, has become crucial for remote sensing monitoring, urban simulation, dynamic analysis, and urban planning. Remote sensing, utilizing satellite technology, monitors environmental changes and urban dynamics, while social sensing gathers data from social media and mobile devices to analyze human behaviors within these environments. To achieve sustainable and healthy urban planning, aligning with the United Nations Sustainable Development Goals (SDGs), especially Goals 3 and 11, there is a critical need to merge these two data sources. Remote sensing provides insights into urban environmental changes, and social sensing offers a deep understanding of human behaviors affected by these changes, thus enabling a more comprehensive approach to planning.
Outdoor jogging, a behavior linked to the health and well-being of city residents, exemplifies the need for such an integrated approach. Understanding the spatiotemporal distribution of jogging behavior and its influencing factors requires a focus on both the urban environment and human behavior. This study addressed this need by combining remote sensing and social sensing data, along with advanced models, to analyze outdoor jogging patterns in Guangzhou City. The use of GPS trajectory data, remote sensing data from NTLs, and SVI images, supported by computer vision algorithms and spatial statistical models, allowed for a comprehensive analysis and strategic zoning of outdoor jogging behavior.

4.4. Limitations

This study has several limitations that need to be addressed.
  • Data source limitations: The jogging trajectory data were derived from the Keep fitness app, covering the entire study area for 2019. However, the data lacked temporal specifics and user attributes due to data acquisition constraints. Future research should aim to integrate this big data with survey data obtained through field studies and questionnaires [11].
  • Sampling bias: The data from the fitness app represent a common big data method but are subject to sampling bias, predominantly capturing urban, middle-aged, or young fitness enthusiasts. This results in the “big data paradox,” where children, the elderly, and non-app users are underrepresented [20,21,22,73]. Combining big data with traditional survey methods could mitigate this issue.
  • Spatial unit considerations: The study utilized a 300 m grid for modeling, selected based on jogging trajectory coverage. However, it did not explore results across different grid scales, which raises concerns related to the Modifiable Areal Unit Problem (MAUP). Future research should include multi-scale comparative analyses to address this issue.
  • Incorporation of additional data: Although this study considered various factors, future research could include more detailed, runner-specific data, such as high-resolution temperature data and remote sensing-based thermal comfort indices [74,75].

5. Conclusions

This study presents an analytical framework utilizing multi-source geospatial big data and various models to explore the relationship between environmental factors and outdoor jogging frequency in Guangzhou. Jogging trajectory data were collected from a fitness app, and key influencing factors, including the built environment, street perception, and natural elements, were identified. The framework employs three models: the BSR model for selecting significant variables, the OPGD model for identifying synergistic effects, and the GWR model for assessing spatial heterogeneity. Clustering analysis was conducted to derive urban planning strategies with practical spatial implications, offering a detailed examination of how environmental factors influence jogging behavior. The results indicated the following: (1) Factors related to the built environment and street perception significantly influence jogging frequency distribution, while natural environmental elements had minimal impact in this study. (2) Public sports facilities, greenery levels, and safety perception were identified as key factors influencing jogging activities, representing the three areas of service facilities, objective perceptions, and subjective perceptions, respectively. (3) Specifically, the influence of each factor on jogging activities displayed significant spatial variation. For instance, sports facilities and greenery levels were positively correlated with jogging frequency in the city center where jogging activities were concentrated, whereas the opposite was observed in other areas. (4) Lastly, the study area was divided into four clusters, each representing different local associative characteristics between variables and jogging activities. The planning strategies and recommendations based on the clustering results have significant implications for urban planners’ and policymakers’ ability to foster and enhance the street exercise atmosphere and create jogging-friendly environments.

Author Contributions

Conceptualization, T.S. and F.G.; methodology, T.S. and F.G.; software, T.S. and F.G.; validation, T.S.; formal analysis, T.S. and F.G.; investigation, T.S.; resources, F.G.; data curation, T.S.; writing—original draft preparation, T.S. and F.G.; writing—review and editing, T.S. and F.G.; visualization, T.S. and F.G.; supervision, F.G.; project administration, F.G.; funding acquisition, F.G. All authors have read and agreed to the published version of the manuscript.

Funding

The completion of this work was supported by National Key R&D Program of China (2022YFC3800704-2).

Data Availability Statement

The original contributions presented in the study are included in the article, further inquiries can be directed to the corresponding author.

Conflicts of Interest

Author Feng Gao was employed by the company Guangzhou Urban Planning & Design Survey Research Institute Co., Ltd. The remaining authors declare that the research was conducted in the absence of any commercial or financial relationships that could be construed as a potential conflict of interest.

References

  1. Kaczynski, A.T.; Potwarka, L.R.; Saelens, B.E. Association of Park Size, Distance, and Features with Physical Activity in Neighborhood Parks. Am. J. Public. Health 2008, 98, 1451–1456. [Google Scholar] [CrossRef] [PubMed]
  2. Pretty, J.; Peacock, J.; Sellens, M.; Griffin, M. The Mental and Physical Health Outcomes of Green Exercise. Int. J. Environ. Health Res. 2005, 15, 319–337. [Google Scholar] [CrossRef] [PubMed]
  3. Huang, X.; Lu, G.; Yin, J.; Tan, W. Non-Linear Associations between the Built Environment and the Physical Activity of Children. Transp. Res. Part. D Transp. Environ. 2021, 98, 102968. [Google Scholar] [CrossRef]
  4. Cohen, D.A.; Marsh, T.; Williamson, S.; Derose, K.P.; Martinez, H.; Setodji, C.; McKenzie, T.L. Parks and Physical Activity: Why Are Some Parks Used More than Others? Prev. Med. 2010, 50, S9–S12. [Google Scholar] [CrossRef]
  5. Tian, Z.; Yang, W.; Zhang, T.; Ai, T.; Wang, Y. Characterizing the Activity Patterns of Outdoor Jogging Using Massive Multi-Aspect Trajectory Data. Comput. Environ. Urban. Syst. 2022, 95, 101804. [Google Scholar] [CrossRef]
  6. Huang, D.; Tian, M.; Yuan, L. Sustainable Design of Running Friendly Streets: Environmental Exposures Predict Runnability by Volunteered Geographic Information and Multilevel Model Approaches. Sustain. Cities Soc. 2023, 89, 104336. [Google Scholar] [CrossRef]
  7. Ettema, D. Runnable Cities: How Does the Running Environment Influence Perceived Attractiveness, Restorativeness, and Running Frequency? Environ. Behav. 2016, 48, 1127–1147. [Google Scholar] [CrossRef]
  8. Cook, S.; Shaw, J.; Simpson, P. Jography: Exploring Meanings, Experiences and Spatialities of Recreational Road-Running. Mobilities 2016, 11, 744–769. [Google Scholar] [CrossRef]
  9. Gao, F.; Li, S.; Tan, Z.; Zhang, X.; Lai, Z.; Tan, Z. How Is Urban Greenness Spatially Associated with Dockless Bike Sharing Usage on Weekdays, Weekends, and Holidays? ISPRS Int. J. Geo-Inf. 2021, 10, 238. [Google Scholar] [CrossRef]
  10. Gao, F.; Li, S.; Tan, Z.; Wu, Z.; Zhang, X.; Huang, G.; Huang, Z. Understanding the Modifiable Areal Unit Problem in Dockless Bike Sharing Usage and Exploring the Interactive Effects of Built Environment Factors. Int. J. Geogr. Inf. Sci. 2021, 35, 1905–1925. [Google Scholar] [CrossRef]
  11. Qiao, S.; Yeh, A.G.-O. Understanding the Effects of Environmental Perceptions on Walking Behavior by Integrating Big Data with Small Data. Landsc. Urban. Plan. 2023, 240, 104879. [Google Scholar] [CrossRef]
  12. Yang, L.; Ao, Y.; Ke, J.; Lu, Y.; Liang, Y. To Walk or Not to Walk? Examining Non-Linear Effects of Streetscape Greenery on Walking Propensity of Older Adults. J. Transp. Geogr. 2021, 94, 103099. [Google Scholar] [CrossRef]
  13. Smith, R.A.; Schneider, P.P.; Cosulich, R.; Quirk, H.; Bullas, A.M.; Haake, S.J.; Goyder, E. Socioeconomic Inequalities in Distance to and Participation in a Community-Based Running and Walking Activity: A Longitudinal Ecological Study of Parkrun 2010 to 2019. Health Place 2021, 71, 102626. [Google Scholar] [CrossRef]
  14. Cheng, L.; De Vos, J.; Zhao, P.; Yang, M.; Witlox, F. Examining Non-Linear Built Environment Effects on Elderly’s Walking: A Random Forest Approach. Transp. Res. Part. D Transp. Environ. 2020, 88, 102552. [Google Scholar] [CrossRef]
  15. Chen, E.; Ye, Z.; Wu, H. Nonlinear Effects of Built Environment on Intermodal Transit Trips Considering Spatial Heterogeneity. Transp. Res. Part. D Transp. Environ. 2021, 90, 102677. [Google Scholar] [CrossRef]
  16. Karusisi, N.; Bean, K.; Oppert, J.-M.; Pannier, B.; Chaix, B. Multiple Dimensions of Residential Environments, Neighborhood Experiences, and Jogging Behavior in the RECORD Study. Prev. Med. 2012, 55, 50–55. [Google Scholar] [CrossRef] [PubMed]
  17. Fernandes, A.; Krog, N.H.; McEachan, R.; Nieuwenhuijsen, M.; Julvez, J.; Márquez, S.; De Castro, M.; Urquiza, J.; Heude, B.; Vafeiadi, M.; et al. Availability, Accessibility, and Use of Green Spaces and Cognitive Development in Primary School Children. Environ. Pollut. 2023, 334, 122143. [Google Scholar] [CrossRef] [PubMed]
  18. Dong, L.; Jiang, H.; Li, W.; Qiu, B.; Wang, H.; Qiu, W. Assessing Impacts of Objective Features and Subjective Perceptions of Street Environment on Running Amount: A Case Study of Boston. Landsc. Urban. Plan. 2023, 235, 104756. [Google Scholar] [CrossRef]
  19. Jiang, H.; Dong, L.; Qiu, B. How Are Macro-Scale and Micro-Scale Built Environments Associated with Running Activity? The Application of Strava Data and Deep Learning in Inner London. ISPRS Int. J. Geo-Inf. 2022, 11, 504. [Google Scholar] [CrossRef]
  20. Yang, W.; Hu, J.; Liu, Y.; Guo, W. Examining the Influence of Neighborhood and Street-Level Built Environment on Fitness Jogging in Chengdu, China: A Massive GPS Trajectory Data Analysis. J. Transp. Geogr. 2023, 108, 103575. [Google Scholar] [CrossRef]
  21. Yang, W.; Li, Y.; Liu, Y.; Fan, P.; Yue, W. Environmental Factors for Outdoor Jogging in Beijing: Insights from Using Explainable Spatial Machine Learning and Massive Trajectory Data. Landsc. Urban. Plan. 2024, 243, 104969. [Google Scholar] [CrossRef]
  22. Yang, W.; Fei, J.; Li, Y.; Chen, H.; Liu, Y. Unraveling Nonlinear and Interaction Effects of Multilevel Built Environment Features on Outdoor Jogging with Explainable Machine Learning. Cities 2024, 147, 104813. [Google Scholar] [CrossRef]
  23. Yang, W.; Chen, H.; Li, J.; Guo, W.; Fei, J.; Li, Y.; He, J. How Does Visual Environment Affect Outdoor Jogging Behavior? Insights from Large-Scale City Images and GPS Trajectories. Urban. For. Urban. Green. 2024, 95, 128291. [Google Scholar] [CrossRef]
  24. Nixon, D.V. A Sense of Momentum: Mobility Practices and Dis/Embodied Landscapes of Energy Use. Environ. Plan. A 2012, 44, 1661–1678. [Google Scholar] [CrossRef]
  25. Krenichyn, K. ‘The Only Place to Go and Be in the City’: Women Talk about Exercise, Being Outdoors, and the Meanings of a Large Urban Park. Health Place. 2006, 12, 631–643. [Google Scholar] [CrossRef]
  26. Boakye, K.A.; Amram, O.; Schuna, J.M.; Duncan, G.E.; Hystad, P. GPS-Based Built Environment Measures Associated with Adult Physical Activity. Health Place. 2021, 70, 102602. [Google Scholar] [CrossRef]
  27. Yang, L.; Yang, H.; Yu, B.; Lu, Y.; Cui, J.; Lin, D. Exploring Non-Linear and Synergistic Effects of Green Spaces on Active Travel Using Crowdsourced Data and Interpretable Machine Learning. Travel. Behav. Soc. 2024, 34, 100673. [Google Scholar] [CrossRef]
  28. Fletcher, O. ‘Friendly’ and ‘Noisy Surveillance’ through MapMyRun during the COVID-19 Pandemic. Geoforum 2022, 133, 11–19. [Google Scholar] [CrossRef]
  29. Huang, D.; Jiang, B.; Yuan, L. Analyzing the Effects of Nature Exposure on Perceived Satisfaction with Running Routes: An Activity Path-Based Measure Approach. Urban. For. Urban. Green. 2022, 68, 127480. [Google Scholar] [CrossRef]
  30. Shi, H. From Trajectories to Network: Delineating the Spatial Pattern of Recreational Walking in Guangzhou. Appl. Geogr. 2024, 170, 103344. [Google Scholar] [CrossRef]
  31. Mooney, S.J.; Sheehan, D.M.; Zulaika, G.; Rundle, A.G.; McGill, K.; Behrooz, M.R.; Lovasi, G.S. Quantifying Distance Overestimation From Global Positioning System in Urban Spaces. Am. J. Public. Health 2016, 106, 651–653. [Google Scholar] [CrossRef]
  32. Zhang, X.; Gao, F.; Liao, S.; Zhou, F.; Cai, G.; Li, S. Portraying Citizens’ Occupations and Assessing Urban Occupation Mixture with Mobile Phone Data: A Novel Spatiotemporal Analytical Framework. ISPRS Int. J. Geo-Inf. 2021, 10, 392. [Google Scholar] [CrossRef]
  33. Deng, X.; Gao, F.; Liao, S.; Li, S. Unraveling the Association between the Built Environment and Air Pollution from a Geospatial Perspective. J. Clean. Prod. 2023, 386, 135768. [Google Scholar] [CrossRef]
  34. Lin, J.; Luo, S.; Huang, Y. Poverty Estimation at the County Level by Combining LuoJia1-01 Nighttime Light Data and Points of Interest. Geocarto Int. 2022, 37, 3590–3606. [Google Scholar] [CrossRef]
  35. Zheng, Z.; Chen, Y.; Wu, Z.; Ye, X.; Guo, G.; Qian, Q. The Desaturation Method of DMSP/OLS Nighttime Light Data Based on Vector Data: Taking the Rapidly Urbanized China as an Example. Int. J. Geogr. Inf. Sci. 2019, 33, 431–453. [Google Scholar] [CrossRef]
  36. Yang, Z.; Chen, Y.; Guo, G.; Zheng, Z.; Wu, Z. Using Nighttime Light Data to Identify the Structure of Polycentric Cities and Evaluate Urban Centers. Sci. Total Environ. 2021, 780, 146586. [Google Scholar] [CrossRef] [PubMed]
  37. Zhang, Q.; Zheng, Z.; Wu, Z.; Cao, Z.; Luo, R. Using Multi-Source Geospatial Information to Reduce the Saturation Problem of DMSP/OLS Nighttime Light Data. Remote Sens. 2022, 14, 3264. [Google Scholar] [CrossRef]
  38. Jie, N.; Cao, X.; Zhuo, L. Identifying the Central Business Districts of Global Megacities Using Nighttime Light Remote Sensing Data. Int. J. Digit. Earth 2024, 17, 2356118. [Google Scholar] [CrossRef]
  39. Sarkar, C.; Webster, C.; Pryor, M.; Tang, D.; Melbourne, S.; Zhang, X.; Jianzheng, L. Exploring Associations between Urban Green, Street Design and Walking: Results from the Greater London Boroughs. Landsc. Urban. Plan. 2015, 143, 112–125. [Google Scholar] [CrossRef]
  40. Tang, Z.; Ye, Y.; Jiang, Z.; Fu, C.; Huang, R.; Yao, D. A Data-Informed Analytical Approach to Human-Scale Greenway Planning: Integrating Multi-Sourced Urban Data with Machine Learning Algorithms. Urban. For. Urban. Green. 2020, 56, 126871. [Google Scholar] [CrossRef]
  41. Liu, Y.; Li, Y.; Yang, W.; Hu, J. Exploring Nonlinear Effects of Built Environment on Jogging Behavior Using Random Forest. Appl. Geogr. 2023, 156, 102990. [Google Scholar] [CrossRef]
  42. Cervero, R.; Kockelman, K. Travel Demand and the 3Ds: Density, Diversity, and Design. Transp. Res. Part. D Transp. Environ. 1997, 2, 199–219. [Google Scholar] [CrossRef]
  43. Ewing, R.; Cervero, R. Travel and the Built Environment: A Meta-Analysis. J. Am. Plan. Assoc. 2010, 76, 265–294. [Google Scholar] [CrossRef]
  44. Zhao, H.; Shi, J.; Qi, X.; Wang, X.; Jia, J. Pyramid Scene Parsing Network. In Proceedings of the 2017 IEEE Conference on Computer Vision and Pattern Recognition (CVPR), Honolulu, HI, USA, 21–26 July 2017; IEEE: Piscataway, NJ, USA, 2017; pp. 6230–6239. [Google Scholar]
  45. Ki, D.; Lee, S. Analyzing the Effects of Green View Index of Neighborhood Streets on Walking Time Using Google Street View and Deep Learning. Landsc. Urban. Plan. 2021, 205, 103920. [Google Scholar] [CrossRef]
  46. Li, X.; Zhang, C.; Li, W.; Kuzovkina, Y.A.; Weiner, D. Who Lives in Greener Neighborhoods? The Distribution of Street Greenery and Its Association with Residents’ Socioeconomic Conditions in Hartford, Connecticut, USA. Urban. For. Urban. Green. 2015, 14, 751–759. [Google Scholar] [CrossRef]
  47. Schuurman, N.; Rosenkrantz, L.; Lear, S.A. Environmental Preferences and Concerns of Recreational Road Runners. Int. J. Environ. Res. Public Health 2021, 18, 6268. [Google Scholar] [CrossRef]
  48. Fylan, F.; King, M.; Brough, D.; Black, A.A.; King, N.; Bentley, L.A.; Wood, J.M. Increasing Conspicuity on Night-Time Roads: Perspectives from Cyclists and Runners. Transp. Res. Part. F Traffic Psychol. Behav. 2020, 68, 161–170. [Google Scholar] [CrossRef]
  49. Shashank, A.; Schuurman, N.; Copley, R.; Lear, S. Creation of a Rough Runnability Index Using an Affordance-Based Framework. Environ. Plan. B Urban. Anal. City Sci. 2022, 49, 321–334. [Google Scholar] [CrossRef]
  50. Wang, R.; Ren, S.; Zhang, J.; Yao, Y.; Wang, Y.; Guan, Q. A Comparison of Two Deep-Learning-Based Urban Perception Models: Which One Is Better? Comput.Urban. Sci. 2021, 1, 3. [Google Scholar] [CrossRef]
  51. Yao, Y.; Liang, Z.; Yuan, Z.; Liu, P.; Bie, Y.; Zhang, J.; Wang, R.; Wang, J.; Guan, Q. A Human-Machine Adversarial Scoring Framework for Urban Perception Assessment Using Street-View Images. Int. J. Geogr. Inf. Sci. 2019, 33, 2363–2384. [Google Scholar] [CrossRef]
  52. Dubey, A.; Naik, N.; Parikh, D.; Raskar, R.; Hidalgo, C.A. Deep Learning the City: Quantifying Urban Perception at a Global Scale. In Computer Vision–ECCV 2016; Leibe, B., Matas, J., Sebe, N., Welling, M., Eds.; Lecture Notes in Computer Science; Springer International Publishing: Cham, Switzerland, 2016; Volume 9905, pp. 196–212. ISBN 978-3-319-46447-3. [Google Scholar]
  53. Qiu, W.; Zhang, Z.; Liu, X.; Li, W.; Li, X.; Xu, X.; Huang, X. Subjective or Objective Measures of Street Environment, Which Are More Effective in Explaining Housing Prices? Landsc. Urban. Plan. 2022, 221, 104358. [Google Scholar] [CrossRef]
  54. Zhang, F.; Zhou, B.; Liu, L.; Liu, Y.; Fung, H.H.; Lin, H.; Ratti, C. Measuring Human Perceptions of a Large-Scale Urban Region Using Machine Learning. Landsc. Urban. Plan. 2018, 180, 148–160. [Google Scholar] [CrossRef]
  55. Zhang, F.; Zu, J.; Hu, M.; Zhu, D.; Kang, Y.; Gao, S.; Zhang, Y.; Huang, Z. Uncovering Inconspicuous Places Using Social Media Check-Ins and Street View Images. Comput. Environ. Urban. Syst. 2020, 81, 101478. [Google Scholar] [CrossRef]
  56. Xu, J.; Liu, Y.; Liu, Y.; An, R.; Tong, Z. Integrating Street View Images and Deep Learning to Explore the Association between Human Perceptions of the Built Environment and Cardiovascular Disease in Older Adults. Soc. Sci. Med. 2023, 338, 116304. [Google Scholar] [CrossRef]
  57. Li, S.; Lyu, D.; Huang, G.; Zhang, X.; Gao, F.; Chen, Y.; Liu, X. Spatially Varying Impacts of Built Environment Factors on Rail Transit Ridership at Station Level: A Case Study in Guangzhou, China. J. Transp. Geogr. 2020, 82, 102631. [Google Scholar] [CrossRef]
  58. Li, S.; Lyu, D.; Liu, X.; Tan, Z.; Gao, F.; Huang, G.; Wu, Z. The Varying Patterns of Rail Transit Ridership and Their Relationships with Fine-Scale Built Environment Factors: Big Data Analytics from Guangzhou. Cities 2020, 99, 102580. [Google Scholar] [CrossRef]
  59. Song, Y.; Wang, J.; Ge, Y.; Xu, C. An Optimal Parameters-Based Geographical Detector Model Enhances Geographic Characteristics of Explanatory Variables for Spatial Heterogeneity Analysis: Cases with Different Types of Spatial Data. GIScience Remote Sens. 2020, 57, 593–610. [Google Scholar] [CrossRef]
  60. Wang, J.; Li, X.; Christakos, G.; Liao, Y.; Zhang, T.; Gu, X.; Zheng, X. Geographical Detectors-Based Health Risk Assessment and Its Application in the Neural Tube Defects Study of the Heshun Region, China. Int. J. Geogr. Inf. Sci. 2010, 24, 107–127. [Google Scholar] [CrossRef]
  61. Gao, F.; Jiao, Z.; Liao, S.; Liu, R.; Hu, Z.; Liu, Y.; Li, H.; Chen, W.; Chen, X.; Li, G. Summer Electricity Consumption and Its Drivers in Urban Areas. Appl. Geogr. 2024, 164, 103223. [Google Scholar] [CrossRef]
  62. Gao, F.; Deng, X.; Liao, S.; Liu, Y.; Li, H.; Li, G.; Chen, W. Portraying Business District Vibrancy with Mobile Phone Data and Optimal Parameters-Based Geographical Detector Model. Sustain. Cities Soc. 2023, 96, 104635. [Google Scholar] [CrossRef]
  63. Jiang, R.; Wu, P.; Song, Y.; Wu, C.; Wang, P.; Zhong, Y. Factors Influencing the Adoption of Renewable Energy in the U.S. Residential Sector: An Optimal Parameters-Based Geographical Detector Approach. Renew. Energy 2022, 201, 450–461. [Google Scholar] [CrossRef]
  64. Fotheringham, A.; Brunsdon, C.F.; Charlton, M. Geographically Weighted Regression: The Analysis of Spatially Varying Relationships; John Wiley & Sons: Hoboken, NJ, USA, 2003. [Google Scholar]
  65. Hartigan, J.A.; Wang, M.A. A K-Means Clustering Algorithm. Appl. Stat. 1979, 28, 100–108. [Google Scholar] [CrossRef]
  66. Liao, S.; Gao, F.; Feng, L.; Wu, J.; Wang, Z.; Chen, W. Observed Equity and Driving Factors of Automated External Defibrillators: A Case Study Using WeChat Applet Data. ISPRS Int. J. Geo-Inf. 2023, 12, 444. [Google Scholar] [CrossRef]
  67. Wang, X.; Zhou, Q.; Yang, J.; You, S.; Song, Y.; Xue, M. Macro-Level Traffic Safety Analysis in Shanghai, China. Accid. Anal. Prev. 2019, 125, 249–256. [Google Scholar] [CrossRef] [PubMed]
  68. Wang, X.; Zhou, Q.; Quddus, M.; Fan, T.; Fang, S. Speed, Speed Variation and Crash Relationships for Urban Arterials. Accid. Anal. Prev. 2018, 113, 236–243. [Google Scholar] [CrossRef] [PubMed]
  69. Borgers, J.; Vanreusel, B.; Vos, S.; Forsberg, P.; Scheerder, J. Do Light Sport Facilities Foster Sports Participation? A Case Study on the Use of Bark Running Tracks. Int. J. Sport. Policy Politics 2016, 8, 287–304. [Google Scholar] [CrossRef]
  70. Ulrich, R.S.; Simons, R.F.; Losito, B.D.; Fiorito, E.; Miles, M.A.; Zelson, M. Stress Recovery during Exposure to Natural and Urban Environments. J. Environ. Psychol. 1991, 11, 201–230. [Google Scholar] [CrossRef]
  71. Hamim, O.F.; Ukkusuri, S.V. Towards Safer Streets: A Framework for Unveiling Pedestrians’ Perceived Road Safety Using Street View Imagery. Accid. Anal. Prev. 2024, 195, 107400. [Google Scholar] [CrossRef]
  72. Cui, Q.; Zhang, Y.; Yang, G.; Huang, Y.; Chen, Y. Analysing Gender Differences in the Perceived Safety from Street View Imagery. Int. J. Appl. Earth Obs. Geoinf. 2023, 124, 103537. [Google Scholar] [CrossRef]
  73. Liu, Y.; Hu, J.; Yang, W.; Luo, C. Effects of Urban Park Environment on Recreational Jogging Activity Based on Trajectory Data: A Case of Chongqing, China. Urban. For. Urban. Green. 2022, 67, 127443. [Google Scholar] [CrossRef]
  74. Yang, Z.; Peng, J.; Jiang, S.; Yu, X.; Hu, T. Optimizing Building Spatial Morphology to Alleviate Human Thermal Stress. Sustain. Cities Soc. 2024, 106, 105386. [Google Scholar] [CrossRef]
  75. Zhang, H.; Luo, M.; Zhao, Y.; Lin, L.; Ge, E.; Yang, Y.; Ning, G.; Cong, J.; Zeng, Z.; Gui, K.; et al. HiTIC-Monthly: A Monthly High Spatial Resolution (1 Km) Human Thermal Index Collection over China during 2003–2020. Earth Syst. Sci. Data 2023, 15, 359–381. [Google Scholar] [CrossRef]
Figure 1. Location of the study area.
Remotesensing 16 03056 g001
Figure 2. The workflow of the study includes data collection (a), variable selection (b), and multi-modeling and clustering (c).
Remotesensing 16 03056 g002
Figure 3. Spatial distribution of jogging trajectories, including three popular spots: Ersha Island (a), the Sports Center (b), and Tianhe Park (c).
Remotesensing 16 03056 g003
Figure 4. Spatial distribution of sampling points (a) and a sample of SVI data (b).
Remotesensing 16 03056 g004
Figure 5. The Luojia 1-01 NTLs data before (a,c) and after geometric calibration (b,d).
Remotesensing 16 03056 g005
Figure 6. Samples of SVI images (a) and the semantic segmentation results (b) based on the PSPNet and ADE20K datasets.
Remotesensing 16 03056 g006
Figure 7. Workflow of extracting subjective perceptions based on SVI.
Remotesensing 16 03056 g007
Figure 8. Spatial distribution of the length of jogging trajectories of each grid (a) and the hot spot analysis (b).
Remotesensing 16 03056 g008
Figure 9. Spatial distribution of the significant variables including jogging frequency (a), RoadDen (b), PoiDen (c), PoiMix (d), Sports (e), Green (f), Wall (g), and Safe (h).
Remotesensing 16 03056 g009
Figure 10. Processes (a) and results (b) of spatial discretization optimization of OPGD model.
Remotesensing 16 03056 g010
Figure 11. Results of the OPGD model: factor detector model (a) and interaction detector model (b).
Remotesensing 16 03056 g011
Figure 12. Spatial distribution of the local R-squared value (a), and the local coefficients of RoadDen (b), PoiDen (c), PoiMix (d), Sports (e), Green (f), Wall (g), and Safe (h).
Remotesensing 16 03056 g012
Figure 13. Clustering results based on GWR coefficients (a), and the local coefficient statistics of the four clusters (be).
Remotesensing 16 03056 g013
Table 1. Data sources and formats.
CategoriesVariablesMethod/Data SourceReference
Built Environment Population density (PopDen)Census data, social media user density data[18,19,20,21,22,23]
Road density (RoadDen)Road density, the angular distance-based accessibility based on Space Syntax[18,39,40]
Public transport (Trans)Density of metro stations and
bus stops
[18,20,41]
Facility density (PoiDen)Density of POIs[18]
Facility diversity (PoiMix)Shannon entropy of POIs[21,22]
Sports facility density (Sports)Density of sports facilities[20]
Residential density (Resi)Density of residential communities
Park (Park)Distance to park[21]
Nighttime lighting (NTL)The mean DN value of NTL[18,19]
Building density (BldDen)Total building base area divided by total area[21,22]
Street Perception Green view index (Green)The mean pixel ratio[18,19,20,21]
Sky view index (Sky)The mean pixel ratio[18,19,20,21]
Wall (Wall)The mean pixel ratio[18,19]
Perceived safety (Safe)The mean of road/grid[18]
Perceived liveliness (Live)The mean of road/grid[18]
Natural Environment Temperature (TEM)Annual mean value, IDW[22,23]
Air quality (AQ)Annual mean value, IDW[22,23]
Slope (Slope)The mean slope of road/grid[18,19]
Water (Water)Distance to body of water /river[20,21]
Table 2. The descriptive statistics of all variables.
CategoriesVariablesMeanS.D.
Built
Environment
PopDen (/km2)1128907
RoadDen (km/km2)906.599520.972
Trans (/km2)8.97110.056
PoiDen (/km2)791.0061104.677
PoiMix0.7140.694
Sports (/km2)4.3786.047
Resi (/km2)28.78426.012
Park (km)8.64710.579
NTL0.6540.457
BldDen0.3660.285
Street
Perception
Green0.3020.172
Sky0.2330.208
Walls0.3620.165
Safe0.2350.167
Live0.2240.174
Natural
Environment
TEM (℃)32.7882.658
AQ ( μ g / m 3 )21.3782.551
Slope (°)3.2643.773
Water (km)18.10320.017
Table 3. Results of the BSR model.
CategoriesVariablesCoefficient
Built Environment PopDen-
RoadDen0.102 ***
Trans-
PoiDen−0.014 **
PoiMix0.304 ***
Sports0.514 ***
Resi-
Park-
NTL-
BldDen-
Street Perception Green0.318 ***
Sky-
Walls0.211 ***
Safe0.157 ***
Live-
Natural Environment TEM-
AQ-
Slope-
Water-
Constant10.871
R20.582
Adj R20.574
“-” means that the variable was eliminated in the model, *** p ≤ 0.01; ** p ≤ 0.05.
Table 4. The optimal combination of variables.
VariablesDiscretization MethodNo. of Intervals
RoadDenEqual6
PoiDenQuantile6
PoiMixEqual6
SportsEqual6
GreenNatural6
WallsEqual6
SafeNatural6
Table 5. Top five pairs of variables in the factor detector sub-model.
Rank Pairs   ( x i x j )Synergistic q Value Compared   with   x i Compared   with   x j
1SportsGreen0.477+90.1%+120.4%
2SportsSafe0.356+41.9%+120.8%
3SportsPoiMix0.346+37.9%+416.4%
4SportsWalls0.342+36.3%+233.7%
5GreenPoiDen0.340+57.1%+592.5%
Table 6. Global (BSR) and local (GWR) model diagnostics.
DiagnosticsGlobal ModelLocal Model
R20.5820.653
Adjusted R20.5740.635
AICc265.124260.017
Moran’s I (residuals)0.301 (0.00) *0.081 (0.16)
Note: * p ≤ 0.1.
Disclaimer/Publisher’s Note: The statements, opinions and data contained in all publications are solely those of the individual author(s) and contributor(s) and not of MDPI and/or the editor(s). MDPI and/or the editor(s) disclaim responsibility for any injury to people or property resulting from any ideas, methods, instructions or products referred to in the content.

