Article

Estimating Reactivation Times and Velocities of Slow-Moving Landslides via PS-InSAR and Their Relationship with Precipitation in Central Italy

by
Ebrahim Ghaderpour
1,2,*,
Claudia Masciulli
1,2,
Marta Zocchi
1,
Francesca Bozzano
1,2,
Gabriele Scarascia Mugnozza
1,2 and
Paolo Mazzanti
1,2
1
Department of Earth Sciences & CERI Research Centre, Sapienza University of Rome, P.le Aldo Moro, 5, 00185 Rome, Italy
2
NHAZCA s.r.l., Via Vittorio Bachelet, 12, 00185 Rome, Italy
*
Author to whom correspondence should be addressed.
Remote Sens. 2024, 16(16), 3055; https://doi.org/10.3390/rs16163055
Submission received: 2 July 2024 / Revised: 12 August 2024 / Accepted: 19 August 2024 / Published: 20 August 2024

Abstract

:
Monitoring slow-moving landslides is a crucial task for socioeconomic risk prevention and/or mitigation. Persistent scatterer interferometric synthetic aperture radar (PS-InSAR) is an advanced remote sensing method for monitoring ground deformation. In this research, PS-InSAR time series derived from COSMO-SkyMed (descending orbit) and Sentinel-1 (ascending orbit) are analyzed for a region in Central Apennines in Italy. The sequential turning point detection method (STPD) is implemented to detect the trend turning dates and their directions in the PS-InSAR time series within areas of interest susceptible to landslides. The monthly maps of significant turning points and their directions for years 2018, 2019, 2020, and 2021 are produced and classified for four Italian administrative regions, namely, Marche, Umbria, Abruzzo, and Lazio. Monthly global precipitation measurement (GPM) images at 0 . 1 × 0 . 1 spatial resolution and four local precipitation time series are also analyzed by STPD to investigate when the precipitation rate has changed and how they might have reactivated slow-moving landslides. Generally, a strong correlation ( r 0.7 ) is observed between GPM (satellite-based) and local precipitation (station-based) with similar STPD results. Marche and Abruzzo (the coastal regions) have an insignificant precipitation rate while Umbria and Lazio have a significant increase in precipitation from 2017 to 2023. The coastal regions also exhibit relatively lower precipitation amounts. The results indicate a strong correlation between the trend turning dates of the accumulated precipitation and displacement time series, especially for Lazio during summer and fall 2020, where relatively more significant precipitation rate of change is observed. The findings of this study may guide stakeholders and responsible authorities for risk management and mitigating damage to infrastructures.

Graphical Abstract

1. Introduction

Slow-moving landslides creep from millimeters to meters annually and may continue creeping for many years [1]. Though these landslides may not cause casualties, they can not only severely damage infrastructures but can also turn into fast-moving landslides, particularly in mountainous regions. Therefore, it is crucial to detect slow-moving landslides and continuously monitor them to mitigate the risks associated with them. There are several factors that control the motion of these landslides, such as precipitation, groundwater, earthquakes, and human activities [2,3,4]. For example, Fiolleau et al. [5] showed that reactivation of slow-moving landslides occurred during an intense rainfall event after a 7-month drought in their study region. Narcisi et al. [6] demonstrated the impact of temperature and precipitation trend changes on slow-moving landslides using in situ and remote sensing instruments in the Piemonte region, Italy.
Interferometric synthetic aperture radar (InSAR) is a satellite remote sensing technique which allows for studying and evaluating slow-moving landslides in local, regional, and global scales [3,7,8,9]. Decorrelation is a phenomenon that occurs in InSAR signals due to several factors, such as vegetation and atmospheric noise [10,11]. Persistent scatterer InSAR (PS-InSAR) is a rigorous method that identifies pixels with strong and constant reflection over a long period and does not have the decorrelation issue [11,12,13].
Many researchers have studied slow-moving landslides through InSAR, differential InSAR, and PS-InSAR displacement time series and investigated their potential influential factors [14,15,16,17]. For example, Bontemps et al. [18] showed that slow-moving landslides in Peru are triggered by a combination of local earthquakes and precipitation. Zocchi et al. [19] showed the advantage of PS-InSAR time series for investigating the large-scale morpho-evolution of ground deformation in a region in Colorado, United States. Processing displacement data acquired from various remote sensing satellites, such as COSMO-SkyMed (CSK) and Sentinel-1, produce a finer spatio-temporal coverage for more effective monitoring. Bayer et al. [20] utilized InSAR data from the X-band of CSK and the C-band of Sentinel-1 to investigate the temporal deformation response to precipitation in the Northern Apennines of Italy. They found a linear relationship between displacement and rainfall.
PS-InSAR, like other InSAR techniques, still has several issues, such as discontinuities and biases due to phase unwrapping and atmospheric noise [21]. However, the displacement time series of PS-InSAR are still very useful and effective for estimating long-term velocity [11]. The sequential turning point detection (STPD) is a fast and robust method of estimating trend turning points and their directions (DIRs) in InSAR time series [22]. The STPD estimates an optimal trend with continuous linear pieces that best fit the time series. The maximum number of pieces can be selected by users while the algorithm sequentially estimates the dates when the linear trend gradient changes. The STPD has been applied to PS-InSAR time series for detecting turning points that may be due to gradual land subsidence/uplift, or slow-moving landslides, where these types of deformations typically do not cause significant jumps in displacement time series [22,23]. A turning point in a time series corresponds to a time when the gradient changes. In slow-moving landslide studies, the velocity of ground motion is generally considered constant over a long period until it changes due to potential triggers, such as changes in precipitation patterns.
The latest most important seismic sequence that occurred in Central Apennines was the Amatrice–Norcia–Campotosto seismic sequence (2016–2017), whose aftershock patterns were studied by many researchers [24,25,26,27,28]. The mainshocks, which occurred in 2016 in Central Italy, triggered hundreds of landslides, many of which were studied on the field and also through remote sensing technology [29]. Many researchers have also studied post-seismic ground deformation using various measurements. Mandler et al. [30] studied the post-seismic phase of Amatrice–Norcia–Campotosto using the ground displacement time series of the global positioning system. Pousse-Beltran et al. [31] found centimeter-level deformation through Sentinel-1-based InSAR time series after the Norcia earthquake in the Castelluccio basin and the Norcia surface rupture, where the displacements were more apparent from ascending orbit than descending orbit. Salvini et al. [32] processed measurements from global navigation satellite systems and observed planimetric movements toward the northwest–southeast of the complex fault system.
Following this devastating seismic sequence, Central Apennines has experienced many landslides, including slow-moving landslides that were further triggered by precipitation. Most of the landslides in this region already existed, some of them were reactivated, and some others were accelerated [33,34]. Unfortunately, there is a limited number of weather stations in Central Apennines to conduct a rigorous correlation analysis between precipitation and displacement in time and space. Fortunately, the satellite-based global precipitation measurement (GPM) images provide a good approximation for precipitation measurements, although they have a low spatial resolution. The GPM images are employed by many researchers for climate studies and environmental monitoring [35,36,37,38,39]. Estimating the dates of velocity changes in the slow-moving landslides (the reactivation dates) in this region and their correlation with precipitation trend change have not been addressed yet using the recent remote sensing technology. Therefore, the main contributions of this manuscript are as follows:
  • The estimation and mapping PS-InSAR time series trend turning dates and their directions within areas of interest (AOI) susceptible to landslides after the Amatrice–Norcia–Campotosto seismic sequence.
  • The estimation and mapping of the average, overall velocity, trend turning dates and their directions for the GPM images covering the entire study region.
  • The study of the possible effect of precipitation pattern change on ground deformation utilizing GPM, local precipitation, and PS-InSAR time series.
Estimating the dates of slow-moving landslide reactivation through PS-InSAR time series along with estimating their velocity movements and their potential correlations with precipitation pattern are the main novelties of this research. The remaining of this article is organized as follows. Section 2 describes the study region, PS-InSAR and precipitation time series, and STPD. Section 3 demonstrates the results, including the monthly spatial maps of turning points and their directions. The results of precipitation turning points are also presented in this section. Potential causes of velocity changes observed in PS-InSAR time series are discussed in Section 4 in the light of similar studies. Limitations and future directions are also discussed in this section. Finally, Section 5 concludes this article.

2. Materials and Methods

2.1. Study Region

The study region comprises part of the four Italian administrative regions, namely, Marche, Umbria, Abruzzo, and Lazio, that were struck by the Amatrice–Norcia–Campotosto seismic sequence from August 2016 to January 2017 (Figure 1). The boundary of the study region is defined by Autorità di Bacino Distrettuale dell’Appennino Centrale (ABDAC), shown in Figure 1a. The current research carefully examines a subset of 255 landslide bodies, the areas of interest (AOI), interacting with urban planning within the study region, shown in Figure 1b. These landslides were selected based on the intersection of the hydrogeological asset plan (https://aubac.it/piani-di-bacino/piani-di-assetto-idrogeologico, accessed on 1 August 2024) catalogue and AOI defined by ABDAC’s project for assisting post-seismic reconstruction activities. While the hydrogeological asset plans catalogue contains a comprehensive inventory of mapped landslides in the region, the present study focuses specifically on those that have a direct impact on urban areas and infrastructure within the scope of ABDAC’s project. These landslide risk areas have a considerable impact on a broad geographical scope, affecting 102 municipalities distributed across 245 the identified slopes of interest. The analysis carried out is designed to identify and discern landslides characterized by a notable differential displacement within their bodies to drive the development of effective and targeted mitigation solutions. This strategic approach aims to make earthquake-prone sites more resilient and minimize potential effects on people and critical infrastructure.
The seismic events impacted a wide range of geological environments across the entire region, resulting in a complex distribution of ground deformations extending from the epicenter to distant areas (Figure 1c). The present research investigates the morphoevolution of landslides occurring on 245 identified slopes of interest, as illustrated in Figure 1c. These phenomena, recorded in the hydrogeological asset plan inventory and characterized by high to very high hazard levels, are thoroughly analyzed to evaluate the associated risks of acceleration or reactivation stages after rainfall-induced triggers.
From a geological perspective, the region underwent initial tectonic compression during the Miocene to Lower Pliocene, with the emplacement of the Umbria–Marche pelagic basin units onto the Latium–Abruzzi carbonate platform ones, and the subsequent development of strike-slip and normal fault systems during the Late Pliocene to Early Pleistocene extensional phase [41,42,43,44,45,46,47]. The eastern and central parts of the study region comprise calcareous, marly, and dolomitic formations (Umbria–Marche and Latium–Abruzzi successions), along with terrigenous turbiditic deposits [48]. This region is characterized by high relief energy, driving slope processes, such as rockfalls, roto-translational landslides, debris flows, and, to a lesser extent, complex landslides [49,50]. Moving further towards the eastern sector, the prevailing lithologies consist mainly of alternating soft and hard terrigenous lithotypes (marls and pelitic-arenaceous successions). As relief energy gradually diminishes towards the Adriatic coast, landslide phenomena such as flows and slides become more prominent [48]. Eventually, in the periadriatic sector, slopes become gentler, often featuring a stepped-like morphology resulting from the interplay between softer pelitic-sandstone lithotypes and stiffer conglomerate layers. Here, the predominant slope processes primarily involve slides, earth and mud flows [48,51].

2.2. Datasets and Preprocessing

The displacement over the landslide bodies is thoroughly examined using PS data obtained from the Sentinel-1 and CSK satellites for the period 2017–2022, excluding the co-seismic deformation due to the 2016–2017 seismic sequence [52]. The multi-temporal datasets are extracted through the processing of SAR images [11,12]. This extraction is achieved through the application of an advanced differential InSAR technique that allows for detailed monitoring of ground deformation with sub-millimetric precision [53]. The displacement rates obtained from the ascending Sentinel-1 and descending CSK orbital geometries offer a comprehensive analysis on ground deformations within the identified landslides [54]:
  • Sentinel-1 is a constellation comprising two imaging C-band SAR satellites, namely, Sentinel-1 A and B. These satellites are under the operation of the European Space Agency and are part of the Copernicus Program. The constellation offers a revisit time of 6 days and a ground resolution of 5 × 20 m. The ascending PS products are extracted from 305 images of track 117 taken in interferometric wide swath mode, with a 250 km swath [55,56].
  • COSMO-SkyMed (CSK) is a constellation of X-band SAR satellites developed by the Italian Space Agency (ASI) with a revisit time of 16 days and a ground resolution of 3 × 3 m. The HImage (HI) mode of CSK data, with a 40 × 40 km swath, required four tracks (i.e., HI01, HI03, HI04, HI05) to cover AOI with a total of 309 images [57,58].
The processing technique utilized is the persistent scatterers pair SAR Inferferometry [59]. The synergy of CSK products provides high-resolution data, complementing the insights derived from Sentinel-1. While Sentinel-1 offers extensive coverage and frequent revisit capabilities, the inclusion of CSK data brings an additional layer of detail and precision to the overall analysis. By combining the strengths of Sentinel-1’s broad coverage with CSK’s high-resolution capabilities, this integrated approach enhances the accuracy of the analysis by providing a more comprehensive understanding of landslide dynamics.
To show possible correlation between precipitation and displacement trend turning points, four weather locations shown by red squares in Figure 1 are chosen and monthly accumulated precipitations are calculated for the period 2017–2022. The precipitation data are provided by 3Bmeteo s.r.l. downloaded from https://www.3bmeteo.com (accessed on 1 June 2024). Due to a limited number of weather stations, monthly GPM images are also employed for the period 2017–2022 [60]. These images are downloaded using the Google Earth Engine through the command ee.ImageCollection (“NASA/GPM_L3/IMERG_MONTHLY_V07”). The images have spatial resolution of 0 . 1 × 0 . 1 (about 10 km) and are generated monthly. The GPM model calibrates and interpolates all satellite microwave precipitation estimates as well as microwave-calibrated infrared satellite estimates and precipitation gauge analyses.

2.3. Sequential Turning Point Detection (STPD) Revisited

This section reviews the already established STPD, utilized herein for estimating trend turning points and their directions. The STPD sequentially estimates a potential turning point in a segment within a window based on the least-squares fit of a connected linear trend with two linear pieces [22]. The window translates over time, e.g., year by year, and the STPD estimates a potential turning point within each window. All the estimated turning points are re-evaluated at the final step for the entire time series in order to find an optimal connected linear trend with multiple pieces that fit best the entire time series. Mathematically, let S 1 = { y 1 , , y τ } and S 2 = { y τ , , y n } be two sub-segments of a time series segment of size n, where τ is a potential turning point ( 1 < τ < n ). Let
y i = m 1 x i + b 1 + ε i , for 1 i τ ,
y j = m 2 x j + b 2 + ε j , for τ j n .
where m 1 and m 2 are the gradients, b 1 and b 2 are the intercepts, and ε i and ε j are the error terms. The STPD has a forward estimation and a backward estimation within each window. In the forward estimation, m 1 and b 1 in Equation (1) are estimated by the ordinary least-squares method (OLS) [61], and m 2 in Equation (2) is estimated by OLS, where b 2 is replaced by b ^ 2 = m ^ 1 x τ + b ^ 1 with x j x j x τ , τ j n . The residual series, the estimated linear trend with turning point at τ subtracted from the entire segment, is computed for each τ , 1 < τ < n . The potential turning point τ forward , 1 < τ forward < n , is the one minimizing the L2 norm of the residual series. In the backward estimation, time series segment is flipped, and the forward estimation process is performed to estimate the linear trend with a potential turning point. Then the linear trend is flipped to obtain the turning point τ backward , 1 < τ backward < n . Finally, a potential turning point in the time series segment exists if | τ forward τ backward | is zero. In practice, if 0 < | τ forward τ backward | 3 , then the potential turning point may also be the one minimizing the L2 norm of residuals.
After a maximum one statistically significant turning point is estimated within each window, the turning points are re-evaluated based on normalized difference residual index (NDRI), defined as
NDRI = r 1 r 2 r 1 + r 2
where · is the L2 norm, and r 1 and r 2 are the residual series of the first and second time series segments with turning point at t τ , respectively, i.e., r 1 is { y i m ^ 1 x j b ^ 1 , 1 i τ } and r 2 is { y j m ^ 2 x j b ^ 2 , τ j n } . The smaller the absolute value of NDRI, the more likely the estimated turning point is a true turning point and vice versa [22]. Next, if there are two consecutive turning points that are close to each other, e.g., less than one year apart, then the one whose location is farther away from the center of its corresponding window will be eliminated. Finally, using all the remaining turning points, a linear trend with connected pieces is estimated for the entire time series. Suppose that τ 1 , , τ k are the turning points of a time series, and m ^ 0 , m ^ 1 , , m ^ k are their estimated gradients in the same sequential order. For each ( 1 k ), the direction (DIR) of turning point τ is defined as DIR = m ^ m ^ 1 .
In the present work, only non-increasing or non-decreasing PS-InSAR time series are chosen, following the assumptions by Urgilez Vinueza et al. [62]. Then only the time series whose turning points are statistically significant at 99 % confidence level and satisfy the conditions | NDRI | < 0.3 and | DIR | > 0.2 mm/year are considered, where | · | denotes the absolute value. Ghaderpour et al. [22], through an extensive simulation experiment, demonstrated that the threshold 0.3 for | NDRI | can effectively distinguish jumps from turning points, see ([22], Figure 6). The advantages of STPD over other popular methods, such as Pettitt’s and running slope difference in terms of root mean square error, have also been demonstrated in [22]. Through an extensive simulation experiment, Ghaderpour et al. [22] also showed that the overall accuracy of STPD for detecting turning points was approximately 83 % while Pettitt’s overall accuracy for detecting a change point was 65 % . The thresholds for | NDRI | and | DIR | have also shown to be effective for reliable turning point estimations in other studies, e.g., [23]. The workflow of the present study is illustrated in Figure 2.

3. Results

3.1. The STPD Results of PS-InSAR Time Series within AOI
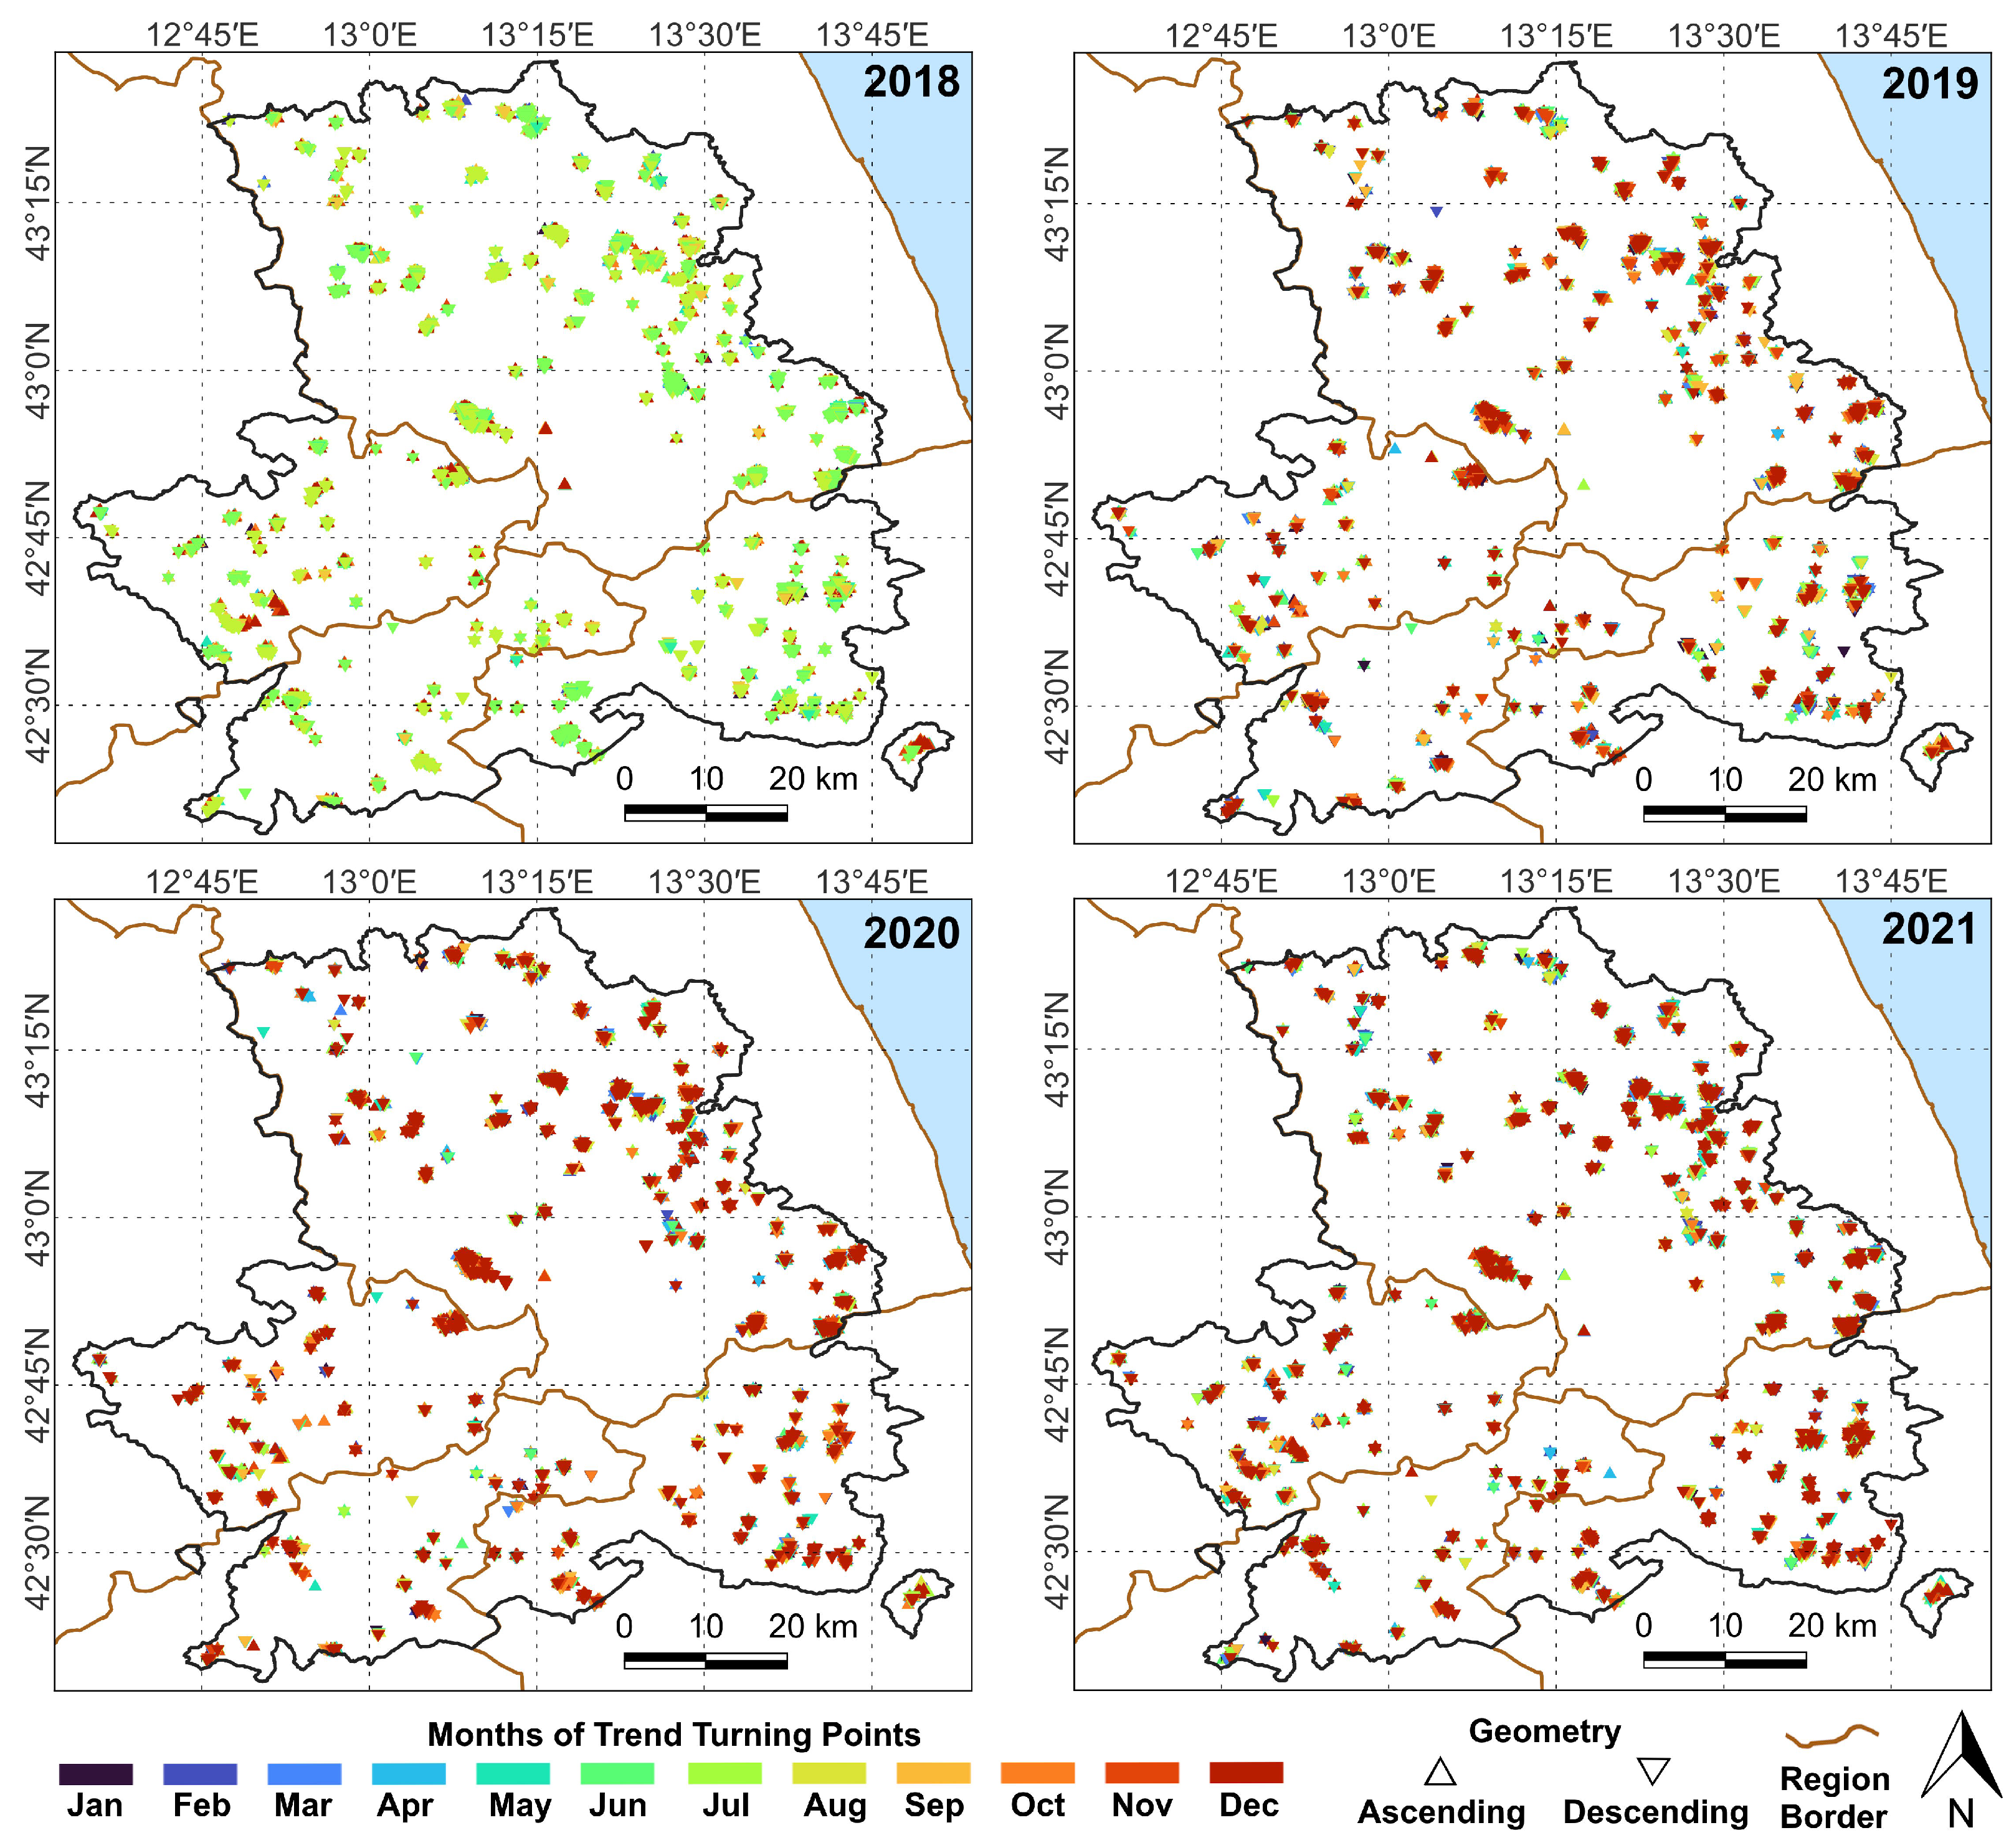
Figure 3 illustrates the spatial maps of calendar months when the gradients of the linear trends in PS-InSAR time series with the subset of 255 landslide bodies changed significantly. Years 2017 and 2022 are the margins of the windows in STPD, and so no turning point is estimated for these two years due to significant annual and seasonal noise, making the trend change results less reliable [22]. Note that the same input parameters in STPD for analyzing PS-InSAR time series in [22] are used in the present study for processing PS-InSAR time series that have a five-year-long window size and one-year-long step size and minimum time interval between turning points. These selections are based on extensive simulation, spectral analysis, and the nature of slow-moving landslides as demonstrated in [22]. The bar charts of distributions of turning points through calendar months during 2018–2021 in the four Italian administrative regions are shown in Figure 4, obtained by counting the number of turning points displayed in Figure 3 within each calendar month and each region. From Figure 4, relatively more turning points are detected in the summer season (summer 2019 in Marche, summers of 2018 and 2020 in Umbria, summer 2018 in Abruzzo, and summer 2020 in Lazio). The dashed red boxes highlight some of the most significant turning points whose directions are more than 4 mm/year. From the statistical point of view, all the estimated turning points are significant at the 99% confidence level.
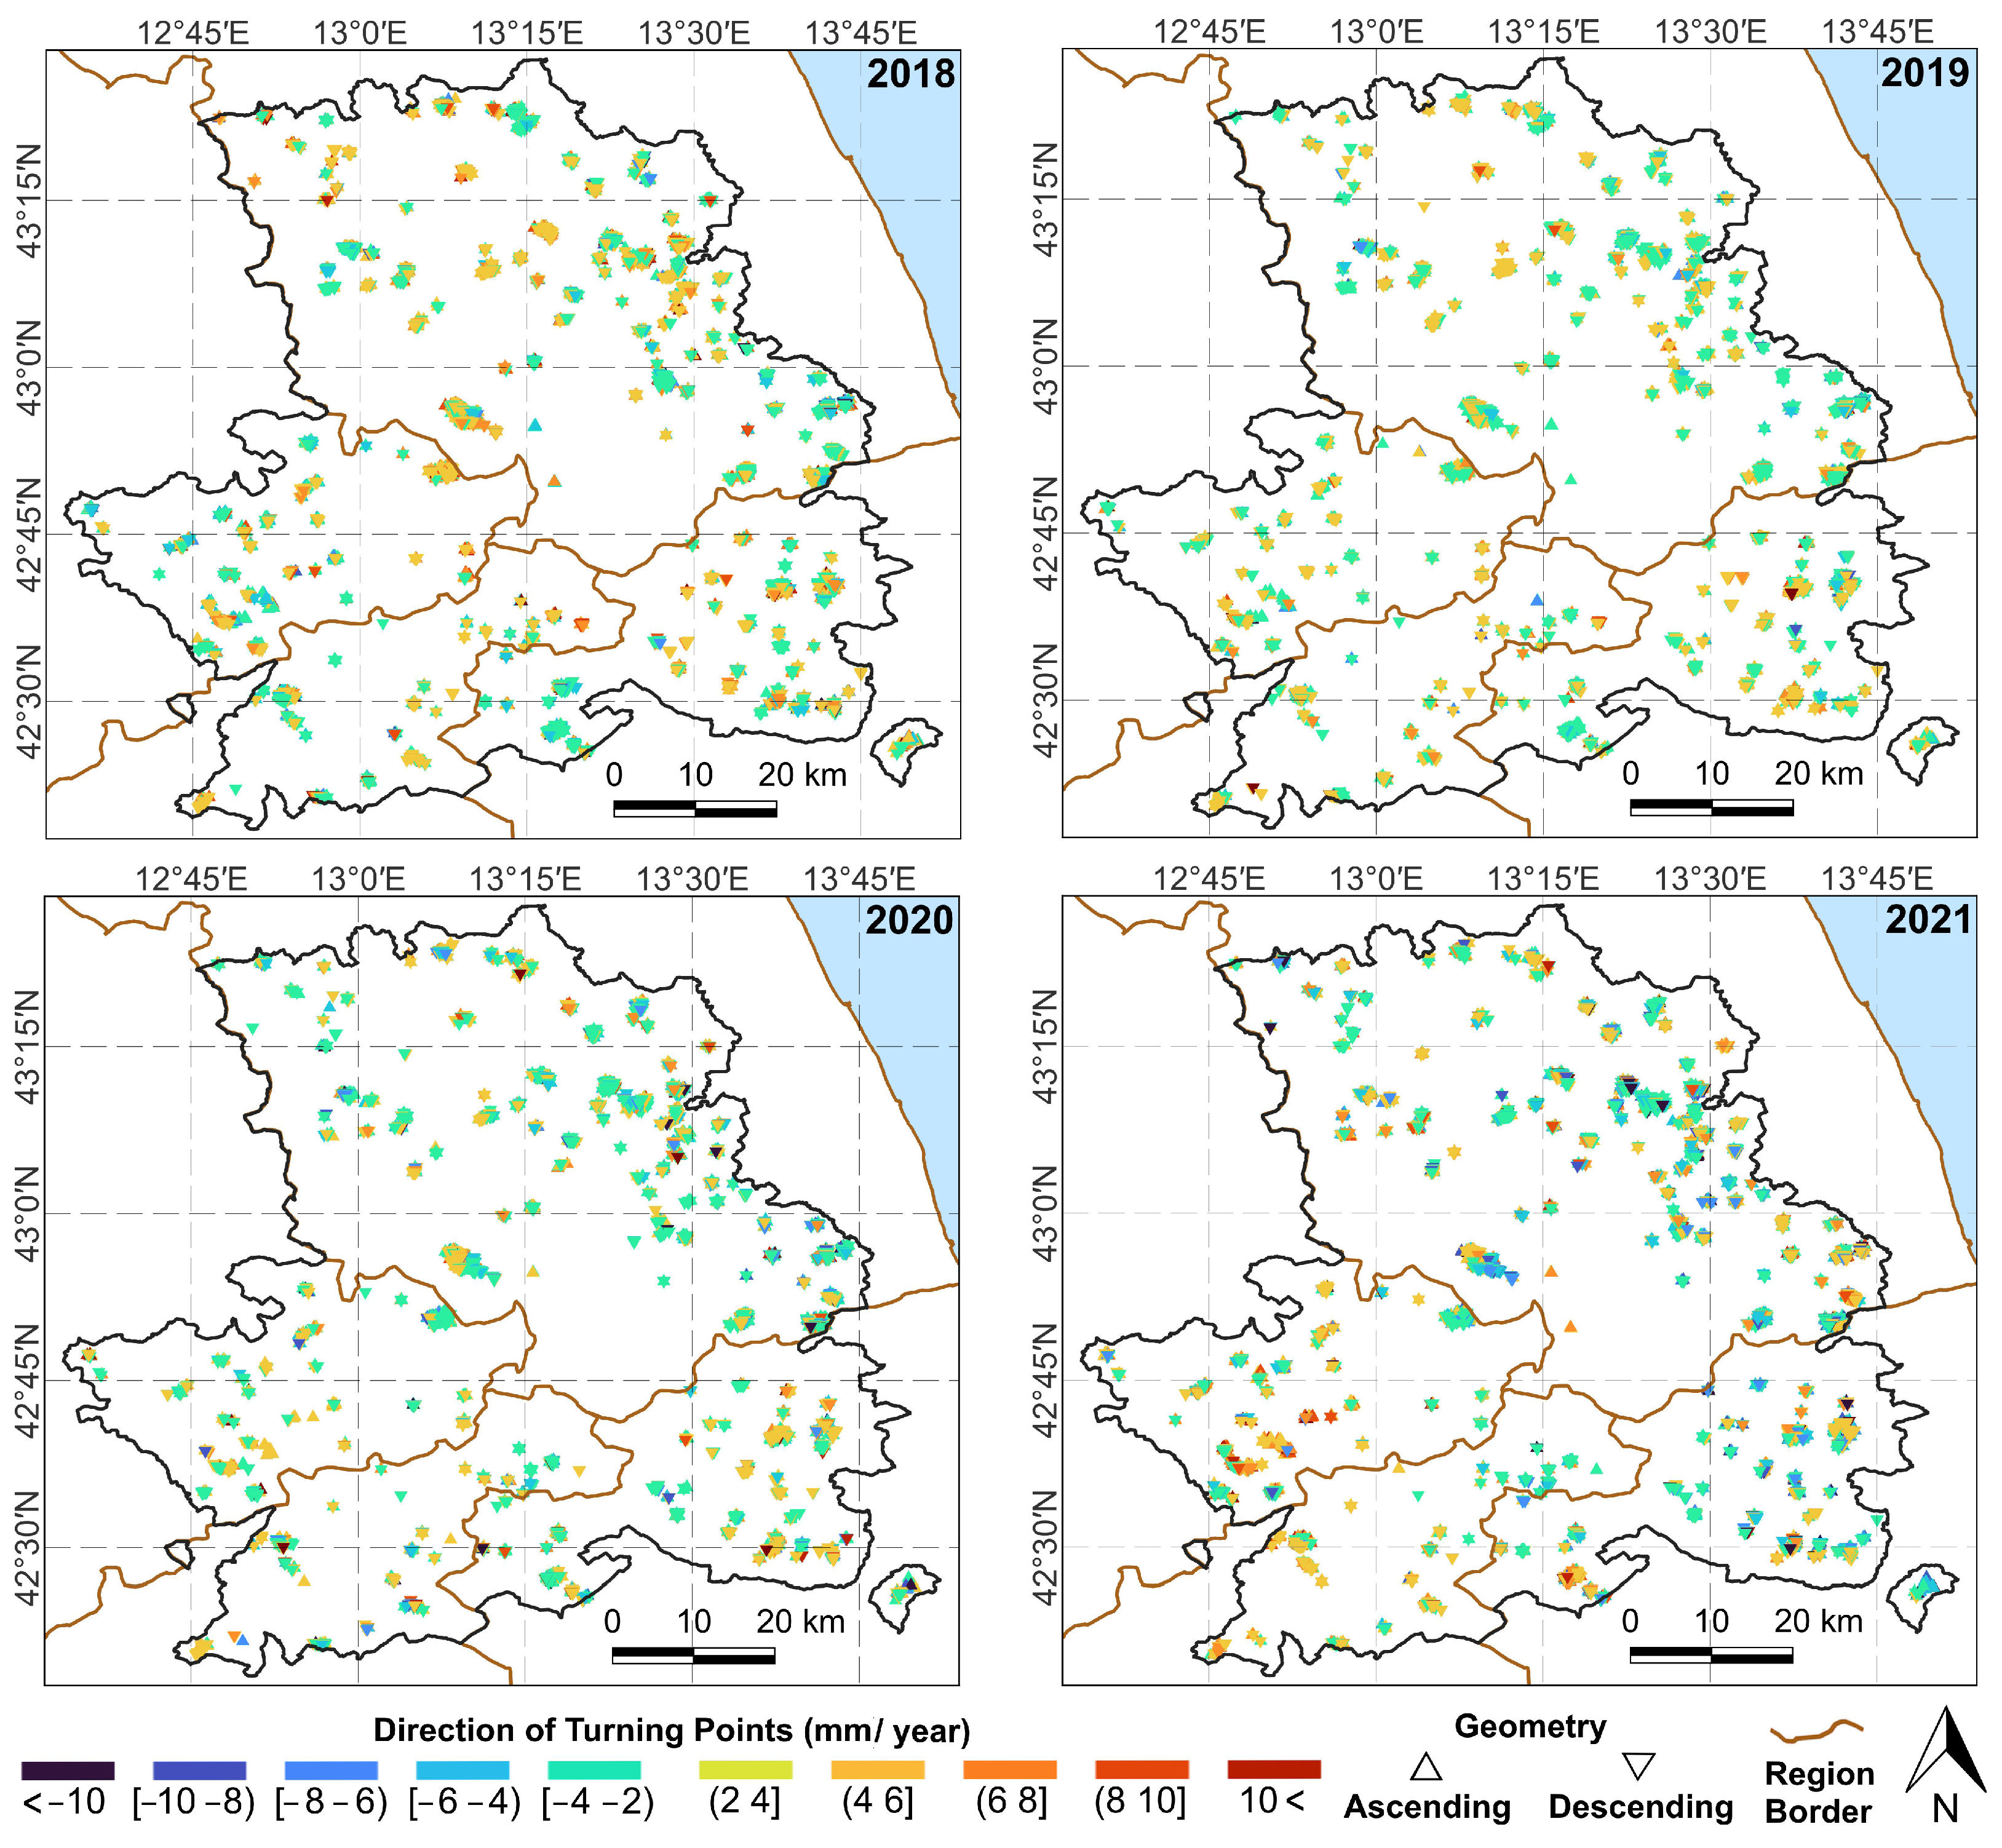
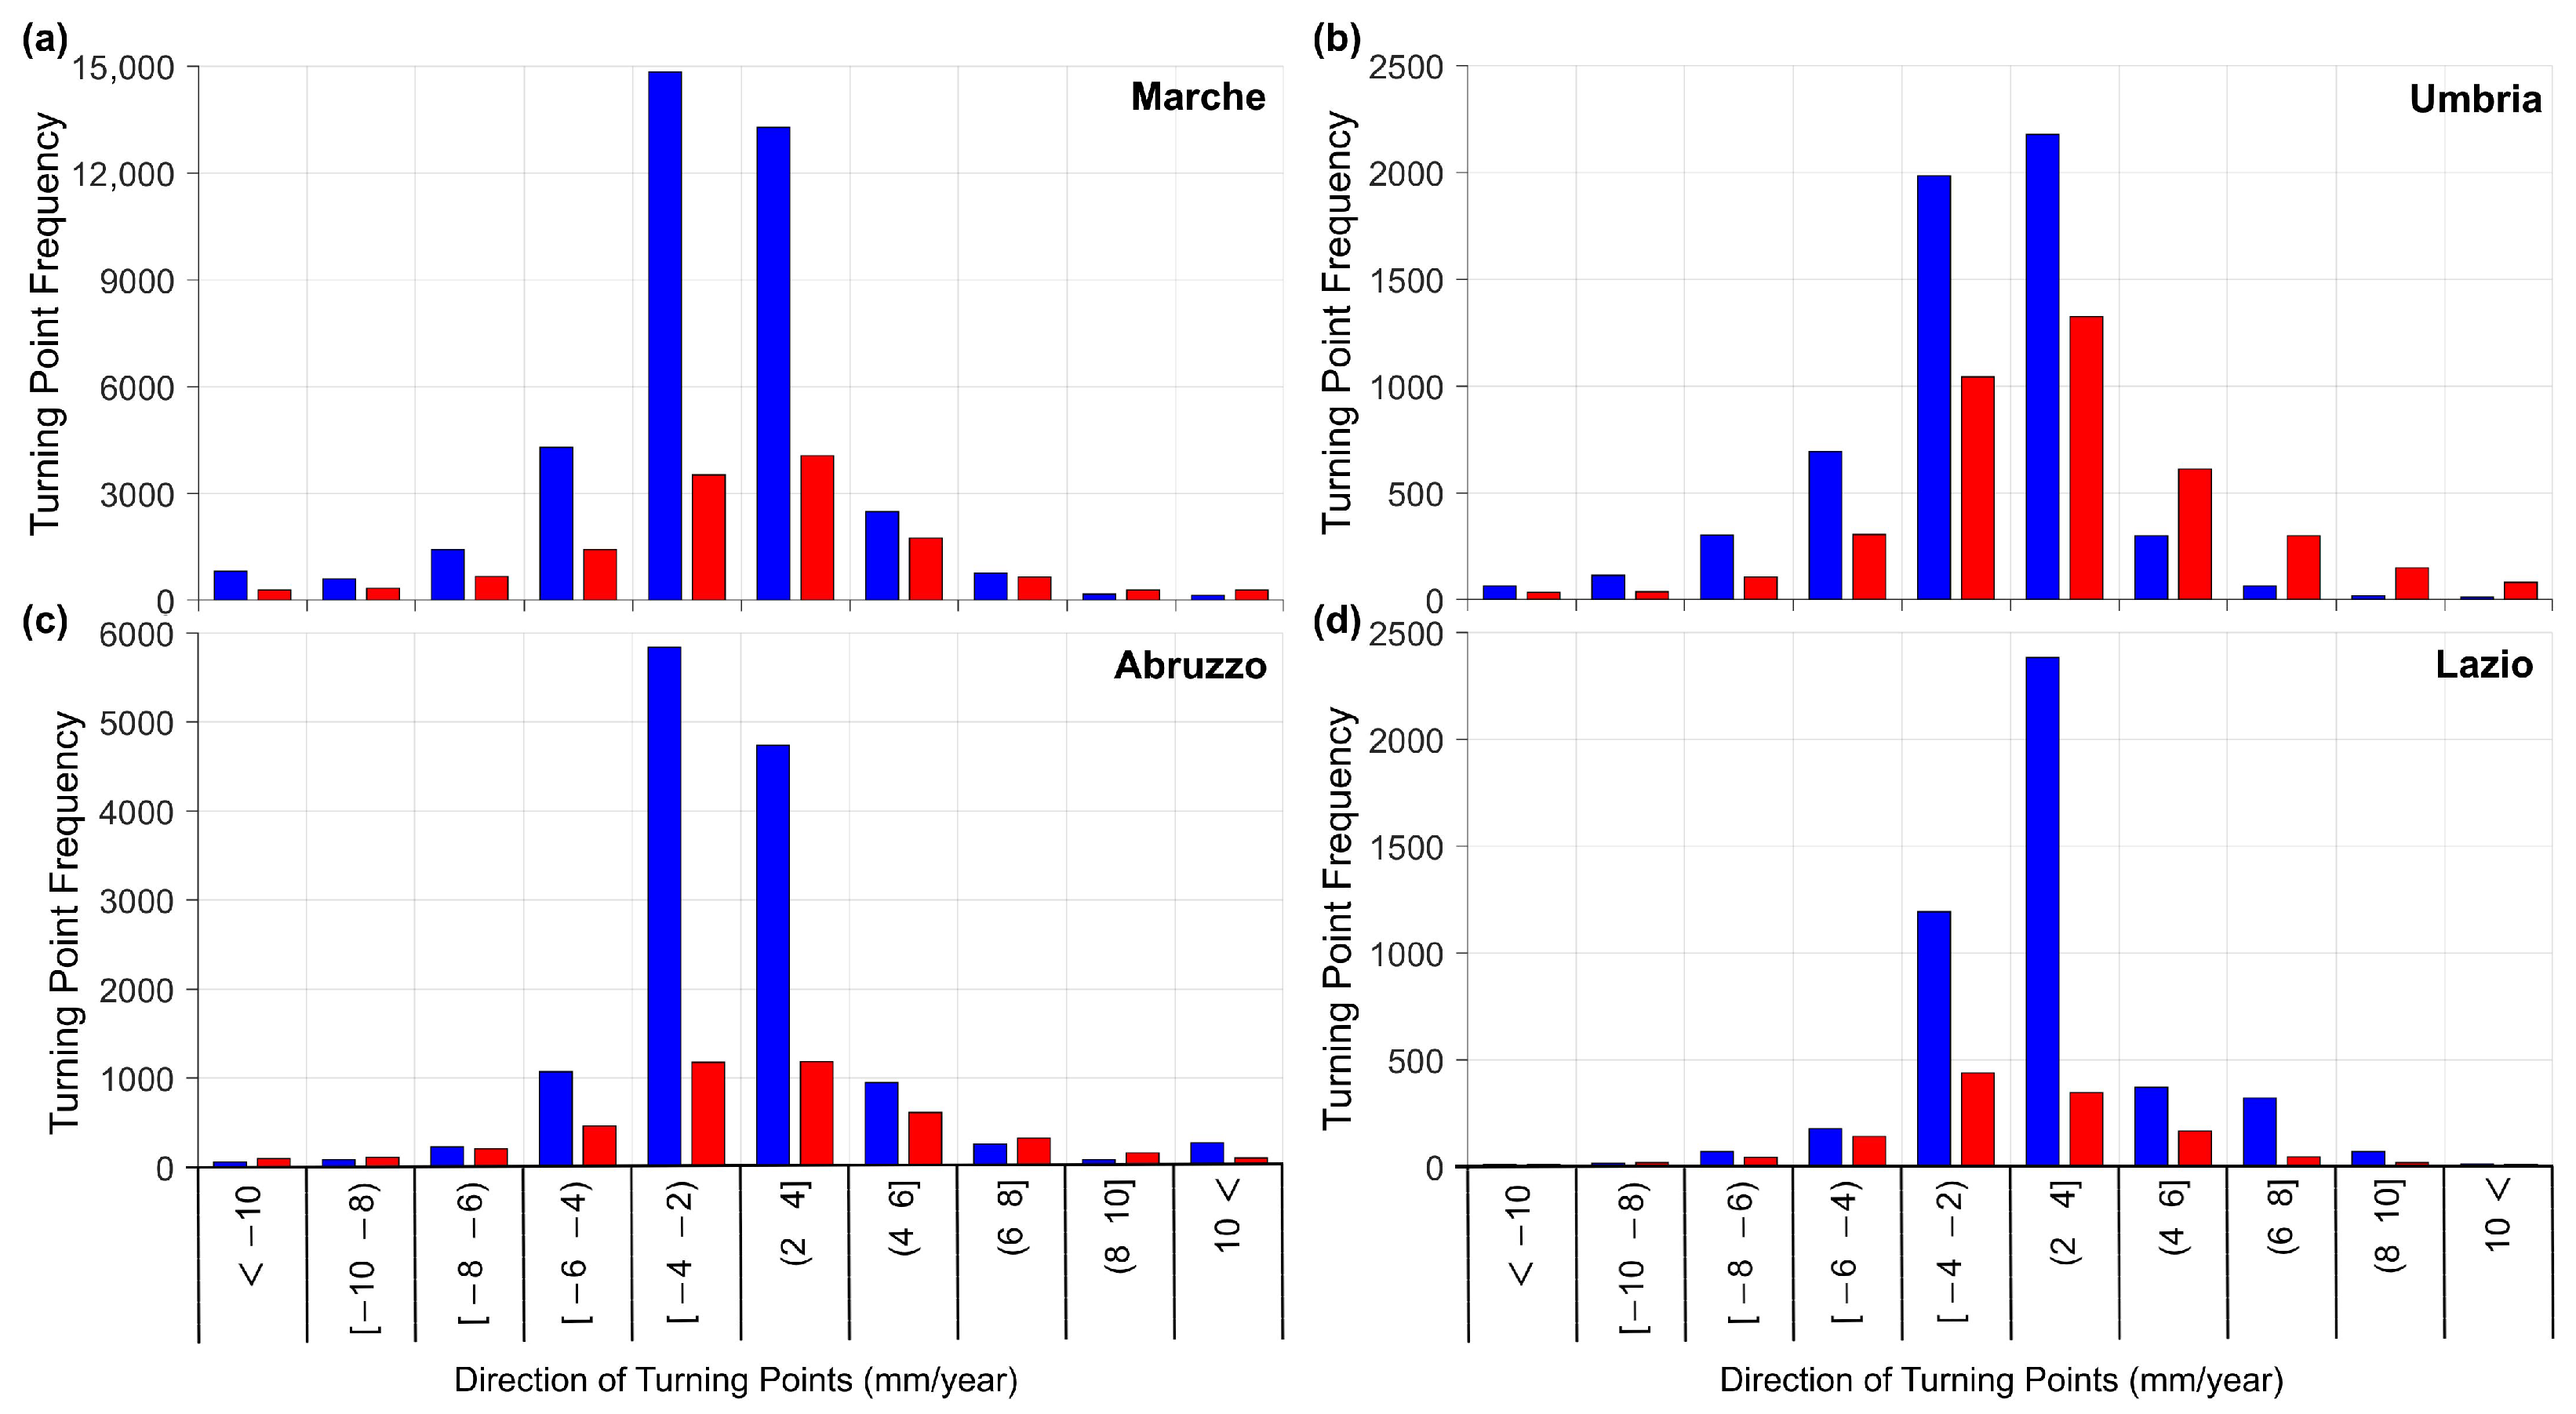
Figure 5 illustrates the spatial maps of the directions of the gradient changes at the turning dates shown in Figure 3. The frequency bar charts of directions of turning points through ten classes for the four regions are displayed in Figure 6, derived from Figure 5 by counting the number of turning points within each DIR class and each region. It is clear from Figure 6 that the directions of the majority of turning points are in classes [ 4 , 2 ) and ( 2 , 4 ] mm/year for both ascending and descending orbits.
Figure 3. The spatial maps of turning points for ascending and descending PS-InSAR time series.
Remotesensing 16 03055 g003
Figure 4. The bar charts of turning points for ascending and descending PS-InSAR time series for (a) Marche, (b) Umbria, (c) Abruzzo, and (d) Lazio. The red dashed boxes show the dates of some of the most significant turning points likely triggered by precipitation trend change. As an example, eight PS-InSAR time series whose trend turning dates are within these boxes are demonstrated in Figure 7.
Remotesensing 16 03055 g004
Figure 5. The spatial maps of directions of turning points for ascending and descending PS-InSAR time series.
Remotesensing 16 03055 g005
Figure 6. The bar charts of directions of turning points for ascending (in red) and descending (in blue) PS-InSAR time series for (a) Marche, (b) Umbria, (c) Abruzzo, and (d) Lazio.
Remotesensing 16 03055 g006
Figure 7. The STPD results of four pairs of PS-InSAR time series near the weather stations shown in Figure 1. The geographic locations of each pair of PS-InSAR time series, i.e., corresponding to ascending (ASC) and descending (DESC) orbital geometries, are less than 50 m. The left and right panels, respectively, show examples of Sentinel-1-ASC and CSK-DESC time series for (a,b) Tolentino in Marche, (c,d) Spoleto in Umbria, (e,f) Teramo in Abruzzo, and (g,h) Rieti in Lazio. The blue lines are the STPD estimated linear trends with multiple connected linear pieces. NDRI is short for normalized difference residual index. A DIR or a turning point direction is the slope of the fitted linear piece after a turning point minus the slope of the fitted linear piece before the turning point.
Remotesensing 16 03055 g007
The details of the number of PS-InSAR time series before and after applying the thresholds are also provided in Table 1. Only 13.5% and 6.9% of the ascending and descending PS-InSAR time series have passed all the conditions written in the caption of Table 1 for having at least one significant turning point, respectively. Note that the turning points and DIRs of only these PS-InSAR time series are shown in Figure 3 and Figure 5, respectively.

3.2. The STPD Results of Station-Based Accumulated Precipitation Time Series

To better understand and visualize how the linear trends are estimated for PS-InSAR time series and how precipitation might have triggered the velocity changes, four pairs of ascending and descending PS-InSAR time series are selected in four AOI polygons near the local weather stations. Each pair of ascending and descending time series is shown by a blue star, and the weather stations are shown by red squares in Figure 1b. The geographic locations of the ascending and descending PS-InSAR time series are within 50 m from each other and within 20 km away from the weather stations. Figure 7 shows these time series along with their STPD results. Note that the estimated turning points and DIRs highlighted by red arrows in these plots are displayed in Figure 3 and Figure 5.
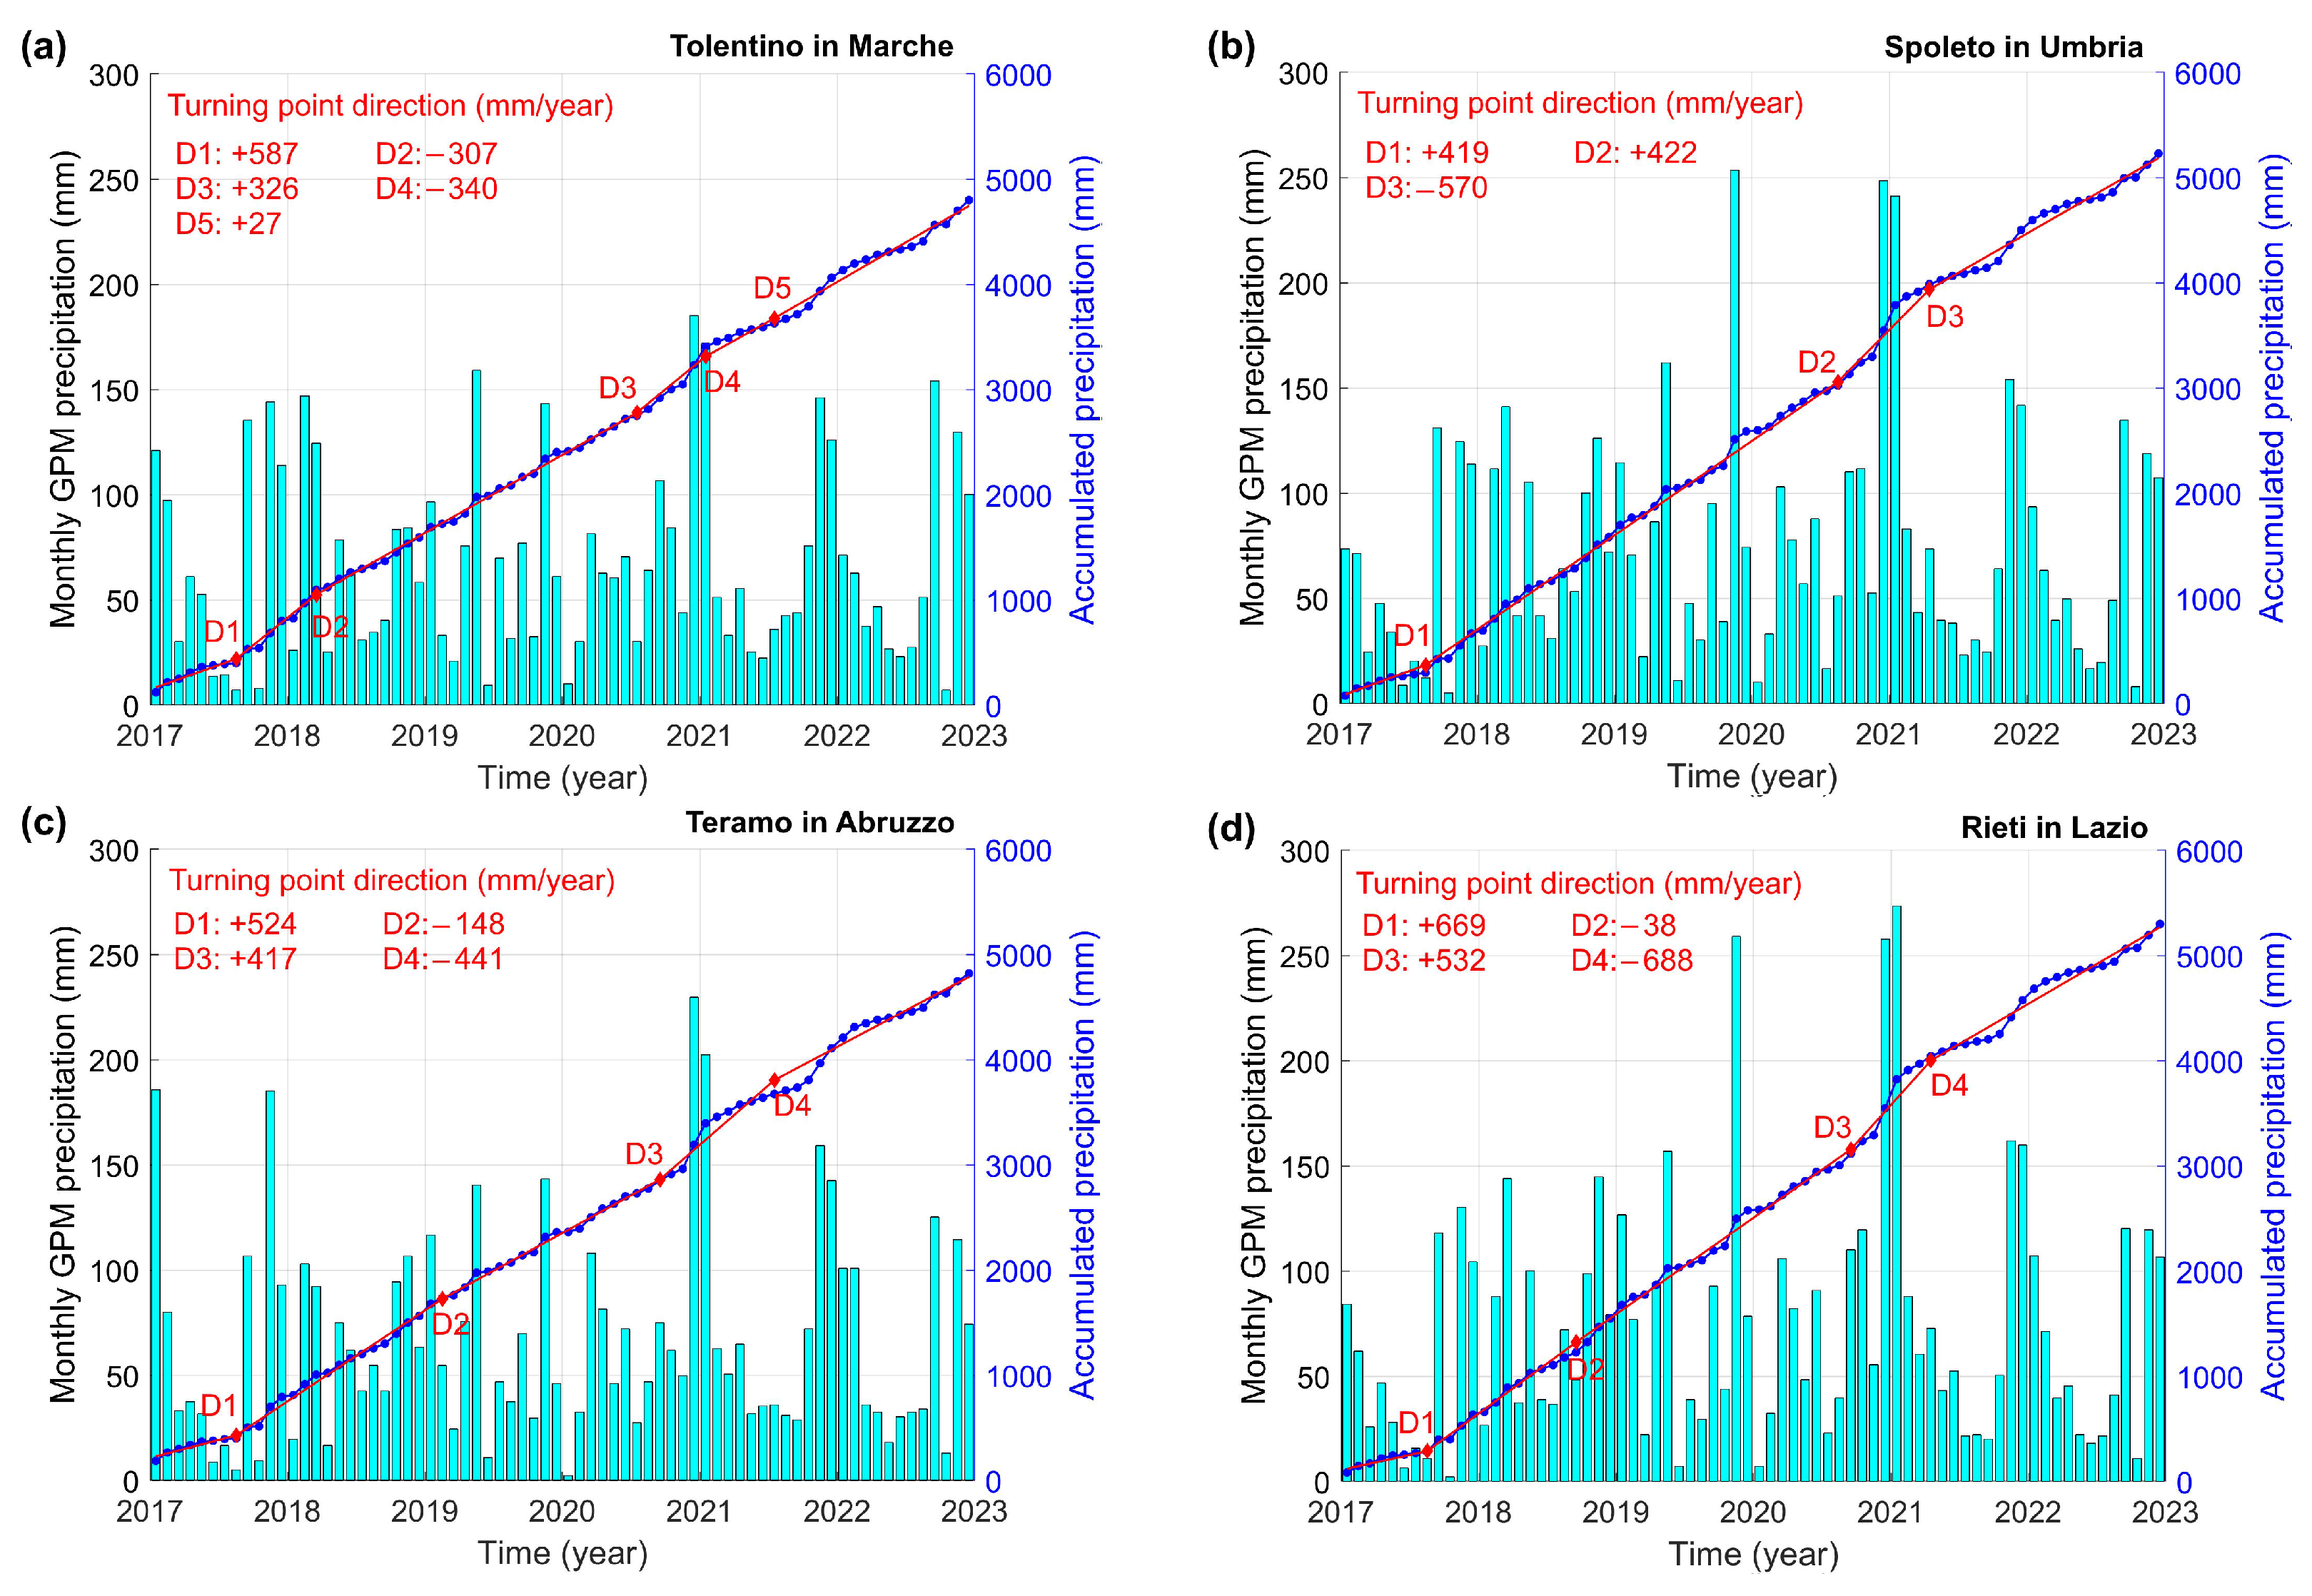
The STPD results of precipitation for locations shown in Figure 1 are illustrated in Figure 8. A significant amount of precipitation was recorded in May 2019 after several drier months, see D 2 640 and D 3 165 mm/year in Figure 8 (Tolentino). This may justify the relatively higher number of turning points during summer of 2019 in Marche (Figure 3) and the detected turning points in PS-InSAR time series shown in Figure 7a,b. The summer of 2020 was much wetter than 2019 where the gradient of accumulated precipitation significantly changed, see D 2 713 and D 3 1494 mm/year in Figure 8b (Spoleto). This may explain the relatively large number of turning points in the summer of 2020 in Umbria and the detected turning points with large DIRs in PS-InSAR time series in the summer of 2020, see Figure 4b and Figure 7c,d. The gradient of accumulated precipitation for Teramo increased significantly in 2018 compared to 2017, see D 1 505 mm/year in Figure 8, where May and June of 2018 were relatively much wetter. This may indicate the increased number of turning points in May, June, and July of 2018 in Abruzzo and the velocity change observed in Figure 7e,f, see the turning points detected in the summer of 2018. Likewise, the turning points detected in Figure 7g,h are likely due to the significant precipitation increase during late 2020, see D 3 1568 mm/year in Figure 8d (Rieti).

3.3. The STPD Results of GPM Time Series

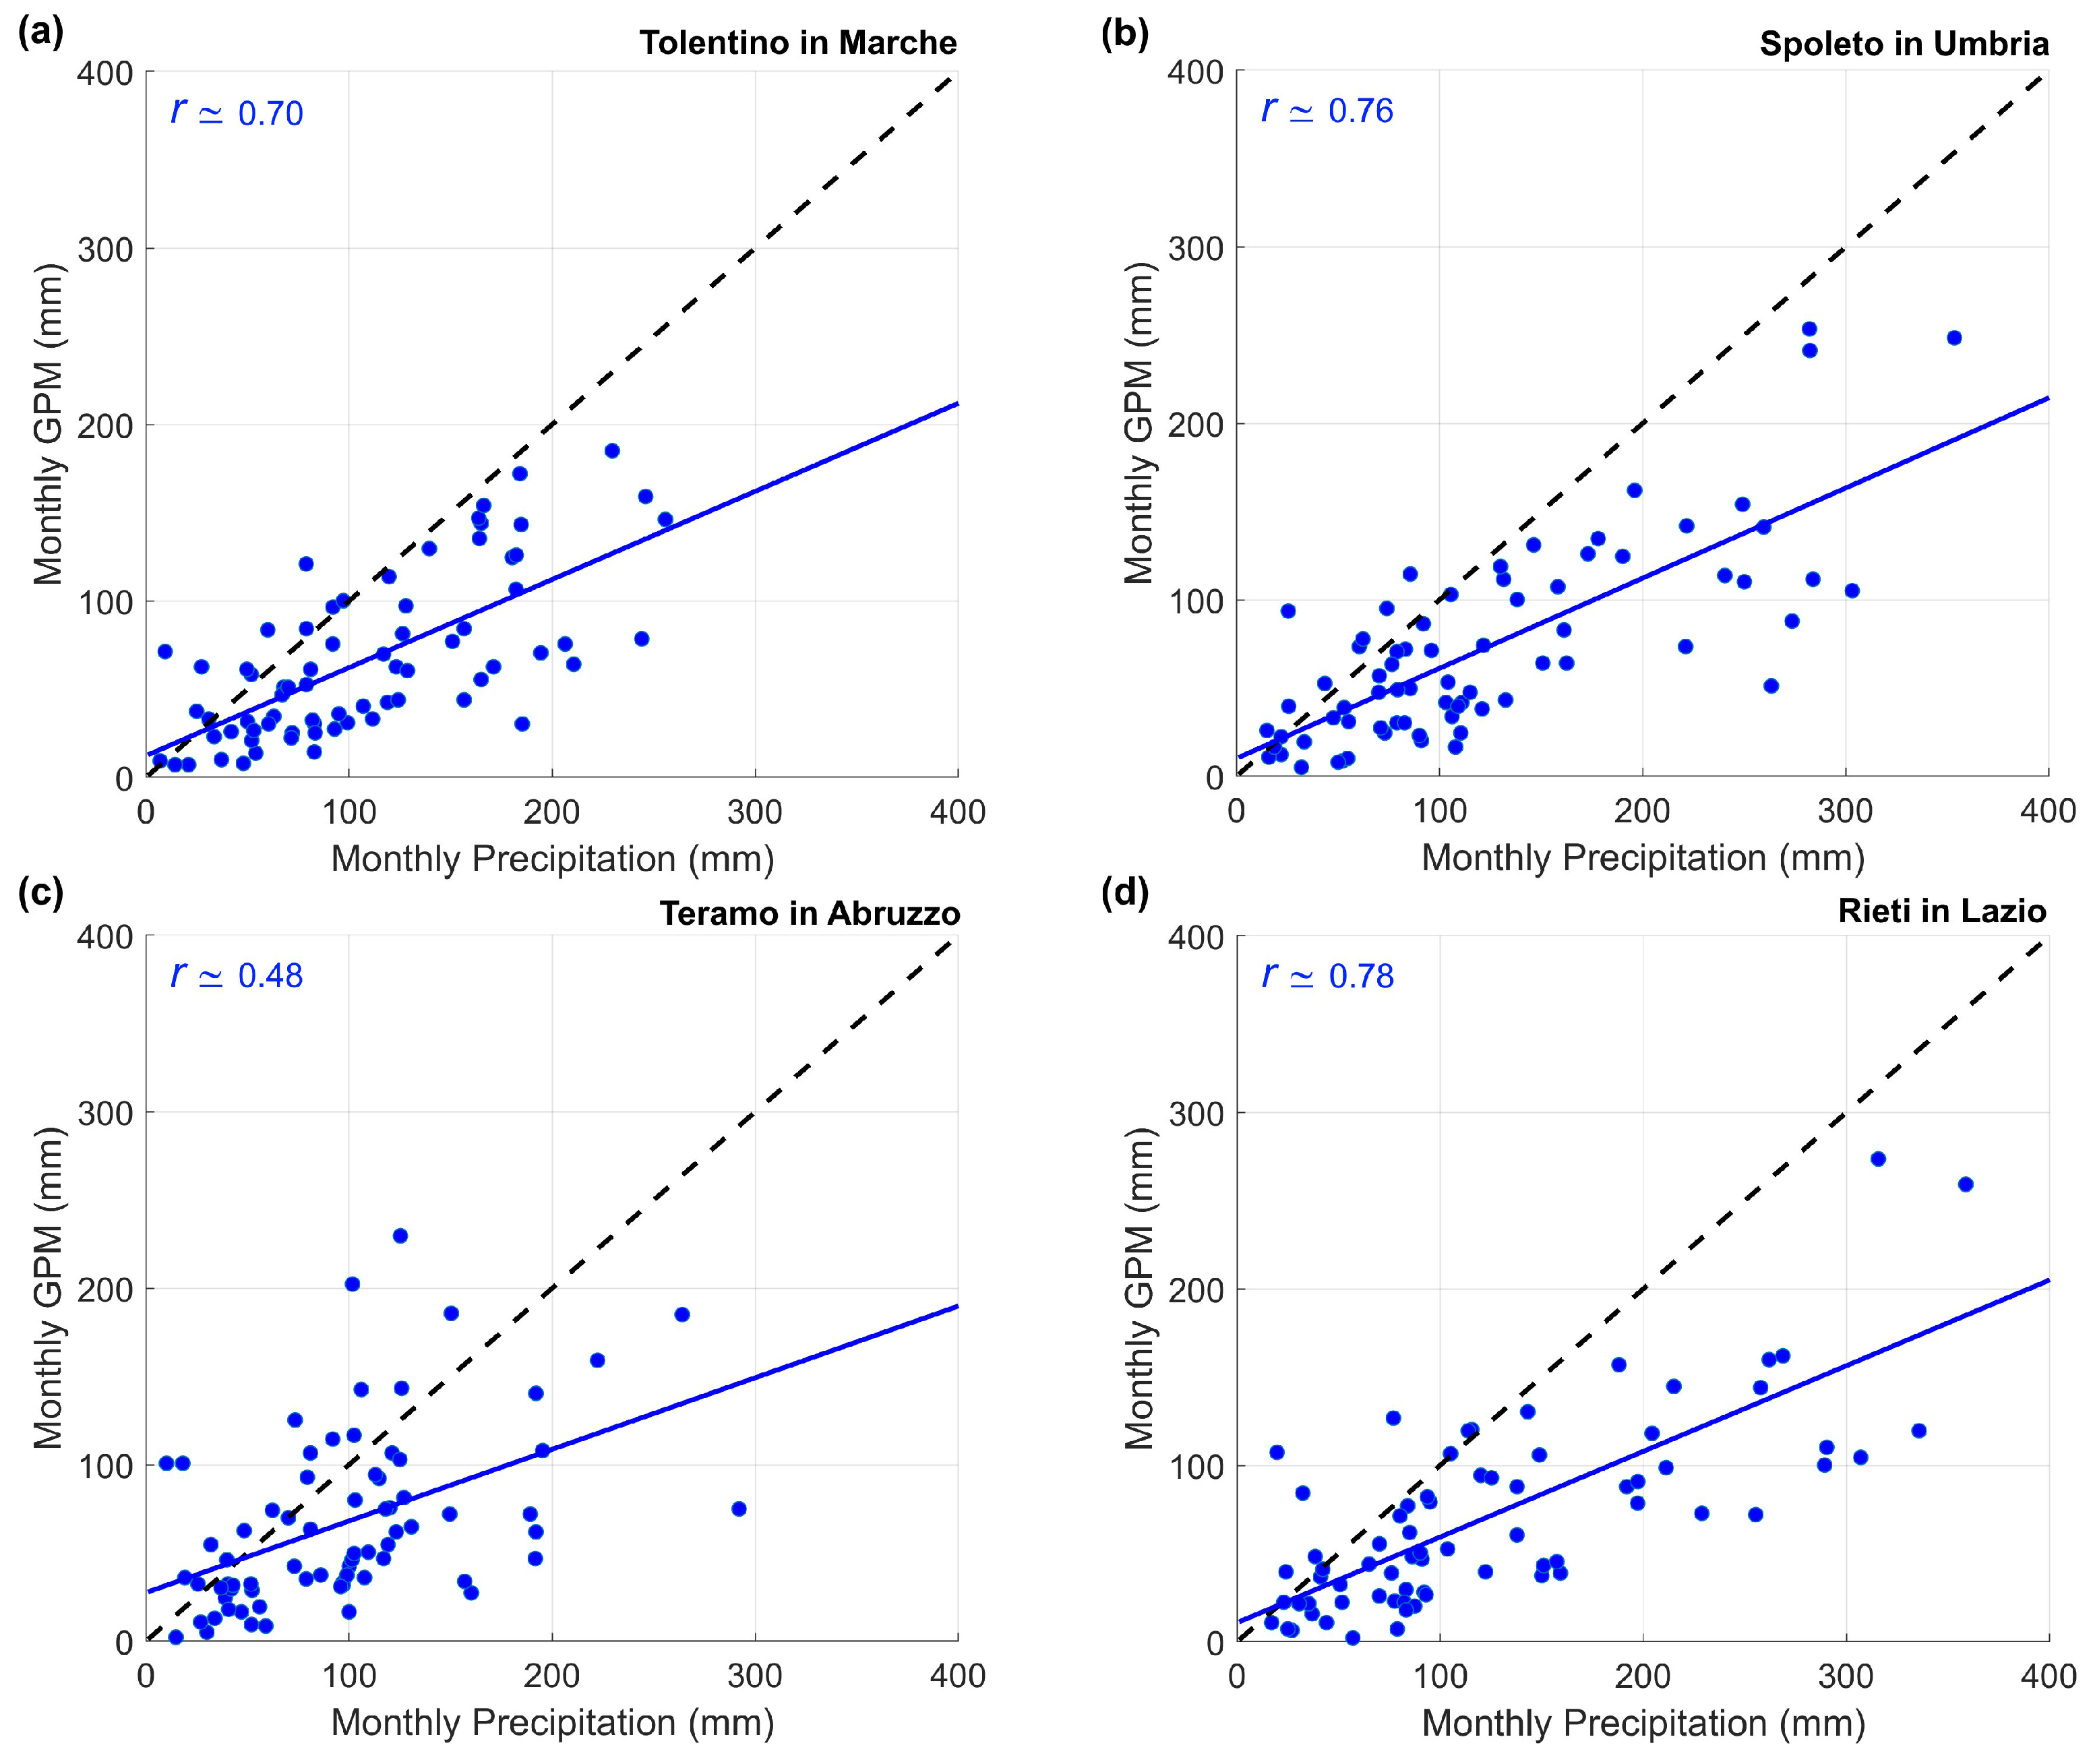
Firstly, to evaluate how monthly GPM and local precipitation measurements are correlated, four per-pixel GPM time series are extracted from the stack of monthly GPM images, each including the location of gauging stations highlighted by red square in Figure 1b. The STPD results of the accumulated GPM time series for these four pixels are displayed in Figure 9, showing similar patterns with more or less the same trend turning dates and directions as the station-based accumulated precipitation time series displayed in Figure 8. In particular, there exist turning points with positive directions in 2017 and 2020 for both GPM and station-based time series for all the four towns. The Pearson correlation analysis is also performed to estimate the linear dependency between these sets of measurements, see [63] (Equation (5)) for the formula. The correlation results are illustrated in Figure 10, showing a strong linear dependency for Tolentino, Spoleto, and Rieti with r 0.7 and a moderate fuzzy linear dependency for Teramo. From the estimated linear trend lines displayed in blue in Figure 10, the GPM values are generally lower than the station-based values. However, note that the spatial resolution of GPM data is about 10 km, providing a rough estimate for a larger area.
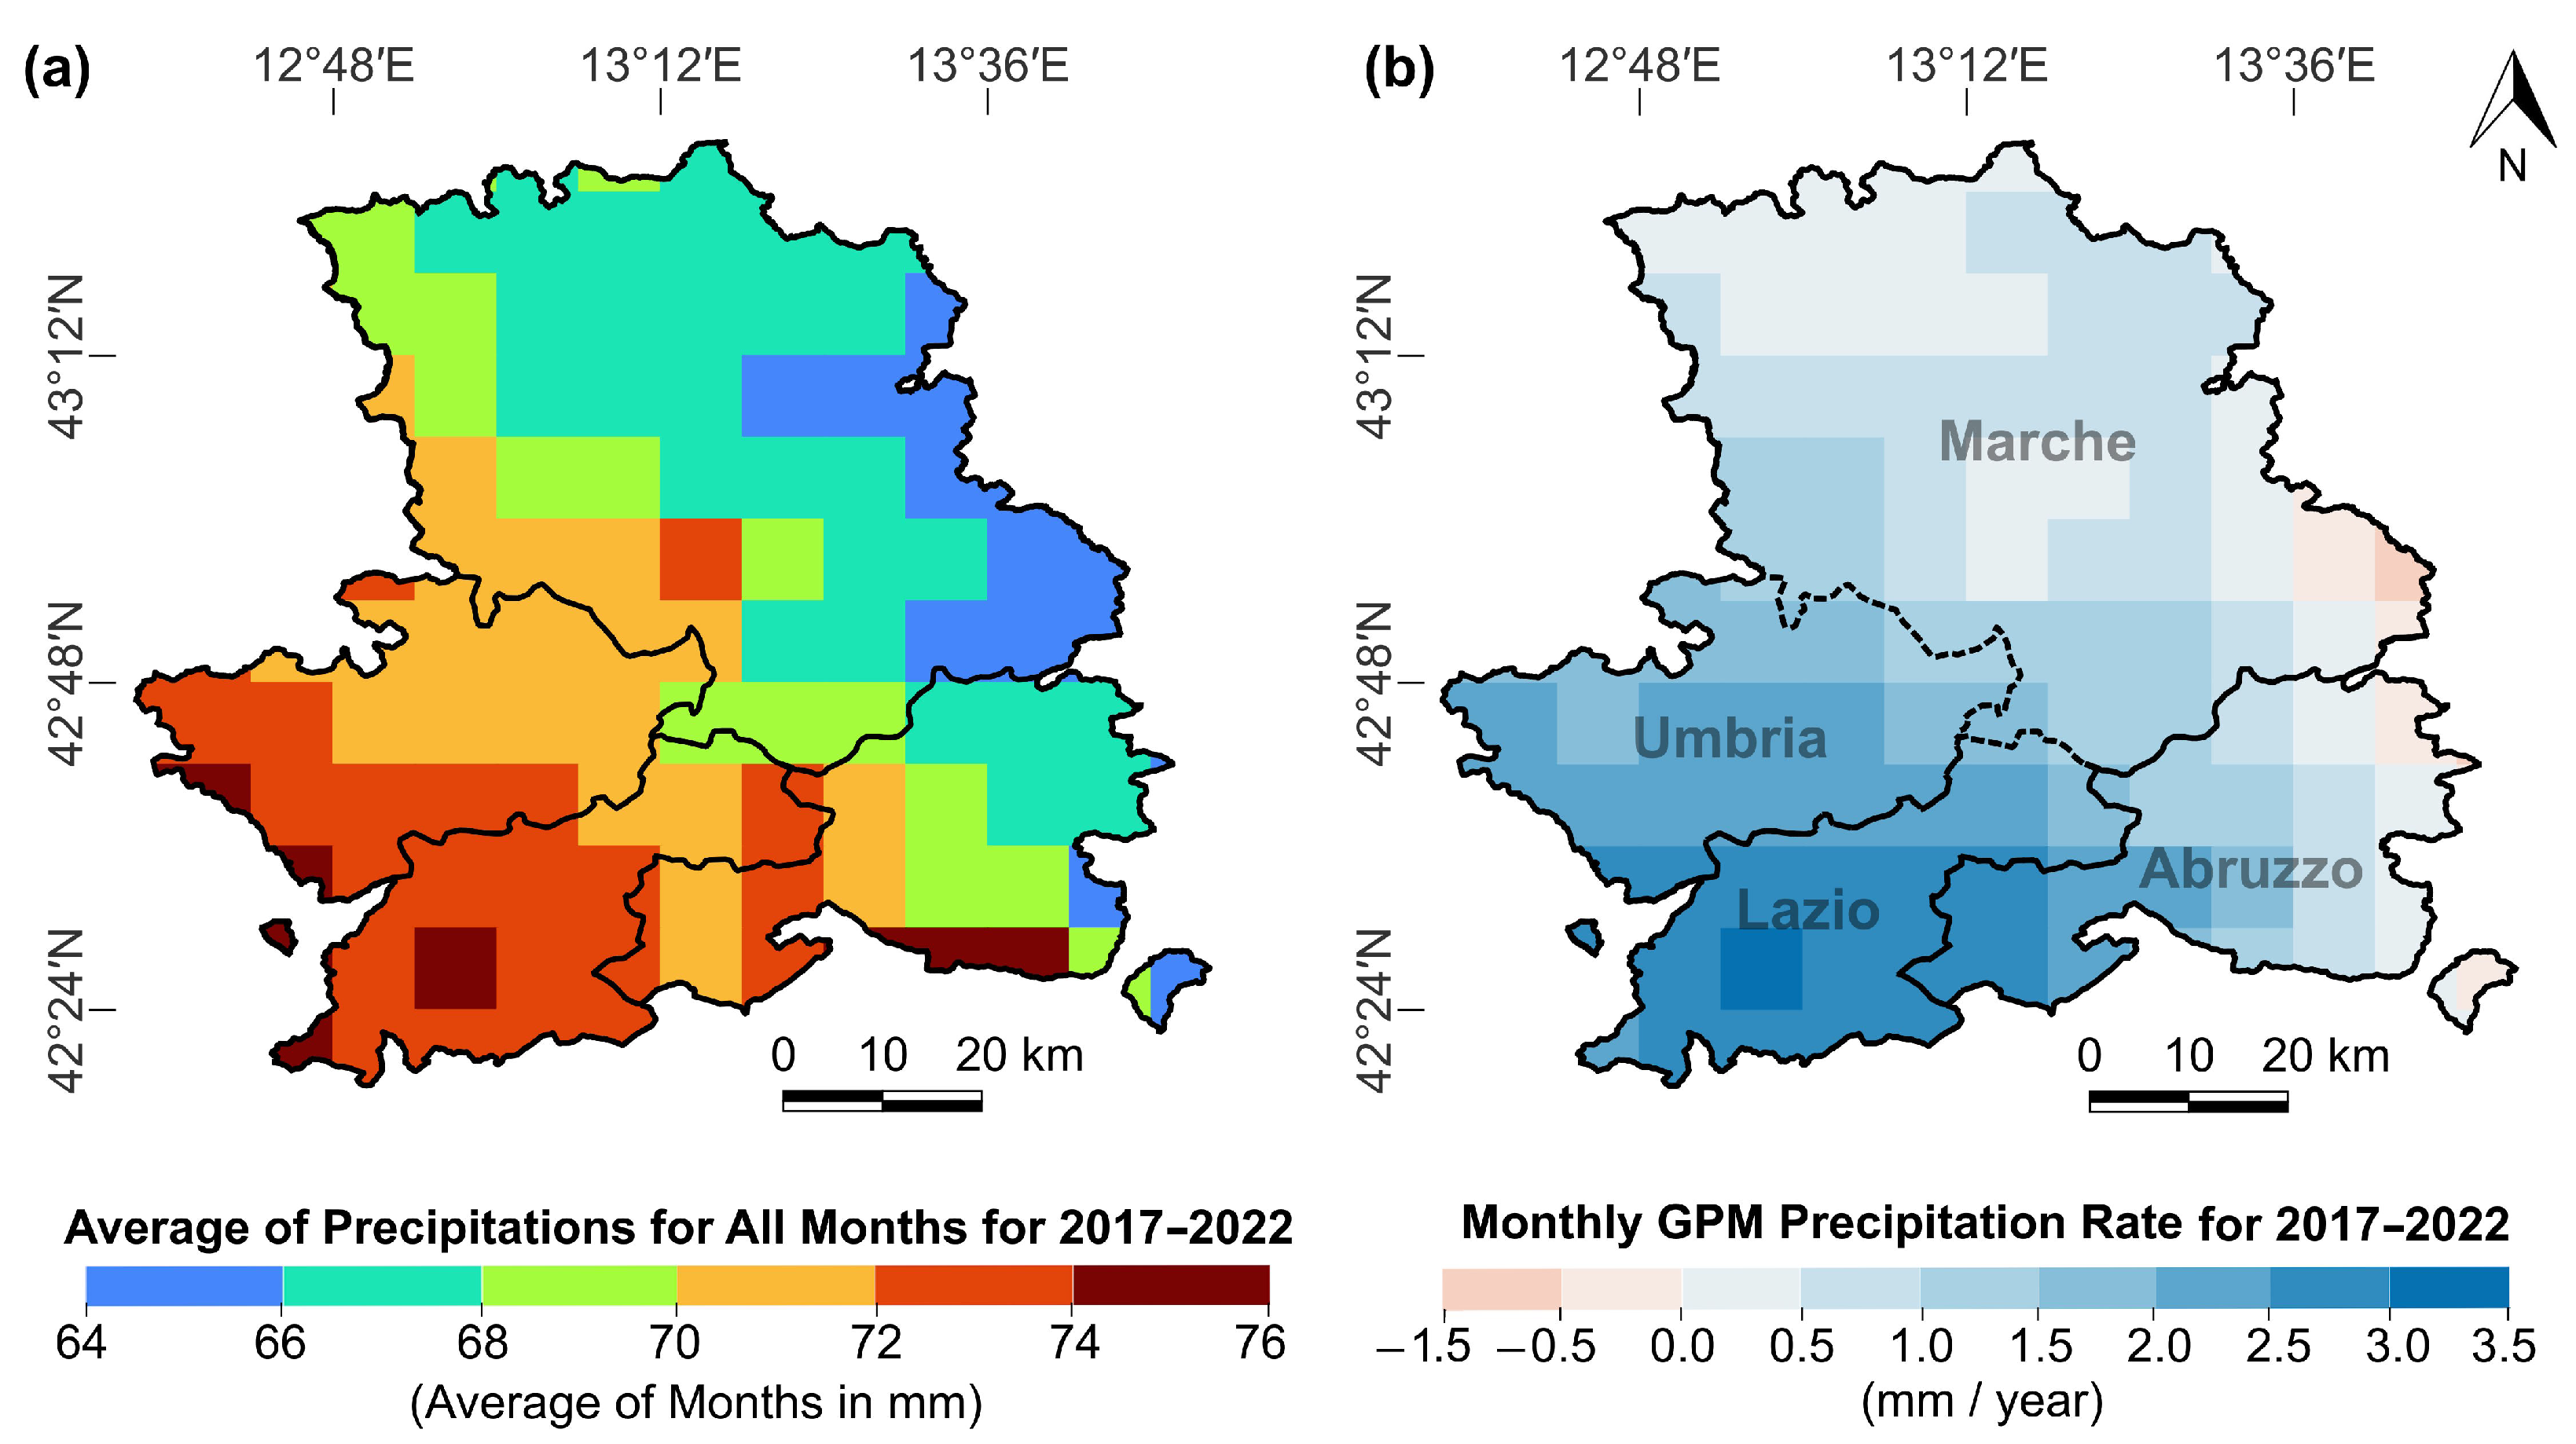
Secondly, to study the overall average monthly precipitation across the study region, the average of precipitations in all calendar months during the period 2017–2022 is calculated for each spatial pixel, and the resulting map is illustrated in Figure 11a. From this figure, it is clear that the coastal sub-regions (Marche and Abruzzo) have relatively lower amounts of monthly average precipitation than Umbria and Lazio. The monthly precipitation rate is also estimated for each per-pixel GPM time series from 2017 to 2023 by the ordinary least-squares method, and the resulting velocity map is depicted in Figure 11b. From this figure, an insignificant precipitation velocity is observed across Marche and Abruzzo while there exists a significant positive monthly precipitation velocity in Umbria and Lazio. Note that four of the per-pixel time series for which the average and velocity through the best fitting lines are estimated are displayed by bars (in cyan) in Figure 9.
Finally, the turning points and their directions are estimated for each per-pixel time series with the same input parameters (two-year-long window size and half-year-long step size and minimum time interval between turning points) as for the station-based precipitation time series, and the results are illustrated in Figure 12. Panel (a) in Figure 12 clearly shows that Marche and Lazio have a significant turning point direction in the summer of 2017, while panel (b) shows that part of Abruzzo has a positive direction in 2019, and panel (c) shows that Lazio has the strongest precipitation trend change (highest positive direction) compared to other sub-regions in 2020. Overall, as one can observe from Figure 12d, most of turning points with positive directions are in the summer of 2017, spring of 2019, and summer and fall of 2020. Note that positive direction means that the precipitation velocity is increased after the turning point.

4. Discussion

This study is dedicated to estimating the reactivation times and velocities of slow-moving landslides in areas affected by the Amatrice–Norcia–Campotosto seismic sequence (2016–2017) through analyzing PS-InSAR time series. Note that the physical concept of a turning point in InSAR time series is based on displacement trend pattern change due to slow-moving landslide reactivation or gradual land subsidence/uplift [22,23]. The geospatial maps showing the dates when the velocities of the displacement time series change are produced for years 2018, 2019, 2020, and 2021, see Figure 3. From Figure 6, one can observe that the majority of turning points have directions with absolute values of less than 4 mm/year, fortunately not in an alarming rate but still significant. On one hand, landslides during the weeks immediately after the seismic sequences are studied by field survey and remote sensing methods by many researchers [29,50,64]. On the other hand, the potential impact of precipitation pattern change on landslide reactivation for the affected regions are investigated well after the seismic sequences in the present research. In the following subsections, potential triggering factors of slow-moving landslides are discussed, and the limitations of the present study as well as future work are mentioned.

4.1. Potential Triggering Factors of Displacement Turning Points

The present results show that precipitation trend change pattern is one of the triggering factors of landslide reactivation in the affected areas. For example, Figure 7c,d for Spoleto and Figure 7g,h for Rieti show that the displacement time series of Sentinel-1-ASC and CSK-DESC have turning points during the summer of 2020 with an increasing rate, likely due to positive precipitation rate change during the summer of 2020 as observed in Figure 8b,d (see D3 with DIR of about 1500 mm/year). The analysis of GPM images also confirms the positive precipitation rate change (DIR > 0 ) during the summer of 2020 as observed in Figure 9b,d for Spoleto and Rieti, respectively. Moreover, Figure 12c shows significant positive turning point direction for the entire Umbria and Lazio sub-regions during the summer and fall of 2020, explaining the relatively large number of turning points detected in the displacement time series in these seasons and sub-regions as shown in Figure 4b,d, see the red dashed boxes. From Figure 12b, one can see that almost half of the Abruzzo sub-region has positive DIR, explaining the relatively large number of turning points during the winter and spring of 2019 as observed in Figure 4c. Figure 12a also shows that the entire ABDAC region has positive precipitation rate change during the summer of 2017, especially for Marche, whose increasing precipitation rate continues in the following years for the most part. This together with heavy rainfalls in May 2019 may explain the relatively large number of turning points during the summer of 2019 as shown in Figure 4a.
Global and local warming and human activities in recent years have contributed to extreme weather events, such as high winds, heatwaves, and short-duration and heavy precipitation, which have changed the frequency of landslides [29,65,66,67]. Ghaderpour et al. [63] observed significant daytime warming trends for September, November, and December, and significant nighttime warming trends for February, July, August, September, November, and December during the period 2000–2023 in Central Italy, linked to forest expansion in recent decades. Extreme precipitation events due to land cover and climate change have become frequent in recent years following drier periods, reactivating landslides [37,38,68]. For example, Luppichini et al. [69] demonstrated that global warning has caused a decline in precipitation amount mainly in the dry season followed by intense and heavy precipitation events in north-central Italy.
The present results agree with the ones by Tichavský et al. [70], who demonstrated that the main triggering factor of landslides in Central Europe is heavy precipitation after dry periods. Moreover, Ghaderpour et al. [22] observed a similar correlation in the province of Frosinone in Central Italy. Martino et al. [71] scrutinized the potential causes of recent landslides in Molise region in Central Italy and concluded that heavy rainfalls and seismic events were the main triggering factors of landslides in Molise region. (Ghaderpour et al. [37], Figure 5) also found a strong positive correlation between vegetation and land surface temperature and a weak negative correlation between satellite-based precipitation and vegetation in Apennines.
The potential of Sentinel-1 and CSK data for landslide detection and monitoring in Italy has been thoroughly studied in literature [72,73]. Barra et al. [15] performed a manual data analysis and interpretation for landslide mapping in Molise, Italy, using Sentinel-1 data. However, they neither developed nor implemented any robust algorithm to automatically estimate the dates and velocities of landslides. Antonielli et al. [74] showed the potential of InSAR time series based on CSK for mapping and monitoring slow-moving landslides in Lombardy Region in Italy. They showed that a single acquisition geometry is effective for preliminary investigation of many landslides. However, they recommended to combine both ascending and descending acquisition geometries to better capture ground movement for various physical and morphological features, such as land cover/use, slope, and aspect angles.
The Sentinel-1- and CSK-based PS-InSAR time series utilized in the present study are all inside the AOI polygons, shown in Figure 1. The PS-InSAR time series that have turning points are also classified based on the information from the landslide inventory map and geological survey. The classification results are shown in Table 2, where it can be seen that most of the turning points belong to the sliding class.
Quantitative analysis of estimating landslide reactivation times and their velocities and considering the uncertainties in measurements as well as spatiotemporal coverage are topics of current interest [75,76,77,78]. The present study provides an insight on how robust data analytics methods and remote sensing technology (e.g., use of STPD and PS-InSAR data) can be integrated to map and monitor landslides and study their triggering factors in more depth than before. The findings of this research can help policymakers and stakeholders in decision-making processes and building risk-mitigation measures. These tasks may include slope stabilization works in landslide-prone areas showing an increase displacement rate change, household relocation in more hazardous regions showing more significant displacement rate change, and ordinary maintenance work, such as repairing cracks and painting in flatter regions with smaller deformation rate [79,80].

4.2. Limitations and Future Work

The non-increasing or non-decreasing assumption of trend component in this research (see Figure 2) limits the results to the places where the ground is always moving toward the same downslope direction with respect to satellite line-of-sight. Urgilez Vinueza et al. [62] pointed out that this assumption is reasonable as there is not a clear geophysical justification on how the sign of line-of-sight direction can switch from negative to positive or vice versa. They assumed that the switching gradient from positive to negative or vice versa could be due to sensor or phase unwrapping errors, which could be plausible for steep slopes. In regions with relatively flat terrain, changing sign in displacement gradients could be due to land subsidence/uplift, correlated with groundwater level fluctuation (e.g., in industrial regions [23]). Table 1 shows that applying this assumption and enforcing the thresholds for NDRI and DIR eliminated about 60% of PS. However, the remaining PS-InSAR time series demonstrated pretty good results, many of which are randomly examined by visual interpretation and QGIS software (an open-source quantum geographic information system software [81,82]) and from field knowledge. Loosening the conditions potentially brings in time series with more uncertain turning points that may be due to measurement errors, phase unwrapping, atmospheric noise, etc.
In summary, the limitations of this study include the lack of adequate spatial coverage of PS-InSAR time series, particularly in non-urban regions, uncertainties in PS-InSAR measurements due to atmospheric noise, errors caused during phase unwrapping and sensor errors, and a lack of adequate meteorological stations. In the present research, due to a limited number of weather stations, satellite-based precipitation measurements are also utilized. The correlation analysis demonstrated in the current study signifies a good linear dependency between ground-based and satellite-based precipitation measurements; however, the distance of weather stations from the PS-InSAR locations and coarse spatial resolution of GPM images bring yet another uncertainty for investigating how precipitation and displacement rate changes are correlated. Integrating optical and radar data acquired from various sensors, such as MODIS, Landsat, Sentinel, and PlanetScope, along with hydro-meteorological data using machine learning models could be beneficial for a better understanding of landslide activities and their triggering factors in the study region, which is the subject of future investigation. Depending on the type of time series and noises involved, the parameters of STPD, such as window and step sizes and the minimum time interval between turning points, must be tuned to optimize the model’s performance. In the present study, like the earlier study by the authors [22] through an extensive simulation, a five-year-long window size and a one-year-long step size with a minimum of one-year difference between turning points are identified to be optimal for the purpose of detecting slow-moving landslides that occur slowly in nature. Therefore, users need to be cautious when applying STPD to other applications as tuning parameters are very important. Lastly, the STPD utilized herein can be applied to other regions across the world for studying the relationships between precipitation and ground deformation trend changes. Intense rainfall after dry periods appear to be triggering landslides in the affected regions in Central Italy, confirming the earlier results for province of Frosinone and Central Europe [22,70,83]. Apart from precipitation, earthquakes, volcanic activities, snowmelt, water-induced soil erosion, changes in groundwater, and human-caused disturbances are also other potential triggering factors of landslides that need to be investigated. Therefore, although generalization of the results presented herein to other regions may sound logical, other factors triggering landslides must also be studied carefully alongside precipitation.

5. Conclusions

This research presents a multifaceted approach for analyzing slow-moving deformation in the landslide-prone areas of Central Apennines, Italy, utilizing PS-InSAR time series data from CSK and Sentinel-1 satellites. The study’s primary contribution lies in its innovative application of STPD for the precise detection of dates of significant velocity changes in landslide displacement. This application enabled the identification of trend changes to facilitate the generation of spatial maps illustrating both the timing and magnitude of these changes and providing a comprehensive view of landslide dynamics across the study area. A key advancement of this research is the application of STPD to investigate the interconnection between precipitation patterns and slow-moving landslides, establishing a validated approach to scrutinizing trend changes due to intense rainfall. This analysis revealed significant correlations that have been challenging to quantify in previous studies.
The results of this research uncovered that extreme precipitation events, particularly when followed by extended dry periods, play a crucial role in reactivating slow-moving landslides within the area of interest. This discovery contributes substantially to the understanding of the complex interplay between climate variability and landslide activity. Furthermore, this research identified a trend of gradual warming and increasingly dry seasons, expected to escalate the frequency of extreme precipitation events. This observation highlights the potential for increased landslide reactivation in Central Italy, emphasizing the urgent need for adaptive strategies in landslide risk management to mitigate socioeconomic risks and damages in the face of current and future climate change. By combining satellite-based displacement data with climate analysis, this study provides an innovative and holistic understanding of landslide behavior over time and space, representing a significant advancement in landslide monitoring and prediction methodologies in the context of changing climate patterns. Future research should build upon these findings to develop more accurate predictive models and risk assessment tools, incorporating the temporal and spatial patterns of landslide activity identified in this study. The methodologies developed here have the potential for application in other landslide-prone regions globally, contributing to improved landslide risk management strategies worldwide and enhancing resilience in vulnerable regions. Some of the main findings of the present research are summarized as follows:
  • Relatively more turning points in the PS-InSAR time series inside the landslide-prone polygons were detected during the summers of 2019 and 2020 for the Marche and Lazio sub-regions, respectively.
  • More than 80% of detected turning points in the PS-InSAR time series had a direction between 4 to 4 mm/year.
  • Ground-based and satellite-based (GPM) monthly precipitation time series generally had a strong correlation ( r 0.7 ) with similar turning points and directions.
  • The coastal sub-regions of Marche and Abruzzo were drier than the Umbria and Lazio sub-regions with an insignificant precipitation rate during 2017–2022.
  • Most of the turning points in the accumulated GPM precipitation time series were during the summers of 2017 and 2020 with positive directions, potentially reactivating many slow-moving landslides across the affected areas.

Author Contributions

Conceptualization, E.G., C.M., M.Z., F.B., G.S.M. and P.M.; Methodology, E.G.; Formal analysis, E.G.; Visualization, E.G.; Writing—original draft, E.G., C.M. and M.Z.; Data Curation, C.M. and M.Z.; Writing—review and editing, F.B., G.S.M. and P.M. All authors have read and agreed to the published version of the manuscript.

Funding

This research was financially supported by the CERI research center at Sapienza University of Rome and the ABDAC project: (000158_2021_ABDAC_Scarascia).

Data Availability Statement

The PS-InSAR time series utilized in this research are available upon a reasonable request. The STPD software implemented in this this study is available at: https://github.com/Ghaderpour/LSWAVE-SignalProcessing (accessed on 1 June 2024).

Acknowledgments

The authors thank European Space Agency and Italian Space Agency personnel for providing the PS-InSAR data and 3Bmeteo s.r.l. for precipitation data utilized in this research.

Conflicts of Interest

The authors declare no conflicts of interest.

Abbreviations

The following abbreviations are used in this manuscript:
ABDACAutorità di Bacino Distrettuale dell’Appennino Centrale
AOIAreas Of Interest
ASCAscending Orbit
CSKCOSMO-SkyMed
DESCDescending Orbit
DEMDigital Elevation Model
DIRTurning Point Direction
GPMGlobal Precipitation Measurement
NDRINormalized Difference Residual Index
PS-InSARPersistent Scatterer Interferometric Synthetic Aperture Radar
SARSynthetic Aperture Radar
STPDSequential Turning Point Detection

References

  1. Lacroix, P.; Handwerger, A.; Bièvre, G. Life and death of slow-moving landslides. Nat. Rev. Earth Environ. 2020, 1, 404–419. [Google Scholar] [CrossRef]
  2. Hilley, G.E.; Bürgmann, R.; Ferretti, A.; Novali, F.; Rocca, F. Dynamics of Slow-Moving Landslides from Permanent Scatterer Analysis. Science 2004, 304, 1952–1955. [Google Scholar] [CrossRef]
  3. Handwerger, A.L.; Roering, J.J.; Schmidt, D.A. Controls on the seasonal deformation of slow-moving landslides. Earth Planet. Sci. Lett. 2013, 377–378, 239–247. [Google Scholar] [CrossRef]
  4. Peruccacci, S.; Gariano, S.L.; Melillo, M.; Solimano, M.; Guzzetti, F.; Brunetti, M.T. The ITAlian rainfall-induced LandslIdes CAtalogue, an extensive and accurate spatio-temporal catalogue of rainfall-induced landslides in Italy. Earth Syst. Sci. Data 2023, 15, 2863–2877. [Google Scholar] [CrossRef]
  5. Fiolleau, S.; Uhlemann, S.; Wielandt, S.; Dafflon, B. Understanding slow-moving landslide triggering processes using low-cost passive seismic and inclinometer monitoring. J. Appl. Geophys. 2023, 215, 105090. [Google Scholar] [CrossRef]
  6. Narcisi, R.; Pappalardo, S.E.; Taddia, G.; De Marchi, M. Assessing climate impacts on slow-moving landslides in the western Alps of Piemonte: Integration of monitoring techniques for detecting displacements. Front. Earth Sci. 2024, 12, 1365469. [Google Scholar] [CrossRef]
  7. Rosen, P.; Hensley, S.; Joughin, I.; Li, F.; Madsen, S.; Rodriguez, E.; Goldstein, R. Synthetic aperture radar interferometry. Proc. IEEE 2000, 88, 333–382. [Google Scholar] [CrossRef]
  8. Ren, T.; Gong, W.; Gao, L.; Zhao, F.; Cheng, Z. An Interpretation Approach of Ascending–Descending SAR Data for Landslide Identification. Remote Sens. 2022, 14, 1299. [Google Scholar] [CrossRef]
  9. Yao, J.; Yao, X.; Liu, X. Landslide Detection and Mapping Based on SBAS-InSAR and PS-InSAR: A Case Study in Gongjue County, Tibet, China. Remote Sens. 2022, 14, 4728. [Google Scholar] [CrossRef]
  10. Sousa, J.J.; Ruiz, A.M.; Hanssen, R.F.; Bastos, L.; Gil, A.J.; Galindo-Zaldívar, J.; de Galdeano, C.S. PS-InSAR processing methodologies in the detection of field surface deformation–Study of the Granada basin (Central Betic Cordilleras, southern Spain). J. Geodyn. 2010, 49, 181–189. [Google Scholar] [CrossRef]
  11. Crosetto, M.; Monserrat, O.; Cuevas-González, M.; Devanthéry, N.; Crippa, B. Persistent scatterer interferometry: A review. ISPRS J. Photogramm. Remote Sens. 2016, 115, 78–89. [Google Scholar] [CrossRef]
  12. Ferretti, A.; Prati, C.; Rocca, F. Permanent scatterers in SAR interferometry. IEEE Trans. Geosci. Remote Sens. 2001, 39, 8–20. [Google Scholar] [CrossRef]
  13. Hooper, A.; Zebker, H.; Segall, P.; Kampes, B. A new method for measuring deformation on volcanoes and other natural terrains using InSAR persistent scatterers. Geophys. Res. Lett. 2004, 31, L23611. [Google Scholar] [CrossRef]
  14. Cascini, L.; Fornaro, G.; Peduto, D. Analysis at medium scale of low-resolution DInSAR data in slow-moving landslide-affected areas. ISPRS J. Photogramm. Remote Sens. 2009, 64, 598–611. [Google Scholar] [CrossRef]
  15. Barra, A.; Monserrat, O.; Mazzanti, P.; Esposito, C.; Crosetto, M.; Scarascia Mugnozza, G. First insights on the potential of Sentinel-1 for landslides detection. Geomat. Nat. Hazards Risk 2016, 7, 1874–1883. [Google Scholar] [CrossRef]
  16. Moretto, S.; Bozzano, F.; Mazzanti, P. The Role of Satellite InSAR for Landslide Forecasting: Limitations and Openings. Remote Sens. 2021, 13, 3735. [Google Scholar] [CrossRef]
  17. Martino, S.; Fiorucci, M.; Marmoni, G.M.; Casaburi, L.; Antonielli, B.; Mazzanti, P. Increase in landslide activity after a low-magnitude earthquake as inferred from DInSAR interferometry. Sci. Rep. 2022, 12, 2686. [Google Scholar] [CrossRef] [PubMed]
  18. Bontemps, N.; Lacroix, P.; Larose, E.; Jara, J.; Taipe, E. Rain and small earthquakes maintain a slow-moving landslide in a persistent critical state. Nat. Commun. 2020, 11, 780. [Google Scholar] [CrossRef] [PubMed]
  19. Zocchi, M.; Kasaragod, A.K.; Jenkins, A.; Cook, C.; Dobson, R.; Oommen, T.; Van Huis, D.; Taylor, B.; Brooks, C.; Marini, R.; et al. Multi-Sensor and Multi-Scale Remote Sensing Approach for Assessing Slope Instability along Transportation Corridors Using Satellites and Uncrewed Aircraft Systems. Remote Sens. 2023, 15, 3016. [Google Scholar] [CrossRef]
  20. Bayer, B.; Simoni, A.; Mulas, M.; Corsini, A.; Schmidt, D. Deformation responses of slow moving landslides to seasonal rainfall in the Northern Apennines, measured by InSAR. Geomorphology 2018, 308, 293–306. [Google Scholar] [CrossRef]
  21. Zeyada, H.H.; Mostafa, M.S.; Ezz, M.M.; Nasr, A.H.; Harb, H.M. Resolving phase unwrapping in interferometric synthetic aperture radar using deep recurrent residual U-Net. Egypt. J. Remote. Sens. Space Sci. 2022, 25, 1–10. [Google Scholar] [CrossRef]
  22. Ghaderpour, E.; Antonielli, B.; Bozzano, F.; Scarascia Mugnozza, G.; Mazzanti, P. A Fast and Robust Method for Detecting Trend Turning Points in InSAR Displacement Time Series. Comput. Geosci. 2024, 185, 105546. [Google Scholar] [CrossRef]
  23. Ghaderpour, E.; Mazzanti, P.; Bozzano, F.; Scarascia Mugnozza, G. Ground Deformation Monitoring via PS-InSAR Time Series An Industrial Zone in Sacco River Valley, Central Italy. Remote. Sens. Appl. Soc. Environ. 2024, 34, 101191. [Google Scholar] [CrossRef]
  24. Polcari, M.; Montuori, A.; Bignami, C.; Moro, M.; Stramondo, S.; Tolomei, C. Using multi-band InSAR data for detecting local deformation phenomena induced by the 2016–2017 Central Italy seismic sequence. Remote Sens. Environ. 2017, 201, 234–242. [Google Scholar] [CrossRef]
  25. Marzocchi, W.; Taroni, M.; Falcone, G. Earthquake forecasting during the complex Amatrice-Norcia seismic sequence. Sci. Adv. 2017, 3, e1701239. [Google Scholar] [CrossRef]
  26. Sebastiani, G.; Govoni, A.; Pizzino, L. Aftershock patterns in recent central Apennines sequences. J. Geophys. Res. Solid Earth 2019, 124, 3881–3897. [Google Scholar] [CrossRef]
  27. Brozzetti, F.; Mondini, A.; Pauselli, C.; Mancinelli, P.; Cirillo, D.; Guzzetti, F.; Lavecchia, G. Mainshock Anticipated by Intra-Sequence Ground Deformations: Insights from Multiscale Field and SAR Interferometric Measurements. Geosciences 2020, 10, 186. [Google Scholar] [CrossRef]
  28. Carboni, F.; Porreca, M.; Valerio, E.; Mariarosaria, M.; Luca, C.D.; Azzaro, S.; Ercoli, M.; Barchi, M.R. Surface ruptures and off-fault deformation of the October 2016 central Italy earthquakes from DInSAR data. Sci. Rep. 2022, 12, 3172. [Google Scholar] [CrossRef]
  29. Martino, S.; Bozzano, F.; Caporossi, P.; D’Angiò, D.; Della Seta, M.; Esposito, C.; Fantini, A.; Fiorucci, M.; Giannini, L.M.; Iannucci, R.; et al. Impact of landslides on transportation routes during the 2016–2017 Central Italy seismic sequence. Landslides 2019, 16, 1221–1241. [Google Scholar] [CrossRef]
  30. Mandler, E.; Pintori, F.; Gualandi, A.; Anderlini, L.; Serpelloni, E.; Belardinelli, M. Post-seismic deformation related to the 2016 Central Italy seismic sequence from GPS displacement time-series. J. Geophys. Res. Solid Earth 2021, 126, e2021JB022200. [Google Scholar] [CrossRef]
  31. Pousse-Beltran, L.; Socquet, A.; Benedetti, L.; Doin, M.P.; Rizza, M.; D’Agostino, N. Localized afterslip at geometrical complexities revealed by InSAR after the 2016 Central Italy seismic sequence. J. Geophys. Res. Solid Earth 2020, 125, e2019JB019065. [Google Scholar] [CrossRef]
  32. Salvini, R.; Vanneschi, C.; Lanciano, C.; Maseroli, R. Ground Displacements Estimation through GNSS and Geometric Leveling: A Geological Interpretation of the 2016–2017 Seismic Sequence in Central Italy. Geosciences 2022, 12, 167. [Google Scholar] [CrossRef]
  33. Martino, S.; Bozzano, F.; Caporossi, P.; D’Angiò, D.; Della Seta, M.; Esposito, C.; Fantini, A.; Fiorucci, M.; Giannini, L.M.; Iannucci, R.; et al. Ground effects triggered by the August 24th 2016, Mw 6.0 Amatrice (Italy) Earthquake: Survey and Inventorying to update the CEDIT catalogue. Geogr. Fis. Din. Quat. 2017, 40, 1–20. [Google Scholar] [CrossRef]
  34. Di Naccio, D.; Kastelic, V.; Carafa, M.M.C.; Esposito, C.; Milillo, P.; Di Lorenzo, C. Gravity Versus Tectonics: The Case of 2016 Amatrice and Norcia (Central Italy) Earthquakes Surface Coseismic Fractures. J. Geophys. Res. Earth Surf. 2019, 124, 994–1017. [Google Scholar] [CrossRef]
  35. Tapiador, F.; Navarro, A.; Levizzani, V.; García-Ortega, E.; Huffman, G.; Kidd, C.; Kucera, P.; Kummerow, C.; Masunaga, H.; Petersen, W.; et al. Global precipitation measurements for validating climate models. Atmos. Res. 2017, 197, 1–20. [Google Scholar] [CrossRef]
  36. Kazemzadeh, M.; Hashemi, H.; Jamali, S.; Uvo, C.; Berndtsson, R.; Huffman, G. Detecting the Greatest Changes in Global Satellite-Based Precipitation Observations. Remote Sens. 2022, 14, 5433. [Google Scholar] [CrossRef]
  37. Ghaderpour, E.; Mazzanti, P.; Scarascia Mugnozza, G.; Bozzano, F. Coherency and phase delay analyses between land cover and climate across Italy via the least-squares wavelet software. Int. J. Appl. Earth Obs. Geoinf. 2023, 118, 103241. [Google Scholar] [CrossRef]
  38. Ghaderpour, E.; Dadkhah, H.; Dabiri, H.; Bozzano, F.; Scarascia Mugnozza, G.; Mazzanti, P. Precipitation Time Series Analysis and Forecasting for Italian Regions. Eng. Proc. 2023, 39, 23. [Google Scholar] [CrossRef]
  39. Woods, D.; Kirstetter, P.E.; Vergara, H.; Duarte, J.A.; Basara, J. Hydrologic evaluation of the global precipitation measurement mission over the U.S.: Flood peak discharge and duration. J. Hydrol. 2023, 617, 129124. [Google Scholar] [CrossRef]
  40. Tarquini, S.; Isola, I.; Favalli, M.; Battistini, A.; Dotta, G. TINITALY, a Digital Elevation Model of Italy with a 10 Meters Cell Size (Version 1.1); Istituto Nazionale di Geofisica e Vulcanologia (INGV): Roma, Italy, 2023. [Google Scholar] [CrossRef]
  41. Bausilio, G.; Khalili, M.A.; Virelli, M.; Di Martire, D. Sedimentology and physical stratigraphy of the Messinian turbidite deposits of the Laga Basin (central Apennines, Italy). Bollettino-Societa Geologica Italiana. Boll.-Soc. Geol. Ital. 2007, 126, 225. [Google Scholar]
  42. Bigi, S.; Casero, P.; Ciotoli, G. Seismic interpretation of the Laga basin; constraints on the structural setting and kinematics of the Central Apennines. J. Geol. Soc. 2011, 168, 179–190. [Google Scholar] [CrossRef]
  43. Carminati, E.; Doglioni, C. Alps vs. Apennines: The paradigm of a tectonically asymmetric Earth. Earth-Science Reviews. Ital. J. Geosci. 2012, 112, 67–96. [Google Scholar]
  44. Pierantoni, P.; Deiana, G.; Galdenzi, S. Stratigraphic and structural features of the Sibillini mountains (Umbria-Marche Apennines, Italy). Ital. J. Geosci. 2013, 132, 497–520. [Google Scholar] [CrossRef]
  45. Marini, M.; Milli, S.; Ravnas, R.; Moscatelli, M. A comparative study of confined vs. semi-confined turbidite lobes from the Lower Messinian Laga Basin (Central Apennines, Italy): Implications for assessment of reservoir architecture. Mar. Pet. Geol. 2015, 63, 142–165. [Google Scholar] [CrossRef]
  46. Nocentini, M.; Cosentino, D.; Spadi, M.; Tallini, M. Plio-quaternary geology of the Paganica-San Demetrio-Castelnuovo basin (Central Italy). J. Maps 2018, 14, 411–420. [Google Scholar] [CrossRef]
  47. Di Bucci, D.; Buttinelli, M.; D’Ambrogi, C.; Scrocca, D.; the RETRACE-3D Working Group. RETRACE-3D project: A multidisciplinary collaboration to build a crustal model for the 2016–2018 central Italy seismic sequence. Boll. Geofis. Teor. Appl. 2020, 62 Pt A, 1–18. [Google Scholar]
  48. Amanti, M.; Muraro, C.; Roma, M.; Chiessi, V.; Puzzilli, L.M.; Catalano, S.; Romagnoli, G.; Tortorici, G.; Cavuoto, G.; Albarello, D.; et al. Geological and geotechnical models definition for 3rd level seismic microzonation studies in Central Italy. Bull. Earthq. Eng. 2020, 18, 5441–5473. [Google Scholar] [CrossRef]
  49. Aringoli, D.; Farabollini, P.; Pambianchi, G.; Materazzi, M.; Bufalini, M.; Fuffa, E.; Gentilucci, M.; Scalella, G. Geomorphological Hazard in Active Tectonics Area: Study Cases from Sibillini Mountains Thrust System (Central Apennines). Land 2021, 10, 510. [Google Scholar] [CrossRef]
  50. Carabella, C.; Cinosi, J.; Piattelli, V.; Burrato, P.; Miccadei, E. Earthquake-induced landslides susceptibility evaluation: A case study from the Abruzzo region (Central Italy). Catena 2022, 208, 105729. [Google Scholar] [CrossRef]
  51. Della Seta, M.; Martino, S.; Scarascia Mugnozza, G. Quaternary sea-level change and slope instability in coastal areas: Insights from the Vasto Landslide (Adriatic coast, central Italy). Geomorphology 2013, 201, 462–478. [Google Scholar] [CrossRef]
  52. Ferretti, A.; Prati, C.; Rocca, F. Nonlinear subsidence rate estimation using permanent scatterers in differential SAR interferometry. IEEE Trans. Geosci. Remote Sens. 2000, 38, 2202–2212. [Google Scholar] [CrossRef]
  53. Kampes, B. Radar Interferometry; Springer: Berlin, Germany, 2006; Volume 12. [Google Scholar]
  54. Bozzano, F.; Carabella, C.; De Pari, P.; Discenza, M.; Fantucci, R.; Mazzanti, P.; Miccadei, E.; Rocca, A.; Romano, S.; Sciarra, N. Geological and geomorphological analysis of a complex landslides system: The case of San Martino sulla Marruccina (Abruzzo, Central Italy). J. Maps 2020, 16, 126–136. [Google Scholar] [CrossRef]
  55. Potin, P.; Bargellini, P.; Laur, H.; Rosich, B.; Schmuck, S. Sentinel-1 mission operations concept. In Proceedings of the 2012 IEEE International Geoscience and Remote Sensing Symposium, Munich, Germany, 22–27 July 2012; pp. 1745–1748. [Google Scholar] [CrossRef]
  56. Geudtner, D.; Torres, R.; Snoeij, P.; Davidson, M.; Rommen, B. Sentinel-1 System capabilities and applications. In Proceedings of the 2014 IEEE Geoscience and Remote Sensing Symposium, Quebec City, QC, Canada, 13–18 July 2014; pp. 1457–1460. [Google Scholar] [CrossRef]
  57. Covello, F.; Battazza, F.; Coletta, A.; Lopinto, E.; Fiorentino, C.; Pietranera, L.; Valentini, G.; Zoffoli, S. COSMO-SkyMed an existing opportunity for observing the Earth. J. Geodyn. 2010, 49, 171–180. [Google Scholar] [CrossRef]
  58. Covello, F.; Battagliere, M.L.; Coletta, A. The Contribution Of The COSMO-SkyMed Space System In The International Context. In Proceedings of the ESA Living Planet Symposium, Edinburgh, UK, 9–13 September 2013; Volume 722, p. 112. [Google Scholar]
  59. Costantini, M.; Falco, S.; Malvarosa, F.; Minati, F.; Trillo, F. Method of persistent scatterer pairs (PSP) and high resolution SAR interferometry. In Proceedings of the 2009 IEEE International Geoscience and Remote Sensing Symposium, Cape Town, South Africa, 12–17 July 2009; Volume 3, pp. III-904–III-907. [Google Scholar] [CrossRef]
  60. Huffman, G.; Stocker, E.; Bolvin, D.; Nelkin, E.; Tan, J. GPM IMERG Final Precipitation L3 1 Month 0.1 Degree x 0.1 Degree V07; Goddard Earth Sciences Data and Information Services Center (GES DISC): Greenbelt, MD, USA, 2019. [Google Scholar] [CrossRef]
  61. Ghaderpour, E.; Pagiatakis, S.D.; Hassan, Q.K. A Survey on Change Detection and Time Series Analysis with Applications. Appl. Sci. 2021, 11, 6141. [Google Scholar] [CrossRef]
  62. Urgilez Vinueza, A.; Handwerger, A.; Bakker, M.; Bogaard, T. A new method to detect changes in displacement rates of slow-moving landslides using InSAR time series. Landslides 2022, 19, 2233–2247. [Google Scholar] [CrossRef]
  63. Ghaderpour, E.; Mazzanti, P.; Bozzano, F.; Scarascia Mugnozza, G. Trend Analysis of MODIS Land Surface Temperature and Land Cover in Central Italy. Land 2024, 13, 796. [Google Scholar] [CrossRef]
  64. Iannucci, R.; Lenti, L.; Martino, S. Seismic monitoring system for landslide hazard assessment and risk management at the drainage plant of the Peschiera Springs (Central Italy). Eng. Geol. 2020, 277, 105787. [Google Scholar] [CrossRef]
  65. Gariano, S.L.; Guzzetti, F. Landslides in a changing climate. Earth-Sci. Rev. 2016, 162, 227–252. [Google Scholar] [CrossRef]
  66. King, A.D.; Lane, T.P.; Henley, B.J.; Brown, J.R. Global and regional impacts differ between transient and equilibrium warmer worlds. Nat. Clim. Chang. 2020, 10, 42–47. [Google Scholar] [CrossRef]
  67. Mondini, A.C.; Guzzetti, F.; Chang, K.T.; Monserrat, O.; Martha, T.R.; Manconi, A. Landslide failures detection and mapping using Synthetic Aperture Radar: Past, present and future. Earth-Sci. Rev. 2021, 216, 103574. [Google Scholar] [CrossRef]
  68. Cifrodelli, M.; Corradini, C.; Morbidelli, R.; Saltalippi, C.; Flammini, A. The Influence of Climate Change on Heavy Rainfalls in Central Italy. Procedia Earth Planet. Sci. 2015, 15, 694–701. [Google Scholar] [CrossRef]
  69. Luppichini, M.; Bini, M.; Giannecchini, R.; Zanchetta, G. High-resolution spatial analysis of temperature influence on the rainfall regime and extreme precipitation events in north-central Italy. Sci. Total. Environ. 2023, 880, 163368. [Google Scholar] [CrossRef]
  70. Tichavský, R.; Ballesteros-Cánovas, J.A.; Šilhán, K.; Tolasz, R.; Stoffel, M. Dry Spells and Extreme Precipitation are The Main Trigger of Landslides in Central Europe. Sci. Rep. 2019, 9, 14560. [Google Scholar] [CrossRef]
  71. Martino, S.; Antonielli, B.; Bozzano, F.; Caprari, P.; Discenza, M.E.; Esposito, C.; Fiorucci, M.; Iannucci, R.; Marmoni, G.M.; Schilirò, L. Landslides triggered after the 16 August 2018 Mw 5.1 Molise earthquake (Italy) by a combination of intense rainfalls and seismic shaking. Landslides 2020, 17, 1177–1190. [Google Scholar] [CrossRef]
  72. Confuorto, P.; Casagli, N.; Casu, F.; De Luca, C.; Del Soldato, M.; Festa, D.; Lanari, R.; Manzo, M.; Onorato, G.; Raspini, F. Sentinel-1 P-SBAS data for the update of the state of activity of national landslide inventory maps. Landslides 2019, 20, 1083–1097. [Google Scholar] [CrossRef]
  73. Bausilio, G.; Khalili, M.A.; Virelli, M.; Di Martire, D. Italian COSMO-SkyMed atlas: R-Index and the percentage of measurability of movement. GISci. Remote. Sens. 2024, 61, 2312705. [Google Scholar] [CrossRef]
  74. Antonielli, B.; Mazzanti, P.; Rocca, A.; Bozzano, F.; Dei Cas, L. A-DInSAR Performance for Updating Landslide Inventory in Mountain Areas: An Example from Lombardy Region (Italy). Geosciences 2019, 9, 364. [Google Scholar] [CrossRef]
  75. Bozzano, F.; Mazzanti, P.; Prestininzi, A.; Scarascia Mugnozza, G. Research and development of advanced technologies for landslide hazard analysis in Italy. Landslides 2010, 7, 381–385. [Google Scholar] [CrossRef]
  76. Bozzano, F.; Cipriani, I.; Mazzanti, P.; Prestininzi, A. Displacement patterns of a landslide affected by human activities: Insights from ground-based InSAR monitoring. Nat. Hazards 2011, 59, 1377–1396. [Google Scholar] [CrossRef]
  77. Moretto, S.; Bozzano, F.; Esposito, C.; Mazzanti, P.; Rocca, A. Assessment of landslide pre-failure monitoring and forecasting using satellite SAR interferometry. Geosciences 2017, 7, 36. [Google Scholar] [CrossRef]
  78. Rosi, A.; Tofani, V.; Tanteri, L.; Tacconi Stefanelli, C.; Agostini, A.; Catani, F.; Casagli, N. The new landslide inventory of Tuscany (Italy) updated with PS-InSAR: Geomorphological features and landslide distribution. Landslides 2018, 15, 5–19. [Google Scholar] [CrossRef]
  79. Ferlisi, S.; Gullà, G.; Nicodemo, G.; Peduto, D. A multi-scale methodological approach for slow-moving landslide risk mitigation in urban areas, southern Italy. Euro-Mediterr. J. Environ. Integr. 2019, 4, 20. [Google Scholar] [CrossRef]
  80. Sciortino, A.; Marini, R.; Guerriero, V.; Mazzanti, P.; Spadi, M.; Tallini, M. Satellite A-DInSAR pattern recognition for seismic vulnerability mapping at city scale: Insights from the L’Aquila (Italy) case study. GISci. Remote. Sens. 2024, 61, 2293522. [Google Scholar] [CrossRef]
  81. Moyroud, N.; Portet, F. Introduction to QGIS. In QGIS and Generic Tools; John Wiley & Sons, Ltd.: Hoboken, NJ, USA, 2018; Chapter 1; pp. 1–17. [Google Scholar] [CrossRef]
  82. Rosas-Chavoya, M.; Gallardo-Salazar, J.L.; López-Serrano, P.M.; Alcántara-Concepción, P.C.; León-Miranda, A.K. QGIS a constantly growing free and open-source geospatial software contributing to scientific development. Cuad. Investig. GeográFica 2022, 48, 197–213. [Google Scholar] [CrossRef]
  83. Ghaderpour, E.; Antonielli, B.; Bozzano, F.; Scarascia Mugnozza, G.; Mazzanti, P. Detecting Trend Turning Points in PS-InSAR Time Series: Slow-Moving Landslides in Province of Frosinone, Italy. Eng. Proc. 2024, 68, 12. [Google Scholar] [CrossRef]
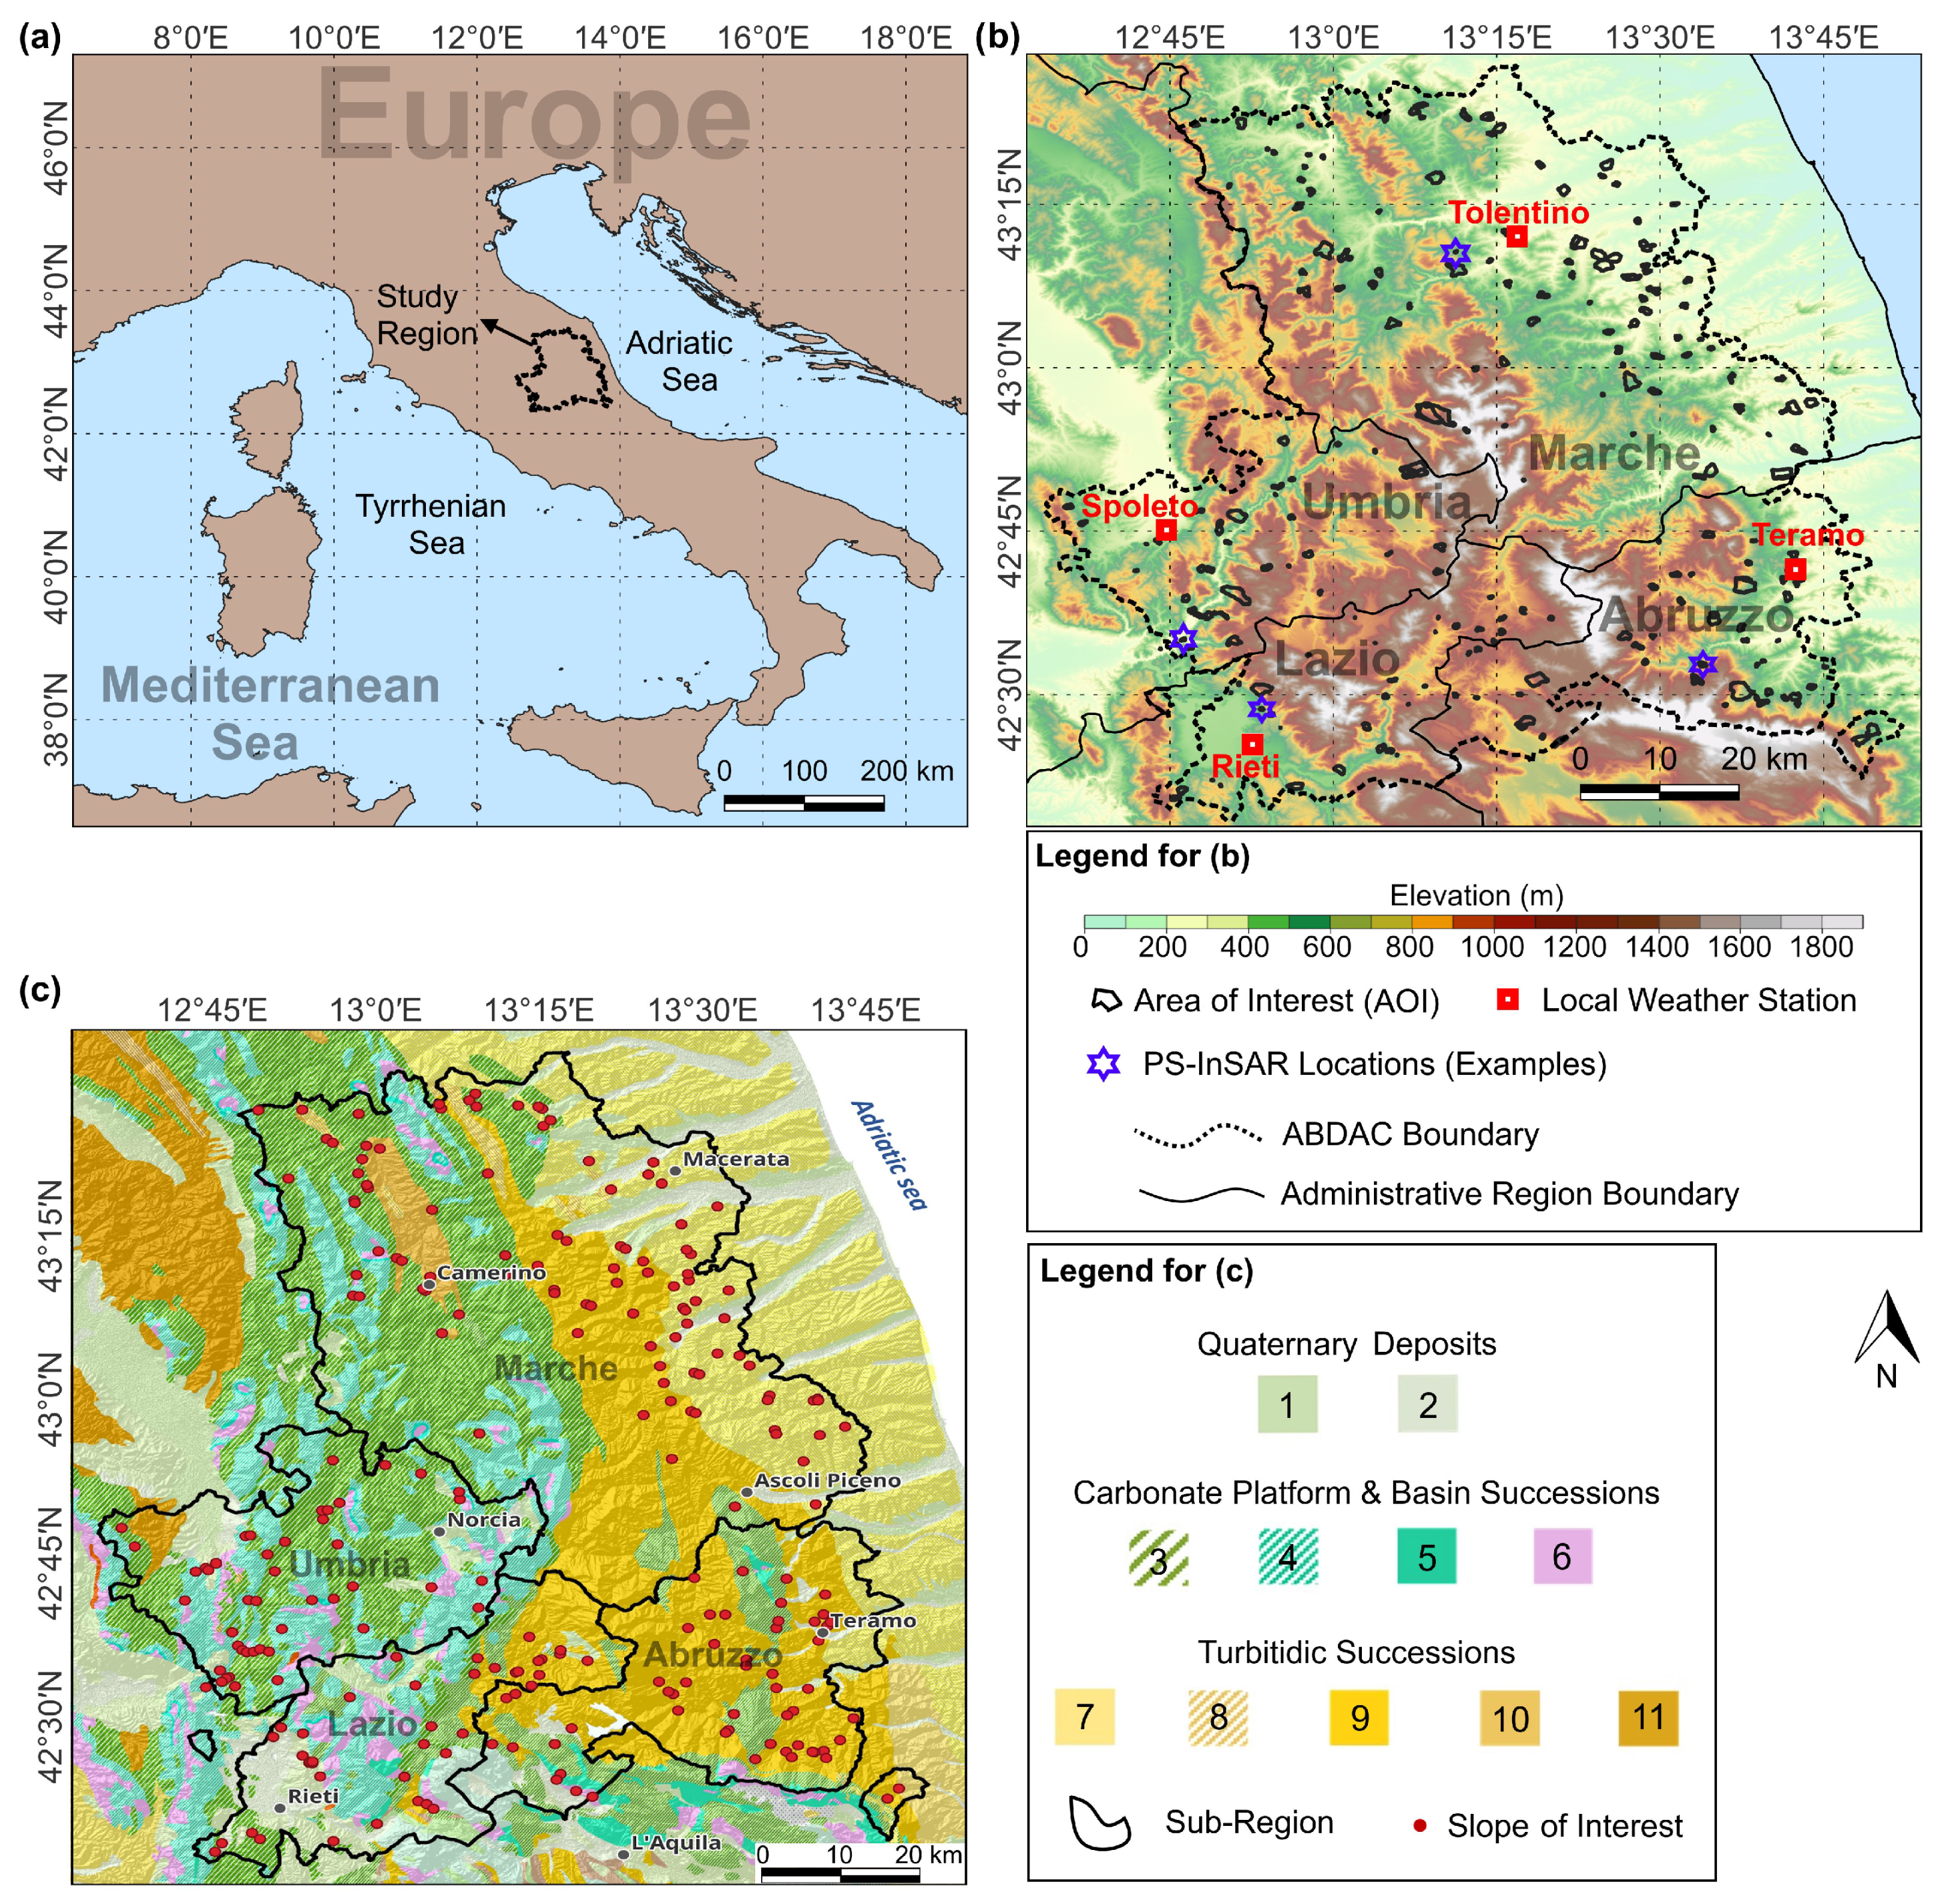
Figure 1. (a) The study region in central Italy, (b) areas of interest (AOI) within the small polygons and with the background elevation model at 10 m resolution, by Tarquini et al. [40], and (c) geological map (scale 1:1,000,000) of the study area (ISPRA: Italian Institute for Environmental Protection and Research, 2017), where the numbers inside the colored boxes refer to 1. Terraced alluvial deposits (Pleistocene–Holocene), 2. Deltaic, coastal, and alluvial deposits (Pleistocene–Holocene), 3. Calcareous marly–calcareous rocks with cherts (Jurassic–Miocene), 4. Limestones and dolomitic rocks with cherts (Late Triassic–Cretaceous), 5. Cherty limestones and marls (Jurassic), 6. Limestones and dolomitic rocks (Triassic–Jurassic), 7. Detrital and organogenic limestones, marl, pelites, sands, and conglomerates (Pilocene–Pleistocene), 8. Marly limestone, marls, pelites, and sandstones (Messinian–Pliocene), 9. Arenaceous–clayey turbitides (Tortonian–Messinian), 10. Calcareous–marly, marly–arenaceous, and pelitic turbitides (Tortonian–Messinian), and 11. Calcareous–marly and marly-arenaceous turbitides (Burdigalian–Tortonian).
Remotesensing 16 03055 g001
Figure 2. Workflow of this research. Acronyms GPM, STPD, NDRI, and DIR mean global precipitation measurement, sequential turning point detection, normalized difference residual index, and turning point direction, respectively.
Remotesensing 16 03055 g002
Figure 8. The STPD results of accumulated precipitation for (a) Tolentino in Marche, (b) Spoleto in Umbria, (c) Teramo in Abruzzo, and (d) Rieti in Lazio. The bars in cyan show monthly precipitations. The dark blue circles are cumulative monthly precipitation. The red lines are the STPD estimated linear trends with multiple connected linear pieces, and “D” denotes the direction amount of turning points in mm/year. The locations of the weather stations are displayed in Figure 1.
Remotesensing 16 03055 g008
Figure 9. The STPD results of accumulated GPM time series for (a) Tolentino, (b) Spoleto, (c) Teramo, and (d) Rieti; see caption of Figure 8 for more details.
Remotesensing 16 03055 g009
Figure 10. The Pearson correlation (r) between monthly GPM and station-based monthly precipitation measurements for (a) Tolentino, (b) Spoleto, (c) Teramo, and (d) Rieti. The blue line is the estimated linear trend while the dashed line indicates the ideal match.
Remotesensing 16 03055 g010
Figure 11. (a) The average map, and (b) the velocity map of the monthly GPM precipitation time series from 2017 to 2023.
Remotesensing 16 03055 g011
Figure 12. The direction map of turning points in per-pixel monthly GPM time series from 2017 to 2023 for (a) Summer of 2017, (b) Winter and Spring of 2019, (c) Summer and Fall of 2020, and (d) the bar chart of all the turning points. The frequency on the y-axis is the number of GPM pixels.
Remotesensing 16 03055 g012
Table 1. Information about the PS-InSAR time series for ascending and descending orbits within AOI, i.e., the subset of 255 landslide bodies. The thresholds are | NDRI | < 0.3 , | DIR | > 0.2 and only non-increasing or non-decreasing time series.
GeometryNumber of PSNumber of PS with Turning PointsNumber of PS with Turning Points after Applying All the Thresholds
Ascending158,759117,985 (74.3%)21,506 (13.5%)
Descending864,408532,901 (61.6%)59,792 (6.9%)
Table 2. Classification of the estimated turning points using the information from the landslide inventory map and geological field survey. The second and third columns show the number of PS with turning points.
Landslide ClassSentinel-1CSK
Sliding272210,067
Complex7993181
Flow3401262
Deep Gravitational Deformations2715
Disclaimer/Publisher’s Note: The statements, opinions and data contained in all publications are solely those of the individual author(s) and contributor(s) and not of MDPI and/or the editor(s). MDPI and/or the editor(s) disclaim responsibility for any injury to people or property resulting from any ideas, methods, instructions or products referred to in the content.