
Refined Landslide Susceptibility Mapping Considering Land Use Changes and InSAR Deformation: A Case Study of Yulin City, Guangxi

Abstract
1. Introduction
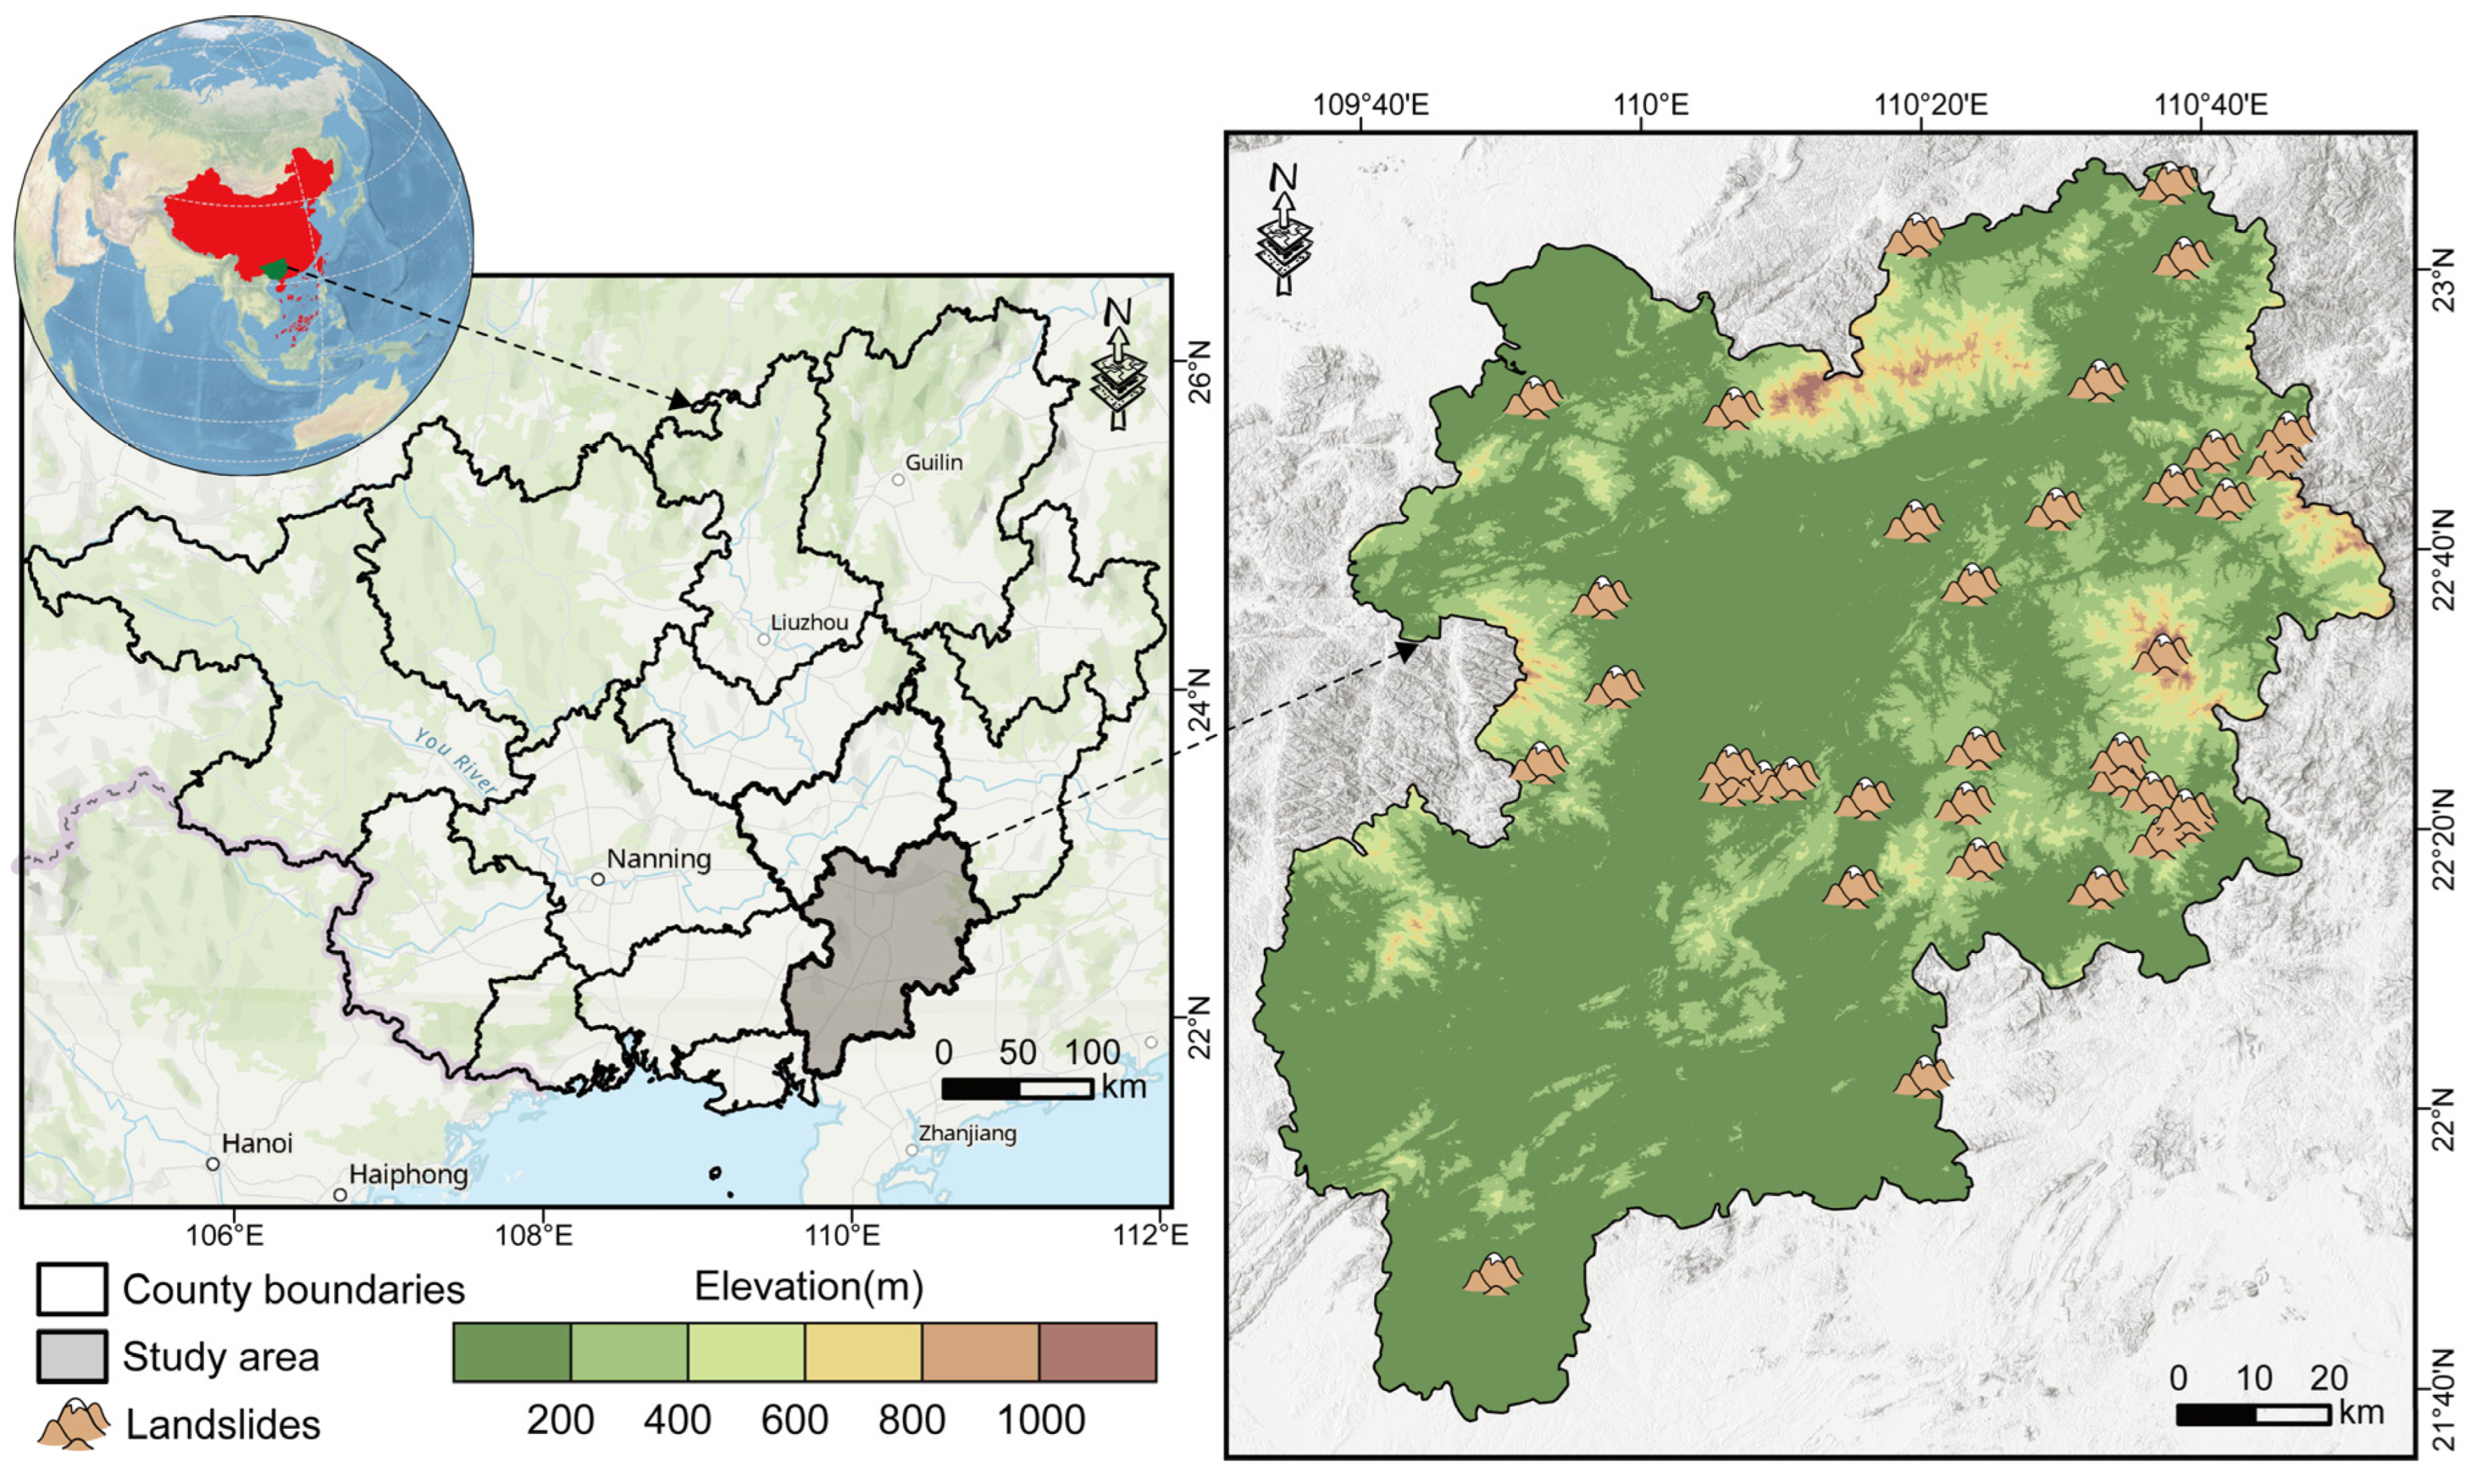
2. Study Area
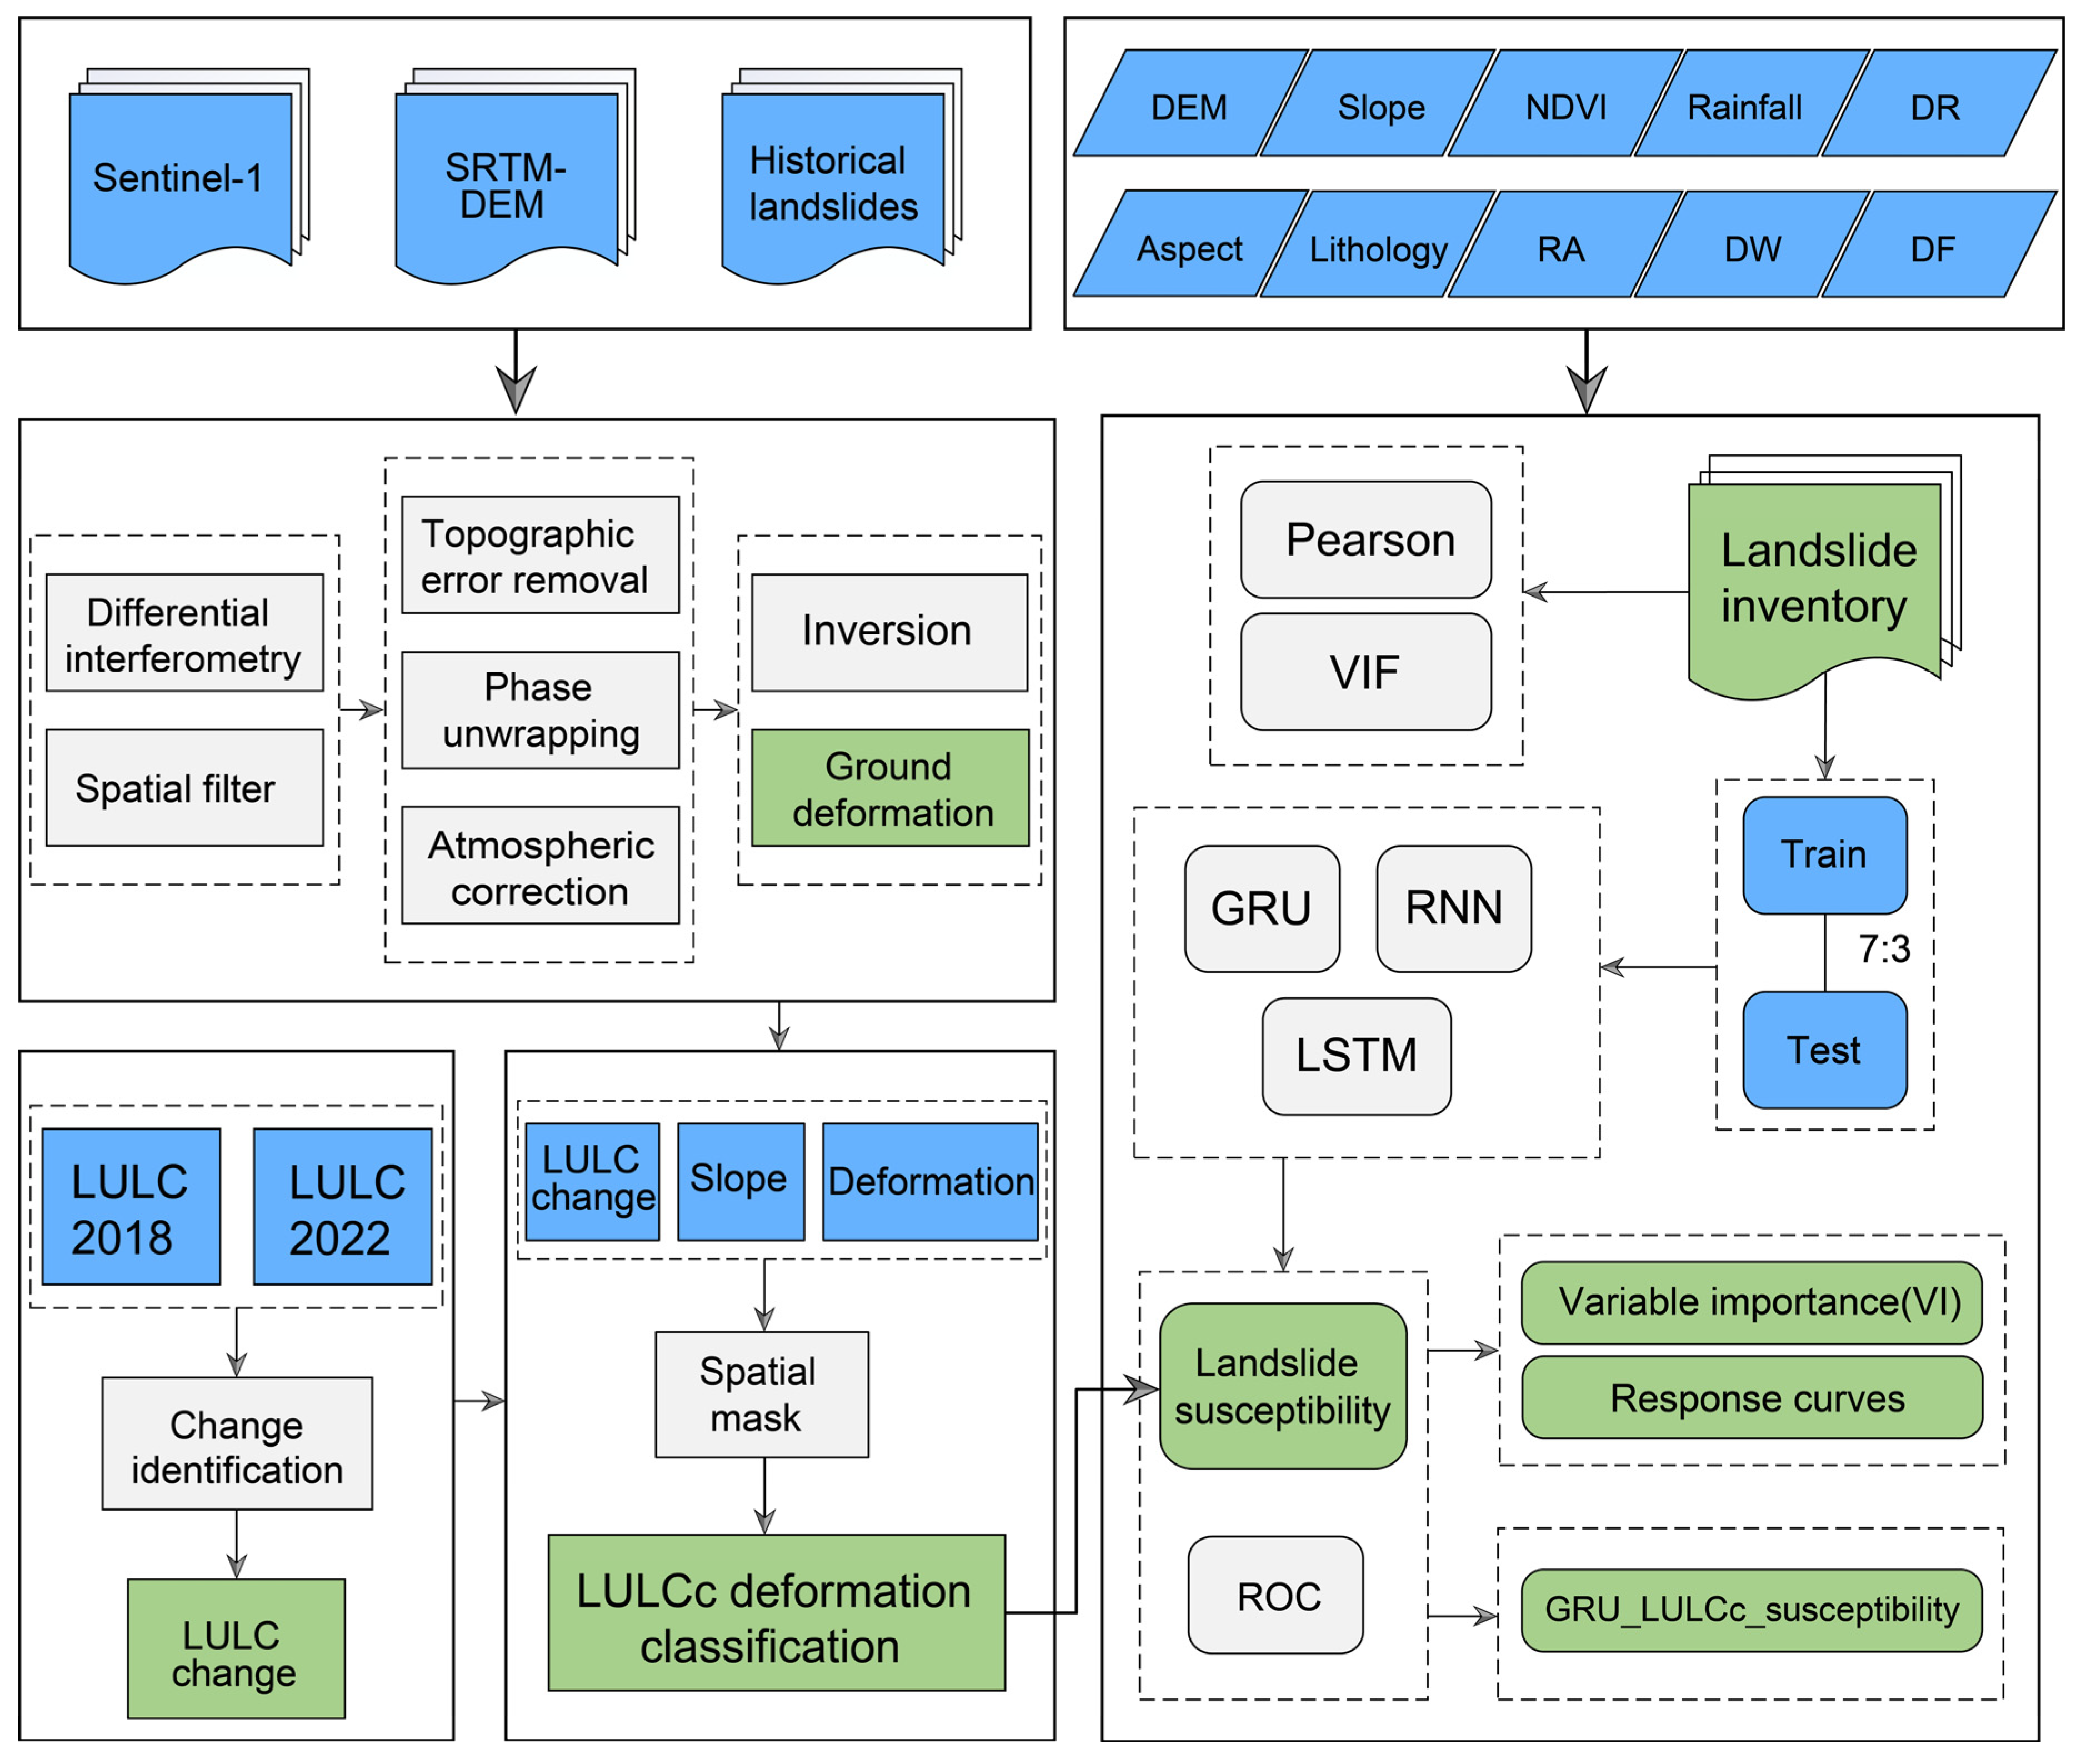
3. Materials and Methods
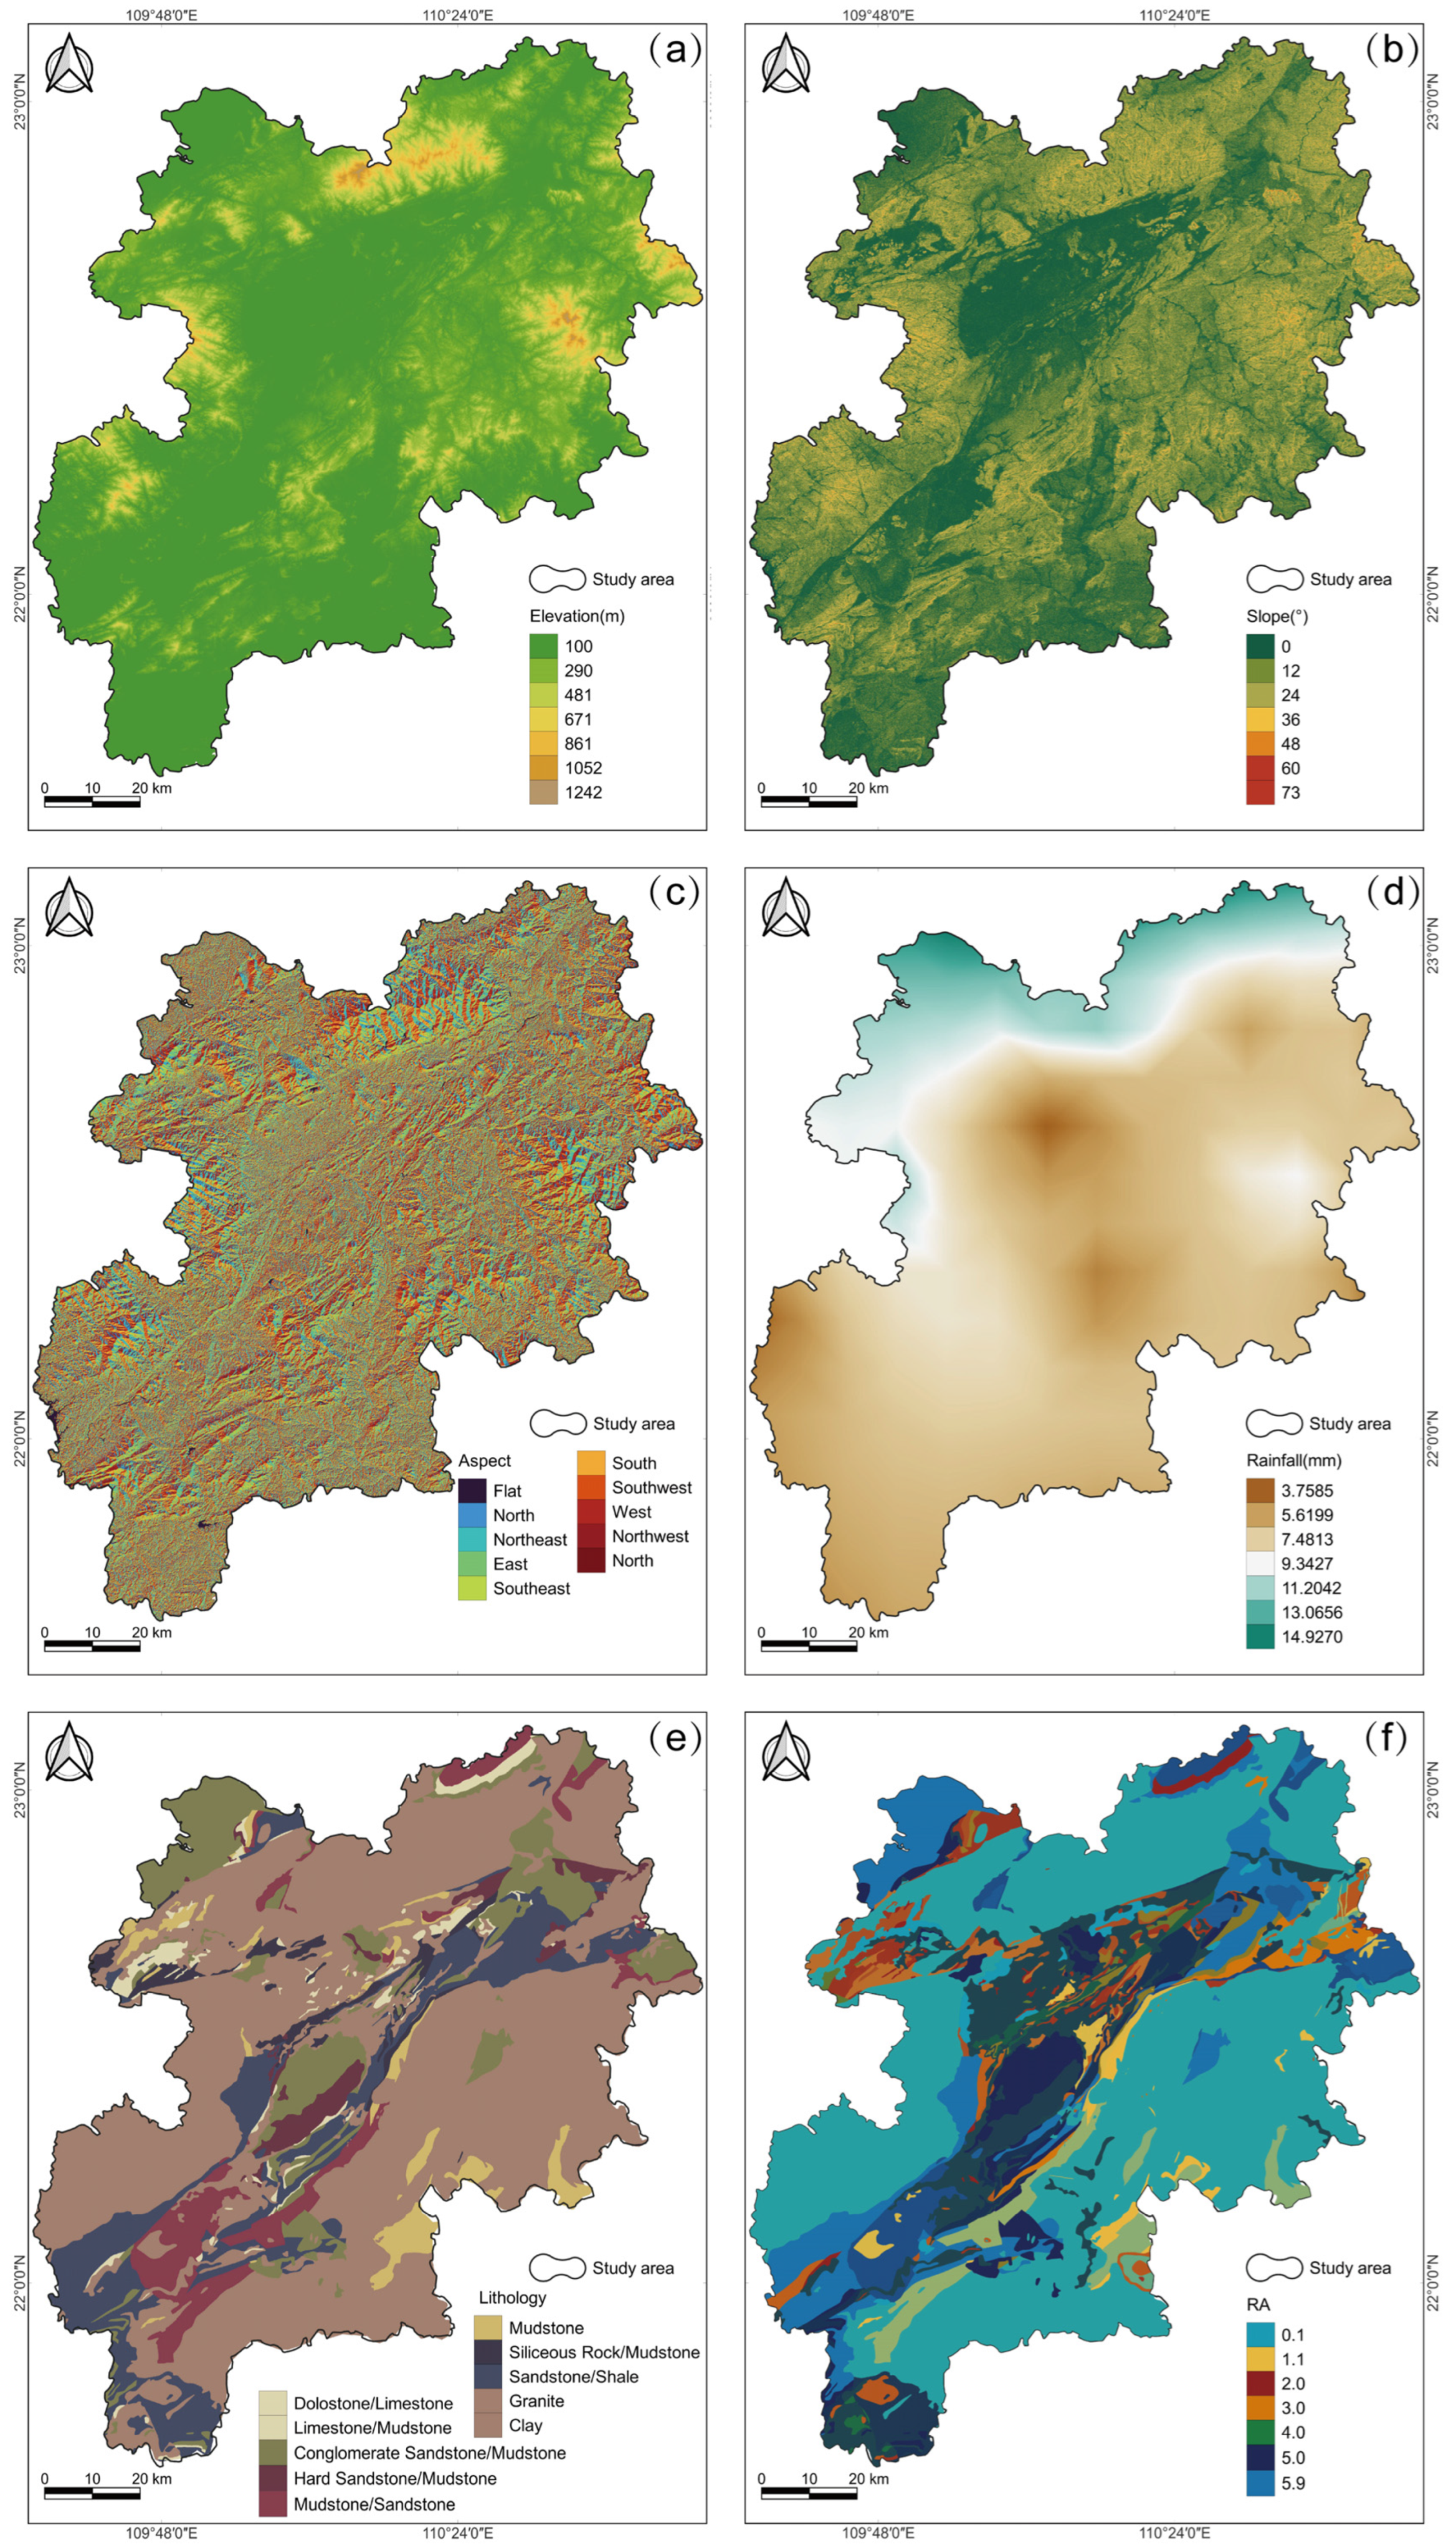
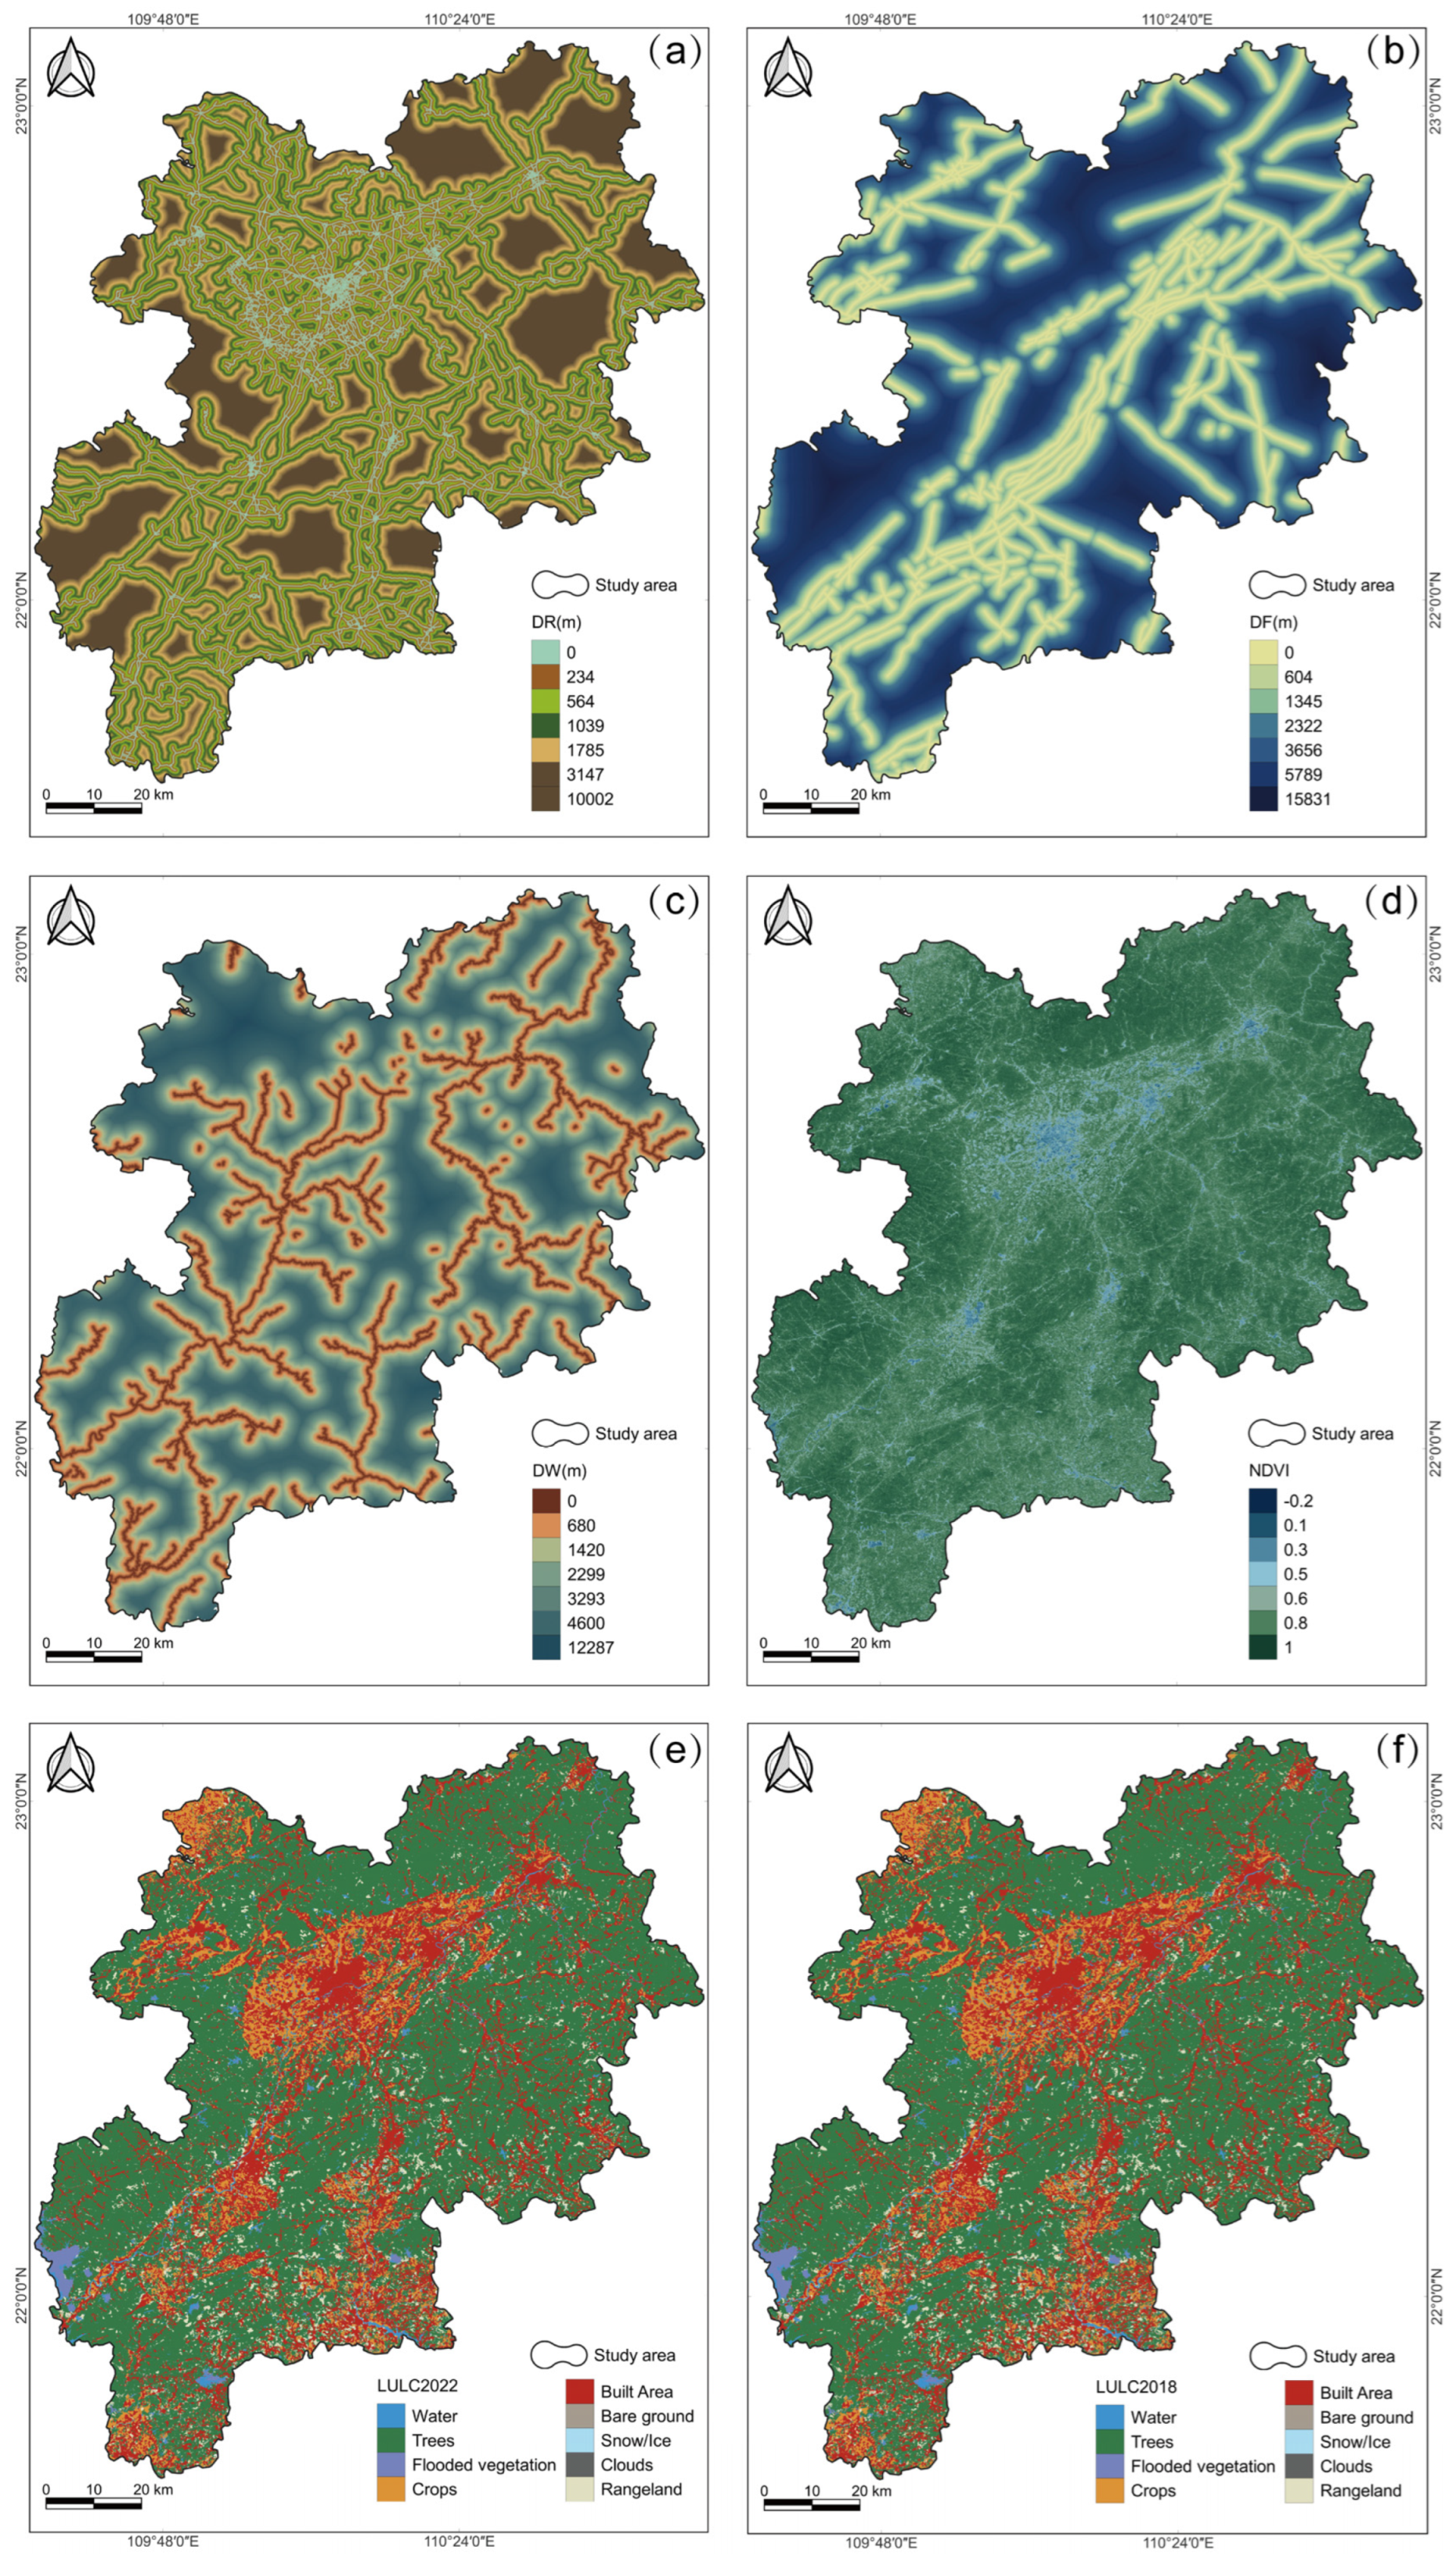
3.1. Data Preparation
3.2. Susceptibility Mapping
3.3. Potential Landslides Detection
3.3.1. LULC Change Detection
3.3.2. SBAS-InSAR
- (1)
- LULC change: Using multi-temporal optical remote sensing images, we identified areas where LULC changes had occurred in the study area and created a buffer zone with a radius of 200 m. Rapid development of LULC changes could have led to geological instability, so these areas were given special attention.
- (2)
- Surface deformation: Based on the ground deformation maps obtained from SBAS-InSAR processing, we identified possible landslide areas. Areas with deformation were marked as potential landslide candidate areas.
- (3)
- Slope: Slope could help us identify the topographic features of landslides. Areas with slopes were given priority consideration.
3.4. Susceptibility Integration
4. Results
4.1. Landslide Susceptibility Map
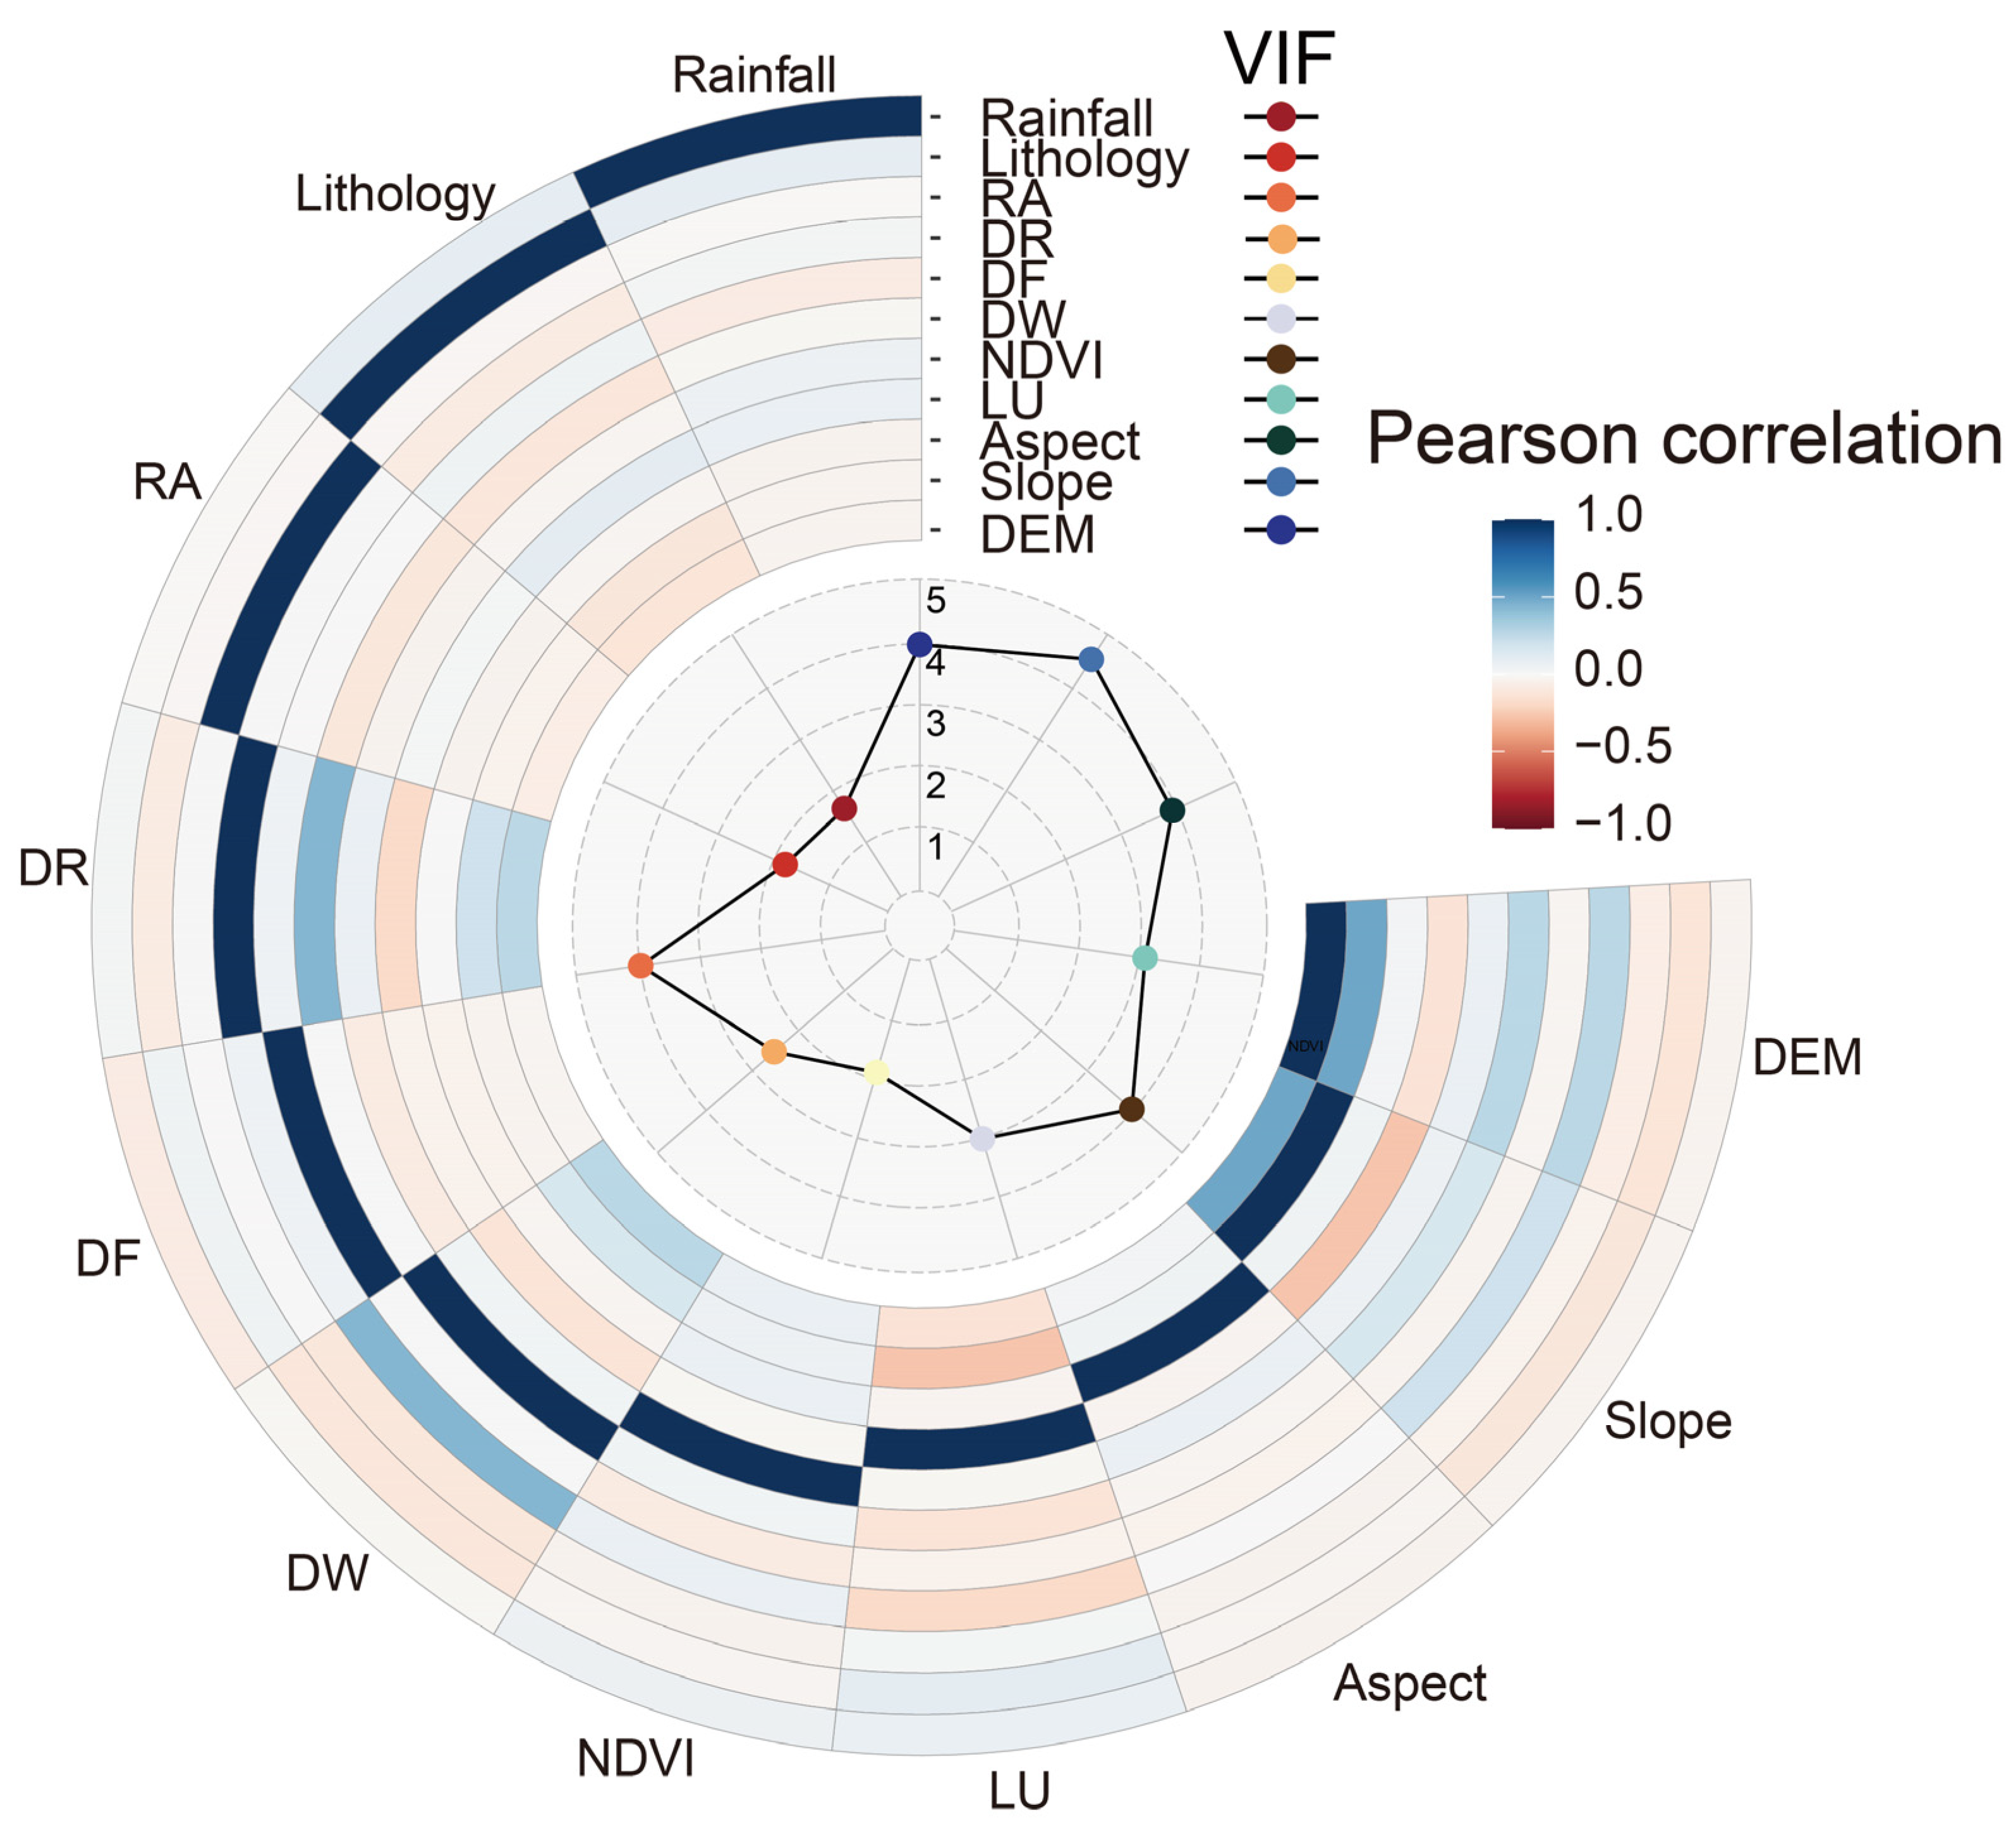
4.1.1. Correlation Analysis
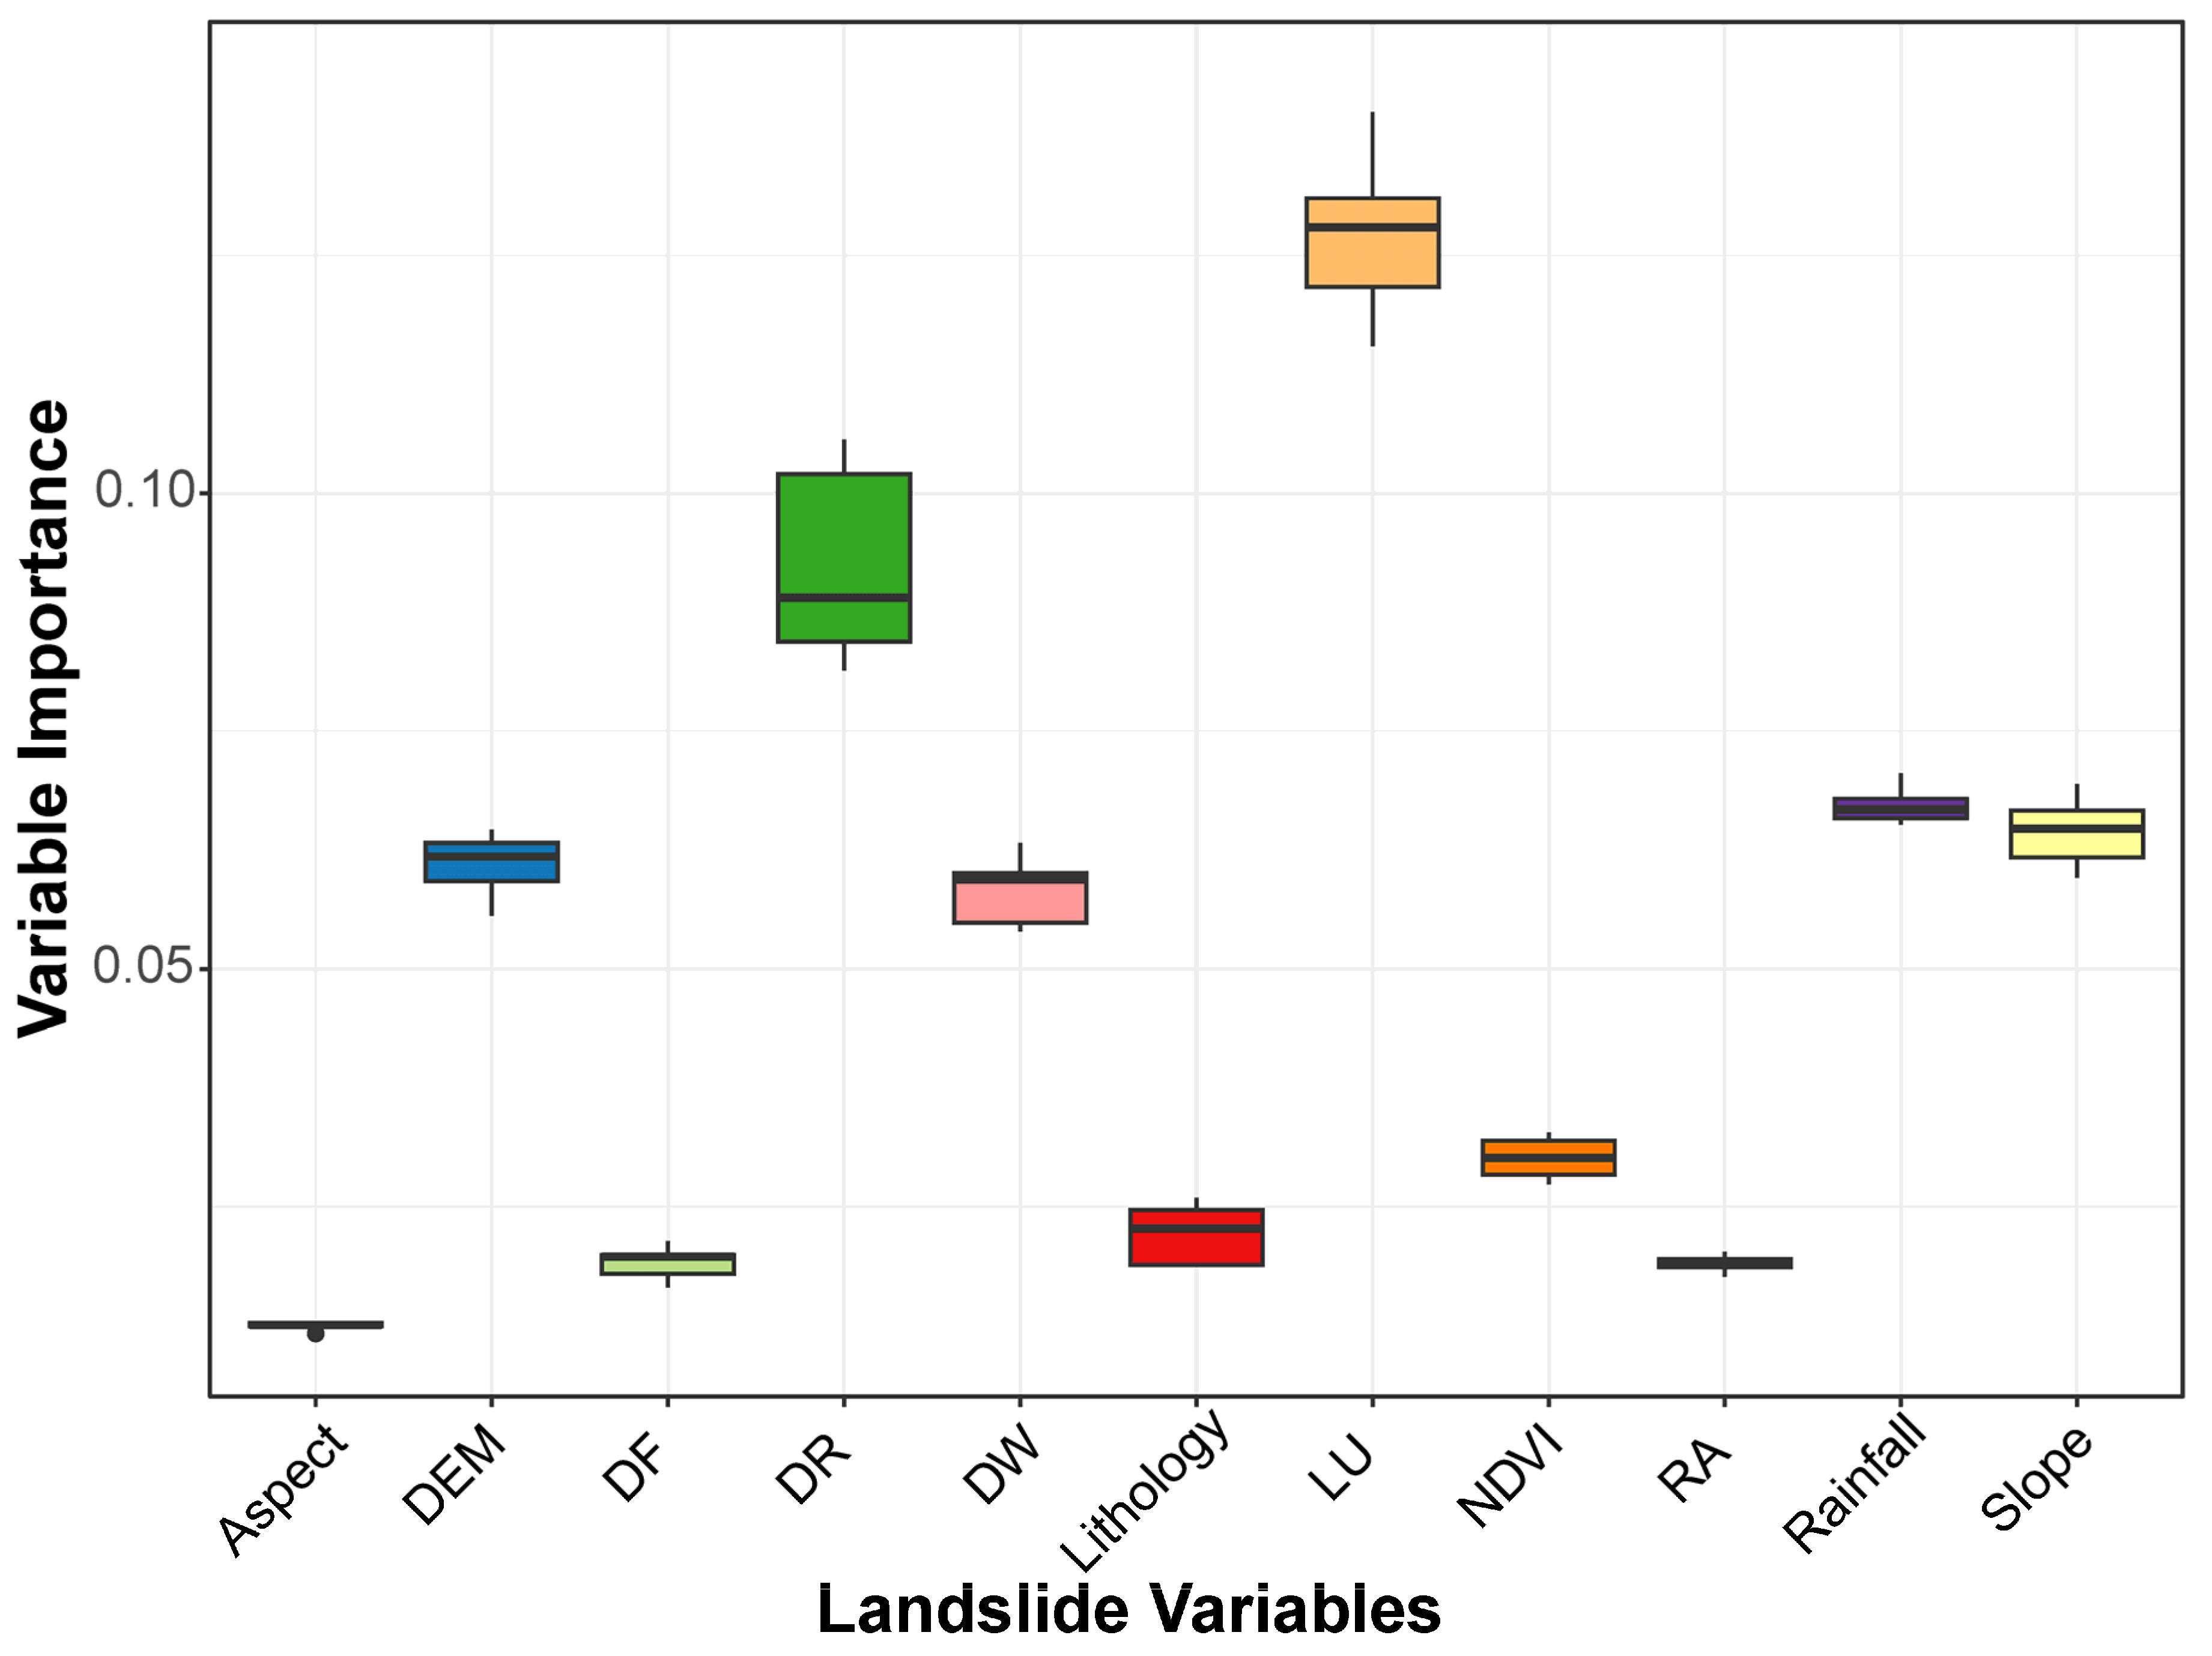
4.1.2. Importance Analysis
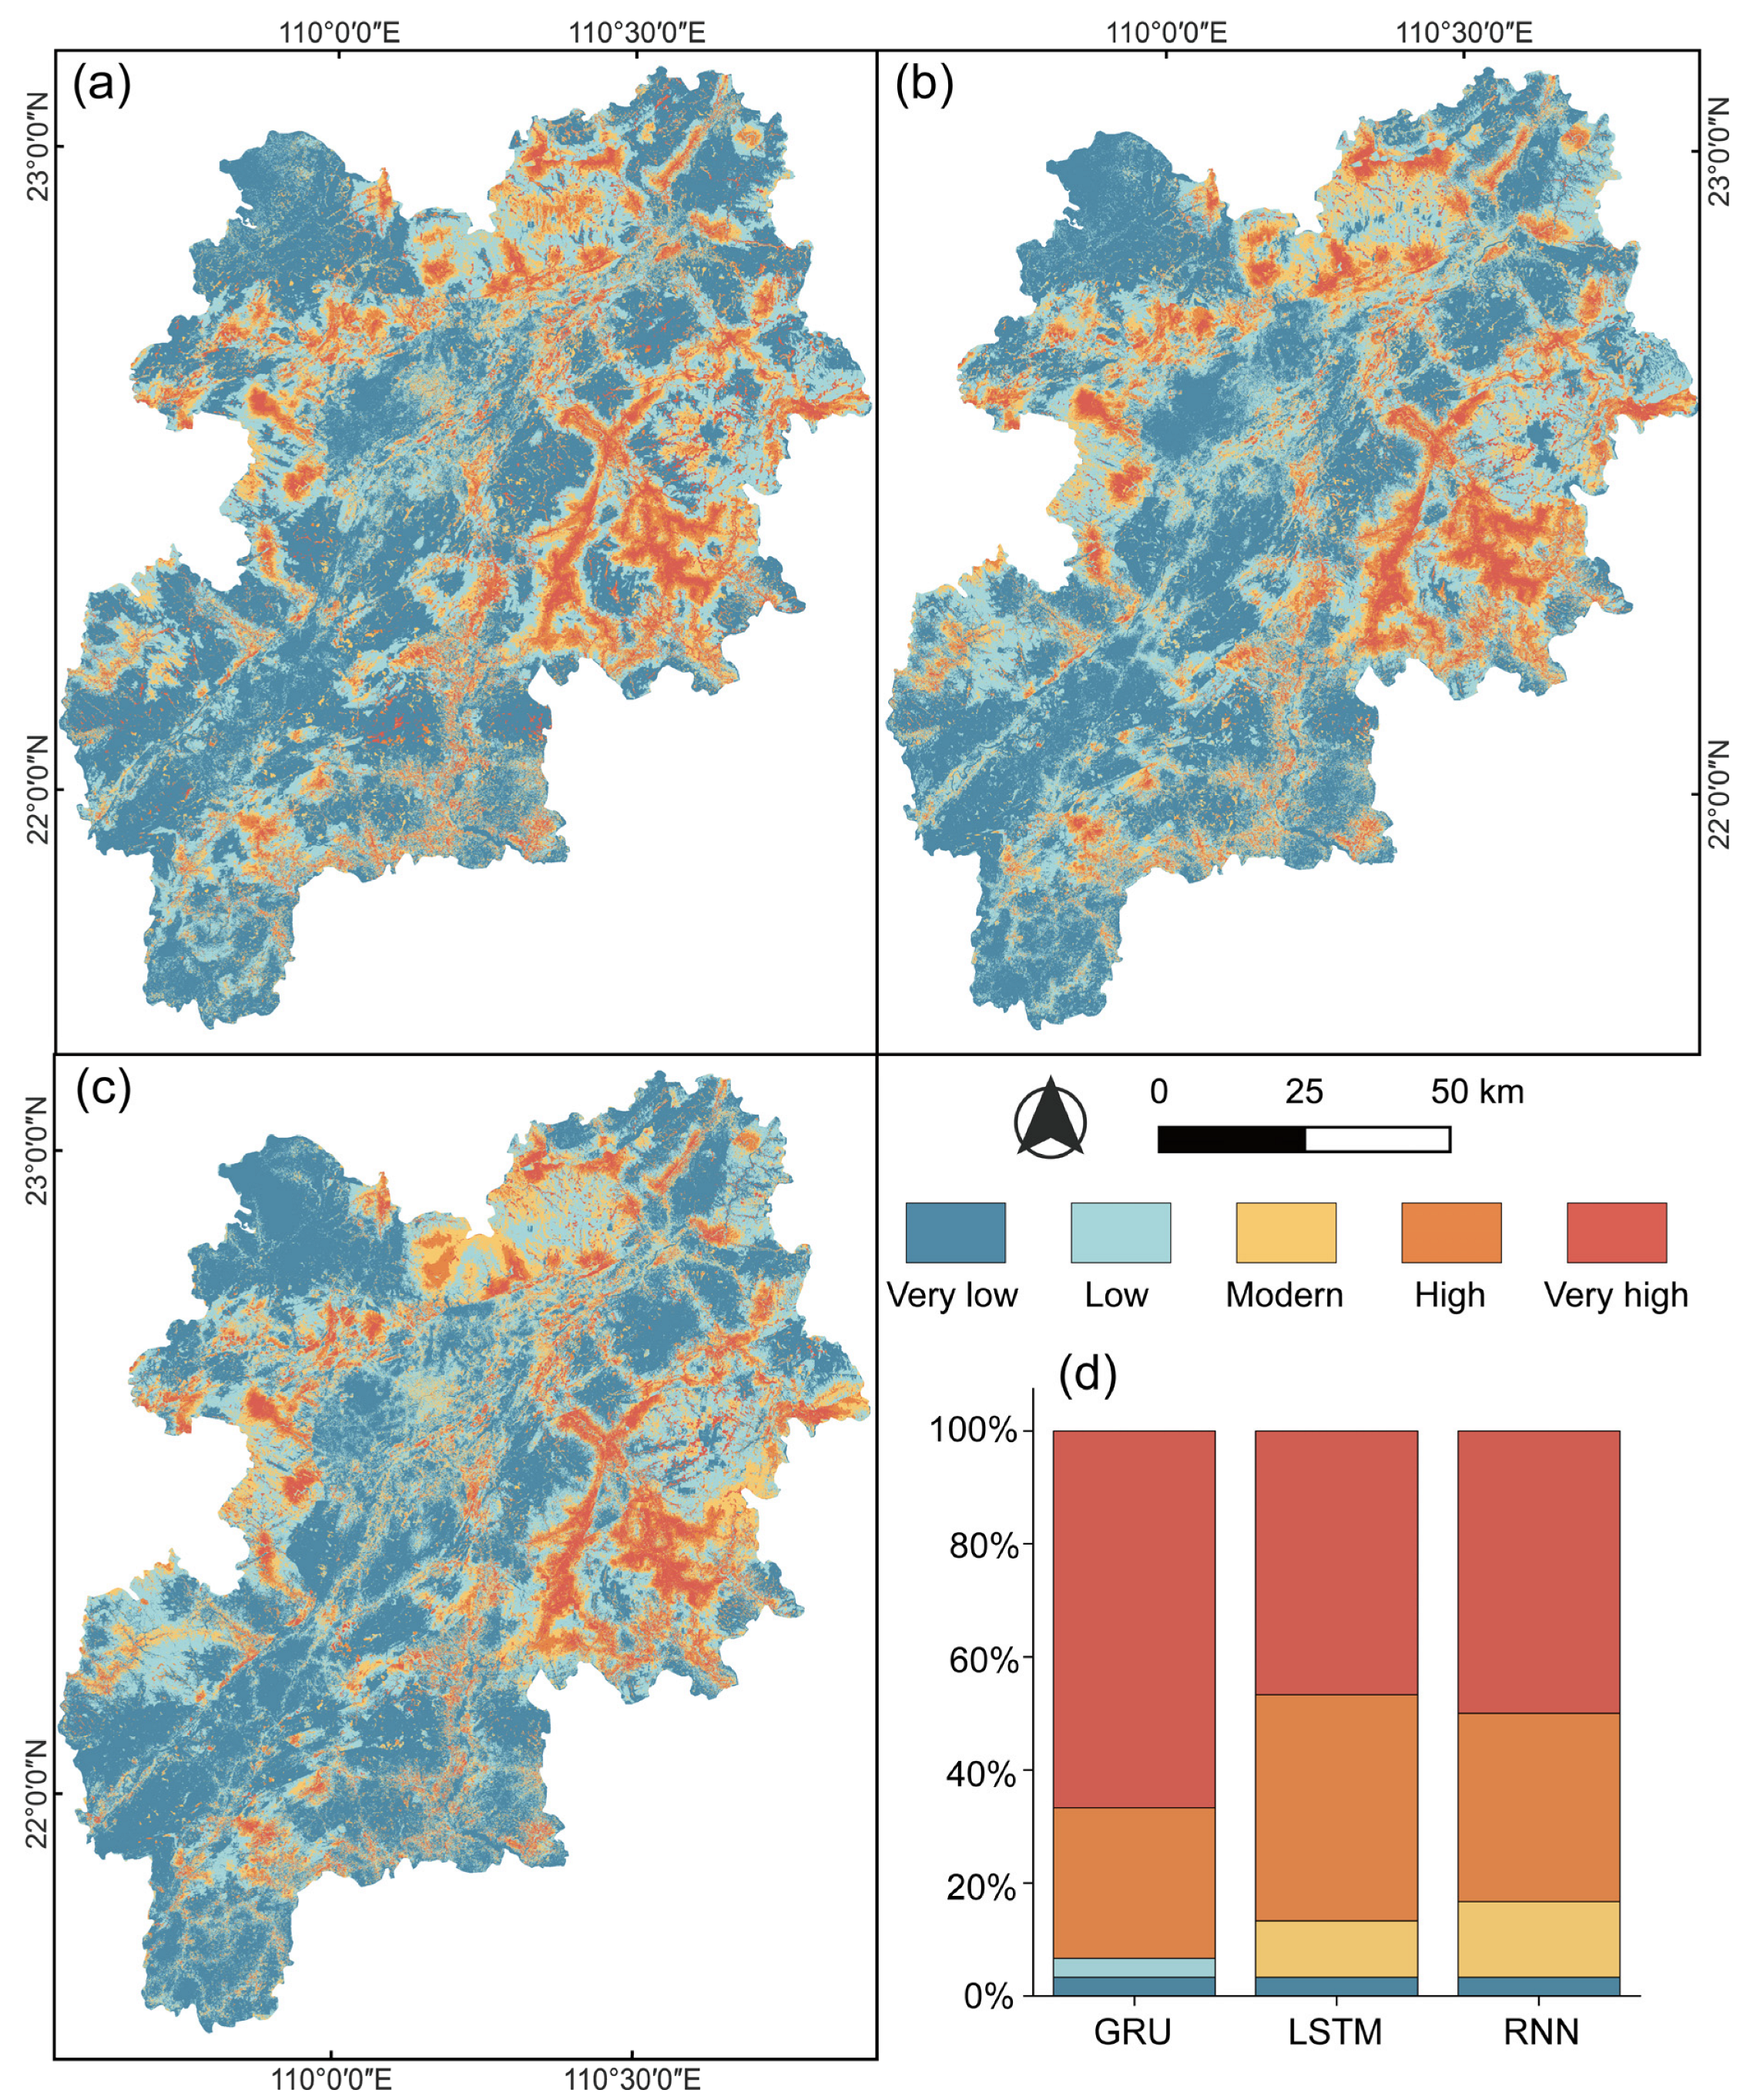
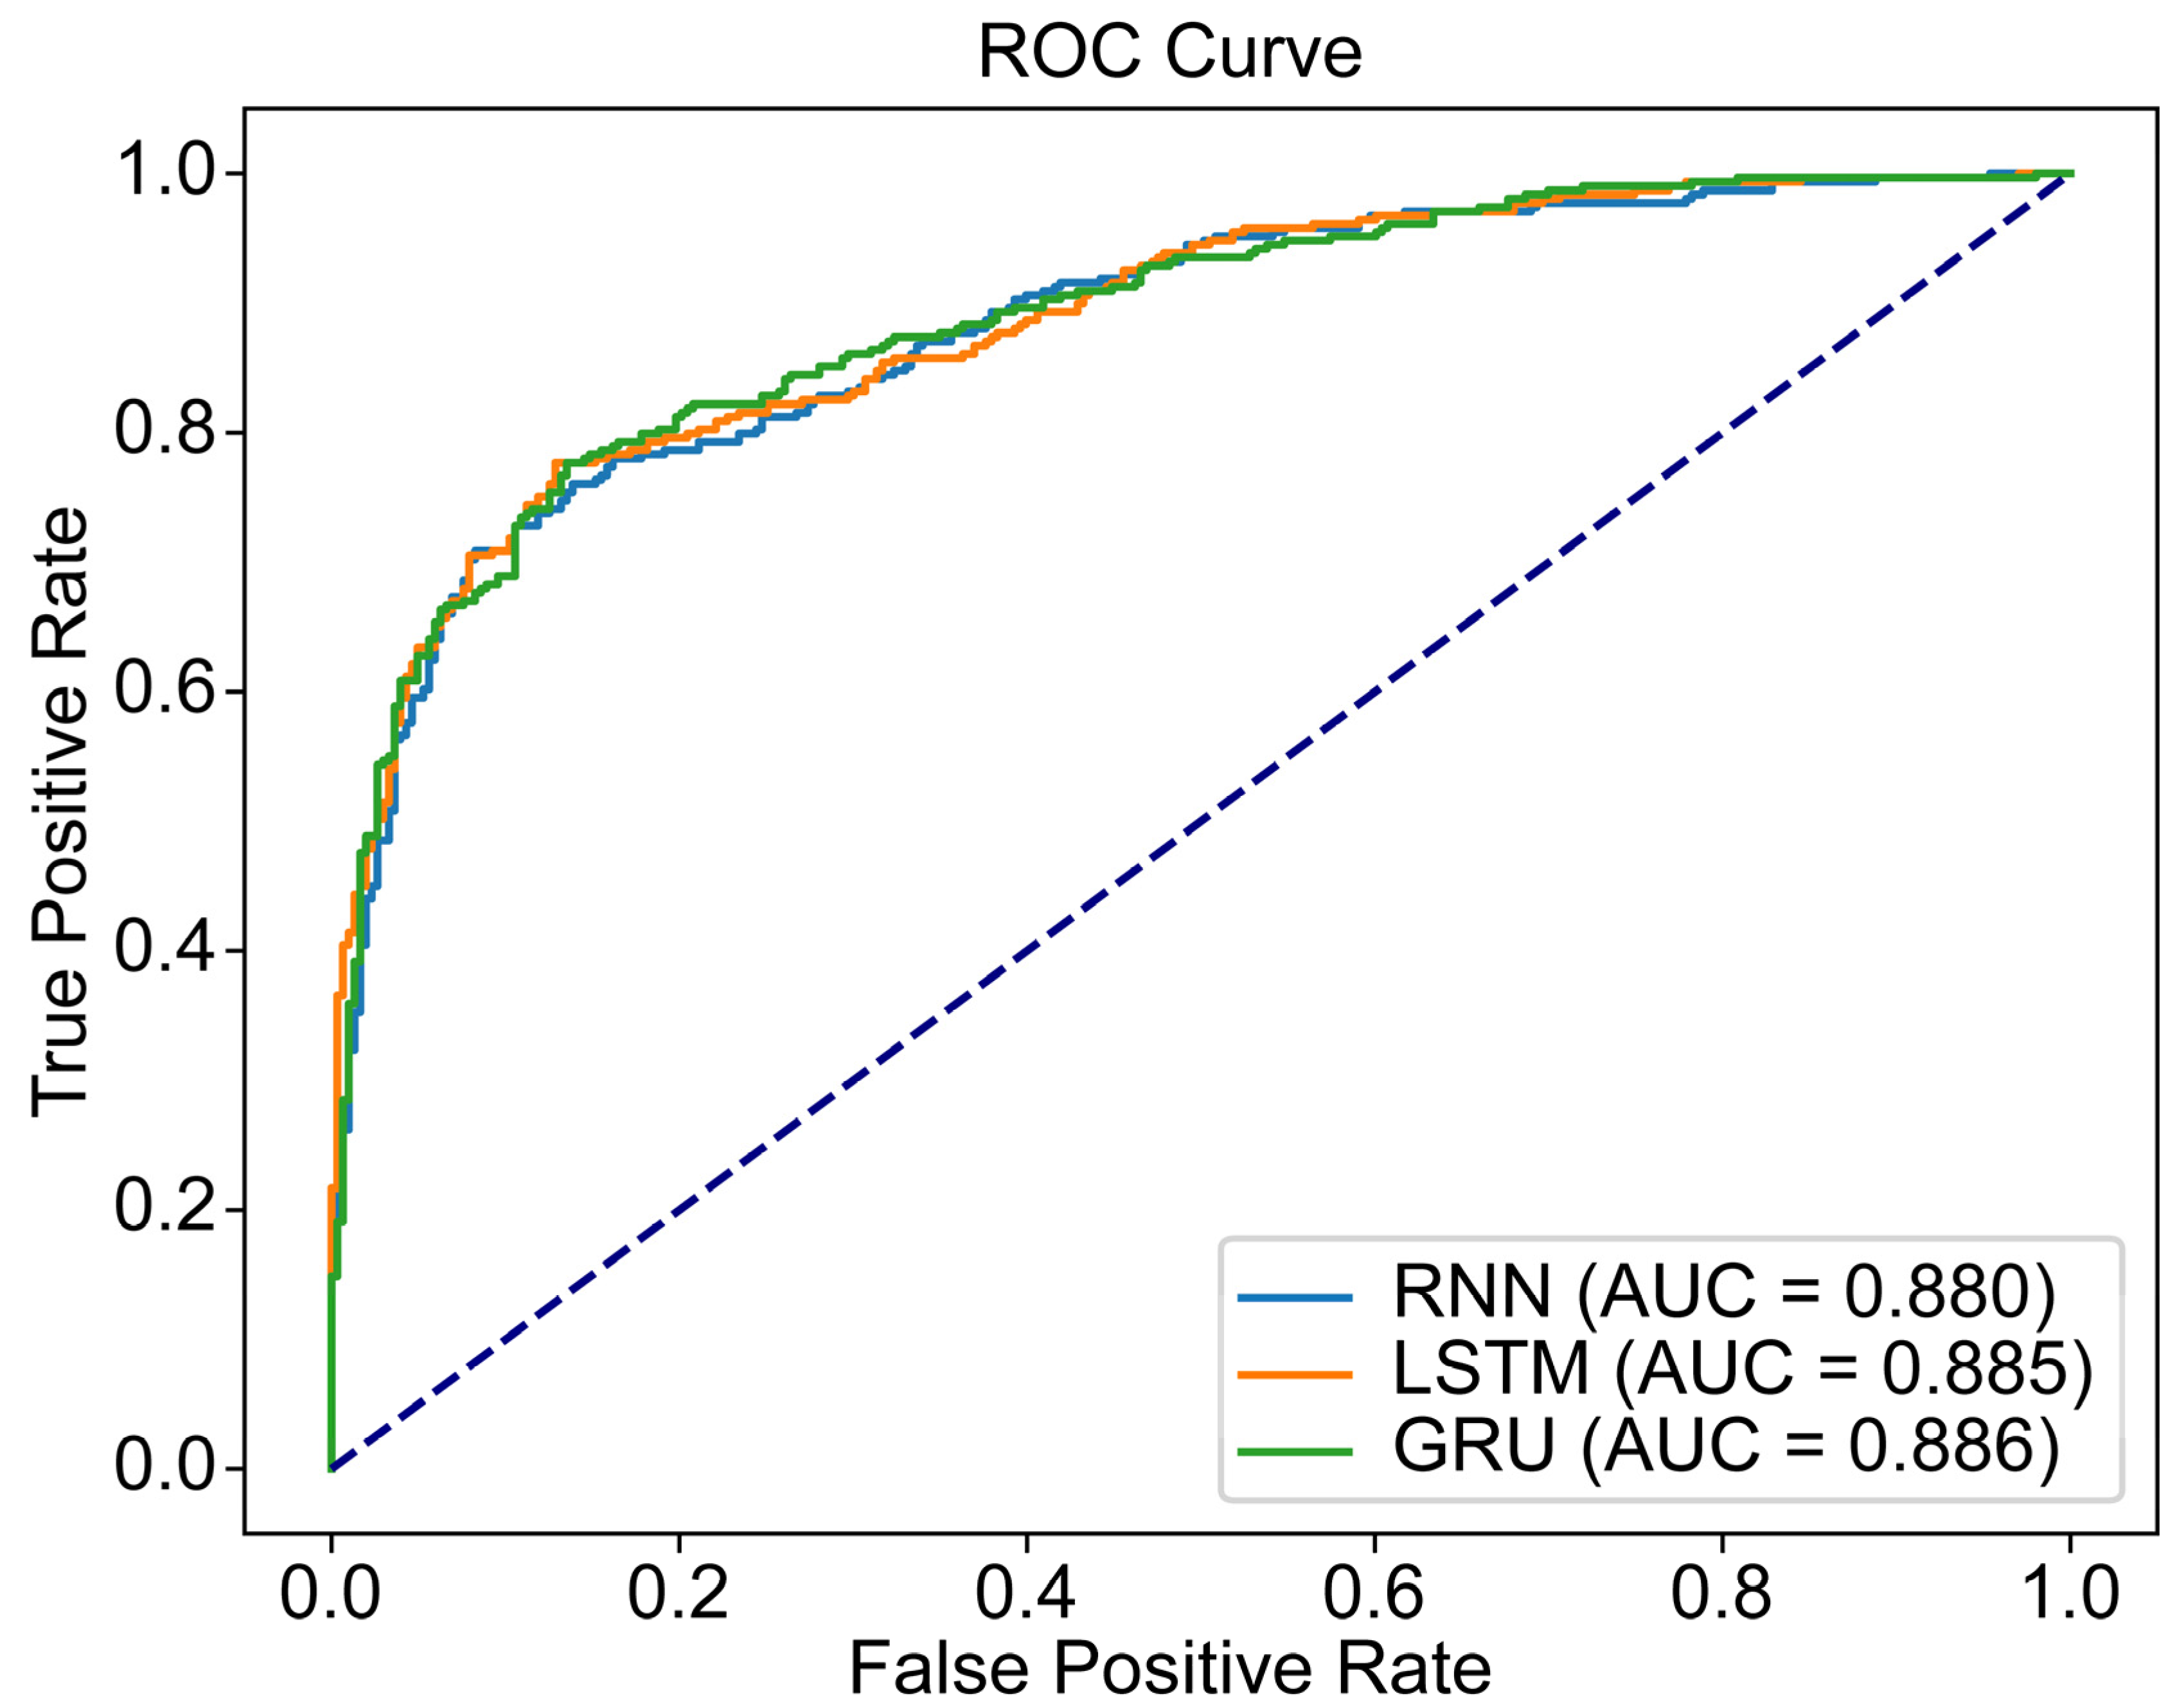
4.1.3. Susceptibility Assessment
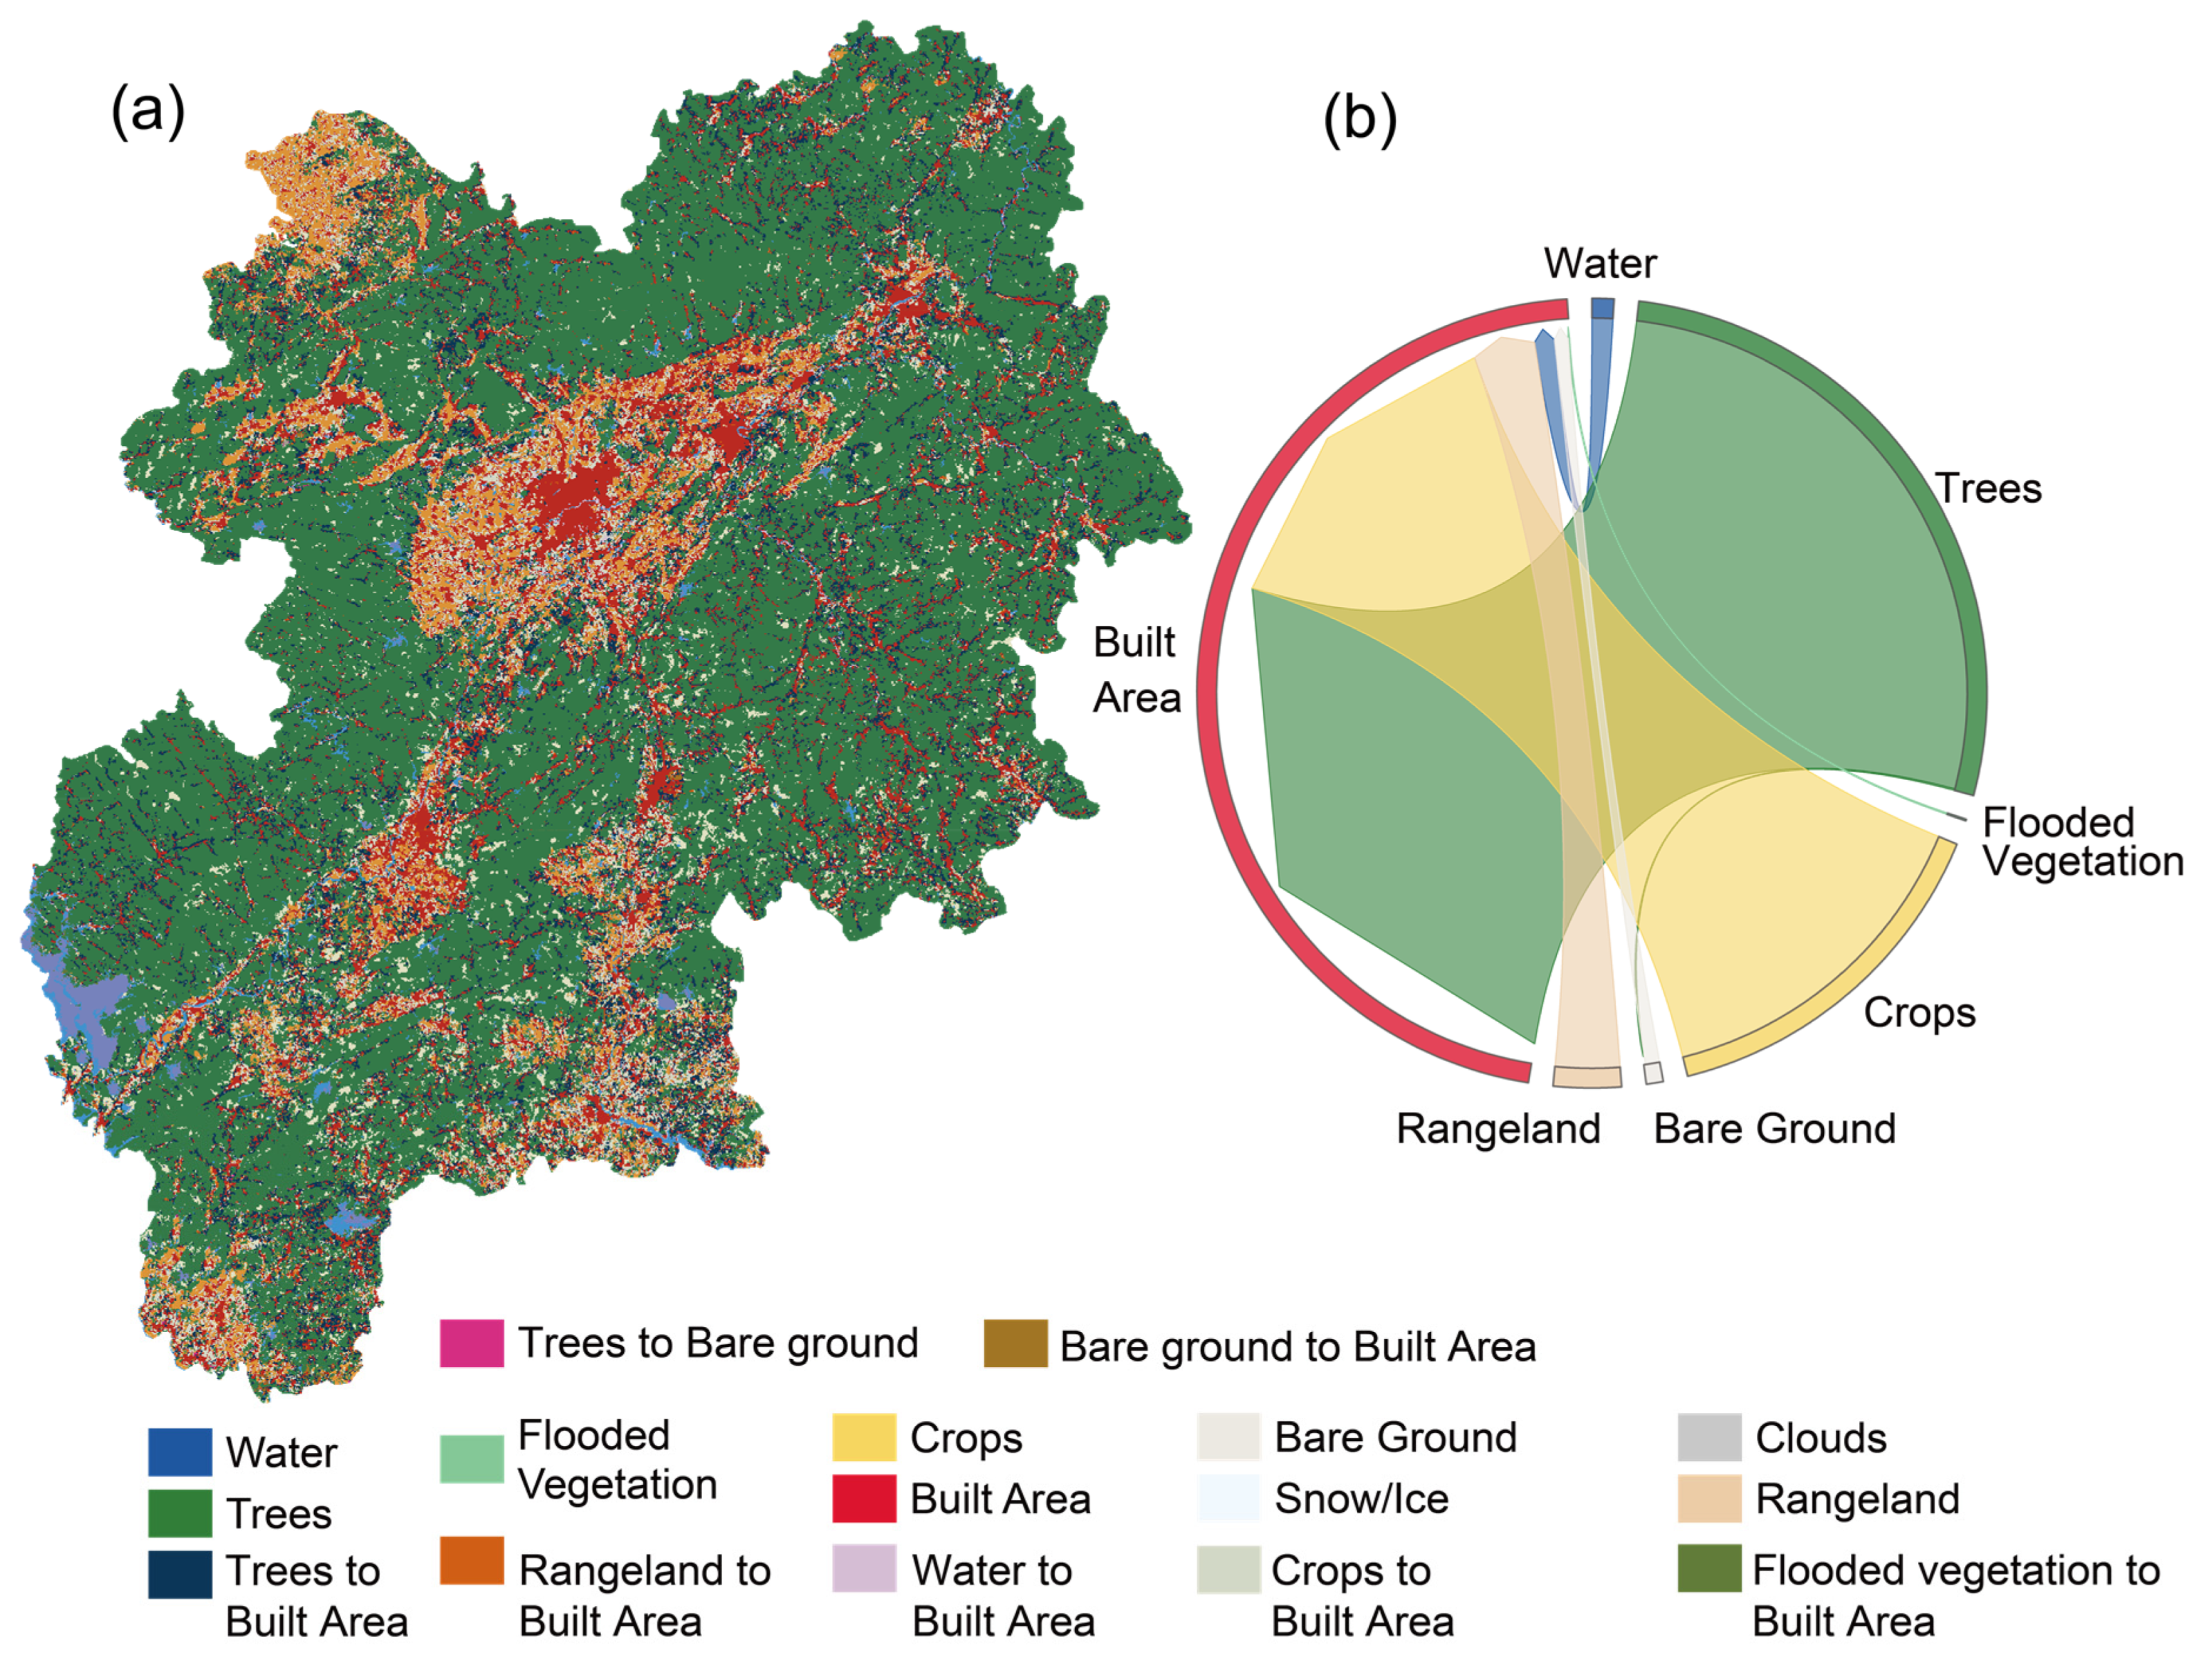
4.2. LULC Change Analysis
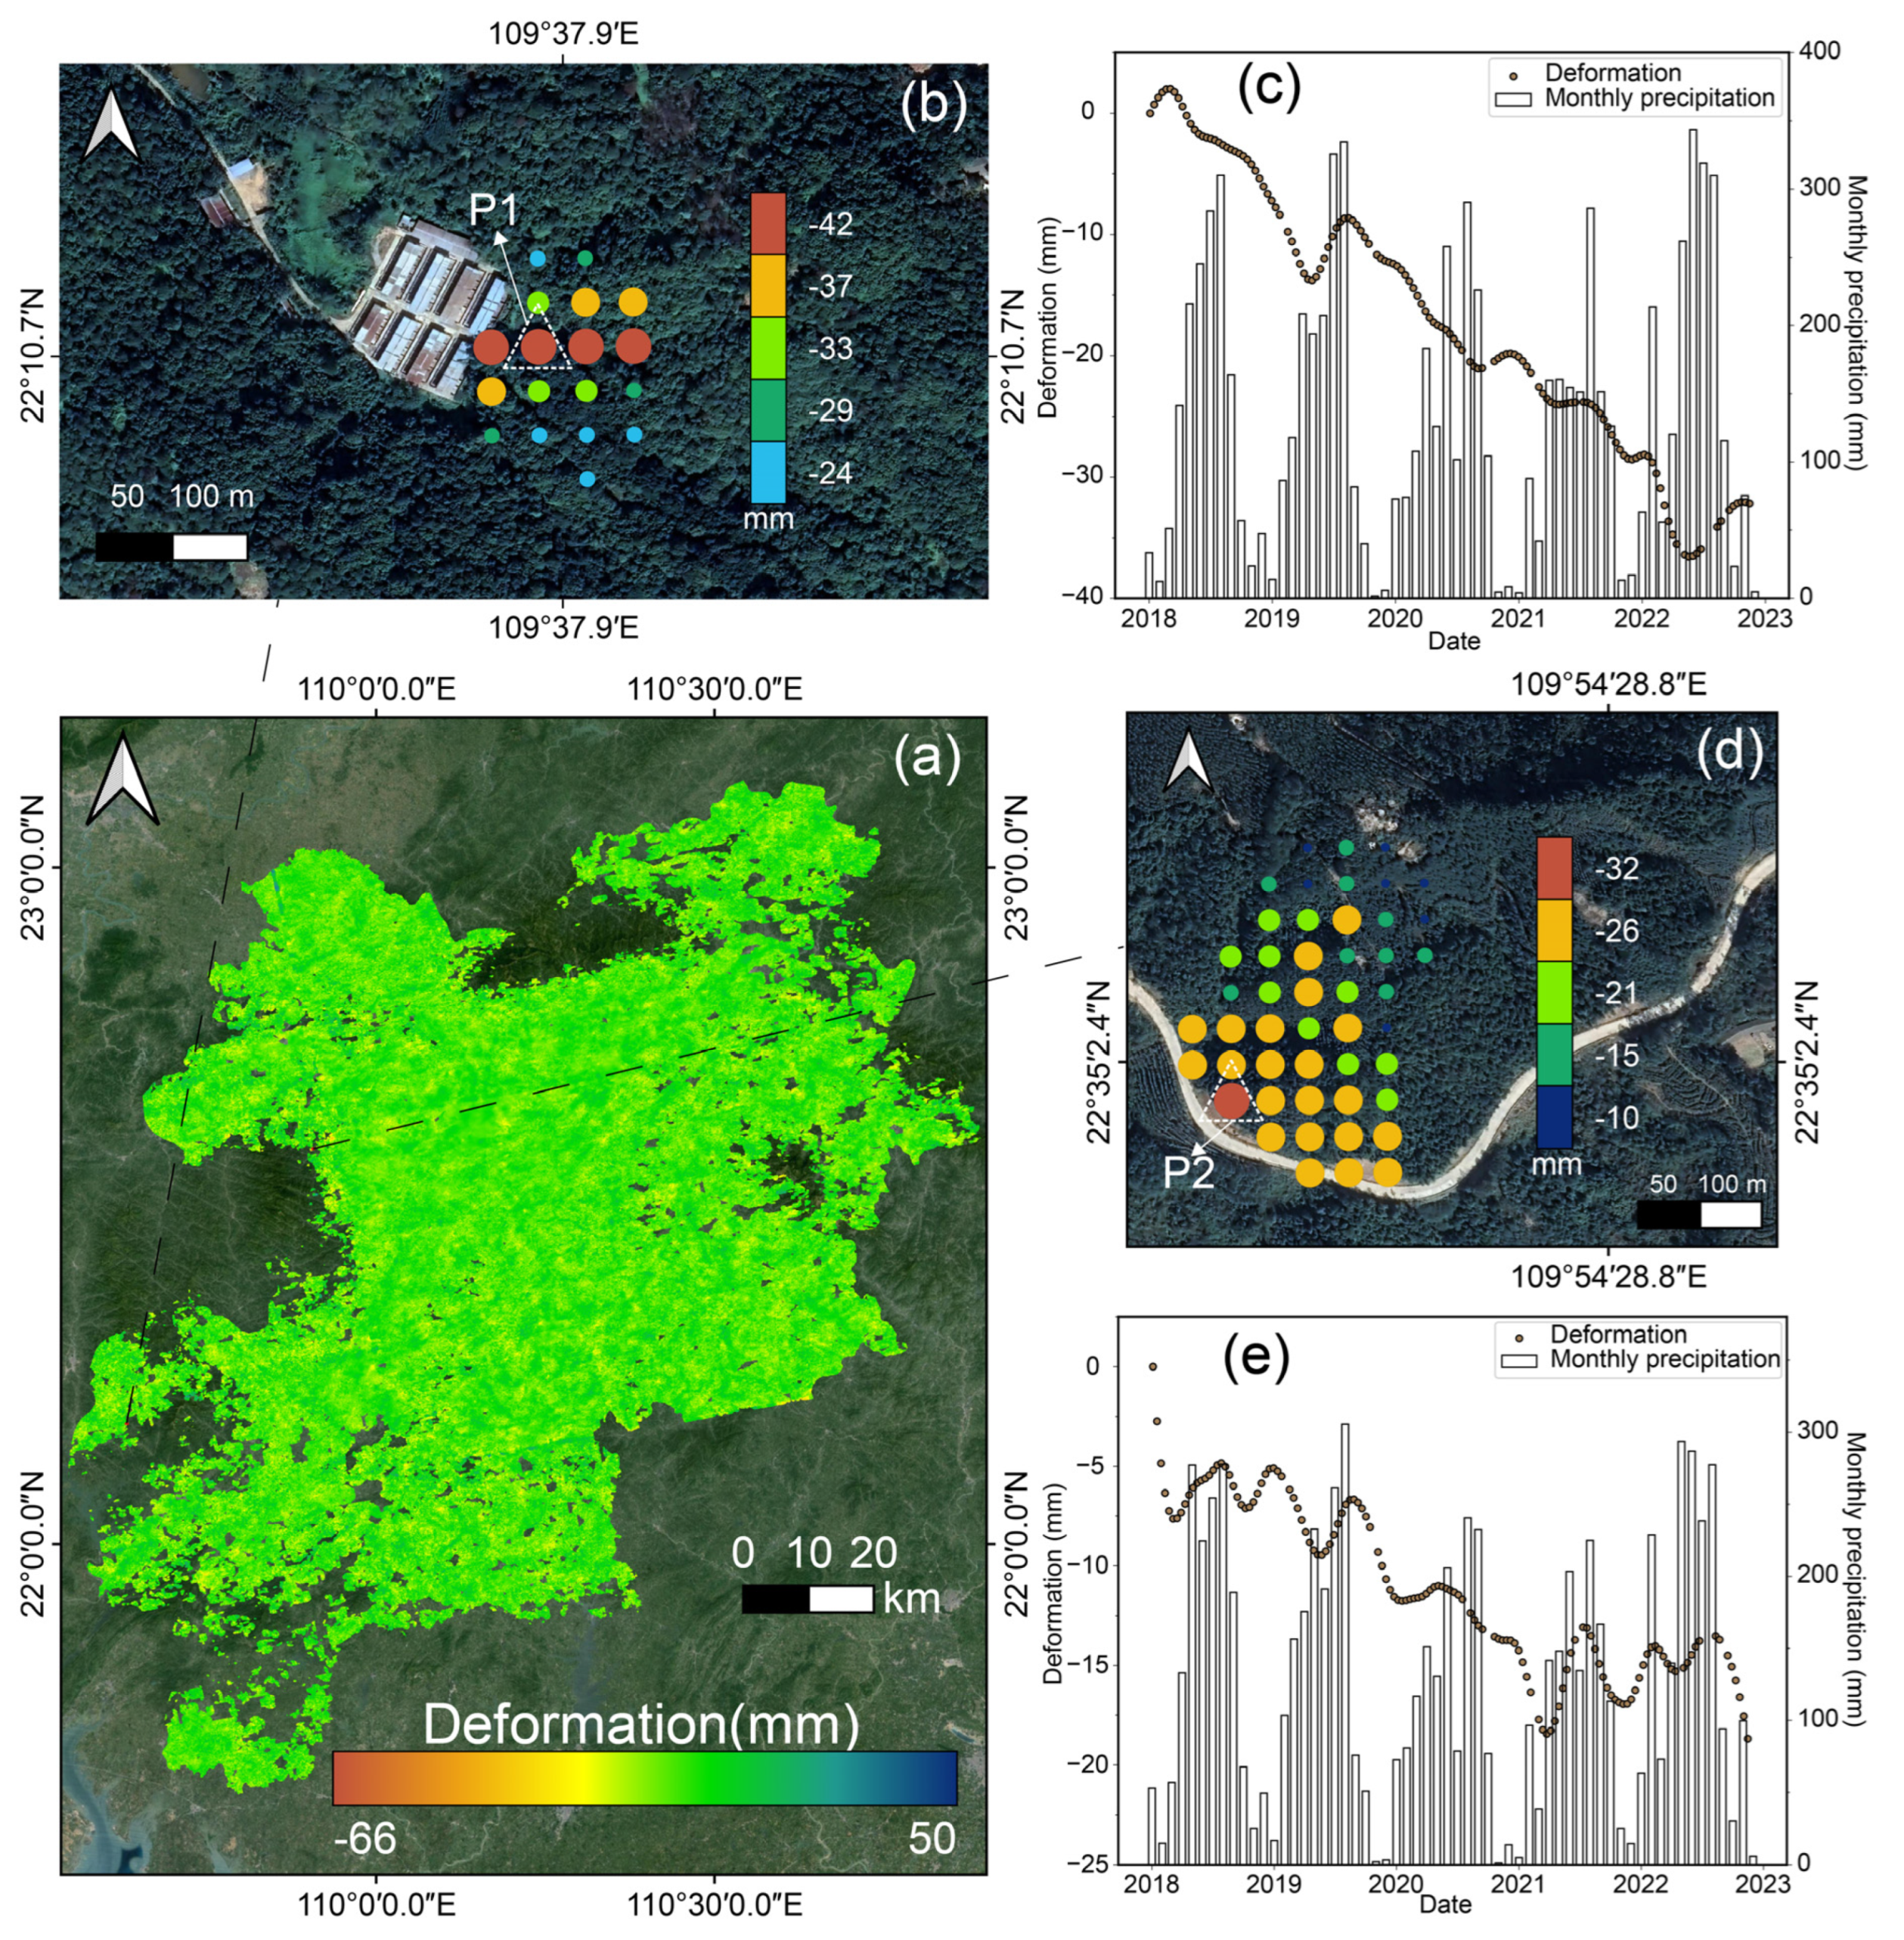
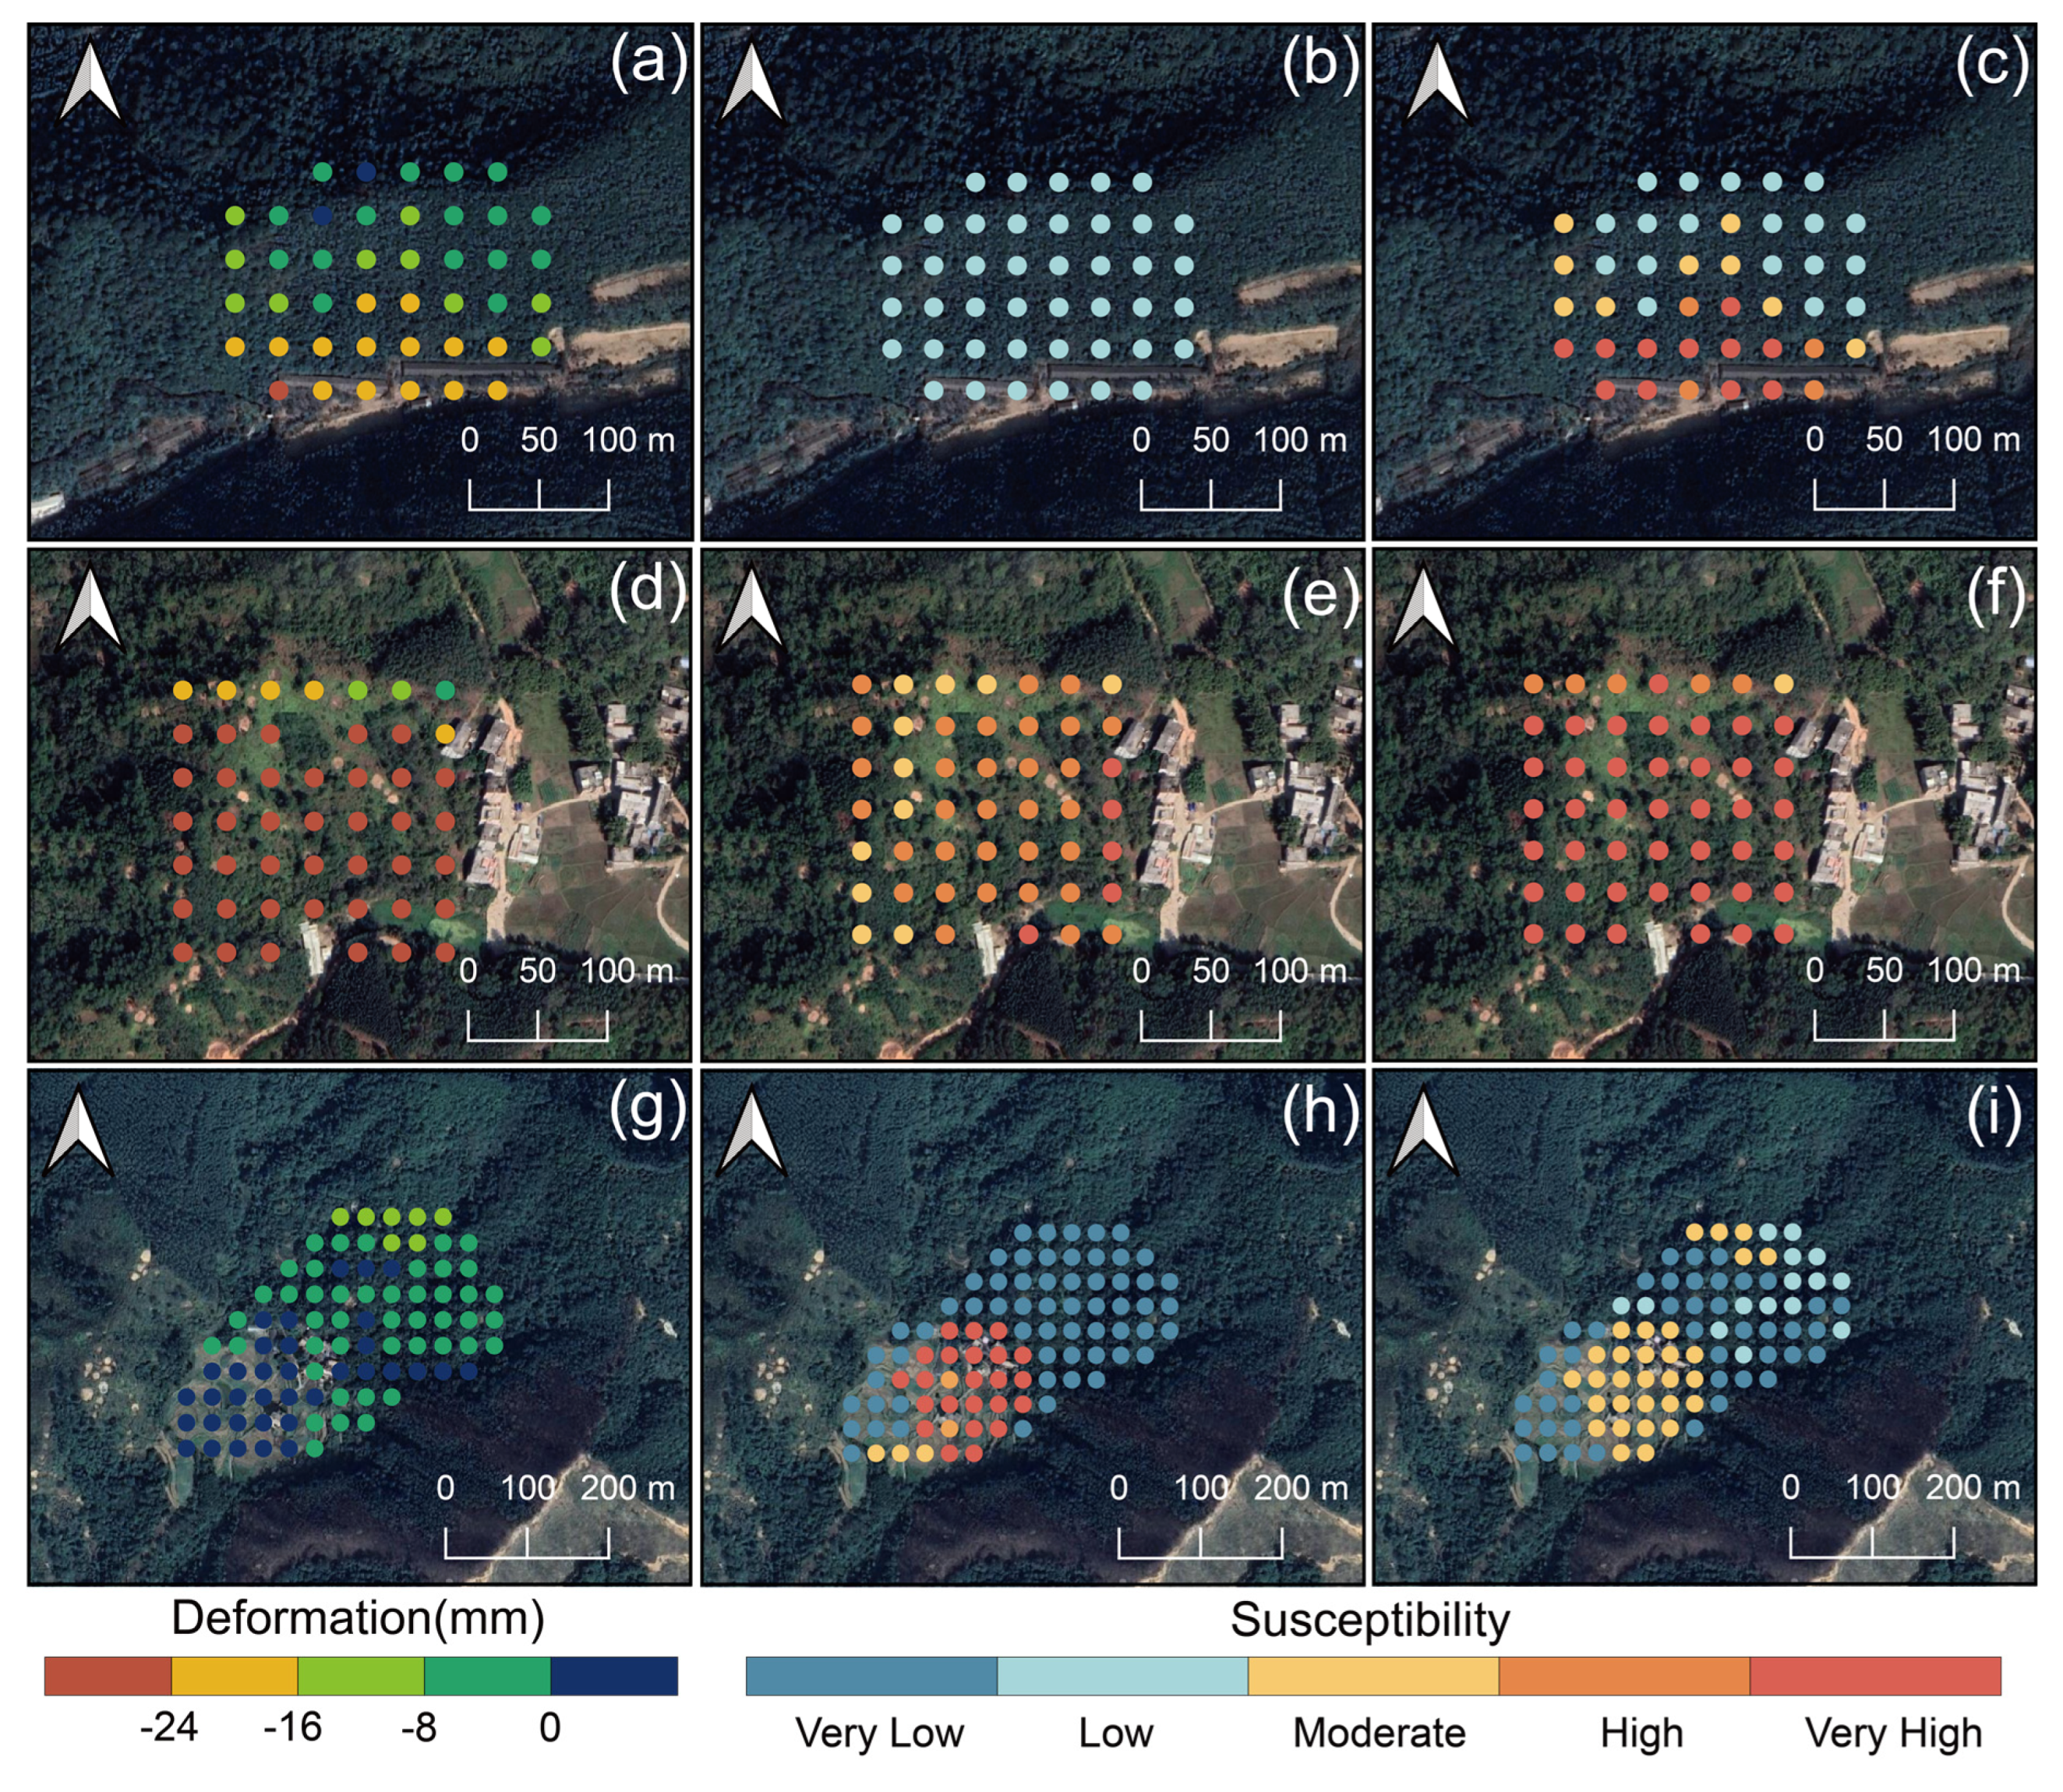
4.3. SBAS-InSAR Analysis
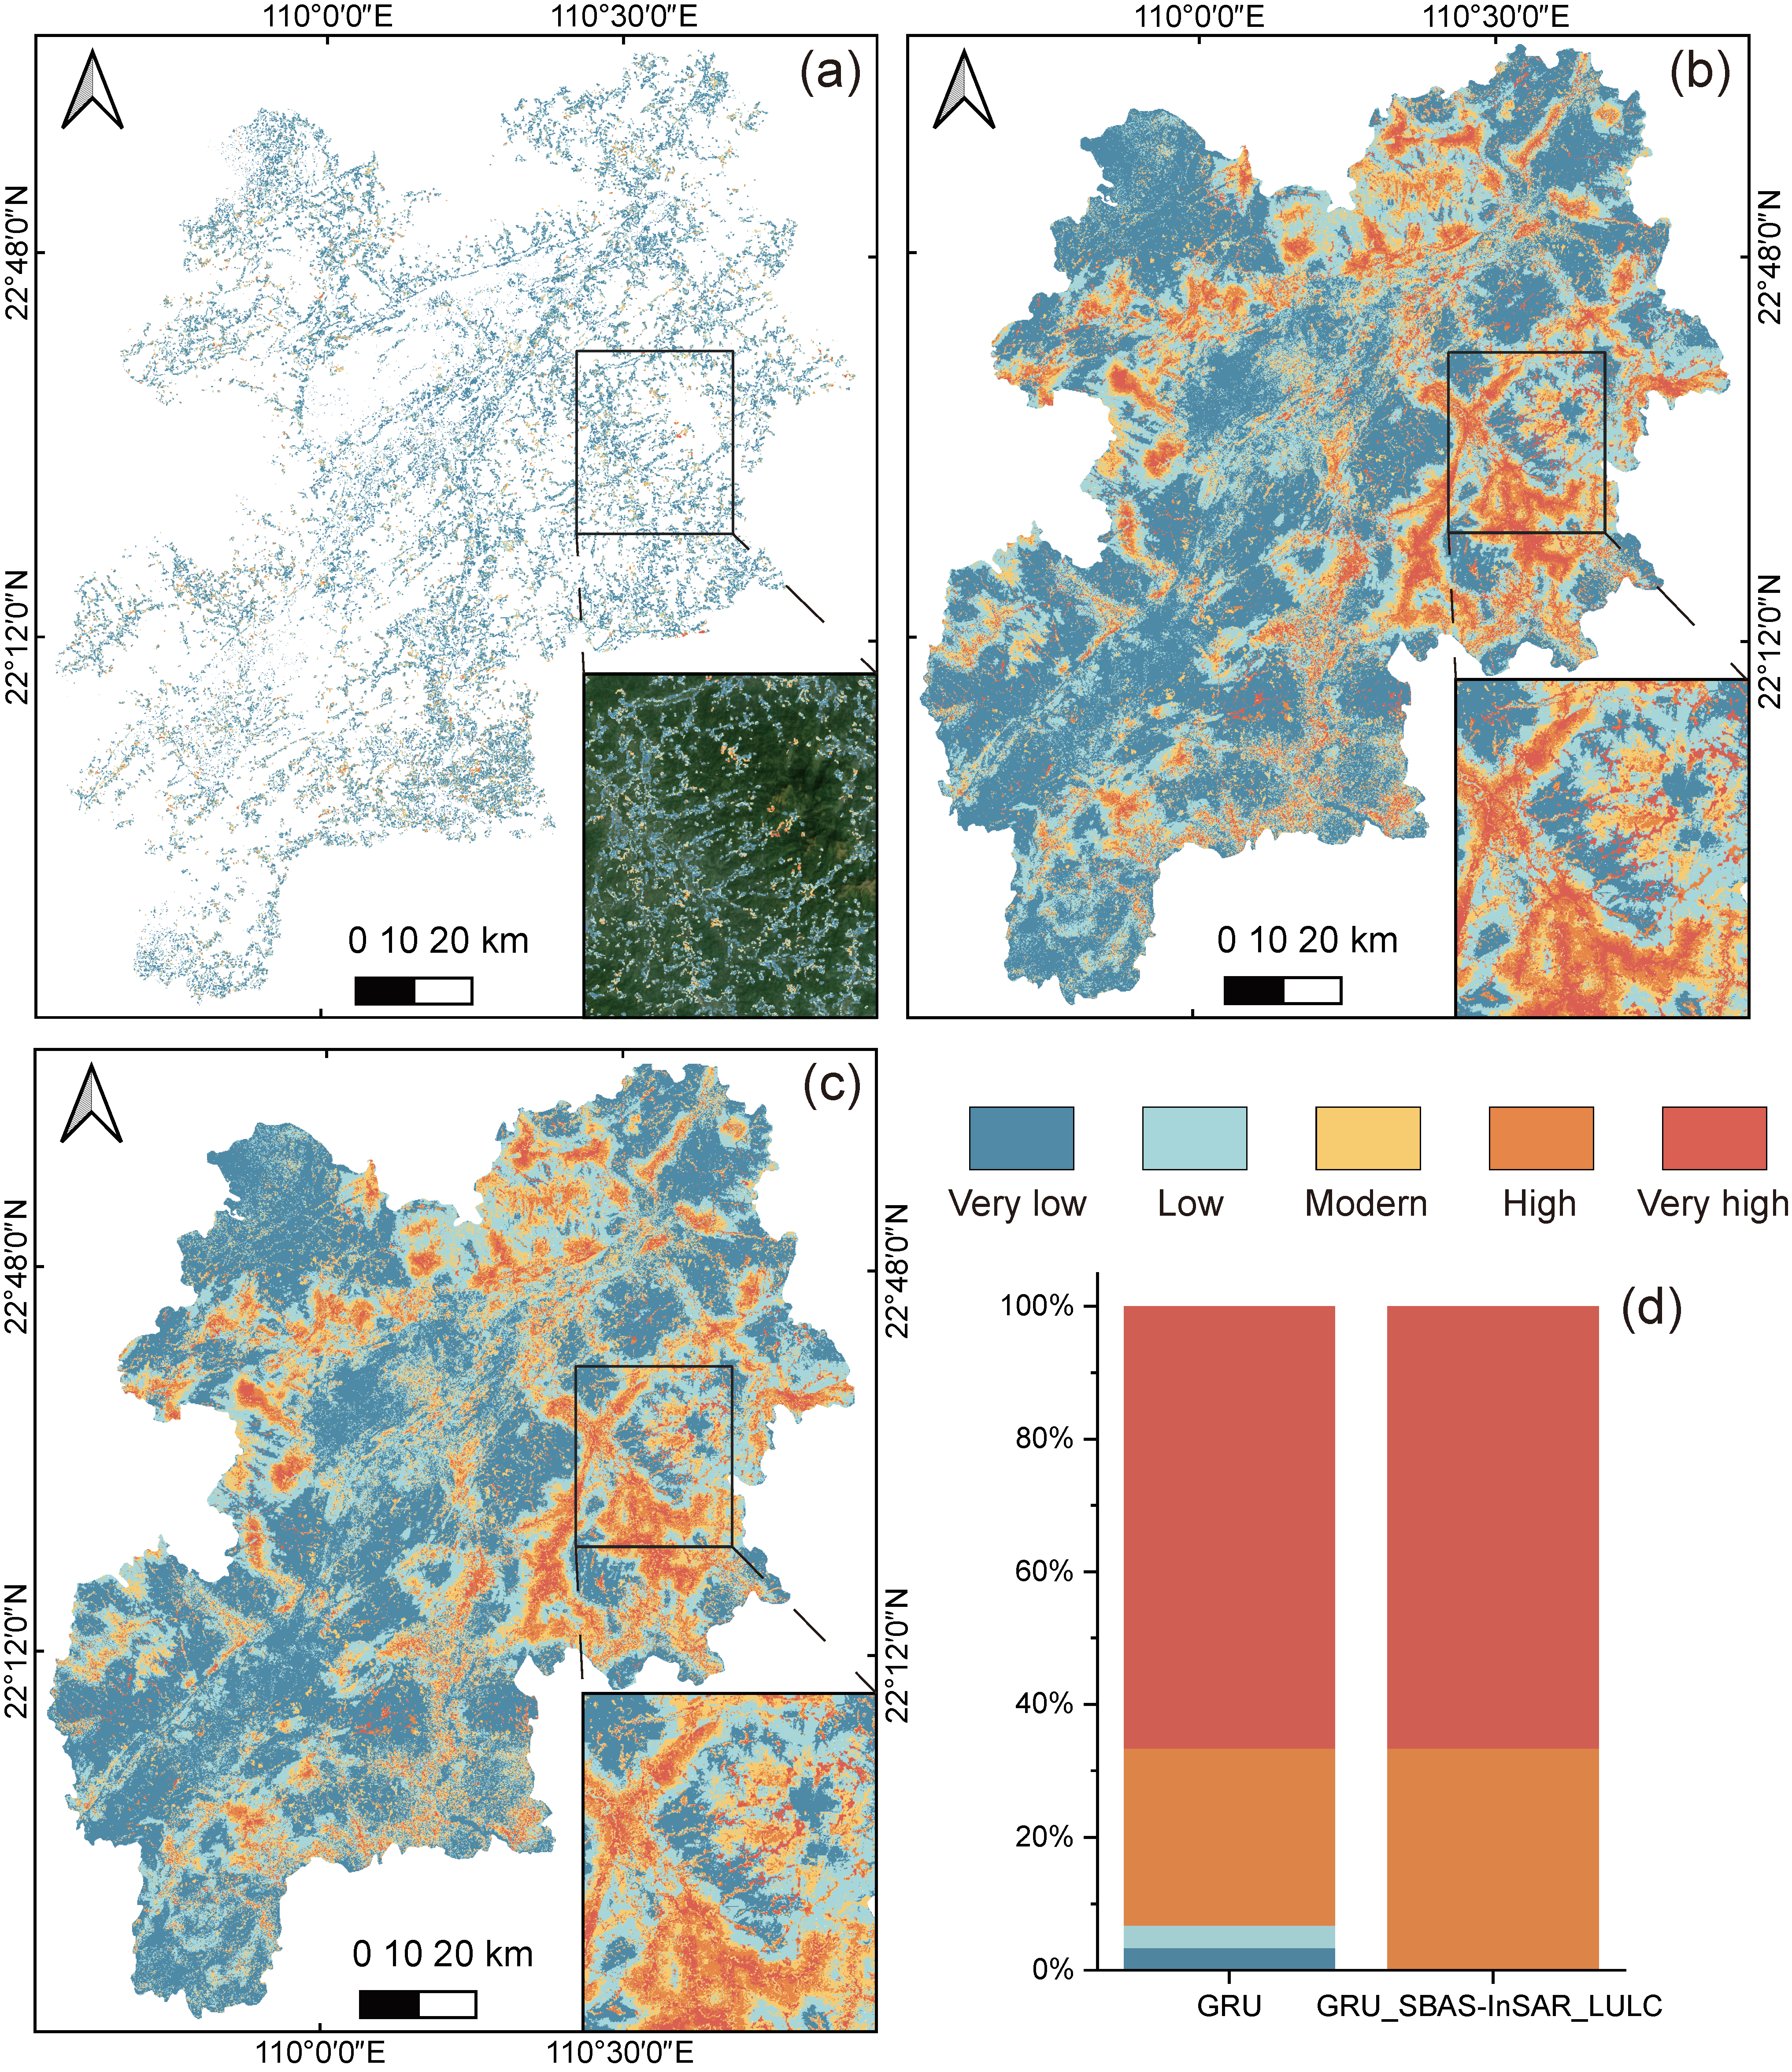
4.4. LSM with Integrated InSAR, LULC Change, and GRU
5. Discussion
5.1. Mapping Unit Selection
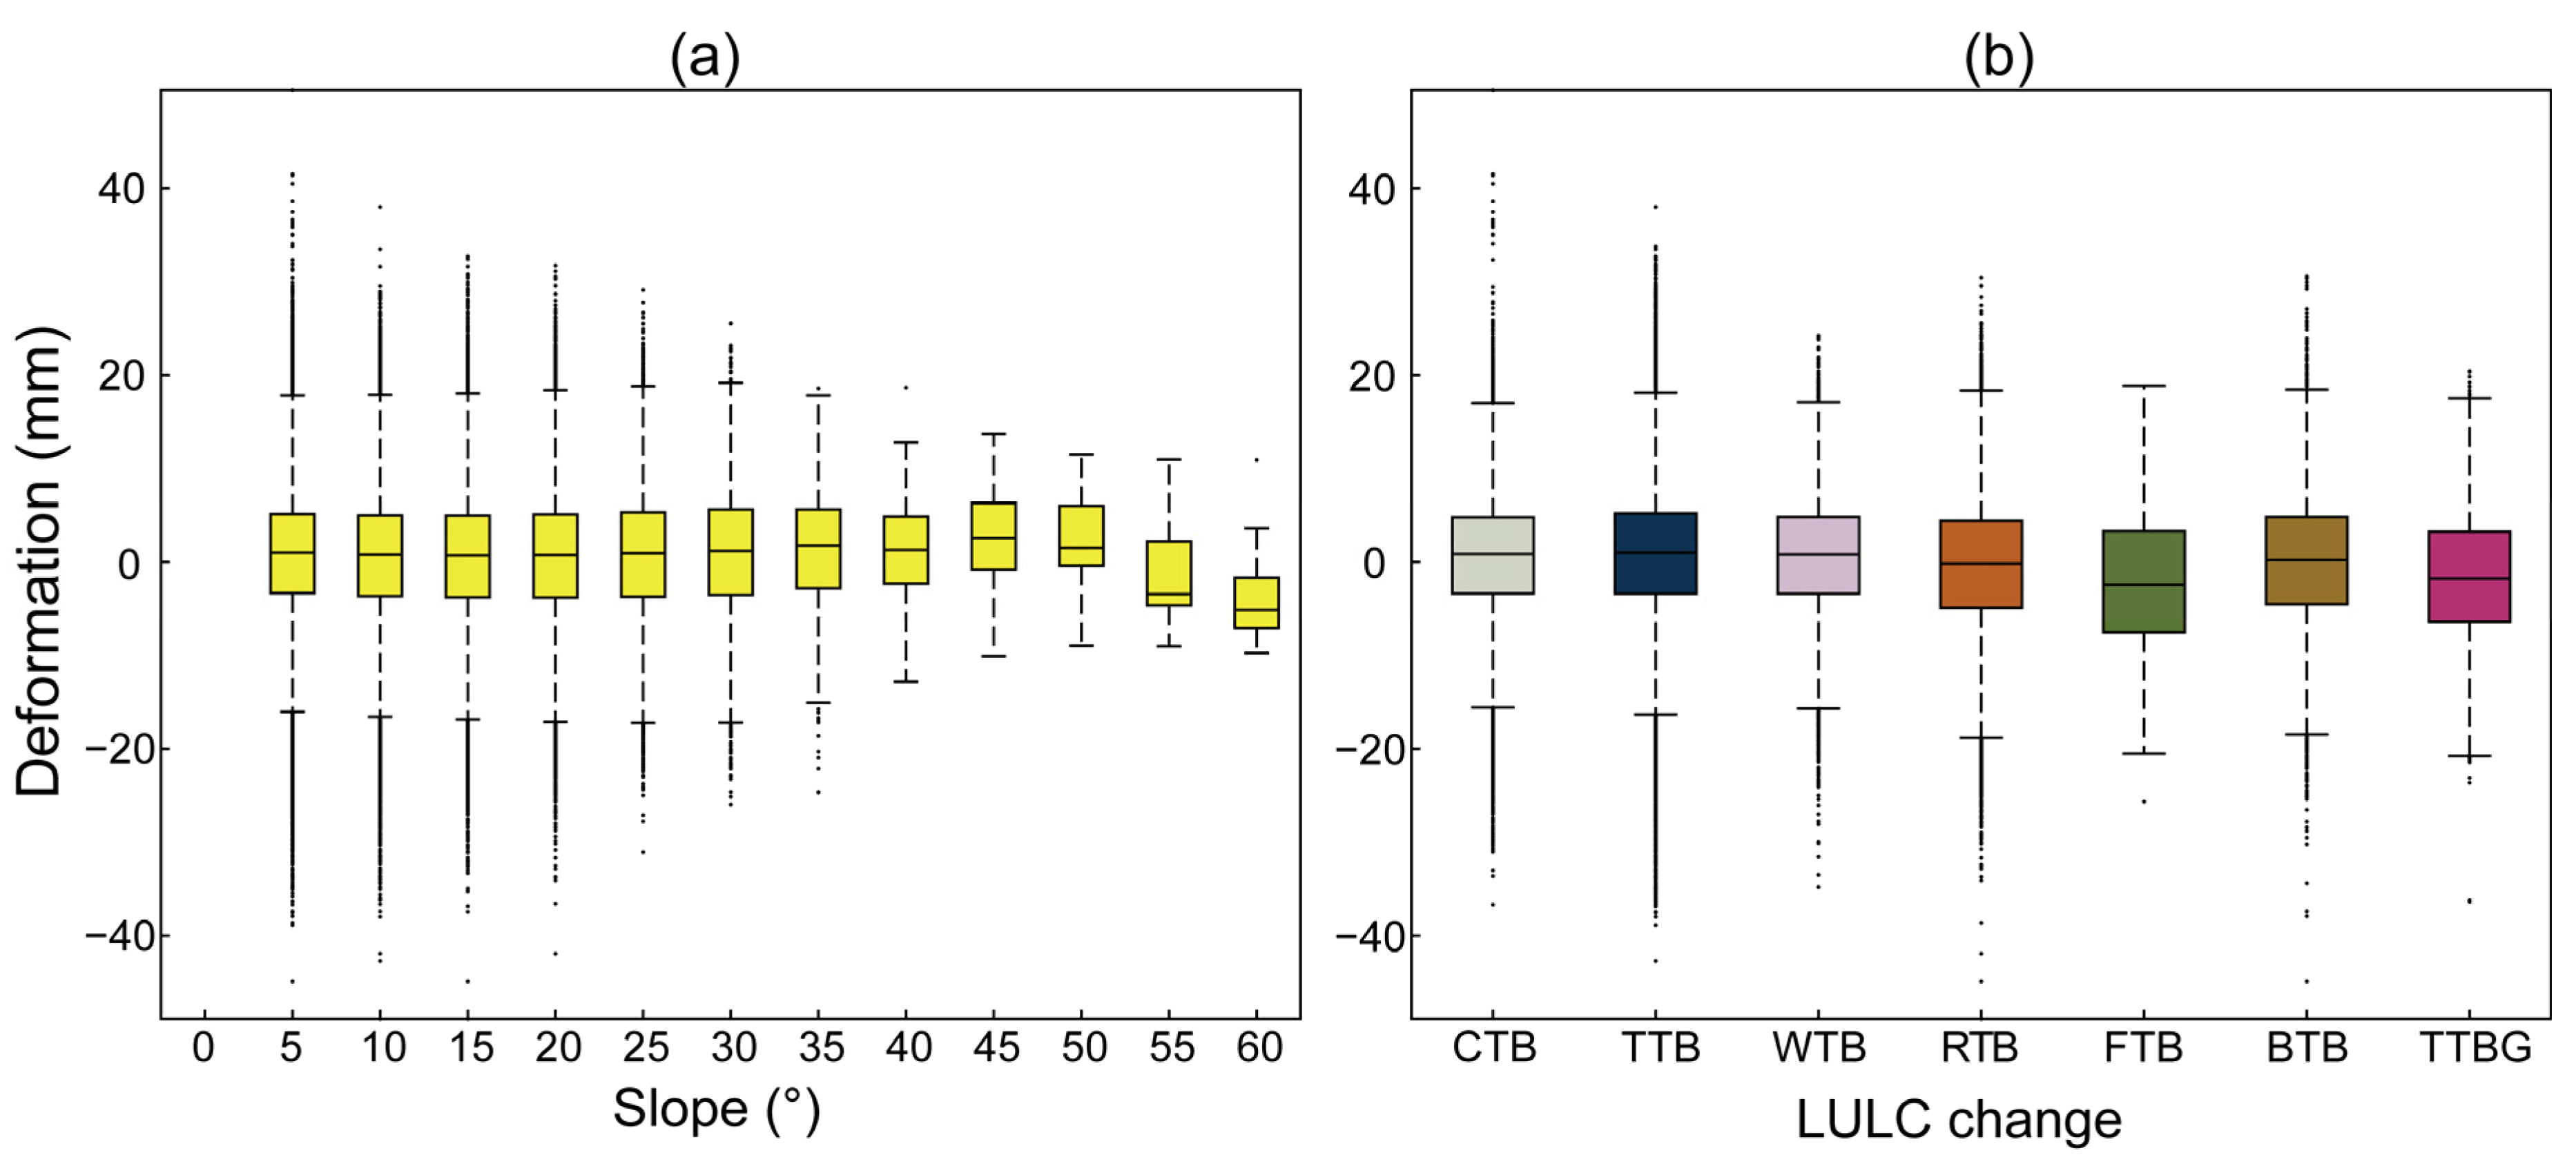
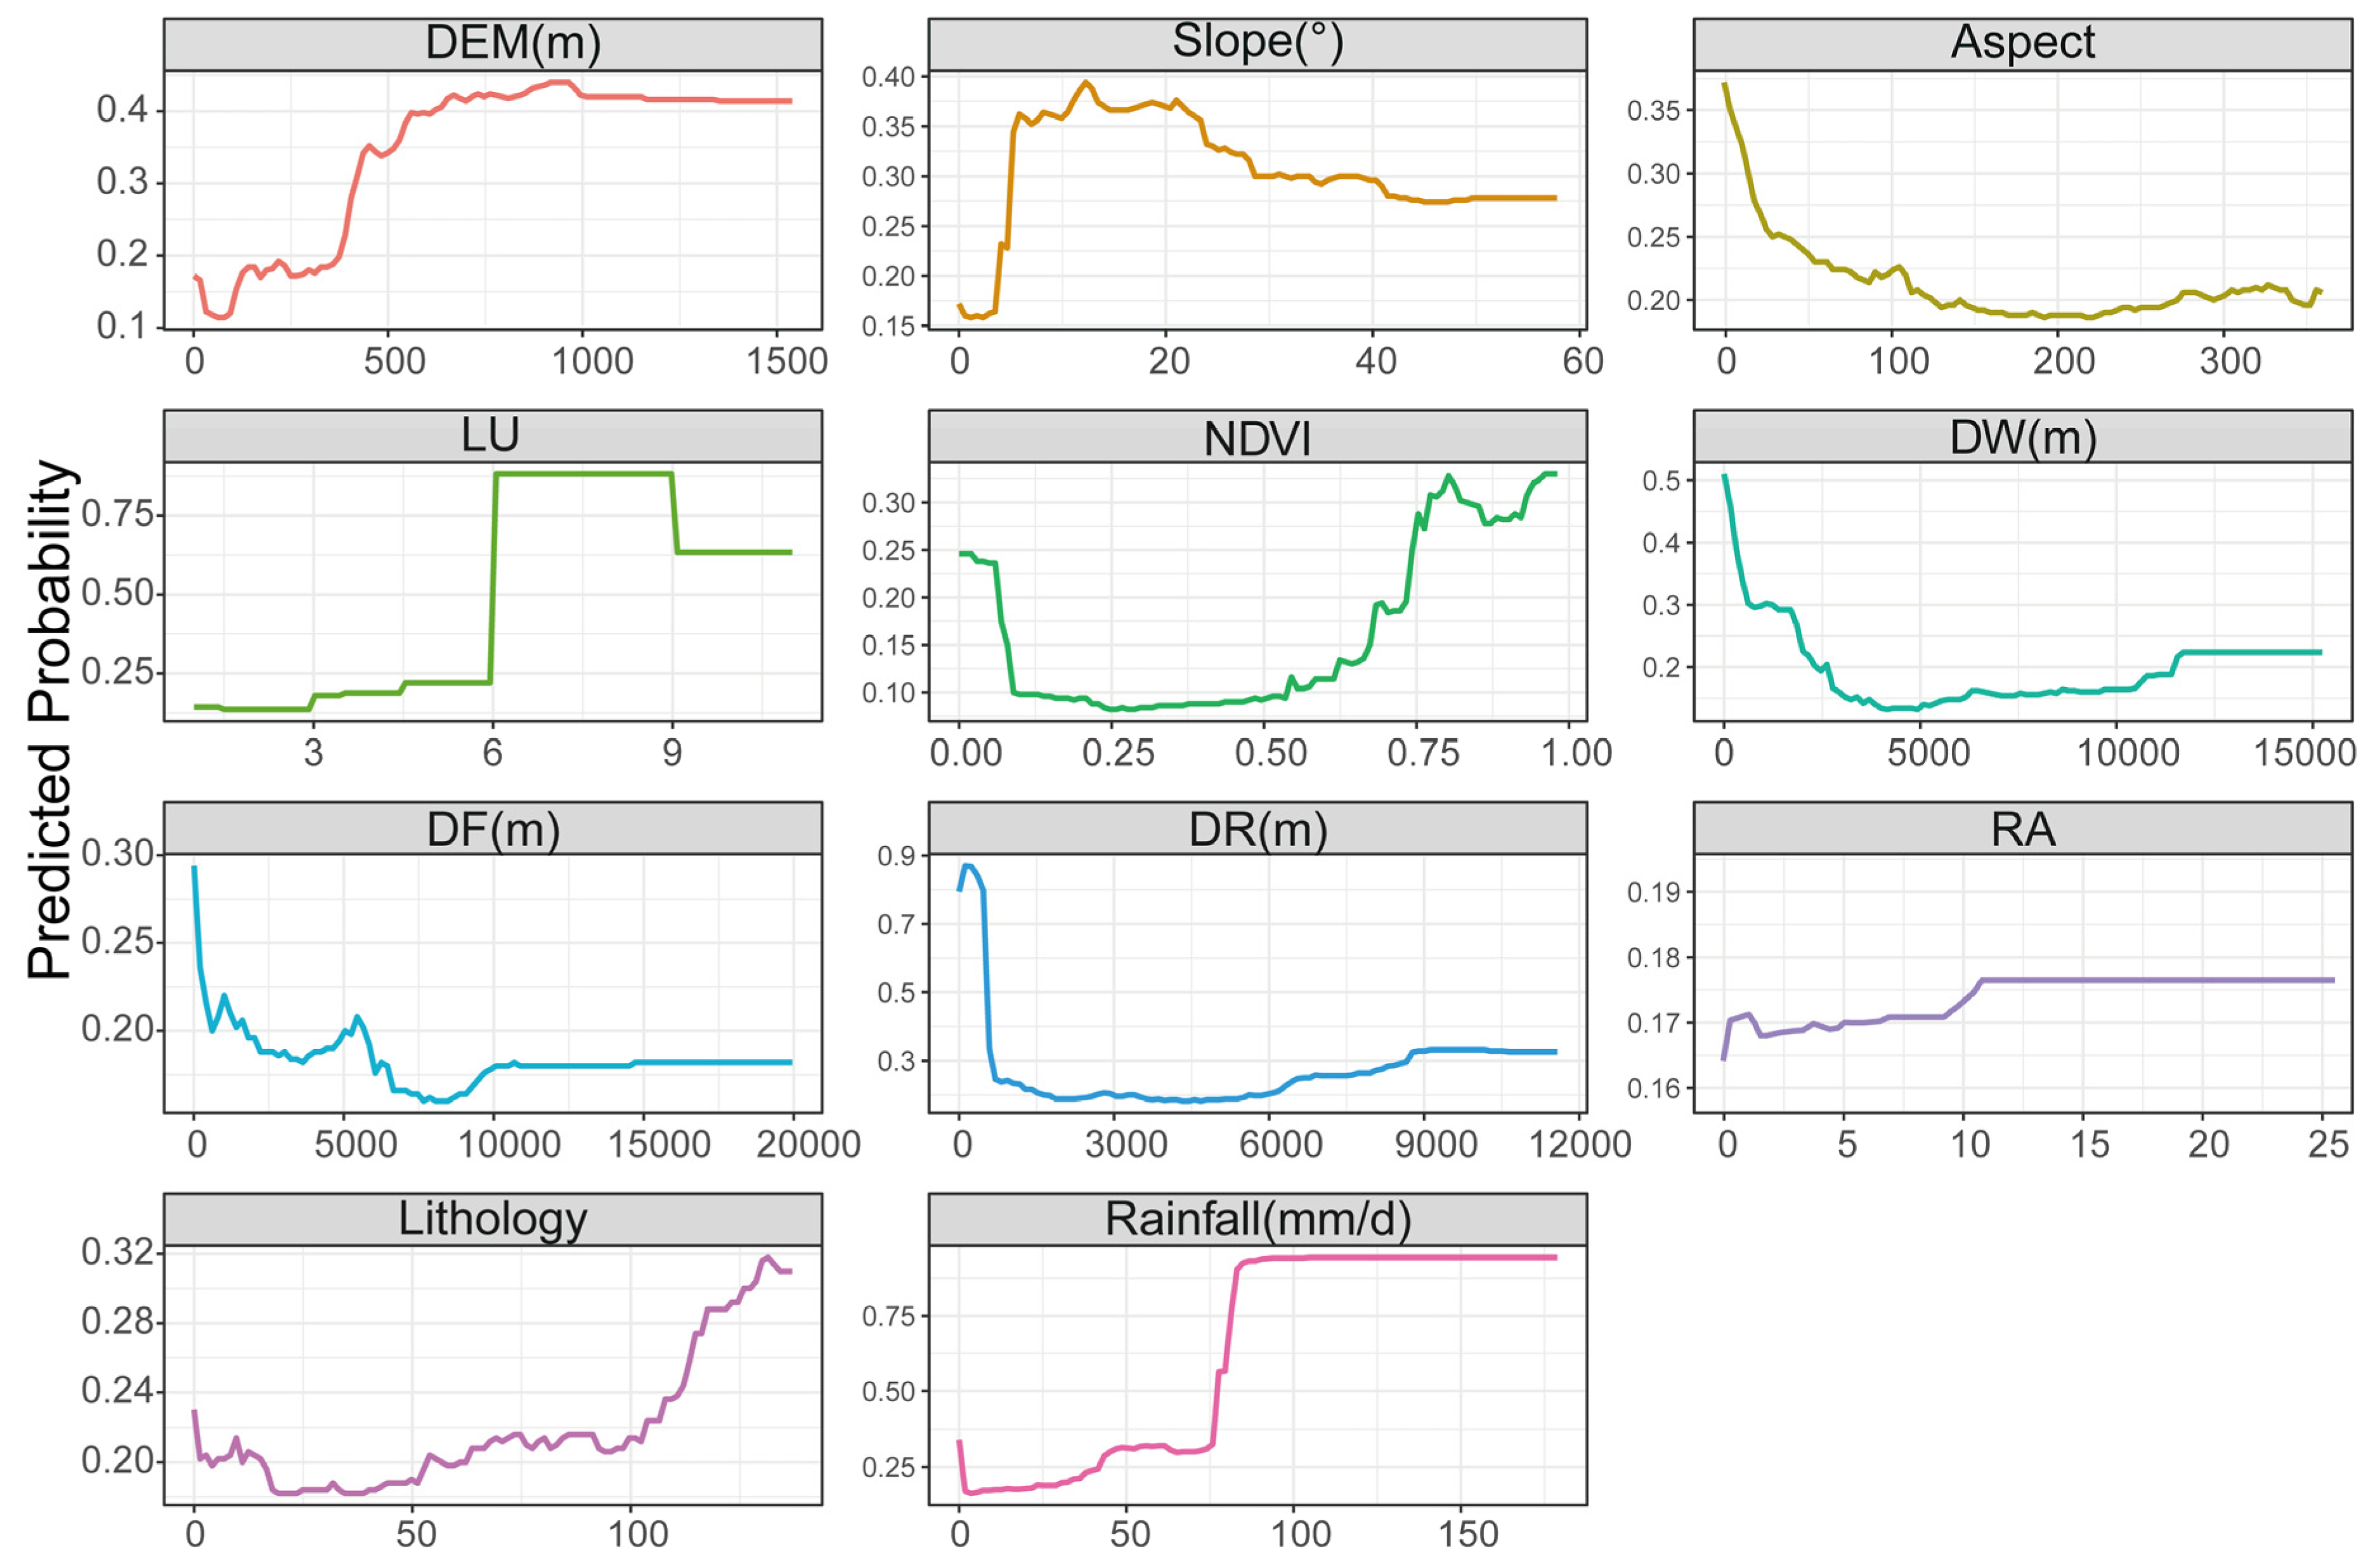
5.2. The Response Relationship of Influencing Factors
5.3. Uncertainties and Advantages
6. Conclusions
- (1)
- The performance and validation results of the model indicated that the GRU model, with the highest AUC value of 0.886, exhibited the best efficacy. Furthermore, it was demonstrated that LULC and distance to roads are closely correlated with landslide occurrence.
- (2)
- Based on the detection of LULC changes and surface deformation results, it was found that deformation occurred most rapidly on slopes ranging from 5 to 25 degrees, with human activities such as deforestation and deforestation identified as the primary drivers of this slope deformation.
- (3)
- Following the integration of deformation results and landslide susceptibility maps using the correction matrix, 3.10% of false positive areas and 0.74% of false negative areas in the study area were corrected. An area of 12.25% of Yulin was in high-susceptibility zones. The validation against actual landslide occurrences indicated that the corrected results were consistent with real-world conditions.
Author Contributions
Funding
Data Availability Statement
Conflicts of Interest
References
- Froude, M.J.; Petley, D.N. Global fatal landslide occurrence from 2004 to 2016. Nat. Hazards Earth Syst. Sci. 2018, 18, 2161–2181. [Google Scholar] [CrossRef]
- Gariano, S.L.; Guzzetti, F. Landslides in a changing climate. Earth-Sci. Rev. 2016, 162, 227–252. [Google Scholar] [CrossRef]
- Segoni, S.; Piciullo, L.; Gariano, S.L. A review of the recent literature on rainfall thresholds for landslide occurrence. Landslides 2018, 15, 1483–1501. [Google Scholar] [CrossRef]
- Keefer, D.K.; Wilson, R.C.; Mark, R.K.; Brabb, E.E.; Brown, W.M., III; Ellen, S.D.; Harp, E.L.; Wieczorek, G.F.; Alger, C.S.; Zatkin, R.S. Real-time landslide warning during heavy rainfall. Science 1987, 238, 921–925. [Google Scholar] [CrossRef] [PubMed]
- Meunier, P.; Hovius, N.; Haines, J.A. Topographic site effects and the location of earthquake induced landslides. Earth Planet. Sci. Lett. 2008, 275, 221–232. [Google Scholar] [CrossRef]
- Alexander, D. On the causes of landslides: Human activities, perception, and natural processes. Environ. Geol. Water Sci. 1992, 20, 165–179. [Google Scholar] [CrossRef]
- Bozzano, F.; Cipriani, I.; Mazzanti, P.; Prestininzi, A. Displacement patterns of a landslide affected by human activities: Insights from ground-based InSAR monitoring. Nat. Hazards 2011, 59, 1377–1396. [Google Scholar] [CrossRef]
- Merghadi, A.; Yunus, A.P.; Dou, J.; Whiteley, J.; ThaiPham, B.; Bui, D.T.; Avtar, R.; Abderrahmane, B. Machine learning methods for landslide susceptibility studies: A comparative overview of algorithm performance. Earth-Sci. Rev. 2020, 207, 103225. [Google Scholar] [CrossRef]
- Zhang, S.; Li, C.; Peng, J.; Zhou, Y.; Wang, S.; Chen, Y.; Tang, Y. Fatal landslides in China from 1940 to 2020: Occurrences and vulnerabilities. Landslides 2023, 20, 1243–1264. [Google Scholar] [CrossRef]
- Dikshit, A.; Pradhan, B.; Alamri, A.M. Pathways and challenges of the application of artificial intelligence to geohazards modelling. Gondwana Res. 2021, 100, 290–301. [Google Scholar] [CrossRef]
- Guzzetti, F.; Reichenbach, P.; Cardinali, M.; Galli, M.; Ardizzone, F. Probabilistic landslide hazard assessment at the basin scale. Geomorphology 2005, 72, 272–299. [Google Scholar] [CrossRef]
- Youssef, K.; Shao, K.; Moon, S.; Bouchard, L.S. Landslide susceptibility modeling by interpretable neural network. Commun. Earth Environ. 2023, 4, 162. [Google Scholar] [CrossRef]
- Montgomery, D.R.; Dietrich, W.E. A physically based model for the topographic control on shallow landsliding. Water Resour. Res. 1994, 30, 1153–1171. [Google Scholar] [CrossRef]
- Alvioli, M.; Baum, R.L. Parallelization of the TRIGRS model for rainfall-induced landslides using the message passing interface. Environ. Model. Softw. 2016, 81, 122–135. [Google Scholar] [CrossRef]
- Dou, J.; Yunus, A.P.; Tien Bui, D.; Sahana, M.; Chen, C.W.; Zhu, Z.; Wang, W.; Pham, B.T. Evaluating GIS-based multiple statistical models and data mining for earthquake and rainfall-induced landslide susceptibility using the LiDAR DEM. Remote Sens. 2019, 11, 638. [Google Scholar] [CrossRef]
- Arabameri, A.; Pradhan, B.; Rezaei, K.; Sohrabi, M.; Kalantari, Z. GIS-based landslide susceptibility mapping using numerical risk factor bivariate model and its ensemble with linear multivariate regression and boosted regression tree algorithms. J. Mt. Sci. 2019, 16, 595–618. [Google Scholar] [CrossRef]
- Li, D.; Huang, F.; Yan, L.; Cao, Z.; Chen, J.; Ye, Z. Landslide susceptibility prediction using particle-swarm-optimized multilayer perceptron: Comparisons with multilayer-perceptron-only, bp neural network, and information value models. Appl. Sci. 2019, 9, 3664. [Google Scholar] [CrossRef]
- Wang, Y.; Ling, Y.; Chan, T.O.; Awange, J. High-resolution earthquake-induced landslide hazard assessment in Southwest China through frequency ratio analysis and LightGBM. Int. J. Appl. Earth Obs. Geoinf. 2024, 131, 103947. [Google Scholar] [CrossRef]
- Kulsoom, I.; Hua, W.; Hussain, S.; Chen, Q.; Khan, G.; Shihao, D. SBAS-InSAR based validated landslide susceptibility mapping along the Karakoram Highway: A case study of Gilgit-Baltistan, Pakistan. Sci. Rep. 2023, 13, 3344. [Google Scholar] [CrossRef]
- Liu, M.; Xu, B.; Li, Z.; Mao, W.; Zhu, Y.; Hou, J.; Liu, W. Landslide susceptibility zoning in Yunnan Province based on SBAS-InSAR technology and a random forest model. Remote Sens. 2023, 15, 2864. [Google Scholar] [CrossRef]
- Agboola, G.; Beni, L.H.; Elbayoumi, T.; Thompson, G. Optimizing landslide susceptibility mapping using machine learning and geospatial techniques. Ecol. Inform. 2024, 81, 102583. [Google Scholar] [CrossRef]
- Liu, Y.; Xu, P.; Cao, C.; Zhang, W.; Han, B.; Zhao, M. A quick method of early landslide identification based on dynamic susceptibility analysis using M-SVM method: A case study. Bull. Eng. Geol. Environ. 2023, 82, 454. [Google Scholar] [CrossRef]
- Chen, Z.; Huang, M.; Zhu, D.; Altan, O. Integrating Remote Sensing and a Markov-FLUS Model to Simulate Future Land Use Changes in Hokkaido, Japan. Remote Sens. 2021, 13, 2621. [Google Scholar] [CrossRef]
- Sameen, M.I.; Pradhan, B.; Lee, S. Application of convolutional neural networks featuring Bayesian optimization for landslide susceptibility assessment. Catena 2020, 186, 104249. [Google Scholar] [CrossRef]
- Dandridge, C.; Stanley, T.; Kirschbaum, D.; Amatya, P.; Lakshmi, V. The influence of land use and land cover change on landslide susceptibility in the Lower Mekong River Basin. Nat. Hazards 2023, 115, 1499–1523. [Google Scholar] [CrossRef]
- Zhao, F.; Miao, F.; Wu, Y.; Ke, C.; Gong, S.; Ding, Y. Refined landslide susceptibility mapping in township area using ensemble machine learning method under dataset replenishment strategy. Gondwana Res. 2024, 131, 20–37. [Google Scholar] [CrossRef]
- Ma, Z.; Mei, G. Deep learning for geological hazards analysis: Data, models, applications, and opportunities. Earth-Sci. Rev. 2021, 223, 103858. [Google Scholar] [CrossRef]
- Huang, W.; Ding, M.; Li, Z.; Yu, J.; Ge, D.; Liu, Q.; Yang, J. Landslide susceptibility mapping and dynamic response along the Sichuan-Tibet transportation corridor using deep learning algorithms. Catena 2023, 222, 106866. [Google Scholar] [CrossRef]
- Corominas, J.; Van Westen, C.; Frattini, P.; Cascini, L.; Malet, J.P.; Fotopoulou, S.; Catani, F.; Van den Eeckhaut, M.; Mavrouli, O.; Agliardi, F.; et al. Recommendations for the quantitative analysis of landslide risk. Bull. Eng. Geol. Environ. 2014, 73, 209–263. [Google Scholar] [CrossRef]
- Chicas, S.D.; Li, H.; Mizoue, N.; Ota, T.; Du, Y.; Somogyvári, M. Landslide susceptibility mapping core-base factors and models’ performance variability: A systematic review. Nat. Hazards 2024, 1–21. [Google Scholar] [CrossRef]
- Lacroix, P.; Handwerger, A.L.; Bièvre, G. Life and death of slow-moving landslides. Nat. Rev. Earth Environ. 2020, 1, 404–419. [Google Scholar] [CrossRef]
- Depicker, A.; Jacobs, L.; Mboga, N.; Smets, B.; Van Rompaey, A.; Lennert, M.; Wolff, E.; Kervyn, F.; Michellier, C.; Dewitte, O.; et al. Historical dynamics of landslide risk from population and forest-cover changes in the Kivu Rift. Nat. Sustain. 2021, 4, 965–974. [Google Scholar] [CrossRef]
- Ahmed, M.; Tanyas, H.; Huser, R.; Dahal, A.; Titti, G.; Borgatti, L.; Francioni, M.; Lombardo, L. Dynamic rainfall-induced landslide susceptibility: A step towards a unified forecasting system. Int. J. Appl. Earth Obs. Geoinf. 2023, 125, 103593. [Google Scholar] [CrossRef]
- Persichillo, M.G.; Bordoni, M.; Meisina, C. The role of land use changes in the distribution of shallow landslides. Sci. Total Environ. 2017, 574, 924–937. [Google Scholar] [CrossRef] [PubMed]
- Xiong, H.; Ma, C.; Li, M.; Tan, J.; Wang, Y. Landslide susceptibility prediction considering land use change and human activity: A case study under rapid urban expansion and afforestation in China. Sci. Total Environ. 2023, 866, 161430. [Google Scholar] [CrossRef] [PubMed]
- Pisano, L.; Zumpano, V.; Malek, Ž.; Rosskopf, C.M.; Parise, M. Variations in the susceptibility to landslides, as a consequence of land cover changes: A look to the past, and another towards the future. Sci. Total Environ. 2017, 601, 1147–1159. [Google Scholar] [CrossRef]
- Promper, C.; Puissant, A.; Malet, J.P.; Glade, T. Analysis of land cover changes in the past and the future as contribution to landslide risk scenarios. Appl. Geogr. 2014, 53, 11–19. [Google Scholar] [CrossRef]
- Fu, Y.H.; Huang, M.; Gong, D.H.; Lin, H.; Fan, Y.W.; Du, W.Y. Dynamic Simulation and Prediction of Carbon Storage Based on Land Use/Land Cover Change from 2000 to 2040: A Case Study of the Nanchang Urban Agglomeration. Remote Sens. 2023, 15, 4645. [Google Scholar] [CrossRef]
- Rabby, Y.W.; Li, Y.; Abedin, J.; Sabrina, S. Impact of land use/land cover change on landslide susceptibility in Rangamati Municipality of Rangamati District, Bangladesh. ISPRS Int. J. Geo-Inf. 2022, 11, 89. [Google Scholar] [CrossRef]
- Tyagi, A.; Tiwari, R.K.; James, N. Mapping the landslide susceptibility considering future land-use land-cover scenario. Landslides 2023, 20, 65–76. [Google Scholar] [CrossRef]
- Chen, L.; Guo, Z.; Yin, K.; Shrestha, D.P.; Jin, S. The influence of land use and land cover change on landslide susceptibility: A case study in Zhushan Town, Xuan’en County (Hubei, China). Nat. Hazards Earth Syst. Sci. 2019, 19, 2207–2228. [Google Scholar] [CrossRef]
- Viet Du, Q.V.; Nguyen, H.D.; Pham, V.T.; Nguyen, C.H.; Nguyen, Q.H.; Bui, Q.T.; Doan, T.T.; Tran, A.T.; Petrisor, A.I. Deep learning to assess the effects of land use/land cover and climate change on landslide susceptibility in the Tra Khuc river basin of Vietnam. Geocarto Int. 2023, 38, 2172218. [Google Scholar] [CrossRef]
- Shafapourtehrany, M.; Rezaie, F.; Jun, C.; Heggy, E.; Bateni, S.M.; Panahi, M.; Özener, H.; Shabani, F.; Moeini, H. Mapping post-earthquake landslide susceptibility using U-Net, VGG-16, VGG-19, and metaheuristic algorithms. Remote Sens. 2023, 15, 4501. [Google Scholar] [CrossRef]
- Fialko, Y.; Sandwell, D.; Simons, M.; Rosen, P. Three-dimensional deformation caused by the Bam, Iran, earthquake and the origin of shallow slip deficit. Nature 2005, 435, 295–299. [Google Scholar] [CrossRef]
- Fruneau, B.; Achache, J.; Delacourt, C. Observation and modelling of the Saint-Etienne-de-Tinée landslide using SAR interferometry. Tectonophysics 1996, 265, 181–190. [Google Scholar] [CrossRef]
- Amelung, F.; Galloway, D.L.; Bell, J.W.; Zebker, H.A.; Laczniak, R.J. Sensing the ups and downs of Las Vegas: InSAR reveals structural control of land subsidence and aquifer-system deformation. Geology 1999, 27, 483–486. [Google Scholar] [CrossRef]
- Perski, Z. Applicability of ERS-1 and ERS-2 InSAR for land subsidence monitoring in the Silesian coal mining region, Poland. Int. Arch. Photogramm. Remote Sens. 1998, 32, 555–558. [Google Scholar]
- Pritchard, M.E.; Simons, M. An InSAR-based survey of volcanic deformation in the southern Andes. Geophys. Res. Lett. 2004, 31. [Google Scholar] [CrossRef]
- Kwok, R.; Fahnestock, M.A. Ice sheet motion and topography from radar interferometry. IEEE Trans. Geosci. Remote Sens. 1996, 34, 189–200. [Google Scholar] [CrossRef]
- Ma, Z.; Mei, G.; Xu, N. Characterizing seasonality and trend from in situ time-series observations using explainable deep learning for ground deformation forecasting. J. Geophys. Res. Mach. Learn. Comput. 2024, 1, e2024JH000122. [Google Scholar] [CrossRef]
- Han, J.Y.; Miao, C.Y.; Gou, J.J.; Zheng, H.Y.; Zhang, Q.; Guo, X.Y. A new daily gridded precipitation dataset for the Chinese mainland based on gauge observations. Earth Syst. Sci. Data 2023, 15, 3147–3161. [Google Scholar] [CrossRef]
- Hopfield, J.J. Neural networks and physical systems with emergent collective computational abilities. Proc. Natl. Acad. Sci. USA 1982, 79, 2554–2558. [Google Scholar] [CrossRef] [PubMed]
- Hochreiter, S.; Schmidhuber, J. Long short-term memory. Neural Comput. 1997, 9, 1735–1780. [Google Scholar] [CrossRef]
- Cho, K.; Van Merriënboer, B.; Gulcehre, C.; Bahdanau, D.; Bougares, F.; Schwenk, H.; Bengio, Y. Learning phrase representations using RNN encoder-decoder for statistical machine translation. arXiv 2014, arXiv:1406.1078. [Google Scholar]
- Chen, Y.; He, Y.; Zhang, L.; Chen, Y.; Pu, H.; Chen, B.; Gao, L. Prediction of InSAR deformation time-series using a long short-term memory neural network. Int. J. Remote Sens. 2021, 42, 6919–6942. [Google Scholar] [CrossRef]
- Wang, J.; Jaboyedoff, M.; Chen, G.; Luo, X.; Derron, M.H.; Hu, Q.; Fei, L.; Prajapati, G.; Choanji, T.; Luo, S.; et al. Landslide susceptibility prediction and mapping using the LD-BiLSTM model in seismically active mountainous regions. Landslides 2024, 21, 17–34. [Google Scholar] [CrossRef]
- R Core Team. R: A Language and Environment for Statistical Computing; R Foundation for Statistical Computing: Vienna, Austria, 2020. [Google Scholar]
- Thuiller, W.; Georges, D.; Engler, R.; Breiner, F. biomod2: Ensemble platform for species distribution modeling. R Package Version 2016, 3, r539. [Google Scholar]
- Huang, M.; Gong, D.H.; Zhang, L.; Lin, H.; Chen, Y.; Zhu, D.Y.; Xiao, C.J.; Altan, O. Spatiotemporal dynamics and forecasting of ecological security pattern under the consideration of protecting habitat: A case study of the Poyang Lake ecoregion. Int. J. Digit. Earth 2024, 17, 2376277. [Google Scholar] [CrossRef]
- Berardino, P.; Fornaro, G.; Lanari, R.; Sansosti, E. A new algorithm for surface deformation monitoring based on small baseline differential SAR interferograms. IEEE Trans. Geosci. Remote Sens. 2002, 40, 2375–2383. [Google Scholar] [CrossRef]
- Notti, D.; Herrera, G.; Bianchini, S.; Meisina, C.; García-Davalillo, J.C.; Zucca, F. A methodology for improving landslide PSI data analysis. Int. J. Remote Sens. 2014, 35, 2186–2214. [Google Scholar] [CrossRef]
- Schlögel, R.; Doubre, C.; Malet, J.P.; Masson, F. Landslide deformation monitoring with ALOS/PALSAR imagery: A D-InSAR geomorphological interpretation method. Geomorphology 2015, 231, 314–330. [Google Scholar] [CrossRef]
- Woodard, J.B.; Mirus, B.B.; Wood, N.J.; Allstadt, K.E.; Leshchinsky, B.A.; Crawford, M.M. Slope Unit Maker (SUMak): An efficient and parameter-free algorithm for delineating slope units to improve landslide modeling. Nat. Hazards Earth Syst. Sci. 2024, 24, 1–12. [Google Scholar] [CrossRef]
- Alvioli, M.; Guzzetti, F.; Marchesini, I. Parameter-free delineation of slope units and terrain subdivision of Italy. Geomorphology 2020, 358, 107124. [Google Scholar] [CrossRef]


| Classification Basis | Type | Description | Quantity | Percentage (%) |
|---|---|---|---|---|
| Cause | Natural Landslide | Landslides caused by natural geological processes | 16 | 19.05 |
| Human-induced Landslide | Landslides triggered by human engineering activities | 68 | 80.95 | |
| Material Composition | Rock Landslide | Sliding along a highly weathered structural plane on a slope facing an open space | 10 | 11.9 |
| Soil Landslide | 49 soil landslides occurred in granite residual soil and completely weathered soil layers. 25 soil landslides occurred in residual slope deposits of clastic rocks and metamorphic rocks | 74 | 88.1 | |
| Scale | Small Landslide | <10 × 104 m3 | 81 | 96.43 |
| Medium Landslide | 10 × 104 m3~100 × 104 m3 | 3 | 3.57 | |
| Thickness | Shallow Landslide | Thickness within 10 m | 84 | 100 |
| Current Stability | Stable | No signs of activity | 16 | 19.05 |
| Relatively Stable | Slight signs of activity | 45 | 53.57 | |
| Unstable | Obvious signs of activity | 23 | 27.38 |
| Data | Source | Data | Source |
|---|---|---|---|
| 30 m SRTM DEM | NASA Earthdata Search | Lithology | China Geological Survey |
| Slope | 30 m SRTM DEM | Faults | China Geological Survey |
| Aspect | 30 m SRTM DEM | Roads | China Geological Survey |
| Rainfall | Han et al. [51] | Rivers | China Geological Survey |
| NDVI | Google Earth Engine | LULC | Google Earth Engine |
| Rock | China Geological Survey | Sentinel-1A | European Space Agency |
| Deformation (mm) | ||||||
|---|---|---|---|---|---|---|
| Susceptibility | 0–5 | 5–10 | 10–15 | 15–20 | >20 | |
| 1 | 1 | 2 | 3 | 4 | 5 | |
| 2 | 2 | 2 | 3 | 4 | 5 | |
| 3 | 3 | 3 | 3 | 4 | 5 | |
| 4 | 3 | 3 | 4 | 5 | 5 | |
| 5 | 3 | 4 | 5 | 5 | 5 | |
Disclaimer/Publisher’s Note: The statements, opinions and data contained in all publications are solely those of the individual author(s) and contributor(s) and not of MDPI and/or the editor(s). MDPI and/or the editor(s) disclaim responsibility for any injury to people or property resulting from any ideas, methods, instructions or products referred to in the content. |
© 2024 by the authors. Licensee MDPI, Basel, Switzerland. This article is an open access article distributed under the terms and conditions of the Creative Commons Attribution (CC BY) license (https://creativecommons.org/licenses/by/4.0/).
Share and Cite
Li, P.; Wang, H.; Li, H.; Ni, Z.; Deng, H.; Sui, H.; Xu, G. Refined Landslide Susceptibility Mapping Considering Land Use Changes and InSAR Deformation: A Case Study of Yulin City, Guangxi. Remote Sens. 2024, 16, 3016. https://doi.org/10.3390/rs16163016
Li P, Wang H, Li H, Ni Z, Deng H, Sui H, Xu G. Refined Landslide Susceptibility Mapping Considering Land Use Changes and InSAR Deformation: A Case Study of Yulin City, Guangxi. Remote Sensing. 2024; 16(16):3016. https://doi.org/10.3390/rs16163016
Chicago/Turabian StyleLi, Pengfei, Huini Wang, Hongli Li, Zixuan Ni, Hongxing Deng, Haigang Sui, and Guilin Xu. 2024. "Refined Landslide Susceptibility Mapping Considering Land Use Changes and InSAR Deformation: A Case Study of Yulin City, Guangxi" Remote Sensing 16, no. 16: 3016. https://doi.org/10.3390/rs16163016
APA StyleLi, P., Wang, H., Li, H., Ni, Z., Deng, H., Sui, H., & Xu, G. (2024). Refined Landslide Susceptibility Mapping Considering Land Use Changes and InSAR Deformation: A Case Study of Yulin City, Guangxi. Remote Sensing, 16(16), 3016. https://doi.org/10.3390/rs16163016