
Recent Developments in Satellite Remote Sensing for Air Pollution Surveillance in Support of Sustainable Development Goals

 , ,
, ,  and
and
Abstract
1. Introduction
1.1. Importance of Air Pollution
1.2. Association with Vegetation and Climate
1.3. Economic Impact
1.4. Inequality
1.5. Initiatives and SDGs
1.6. Objective
2. Traditional Sensors, Infrastructure and Methods
2.1. Ground Stations
2.2. Databases
3. Case Studies
3.1. Examples of Earth Observation
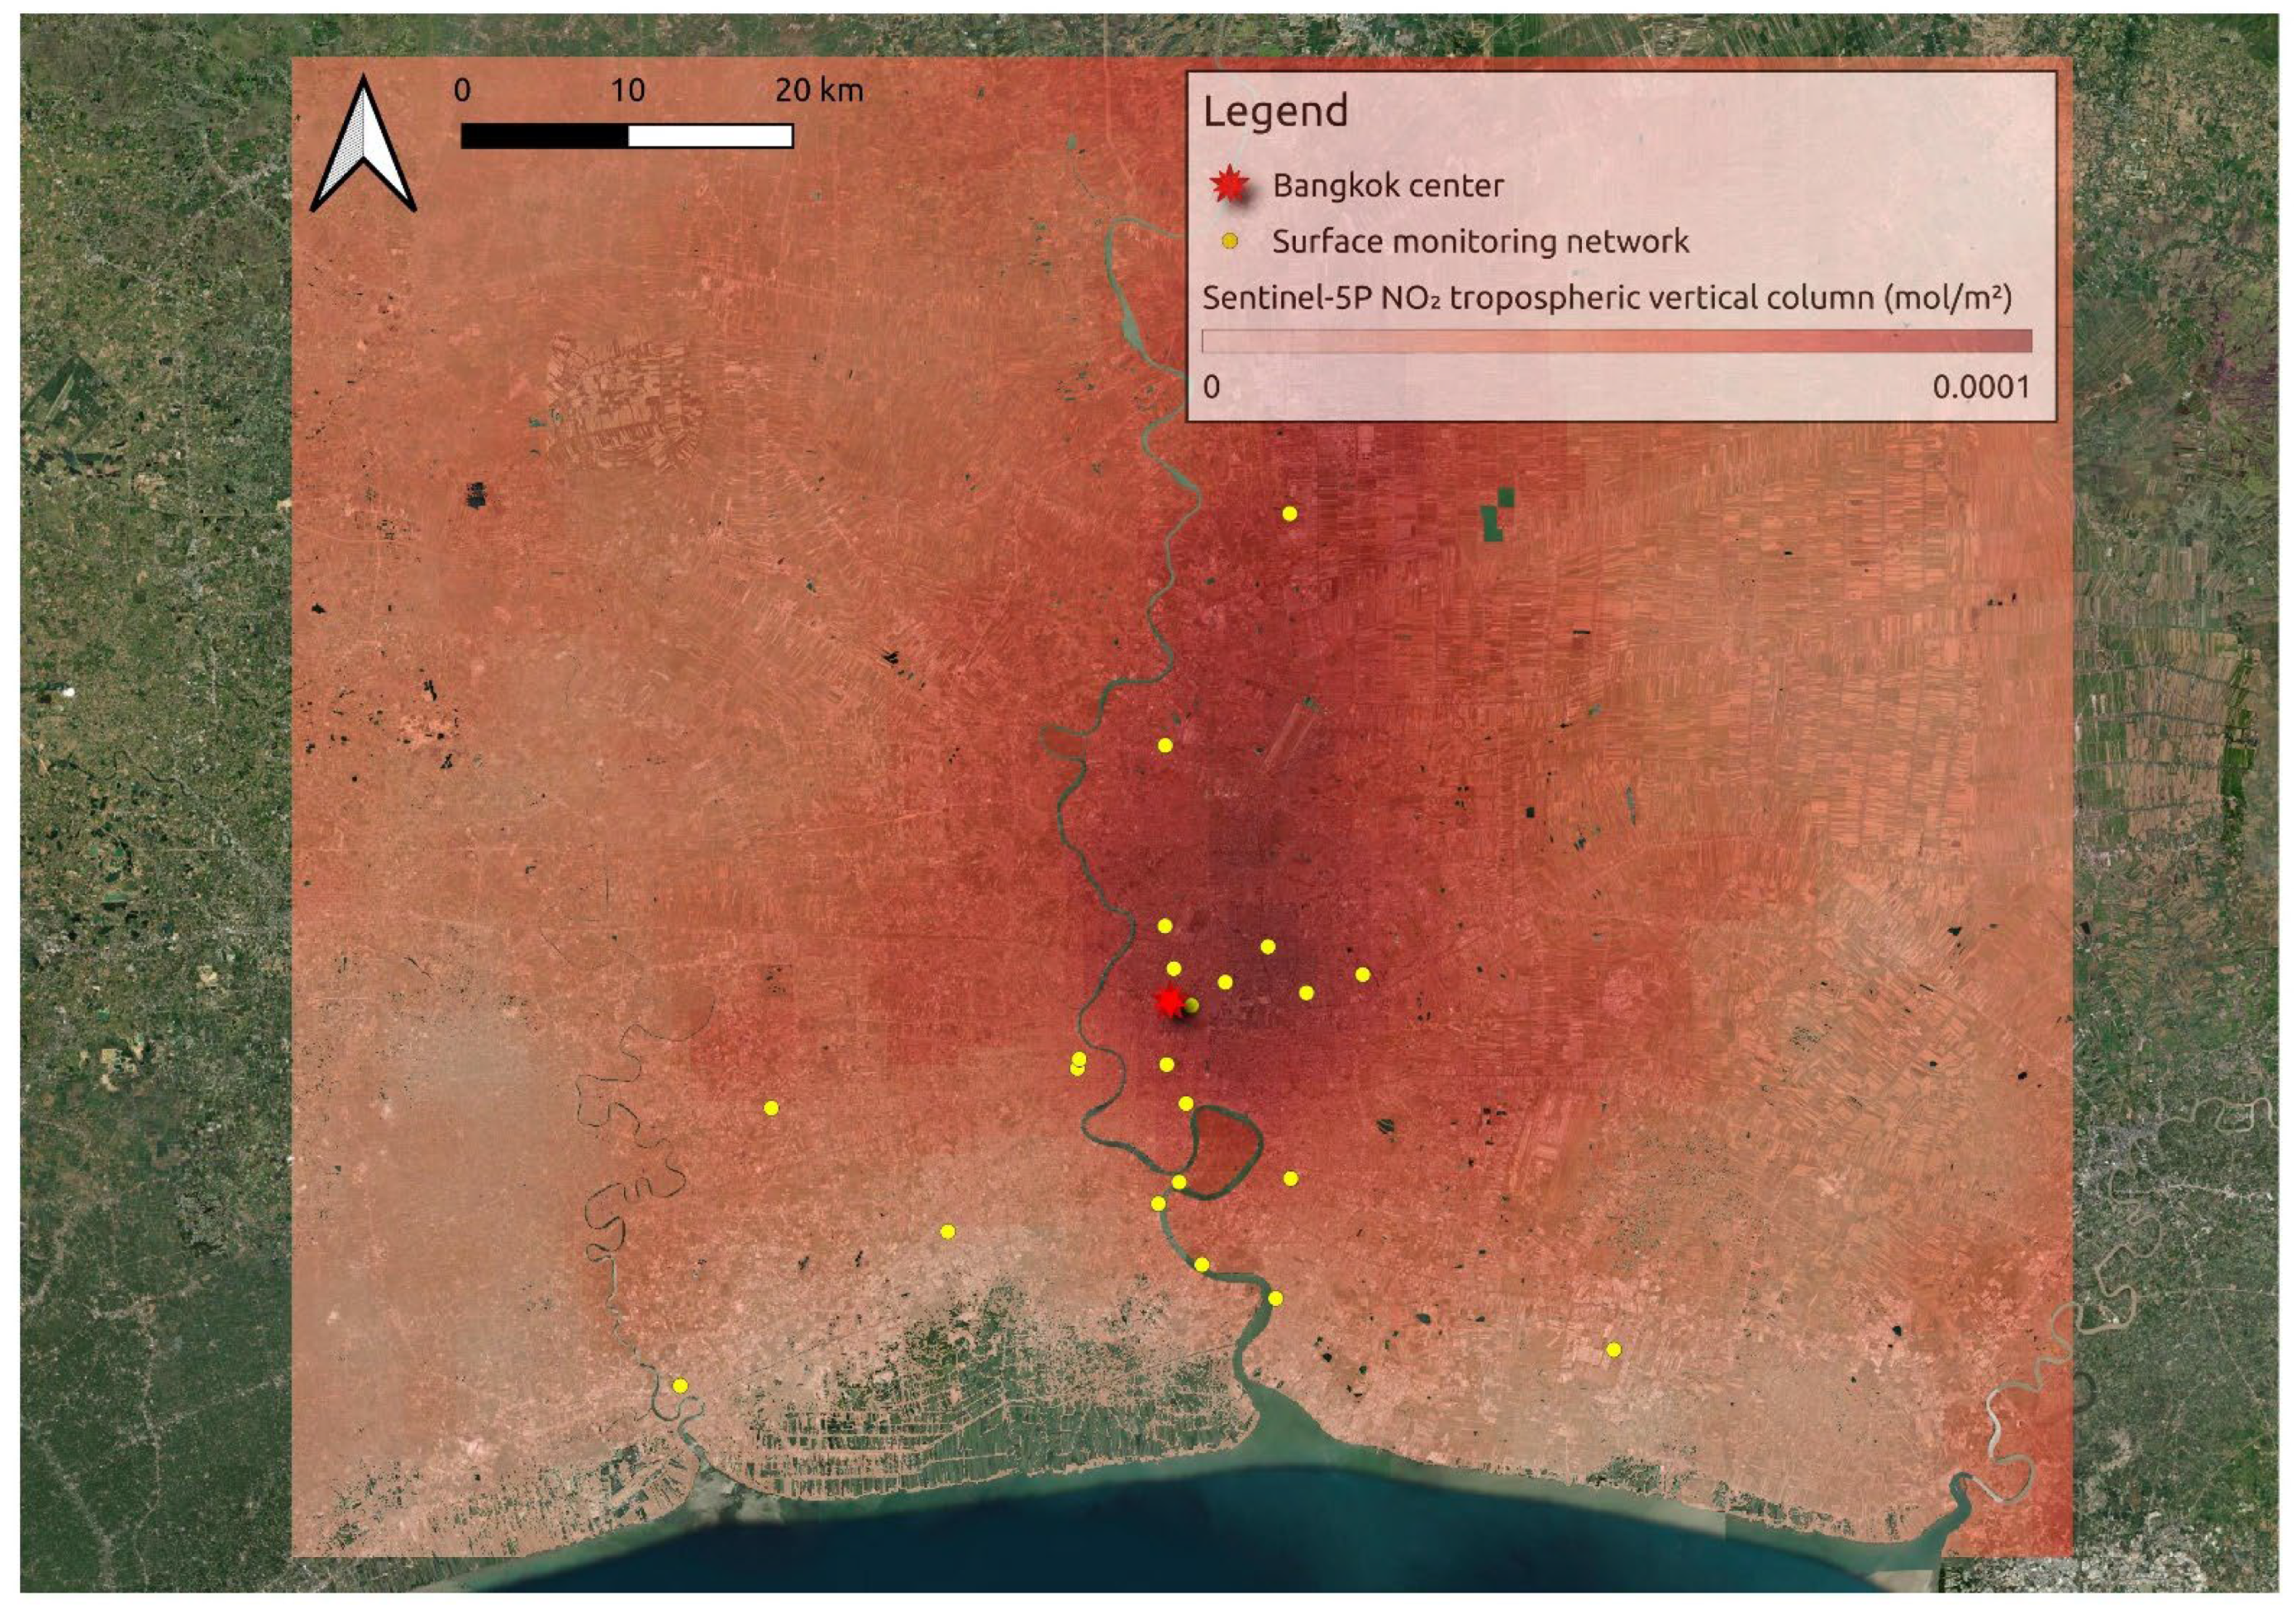
3.2. Sentinel-5P
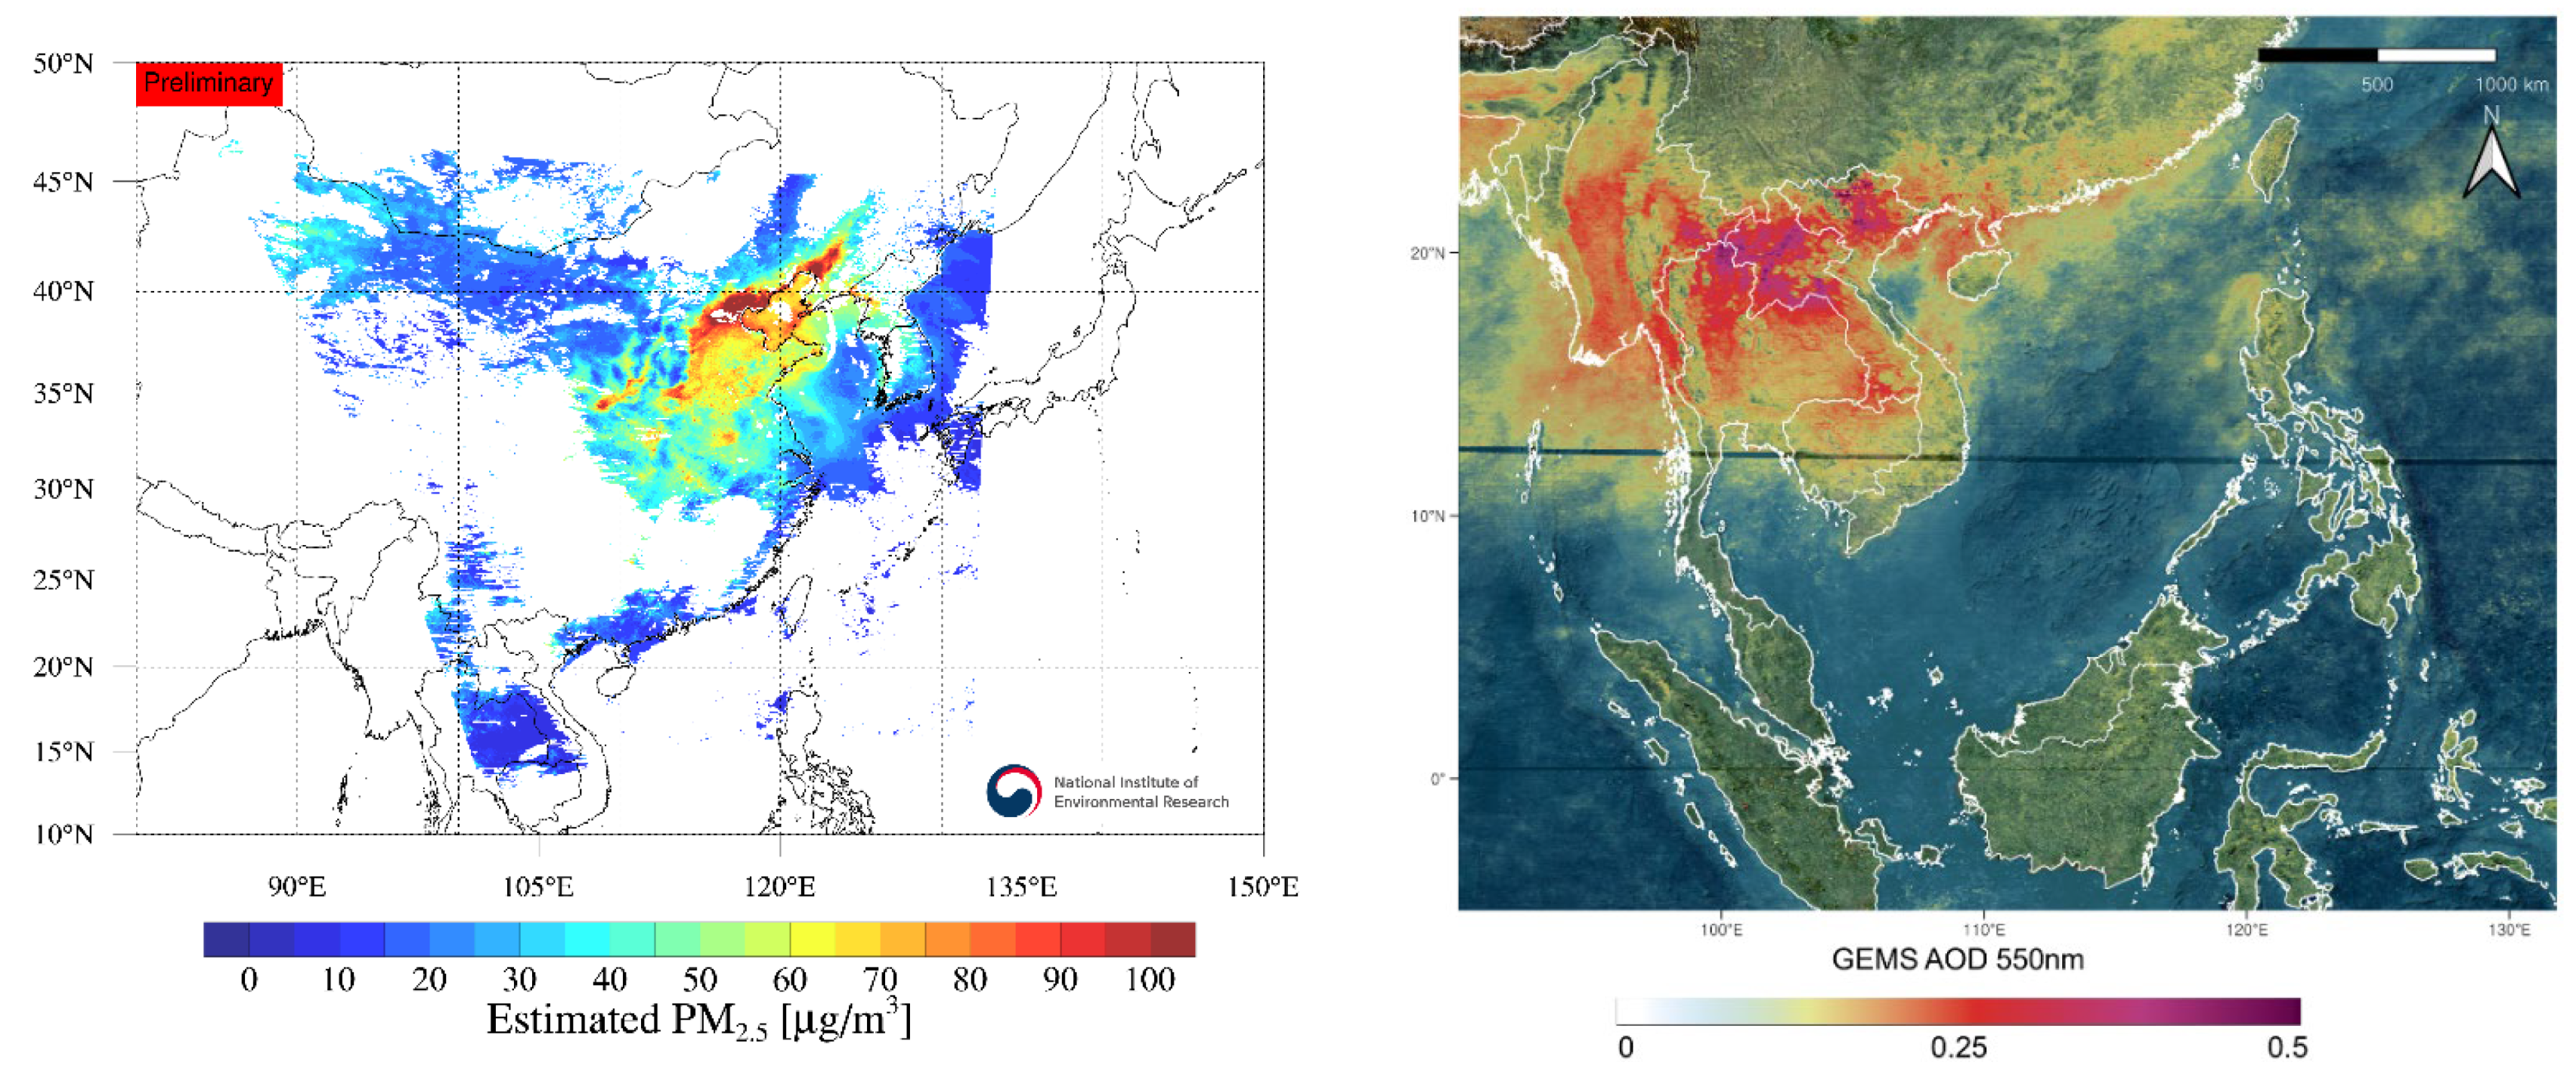
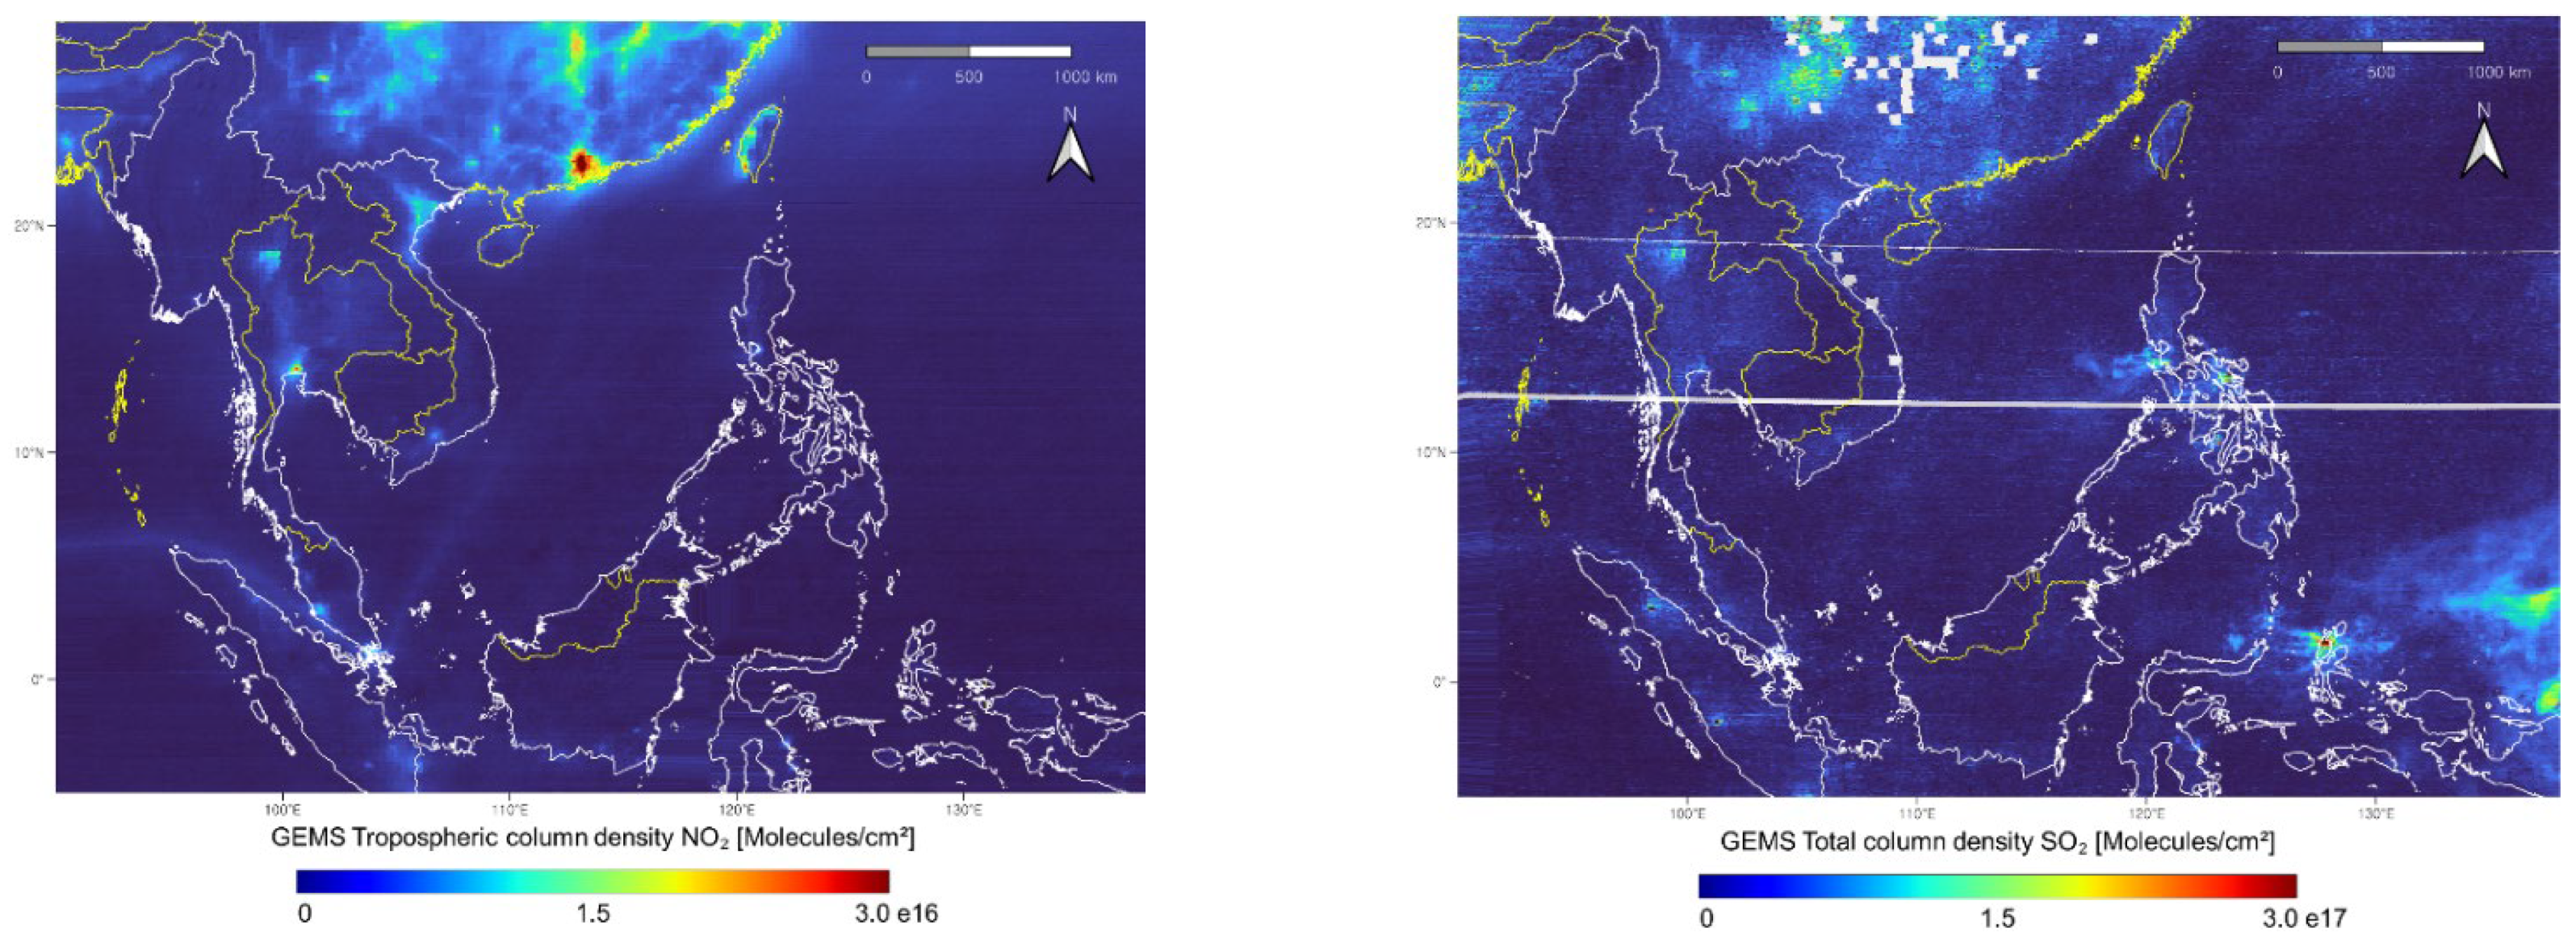
3.3. GEMS
4. Discussion
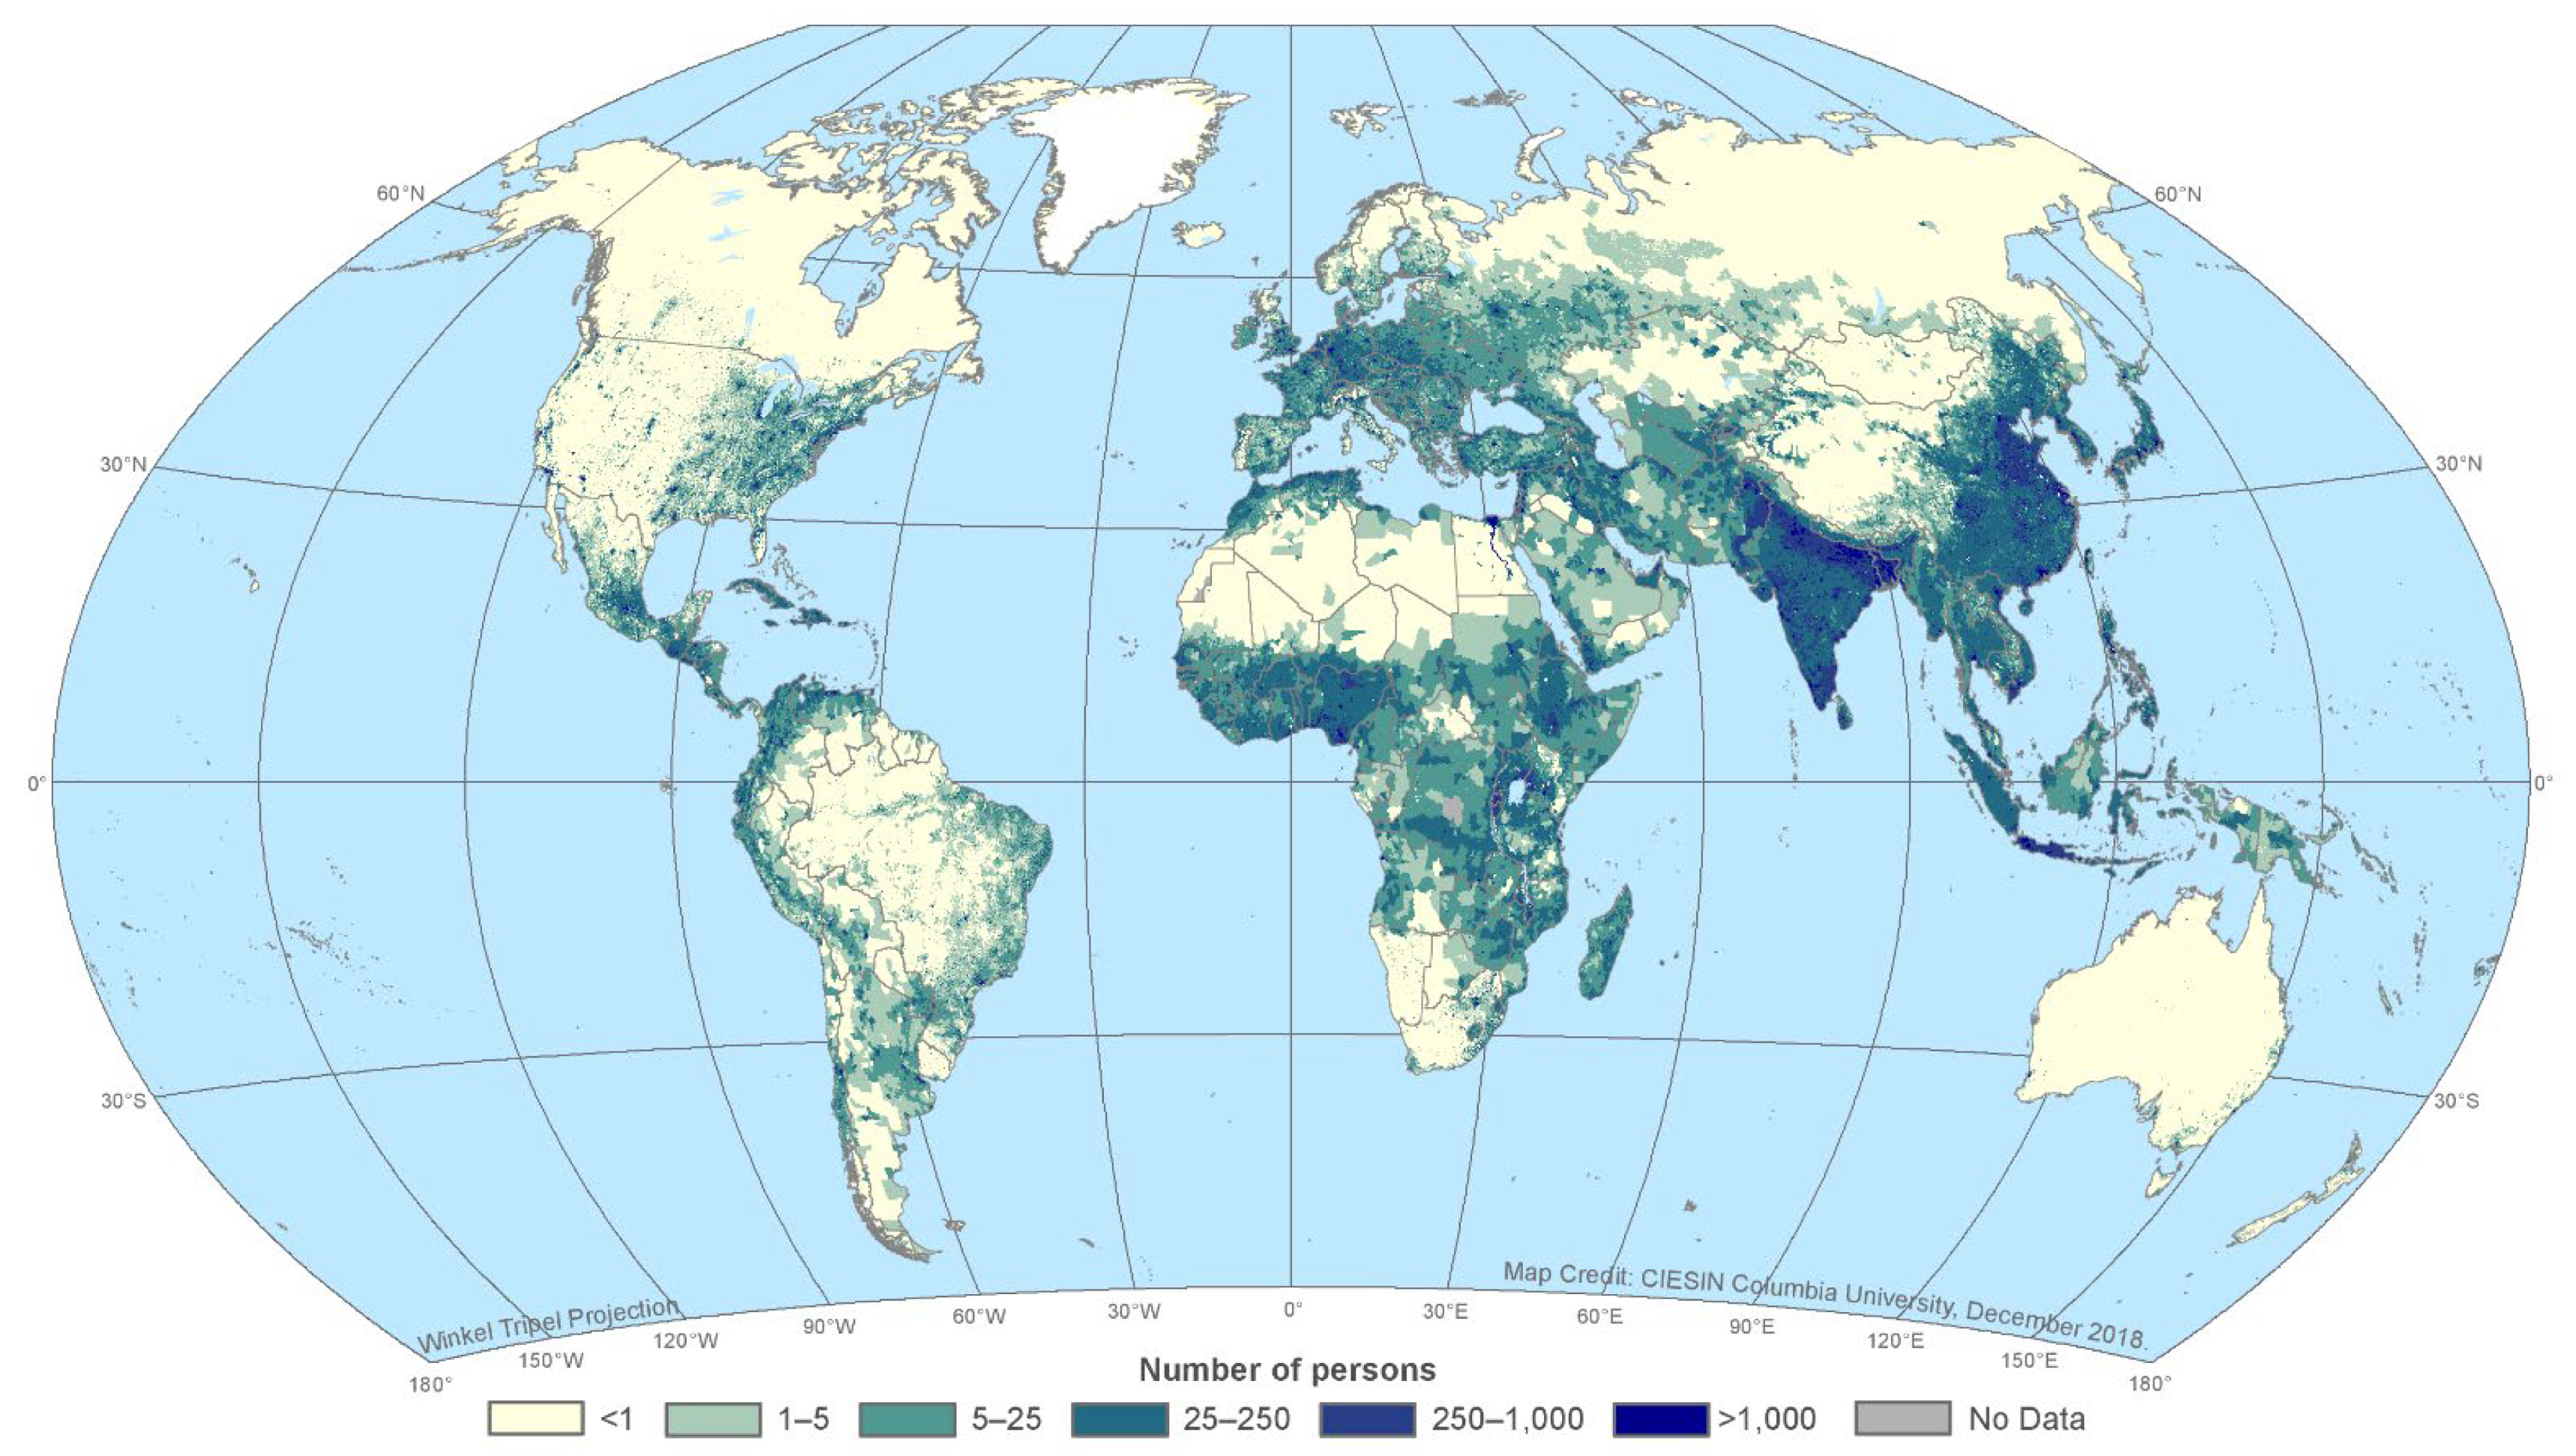
4.1. Filling the Spatial Gap in Low-Income Countries
4.2. Continuous and Contiguous Measurements
4.3. The Near Future of Satellite Remote Sensing in Air Pollution
4.4. Reliability and Accuracy
5. Conclusions
Author Contributions
Funding
Data Availability Statement
Acknowledgments
Conflicts of Interest
References
- Fuller, R.; Landrigan, P.J.; Balakrishnan, K.; Bathan, G.; Bose-O’Reilly, S.; Brauer, M.; Caravanos, J.; Chiles, T.; Cohen, A.; Corra, L.; et al. Pollution and health: A progress update. Lancet Planet. Health 2022, 6, e535–e547. [Google Scholar] [CrossRef] [PubMed]
- World Health Organization. Burden of Disease from Ambient Air Pollution for 2016—Description of Method. 2018. Available online: https://cdn.who.int/media/docs/default-source/air-quality-database/aqd-2018/aap_bod_methods_apr2018_final.pdf?sfvrsn=30ac0d62_3 (accessed on 20 August 2022).
- World Health Organization. Billions of People Still Breathe Unhealthy Air: New WHO Data. 2022. Available online: https://www.who.int/news/item/04-04-2022-billions-of-people-still-breathe-unhealthy-air-new-who-data (accessed on 9 July 2024).
- Xing, Y.F.; Xu, Y.H.; Shi, M.H.; Lian, Y.X. The impact of PM2.5 on the human respiratory system. J. Thorac. Dis. 2016, 8, E69. [Google Scholar] [PubMed]
- Feng, S.; Gao, D.; Liao, F.; Zhou, F.; Wang, X. The health effects of ambient PM2.5 and potential mechanisms. Ecotoxicol. Environ. Saf. 2016, 128, 67–74. [Google Scholar] [CrossRef] [PubMed]
- Brunekreef, B.; Strak, M.; Chen, J.; Andersen, Z.J.; Atkinson, R.; Bauwelinck, M.; Bellander, T.; Boutron, M.-C.; Brandt, J.; Carey, I.; et al. Mortality and morbidity effects of long-term exposure to low-level PM2.5, bc, NO2, and O3: An analysis of European cohorts in the ELAPSE project. Res. Rep. Health Eff. Inst. 2021, 2021, 208. [Google Scholar] [PubMed]
- Brauer, M.; Brook, J.R.; Christidis, T.; Chu, Y.; Crouse, D.L.; Erickson, A.; Hystad, P.; Li, C.; Martin, R.V.; Meng, J.; et al. Mortality–air pollution associations in low exposure environments (MAPLE): Phase 2. Res. Rep. Health Eff. Inst. 2022, 2022, 212. [Google Scholar] [PubMed]
- Dominici, F.; Zanobetti, A.; Schwartz, J.; Braun, D.; Sabath, B.; Wu, X. Assessing adverse health effects of long-term exposure to low levels of ambient air pollution: Implementation of causal inference methods. Res. Rep. Health Eff. Inst. 2022, 2022, 211. [Google Scholar] [PubMed]
- Lu, X.; Lin, C.; Li, W.; Chen, Y.; Huang, Y.; Fung, J.C.; Lau, A.K. Analysis of the adverse health effects of PM2.5 from 2001 to 2017 in China and the role of urbanization in aggravating the health burden. Sci. Total Environ. 2019, 652, 683–695. [Google Scholar] [CrossRef] [PubMed]
- Lu, F.; Xu, D.; Cheng, Y.; Dong, S.; Guo, C.; Jiang, X.; Zheng, X. Systematic review and meta-analysis of the adverse health effects of ambient PM2.5 and PM10 pollution in the Chinese population. Environ. Res. 2015, 136, 196–204. [Google Scholar] [CrossRef]
- World Health Organization. Household Air Pollution. 2022. Available online: https://www.who.int/news-room/fact-sheets/detail/household-air-pollution-and-health (accessed on 9 July 2024).
- World Health Organization. Particulate Matter (PM2.5 and PM10), Ozone, Nitrogen Dioxide, Sulphur Dioxide and Carbon Monoxide; WHO Global Air Quality Guidelines; World Health Organization: Geneva, Switzerland, 2021. [Google Scholar]
- World Health Organization. Ambient Air Pollution: A Global Assessment of Exposure and Burden of Disease; World Health Organization: Geneva, Switzerland, 2016. [Google Scholar]
- GBD 2015 Risk Factors Collaborators. Global, regional, and national comparative risk assessment of 79 behavioural, environmental and occupational, and metabolic risks or clusters of risks, 1990–2015: A systematic analysis for the Global Burden of Disease Study 2015. Lancet 2016, 388, 1659. [Google Scholar] [CrossRef]
- Landrigan, P.J.; Fuller, R.; Acosta, N.J.; Adeyi, O.; Arnold, R.; Baldé, A.B.; Bertollini, R.; Bose-O’Reilly, S.; Boufford, J.I.; Breysse, P.N.; et al. The Lancet Commission on pollution and health. Lancet 2018, 391, 462–512. [Google Scholar] [CrossRef]
- Stevens, C.J.; Bell, J.N.B.; Brimblecombe, P.; Clark, C.M.; Dise, N.B.; Fowler, D.; Lovett, G.M.; Wolseley, P.A. The impact of air pollution on terrestrial managed and natural vegetation. Philos. Trans. R. Soc. A 2020, 378, 20190317. [Google Scholar] [CrossRef] [PubMed]
- Gheorghe, I.F.; Ion, B. The effects of air pollutants on vegetation and the role of vegetation in reducing atmospheric pollution. In The Impact of Air Pollution on Health, Economy, Environment and Agricultural Sources; IntechOpen Limited: London, UK, 2011; Chapter 12; pp. 241–280. [Google Scholar] [CrossRef]
- Emberson, L. Effects of ozone on agriculture, forests and grasslands. Philos. Trans. R. Soc. A 2020, 378, 20190327. [Google Scholar] [CrossRef] [PubMed]
- Mills, G.; Sharps, K.; Simpson, D.; Pleijel, H.; Frei, M.; Burkey, K.; Emberson, L.; Uddling, J.; Broberg, M.; Feng, Z.; et al. Closing the global ozone yield gap: Quantification and cobenefits for multistress tolerance. Glob. Chang. Biol. 2018, 24, 4869–4893. [Google Scholar] [CrossRef] [PubMed]
- World Bank & Institute for Health Metrics and Evaluation. The Cost of Air Pollution: Strengthening the Economic Case for Action (English); World Bank Group: Washington, DC, USA, 2016; Available online: http://documents.worldbank.org/curated/en/781521473177013155/The-cost-of-air-pollution-strengthening-the-economic-case-for-action (accessed on 9 July 2024).
- Awe, Y.A.; Larsen, B.K.; Sanchez-Triana, E. The Global Health Cost of PM2.5 Air Pollution: A Case for Action beyond 2021; International Development in Focus; World Bank Group: Washington, DC, USA, 2021. [Google Scholar]
- Reddington, C.L.; Conibear, L.; Robinson, S.; Knote, C.; Arnold, S.R.; Spracklen, D.V. Air pollution from forest and vegetation fires in Southeast Asia disproportionately impacts the poor. GeoHealth 2021, 5, e2021GH000418. [Google Scholar] [CrossRef] [PubMed]
- Hammer, M.S.; van Donkelaar, A.; Li, C.; Lyapustin, A.; Sayer, A.M.; Hsu, N.C.; Levy, R.C.; Garay, M.J.; Kalashnikova, O.V.; Kahn, R.A.; et al. Global estimates and long-term trends of fine particulate matter concentrations (1998–2018). Environ. Sci. Technol. 2020, 54, 7879–7890. [Google Scholar] [CrossRef]
- Rafaj, P.; Kiesewetter, G.; Gül, T.; Schöpp, W.; Cofala, J.; Klimont, Z.; Purohit, P.; Heyes, C.; Amann, M.; Borken-Kleefeld, J.; et al. Outlook for clean air in the context of sustainable development goals. Glob. Environ. Chang. 2018, 53, 1–11. [Google Scholar] [CrossRef]
- Hvidtfeldt, U.A.; Severi, G.; Andersen, Z.J.; Atkinson, R.; Bauwelinck, M.; Bellander, T.; Boutron-Ruault, M.-C.; Brandt, J.; Brunekreef, B.; Cesaroni, G.; et al. Long-term low-level ambient air pollution exposure and risk of lung cancer—A pooled analysis of 7 European cohorts. Environ. Int. 2021, 146, 106249. [Google Scholar] [CrossRef]
- Papadogeorgou, G.; Kioumourtzoglou, M.A.; Braun, D.; Zanobetti, A. Low levels of air pollution and health: Effect estimates, methodological challenges, and future directions. Curr. Environ. Health Rep. 2019, 6, 105–115. [Google Scholar] [CrossRef]
- West, J.J.; Cohen, A.; Dentener, F.; Brunekreef, B.; Zhu, T.; Armstrong, B.; Bell, M.L.; Brauer, M.; Carmichael, G.; Costa, D.L.; et al. What we breathe impacts our health: Improving understanding of the link between air pollution and health. Environ. Sci. Technol. 2016, 50, 4895–4904. [Google Scholar] [CrossRef]
- United Nations. Transforming Our World: The 2030 Agenda for Sustainable Development. 2015. Available online: https://sdgs.un.org/publications/transforming-our-world-2030-agenda-sustainable-development-17981 (accessed on 9 July 2024).
- Maso, J.; Zabala, A.; Serral, I. Earth Observations for Sustainable Development Goals. Remote Sens. 2023, 15, 2570. [Google Scholar] [CrossRef]
- Varotsos, C.A.; Cracknell, A.P. Remote Sensing Letters contribution to the success of the Sustainable Development Goals-UN 2030 agenda. Remote Sens. Lett. 2020, 11, 715–719. [Google Scholar] [CrossRef]
- World Health Organization. WHO Ambient Air Quality Database—2022 Update—Status Report. 2022. Available online: https://www.who.int/publications/i/item/9789240047693 (accessed on 9 July 2024).
- Doxsey-Whitfield, E.; MacManus, K.; Adamo, S.B.; Pistolesi, L.; Squires, J.; Borkovska, O.; Baptista, S.R. Taking advantage of the improved availability of census data: A first look at the gridded population of the world, version 4. Appl. Geogr. 2015, 1, 226–234. [Google Scholar] [CrossRef]
- Center for International Earth Science Information Network—CIESIN—Columbia University. Gridded Population of the World, Version 4 (GPWv4): Population Count Adjusted to Match 2015 Revision of UN WPP Country Totals, Revision 11. Palisades, New York: NASA Socioeconomic Data and Applications Center (SEDAC). 2018. Available online: https://sedac.ciesin.columbia.edu/data/set/gpw-v4-population-count-adjusted-to-2015-unwpp-country-totals-rev11 (accessed on 1 August 2022).
- Veefkind, J.P.; Aben, I.; McMullan, K.; Förster, H.; De Vries, J.; Otter, G.; Claas, J.; Eskes, H.J.; de Haan, J.F.; Kleipool, Q.; et al. TROPOMI on the ESA Sentinel-5 Precursor: A GMES mission for global observations of the atmospheric composition for climate, air quality and ozone layer applications. Remote Sens. Environ. 2012, 120, 70–83. [Google Scholar] [CrossRef]
- ESA. Technical Guides, Sentinel-5P TROPOMI, Products and Algorithms. 2020. Available online: https://sentinel.esa.int/web/sentinel/technical-guides/sentinel-5p/products-algorithms (accessed on 9 July 2024).
- Muhammad, S.; Long, X.; Salman, M. COVID-19 pandemic and environmental pollution: A blessing in disguise? Sci. Total Environ. 2020, 728, 138820. [Google Scholar] [CrossRef]
- Bauwens, M.; Compernolle, S.; Stavrakou, T.; Müller, J.F.; Van Gent, J.; Eskes, H.; Levelt, P.F.; Van Der A, R.; Veefkind, J.P.; Vlietinck, J.; et al. Impact of coronavirus outbreak on NO2 pollution assessed using TROPOMI and OMI observations. Geophys. Res. Lett. 2020, 47, e2020GL087978. [Google Scholar] [CrossRef]
- Wang, Q.; Su, M. A preliminary assessment of the impact of COVID-19 on environment—A case study of China. Sci. Total Environ. 2020, 728, 138915. [Google Scholar] [CrossRef] [PubMed]
- Stratoulias, D.; Nuthammachot, N. Air quality development during the COVID-19 pandemic over a medium-sized urban area in Thailand. Sci. Total Environ. 2020, 746, 141320. [Google Scholar] [CrossRef]
- Fan, C.; Li, Y.; Guang, J.; Li, Z.; Elnashar, A.; Allam, M.; de Leeuw, G. The impact of the control measures during the COVID-19 outbreak on air pollution in China. Remote Sens. 2020, 12, 1613. [Google Scholar] [CrossRef]
- Sharma, S.; Zhang, M.; Gao, J.; Zhang, H.; Kota, S.H. Effect of restricted emissions during COVID-19 on air quality in India. Sci. Total Environ. 2020, 728, 138878. [Google Scholar] [CrossRef] [PubMed]
- Sreekanth, V.; Kushwaha, M.; Kulkarni, P.; Upadhya, A.R.; Spandana, B.; Prabhu, V. Impact of COVID-19 lockdown on the fine particulate matter concentration levels: Results from Bengaluru megacity, India. Adv. Space Res. 2021, 67, 2140–2150. [Google Scholar] [CrossRef]
- Mahesh, B.; Sivakumar, V.; Kulkarni, P.; Sreekanth, V. Particulate air pollution in Durban: Characteristics and its relationship with 1 km resolution satellite aerosol optical depth. Adv. Space Res. 2022, 70, 371–382. [Google Scholar] [CrossRef]
- Gorelick, N.; Hancher, M.; Dixon, M.; Ilyushchenko, S.; Thau, D.; Moore, R. Google Earth Engine: Planetary-scale geospatial analysis for everyone. Remote Sens. Environ. 2017, 202, 18–27. [Google Scholar] [CrossRef]
- Kim, J.; Jeong, U.; Ahn, M.H.; Kim, J.H.; Park, R.J.; Lee, H.; Song, C.H.; Choi, Y.-S.; Lee, K.-H.; Yoo, J.-M.; et al. New era of air quality monitoring from space: Geostationary Environment Monitoring Spectrometer (GEMS). Bull. Am. Meteorol. Soc. 2020, 101, E1–E22. [Google Scholar] [CrossRef]
- Burke, M.; Driscoll, A.; Lobell, D.B.; Ermon, S. Using satellite imagery to understand and promote sustainable development. Science 2021, 371, eabe8628. [Google Scholar] [CrossRef]
- Andries, A.; Morse, S.; Murphy, R.J.; Lynch, J.; Woolliams, E.R. Using Data from Earth Observation to Support Sustainable Development Indicators: An Analysis of the Literature and Challenges for the Future. Sustainability 2022, 14, 1191. [Google Scholar] [CrossRef]
- Longhurst, J.; Barnes, J.; Chatterton, T.; De Vito, L.; Everard, M.; Hayes, E.; Prestwood, E.; Williams, B. Analysing air pollution and its management through the lens of the UN sustainable development goals: A review and assessment. WIT Trans. Ecol. Environ. 2018, 230, 3–14. [Google Scholar]
- Pinder, R.W.; Klopp, J.M.; Kleiman, G.; Hagler, G.S.; Awe, Y.; Terry, S. Opportunities and challenges for filling the air quality data gap in low-and middle-income countries. Atmos. Environ. 2019, 215, 116794. [Google Scholar] [CrossRef]
- World Economic Forum. Net Zero Carbon Cities: An Integrated Approach. Insight Report. 2021. Available online: https://www3.weforum.org/docs/WEF_Net_Zero_Carbon_Cities_An_Integrated_Approach_2021.pdf (accessed on 5 June 2024).
- Bechle, M.J.; Millet, D.B.; Marshall, J.D. Effects of income and urban form on urban NO2: Global evidence from satellites. Environ. Sci. Technol. 2011, 45, 4914–4919. [Google Scholar] [CrossRef]
- Keola, S.; Hayakawa, K. Do lockdown policies reduce economic and social activities? Evidence from NO2 emissions. Dev. Econ. 2021, 59, 178–205. [Google Scholar] [CrossRef]
- World Health Organization. WHO Ambient Air Quality Database—April 2022 Update—Methodology. 2022. Available online: https://cdn.who.int/media/docs/default-source/air-pollution-documents/air-quality-and-health/methodology_who-air-quality-database-2022.pdf?sfvrsn=bdcf9241_10 (accessed on 9 July 2024).
- Global Burden of Disease. Institute for Health Metrics and Evaluation. Seattle (WA). 2022. Available online: www.healthdata.org/gbd (accessed on 9 July 2024).
- Larkin, A.; Geddes, J.A.; Martin, R.V.; Xiao, Q.; Liu, Y.; Marshall, J.D.; Brauer, M.; Hystad, P. Global land use regression model for nitrogen dioxide air pollution. Environ. Sci. Technol. 2017, 51, 6957–6964. [Google Scholar] [CrossRef]
- Clean Air Asia. Paseig City. 2022. Available online: https://cleanairasia.org/ (accessed on 9 July 2024).
- Air Quality e-Reporting. Copenhagen: European Environment Agency. 2022. Available online: https://www.eea.europa.eu/data-and-maps/data/aqereporting-9 (accessed on 9 July 2024).
- AirNow Department of State. Research Triangle Park (NC). United States Environmental Protection. Agency Office of Air Quality Planning and Standards. 2022. Available online: https://www.airnow.gov/international/us-embassies-and-consulates (accessed on 9 July 2024).
- Union of Concerned Scientists (UCS). UCS Satellite Database. 2023. Available online: https://www.ucsusa.org/resources/satellite-database (accessed on 9 July 2024).
- Strandgren, J. Study of Satellite Retrieved Aerosol Optical Depth Spatial Resolution Effect on Particulate Matter Concentration Prediction. Master’s Thesis, Lulea University of Technology Study, Norrbotten County, Sweden, 2014. Available online: https://urn.kb.se/resolve?urn=urn:nbn:se:ltu:diva-48692 (accessed on 9 July 2024).
- Wang, Z.; Menenti, M. Challenges and opportunities in Lidar remote sensing. Front. Remote Sens. 2021, 2, 641723. [Google Scholar] [CrossRef]
- National Academies of Sciences, Engineering, and Medicine. Thriving on Our Changing Planet: A Decadal Strategy for Earth Observation from Space. Chapter 3: A Prioritized Program for Science, Applications, and Observations; The National Academies Press: Washington, DC, USA, 2018; Available online: https://doi.org/10.17226/24938 (accessed on 5 June 2024).
- Cheng, X.; Liu, Y.; Xu, X.; You, W.; Zang, Z.; Gao, L.; Chen, Y.; Su, D.; Yan, P. Lidar data assimilation method based on CRTM and WRF-Chem models and its application in PM2.5 forecasts in Beijing. Sci. Total Environ. 2019, 682, 541–552. [Google Scholar] [CrossRef]
- El Amraoui, L.; Sič, B.; Piacentini, A.; Marécal, V.; Frebourg, N.; Attié, J.L. Aerosol data assimilation in the MOCAGE chemical transport model during the TRAQA/ChArMEx campaign: Lidar observations. Atmos. Meas. Tech. 2020, 13, 4645–4667. [Google Scholar] [CrossRef]
- Perrone, M.R.; De Tomasi, F.; Gobbi, G.P. Vertically resolved aerosol properties by multi-wavelength lidar measurements. Atmos. Chem. Phys. 2014, 14, 1185–1204. [Google Scholar] [CrossRef]
- Hara, Y.; Nishizawa, T.; Sugimoto, N.; Osada, K.; Yumimoto, K.; Uno, I.; Kudo, R.; Ishimoto, H. Retrieval of aerosol components using multi-wavelength Mie-Raman lidar and comparison with ground aerosol sampling. Remote Sens. 2018, 10, 937. [Google Scholar] [CrossRef]
- Singh, D.; Dahiya, M.; Kumar, R.; Nanda, C. Sensors and systems for air quality assessment monitoring and management: A review. J. Environ. Manag. 2021, 289, 112510. [Google Scholar] [CrossRef] [PubMed]
- Li, S.; Dragicevic, S.; Castro, F.A.; Sester, M.; Winter, S.; Coltekin, A.; Pettit, C.; Jiang, B.; Haworth, J.; Stein, A.; et al. Geospatial big data handling theory and methods: A review and research challenges. ISPRS J. Photogramm. Remote Sens. 2016, 115, 119–133. [Google Scholar] [CrossRef]
- Xu, J.W.; Martin, R.V.; Van Donkelaar, A.; Kim, J.; Choi, M.; Zhang, Q.; Geng, G.; Liu, Y.; Ma, Z.; Huang, L.; et al. Estimating ground-level PM2.5 in eastern China using aerosol optical depth determined from the GOCI satellite instrument. Atmos. Chem. Phys. 2015, 15, 13133–13144. [Google Scholar] [CrossRef]
- Sreekanth, V.; Mahesh, B.; Niranjan, K. Satellite remote sensing of fine particulate air pollutants over Indian mega cities. Adv. Space Res. 2017, 60, 2268–2276. [Google Scholar] [CrossRef]
- Park, S.; Shin, M.; Im, J.; Song, C.K.; Choi, M.; Kim, J.; Lee, S.; Park, R.; Kim, J.; Lee, D.-W.; et al. Estimation of ground-level particulate matter concentrations through the synergistic use of satellite observations and process-based models over South Korea. Atmos. Chem. Phys. 2019, 19, 1097–1113. [Google Scholar] [CrossRef]
- Van Donkelaar, A.; Martin, R.V.; Brauer, M.; Boys, B.L. Use of satellite observations for long-term exposure assessment of global concentrations of fine particulate matter. Environ. Health Perspect. 2015, 123, 135–143. [Google Scholar] [CrossRef] [PubMed]
- Zhang, Y.; Li, Z.; Bai, K.; Wei, Y.; Xie, Y.; Zhang, Y.; Ou, Y.; Cohen, J.; Zhang, Y.; Peng, Z.; et al. Satellite remote sensing of atmospheric particulate matter mass concentration: Advances, challenges, and perspectives. Fundam. Res. 2021, 1, 240–258. [Google Scholar] [CrossRef]
- Alvarado, M.J.; McVey, A.E.; Hegarty, J.D.; Cross, E.S.; Hasenkopf, C.A.; Lynch, R.; Kennelly, E.J.; Onasch, T.B.; Awe, Y.; Sanchez-Triana, E.; et al. Evaluating the use of satellite observations to supplement ground-level air quality data in selected cities in low-and middle-income countries. Atmos. Environ. 2019, 218, 117016. [Google Scholar] [CrossRef]
- Stratoulias, D.; Jang, B.; Nuthammachot, N. Evaluation of daily PM2.5 surface concentrations over 76 major cities and the association with AOD: A global analysis of ambient air pollution. Remote Sens. 2024; in press. [Google Scholar]
- World Bank. Getting Down to Earth: Are Satellites Reliable for Measuring Air Pollutants That Cause Mortality in Low-and Middle-Income Countries? International Development in Focus; World Bank Group: Washington, DC, USA, 2022. [Google Scholar]
- Health Effects Institute. Air Quality and Health. In Cities: A State of Global Air Report 2022; Health Effects Institute: Boston, MA, USA, 2022. [Google Scholar]
- Yang, Z.; Zdanski, C.; Farkas, D.; Bang, J.; Williams, H. Evaluation of Aerosol Optical Depth (AOD) and PM2.5 associations for air quality assessment. Remote Sens. Appl. Soc. Environ. 2020, 20, 100396. [Google Scholar] [CrossRef]
- Thurston, G.; Awe, Y.; Ostro, B.; Sanchez-Triana, E. Are All Air Pollution Particles Equal? How Constituents and Sources of Fine Air Pollution Particles (PM2.5) Affect Health; World Bank Group: Washington, DC, USA, 2021. [Google Scholar]
- Lee, K.; Chung, C.E. Observationally-constrained estimates of global fine-mode AOD. Atmos. Chem. Phys. 2013, 13, 2907–2921. [Google Scholar] [CrossRef]
- Yan, X.; Shi, W.; Li, Z.; Li, Z.; Luo, N.; Zhao, W.; Wang, H.; Yu, X. Satellite-based PM2.5 estimation using fine-mode aerosol optical thickness over China. Atmos. Environ. 2017, 170, 290–302. [Google Scholar] [CrossRef]
- Zang, Z.; Li, D.; Guo, Y.; Shi, W.; Yan, X. Superior PM2.5 estimation by integrating aerosol fine mode data from the Himawari-8 satellite in deep and classical machine learning models. Remote Sens. 2021, 13, 2779. [Google Scholar] [CrossRef]
- Wei, X.; Chang, N.B.; Bai, K.; Gao, W. Satellite remote sensing of aerosol optical depth: Advances, challenges, and perspectives. Crit. Rev. Environ. Sci. Technol. 2020, 50, 1640–1725. [Google Scholar] [CrossRef]
- Liu, C.; Cai, J.; Chen, R.; Sera, F.; Guo, Y.; Tong, S.; Li, S.; Lavigne, E.; Correa, P.M.; Ortega, N.V.; et al. Coarse particulate air pollution and daily mortality: A global study in 205 cities. Am. J. Respir. Crit. Care Med. 2022, 206, 999–1007. [Google Scholar] [CrossRef]
- Dubovik, O.; Schuster, G.L.; Xu, F.; Hu, Y.; Bösch, H.; Landgraf, J.; Li, Z. Grand challenges in satellite remote sensing. Front. Remote Sens. 2021, 2, 619818. [Google Scholar] [CrossRef]


| SDG. Target. Indicator | Goal | Target | Indicator |
|---|---|---|---|
| 3.9.1 | Ensure healthy lives and promote well-being for all at all | By 2030, substantially reduce the number of deaths and illnesses from hazardous chemicals and air, water, and soil pollution and contamination | Mortality rate attributed to household and ambient air pollution |
| 11.6.2 | Make cities and human settlements inclusive, safe, resilient, and sustainable | By 2030, reduce the adverse per capita environmental impact of cities, including by paying special attention to air quality and municipal and other waste management | Annual mean levels of fine particulate matter (e.g., PM2.5 and PM10) in cities (population-weighted) |
| 7.1.2 | Ensure access to affordable, reliable, sustainable, and modern energy for all | By 2030, ensure universal access to affordable, reliable, and modern energy services | Proportion of population with primary reliance on clean fuels and technology |
Disclaimer/Publisher’s Note: The statements, opinions and data contained in all publications are solely those of the individual author(s) and contributor(s) and not of MDPI and/or the editor(s). MDPI and/or the editor(s) disclaim responsibility for any injury to people or property resulting from any ideas, methods, instructions or products referred to in the content. |
© 2024 by the authors. Licensee MDPI, Basel, Switzerland. This article is an open access article distributed under the terms and conditions of the Creative Commons Attribution (CC BY) license (https://creativecommons.org/licenses/by/4.0/).
Share and Cite
Stratoulias, D.; Nuthammachot, N.; Dejchanchaiwong, R.; Tekasakul, P.; Carmichael, G.R. Recent Developments in Satellite Remote Sensing for Air Pollution Surveillance in Support of Sustainable Development Goals. Remote Sens. 2024, 16, 2932. https://doi.org/10.3390/rs16162932
Stratoulias D, Nuthammachot N, Dejchanchaiwong R, Tekasakul P, Carmichael GR. Recent Developments in Satellite Remote Sensing for Air Pollution Surveillance in Support of Sustainable Development Goals. Remote Sensing. 2024; 16(16):2932. https://doi.org/10.3390/rs16162932
Chicago/Turabian StyleStratoulias, Dimitris, Narissara Nuthammachot, Racha Dejchanchaiwong, Perapong Tekasakul, and Gregory R. Carmichael. 2024. "Recent Developments in Satellite Remote Sensing for Air Pollution Surveillance in Support of Sustainable Development Goals" Remote Sensing 16, no. 16: 2932. https://doi.org/10.3390/rs16162932
APA StyleStratoulias, D., Nuthammachot, N., Dejchanchaiwong, R., Tekasakul, P., & Carmichael, G. R. (2024). Recent Developments in Satellite Remote Sensing for Air Pollution Surveillance in Support of Sustainable Development Goals. Remote Sensing, 16(16), 2932. https://doi.org/10.3390/rs16162932