Abstract
The ionospheric quasi-periodic wave is a type of typical and common electromagnetic wave phenomenon occurring in extremely low-frequency (ELF) and very low-frequency ranges (VLF). These emissions propagate in a distinct whistler-wave mode, with varying periodic modulations of the wave intensity over time scales from several seconds to a few minutes. We developed an automatic detection model for the QP waves in the ELF band recorded by the China Seismo-Electromagnetic Satellite. Based on the 827 QP wave events, which were collected through visual screening from the electromagnetic field observations, an automatic detection model based on the Transformer architecture was built. This model, comprising 34.27 million parameters, was trained and evaluated. It achieved mean average precision of 92.3% on the validation dataset, operating at a frame rate of 39.3 frames per second. Notably, after incorporating the proton cyclotron frequency constraint, the model displayed promising performance. Its lightweight design facilitates easy deployment on satellite equipment, significantly enhancing the feasibility of on-board detection.
1. Introduction
The quasi-periodic (QP) emission is a type of typical whistler-mode electromagnetic wave commonly appearing in the frequency range of extremely/very low frequency (ELF/VLF), with great research value in terms of understanding the physical space environment of the ionosphere [1,2]. The wave property of the QP wave shows varying periodic modulations over time scales from several seconds to a few minutes [3]. Since the 1960s, the QP wave has been extensively studied using observations from electric field detectors (EFD) and search coil magnetometers (SCM) onboard satellites operating at different altitudes (high/medium/low orbit) or installed at ground stations. The QP wave preferably occurs during geomagnetic storms. Generally, there are two types of QP waves according to their association (Type I) or non-association (Type II) with ultra-low-frequency (ULF) magnetic field pulsations [1,4]. Thus, there are mainly two generation mechanisms: Type I is excited by the modulation of ULF geomagnetic pulsations, and Type II is mainly excited by the cyclotron instability caused by wave–particle interactions [5].
In recent decades, with the launch of low-orbit electromagnetic satellites, such as DEMETER and the China Seismo-Electromagnetic Satellite (CSES-01), a large number of QP wave events in the ionosphere have been recorded. The observations from DEMETER and the CSES-01 show that the QP waves mainly appear in the dayside ionosphere, with a frequency range of several hundred hertz to 4 kHz [2,3]. Hayosh et al. reported that the source region of QP waves is probably located near the geomagnetic equatorial plane of the magnetosphere, and its occurrence is dependent on disturbed space weather conditions based on the analysis of DEMETER’s observations [2]. Zhima et al. were the first to report the well-pronounced rising-tone QP waves accompanied by simultaneous energetic precipitations based on the CSES-01’s observations, with a repetition period varying from ~1 s to ~23 s [3].
Although previous studies have achieved a certain understanding of QP emissions, its propagation features and generation mechanism are still poorly understood, due to the limitations of massive electromagnetic field data analysis. Since its launch on 2 February 2018, the CSES-01 has been operating stably in orbit for more than six years, accumulating massive electromagnetic field waveform data that contain valuable information about QP waves, providing us with new opportunities to study QP waves in depth. However, in the face of these massive electromagnetic field datasets, the traditional data processing and research methods are inefficient, and the information mining capacity is very limited. Therefore, we propose an automatic detection method to extract target information from massive electromagnetic data quickly and accurately.
It is known that with the advent of intelligent technology, image recognition algorithms based on deep learning can achieve better results than traditional algorithms in areas such as target detection. This is thanks to neural networks, which can automatically extract features from large amounts of data, creating many powerful target detection algorithms. There are two main types of deep learning methods based on target recognition algorithms. One is the two-stage target detection algorithms based on the region proposal strategy, such as the Faster Region-Based Convolutional Neural Network (RCNN) algorithm [6], which has high accuracy but is slow and takes a long time to train. The second one is the one-step detection and recognition algorithms based on the regression framework.
Regarding the second type, this class of algorithms first locates the object and then determines its type. They do not need to pre-identify regions where the object might be; instead, they directly predict the object’s type and location. Examples include the RetinaNet algorithm [7], the YOLOv3 algorithm [8], and the CenterNet algorithm [9]. While these algorithms are fast, they have lower accuracy and perform poorly in detecting small objects.
The aforementioned models require extensive prior knowledge to obtain initial frames and use non-maximum suppression to eliminate redundant predicted frames, thereby filtering out high-quality detection results. In 2020, the Facebook AI team proposed the Transformer-based end-to-end object detection algorithm DETR (Detection Transformer) [10,11], which introduced the Transformer structure to the field of object detection and demonstrated excellent performance. However, the spectrogram feature of the QP emissions from satellite data results in different texture features and the locations of wave events vary; thus, the direct use of the existing DETR algorithm is not effective enough. Therefore, we improved the existing DETR algorithm in this work.
The primary contributions of this study are listed as follows.
(1) Using satellite data from the CSES-01, a dataset of 827 significant samples of QP emission events was created.
(2) A target detection algorithm, called QP-DETR, was proposed to cope with the complex morphological features of QP emissions and the interference from the space electromagnetic environment.
(3) QP-DETR was validated on the created QP dataset and the EFD payload ELF band data from June 2023. The experimental results show that QP-DETR achieves a high detection speed and a lightweight model while ensuring recognition accuracy.
2. Dataset and Target
This section provides an overview of the dataset and target QP emissions in this study. It includes detailed descriptions of the CSES-01 satellite and its payloads, the electromagnetic features of QP waves, and the process of identifying and characterizing QP emissions.
2.1. CSES-01 Satellite and Dataset
Observations of the electromagnetic field are an important means of gaining a comprehensive understanding of the ionospheric QP emission phenomena in near-Earth space. China successfully launched the CSES-01 into a sun-synchronous polar orbit on 2 February 2018 [12], with the scientific objective of monitoring the ionosphere disturbances related to the strong earthquakes in the lithosphere by detecting the electromagnetic field, ionospheric plasma, and other physical phenomena in global space. The satellite has an altitude of 507 km, inclination of 97.4 degrees, a local time of 14:00 at the descending node, and a sun-synchronous circular orbit [3].
The electromagnetic field observations in this work were detected by three payloads onboard the CSES-01. The background geomagnetic field is measured by the high-precision magnetometer (HPM), which includes two fluxgate sensors [13] and a coupled dark-state magnetometer [14], providing both vector and scalar values of the total geomagnetic field at a frequency range from 0 Hz to 15 Hz. The magnetic field is detected by a tri-axial search coil magnetometer (SCM) in the frequency range from a few Hz to 20 kHz [15]. The sampling rate of the SCM at the ELF frequency (200 Hz to 2.2 kHz) is 10.24 kHz, and the frequency resolution is 2.5 Hz. The spatial electric field in the frequency band from 0 Hz to 3.5 MHz is measured by an electric field detector (EFD) [16]. An EFD measures electric field fluctuations across a wide frequency range of 0 Hz to 3.5 MHz. It is divided into four channels: ULF (0 Hz–16 Hz), ELF (6 Hz–2.2 kHz), VLF (1.8 kHz–20 kHz), and HF (18 kHz–3.5 MHz). Each channel has a different sampling rate, with rates of 125 Hz, 5 kHz, 50 kHz, and 10 MHz, respectively.
There are two operational modes for payload operation: survey mode and burst mode. The survey mode operates throughout the entire orbit with a downlink of lower-sampling-rate data, whereas the burst mode is triggered exclusively above the global main seismic belts, with a higher-sampling-rate downlink [12].
Zhima et al. cross-calibrated the consistency of HPM, SCM, and EFD in their overlapped detection frequency range and first evaluated the timing system of the satellite. They found a stable discrepancy in the sampling time differences between EFD and SCM, and then proposed a high-precision synchronization method for the ELF band [17]. Yang DH et al. confirmed the stability of EFD and SCM after analyzing the sampling time difference in the VLF band between EFD and SCM based on three years of operation and put forward a precise synchronization method for the VLF burst-mode waveform data [18]. Hu et al. validated the wave propagation parameters for the same types of waves based on the electromagnetic field observations from the CSES-01 and DEMETER and confirmed the good performance of EFD and SCM onboard the CSES-01 [19]. Yang YY et al. validated the HPM data by comparing the Swarm and CHAOS model and ground observatories, and the potential artificial disturbances from the platform and payloads were labeled as data quality flags in the standard Level 2 scientific data [20]. Further, Yang YY et al. rechecked each year’s HPM data, improved the data quality by removing seasonal effects, prolonged the updating period of all calibration parameters from daily to 10 days, and optimized the routine HPM data processing efficiency [21].
2.2. Identification and Characteristics of QP Emissions
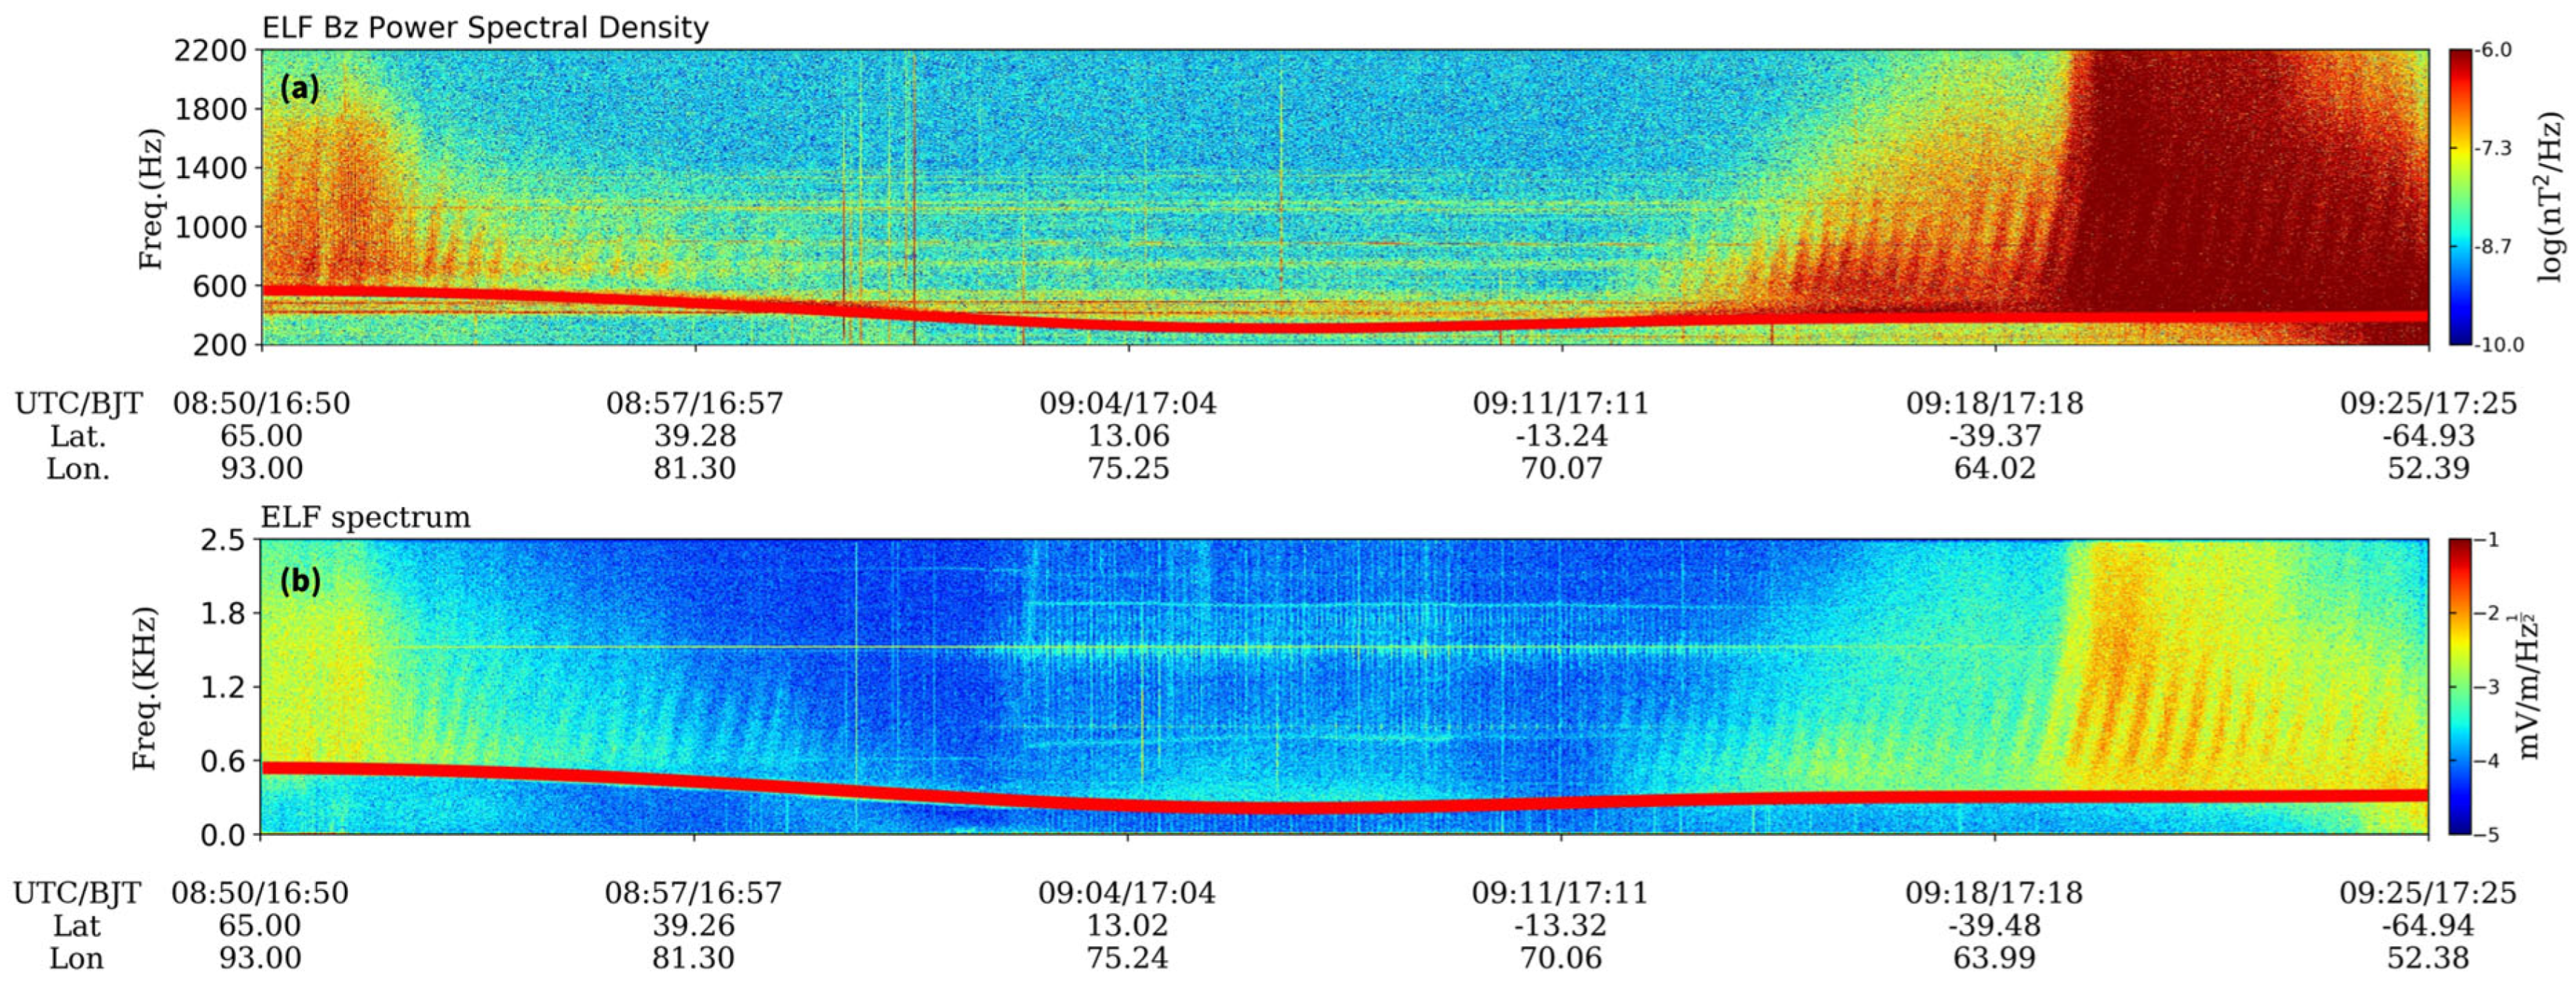
Figure 1 shows one example event of a QP wave recorded by the CSES-01, by presenting the power spectral density (PSD) values of the magnetic field (Figure 1a) and the electric field (Figure 1b), respectively. It is seen that the frequency of this QP event varied from the fcp to approximately 1.8 kHz. The intensity of the QP structure gradually decreased from high to low latitudes, but the modulation period remained relatively stable. The discrete spectral lines are visible, but the period between two neighboring wave elements is not fixed and slightly varies. The red line is the local proton gyrofrequency frequency fcp, which is computed by the following equation:
where q is the proton charge, m is the mass of the proton, and B is the total geomagnetic field data, which were provided from the HPM onboard the CSES-01.
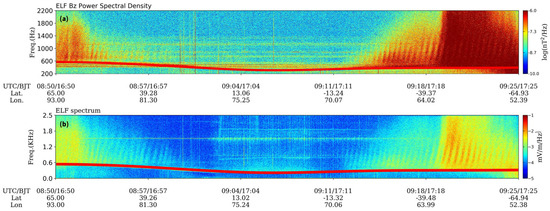
Figure 1.
An example of a QP wave event recorded by the CSES-01 on 6 January 2019, from 08:50 to 9:25 UTC, presented via the PSD values of the magnetic field (a) and electric field (b). The proton cyclotron frequency is represented by the red lines.
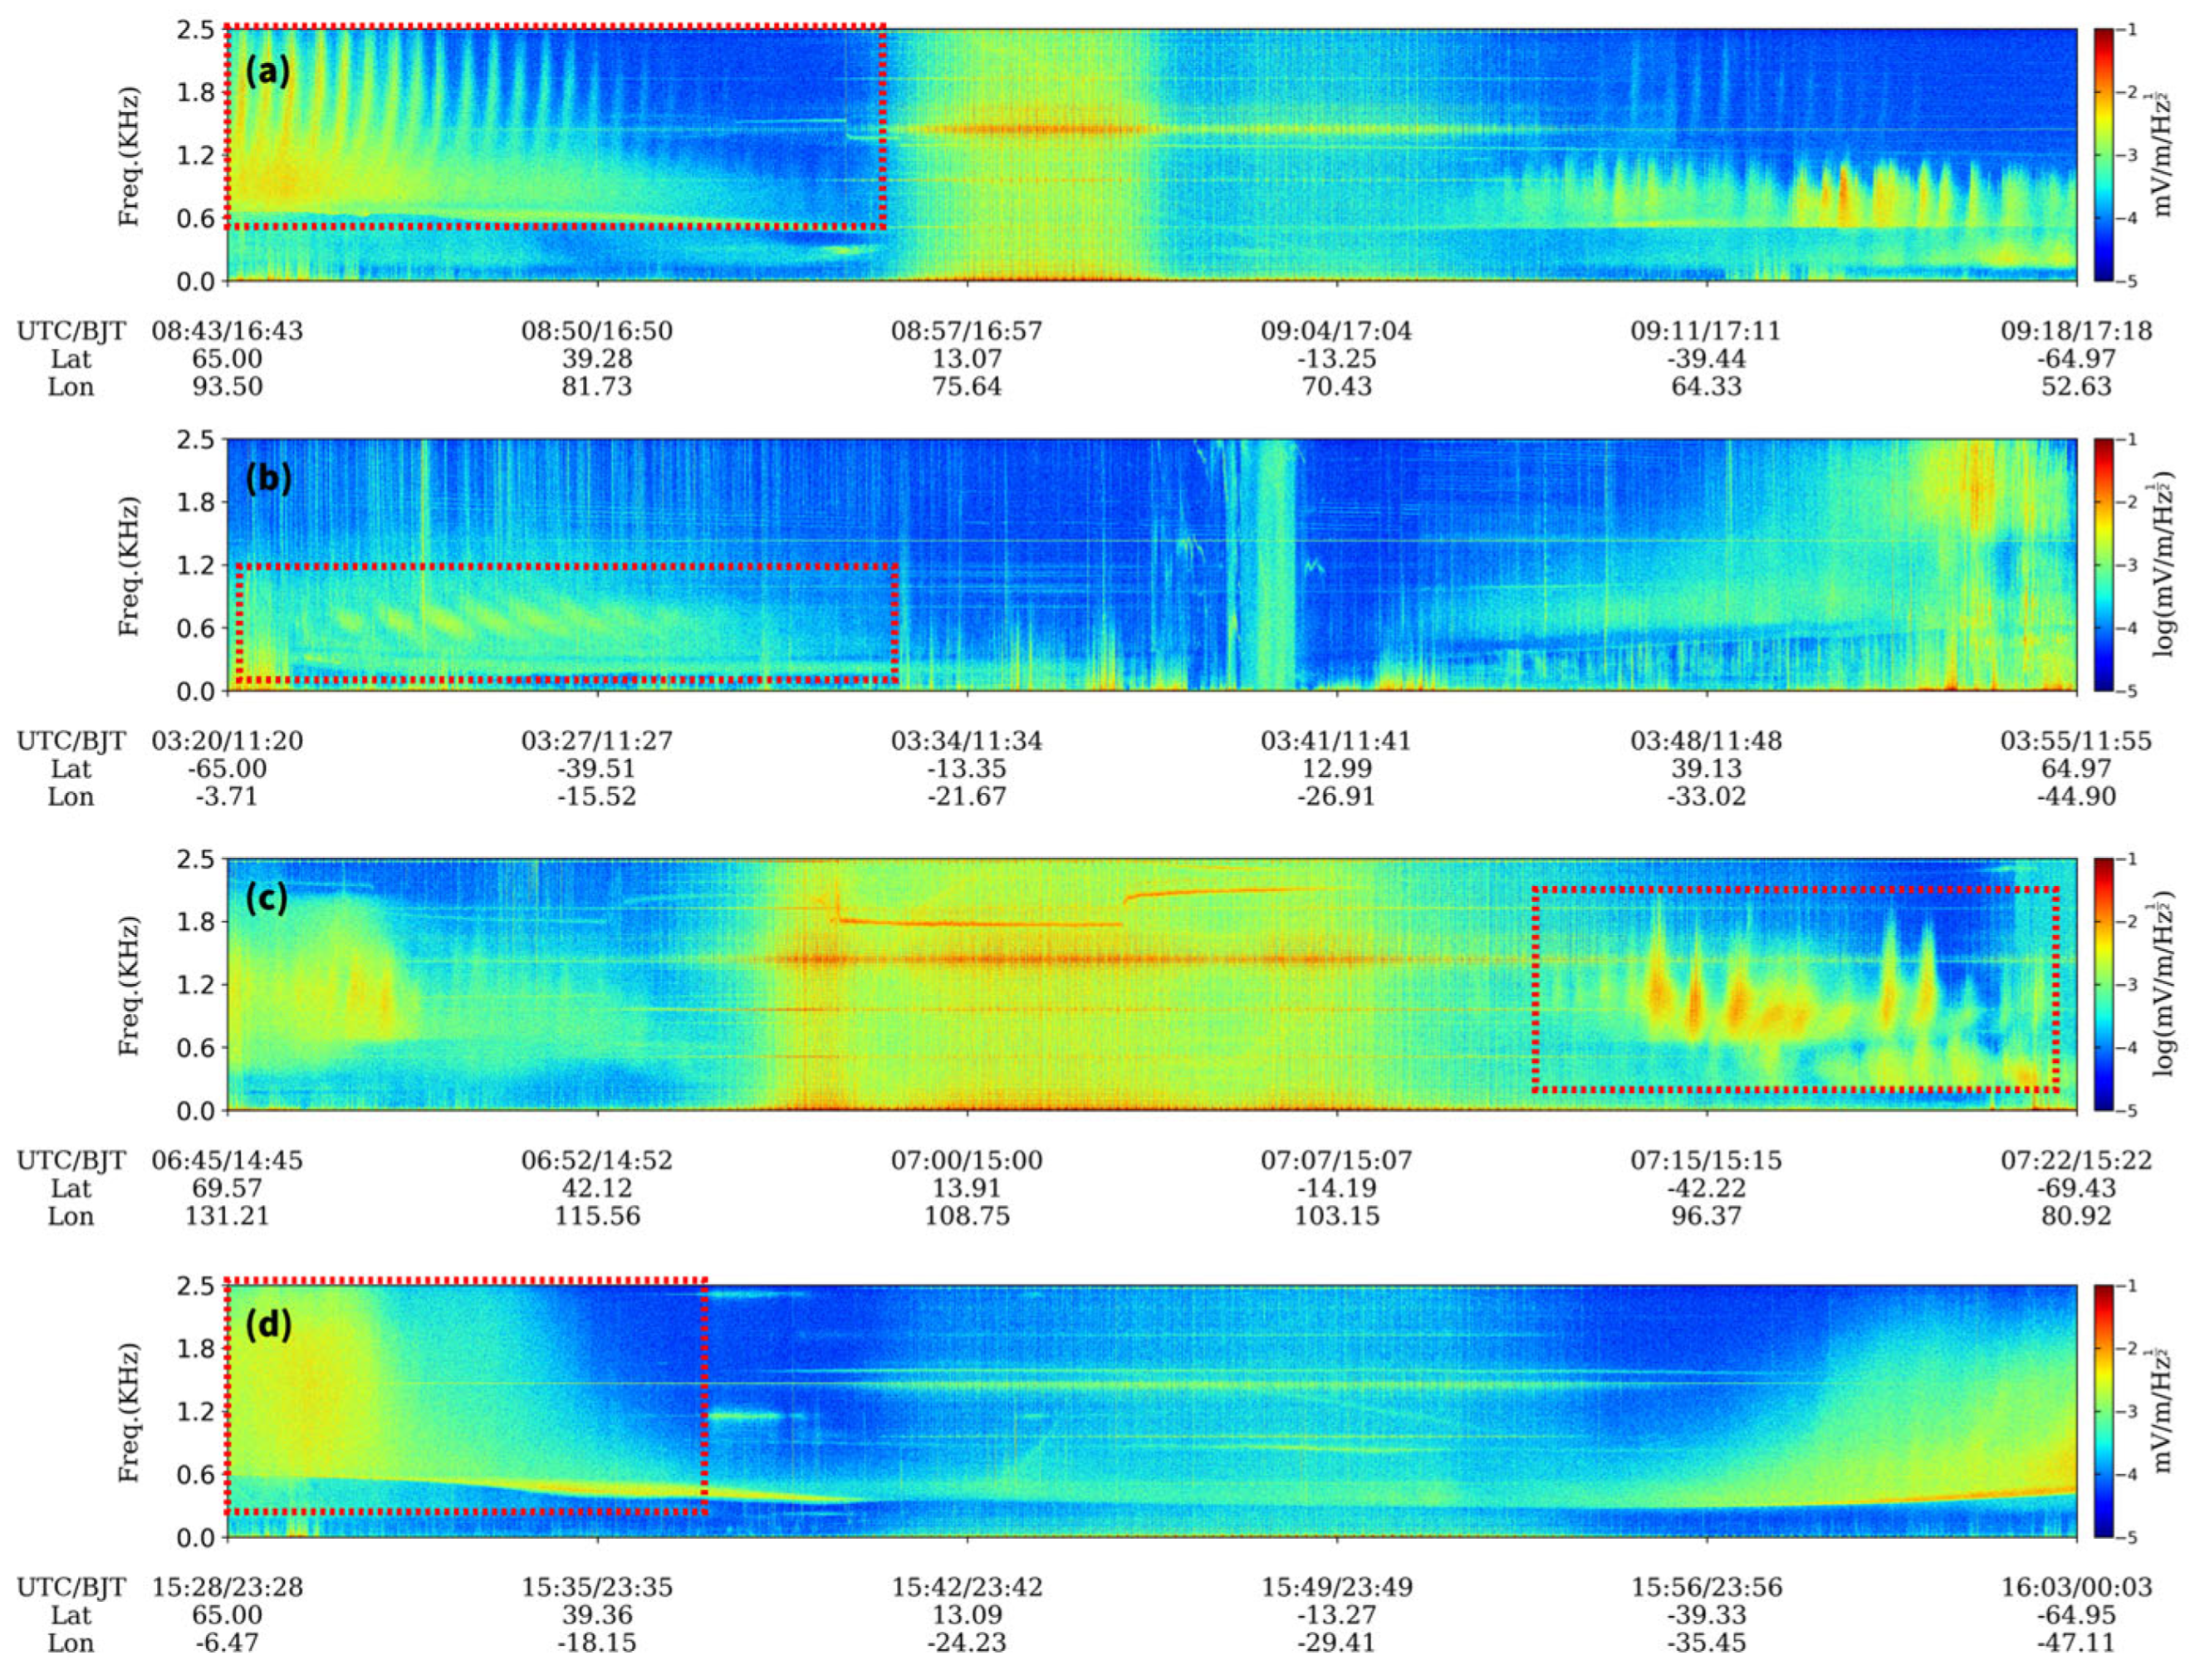
The QP emissions can be classified into five different types based on their morphological characteristics in the spectrogram: the rising tone type (see Figure 2a), falling tone type (see Figure 2b), burst type (see Figure 2c), non-dispersive type (see Figure 2d), and hybrid type (mixture of rising and falling types) [22].
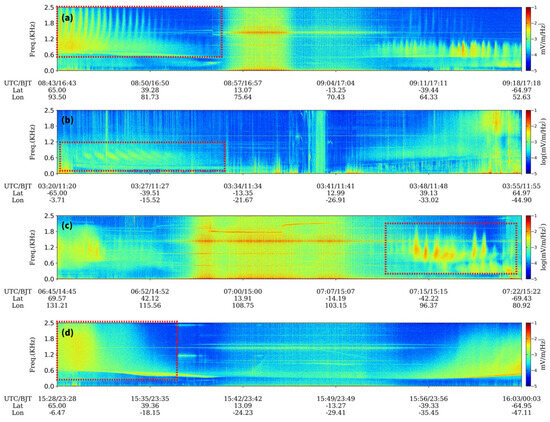
Figure 2.
The different types of QP waves recorded by the CSES-01 in the ionosphere; (a) rising tone type, (b) falling tone type, (c) burst type, (d) non-dispersive type.
The rising tone type is the most commonly observed, and the slope of each wave package increases with time, illustrating a short arc pattern. The falling tone type is the opposite of the rising tone, and the slope of each QP element decreases with time. The hybrid type presents both rising and falling tone structures. The burst type is composed of elements with a strong burst of discrete emission and a weak diffuse emission. There will be a clear split in this type of element. The non-dispersive type has no clear distinction between the QP elements, its intensity gradually decreases from higher to lower latitudes, and the intensity decreases gradually from the cut-off frequency to the maximum frequency. For most QP emissions of all types, with decreasing latitude, the bandwidth of QP emissions decreases, with a more pronounced decrease at the maximum frequency and a less pronounced decrease at the cut-off frequency.
Considering that the observations from EFD are more prominent than those from SCM, this study specifically focuses on the utilization of EFD data. Firstly, we plotted the spectral image (PSD value) of the electric field in the ELF frequency range for each set of orbit data spanning a period of five years from January 2019 to May 2023. Secondly, we used the manual detection method to identify the QP wave phenomena in the ELF frequency range; a total of 1765 orbits’ data containing QP waves were selected from the extensive dataset.
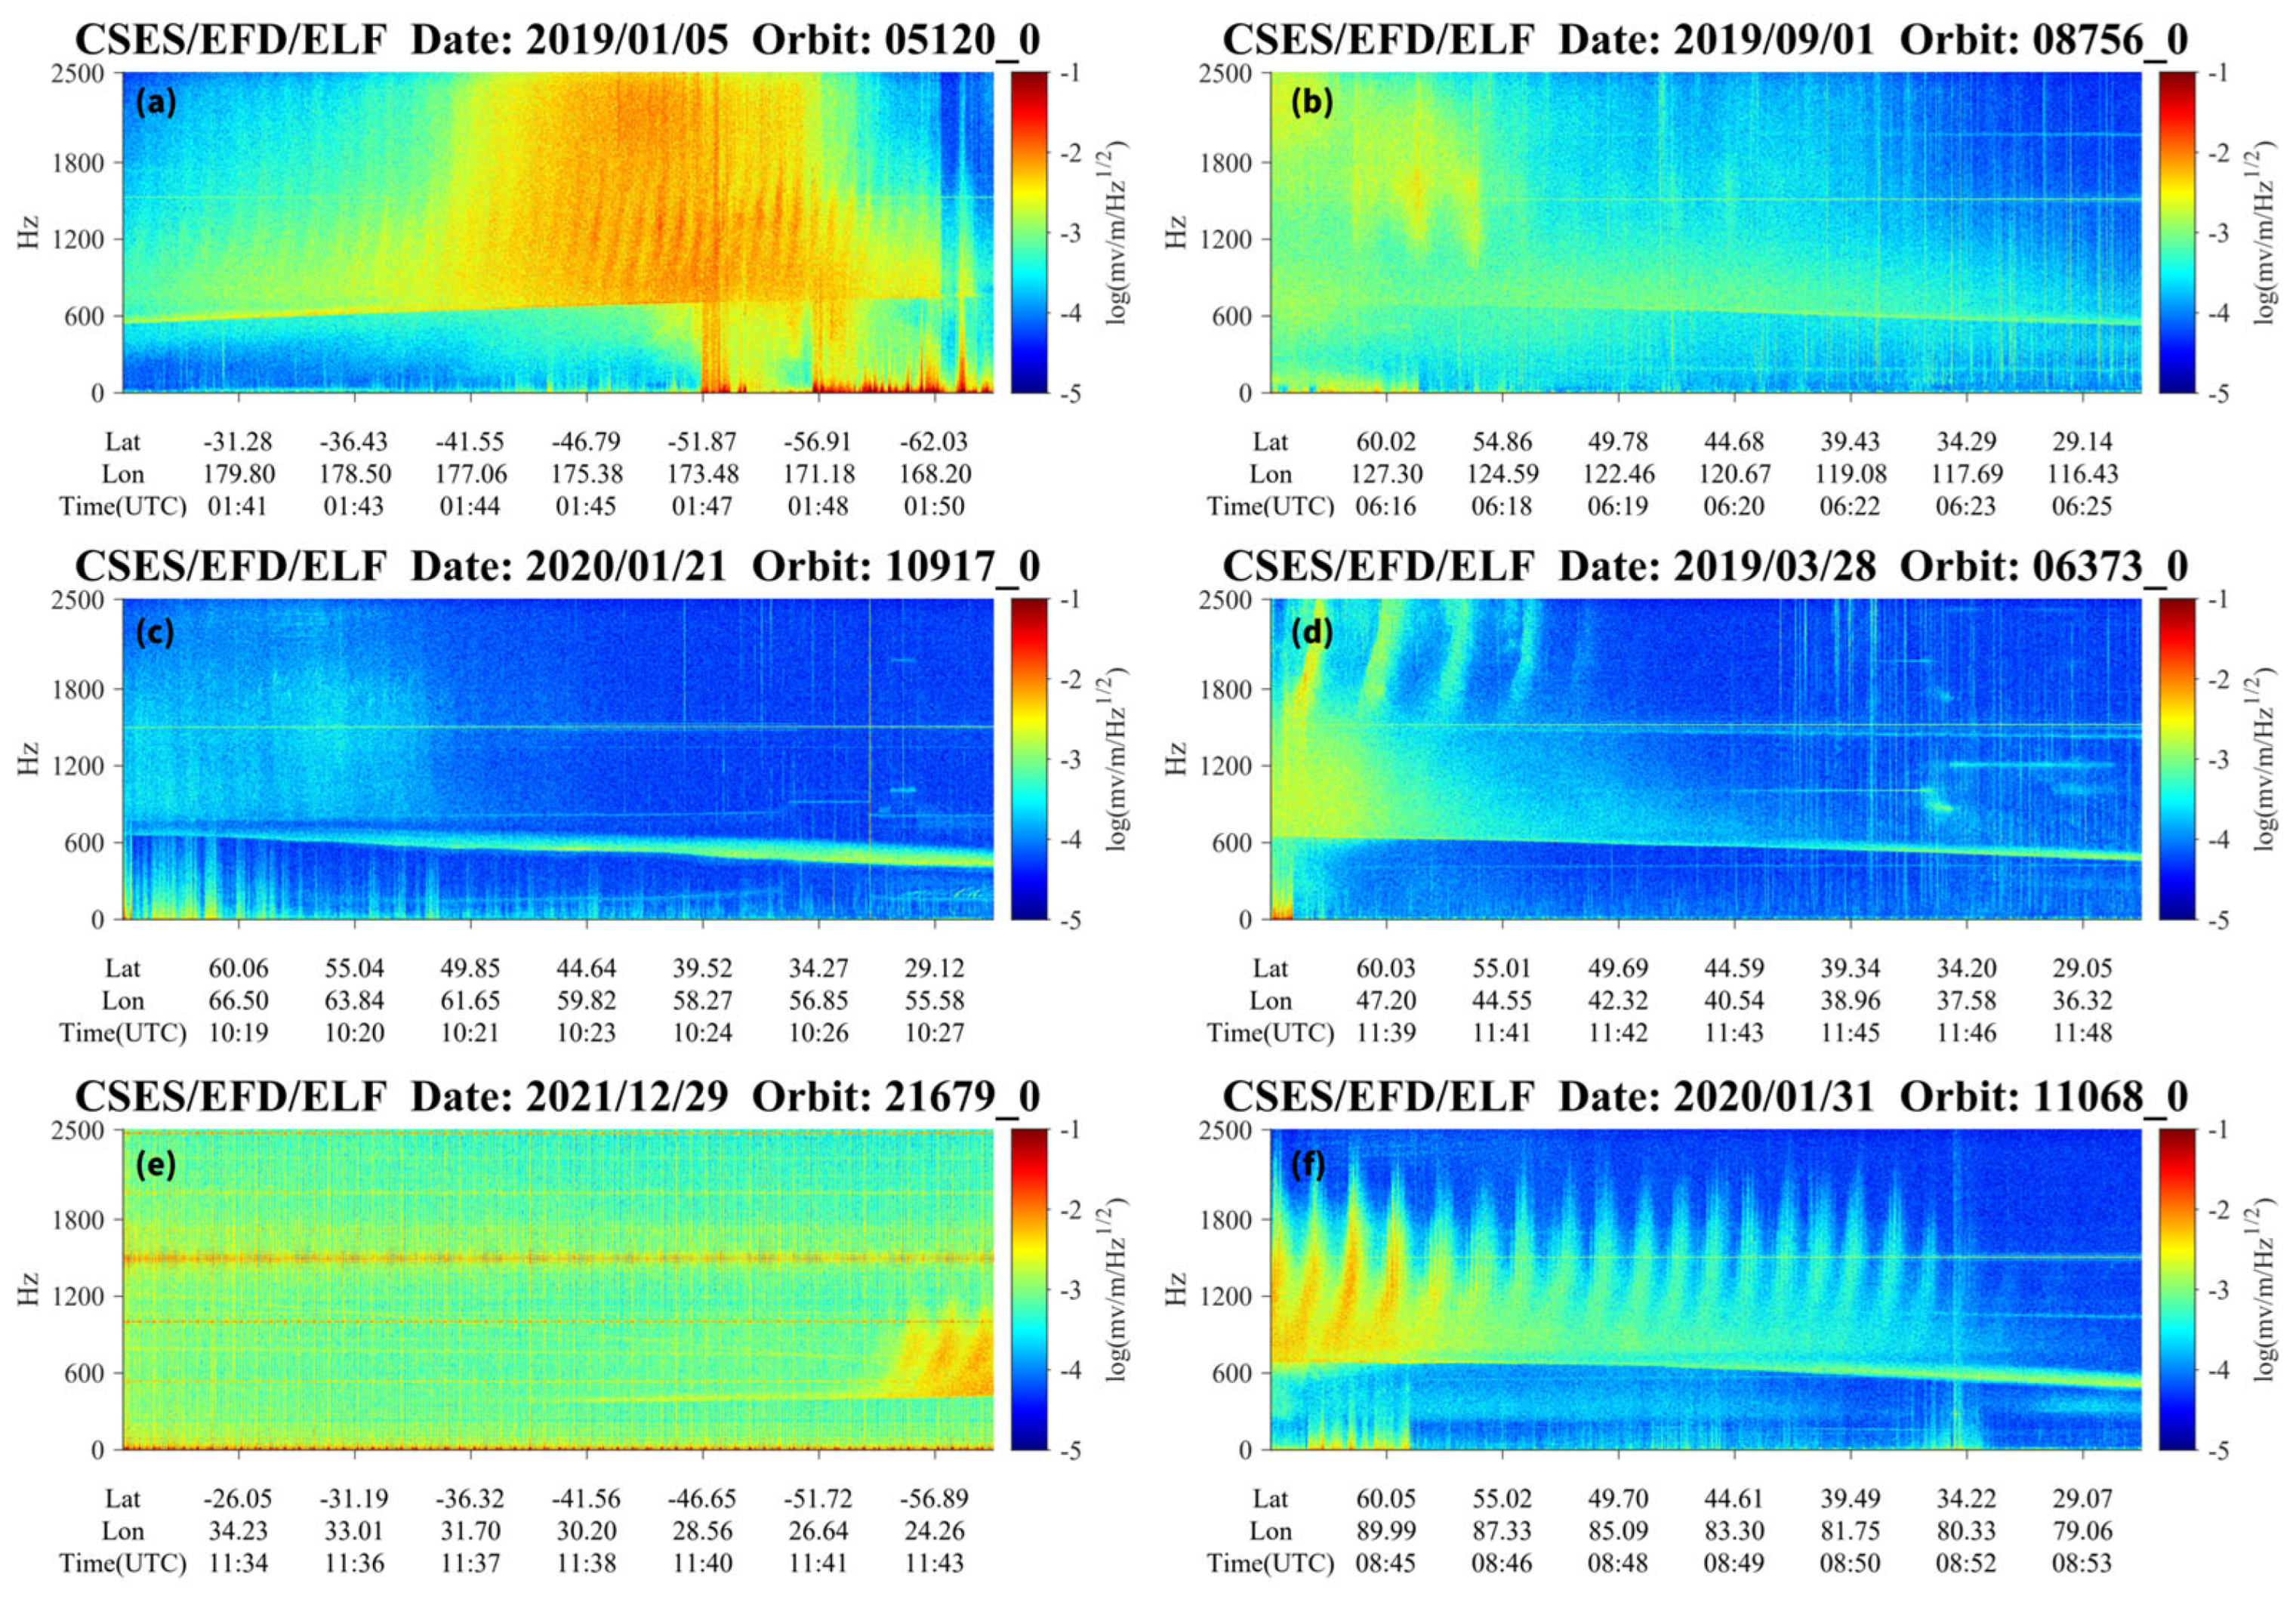
In the analysis of the 1765 QP events, we found that QP events predominately appeared within the latitude ranges of −69° to −28° and 28° to 69° and preferably occurred during the main and recovery phases of the storm, which is consistent with the statistical analysis of Hayosh et al. based on long-term observations from the DETMETER satellite [23]. In in the equatorial region, electric field observation is heavily interfered with by artificial noise from EFD or the satellite internal communication design [17]. Thus, to avoid the high noise and to obtain reliable QP data, we mainly truncated the orbit data within the latitude ranges of −69° to −28° and 28° to 69° to build a dataset for training (see Figure 3). In total, we obtained approximately 3000 QP data samples. However, due to the intricate morphology of the QP waves, direct training on all samples yielded poor accuracy (around 20%). After the meticulous screening of 3000 samples, we selected 827 images depicting various features indicative of QP phenomena. These 827 samples were manually annotated and served as the dataset for the object detection framework.
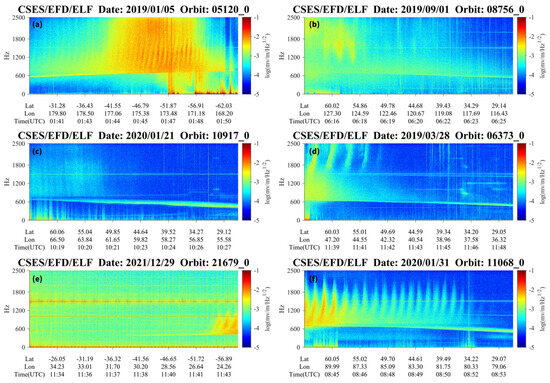
Figure 3.
The data were truncated to the latitude ranges of −69° to −28° and 28° to 69° to obtain reliable QP data by avoiding noise from EFD in the equatorial area. (a) A strong rising tone QP event observed in the southern hemisphere. (b) A weaker falling tone QP event observed in the northern hemisphere. (c) A very weak falling tone QP event observed in the northern hemisphere. (d) A QP event with both rising tone and non-dispersive types occurring simultaneously in the northern hemisphere. (e) A short-duration rising tone QP event under noise interference observed in the southern hemisphere. (f) A very prominent rising tone QP event observed in the northern hemisphere.
3. Automatic Detection Method Development
This section outlines the development of the automatic detection method, including the architectural design of the proposed QP-DETR model, modifications to the backbone network using EfficientNetV2, the addition of the Efficient Channel Attention (ECA) module, and improvements to the deformable attention mechanism. Each subsection provides detailed explanations of the components and enhancements implemented to improve the model’s performance and efficiency.
3.1. QP-DETR Design
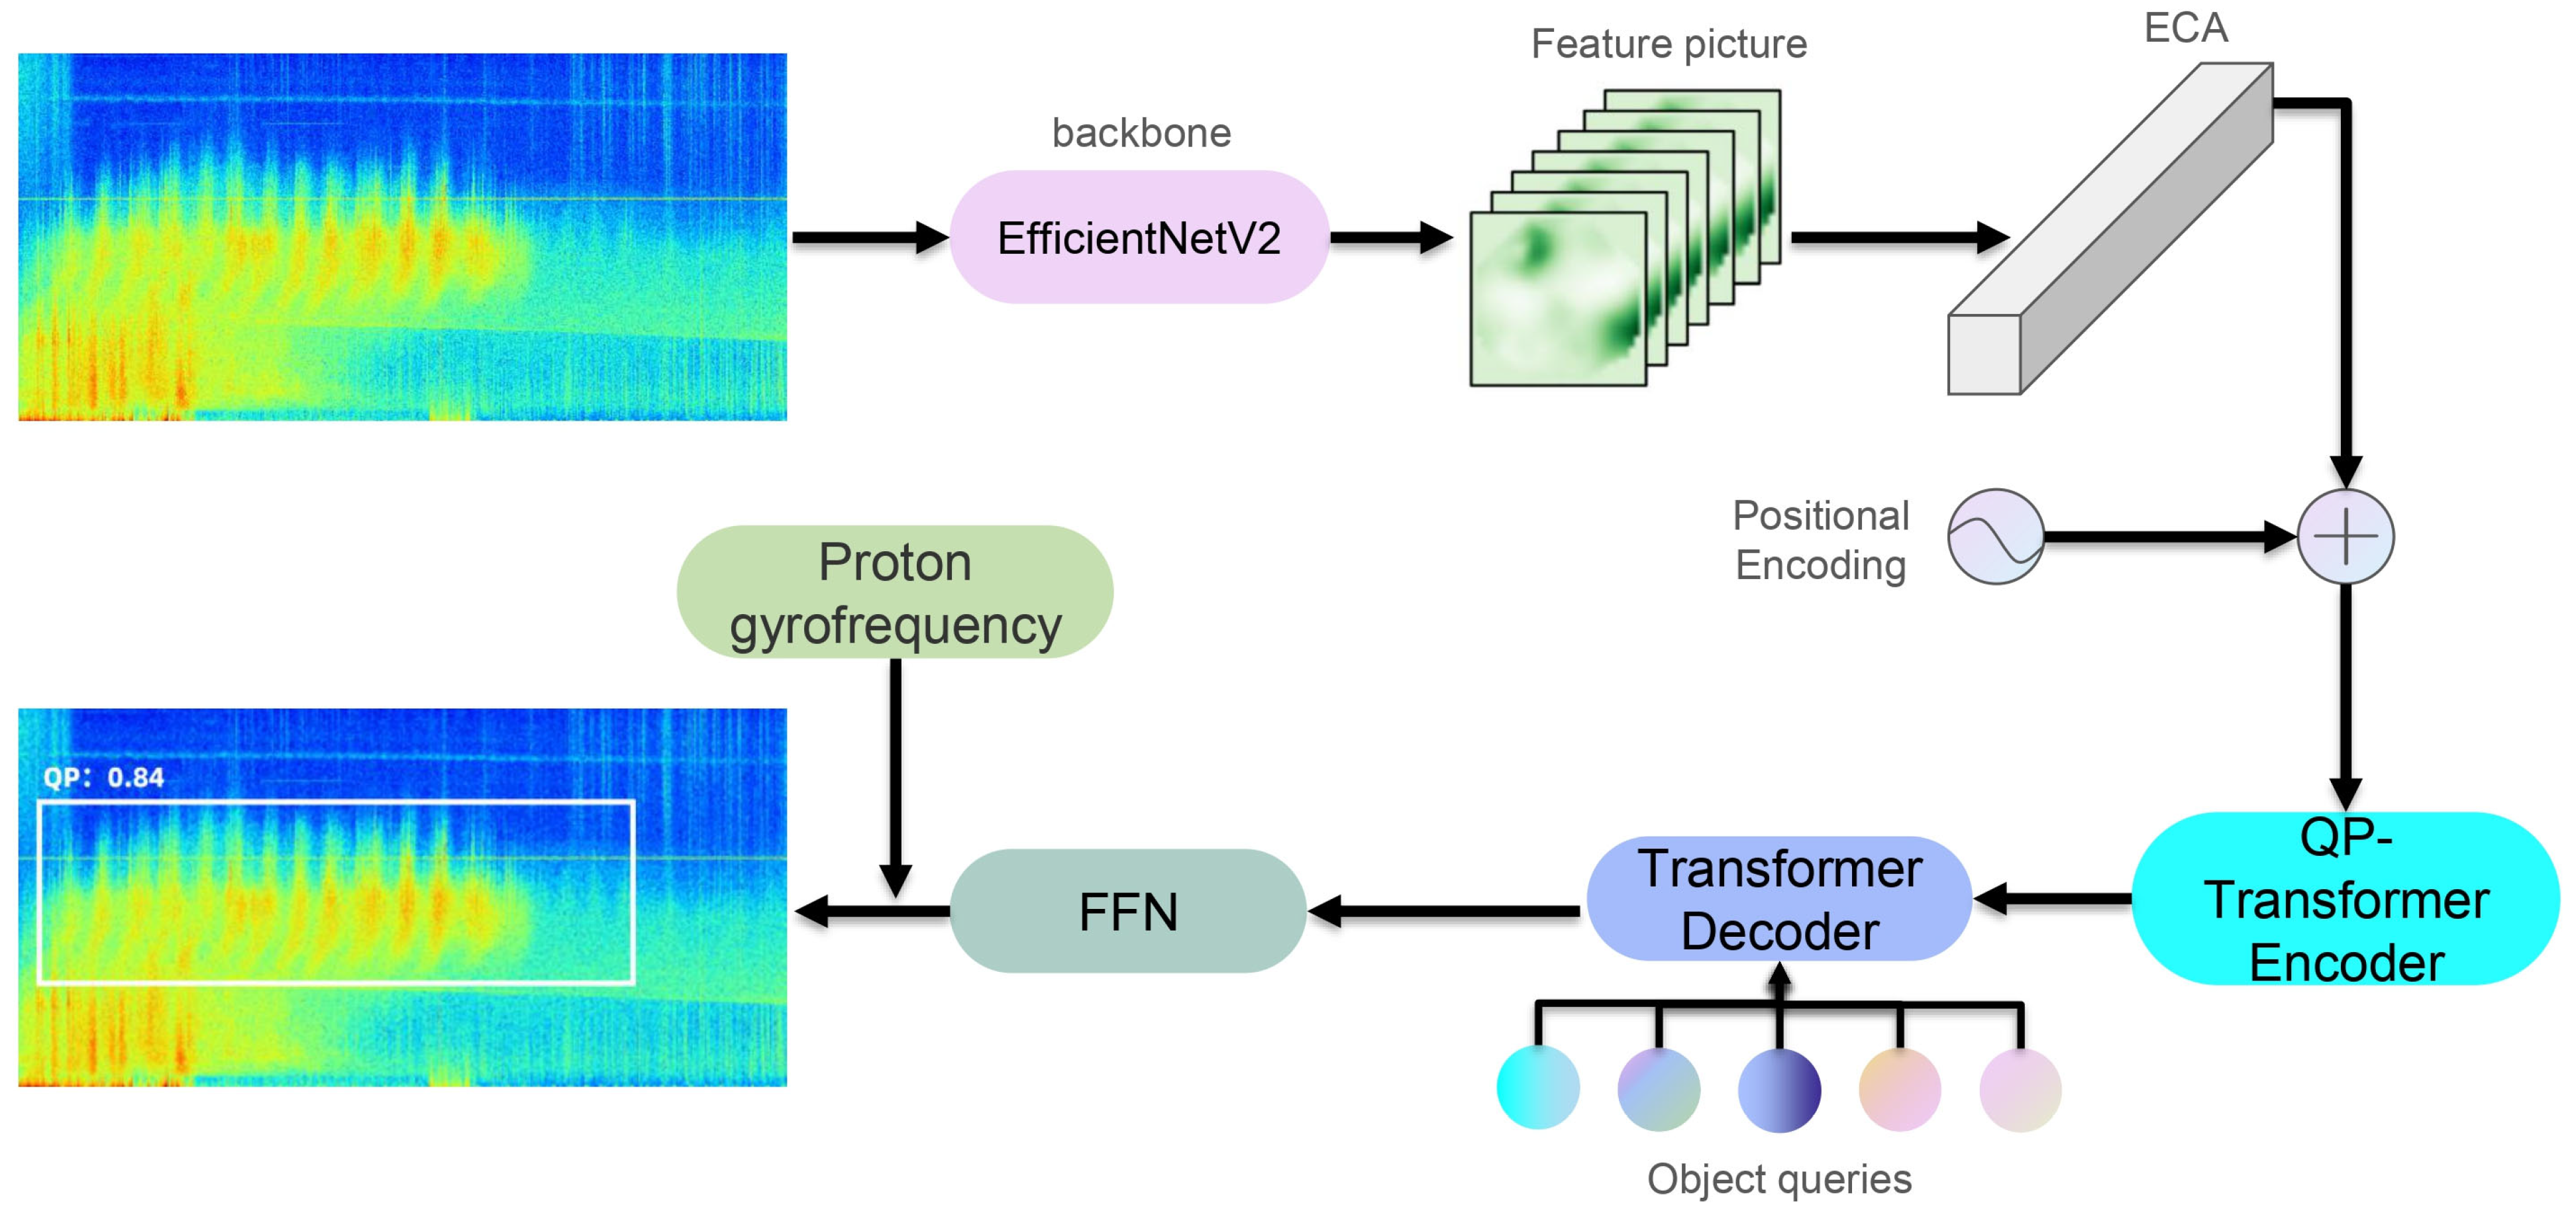
Figure 4 illustrates the detailed architecture of our proposed automatic detection model using DETR, called QP-DETR. One of the key features of DETR is the Transformer attention mechanism, which enables the neural network to extract important information from the input images. Through the attention mechanism, the network dynamically adjusts the weights, assigning higher weights to significant signals (i.e., the target) and lower weights to other signals within the input data. In essence, the attention mechanism mimics the human brain by automatically focusing on the most salient and relevant pixels in the image, with the specific saliency depending on the application [10]. DETR differs from prior target detection algorithms in that it achieves full end-to-end target detection without the need for a non-maximum suppression (NMS) post-processing step or prior knowledge and constraints such as anchor boxes [11].
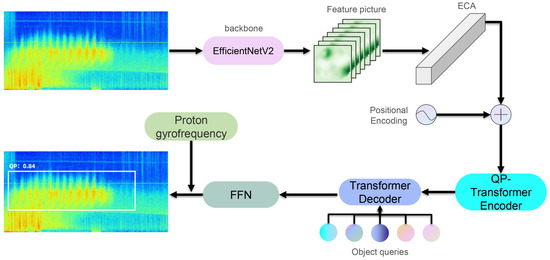
Figure 4.
A comprehensive diagram illustrating the structure of the QP-DETR model. Following the diagram from the top left to the bottom left, the entire flow from the input image to the output of the detection results is depicted. The model incorporates the ECA mechanism. A detailed explanation of the ECA is provided in Section 3.3.
The network architecture of DETR is remarkably straightforward and comprises four main components: a backbone for the extraction of image features, a Transformer-based encoder, a decoder, and a prediction module. In the backbone, a traditional convolutional neural network (CNN) is employed to extract features. Following a 1 × 1 convolution, the channel is downscaled. Together with the positional encoding of the image, these image features are input into the Transformer-based encoder to generate candidate features. The decoder then decodes both the candidate features and the object query independently. Finally, box coordinates and class labels are obtained through a fully connected layer to formulate the final prediction.
The encoder in the Transformer model primarily consists of two components: self-attention and a feed-forward neural network (FFN). The decoder is composed of a multi-headed self-attention mechanism and an encoder–decoder attention mechanism. This process allows the model to capture the relationships between different positions within the input sequence and assign appropriate weights to the feature representations.
After obtaining the weighted feature vector Z through the self-attention mechanism in the encoder, it is passed to the FFN module. This module primarily consists of two layers: an activation function, namely a Rectified Linear Unit (ReLU) layer, and a linear activation function, as depicted in Equation (2).
In Equation (2), and , respectively, represent the weight parameters of the activation function. On the other hand, and denote the bias parameters of the linear activation function.
In the decoder structure, the input is decoded in parallel using X decoder blocks. The input is augmented with positional encoding, which is based on the sine function, to provide information about the positions of the tokens in the sequence. After incorporating positional encoding, the input is passed through the decoder block, which consists of self-attention and FFN layers. The output from the decoder block is then transformed into the final output.
3.2. The Backbone Network Is Modified with EfficientNetV2
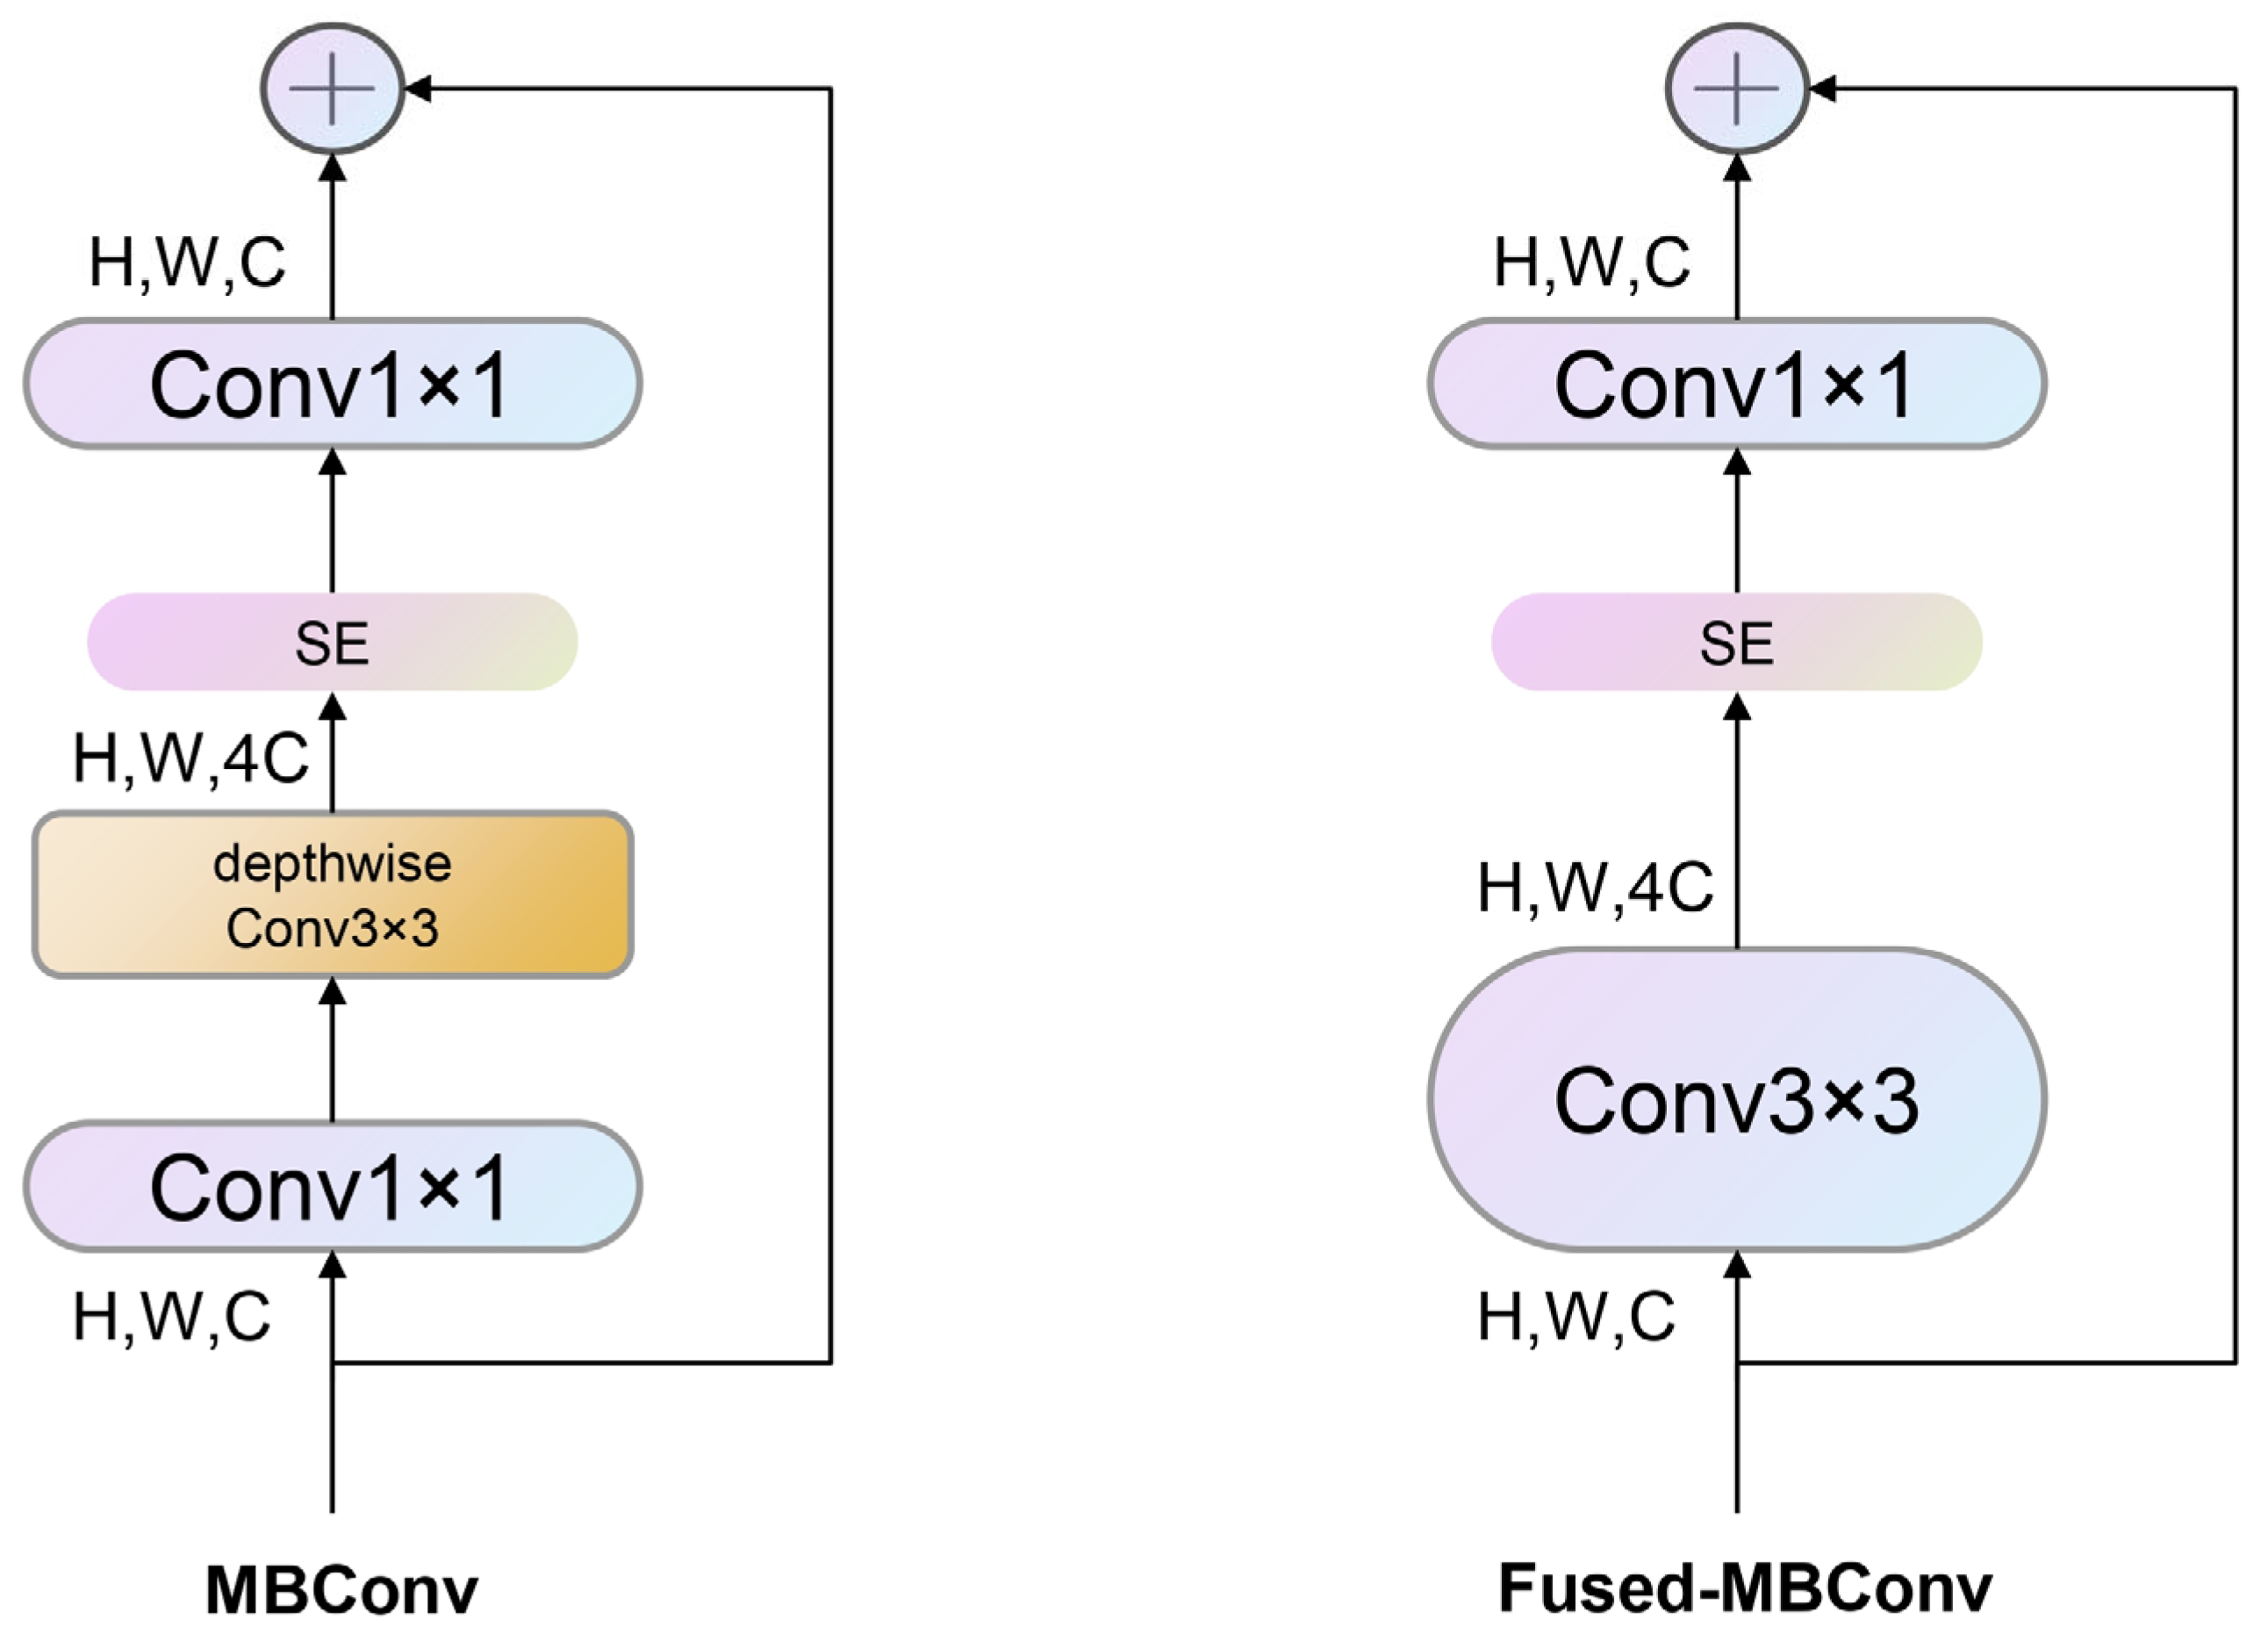
With the advancements in research on CNNs, the evaluation criteria for a good model have shifted beyond just stacking network layers to improve the accuracy. The ability to achieve satisfactory results with fewer parameters and faster training speeds has become equally important. EfficientNet is a lightweight network structure that addresses these concerns [24]. EfficientNetV2 is an enhanced network built upon the fundamental concept of EfficientNet. Tan et al. modified the depth, width, and input image resolution parameters, and the network achieved improved performance [25]. This classification recognition network utilizes a neural architecture search (NAS) and a composite model expansion method to select the optimal composite coefficients that proportionally scale the network’s depth, width, and input image resolution. These adjustments are made to obtain optimal parameters that maximize the recognition feature accuracy. EfficientNetV2 effectively reduces the number of parameters and the complexity of model training by dynamically balancing these three dimensions and delivers a noticeable improvement in the inference speed. The EffcientNetV2 network primarily consists of Mobile Inverted Bottleneck Convolution (MBConv) and Fused-MBConv modules (see Figure 5) stacked together, and its specific structure is detailed in Table 1.
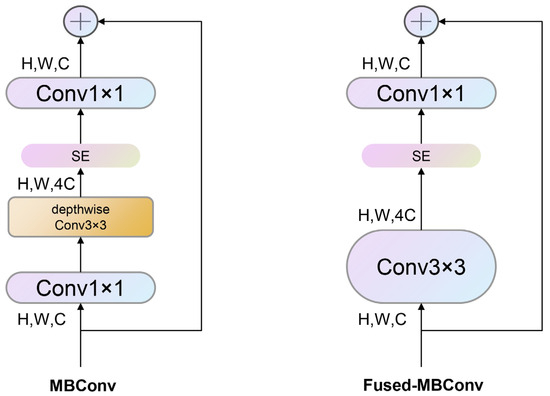
Figure 5.
Structure of MBConv and Fused-MBConv. The MBConv block and the Fused-MBConv block are used in stages 4, 5, and 6 and in stages 1, 2, and 3, respectively; see Table 1.

Table 1.
EfficientNetV2 architecture—MBConv and Fused-MBConv blocks described in Figure 5.
To improve the computational speed of the network, the following module configurations are implemented for the processing of the data. The input images have a size of 1295 × 620 pixels with three channels, which undergo several transformations throughout the network.
Stages 1, 2, and 3 are carried out by the Fused-MBConv modules, as listed below.
Fused-MBConv Modules: These modules are used for faster computation. The Fused-MBConv modules replace the 1 × 1 expansion convolution structure in the MBConv modules with a standard 3 × 3 convolution structure. Additionally, they replace both the 1 × 1 expansion and 3 × 3 depthwise convolution with a regular 3 × 3 convolution structure. This configuration avoids the slowdown caused by depthwise convolution in shallow layers [25]. Specifically, the input image size and channel numbers change as follows.
Stage 1: Input size ~323 × 155 pixels, 3 channels -> 32 channels.
Stage 2: Input size ~161 × 78 pixels, 32 channels -> 64 channels.
Stage 3: Input size ~80 × 39 pixels, 64 channels -> 128 channels.
Stages 4, 5, and 6 are carried out by deep convolution, as listed below.
MBConv Modules: These modules consist of two 1 × 1 convolutions (input and output), a 3 × 3 depth-separable convolution, and a Squeeze-and-Excitation (SE) attention module [26]. The SE module enhances the feature extraction capability by modifying the weights of each channel, thereby increasing the attention towards the most important channels. The transformations in the deep layers are as follows.
Stage 4: Input size ~40 × 20 pixels, 128 channels -> 256 channels.
Stage 5: Input size ~20 × 10 pixels, 256 channels -> 512 channels.
Stage 6: Input size ~10 × 5 pixels, 512 channels -> 1024 channels.
Depthwise separable convolution, also called depthwise, employs a distinct convolutional kernel for every channel in the input feature map. These convolutional kernels’ outputs are subsequently concatenated to generate the final output. For a comprehensive explanation of depthwise separable convolution, see MobileNets [27].
By implementing these configurations, the network achieves a balance between computational efficiency and feature extraction capabilities, providing satisfactory results with fewer parameters and faster speeds.
3.3. Adding Efficient Channel Attention Module
The SE attention mechanism is a frequently employed channel attention mechanism that generates feature channel weights using a fully connected (FC) layer. However, the utilization of two non-linear FC layers unavoidably leads to a significant increase in parameters and computations, particularly when dealing with deep features containing numerous channels.
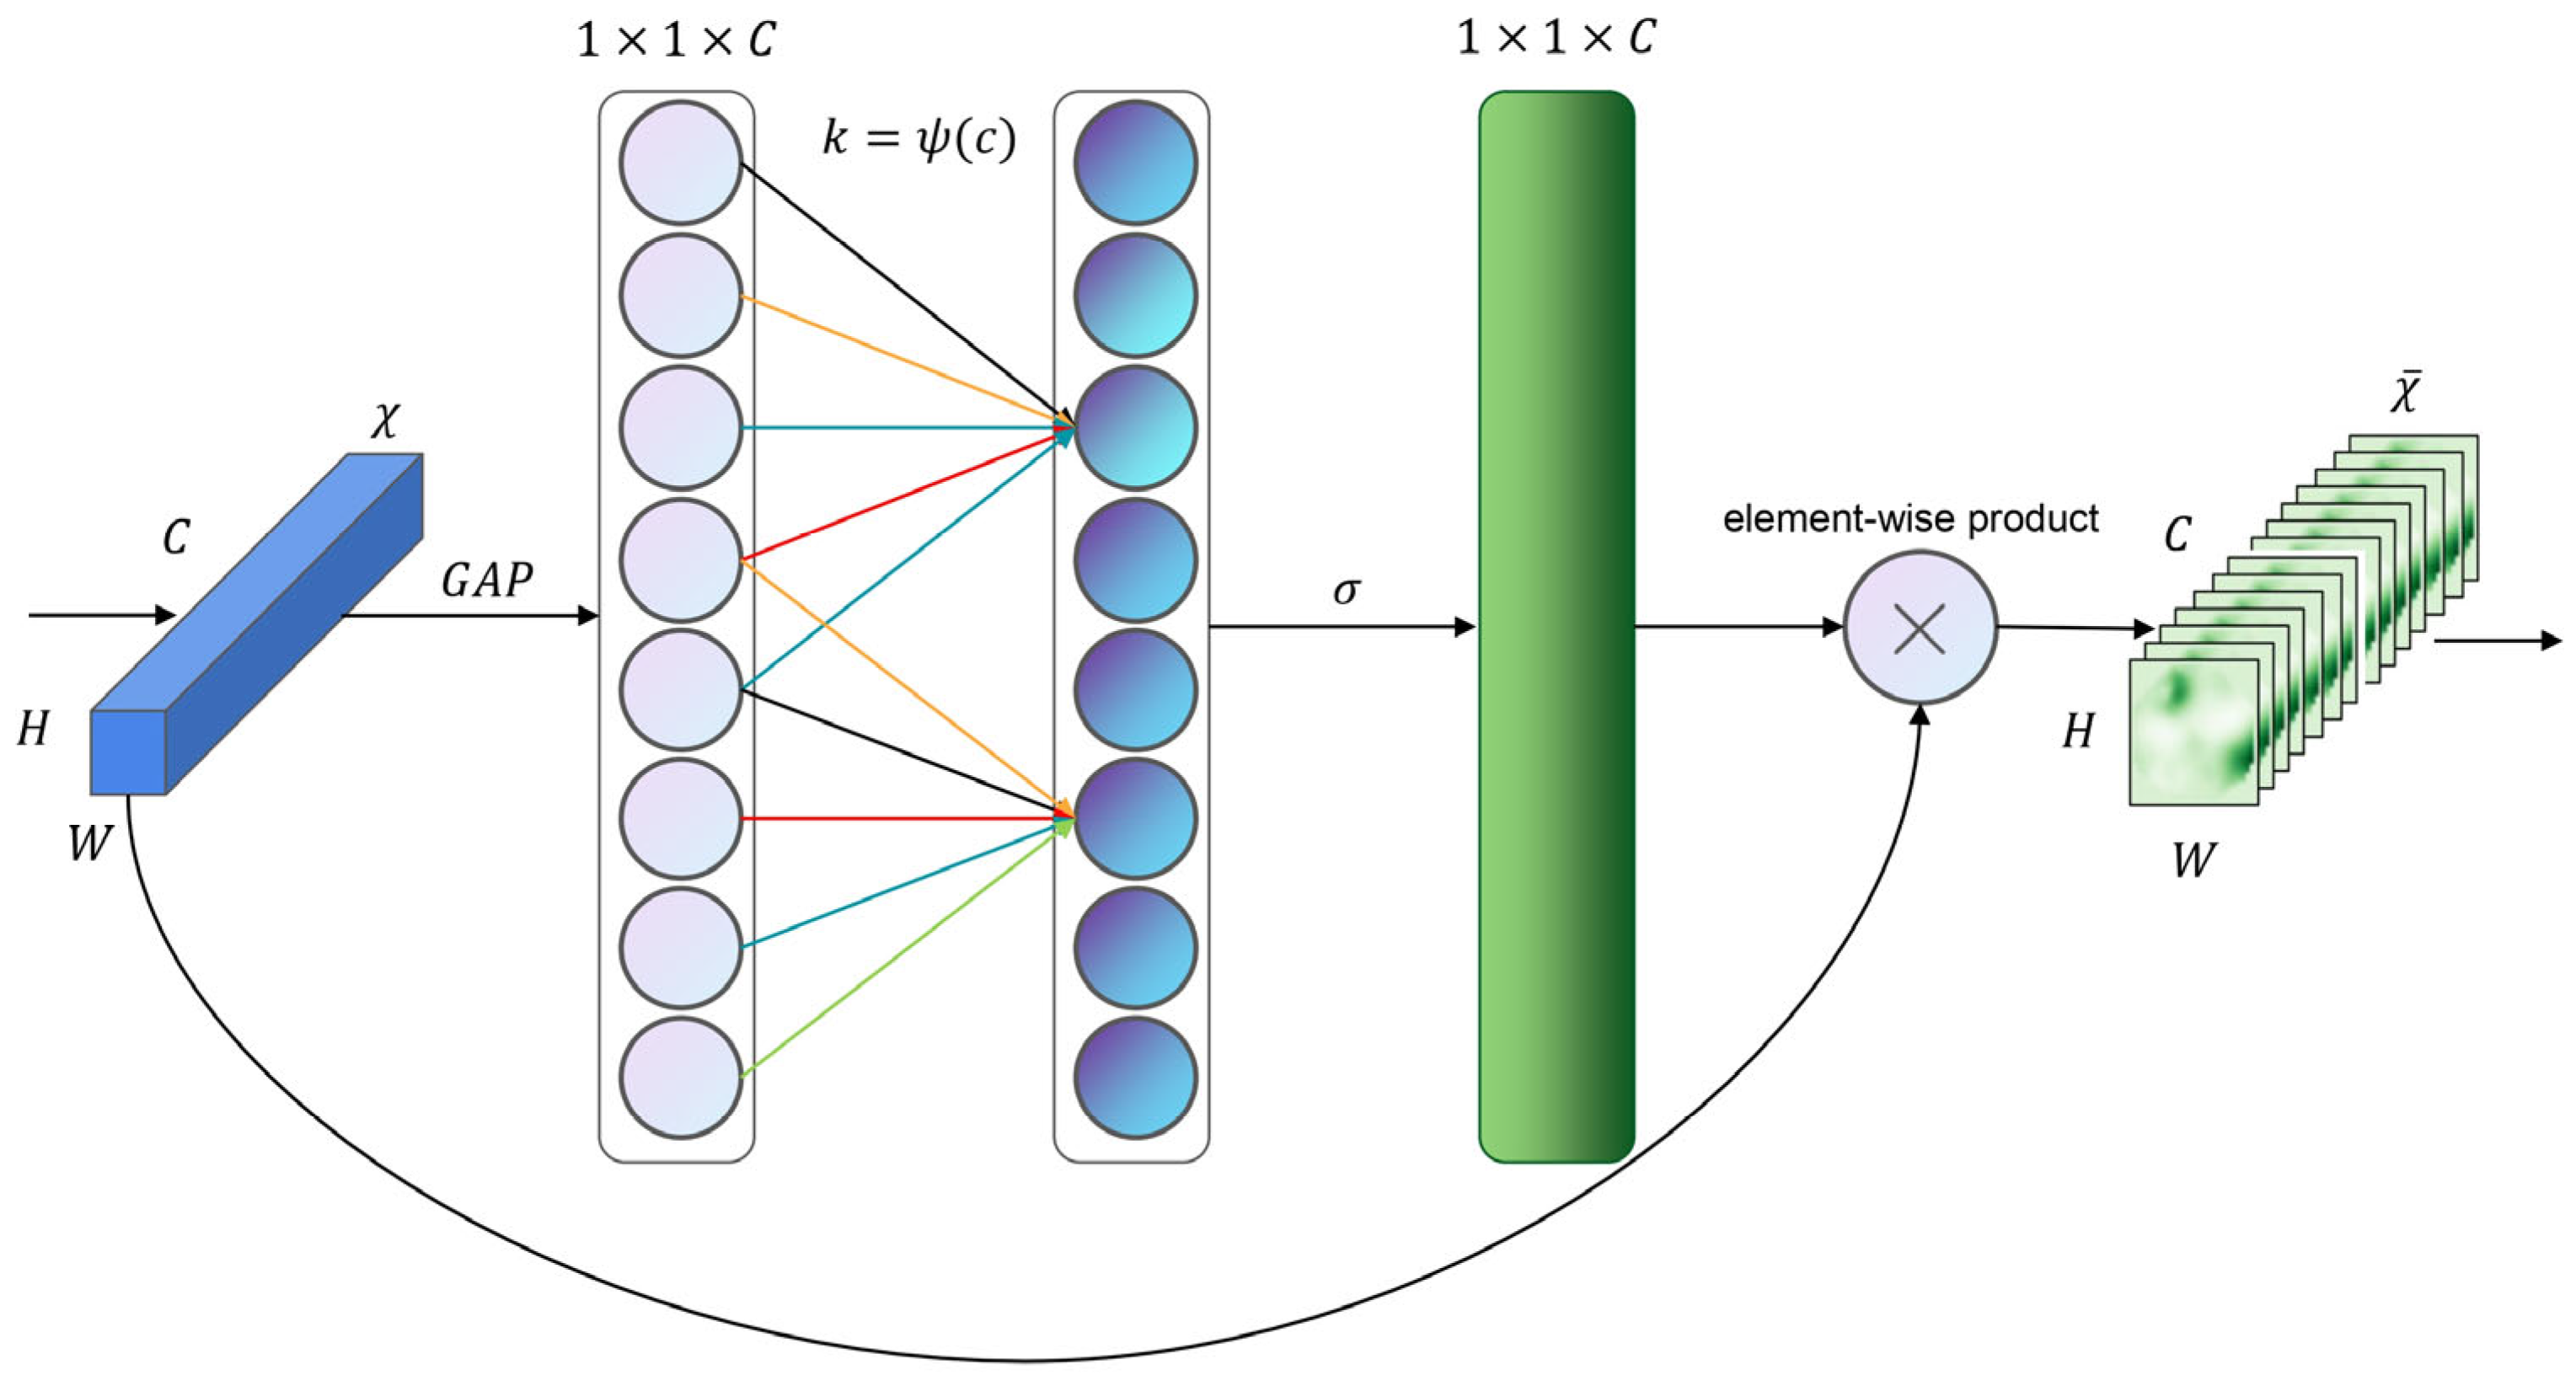
In recent years, some scholars have proposed lightweight attention mechanisms, such as the ECA mechanism [28] (see Figure 6). In this paper, the ECA attention mechanism is used to assign weights to the features of the QP events in the channel dimension, thereby enhancing the important texture features. The ECA attention mechanism offers a more efficient and streamlined implementation compared to SE. Instead of compressing and reducing the input feature image channels, it uses one-dimensional convolution to effectively perform local cross-channel interactions. Attention weights are then obtained by taking into account the dependencies between the image channels. As the input image passes through the network, the size and number of its channels change, resulting in the extraction of deep features. The ECA module is applied to these features to enhance the representation.
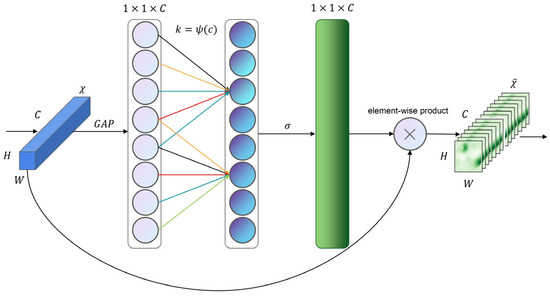
Figure 6.
Diagram of our ECA module. Given the aggregated features obtained by global average pooling (GAP), ECA generates channel weights by performing a fast 1D convolution of size k, where k is adaptively determined via a mapping of channel dimension C.
Figure 6 demonstrates the process of the ECA attention module. It begins by conducting a global average pooling operation on the input feature map with dimensions H × W × C. Subsequently, a 1D convolution operation is applied using a convolution kernel of size k. The value of the convolution kernel k is obtained as an adaptive function of the number of input channels C, as depicted in Equation (3), where denotes the closest odd number to x.
Following the convolution operation, the weights W for each channel are obtained through the application of the sigmoid activation function. To enhance the network’s performance, the convolution shared weights are employed, enabling the efficient capturing of local interaction channel information while reducing the number of network parameters. The shared weight method is illustrated in Equation (4).
In Equation (4), indicates the set of k adjacent channels of . represents the sigmoid activation operation. denotes the i-th weight matrix acquired through the grouping of the C channels. stands for the jth local weight matrix within the ith weight matrix. Additionally, is obtained using the same methodology.
Finally, the obtained weights are multiplied by the original input feature map, resulting in a feature map with attention weights. The ECA attention mechanism, serving as a plug-and-play module, employs simple ideas and operations compared to other attention mechanisms. It has minimal impact on the network processing speed while significantly enhancing the classification accuracy.
In our study, this enables our model to enhance the feature representation without significantly increasing the computational costs. The channel attention mechanism dynamically adjusts the weights of the channel features, enabling the model to better emphasize essential features. By doing so, the mechanism improves the discriminative ability of the features, consequently enhancing the overall performance of the model. Additionally, the capability to prioritize important features promotes better generalization, contributing to improved performance in diverse scenarios.
3.4. Improving Deformable Attention Mechanism
This architecture demonstrates high accuracy in detecting overlapping targets during target detection. To further enhance the spatial localization, the deformable convolution technique is utilized [29]. Deformable convolution provides an effective means of emphasizing sparse spatial localization. In deformable DETR, the optimal sparse spatial sampling method of deformable convolution is combined with the relational modeling capability of the Transformer [30]. This combination not only accelerates the convergence of DETR but also reduces the complexity of the problem. In light of these advancements, we introduce the deformable attention mechanism into our model, aiming to improve the performance and efficiency of the target detection task.
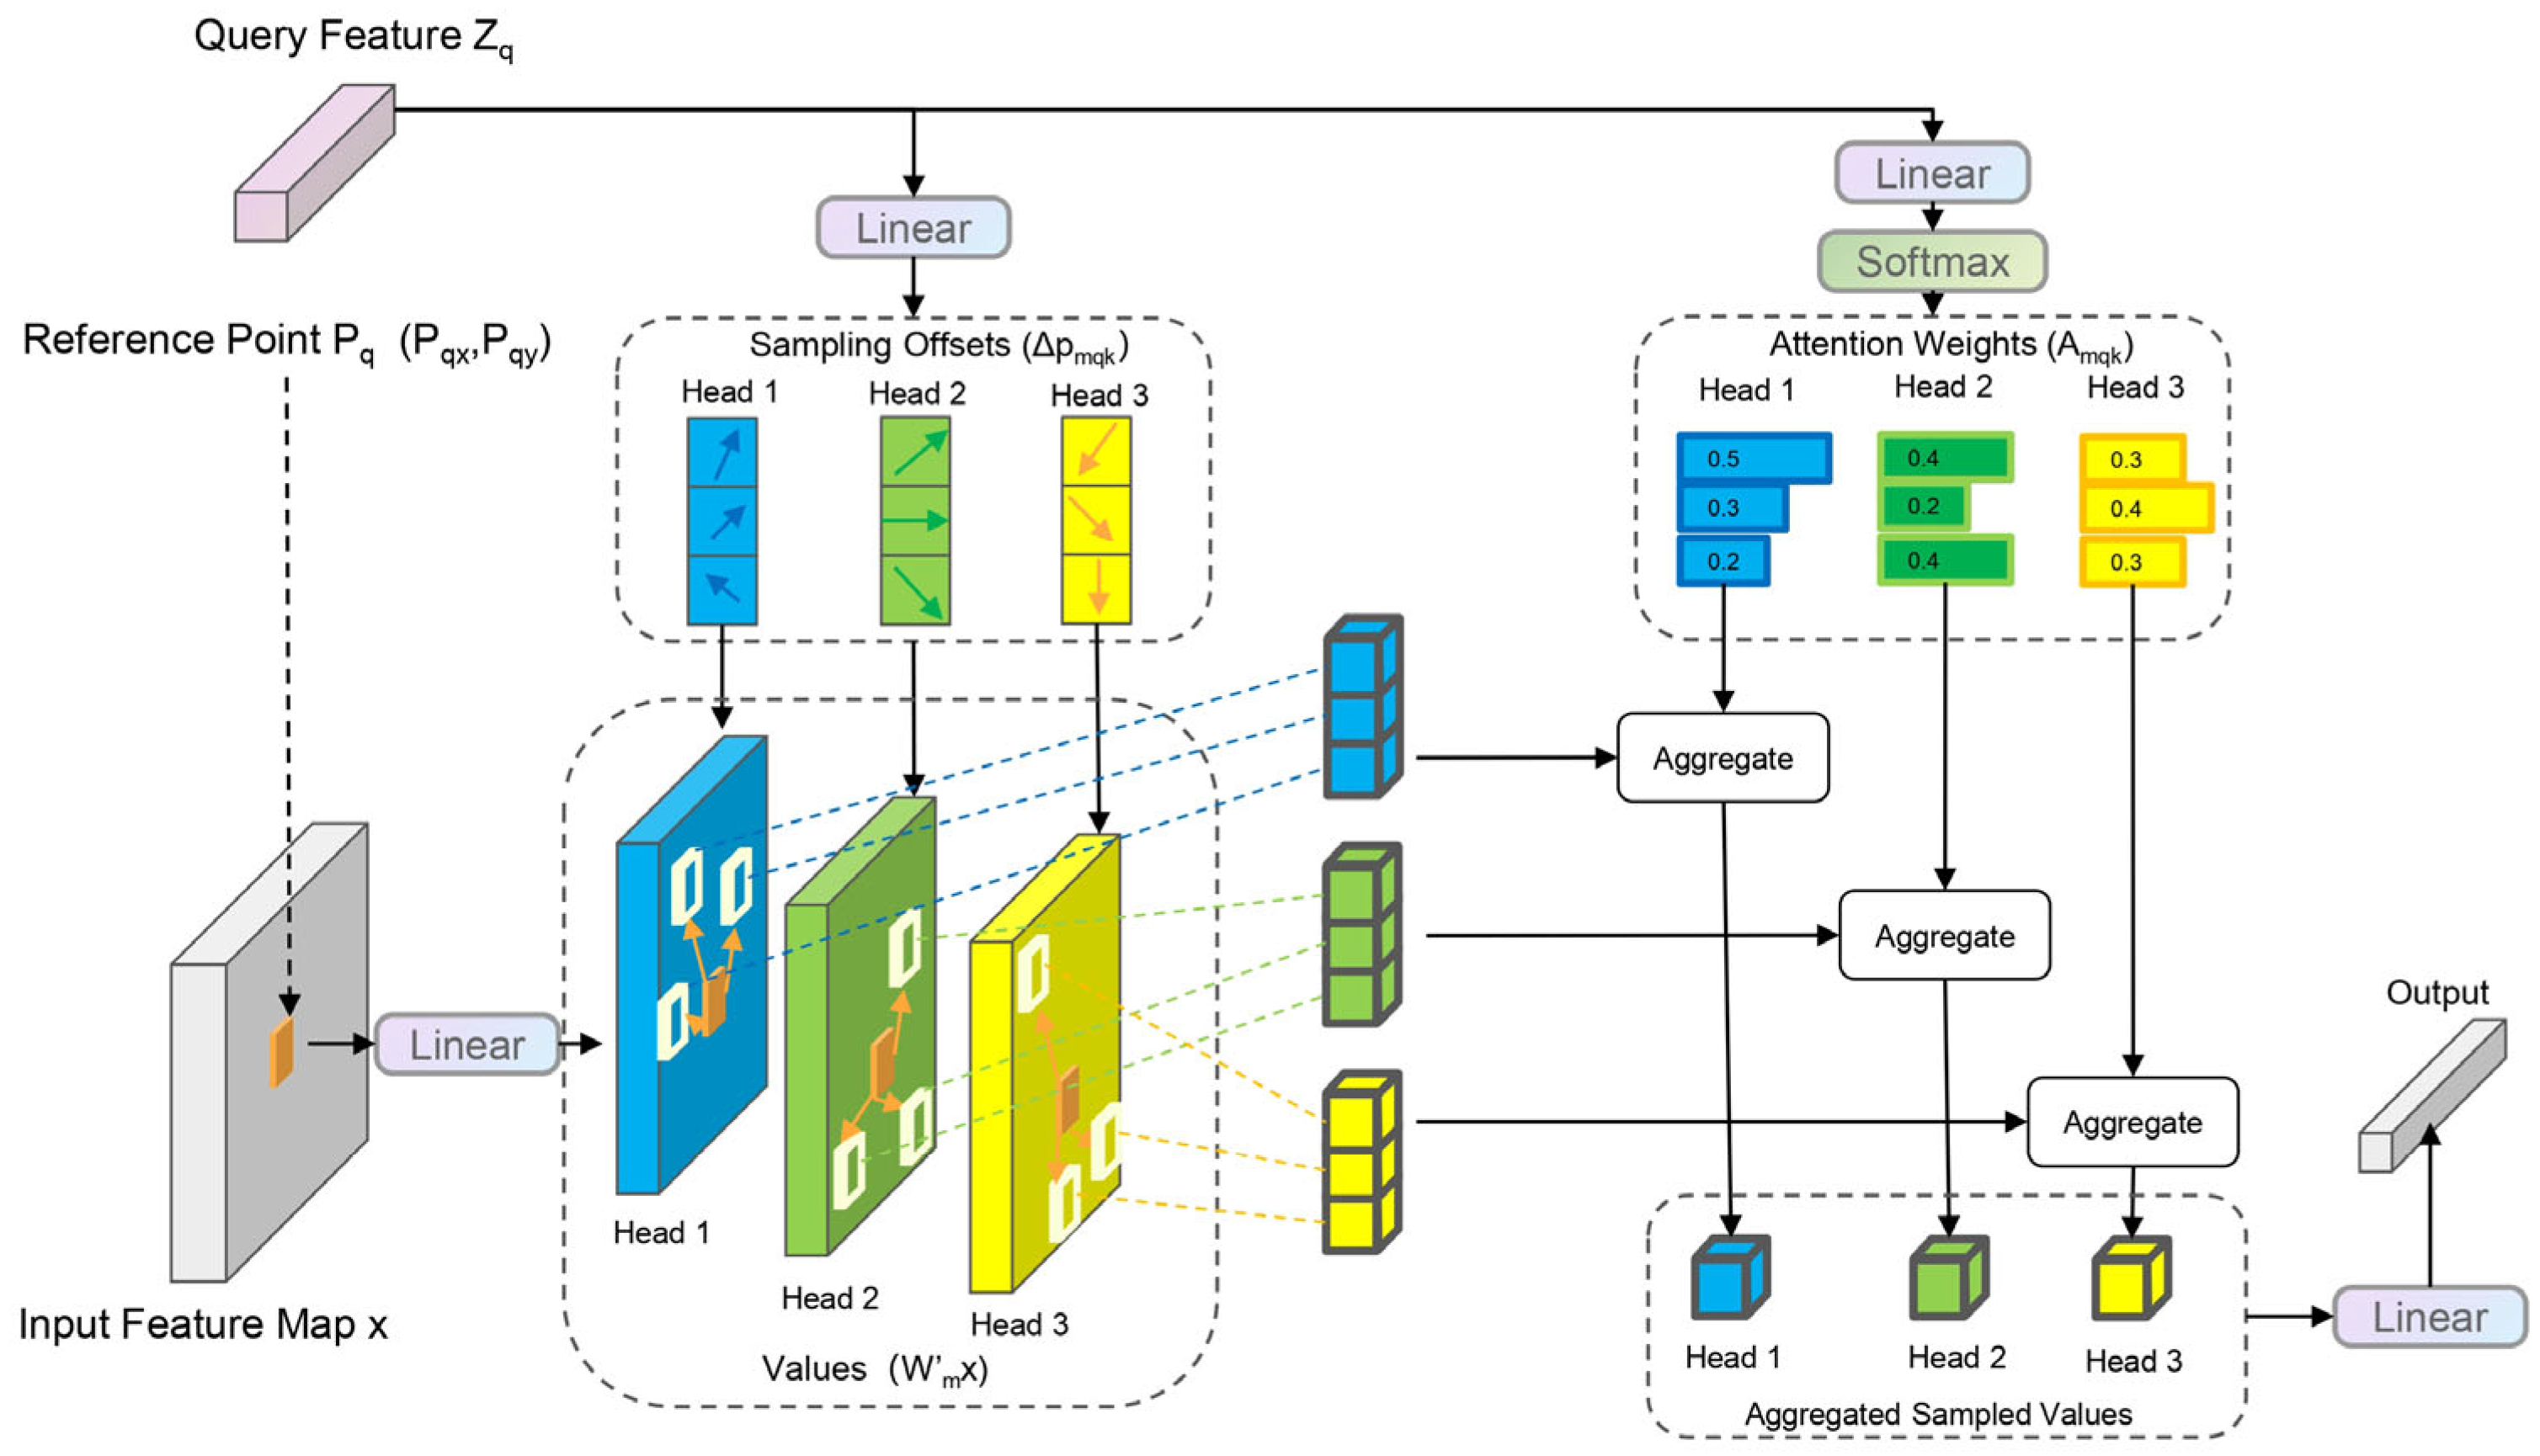
The original Transformer attention mechanism has a limitation in that it attends to all spatial locations within the feature map. In contrast, the deformable attention module addresses this limitation by selectively focusing on a small set of key sampling points near the reference point. This selection is independent of the spatial size of the feature map. In the deformable attention module, a set of query vectors is used to calculate K offsets. These offsets are then added to the reference point, resulting in K coordinates of the attention points. Notably, this approach avoids considering H (height) × W (width) points across the entire feature map, thus significantly reducing the computational complexity (see Figure 7).
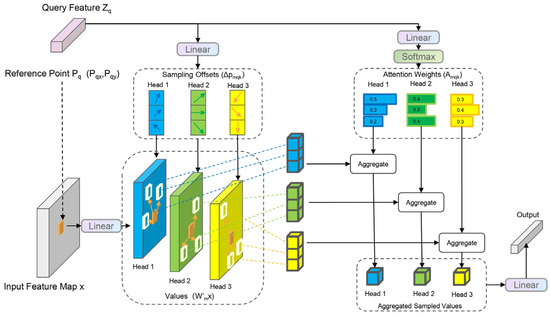
Figure 7.
Illustration of the proposed deformable attention module.
For an input feature map x ∈ R (C × H × W), where C, H, and W represent the number of channels, height, and width, respectively, let q denote the index of a query element. Zq represents the original feature on the feature map corresponding to the query element. The 2D reference point is denoted as pq. The computation of deformable attention features can be described by Equation (5).
M denotes the multi-head attention mechanism, representing the index of the attention head. The variable k denotes the sampling points, while K refers to the total number of sampling points (K << HW). ∆pmqk represents the sampling offset of the kth sampling point in the mth attention head, and Amqk denotes the attention weight requiring normalization. Since pq + ∆pmqk is a small value, bilinear interpolation is employed.
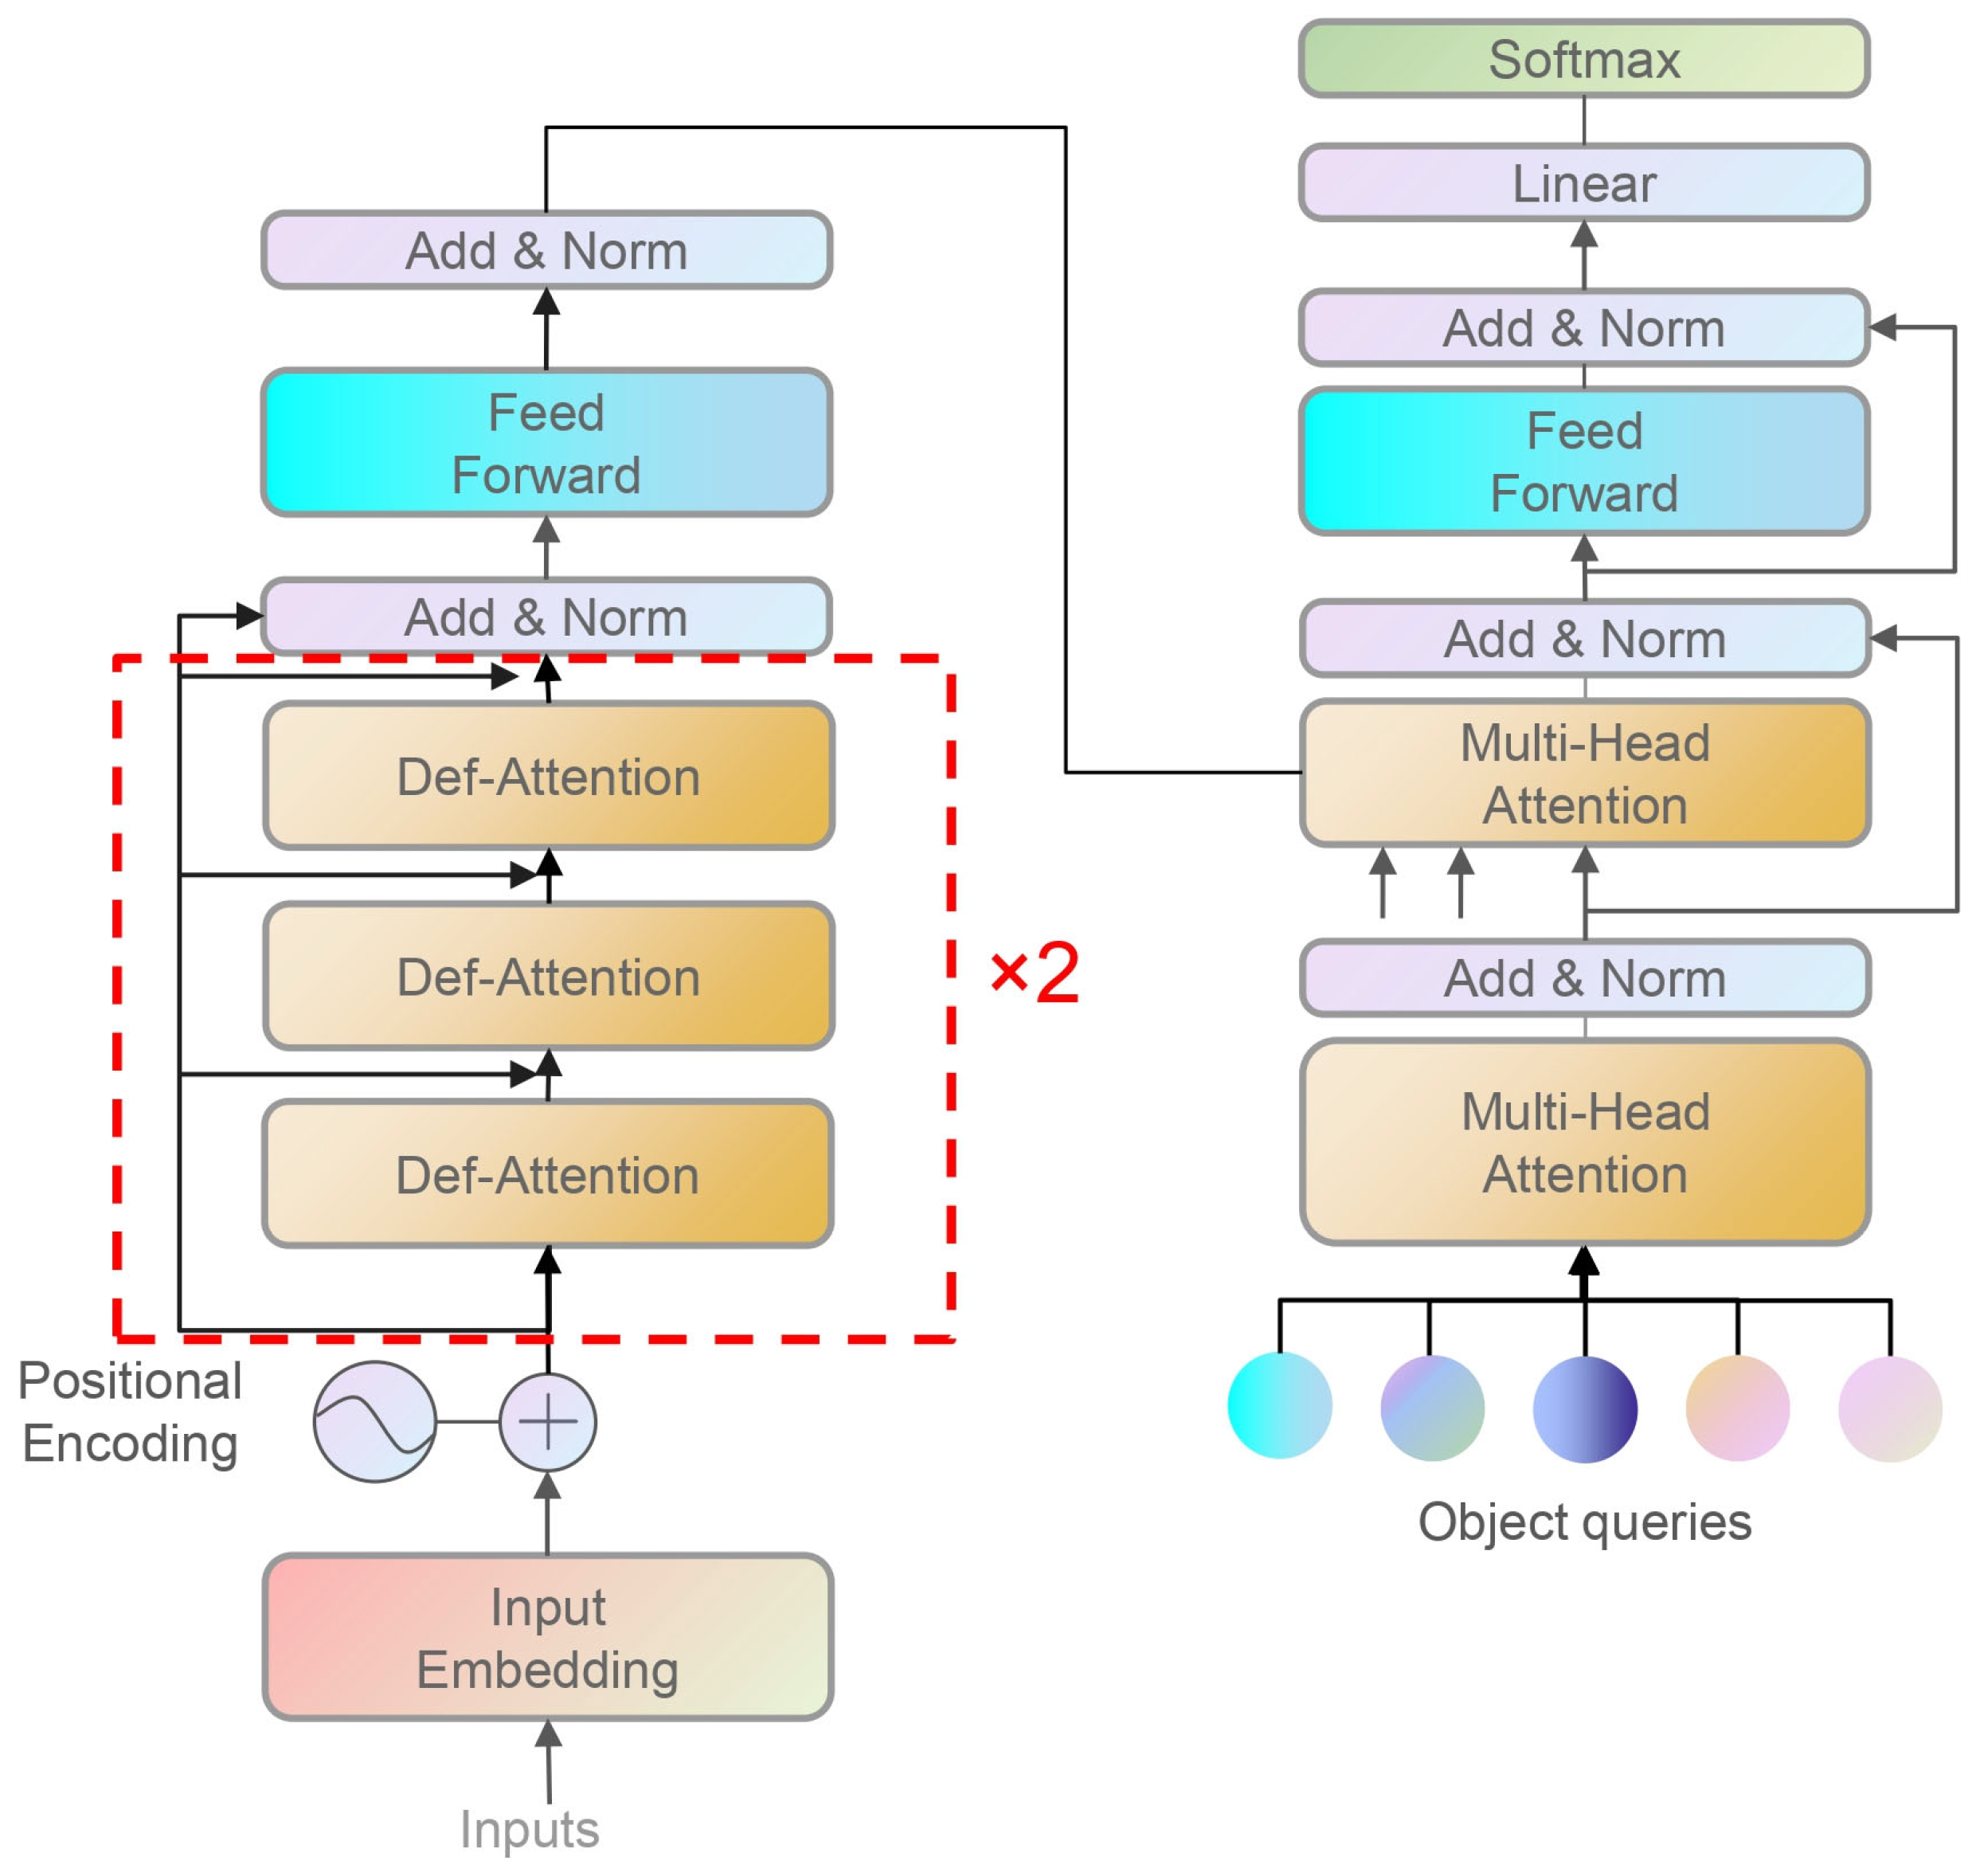
The proposed model introduces the variable attention mechanism deformable attention to replace the global sampling utilized in the original encoder, aiming to address the slower and computationally expensive DETR detection challenge. Drawing inspiration from deformable models, this mechanism employs a sparse sampling strategy to streamline the computational requirements while capturing more intricate features. Simultaneously, we simplify the network structure by transitioning from the original multi-scale feature extraction method to extracting solely single-scale features, thereby lowering the computational costs without a notable decrease in accuracy. Furthermore, the implemented multi-layer attentional fusion mechanism in the encoder integrates residual connections at each layer to enhance the feature learning and improve the effectiveness of feature extraction.
The encoder processes the input image by first resizing and normalizing it. The deformable attention module then selectively focuses on key sampling points near the reference points, and multi-layer fusion enhances the representational power of the encoder by integrating residual connections at each layer. In the decoder, the fused features are initially processed, refined through attention mechanisms, and further refined through multiple layers. The final stage generates the predicted bounding boxes and class labels for the objects in the image. Please refer to Figure 8 for a comprehensive illustration of the module structure.
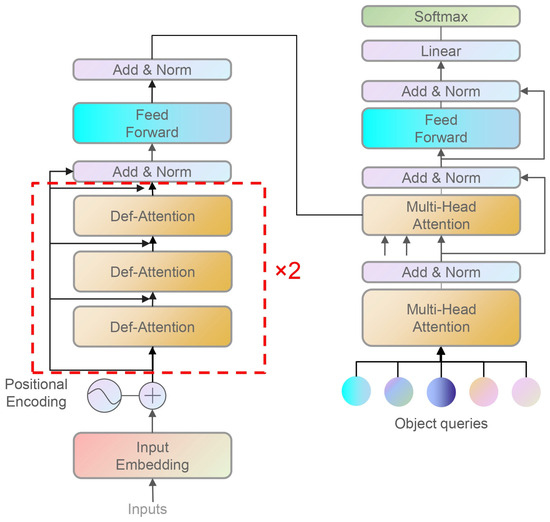
Figure 8.
The encoder–decoder structure of our model after incorporating a multi-layer fusion deformable attention mechanism.
4. Results
This section presents the results of our study, including the experimental environment, the evaluation indicators, and a comprehensive assessment of the performance of the proposed QP-DETR model. It provides a detailed analysis of the model’s accuracy, precision, and detection speed, along with comparisons to baseline methods. Each subsection elaborates on specific aspects of the experiments and findings.
4.1. Experimental Environment
The study utilized Ubuntu 18.04.6 LTS as the operating system model. The CPU employed was an Intel(R) Xeon(R) CPU E5-2640 v4 @ 2.40 GHz. The system had running memory of 256 GB, and the GPU model used was the NVIDIA Corporation GV100GL (Tesla V100 PCIe 32 GB) (rev a1), with a memory size of 32 GB. For the model hyperparameters, the epoch number was set to 300, the initial learning rate to 0.0002, and the batch size to 4. Stochastic Gradient Descent (SGD) was selected as the optimizer for model training, and the optimal weight file was saved as the final model during training [31].
The dataset used in this study consisted of 827 QP events. We screened and randomly divided these images into a training set and a validation set, following a ratio of 8:2. The size of each image was 1295 × 620 pixels.
4.2. Evaluation Indicators
In this study, the performance of the model is evaluated based on both its detection accuracy and detection speed. The number of frames detected per second (FPS) is employed as a measure of the detection speed, while the mean average precision (mAP) is computed to assess the accuracy of the model.
The dataset comprises both negative class samples (N) and positive class samples (P). The combinations of N and P, along with their corresponding meanings, are outlined in the following explanation. When the threshold exceeds the Intersection over Union (IoU), it indicates correct predictions by the model. Conversely, when the threshold falls below the IoU, it signifies incorrect predictions. FN, FP, and TN are the false negatives, false positives, and true negatives, respectively.
Precision is a metric that measures the accuracy of a model. It represents the proportion of true positive cases among the samples predicted as positive, as shown in Equation (6). A higher precision value signifies the greater accuracy of the model, indicating that a larger proportion of the predicted positive cases are indeed true positives.
mAP is a widely used evaluation metric in the field of object detection. It quantifies the average detection accuracy of a model across multiple classes or categories. A higher mAP indicates higher average accuracy in detecting objects, demonstrating the better performance of the model in object detection tasks. Specifically, mAP0.5:0.95 refers to the mean average precision calculated at IoU thresholds ranging from 0.5 to 0.95, while mAP0.5 refers to the mean average precision at an IoU threshold of 0.5.
In Equation (7), N is the total number of samples in the test set, P is the precision, k is the kth sample, and R is the amount of change in the recall rate from the k-1st sample to the kth sample. The recall rate, also known simply as recall, is a metric that measures the ability of the model to identify all relevant instances in the dataset. It is defined as the proportion of true positive cases among the total actual positive cases. Higher recall indicates that the model can detect a larger portion of the true positive cases.
“Params/M” denotes the number of parameters in millions. This metric is used to compare the model’s complexity and efficiency. Lower Params/M values indicate more lightweight models, which are often preferable for applications requiring limited computational resources or faster inference times.
FPS is a valuable metric for the evaluation of the inference speeds of object detection algorithms. It provides a straightforward measure of how many frames can be processed per second by the detection algorithm. In the context of object detection, the objective is to accurately identify and locate objects within a video or image sequence.
By measuring the FPS, we can assess the efficiency and real-time capability of different object detection algorithms. A higher FPS indicates the faster processing of frames, which is crucial for applications requiring real-time detection. Evaluating the FPS allows for direct comparisons between algorithms, helping to determine their efficiency and suitability for real-time applications. For CSES data, while real-time processing might not be immediately necessary, the efficient processing of large datasets is vital. A higher FPS means that our algorithm can handle extensive datasets swiftly, which is beneficial for timely analysis. Additionally, future CSES missions may require real-time or near-real-time processing, making the FPS an important metric in assessing the computational efficiency and scalability, ensuring preparedness for future scenarios where rapid data processing is critical.
4.3. Algorithm Performance Assessment
To comprehensively evaluate the performance of the improved models, comparative experiments are conducted on multiple models using the same randomly partitioned dataset. The experimental results of each model are recorded after 300 epochs, utilizing the mean average precision (mAP) and detection speed (FPS) as the evaluation metrics. By using the same dataset and experimental setup for all models, a fair and direct comparison can be performed. The mAP metric provides insight into the accuracy and precision of object detection, while the FPS metric allows for the assessment of the speed at which the models can process frames. By considering both the mAP and FPS as evaluation metrics, the experiments provide a balanced assessment of the improved models, considering their accuracy as well as their computational efficiency in terms of speed.
Overall, this experimental setup ensures a comprehensive evaluation of the models, encompassing their performance in terms of accuracy and speed.
As shown in Table 2, our proposed QP-DETR model reduces the parameter count by 17%, resulting in a compact size of 34.27 million. It surpasses other algorithms in detection speed, matches YOLOv3 in performance, and enhances the accuracy by 1% compared to DETR-R50. Collectively, these findings affirm QP-DETR’s outstanding capabilities in detecting QP events. The QP-DETR model amalgamates superior accuracy, reduced parameters, and swift detection speeds, rendering it a potent and efficient solution for QP event detection tasks.

Table 2.
Comparison of algorithms and backbone models. Yellow highlighting is the optimal value.
As shown in Table 3, after replacing the backbone with EfficientNetV2, we find a significant reduction in the number of parameters, from 41.28 M to 34.27 M parameters, and a 0.2% increase in the mAP. This is because EfficientNetV2 has stronger feature extraction capabilities and a lighter design compared to ResNet50. Subsequently, when incorporating ECA channel attention into the model, the mAP0.5 showed a further improvement of 0.4%. This addition enhanced the model’s ability to refine feature extraction, resulting in increased detection accuracy. Following this, the inclusion of DefAttention led to an additional increase in the mAP0.5 of 0.3%. DefAttention incorporated a variable attention mechanism, enabling the model to extract more precise features, thus contributing to improved detection performance.

Table 3.
Results of ablation experiments. √ indicates that the corresponding improvement was made in the model, - no improvement was made.
Although there were no significant changes in the mAP0.5 observed after applying multi-level fusion with DefAttention, there was an improvement of 0.4% in the mAP0.5:0.95 metric. This indicates that the model achieved better precision in localizing and identifying objects with high confidence. Overall, these improvements in the mAP0.5 and mAP0.5:0.95, achieved through various modifications such as backbone replacement, channel attention, and DefAttention, demonstrate the effectiveness of the proposed enhancements in accurately detecting and localizing objects in the study.
4.4. Test Set Comparison Experiment
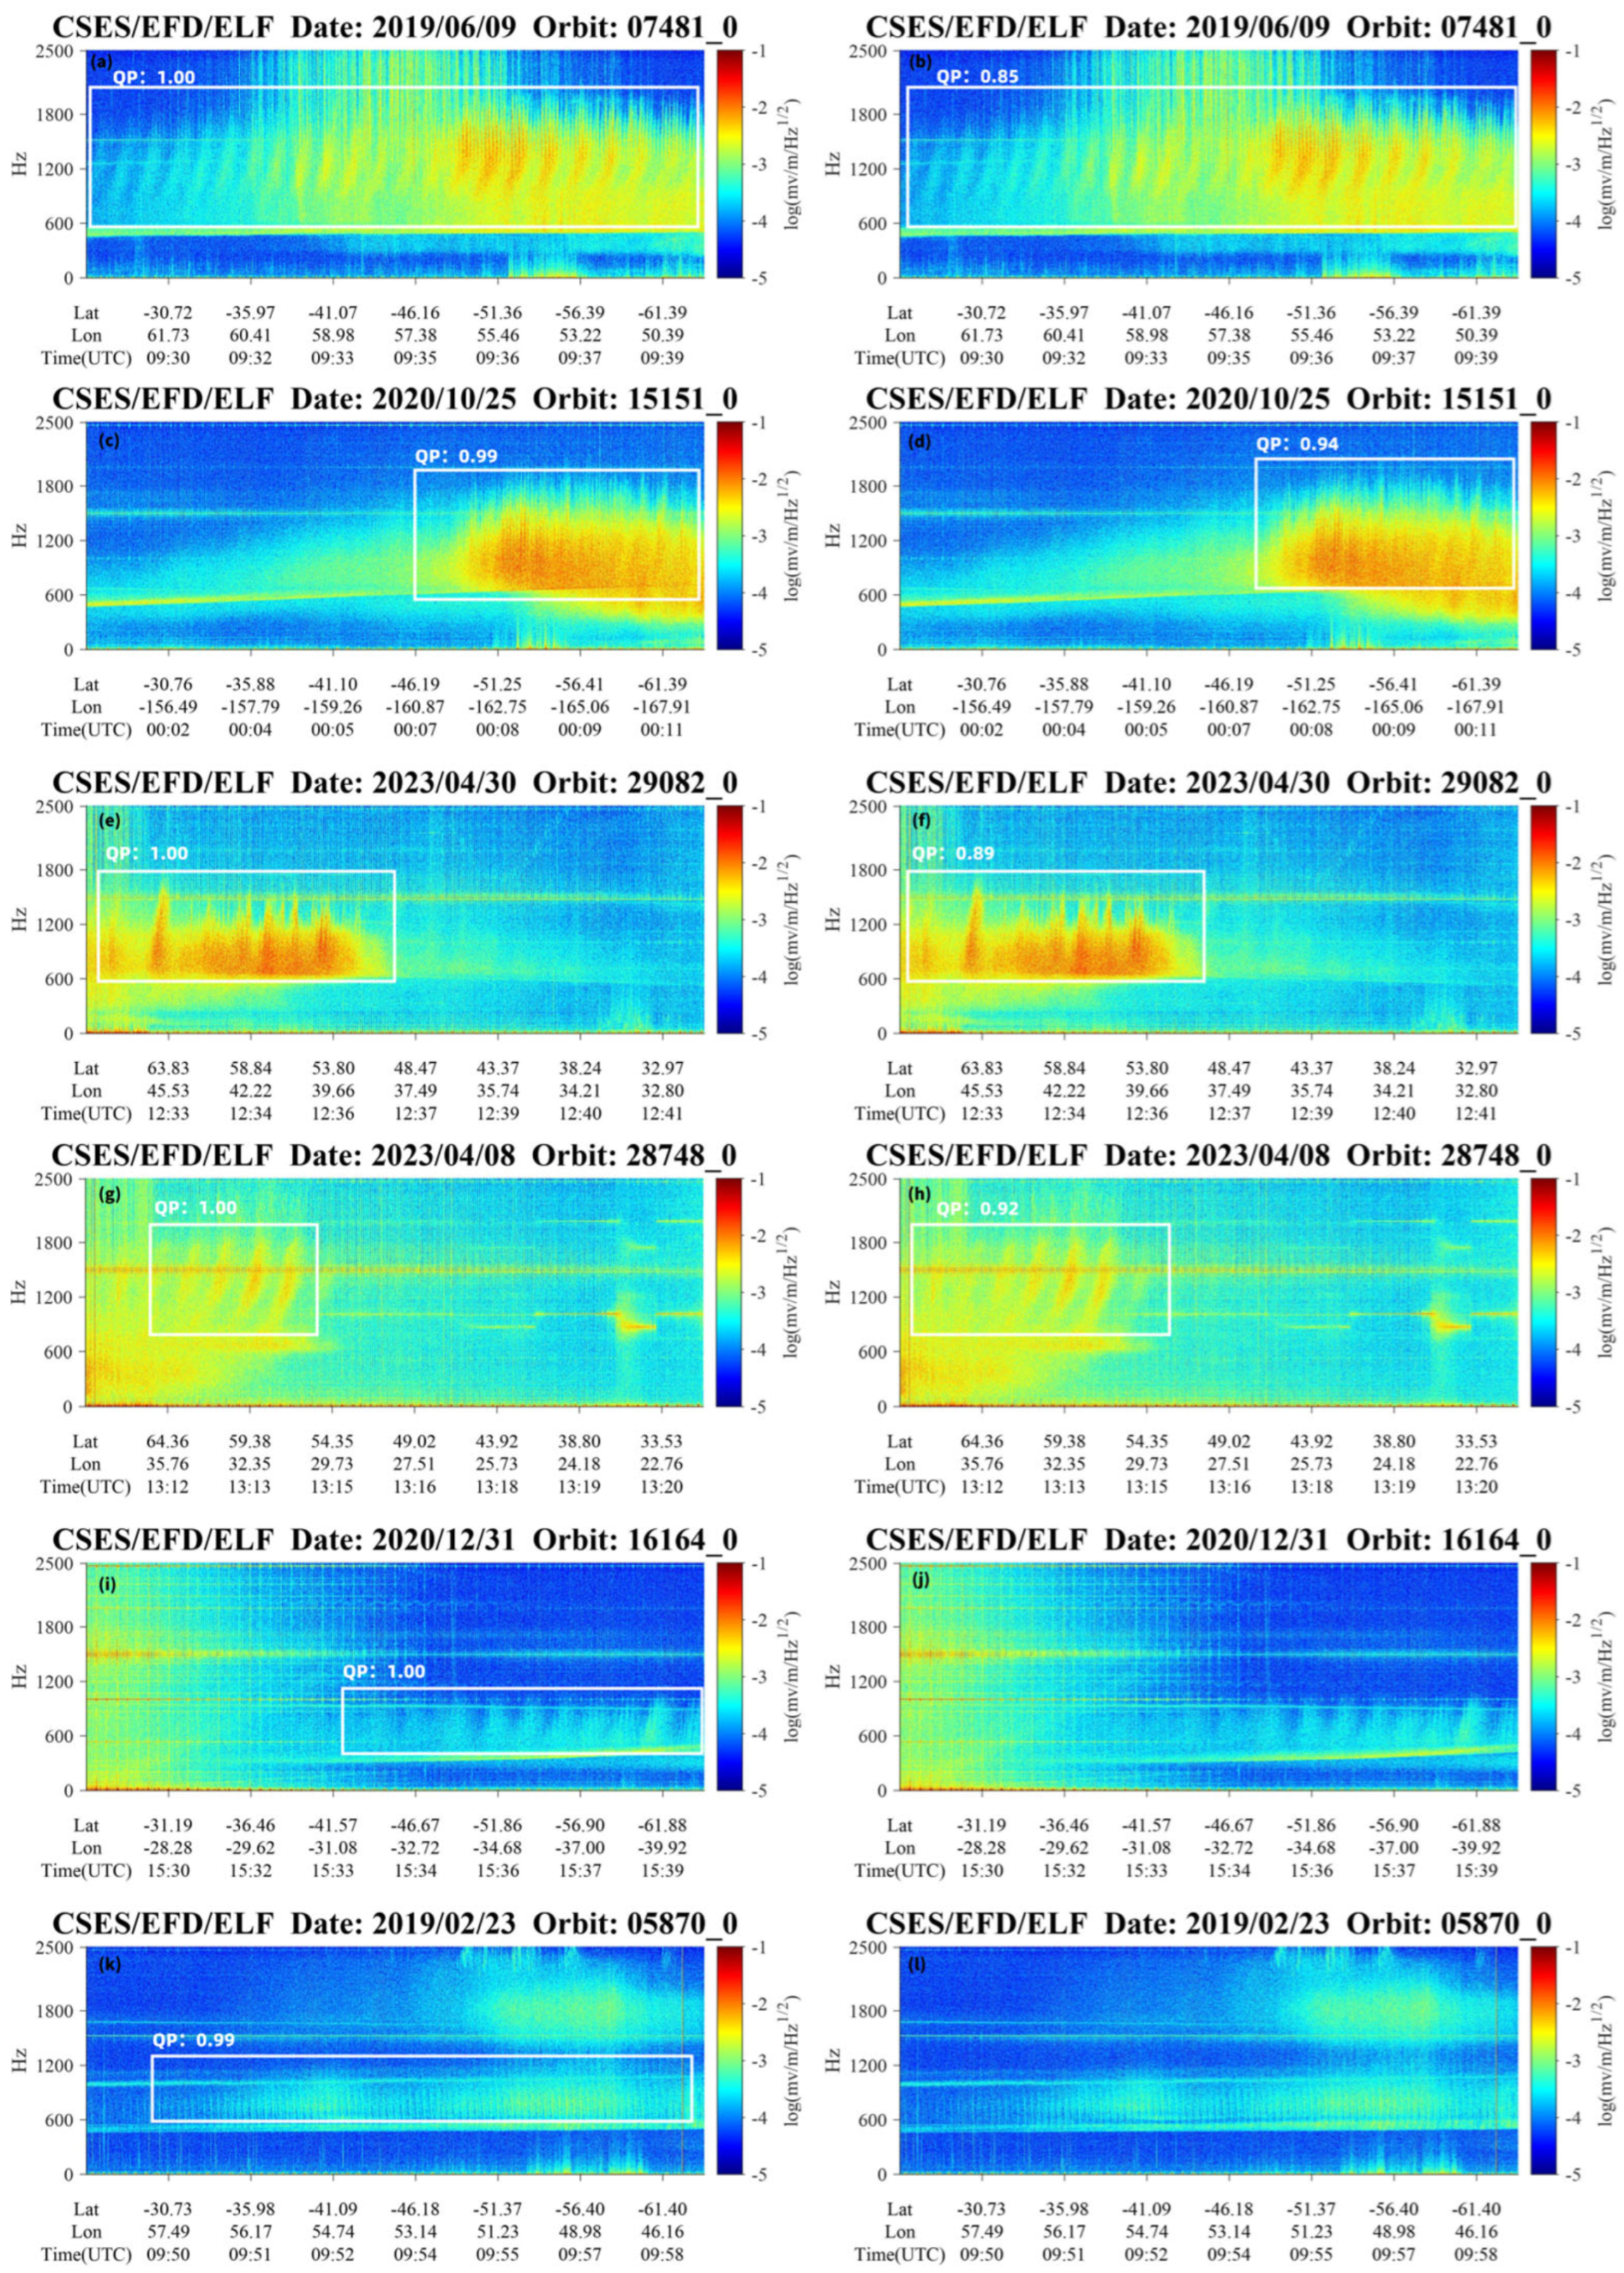
In this study, QP-DETR and DETR are used for detection on the test set. Figure 9 shows the results for some of the test images, with the QP-DETR results in the left column and the DETR results in the right column. The numbers on the detection boxes indicate the confidence level, which represents the probability that the model considers the box to be a QP event.
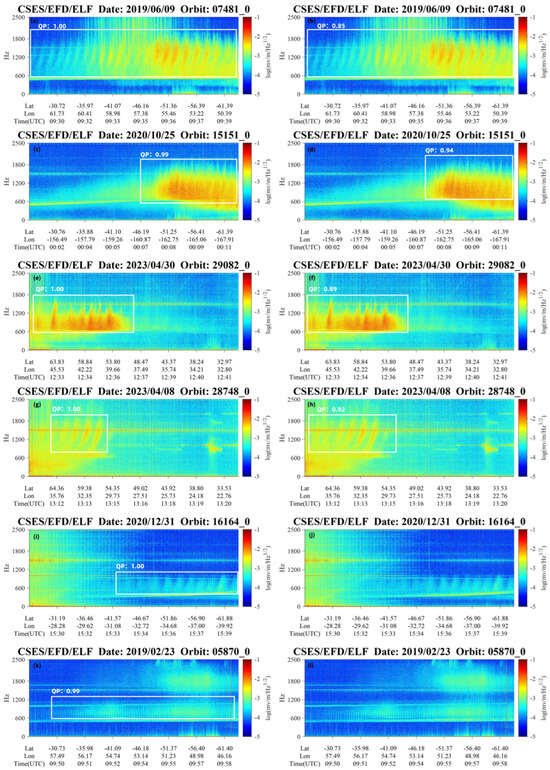
Figure 9.
Comparison of detection results between QP-DETR and DETR. Left column: results from QP-DETR; right column: results from DETR. (a–h) show cases with higher confidence levels in QP-DETR. (i–l) show cases where DETR failed to detect QP events but QP-DETR successfully detected them.
When comparing the two algorithms, it can be seen that both models can successfully identify the more obvious different types of QP events. However, the confidence level of QP-DETR is significantly higher than that of DETR, as shown in Figure 9a–h. For QP events with a weaker intensity and less obvious texture features, DETR shows a higher rate of missed detections, while QP-DETR can still successfully detect these events, as shown in Figure 9i–l.
These results indicate that the improved model, QP-DETR, has stronger feature extraction capabilities. It can highlight the necessary texture features in a complex background, reduce the missed detection rate of QP events, and thus prove the effectiveness of the model.
4.5. Improvement of the Detection Stage
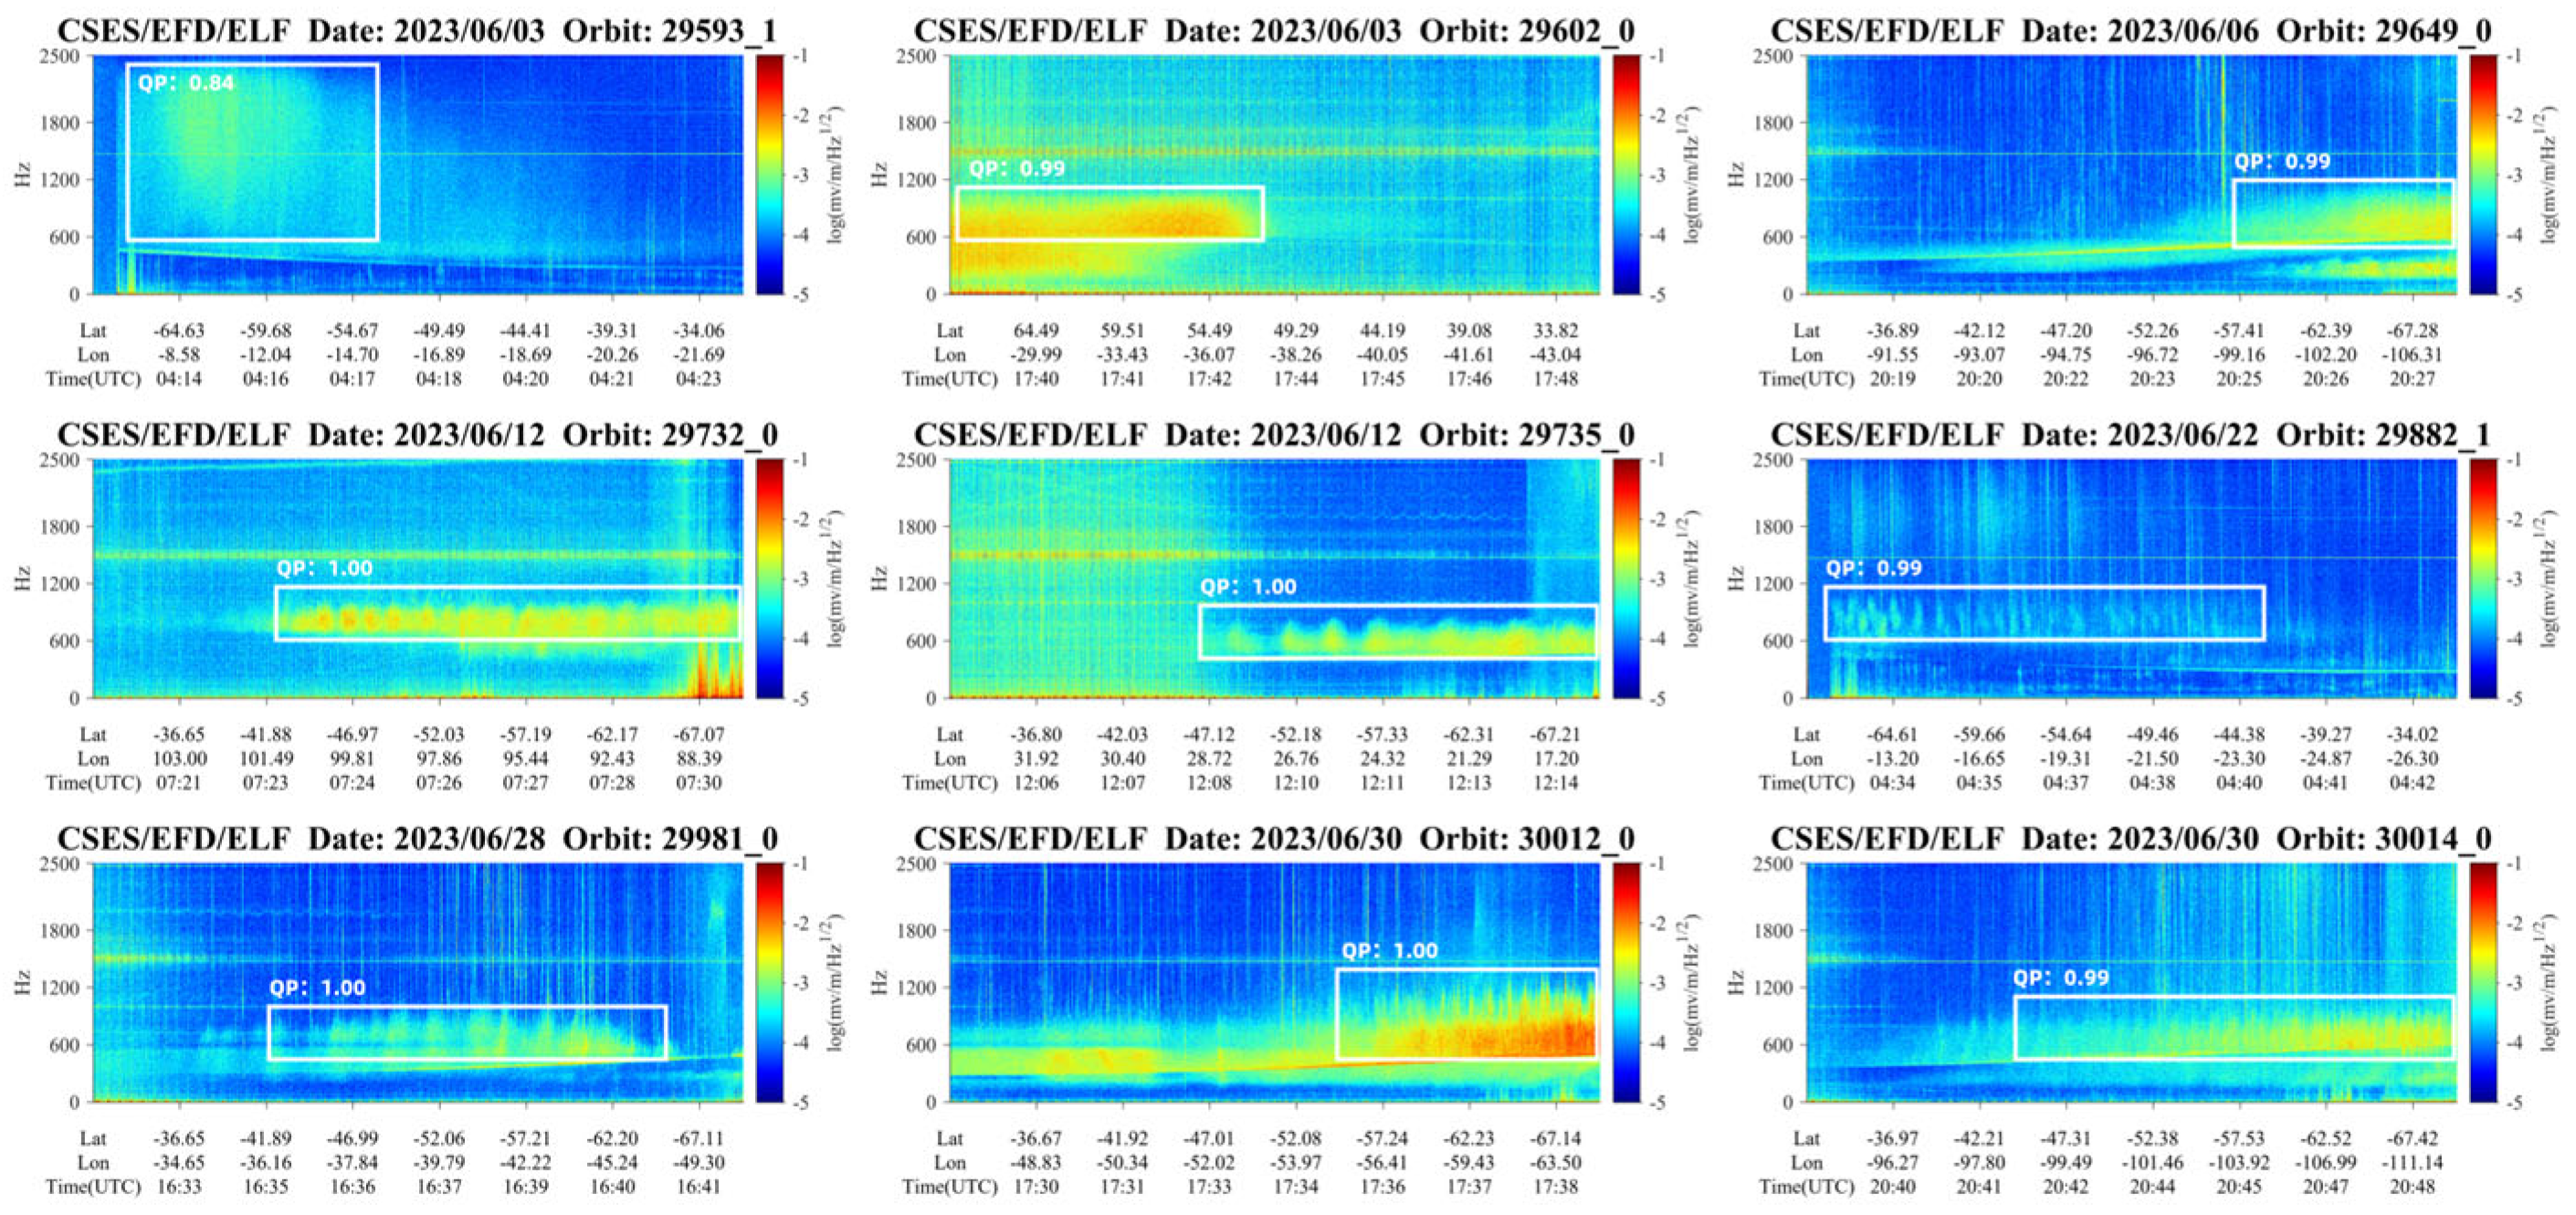
To assess the practical applicability of our model for future satellite data detection, we performed QP event detection on data collected in June 2023 using our proposed QP-DETR automatic detection model. From the 1918 intercepted EFD power spectra, we detected 164 QP events, with 87 correctly identified and 32 QP events missed in the remaining images. The results from June 2023 show precision of 53.0% and recall of 81.5%. These results indicate that our model accurately identifies the majority of QP events, as shown in Figure 10.
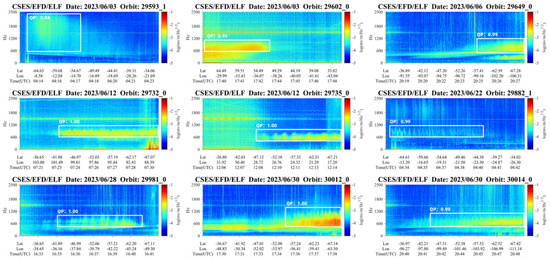
Figure 10.
The QP-DETR successfully detected a selection of QP events in June 2023.
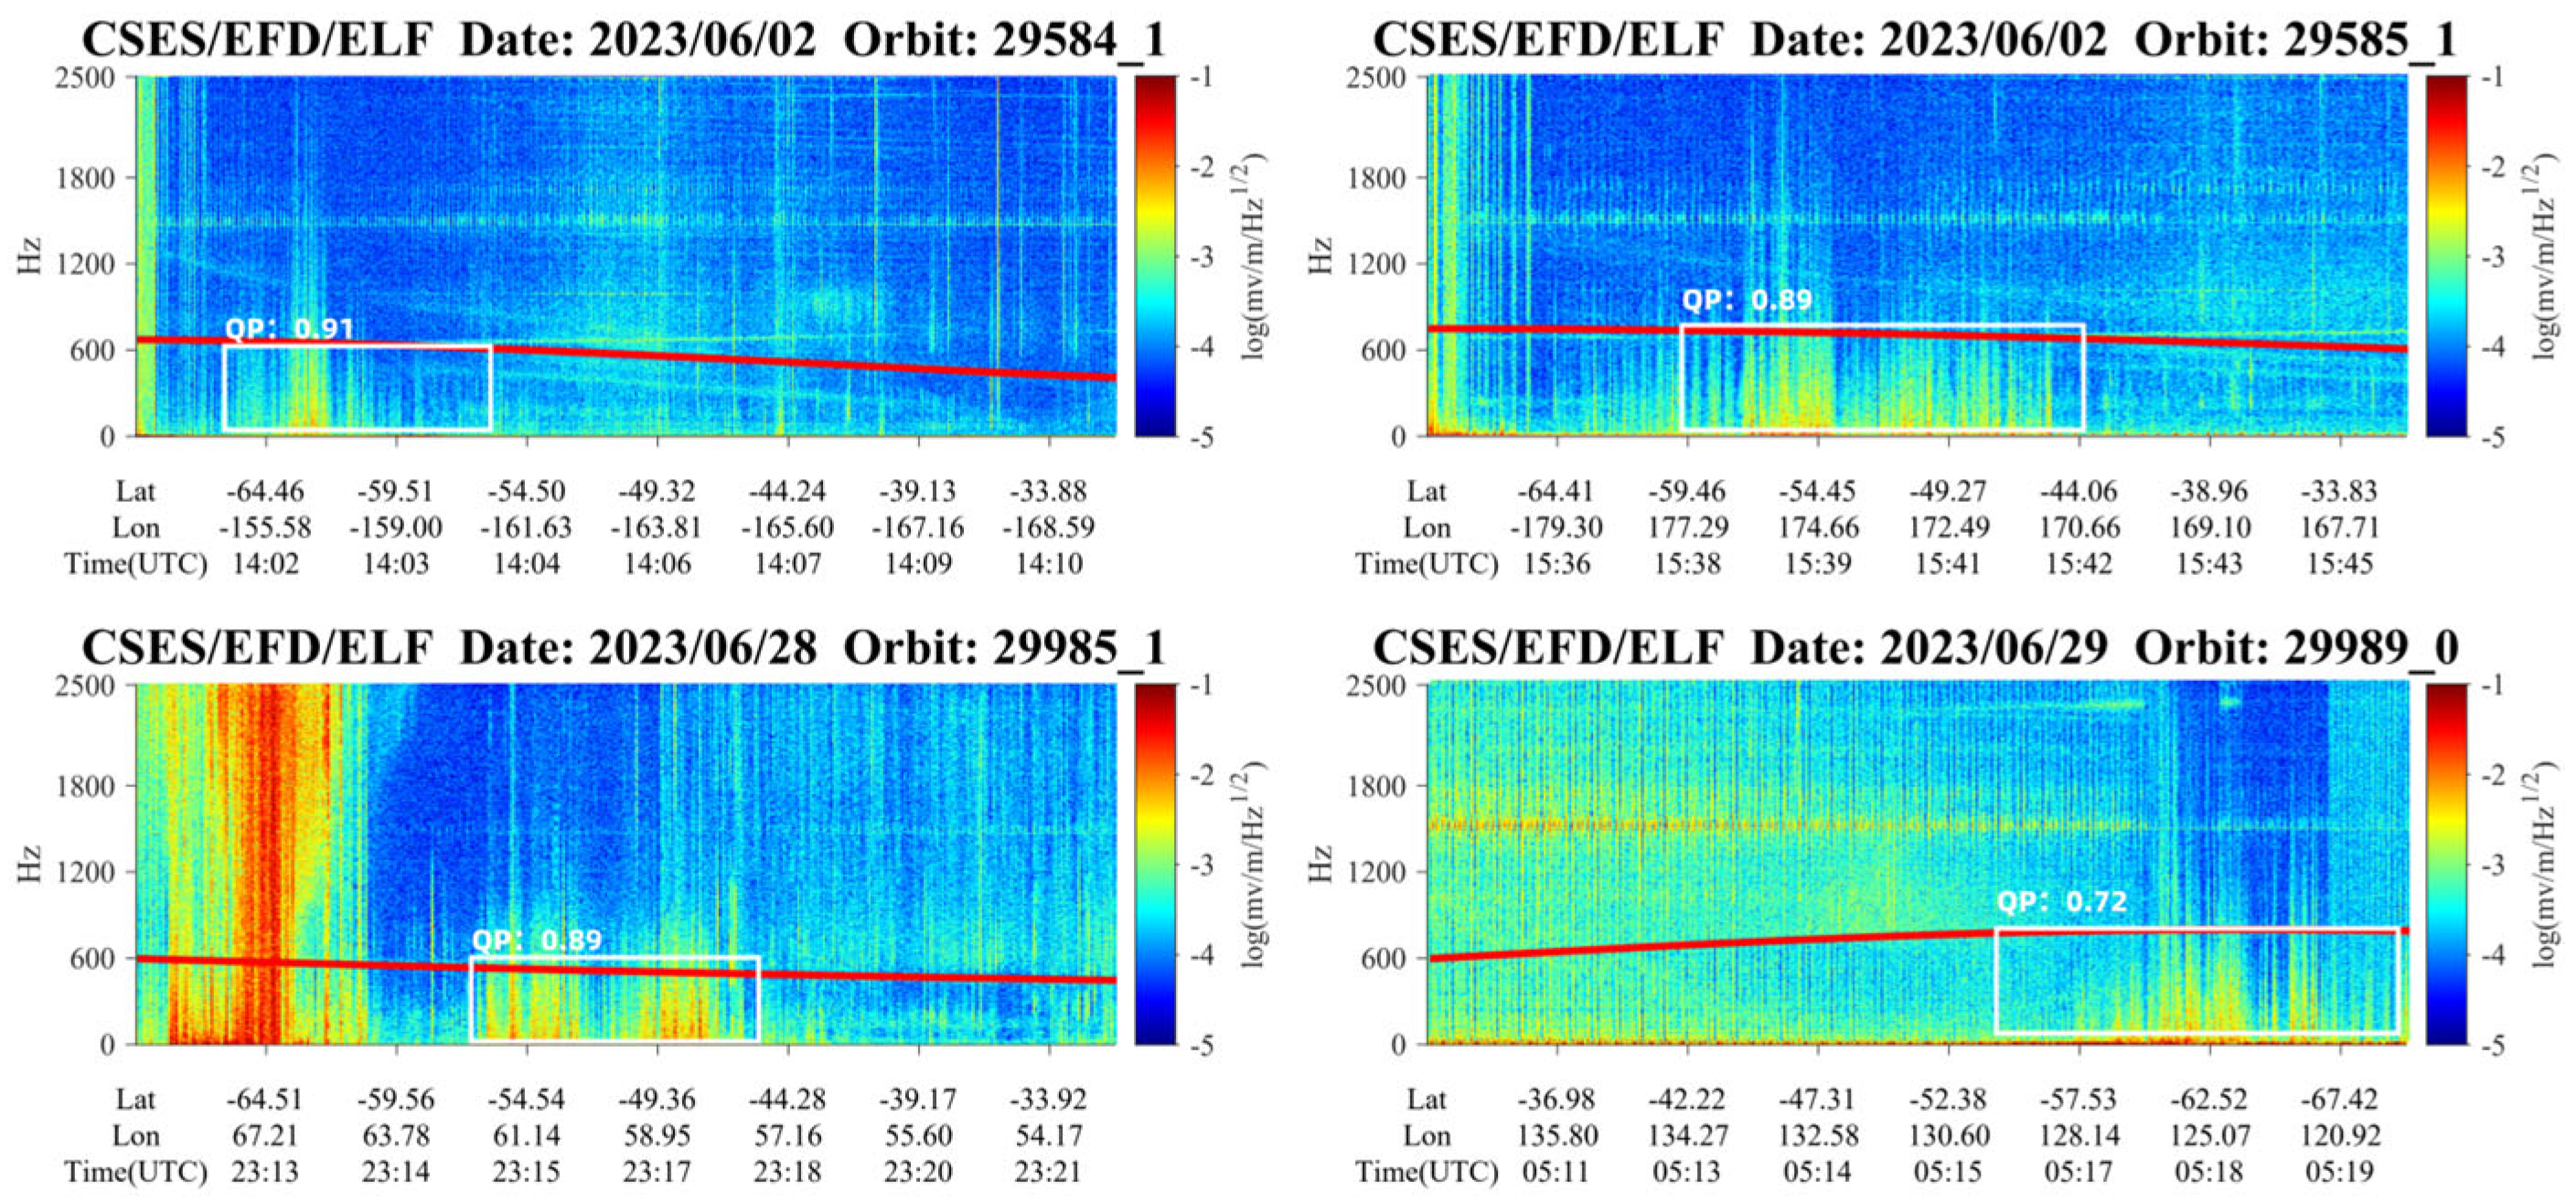
At the same time, we have identified some new problems, as shown in Figure 11. It was observed that certain low-frequency noise, including signals from lightning events, had similar texture characteristics and occurred below fcp. Since the cut-off frequency of the QP emission exceeded fcp, a proton cyclotron frequency limit was introduced during the prediction phase. Figure 2b shows the image and Equation (1) shows the calculation of fcp.
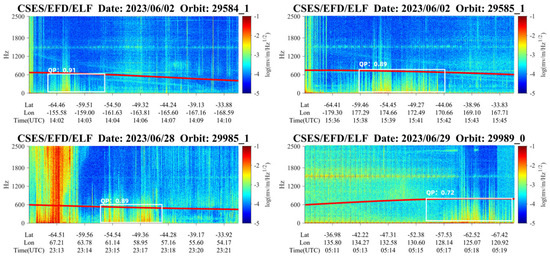
Figure 11.
Detection results on the June 2023 dataset using the QP-DETR algorithm, with the proton cyclotron frequency indicated by red lines. Several error detection issues were identified during testing.
In identifying the pixel coordinates corresponding to fcp within the image, interpolation was performed to align the latitude and frequency values with the pixel count. At the center of the prediction box, represented by the coordinates (x,y), a validation process is performed to ensure that the y value at the x position is greater than the fcp corresponding to that pixel. If the y value is lower, the prediction box is rejected. This method significantly reduces the occurrence of false alarms during detection.
5. Discussions
Time–frequency plots of high-precision sampled electromagnetic field observations reveal the presence of ionospheric QP emission characterized by changes in spectral morphology. This is particularly evident for targets affected by high levels of background noise interference, narrow bandwidths, short modulation periods, short durations, and low power spectral densities, which are effectively addressed by our proposed model.
5.1. Impacts of Other Types of Wave Activity
The simultaneous occurrence of electromagnetic wave phenomena such as magnetic line radiation (MLR), lightning whistle waves (LWs), and hissing waves on the time–frequency map adds complexity to recognition efforts. For example, MLR emissions consist of parallel spectral lines visible in both the electric and magnetic fields within a frequency band ranging from the local proton cyclotron frequency to ∼8 kHz [32]. This phenomenon is very similar to QP emission in terms of location and textural characteristics, but MLR is a parallel structure and rarely occurs simultaneously with QP emissions, thus having less impact on our detection.
For LW waves that occur in the frequency range of 100 ∼ 6 kHz, a clear down-tuning feature can be observed, with a morphology similar to the letter L [33]. In the ELF band, only a few energetic vertical line waveforms can be observed, and this phenomenon often occurs in conjunction with QP emission. In our proposed model, the backbone network has stronger feature extraction capabilities, and the improved deformable attention mechanism enables the model to execute a finer sampling strategy, minimizing the interference of LWs in our recognition.
The hiss waves, which occur mainly at or below fcp at geomagnetic latitudes from 20° (relatively weak) to 65° (dominant), or at frequencies above fcp to 800 Hz over the equatorial region at 20°, exhibit structureless wave spectral characteristics [34]. For hiss waves below fcp, instantaneous misidentification is ruled out by our constraints. Hiss waves above fcp are similar to the non-dispersive texture characteristics of QP emission, which can cause some interference. However, the frequency band of QP emission is from fcp to 4 kHz, which is a significant difference, allowing us to add finer frequency constraints during the prediction stage to rule out the effect of the hiss wave on detection.
5.2. Neural Networks in Other Space Missions
The DEMETER satellite was equipped with an onboard neural network for efficient signal analysis beyond the waveform recording time [35]. This neural network-based system was utilized to detect various phenomena defined during the space mission based on the analysis of the received waveforms. Specific data processing is triggered to record only the relevant information. The neural network on the DEMETER satellite served the purpose of real-time detection and the characterization of whistling phenomena. Currently, there is no neural network for the real-time monitoring of the CSES-01. Therefore, our model improvement is optimized to address this limitation, resulting in significant improvements in both weight and detection speed. However, the neural network on the DEMETER satellite directly processes waveform signals, while the conversion of waveform signals into time–frequency maps requires more computational power and storage capacity, hindering real-time monitoring. The recognition of QP emission from waveform or audio data will also be considered in future missions.
5.3. Future Directions: Audio Feature Extraction and Model Integration
The difficulty in detecting QP events from audio lies in extracting audio features and accurately detecting complete QP events, as QP events consist of multiple QP elements, leading to discontinuous audio features. Current research on the CSES-01 satellite’s LW recognition proposes using satellite waveform data as audio segments, extracting the Mel-Frequency Cepstral Coefficient (MFCC) features of LWs using speech intelligence techniques, constructing a long short-term memory (LSTM) neural network, and inputting the MFCC features of the waveform data to train a classification model [36]. The frequency of QP emission is about a few hundred to 4 kHz, within the human ear’s hearing range, allowing the use of the same MFCC features to construct an intelligent speech model. The LSTM neural network, which introduces time-dimensional information, is suitable for dealing with sound events in auditory features and events with long intervals and delays in the time series. The computational cost of detecting waveform data directly as audio is much lower than the cost of converting them into image data, further improving the model’s detection speed and enabling near-real-time detection. However, the feature expression ability of the MFCC and the long- and short-term memory feature ability of the LSTM in the recognition of QP events need to be verified by systematic experiments. Furthermore, for offline satellite data, we can consider ideas such as integrated learning, which integrates different models trained on waveform and image data to improve the accuracy of QP event detection [37].
5.4. Limitations and Potential Failure Conditions
While the QP-DETR model demonstrates improvements in detecting QP events, there are potential limitations and conditions under which the model might fail. In regions with high levels of background noise, such as the artificial noise from EFD or internal satellite communication, the model’s detection accuracy may decrease. Although we have introduced a proton cyclotron frequency limit to reduce false alarms, interference in the HPM payload data could affect the proton cyclotron frequency constraint, potentially leading to detection failures. The model may also struggle to detect QP events with very low intensities or indistinct texture features. In such cases, the confidence level of detection might be lower, leading to higher rates of missed detection. Additionally, although the QP-DETR model reduces the number of parameters, it still requires significant computational resources for training and inference. In resource-constrained environments, deploying the model might be challenging. By acknowledging these limitations, we aim to provide a clear understanding of the conditions under which the QP-DETR model performs optimally and the scenarios that may require further investigation and optimization.
6. Conclusions and Outlook
This paper proposes the QP-DETR method, a DETR-based automatic detection model for the detection of the QP emissions observed by the CSES-01 satellite. Our model utilizes high-sampling-rate ELF frequency band electromagnetic field data and employs deep learning techniques to achieve the automated detection of QP waves. The research primarily focused on efficiently and accurately extracting target signals from large volumes of satellite-collected electromagnetic field data. The feasibility and effectiveness of the QP-DETR model were verified through testing on both the original significant sample set and a new unscreened dataset. Additionally, the incorporation of proton cyclotron frequency constraints in the detection process successfully mitigated false alarm issues associated with QP events. This lightweight and fast detection model is suitable for deployment in satellite equipment and greatly enhances the possibility of onboard detection.
To effectively identify QP emissions, the presented detection model requires an extensive collection of training samples. In future work, we plan to iterate the training process using CSES-01 orbital observations while optimizing the model. Furthermore, we aim to explore the integration of meta-learning methods to achieve the more comprehensive and accurate detection of these QP waves. Additionally, we intend to conduct further research based on the identified ionospheric QP events using the QP-DETR method. By applying quantitative analysis techniques such as correlation analysis and the wave growth rate method, we seek to investigate the underlying mechanisms involving ULF waves and the modulation of ELF/VLF electromagnetic waves by high-energy electrons. These investigations will provide a detailed understanding of the generation of ionospheric QP emissions.
Author Contributions
Z.R. performed the data process and wrote the original manuscript version. D.Y. put forward the main idea and led the whole analysis process and the manuscript writing of this work. C.L., Y.H., X.S., and Z.Z. provided consultation on the idea and the manuscript writing of the work. All authors have read and agreed to the published version of the manuscript.
Funding
This work is supported by the National Key Research and Development Program of China: 2023YFE0117300, the National Natural Science Foundation of China: 41874174, the APSCO Earthquake Research Project: Phase II and Dragon 5 cooperation 2020-2024: 59236.
Data Availability Statement
The ZH-1 satellite data can be downloaded from the Internet at https://www.leos.ac.cn via the Data Service term, where scientists can access the data download service by registering online and filling in the application form following the data policy (accessed on 30 July 2023).
Acknowledgments
We acknowledge the CSES-01 scientific mission center for providing the data.
Conflicts of Interest
The authors declare that the research was conducted in the absence of any commercial or financial relationships that could be construed as potential conflicts of interest.
References
- Sato, N.; Hayashi, K.; Kokubun, S.; Oguti, T.; Fukunishi, H. Relationships between Quasi-Periodic VLF Emission and Geomagnetic Pulsation. J. Atmos. Terr. Phys. 1974, 36, 1515–1526. [Google Scholar] [CrossRef]
- Hayosh, M.; Němec, F.; Santolík, O.; Parrot, M. Propagation Properties of Quasiperiodic VLF Emissions Observed by the DEMETER Spacecraft. Geophys. Res. Lett. 2016, 43, 1007–1014. [Google Scholar] [CrossRef]
- Zhima, Z.; Huang, J.; Shen, X.; Xia, Z.; Chen, L.; Piersanti, M.; Yang, Y.; Wang, Q.; Zeng, L.; Lei, J.; et al. Simultaneous Observations of ELF/VLF Rising-Tone Quasiperiodic Waves and Energetic Electron Precipitations in the High-Latitude Upper Ionosphere. J. Geophys. Res. Space Phys. 2020, 125, e2019JA027574. [Google Scholar] [CrossRef]
- Němec, F.; Santolík, O.; Parrot, M.; Pickett, J.; Hayosh, M.; Cornilleau-Wehrlin, N. Conjugate Observations of Quasi-Periodic Emissions by Cluster and DEMETER Spacecraft. J. Geophys. Res. Space Phys. 2013, 118, 198–208. [Google Scholar] [CrossRef]
- Hayosh, M.; Pasmanik, D.; Demekhov, A.; Santolík, O.; Parrot, M.; Titova, E. Simultaneous Observations of Quasi-Periodic ELF/VLF Wave Emissions and Electron Precipitation by DEMETER Satellite: A Case Study. J. Geophys. Res. Space Phys. 2013, 118, 4523–4533. [Google Scholar] [CrossRef]
- Ren, S.; He, K.; Girshick, R.; Sun, J. Faster R-Cnn: Towards Real-Time Object Detection with Region Proposal Networks. Adv. Neural Inf. Process. Syst. 2015, 28. [Google Scholar] [CrossRef]
- Lin, T.-Y.; Goyal, P.; Girshick, R.; He, K.; Dollár, P. Focal Loss for Dense Object Detection. In Proceedings of the IEEE International Conference on Computer Vision, Venice, Italy, 22–29 October 2017; pp. 2980–2988. [Google Scholar]
- Redmon, J.; Farhadi, A. Yolov3: An Incremental Improvement. arXiv 2018, arXiv:1804.02767. [Google Scholar] [CrossRef]
- Duan, K.; Bai, S.; Xie, L.; Qi, H.; Huang, Q.; Tian, Q. Centernet: Keypoint Triplets for Object Detection. In Proceedings of the IEEE/CVF International Conference on Computer Vision, Seoul, Republic of Korea, 27 October–2 November 2019; pp. 6569–6578. [Google Scholar]
- Vaswani, A.; Shazeer, N.; Parmar, N.; Uszkoreit, J.; Jones, L.; Gomez, A.N.; Lukasz, K.; Polosukhin, I. Attention Is All You Need. Adv. Neural Inf. Process. Syst. 2017, 30. [Google Scholar] [CrossRef]
- Carion, N.; Massa, F.; Synnaeve, G.; Usunier, N.; Kirillov, A.; Zagoruyko, S. End-to-End Object Detection with Transformers. In Proceedings of the European Conference on Computer Vision; Springer: Berlin/Heidelberg, Germany, 2020; pp. 213–229. [Google Scholar]
- Shen, X.; Zhang, X.; Yuan, S.; Wang, L.; Cao, J.; Huang, J.; Zhu, X.; Piergiorgio, P.; Dai, J. The State-of-the-Art of the China Seismo-Electromagnetic Satellite Mission. Sci. China Technol. Sci. 2018, 61, 634–642. [Google Scholar] [CrossRef]
- Cheng, B.; Zhou, B.; Magnes, W.; Lammegger, R.; Pollinger, A. High Precision Magnetometer for Geomagnetic Exploration Onboard of the China Seismo-Electromagnetic Satellite. Sci. China Technol. Sci. 2018, 61, 659–668. [Google Scholar] [CrossRef]
- Pollinger, A.; Lammegger, R.; Magnes, W.; Hagen, C.; Ellmeier, M.; Jernej, I.; Leichtfried, M.; Kürbisch, C.; Maierhofer, R.; Wallner, R.; et al. Coupled Dark State Magnetometer for the China Seismo-Electromagnetic Satellite. Meas. Sci. Technol. 2018, 29, 095103. [Google Scholar] [CrossRef]
- Cao, J.; Zeng, L.; Zhan, F.; Wang, Z.; Wang, Y.; Chen, Y.; Meng, Q.; Ji, Z.; Wang, P.; Liu, Z.; et al. The Electromagnetic Wave Experiment for CSES Mission: Search Coil Magnetometer. Sci. China Technol. Sci. 2018, 61, 653–658. [Google Scholar] [CrossRef]
- Huang, J.; Shen, X.; Zhang, X.; Lu, H.; Tan, Q.; Wang, Q.; Yan, R.; Chu, W.; Yang, Y.; Liu, D.; et al. Application System and Data Description of the China Seismo-Electromagnetic Satellite. Earth Planet. Phys. 2018, 2, 444–454. [Google Scholar] [CrossRef]
- Zhima, Z.; Zhou, B.; Zhao, S.; Wang, Q.; Huang, J.; Zeng, L.; Lei, J.; Chen, Y.; Li, C.; Yang, D.; et al. Cross-Calibration on the Electromagnetic Field Detection Payloads of the China Seismo-Electromagnetic Satellite. Sci. China Technol. Sci. 2022, 65, 1415–1426. [Google Scholar] [CrossRef]
- Yang, D.; Zhima, Z.; Wang, Q.; Huang, J.; Wang, X.; Zhang, Z.; Zhao, S.; Guo, F.; Cheng, W.; Lu, H.; et al. Stability Validation on the VLF Waveform Data of the China-Seismo-Electromagnetic Satellite. Sci. China Technol. Sci. 2022, 65, 3069–3078. [Google Scholar] [CrossRef]
- Hu, Y.; Zhima, Z.; Huang, J.; Zhao, S.; Guo, F.; Wang, Q.; Shen, X. Algorithms and Implementation of Wave Vector Analysis Tool for the Electromagnetic Waves Recorded by the CSES Satellite. Chin. J. Geophys. 2020, 63, 1751–1765. [Google Scholar] [CrossRef]
- Yang, Y.; Zhou, B.; Hulot, G.; Olsen, N.; Wu, Y.; Xiong, C.; Stolle, C.; Zhima, Z.; Huang, J.; Zhu, X.; et al. CSES High Precision Magnetometer Data Products and Example Study of an Intense Geomagnetic Storm. J. Geophys. Res. Space Phys. 2021, 126, e2020JA028026. [Google Scholar] [CrossRef]
- Yang, Y.; Zhima, Z.; Shen, X.; Zhou, B.; Wang, J.; Magnes, W.; Pollinger, A.; Lu, H.; Guo, F.; Lammegger, R.; et al. An Improved In-Flight Calibration Scheme for CSES Magnetic Field Data. Remote Sens. 2023, 15, 4578. [Google Scholar] [CrossRef]
- Sato, N.; Fukunishi, H. Interaction between ELF-VLF Emissions and Magnetic Pulsations: Classification of Quasi-Periodic ELF-VLF Emissions Based on Frequency-Time Spectra. J. Geophys. Res. Space Phys. 1981, 86, 19–29. [Google Scholar] [CrossRef]
- Hayosh, M.; Němec, F.; Santolík, O.; Parrot, M. Statistical Investigation of VLF Quasiperiodic Emissions Measured by the DEMETER Spacecraft. J. Geophys. Res. Space Phys. 2014, 119, 8063–8072. [Google Scholar] [CrossRef]
- Tan, M.; Le, Q. Efficientnet: Rethinking Model Scaling for Convolutional Neural Networks. In Proceedings of the International Conference on Machine Learning, PMLR, Long Beach, CA, USA, 10–15 June 2019; pp. 6105–6114. [Google Scholar]
- Tan, M.; Le, Q. Efficientnetv2: Smaller Models and Faster Training. In Proceedings of the International Conference on Machine Learning, PMLR, Virtual, 18–24 July 2021; pp. 10096–10106. [Google Scholar]
- Hu, J.; Shen, L.; Sun, G. Squeeze-and-Excitation Networks. In Proceedings of the Proceedings of the IEEE Conference on Computer Vision and Pattern Recognition, Salt Lake City, UT, USA, 18–23 June 2018; pp. 7132–7141.
- Howard, A.G.; Zhu, M.; Chen, B.; Kalenichenko, D.; Wang, W.; Weyand, T.; Andreetto, M.; Adam, H. MobileNets: Efficient Convolutional Neural Networks for Mobile Vision Applications. arXiv 2017, arXiv:1704.04861. [Google Scholar]
- Wang, Q.; Wu, B.; Zhu, P.; Li, P.; Zuo, W.; Hu, Q. ECA-Net: Efficient Channel Attention for Deep Convolutional Neural Networks. In Proceedings of the IEEE/CVF Conference on Computer Vision and Pattern Recognition, Seattle, WA, USA, 13–19 June 2020; pp. 11534–11542. [Google Scholar] [CrossRef]
- Dai, J.; Qi, H.; Xiong, Y.; Li, Y.; Zhang, G.; Hu, H.; Wei, Y. Deformable Convolutional Networks. In Proceedings of the IEEE International Conference on Computer Vision, Venice, Italy, 22–29 October 2017; pp. 764–773. [Google Scholar]
- Zhu, X.; Su, W.; Lu, L.; Li, B.; Wang, X.; Dai, J. Deformable Detr: Deformable Transformers for End-to-End Object Detection. arXiv 2020, arXiv:2010.04159. [Google Scholar] [CrossRef]
- Bottou, L. Large-Scale Machine Learning with Stochastic Gradient Descent. In Proceedings of the COMPSTAT’2010, Paris, France, 22–27 August 2010; Lechevallier, Y., Saporta, G., Eds.; Physica-Verlag HD: Heidelberg, Germany, 2010; pp. 177–186. [Google Scholar]
- Hu, Y.; Zhima, Z.; Fu, H.; Cao, J.; Piersanti, M.; Wang, T.; Yang, D.; Sun, X.; Lv, F.; Lu, C.; et al. A Large-Scale Magnetospheric Line Radiation Event in the Upper Ionosphere Recorded by the China-Seismo-Electromagnetic Satellite. J. Geophys. Res. Space Phys. 2023, 128, e2022JA030743. [Google Scholar] [CrossRef]
- Yuan, J.; Wang, Q.; Yang, D.; Liu, Q.; Zhima, Z.; Shen, X. Automatic Recognition Algorithm of Lightning Whistlers Observed by the Search Coil Magnetometer Onboard the Zhangheng-1 Satellite. Chin. J. Geophys. 2021, 64, 3905–3924. [Google Scholar] [CrossRef]
- Zhima, Z.; Hu, Y.; Shen, X.; Chu, W.; Piersanti, M.; Parmentier, A.; Zhang, Z.; Wang, Q.; Huang, J.; Zhao, S.; et al. Storm-Time Features of the Ionospheric ELF/VLF Waves and Energetic Electron Fluxes Revealed by the China Seismo-Electromagnetic Satellite. Appl. Sci. 2021, 11, 2617. [Google Scholar] [CrossRef]
- Elie, F.; Hayakawa, M.; Parrot, M.; Pinçon, J.-L.; Lefeuvre, F. Neural Network System for the Analysis of Transient Phenomena on Board the DEMETER Micro-Satellite. IEICE Trans. Fundam. Electron. Commun. Comput. Sci. 1999, 82, 1575–1581. [Google Scholar]
- Yuan, J.; Wang, Z.; Zeren, Z.; Wang, Z.; Feng, J.; Shen, X.; Wu, P.; Wang, Q.; Yang, D.; Wang, T.; et al. Automatic Recognition Algorithm of the Lightning Whistler Waves by Using Speech Processing Technology. Chin. J. Geophys. 2022, 65, 882–897. [Google Scholar] [CrossRef]
- Wang, Z.; Yi, J.; Yuan, J.; Hu, R.; Peng, X.; Chen, A.; Shen, X. Lightning-Generated Whistlers Recognition for Accurate Disaster Monitoring in China and Its Surrounding Areas Based on a Homologous Dual-Feature Information Enhancement Framework. Remote Sens. Environ. 2024, 304, 114021. [Google Scholar] [CrossRef]
Disclaimer/Publisher’s Note: The statements, opinions and data contained in all publications are solely those of the individual author(s) and contributor(s) and not of MDPI and/or the editor(s). MDPI and/or the editor(s) disclaim responsibility for any injury to people or property resulting from any ideas, methods, instructions or products referred to in the content. |
© 2024 by the authors. Licensee MDPI, Basel, Switzerland. This article is an open access article distributed under the terms and conditions of the Creative Commons Attribution (CC BY) license (https://creativecommons.org/licenses/by/4.0/).

