Article

Influence of Abnormal Eddies on Seasonal Variations in Sonic Layer Depth in the South China Sea

1
School of Marine Sciences, Sun Yat-sen University, and Southern Marine Science and Engineering Guangdong Laboratory (Zhuhai), Zhuhai 519020, China
2
Guangdong Provincial Key Laboratory of Marine Resources and Coastal Engineering School of Marine Sciences, Sun Yat-sen University, Guangzhou 510275, China
3
Key Laboratory of Science and Technology on Operational Oceanography, South China Sea Institute of Oceanology, Chinese Academy of Sciences, Guangzhou 510301, China
4
School of Ocean Engineering and Technology, Sun Yat-sen University, Zhuhai 519000, China
*
Author to whom correspondence should be addressed.
Remote Sens. 2024, 16(15), 2845; https://doi.org/10.3390/rs16152845
Submission received: 29 June 2024 / Revised: 22 July 2024 / Accepted: 30 July 2024 / Published: 2 August 2024
(This article belongs to the Special Issue Remote Sensing Applications in Ocean Observation (Third Edition))

Abstract

:
Sonic layer depth (SLD) is crucial in ocean acoustics research and profoundly influences sound propagation and Sonar detection. Carrying 90% of oceanic kinetic energy, mesoscale eddies significantly impact the propagation of acoustic energy in the ocean. Recent studies classified mesoscale eddies into normal eddies (warm anticyclonic and cold cyclonic eddies) and abnormal eddies (cold anticyclonic and warm cyclonic eddies). However, the influence of mesoscale eddies, especially abnormal eddies, on SLD remains unclear. Based on satellite altimeter and reanalysis data, we explored the influence of mesoscale eddies on seasonal variations in SLD in the South China Sea. We found that the vertical structures of temperature anomalies within the eddies had a significant impact on the sound speed field. A positive correlation between sonic layer depth anomaly (SLDA) and eddy intensity (absolute value of relative vorticity) was investigated. The SLDA showed significant seasonal variations: during summer (winter), the proportion of negative (positive) SLDA increased. Normal eddies (abnormal eddies) had a more pronounced effect during summer and autumn (spring and winter). Based on mixed-layer heat budget analysis, it was found that the seasonal variation in SLD was primarily induced by air–sea heat fluxes. However, for abnormal eddies, the horizontal advection and vertical convective terms modulated the variations in the SLDA. This study provides additional theoretical support for mesoscale eddy–acoustic coupling models and advances our understanding of the impact of mesoscale eddies on sound propagation.

1. Introduction

The sonic layer depth (SLD) represents the depth at which the speed of sound reaches its maximum in the ocean surface layer. Above this depth, the convergence zone for the propagation of acoustic energy is formed, which determines the cutoff frequency for sound wave propagation [1,2]. This significantly affects sound wave propagation and Sonar detection [3]. Research on SLD is also important in detecting and protecting marine animals. Active acoustic monitoring can detect marine mammals at distances of up to 2000 m, identifying 92% of observed cetaceans within SLD [4]. Anthropogenic sound sources within SLD cause slower sound level to decrease, severely impacting marine mammal populations due to behavioral and physiological effects [5] and even leading to the mass stranding of whales [6]. In addition, the SLD with maximum sound speed could influence the detection of underwater vehicles. Because of the strong correlation between the mixed layer depth (MLD) and SLD, the SLD is commonly assumed to be equivalent to the MLD in actions such as acoustic detection [7,8]. However, researchers have indicated that in certain regions, the SLD may vary because of temperature-induced sound speed variation [9]. Therefore, the calculation of SLD is a key issue in ocean acoustics research, marine animal protection, and underwater object detection.
The formation and variation in sound channels are influenced by various ocean dynamic processes, within which mesoscale eddies are crucial oceanic dynamic phenomena that significantly affect SLD [10,11,12]. It has been observed that eddies induce displacement of convergence zones and alterations of arrival sequences for different sound rays in multiple paths [13]. Mellberg used acoustic models to study the sound propagation characteristics of cold and warm eddies [14]. Simulations using the MMPE (Monterey–Miami parabolic equation) underwater sound field model demonstrated that mesoscale eddies influence the horizontal spatial distribution of the sound field [15]. The impact of mesoscale eddies on SLD was also supported by in situ observations [16]. Warm eddies cause a redistribution of sound energy, which means that the first sound energy convergence zone disappears, and a high-energy region appears at the typical location of the first shadow zone [17]. Using temperature–salinity (T/S) profiles from Argo floats and meteorological data from NCEP/NCAR and Quickscat, it was found that variations in net heat flux and wind were the primary factors regulating spatial and seasonal changes in SLD in the Arabian Sea [18]. Therefore, studying the impact of mesoscale eddies on SLD can provide a more solid theoretical foundation for sound propagation models and enable a more accurate estimation of changes in the sound field in practical acoustic detection work.
The impact of mesoscale eddies on SLD predominantly focuses on the influence of normal eddies. Here, normal anticyclonic (cyclonic) eddies are taken as the eddies with positive (negative) sea surface temperature anomalies (SSTAs) [19,20] and sea level anomalies (SLAs) [21]. Abnormal eddies are termed warm-core cyclonic eddies (WCE) and cold-core anticyclonic eddies (CAE), which are widespread in the ocean [22,23,24,25] and exhibit SLAs opposite to SSTAs [26,27,28]. AE and CE with positive (negative) SSTAs reinforce (weakened) vertical turbulent mixing and downward momentum transfer in the ocean [23,29,30,31], leading to deepening (shallowing) of the MLD [21,32,33,34], and are expected to deepen (shallow) SLD [35]. Abnormal eddies with shallow SST anomaly cores are different from normal eddies, which has been confirmed to affect the air–sea heat flux and convection [25,34,36], and this might have a significant influence on SLD. But how abnormal eddies influence SLD and how much they contribute to the variations in SLD are still unclear.
In this study, by distinguishing between normal and abnormal eddies, we investigated the seasonal variations in SLD and further revealed the modulation mechanisms of how mesoscale eddies influence the formation and changes in SLD across different spatial and temporal scales. Data and methods are in Section 2, spatiotemporal variations in SLD are presented in Section 3, and the possible mechanisms of SLD variation are discussed in Section 4.

2. Data and Methods

2.1. Construction of Three-Dimensional Sound Speed Field

We calculated the three-dimensional sound speed field by employing the Chen and Millero empirical formula [37], which is applicable to the South China Sea [38]. These formulas represent sound speed as a function of temperature, salinity, and pressure and can be expressed by the following equation:
c S , T , P = A T , P S + B T , P S 3 / 2 + C P S 2 + D T , S
A = ( 9.4742 × 10 5 1.2580 × 10 5 T 6.4885 × 10 8 T 2 + 1.0507 × 10 8 T 3 2.0122 × 10 10 T 4 ) P + ( 3.9064 × 10 7 + 9.1041 × 10 9 T 1.6002 × 10 10 T 2 + 7.988 × 10 12 T 3 ) P 2 + ( 1.100 × 10 10 + 6.649 × 10 12 T 3.389 × 10 13 T 2 ) P 3
B = 7.3637 × 10 5 + 1.7945 × 10 7 T P
C = 7.9836 × 10 6 P
D = 1.389 1.262 × 10 2 T + 7.164 × 10 5 T 2 + 2.006 × 10 6 T 3 3.21 × 10 8 T 4 S + 1.9222 × 10 2 4.42 × 10 5 T 3 2 + 1.727 × 10 3 S 2
where A , B , C ,   and   D are parameters related to salinity, temperature, and pressure, which are represented as   S x , y , z , t , T x , y , z , t , and P x , y , z , t , respectively. Three-dimensional temperature and salinity data were obtained from the Copernicus Marine Environment Monitoring Service (CMEMS, DOI: 10.48670/moi-00021 (accessed on 8 January 2024)), which provides global ocean reanalysis products. We used the daily 1/12° × 1/12° temperature, salinity, and velocity data from 1993 to 2018.

2.2. SLD Anomaly (SLDA)

The SLD is defined as the depth at which the maximum sound speed occurs, S L D x , y , t = z ( m a x i m u m   c   x , y , z , t . We then derived the daily grid data of the SLD, with a spatial resolution of 1/12°. The SLDA was quantified following [21],
S L D A x , y , t = S L D x , y , t S L D ¯   x , y , m
where S L D ¯ is the climatological mean value of S L D at the same location   x , y and month m . A positive SLDA indicates that the sonic layer is deeper than the climatological value, while a negative SLDA indicates that the sonic layer is shallower than the climatological value.

2.3. Identification of Eddies

The winding-angle (WA) algorithm, based on the geometric characteristics of ocean streamlines, was employed for the automated identification of eddies. This algorithm exhibits high accuracy and reliability [39,40]. The daily SLA, geostrophic current velocity, and geostrophic current velocity anomalies used in the algorithm were obtained from the Archiving, Validation, and Interpretation of Satellite Oceanographic Data (AVISO). This product merges data from various altimeter satellites, including TOPEX/Poseidon, Jason-1 and 2, and so on. The resolution of the data was 0.25°. In this study, we used data covering the period from 1993 to 2018. We obtained the eddy’s position, radius, and relative vorticity, ξ = v / x u / y , where u and v are the zonal and meridional velocities, respectively. In this study, the absolute value of the average relative vorticity ξ was defined as the eddy intensity, quantifying the dynamic impact of eddies on the SLD.
To identify abnormal eddies, we first classified eddies using AVISO SLA data. Normal anticyclonic (cyclonic) eddies are characterized by positive (negative) SSTAs and SLAs [19,20,21]. We then utilized SST data from CEMES to calculate the SSTAs for each identified eddy. Eddies were classified as abnormal ones if their SSTAs and SLAs were negatively correlated. That is, if an anticyclonic eddy showed a negative SSTA or a cyclonic eddy showed a positive SSTA, it was classified as an abnormal eddy. This approach ensured that our classification captured the distinct thermal and dynamic characteristics of abnormal eddies, which are crucial for understanding their impact on the SLD.

2.4. SLD Heat Budget Equation

Because the speed of sound propagation is significantly influenced by the upper ocean temperature [3,41], the SLD also strongly relies on temperature [7]. Therefore, the heat budget equation within the sonic layer was used to explore the primary mechanisms of the SLD variation, which is expressed as follows [42]:
ρ 0 C p h T t = Q n e t ρ 0 C p h u T x + v T y ρ 0 C p H w T m T h + R e s i d u a l
Here, the heat content variation is on the left. The first, second, third, and fourth terms on the right-hand side represent the net heat flux, horizontal advection, vertical advection, and residual terms, respectively. ρ 0 is the water density (1024 kg/m3), h is the SLD, and C p is the seawater specific heat capacity (4000 J/(kg·K)).
The net surface heat flux is denoted as
Q n e t = Q L W R + Q S W R + Q S H F + Q L H F  
which is the sum of the net shortwave radiation ( Q S W R ), net longwave radiation ( Q L W R ), sensible heat flux ( Q S H F ), and latent heat flux ( Q L H F ). These surface heat fluxes data were obtained from the European Center for Medium-Range Weather Forecasts (ECMWF, DOI: 10.24381/cds.adbb2d47 (accessed on 26 February 2024)) with a resolution of 0.25° × 0.25°.
The horizontal advection term was determined by the horizontal temperature gradient ( T x , T y ) and the horizontal current velocity ( u , v ). The vertical transport term was influenced by the vertical velocity ( w ) and vertical temperature differences T m T h . Here, T m is the temperature just above the SLD, and T h is the temperature 5 m below the SLD. The vertical velocity, w , includes the Ekman pumping velocity, w e = × τ ρ f , and the temporal trend of SLD, w h = h t . τ is the wind stress. H is a Heaviside step function: when w e > 0, the water masses were entrained into the mixed layer, and we set H as 1; when w e < 0, the vertical transport did not significantly alter seawater temperature, and we set H as 0. The last term in Equation (3) is the residual term, which is influenced by eddy diffusion, entrainment, etc.

3. Spatiotemporal Characteristics of SLD Induced by Abnormal Eddy

3.1. Spatial Distribution of SLD Induced by Abnormal Eddy

The mean temperature anomaly and SLD are shown in Figure 1. Here, a temperature anomaly is defined as the temperature minus the climatical mean value. For AE (CE), temperature anomalies increase (decrease) as depth increases, and only one maxima sound speed axis appears. But for abnormal eddies of CAE (WCE), one surface cold core (warm core) and one subsurface warm core (cold core) appear, causing two maxima sound speeds (dashed blue lines in Figure 1e,f). The SLDs of AE and CAE were larger than those of the CE and WCE. In abnormal eddies, the presence of multiple cores with temperature differences between the warm and cold cores makes the sound speed field more complex.
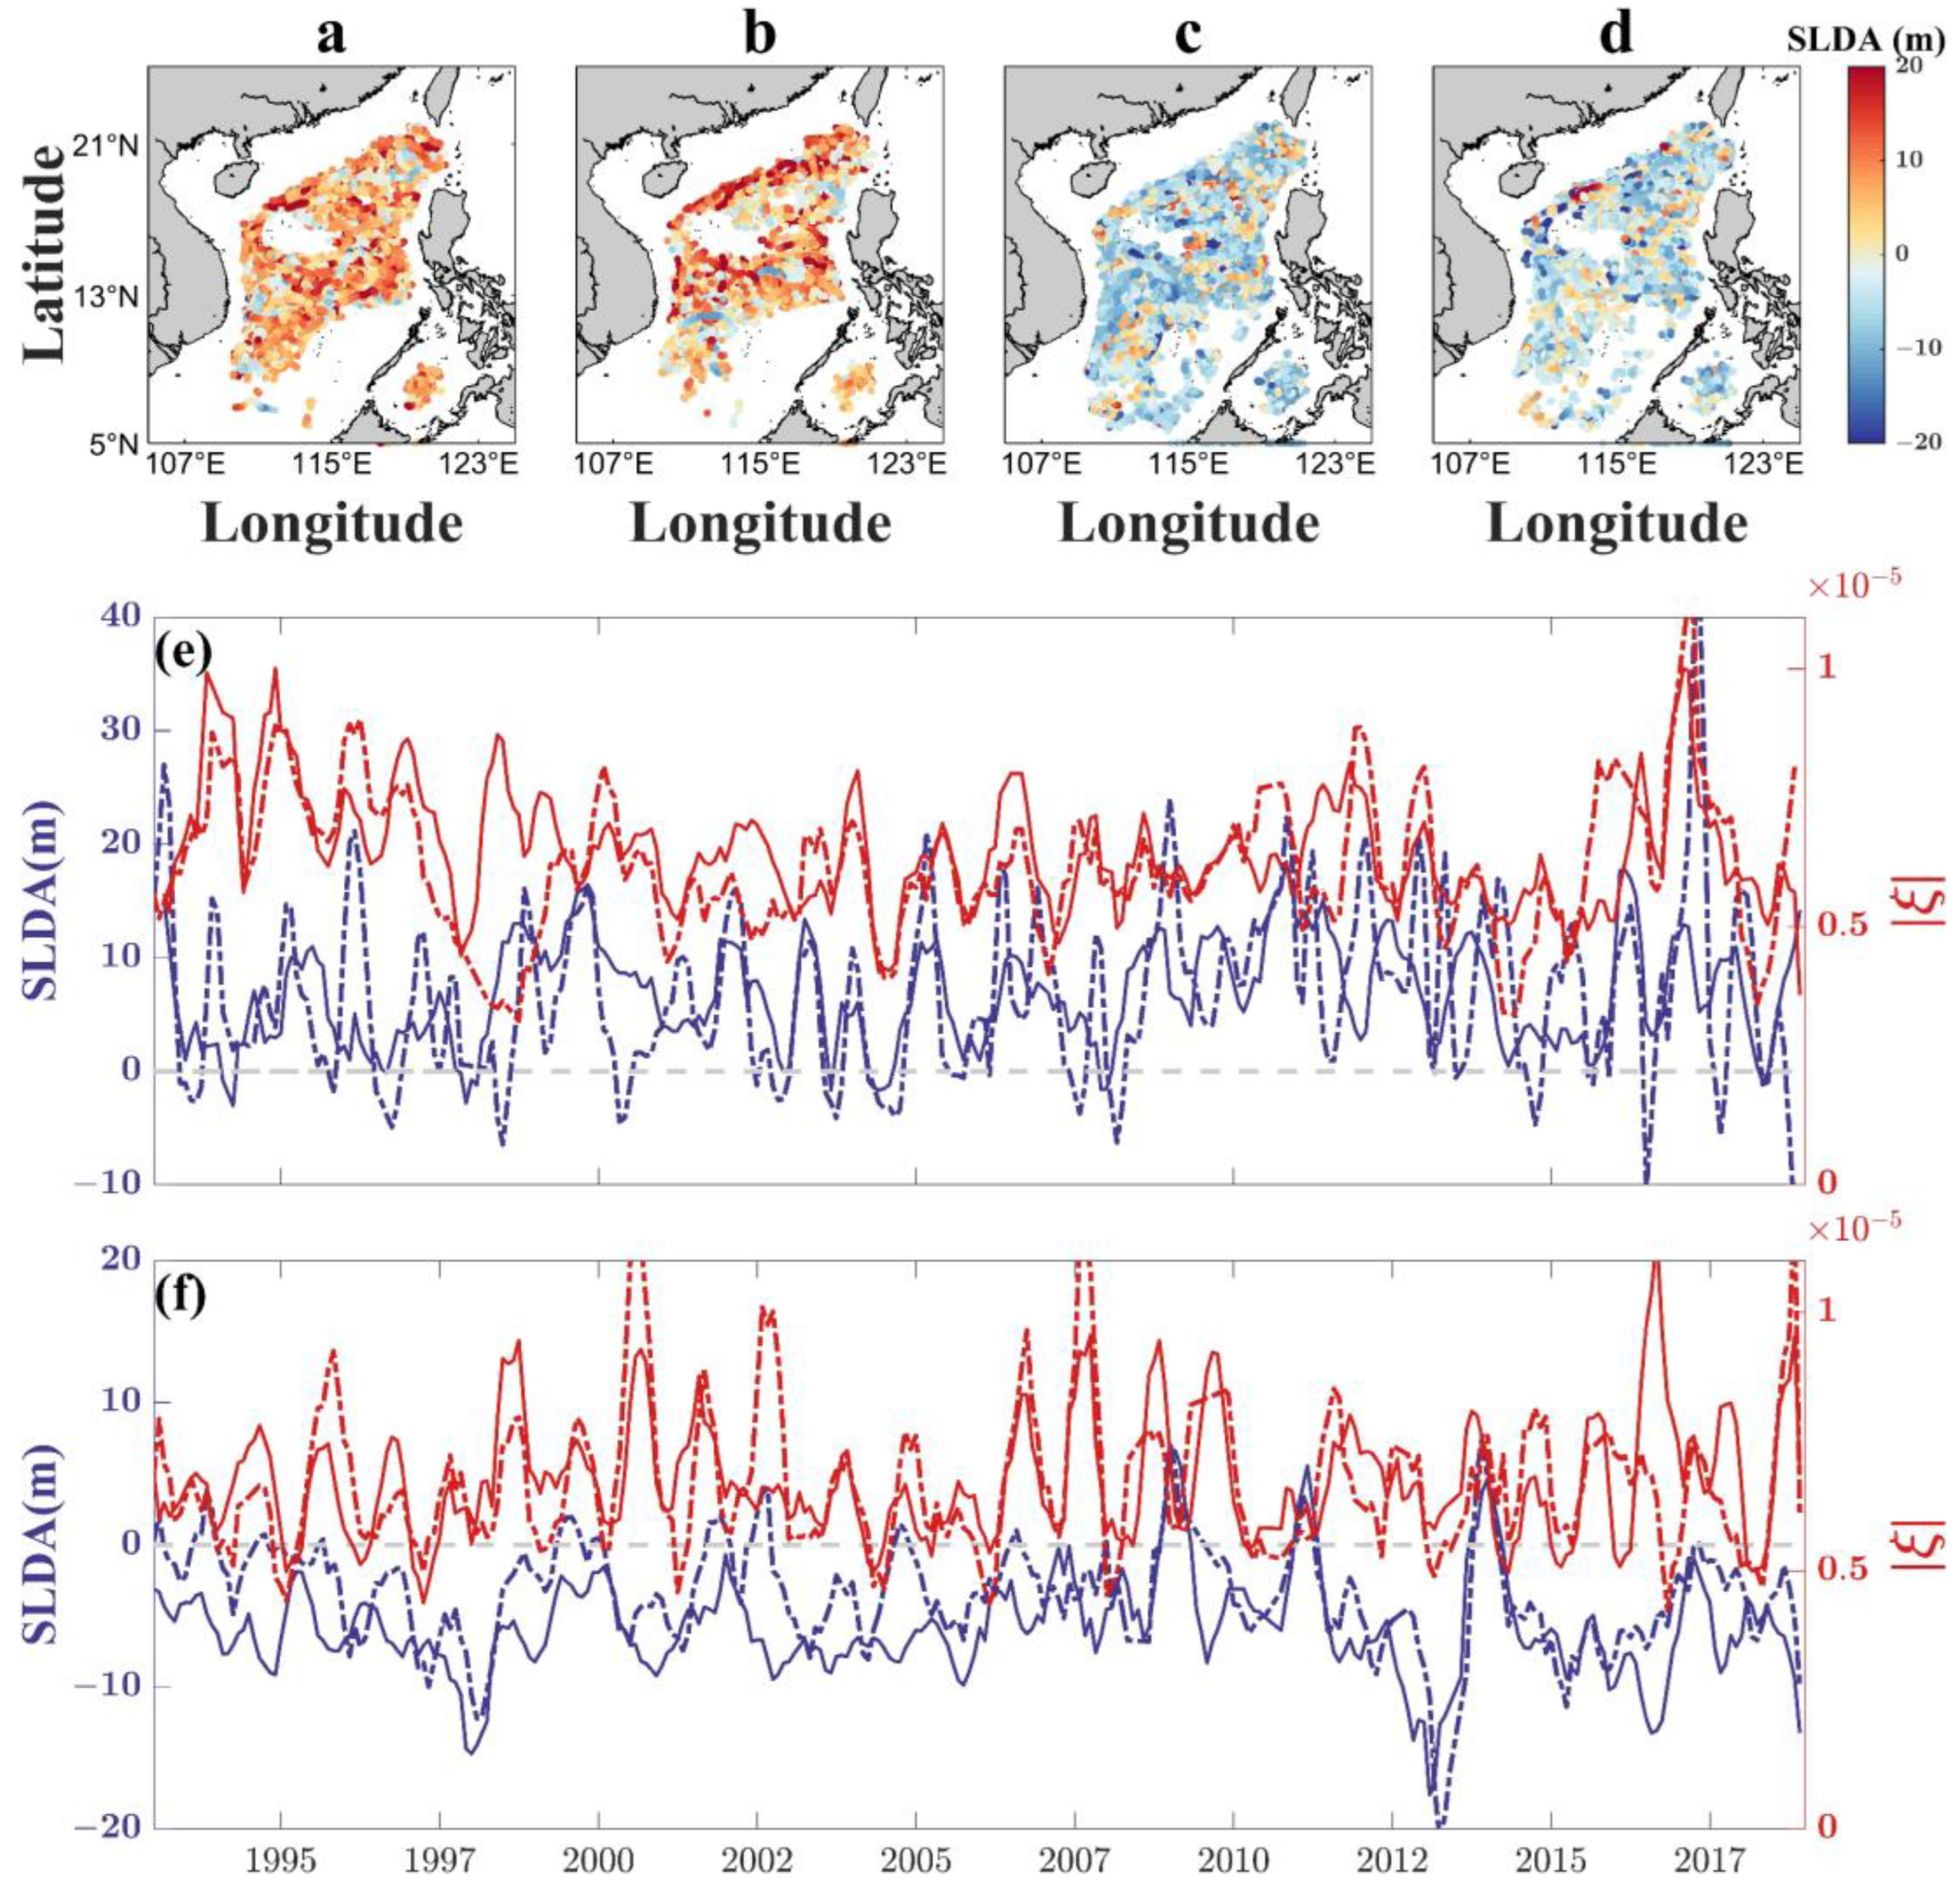
From 1993 to 2018, 17,292 AE snapshots, 9735 CAE snapshots, 25,510 CE snapshots, and 11,991 WCE snapshots were identified. CAEs accounted for 36% of the total anticyclonic eddies, while WCEs represented 32% of the total cyclonic eddies. More cyclonic eddies were identified than anticyclonic eddies. According to Figure 2a–d, more positive SLDAs were in AE and CAE, and more negative SLDAs in CE and WCE, suggesting that the SLD was influenced by the dynamic characteristics of the eddy.
Figure 2e,f illustrate that SLDAs were mainly distributed within the range of ±30 m and positively correlated with the eddy intensities; that is, the stronger the mesoscale eddies, the deeper the SLD. Although the fluctuations in the SLDA induced by CE (AE) and WCE (CAE) exhibited a similar trend, the amplitude of the SLDA induced by CAE (WCE) was larger than that induced by AE (CE), indicating that abnormal eddies strengthened the SLDA, especially during the period with peak values. For example, in 2017, significant SLDA fluctuations (>40 m) occurred for the CAE, which may have been associated with the El Niño event.

3.2. Seasonal Variation in SLDA Induced by Abnormal Eddies

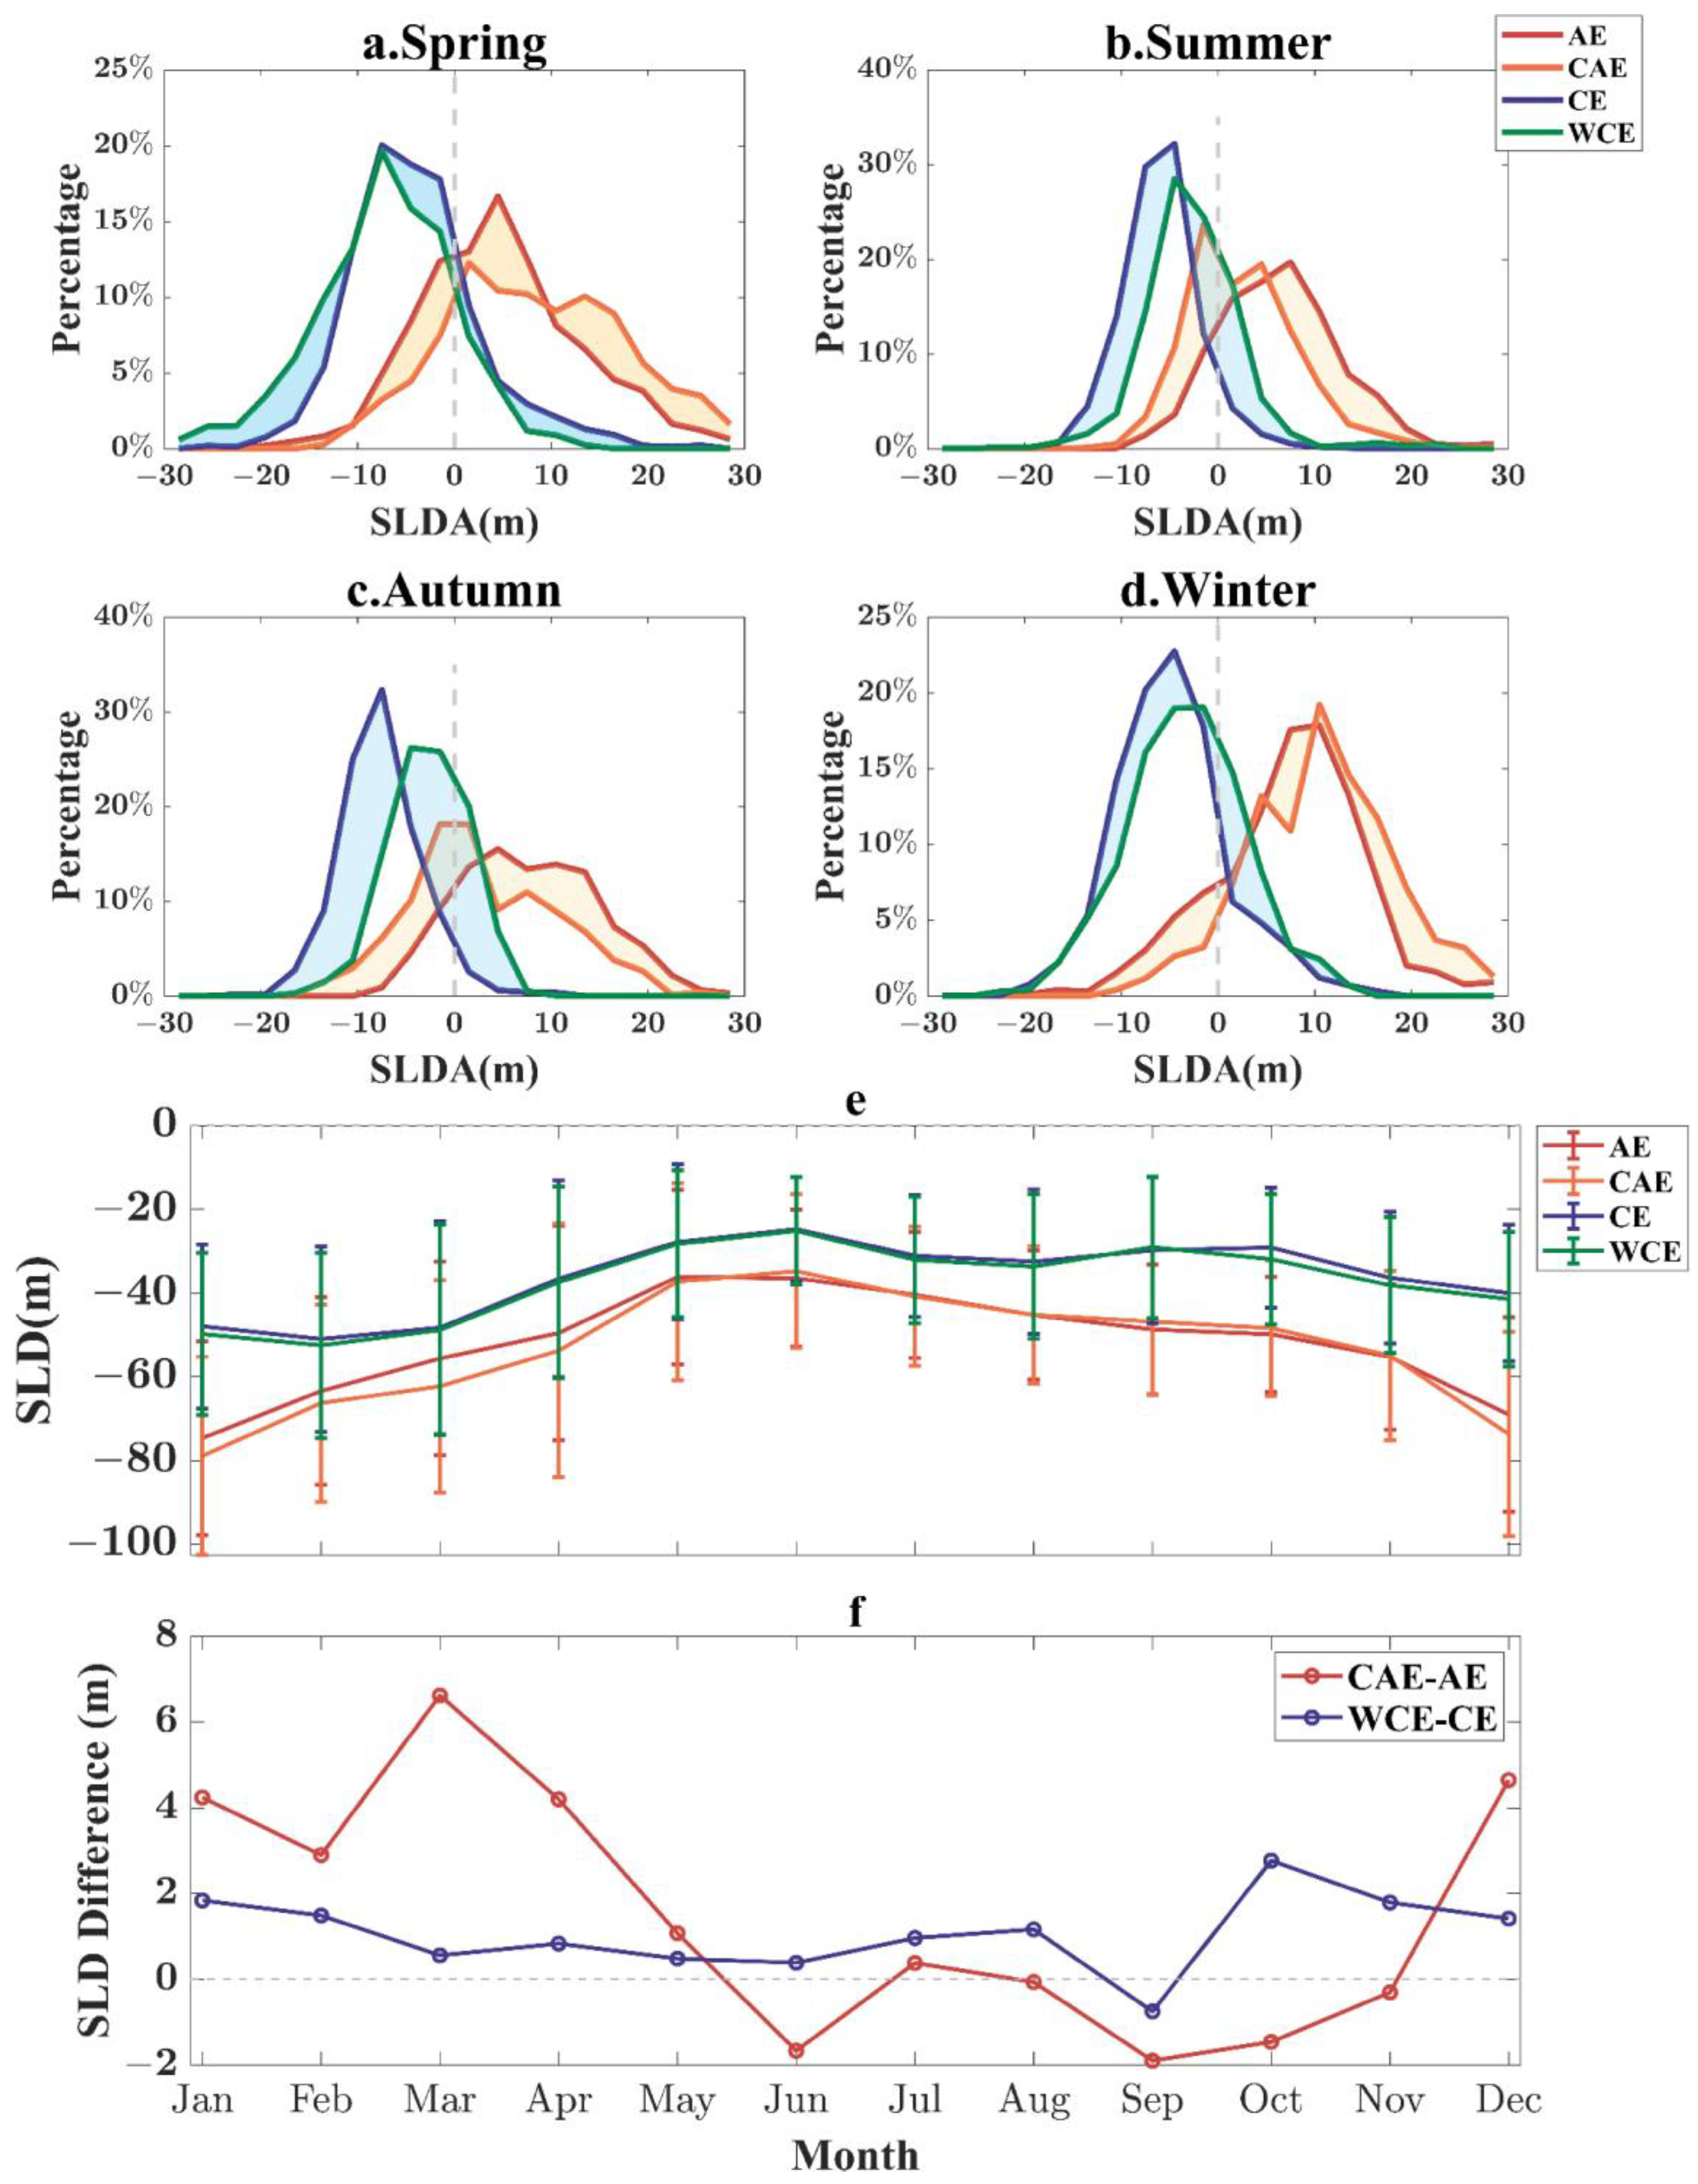
Figure 3 shows the seasonal variation in the SLDA. The mean SLDAs in both the AE and CAE were positive. Except in spring, the percentage of lower SLDA in CAE was larger than that in AE. The mean values of SLDA for CE and WCE were negative. The percentage of higher SLDA for WCE was lower than CE, except in spring. This indicates that the abnormal eddies enhanced the SLD in spring and weakened the SLD in other seasons.
As depicted in Figure 3e, the SLD fluctuated between 0 and 110 m throughout the year, reaching its deepest value in winter and shallowest in summer. The maximum SLD for CAE was approximately 110 m, and the shallowest value for CE was 13 m. Figure 3f displays the monthly SLD difference between abnormal eddies and normal eddies. In spring and winter, the SLD induced by CAE was deeper than that induced by AE. The SLD difference between WCE and CE exhibited relatively small values.
Overall, anticyclonic eddies (AE and CAE) deepened the SLD, while cyclonic eddies (CE and WCE) caused shallower SLD. However, more than 20% of anticyclonic (cyclonic) eddies induced negative (positive) SLDA. This phenomenon contradicts the widely accepted view that anticyclonic eddies deepen SLD, while cyclonic eddies cause shallowing, as suggested in previous studies [13,16,35]. The percentage of negative (positive) SLDA increased in summer (winter) for all eddies, while abnormal eddies exhibited a more prominent influence in spring.

3.3. Mechanism of Seasonal Variations in SLD

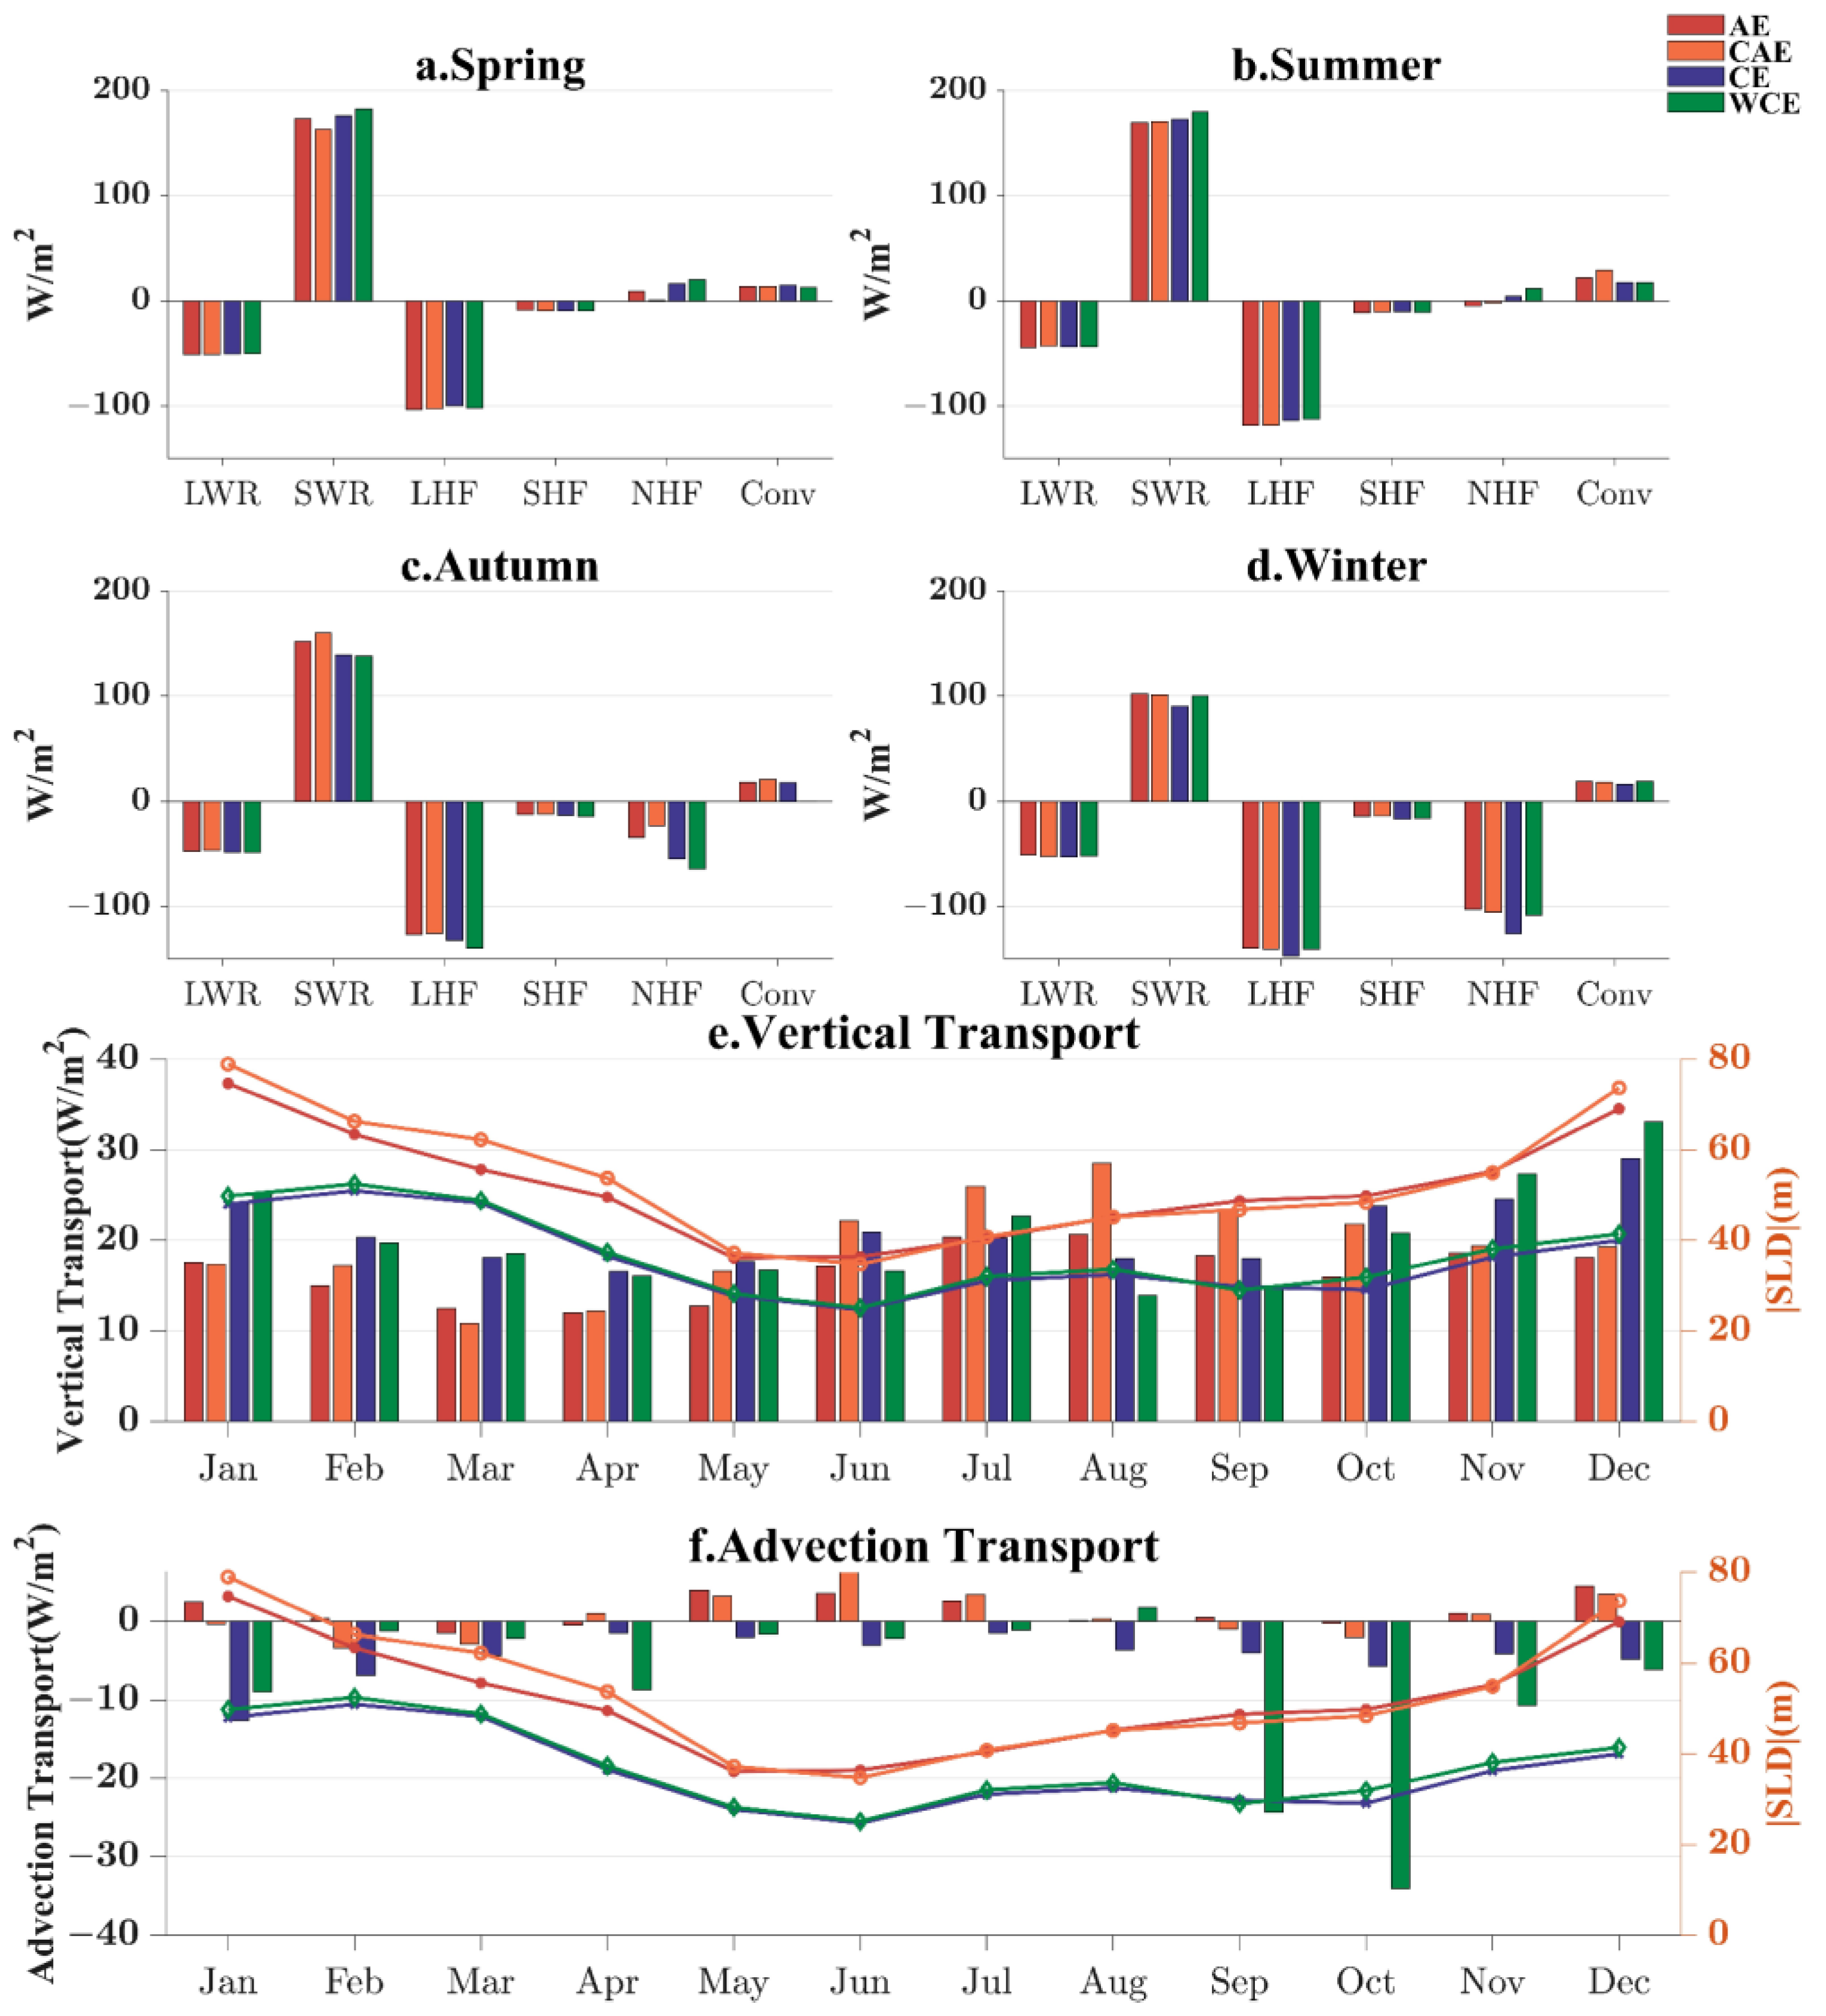
To reveal the mechanisms of SLD variation, the heat budget within the sonic layer is presented in Figure 4. The SLDA was strongest in winter and weakest in summer. In the heat budget balance, shortwave radiation fluxes (SWR) and latent heat fluxes (LHF) were the largest two terms and exhibited significant discrepancies in summer and winter.
The absolute value of LHF increased from spring to winter. From summer to autumn, positive SSTA may enhance the evaporation rate within anticyclonic eddies via vertical mixing [43,44], favoring the release of LHF. In winter, increased wind speed may have accelerated the large value of LHF (−141.7 W/m2), by promoting heat and moisture exchange between the atmosphere and the ocean. This large value of LHF caused the SST to decrease quickly in turn, resulting in deepening the SLD.
The NHF terms exhibit distinct seasonal variations and serve as determining factors for seasonal changes in SLD. The SSTAs within normal anticyclonic eddies (cyclonic eddies) are positive (negative), leading to an increase (decrease) in the sea–air heat flux [19,20], which has been suggested to deepen (shallow) the MLD [21,34,36]. During winter (summer), the absolute value of NHF increased (decreased) in our study area (Figure 4d), which was favorable for reinforcing (suppressing) the convective action of seawater [21,29,33], resulting in SLD deepening (shallowing) (in Figure 4e). Here, the convective term is defined as the sum of vertical and horizontal transport terms.
As shown in Figure 3f and Figure 4a, CAE caused the SLD to deepen, but the air–sea fluxes were relatively weaker in spring. Hence, we deduce that the ocean dynamic process may also be important for SLD changes. We further analyzed the heat contributions of vertical and horizontal advection transports, as shown in Figure 4e,f. The variations in the |SLD| were closely correlated with the changes in the contributions from vertical transport. Positive horizontal advection terms were in both AE and CAE, while negative horizontal advection terms were in CE and WCE. There was a stronger vertical advection term in CAE than that induced by AE in May–October, which may have been caused by stronger vertical entrainment due to Ekman pumping. The generation of abnormal eddies can be attributed to wind-induced Ekman pumping and vertical mixing [45], which could explain our result. The surface cold core and subsurface warm core in CAE enlarges the temperature difference between T m and T h , which favors vertical convection and increases the probability of merging with surface water masses around the subsurface core of abnormal eddies [46]. This process may cause CAE to be more effective in deepening the SLD compared to AE. In contrast, WCE has a surface warm core and subsurface cold core, enhancing the vertical stratification and causing weaker vertical convection than CE. During autumn, we identified significant differences in the advection effects of WCE and CE. The WCE exhibited larger negative advection values, indicating substantial horizontal heat transfer from the warm-core regions to the surrounding cooler waters. This intense heat transfer led to a more uniform temperature distribution around the WCE, resulting in the formation of SLD at shallower depths.
The SLA differences between abnormal eddies and normal eddies were most pronounced in spring. We further explain the influence of abnormal eddies on SLD in spring in Figure 5. Less NHFs were input to the CAE, enhancing the vertical mixing effects during spring and winter, leading to the deepening of the SLD. In addition, the vertical structures of the surface cold core and subsurface warm core also decreased the vertical stratification, and deepened the SLD. In reverse, WCE caused a shallower SLD. This finding complements previous research that a weakening of the impact of abnormal eddies on MLD was found in global ocean regions [34]. Statistical analysis provided evidence that the distinctive vertical structure of abnormal eddies is a key factor causing the deepening of the ocean mixed layer [36].

4. Conclusions and Discussions

This study investigated the seasonal variation in SLD and revealed the mechanisms of SLD related to mesoscale eddies in the SCS. Compared to a normal eddy with one eddy core, an abnormal eddy exhibits two eddy cores in the vertical direction, which significantly affect the distribution of the sound speed field. Statistically, a positive correlation coefficient between the SLDA and eddy intensity was found, indicating that weaker eddies can lead to negative SLDAs, while stronger eddies result in positive SLDAs. The seasonal distribution of these anomalies showed an increase in the negative (positive) SLDA during the summer (winter).
Through a heat budget analysis, we examined the mechanisms of seasonal variation in the SLDA. It was found that the NHF dominated the seasonal variation in SLDA, yet does not fully account for extreme SLDA in spring and winter. Instead, the vertical and horizontal advections contribute to variations in the eddy vertical structure. Less (more) NHFs are input within CAE(WCE), leading to stronger (weaker) convection, enhancing vertical mixing(stratification), and consequently deepening (shallowing) the SLD. This quantification may have some uncertainties due to the eddies’ properties, such as the vertical tilt, the appearance of subsurface eddies, and so on. These uncertainties merit future studies.
By quantifying SLD changes, this study demonstrated how mesoscale eddies influence sound energy propagation. These findings offer theoretical support for coupling mesoscale eddies with acoustic models, providing further insights into the complex interactions between mesoscale eddies and underwater acoustics. Moreover, this study provides potential dynamics to predict the activity of marine life and is helpful in developing political plans for protecting marine animals.

Author Contributions

The study was conceived and designed by X.L. and C.Q. The data were collected and processed by X.L. and T.W. X.L. conducted the data analysis, interpreted the results, and drafted the manuscript. C.Q. supervised the study and provided critical writing suggestions and edits. H.M. and P.X. offered English language improvements. All authors have read and agreed to the published version of the manuscript.

Funding

This research was funded by National Key Research and Development Program of China (Grant No. 2023YFC3107800) and National Natural Science Foundation of China (Grant No. 42376011). The APC was funded by National Natural Science Foundation of China (Grant No. 42376011).

Data Availability Statement

Oceanographic data that support the findings of this study are available from the CMEMS. These datasets can be accessed through the Copernicus Marine Service (http://marine.copernicus.eu). Sea level anomaly and surface geostrophic velocity anomaly data, crucial for eddy identification, are available from the AVISO project (http://www.aviso.oceanobs.com). Atmospheric reanalysis data used in this study are sourced from the ECMWF. The data contributing to this research can be found at the ECMWF data portal, available at https://www.ecmwf.int.

Conflicts of Interest

The authors have no relevant financial or non-financial interests to disclose.

References

  1. Jensen, F.B.; Kuperman, W.A.; Porter, M.B.; Schmidt, H. Fundamentals of Ocean Acoustics. In Computational Ocean Acoustics, Modern Acoustics and Signal Processing; Jensen, F.B., Kuperman, W.A., Porter, M.B., Schmidt, H., Eds.; Springer: New York, NY, USA, 2011; pp. 1–64. ISBN 978-1-4419-8678-8. [Google Scholar] [CrossRef]
  2. Lim, S. A study on the sonic layer depth and the cutoff frequency in the East Sea/Japan Sea. In Proceedings of the OCEANS 2014—TAIPEI, Taipei, Taiwan, China, 7–10 April 2014; pp. 1–5. [Google Scholar] [CrossRef]
  3. Colosi, J.A.; Rudnick, D.L. Observations of upper ocean sound-speed structures in the North Pacific and their effects on long-range acoustic propagation at low and mid-frequencies. J. Acoust. Soc. Am. 2020, 148, 2040–2060. [Google Scholar] [CrossRef] [PubMed]
  4. Pyc, C.D.; Geoffroy, M.; Knudsen, F.R. An evaluation of active acoustic methods for detection of marine mammals in the Canadian Beaufort Sea. Mar. Mamm. Sci. 2016, 32, 202–219. [Google Scholar] [CrossRef]
  5. Tyack, P.L. Implications for marine mammals of large-scale changes in the marine acoustic environment. J. Mammal. 2008, 89, 549–558. [Google Scholar] [CrossRef]
  6. D’Spain, G.L.; D’Amico, A.; Fromm, D.M. Properties of the underwater sound fields during some well documented beaked whale mass stranding events. J. Cetacean Res. Manage. 2005, 7, 223–238. [Google Scholar] [CrossRef]
  7. Bhaskar, T.U.; Swain, D. Relation between Sonic Layer and Mixed layer depth in the Arabian Sea. Indian J. Geo-Mar. Sci. 2016, 45, 1264–1271. [Google Scholar]
  8. Lim, S. Analysis of Differences between the Sonic Layer Depth and the Mixed Layer Depth in the East Sea. J. Korea Inst. Inf. Commun. Eng. 2015, 19, 1259–1268. [Google Scholar] [CrossRef]
  9. Helber, R.W.; Barron, C.N.; Carnes, M.R.; Zingarelli, R.A. Evaluating the sonic layer depth relative to the mixed layer depth. J. Geophys. Res. Ocean. 2008, 113, 1–14. [Google Scholar] [CrossRef]
  10. Mercer, J.A.; Booker, J.R. Long-range propagation of sound through oceanic mesoscale structures. J. Geophys. Res. 1983, 88, 689–699. [Google Scholar] [CrossRef]
  11. Liu, J.; Piao, S.; Gong, L.; Zhang, M.; Guo, Y.; Zhang, S. The Effect of Mesoscale Eddy on the Characteristic of Sound Propagation. J. Mar. Sci. Eng. 2021, 9, 787. [Google Scholar] [CrossRef]
  12. Chen, W.; Zhang, Y.; Liu, Y.; Ma, L.; Wang, H.; Ren, K.; Chen, S. Parametric Model for Eddies-Induced Sound Speed Anomaly in Five Active Mesoscale Eddy Regions. J. Geophys. Res. Ocean. 2022, 127, e2022JC018408. [Google Scholar] [CrossRef]
  13. Munk, W.H. Horizontal Deflection of Acoustic Paths by Mesoscale Eddies. J. Phys. Oceanogr. 1980, 10, 596–604. [Google Scholar] [CrossRef]
  14. Mellberg, L.E.; Johannessen, O.M.; Connors, D.N.; Botseas, G.; Browning, D. Modeled acoustic propagation through an ice edge eddy in the East Greenland Sea Marginal Ice Zone. J. Geophys. Res. Ocean. 1987, 92, 6857–6868. [Google Scholar] [CrossRef]
  15. Li, J.; Zhang, R.; Chen, Y.; Jin, B. Ocean mesoscale eddy modeling and its application in studying the effect on underwater acoustic propagation. J. Ocean. Technol. 2011, 30, 37–46. [Google Scholar]
  16. Zhu, F.; Zhang, H.; Qu, K. Influence of mesoscale warm eddies on sound propagation in the northeastern South China Sea. J. Harbin Eng. Univ. 2021, 42, 1496–1502. Available online: http://www.cnki.net/kcms/detail/23.1390.u.20210702.1704.008.html (accessed on 16 July 2021).
  17. Wu, Y.; Qin, J.; Li, Z.; Wu, S.; Wang, M.; Li, W.; Guo, Y. Warm-core eddy effects on sound propagation in the South China sea. Appl. Acoust. 2023, 211, 109551. [Google Scholar] [CrossRef]
  18. Udaya Bhaskar, T.; Swain, D.; Ravichandran, M. Seasonal variability of sonic layer depth in the Central Arabian Sea. Ocean Sci. J. 2008, 43, 147–152. [Google Scholar] [CrossRef]
  19. Hausmann, U.; Czaja, A. The observed signature of mesoscale eddies in sea surface temperature and the associated heat transport. Deep. Sea Res. Part I Oceanogr. Res. Pap. 2012, 70, 60–72. [Google Scholar] [CrossRef]
  20. Villas Bôas, A.B.; Sato, O.T.; Chaigneau, A.; Castelão, G.P. The signature of mesoscale eddies on the air-sea turbulent heat fluxes in the South Atlantic Ocean. Geophys. Res. Lett. 2015, 42, 1856–1862. [Google Scholar] [CrossRef]
  21. Gaube, P.; McGillicuddy, D.J., Jr.; Moulin, A.J. Mesoscale Eddies Modulate Mixed Layer Depth Globally. Geophys. Res. Lett. 2019, 46, 1505–1512. [Google Scholar] [CrossRef]
  22. Liu, Y.; Yu, L.; Chen, G. Characterization of Sea Surface Temperature and Air-Sea Heat Flux Anomalies Associated With Mesoscale Eddies in the South China Sea. JGR Ocean. 2020, 125, e2019JC015470. [Google Scholar] [CrossRef]
  23. Ni, Q.; Zhai, X.; Wang, G.; Hughes, C.W. Widespread Mesoscale Dipoles in the Global Ocean. J. Geophys. Res. Ocean. 2020, 125, e2020JC016479. [Google Scholar] [CrossRef]
  24. Liu, Y.; Zheng, Q.; Li, X. Characteristics of Global Ocean Abnormal Mesoscale Eddies Derived From the Fusion of Sea Surface Height and Temperature Data by Deep Learning. Geophys. Res. Lett. 2021, 48, e2021GL094772. [Google Scholar] [CrossRef]
  25. Ni, Q.; Zhai, X.; Jiang, X.; Chen, D. Abundant Cold Anticyclonic Eddies and Warm Cyclonic Eddies in the Global Ocean. J. Phys. Oceanogr. 2021, 51, 2793–2806. [Google Scholar] [CrossRef]
  26. Bashmachnikov, I.; Boutov, D.; Dias, J. Manifestation of two meddies in altimetry and sea-surface temperature. Ocean. Sci. 2013, 9, 249–259. [Google Scholar] [CrossRef]
  27. Assassi, C.; Morel, Y.; Vandermeirsch, F.; Chaigneau, A.; Pegliasco, C.; Morrow, R.; Colas, F.; Fleury, S.; Carton, X.; Klein, P.; et al. An Index to Distinguish Surface- and Subsurface-Intensified Vortices from Surface Observations. J. Phys. Oceanogr. 2016, 46, 2529–2552. [Google Scholar] [CrossRef]
  28. Dilmahamod, A.F.; Aguiar-González, B.; Penven, P.; Reason, C.J.C.; De Ruijter, W.P.M.; Malan, N.; Hermes, J.C. SIDDIES Corridor: A Major East-West Pathway of Long-Lived Surface and Subsurface Eddies Crossing the Subtropical South Indian Ocean. J. Geophys. Res. Ocean. 2018, 123, 5406–5425. [Google Scholar] [CrossRef]
  29. Williams, R.G. Modification of ocean eddies by air-sea interaction. J. Geophys. Res. Ocean. 1988, 93, 15523–15533. [Google Scholar] [CrossRef]
  30. Chelton, D.; Xie, S.-P. Coupled Ocean-Atmosphere Interaction at Oceanic Mesoscales. Oceanography 2010, 23, 52–69. [Google Scholar] [CrossRef]
  31. Frenger, I.; Gruber, N.; Knutti, R.; Münnich, M. Imprint of Southern Ocean eddies on winds, clouds and rainfall. Nat. Geosci. 2013, 6, 608–612. [Google Scholar] [CrossRef]
  32. Dufois, F.; Hardman-Mountford, N.J.; Greenwood, J.; Richardson, A.J.; Feng, M.; Matear, R.J. Anticyclonic eddies are more productive than cyclonic eddies in subtropical gyres because of winter mixing. Sci. Adv. 2016, 2, e1600282. [Google Scholar] [CrossRef]
  33. Hausmann, U.; McGillicuddy, D.J., Jr.; Marshall, J. Observed mesoscale eddy signatures in Southern Ocean surface mixed-layer depth. J. Geophys. Res. Ocean. 2017, 122, 617–635. [Google Scholar] [CrossRef]
  34. Hao, J.; Yang, J.; Chen, G. The effect of normal and abnormal eddies on the mixed layer depth in the global ocean. Front. Mar. Sci. 2023, 9, 981505. [Google Scholar] [CrossRef]
  35. Chen, C.; Jin, T.; Zhou, Z. Effect of eddy on acoustic propagation from the surface duct perspective. Appl. Acoust. 2019, 150, 190–197. [Google Scholar] [CrossRef]
  36. Barboni, A.; Coadou-Chaventon, S.; Stegner, A.; Le Vu, B.; Dumas, F. How subsurface and double-core anticyclones intensify the winter mixed-layer deepening in the Mediterranean Sea. Ocean. Sci. 2023, 19, 229–250. [Google Scholar] [CrossRef]
  37. Chen, C.-T.; Millero, F.J. Speed of sound in seawater at high pressures. J. Acoust. Soc. Am. 1977, 62, 1129–1135. [Google Scholar] [CrossRef]
  38. Wu, B.; Chen, C.; Lin, L. Analysis of applicable scope of empirical equation for sound velocity. Tech. Acoust. 2014, 33, 504–507. [Google Scholar] [CrossRef]
  39. Chaigneau, A.; Gizolme, A.; Grados, C. Mesoscale eddies off Peru in altimeter records: Identification algorithms and eddy spatio-temporal patterns. Prog. Oceanogr. 2008, 79, 106–119. [Google Scholar] [CrossRef]
  40. Qiu, C.; Yang, Z.; Wang, D.; Feng, M.; Su, J. The Enhancement of Submesoscale Ageostrophic Motion on the Mesoscale Eddies in the South China Sea. J. Geophys. Res. Ocean. 2022, 127, e2022JC018736. [Google Scholar] [CrossRef]
  41. Richards, E.L.; Colosi, J.A. Observations of ocean spice and isopycnal tilt sound-speed structures in the mixed layer and upper ocean and their impacts on acoustic propagation. J. Acoust. Soc. Am. 2023, 154, 2154–2167. [Google Scholar] [CrossRef]
  42. Qiu, B. Interannual Variability of the Kuroshio Extension System and Its Impact on the Wintertime SST Field. J. Phys. Oceanogr. 2000, 30, 1486–1502. [Google Scholar] [CrossRef]
  43. Sun, S.; Fang, Y.; Liu, B.; Tana, C. Coupling between SST and wind speed over mesoscale eddies in the South China Sea. Ocean. Dyn. 2016, 66, 1467–1474. [Google Scholar] [CrossRef]
  44. Liu, H.; Li, W.; Chen, S.; Fang, R.; Li, Z. Atmospheric Response to Mesoscale Ocean Eddies over the South China Sea. Adv. Atmos. Sci. 2018, 35, 1189–1204. [Google Scholar] [CrossRef]
  45. Ni, Q.; Zhai, X.; Yang, Z.; Chen, D. Generation of Cold Anticyclonic Eddies and Warm Cyclonic Eddies in the Tropical Oceans. J. Phys. Oceanogr. 2023, 53, 1485–1498. [Google Scholar] [CrossRef]
  46. de Marez, C.; Le Corre, M.; Gula, J. The influence of merger and convection on an anticyclonic eddy trapped in a bowl. Ocean. Model. 2021, 167, 101874. [Google Scholar] [CrossRef]
Figure 1. The typical vertical structure of sound speed (black contour lines) and temperature anomalies (background colors) in AE (a), CAE (b), CE (c), and WCE (d). The colorbar represents temperature anomalies (°C). The green solid line represents the SLD. The vertical profiles of mean temperature (red) and sound speed (blue) at the center of AE/CAE are in (e), CE/WCE in (f), respectively. Solid lines represent normal eddies, while dashed lines represent abnormal eddies.
Remotesensing 16 02845 g001
Figure 2. Spatial distribution of SLDA in (a) AE, (b) CAE, (c) CE, and (d) WCE. Monthly series of SLDA and eddy intensity for (e) AE and CAE, and (f) CE, and WCE. The blue solid (dashed) line represents the SLDA of normal (abnormal) eddies, and the red solid (dashed) line represents the eddy intensity of normal (abnormal) eddies.
Remotesensing 16 02845 g002
Figure 3. The percentage of SLDA caused by eddies in spring (a), summer (b), autumn (c), and winter (d). Monthly variations in average SLD (e), and SLD difference between abnormal eddies and normal eddies (f). In (e), the bar represents the standard deviation, showing the range of expected values, with central markers indicating the mean value.
Remotesensing 16 02845 g003
Figure 4. Seasonal variation in the heat budget term in (a) spring, (b) summer, (c) autumn, and (d) winter. The dark red, orange, green blue, and green bars are the terms for longwave radiation (LWR), shortwave radiation (SWR), latent heat flux (LHF), sensible heat flux (SHF) term, net air–sea heat flux (NHF), and convection (Conv). Monthly contributions of |SLD| (solid line) and advection terms in (e) vertical direction, and (f) horizontal direction. The red, orange, blue, and green lines are the SLDs for AE, CAE, CE, and WCE, respectively.
Remotesensing 16 02845 g004
Figure 5. Schematic of CAE and WCE influences on the sonic layer depth (SLD) via vertical advection during spring, in comparison with normal eddies (AE and CAE). The blue and red circles are the cold and warm cores. Blue and red curves with arrows are the eddy rotation directions.
Remotesensing 16 02845 g005
Disclaimer/Publisher’s Note: The statements, opinions and data contained in all publications are solely those of the individual author(s) and contributor(s) and not of MDPI and/or the editor(s). MDPI and/or the editor(s) disclaim responsibility for any injury to people or property resulting from any ideas, methods, instructions or products referred to in the content.