Article

The Impact of Meteorological Drought at Different Time Scales from 1986 to 2020 on Vegetation Changes in the Shendong Mining Area

School of Surveying and Land Information Engineering, Henan Polytechnic University, Jiaozuo 454000, China
*
Author to whom correspondence should be addressed.
Remote Sens. 2024, 16(15), 2843; https://doi.org/10.3390/rs16152843
Submission received: 19 June 2024 / Revised: 27 July 2024 / Accepted: 1 August 2024 / Published: 2 August 2024

Abstract

:
The Shendong Mining Area, being the largest coal base in the world, has significant challenges in the intensive development and utilization of coal resources, as well as the impact of a dry climate, which can have serious negative effects on the growth of flora in the region. Investigating the spatial and temporal patterns of how meteorological drought affects vegetation in the Shendong Mining Area at various time scales can offer a scientific foundation for promoting sustainable development and ecological restoration in the region. This study utilizes the Standardized Precipitation Evapotranspiration Index (SPEI) and Normalized Difference Vegetation Index (NDVI) data from 1986 to 2020 in the Shendong Mining Area. It employs Slope trend analysis, a Mann–Kendall test, a Geographic Detector, and other methods to examine the spatiotemporal distribution characteristics of meteorological drought at various time scales. Additionally, the study investigates the influence of these drought patterns on vegetation growth in the Shendong Mining Area. Across the mining area, there was a general decrease in the monthly average SPEI on an annual basis. However, on a seasonal, semi-annual, and annual basis, there was a gradual increase in the annual average SPEI, with a higher rate of increase in the southern region compared to the northern region. When considering the spatial variation trend in different seasons, both positive and negative trends were observed in winter and summer. The negative trend was mainly observed in the western part of the mining area, while the positive trend was observed in the eastern part. In spring, the mining area generally experienced drought, while in autumn, it generally experienced more precipitation. The mining area exhibits a prevailing distribution of vegetation, with a greater extent in the southeast and a lesser extent in the northwest. The vegetation coverage near the mine is insufficient, resulting in a low NDVI value, which makes the area prone to drought. Over the past few years, the mining area has experienced a significant increase in vegetation coverage, indicating successful ecological restoration efforts. Various forms of land use exhibit distinct responses to drought, with forests displaying the most positive correlation and barren land displaying the strongest negative correlation. Various types of landforms exhibit varying responses to drought. Loess ridge and hill landforms demonstrate the most pronounced positive association with monthly-scale SPEI values, whereas alluvial and floodplain landforms display the poorest positive correlation with yearly scale SPEI values. The general findings of this research can be summarized as follows: (1) The mining area exhibits a general pattern of increased humidity, with the pace of humidity increase having intensified in recent times. Seasonal variations exhibit consistent cyclic patterns. (2) There are distinct regional disparities in NDVI values, with a notable peak in the southeast and a decline in the northwest. The majority of the mining area exhibits a positive trend in vegetation recovery. (3) Regional meteorological drought is a significant element that influences changes in vegetation coverage in the Shendong Mining Area. Nevertheless, it displays complexity and is more obviously impacted by other factors at a small scale. (4) It should be noted that forests and barren land exert a more significant influence on SPEI values, despite their relatively lesser spatial coverage. The predominant land use type in most locations is grasslands; however, they have a relatively minor influence on SPEI. (5) A shorter time period, higher elevation, and steeper slope gradient all contribute to a larger correlation with drought.

1. Introduction

In recent decades, the rate of global warming has experienced a substantial increase. Presently, the global mean temperature is increasing at a rate of approximately 0.2 °C per decade [1], and the temperature rise observed in the last century exceeds that of the preceding several millennia [2]. Global warming would not only result in the occurrence of exceptionally high temperatures [3], but also induce regional drought events in certain locations [4]. With increasing temperatures, certain regions may see alterations in precipitation patterns, such as variations in the amount and distribution of rainfall [5]. This phenomenon has the potential to result in certain regions becoming more arid and perhaps enduring prolonged periods of drought [6]. Droughts have significant ramifications for agriculture, ecosystems, and human society, such as decreased productivity, water scarcity, and decreased vegetation coverage [7]. Hence, it is crucial to tackle the difficulties posed by drought resulting from global warming, which involves enhancing water resource management, advocating for sustainable agricultural growth, and afforestation [8].
Historically, both domestic and international academic circles, when researching characteristics such as vegetation resistance and resilience, have mostly approached the subject from perspectives such as water resources, biomass, and drought. Certain research teams are dedicated to examining the impact of water storage on vegetation growth and recovery in arid regions [9], as well as forecasting the future trends in terrestrial water storage [10]. Some researchers carry out systematic studies on the historical development and future projections of aridity in arid locations worldwide, examining the variations and underlying causes of changes across different domains [11]. In light of the ongoing era of rapid global warming, numerous research teams are approaching the study of arid areas and their ecosystems from the standpoint of climate change [12]. This is particularly important because arid ecosystems are more susceptible to sudden and severe droughts compared to humid places [13].
Recently, domestic scholars have also shown significant interest in this matter. Some researchers have examined extreme drought events and analyzed the variations in vegetation cover and production throughout different time periods across the country [14]. Some researchers focus on specific drought events and have found that after the occurrence of meteorological drought, different types of vegetation exhibit varying degrees of response and recovery times to meteorological drought conditions [15]. Others focus on investigating the patterns and sensitivity of vegetation to drought by enhancing vegetation indicators [16]. Studying domestic concerns is inherently linked to the context of global change, and the concept of “resilience” is currently a prominent area of inquiry. Several academics have investigated the advancements in research on vegetation ecology under drought-induced stress. They have identified three crucial dimensions: resistance, recovery, and adaptability [17].
A multitude of experts express significant apprehension over the ramifications of regional droughts of small to medium scale on vegetation, particularly in the northern portion of the country. The climate condition in the northern portion of China is comparatively more arid. Through the examination of the effects of drought on the local ecosystem, more effective measures for planning and safeguarding can be implemented [18]. The Yellow River Basin is a significant territorial divisional unit in China. The study by Huazhu Xue’s team examined climate data from the Yellow River Basin and its surrounding areas, along with NDVI data, to investigate the connection between meteorological drought and changes in vegetation across the entire basin. The findings revealed that a majority of the areas displayed a positive correlation between drought conditions and vegetation condition [19]. Bojie Fu’s team has focused on the changes in the resilience of vegetation recovery on the Loess Plateau, finding that an increase in vegetation coverage does not necessarily correspond to an increase in resilience, and the decline in resilience may be related to climate factors [20]. Some scientists opt to examine the variations in different regions adjacent to the Yellow River Basin in order to investigate the correlation between meteorological drought and vegetation in the presence of varied underlying surfaces, such as mining areas [21] and grasslands [22]. The Inner Mongolia section of the Yellow River Basin is a typical representative area. By analyzing the spatiotemporal changes in meteorological drought and hydrological drought in this region and exploring their impact on vegetation NDVI, it can be found that meteorological drought in this area shows a decreasing trend, while hydrological drought shows an increasing trend, both of which have a significant impact on vegetation changes [23]. Ecological restoration of vegetation in mining regions has consistently been a significant study topic. Examining the correlation between meteorological drought and alterations in vegetation can offer valuable insights into this subject matter. Several researchers integrate several drought indicators, vegetation indices, and remote sensing imageries [24], such as SPEI, NDVI, TVDI, etc., in order to examine the impact of drought on mining area vegetation over different time periods [25].
Previous research has demonstrated that the SPEI is effective in identifying regional drought occurrences. The identification of drought conditions on a large scale has reached a comparatively advanced stage of development. However, there is still limited progress in identifying drought conditions on a local and medium scale. The Shendong Mining Area, one of the world’s eight major coal fields, has a history of mining that dates back to the 1920s, and it has been a focus of national coal field development since 1985. Historically, the study of vegetation in the Shendong Mining Area has primarily concentrated on indices such as the NDVI, TVDI, and SPI. However, the more advanced SPEI has not yet been incorporated into the investigation of drought in land vegetation in the Shendong Mining Area. As a typical representative of mining development and located in the ecologically fragile semi-arid region of China, the Shendong Mining Area has significant research importance. Based on the development history of the Shendong Mining Area, this paper introduces the SPEI into the study of vegetation in mining areas, investigating the impact of meteorological drought on vegetation changes in the Shendong Mining Area from 1986 to 2020. The aim is to explore the influence of meteorological drought on mining area vegetation and vegetation ecology. Additionally, this work aims to offer insights and recommendations for the future ecological restoration of mining sites.

2. Data and Methods

2.1. Research Area

The Shendong Mining Area is situated in the northern region of Yulin City, Shaanxi Province, and the southeastern area of Ordos City (Figure 1). The site is located in the transitional region between the Maowusu Sandy Land and the Loess Plateau. It primarily encompasses three county-level administrative regions: Shenmu City, Fugu County, and Yijinhuoluo Banner. The geographical coordinates range from 38°52′–39°41′N to 109°51′–110°46′E, with an elevation varying between 905 and 1507 m. The region experiences a temperate semi-arid continental climate characterized by an average annual temperature of 6.6 °C. It is prone to frequent strong winds, dry conditions, and limited rainfall, which primarily occurs between June and September annually. The duration of the vegetation growth season is brief, while the time of dormancy is extensive. The vegetation coverage is little, and the degree of closure is inadequate. The mining area encompasses a total of 13 mines, namely the Dalutuo Mine, Halagou Mine, Bulianta Mine, Shangwan Mine, Shigetai Mine, and Bulate Mine. This expansive territory spans over 3539 km2. The primary river within the mining region is the Wul-anmulun, which is part of the Yellow River system. It runs in a northwestern to southeastern direction. The development of coal fields in the Shendong–Dongsheng Mining Area dates back to the 1920s of the 20th century. Since 1985, the state has prioritized the development of coal fields, and coal mining has persisted up until the present.

2.2. Data Sources

2.2.1. Meteorological Data

The meteorological data utilized in this study mostly originate from the National Tibetan Plateau Data Center (https://www.tpdc.ac.cn/home) (accessed on 9 March 2024), encompassing a 1 km resolution monthly precipitation dataset (1901–2022) and a 1 km resolution monthly temperature dataset (1901–2022) of China. Furthermore, the grid image data representing temperature and precipitation in the research area from 1986 to 2020 were acquired using ArcGIS10.8. In addition, the observational data from the Yulin, Shenmu, and Dongsheng stations, which are situated inside and near the study area, are utilized as the validation dataset. These data were obtained from the China Ground Meteorological Daily Data Set (V3.0) spanning from 1951 to 2020. The data have undergone quality inspection and verification by the National Tibetan Plateau Data Center.

2.2.2. Normalized Difference Vegetation Index (NDVI)

This article utilizes the Google Earth Engine (GEE) cloud computing platform and three datasets: LANDSAT/LT05/C01/T1_8DAY_NDVI, LAND-SAT/LE07/C01/T1_8DAY_NDVI, and LANDSAT/LC08/C01/T1_8DAY_NDVI. Before conducting image analysis, these datasets were subjected to necessary preprocessing, including image calibration to ensure that the radiance values correspond to the actual ground reflectance or radiance, radiometric correction to eliminate the effects of sensor response inconsistencies and atmospheric conditions, and cloud and shadow removal to identify and exclude cloud layers and shadows in the images. These steps help to reduce interference caused by factors such as clouds, aerosols, and solar elevation angle. After processing with the maximum value composition method, we obtained monthly scale NDVI data for the Shendong Mining Area. Subsequently, using ArcGIS10.8 software, further processing of these data yielded annual NDVI data that reflect annual vegetation changes. This method not only improves data quality but also enhances the accuracy of analysis on vegetation coverage and health status.

2.2.3. Land Use Data

The land use types are determined based on the provincial-level annual land cover product (CLCD) of China from 1985 to 2022. This product was established by Professors Yang Jie and Huang Xin from Wuhan University (more info at https://zenodo.org/records/4417809) (accessed on 28 March 2024). This product demonstrates strong congruity with established land cover products in relation to global forest change, global surface water, and impervious surface time series datasets. This work focuses on analyzing the impact of climatic drought on vegetation by studying six specific types of land use—grassland, forest land, arable land, water bodies, wasteland, and unused land—as identified in the dataset(Figure 2). In addition, ArcGIS software is utilized for zonal statistics in order to compute the NDVI values for each land use category, hence facilitating subsequent study.

2.2.4. Landform Data

The landform type is sourced from the Earth Resources Data Cloud (http://www.gis5g.com/home) (accessed on 28 March 2024) of “Topographic Atlas of the People’s Republic of China (1:1 million)”. This is an atlas that fully reflects the macro regularity of the landscape in our country, revealing the spatial differentiation of regional geomorphology at the national basic scale. The dataset is type-coded with 6-digit numbers according to three levels: geomorphic type, elevation or water depth, mountain relief or platform plain origin, or marine geomorphic subtype. Given the size of the study area of this article, four specific types of landforms within the processed data were chosen for investigation: mid-altitude loess ridges and mounds, mid-altitude aeolian landforms, mid-altitude denudation plains, and low-altitude alluvial and floodplain plains. These were selected to examine the vegetation’s response to climate change in various landform categories.

2.3. Research Methods

2.3.1. Standardized Precipitation Evapotranspiration Index (SPEI)

The Standardized Precipitation Evapotranspiration Index (SPEI) is an indicator utilized for evaluating the severity of drought in a particular area and forecasting forthcoming drought patterns. This index can be analyzed from many spatial and temporal viewpoints.
From a spatial point of view, by analyzing the monthly, quarterly, and annual fluctuations in SPEI at a specific location over an extended period, it is possible to depict the long-term trend in drought intensity in a small region. This information can then be integrated with local agricultural, hydrological, and other relevant data to form a comprehensive assessment of the meteorological dry and wet conditions in that area. Furthermore, by computing the monthly, seasonal, and annual averages of SPEI at multiple locations, and subsequently employing spatial interpolation techniques to obtain uninterrupted variations in SPEI across a mesoscale or macroscale research region, one can investigate the correlation and statistical significance between different influencing factors in conjunction with pertinent data.
The SPEI can be computed at several temporal scales, such as n = 1, 3, 6, 9, 12, etc. When the time interval is set to 1 month, only the monthly SPEI value is computed. For time scales larger than one month, the SPEI is computed by adding the precipitation and potential evapotranspiration for the current month and the preceding n-1 months. To be more precise, a 1-month-scale SPEI primarily captures the minor variations in short-term drought conditions in the specific geographical region under investigation. The 3-month scale provides insights into the patterns of drought change during the months of May, August, November, and the subsequent February, representing the seasons of spring, summer, autumn, and winter, respectively. A 6-month scale provides an assessment of drought conditions in the area over half a year. A 12-month scale accurately captures the year-to-year fluctuations in drought conditions within the region.
The Thornthwaite formula is used to compute the potential evapotranspiration in this study. Although the Penman–Monteith method can take into account additional factors that have an influence, the study area is situated in an environmentally fragile zone at the intersection of Shanxi, Shaanxi, and Inner Mongolia. In this region, precipitation is relatively low and has a negligible effect on the computation of SPEI values. Furthermore, the Thornthwaite approach is capable of generating extensive historical data and accurate trend analysis values. As a result, the Thornthwaite method, which primarily relies on temperature data, continues to be utilized.
The classification of SPEI grades may be found in Table 1. The computation process is mainly divided into the following four steps:
Step one: Calculate the potential evapotranspiration (PET).
P E T = 0   T i < 0   ° C 16 × 10 T i H A   0   ° C T i < 26.5   ° C 415.85 + 32.24 T i 0.43 T i 2   T i 26.5   ° C
Considering the variations in sunshine hours and the number of days per month, adjust the PET as follows:
P E T = P E T θ 30 h 12
where PET (potential evapotranspiration) refers to monthly potential evapotranspiration in mm/month; Ti is the average monthly temperature (°C); H refers to the annual heat index; A is a constant; θ refers to the actual number of days in each month; and h refers to the number of hours of sunshine.
The annual heat index H is calculated using Equation (3) as
H = i = 1 12 H i = i = 1 12 T i 5 1.514
The constant A is calculated using Equation (4) as
A = 6.75 × 10 7 H 3 7.71 × 10 5 H 2 + 1.792 × 10 2 H + 0.49
Step two: Calculate the cumulative difference value Di between precipitation and PET, which represents the climatic water balance.
D i = P i P E T i
D i , j k = m = 13 k j 12 D i 1 , m + m = 1 j D i , m   j < k D i , j k = m = j k + 1 j D i , m   j k
where Di represents the cumulative value of the difference between precipitation and potential evapotranspiration over the calculation time scale, and Dki,j is the cumulative value of the precipitation–evapotranspiration difference within the k-th month starting from the j-th month of the i-th year.
Step three: Fit the Di data sequence with a 3-parameter log-logistic distribution function.
f X = β α X γ α β 1 1 + X γ α β 2
In the formula, α, β, and γ can be obtained by fitting with the method of linear moments, that is
β = 2 ω 1 ω 0 6 ω 1 ω 0 6 ω 2 α = ω 0 2 ω 1 β Г 1 + 1 / β Г 1 1 / β γ = ω 0 α Г 1 + 1 / β Г 1 1 / β
where Γ(β) refers to the Gamma function concerning β. From this, the cumulative probability distribution function for Di is obtained, that is
F X = 1 + α X γ β 1
Step four: To normalize the cumulative probability distribution function, the probability of exceeding a certain value of Di is calculated as P = 1 F X . The probability-weighted moment is ω = 2 ln P .
S P E I = ω c 0 + c 1 ω + c 2 ω 2 1 + d 1 ω + d 2 ω 2 + d 3 ω 3   P 0.5 S P E I = ω c 0 + c 1 ω + c 2 ω 2 1 + d 1 ω + d 2 ω 2 + d 3 ω 3   P > 0.5
In the formula, c0 = 2.515517; c1 = 0.802853; c2 = 0.010328; d1 = 1.432788; d2 = 0.189269; d3 = 0.001308.

2.3.2. Slope Trend Analysis

Linear regression is a statistical method used to study the relationship between two or more variables. The slope is a key parameter in linear regression analysis, representing the amount of change in the dependent variable for each unit change in the independent variable. The slope can be calculated using the least squares method, with the specific formula as follows:
S l o p e = n i = 1 n i × N D V I i i = 1 n i × i = 1 n N D V I i n i = 1 n i 2 i = 1 n i 2
where “Slope” refers to the slope of the pixel regression equation, which indicates the rate of change in NDVI over time; “NDVIi” represents the average NDVI value for the i-th year; “n” is the length of the study period.
When Slope is more than 0 (Slope > 0), it indicates an increasing trend in the NDVI of that pixel, suggesting improvements or increases in vegetation cover.
When Slope equals 0 (Slope = 0), it suggests that the NDVI of the pixel has remained relatively stable over the study period, showing no significant change.
When Slope is less than 0 (Slope < 0), it indicates a decreasing trend in the NDVI of the pixel, which may imply a decline in vegetation health or cover [26].
Slope analysis has obvious intuitiveness, which can help us understand the long-term trends in data changes and facilitate data visualization better. It has a wide range of applicability and can be applied to the analysis of time series data, cross-sectional data, and spatial data, but it has certain limitations in handling outliers.

2.3.3. Mann–Kendall Test

The Mann–Kendall statistical test is non-parametric in nature and is employed to identify trends in time series data. The primary objective of this test is to ascertain the presence of a statistically significant trend in the data. The fundamental concept is to analyze the correlation between each individual data point in the time series in order to ascertain the presence of a change in trend [27].
The Mann–Kendall test offers several advantages, such as its independence from data distribution criteria and its ability to handle small sample sizes and outliers effectively. For a time series variable (X1, X2, …, Xn), where n is the length of the time series, the Mann–Kendall (M-K) method defines the statistic S as follows:
S = k = 1 n = 1 j = k + 1 n S g n x j x k
The Sgn( ) symbol function is defined as follows:
S g n x j x k = 1 , x j x k > 0 0 , x j x k = 0 1 , x j x k < 0
If s is a normal distribution, then Var (S) = n (n − 1) (2n + 5)/18. When n > 10, the normal distribution statistic is
Z = s 1 V a r s , s > 0 0 , s = 0 s 1 V a r s , s < 0
When Z > 0, it indicates an increasing trend of drought; when Z < 0, it shows a decreasing trend; and when |Z| > 1.96, the trend is significant.

2.3.4. Geodetectors

Geodetectors are used to identify and use spatial differentiation. Geographical Detectors include four types of detectors: Differentiation Detectors, Factor Detectors, Interaction Detectors (Table 2), and Risk Detectors. These detectors quantify the contribution of factors to spatial differentiation by calculating the q statistic, where a higher q value indicates a stronger explanatory power of the factor for spatial differentiation [28]. The expression is as follows:
q = 1 h = 1 L N h σ 2 h N σ 2 = 1 S S W S S T
Here, h represents the stratification of factor X, Nh represents the number of units in layer h, σ 2 h represents the variance of the Y values in layer h, and SSW and SST represent the sum of variances within each layer and the total variance of the entire region, respectively. The variable q is defined within the range of values from 0 to 1. As the value of q increases, the level of explanatory power that X has on Y also increases.

3. Results

3.1. Drought Spatiotemporal Analysis

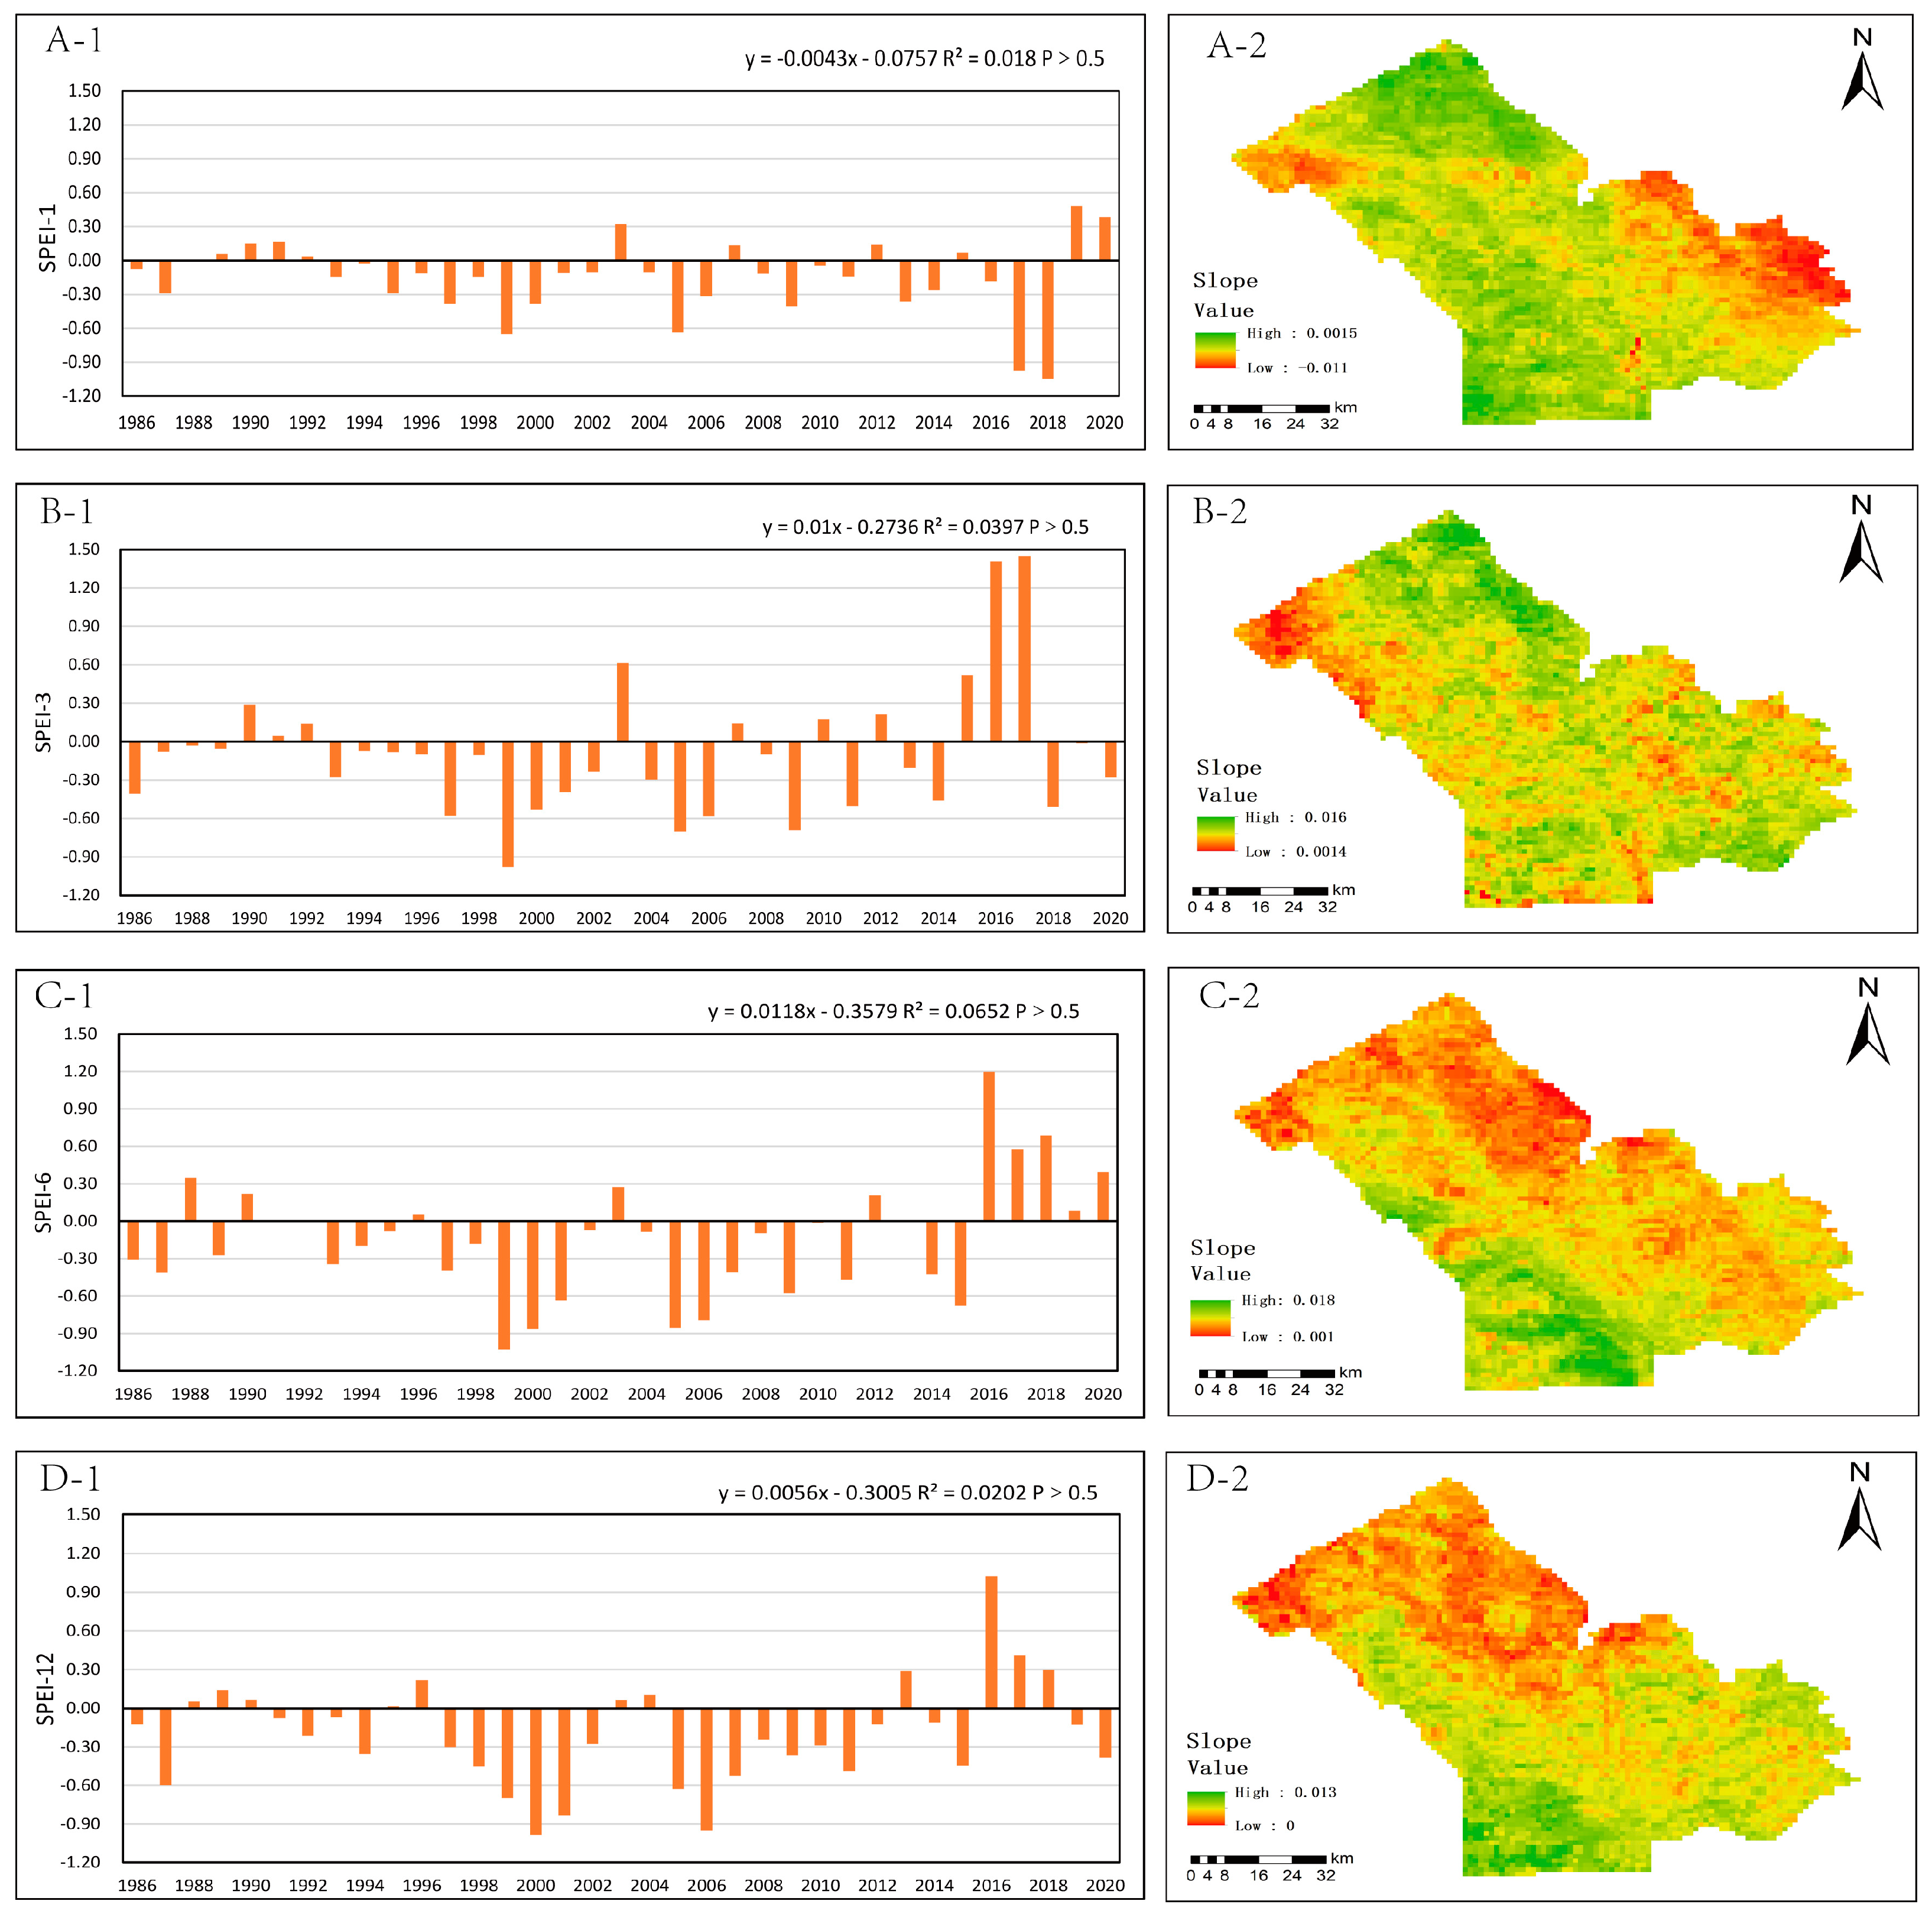
When considering various time periods, there are distinct variations in the annual average fluctuations in the SPEI. Figure 3 demonstrates that the SPEI-1 values exhibit a range of variation from −1.04 to 0.48, with an average value of −0.15. Out of these, 25 years have negative values; however, only 4 years meet the criteria for the drought index. Based on the drought categorization criterion, there was one instance of moderate drought on a monthly basis in 2018, and three instances of mild drought. The moderate drought in 2018 originated from the mild drought of 2017. Upon calculation, it was determined that 99.6% of the research area exhibited a decrease in SPEI values, while just approximately 0.4% of the region experienced a minor increase.
The SPEI-3 values exhibit a range of variation from −0.98 to 1.45, with an average value of −0.09. Out of the total, 10 years exhibit positive SPEI values, while the remaining years have negative values. Based on the drought classification criterion, all the droughts that occurred on a quarterly basis after the year 2000 are classified as mild droughts. Geographically, the SPEI values exhibit a general upward trend, with the western portion of the study region experiencing little changes, approaching a condition of balance between dryness and wetness.
The SPEI-6 values exhibit a range of variation from −1.03 to 1.20, with an average value of −0.15. Over a period of 12 years, positive SPEI values were observed. Based on the drought classification standard, there was one instance of moderate drought and six instances of mild drought on a semi-annual basis. Furthermore, from 2016 to 2018, it met the criteria for mildly wet conditions. Geographically, the rate of growth in the pattern of SPEI values is larger in the southern region of the research area compared to the north. There is a notable trend towards increased precipitation in the southern half.
The SPEI-12 values exhibit a range of variation influenced by the annual phenology, spanning from −0.99 to 1.02, with an average value of −0.20. Out of the total, 11 years exhibit positive SPEI values, while the remaining years have negative values. Based on the drought classification standard, there have been seven instances of moderate drought annually, primarily occurring since 2000. Additionally, in 2016, the criteria for a mildly wet condition was met. In terms of spatial distribution, the SPEI values generally exhibit an increasing tendency, with the southern region seeing a quicker rate of increase compared to the northern region. This trend is consistent with the pattern observed on a semi-annual timeframe.
To sum up, Figure 3 demonstrates that both SPEI06 and SPEI12 exhibit a distinct pattern where the rate of wetness is greater in the southern region of the research area compared to the northern region. The SPEI03 exhibits an oscillating characteristic of alternating between high and low values, without any discernible pattern. The majority of regions on SPEI01 exhibit negative trends, suggesting that the Shendong Mining Area is very susceptible to drought, particularly abrupt dry events, on a monthly basis. Over the course of three months, six months, and twelve months, there is a clear trend towards increased humidity. This suggests that soil moisture has a delayed effect and can sustain its initial condition for a longer period, concealing the inclination towards drought. Furthermore, the SPEI values over the previous five years have exhibited a notable increase, suggesting that the research area is experiencing a clear pattern of becoming warmer and more humid due to the impact of local environmental conditions [29].
Although the trend slopes of the SPEI annual mean values at different time scales are −0.0043/year, 0.01/year, 0.0118/year, and 0.0056/year, none of them passed the significance test at the 0.05 level, indicating that there is no linear relationship between the SPEI annual mean values and time, and thus it is not possible to simply predict the changes in the SPEI annual mean values through time. Further observation in this paper reveals that at different time scales, there are several identical periods where certain extreme values exist, which can be further analyzed in Section 4.
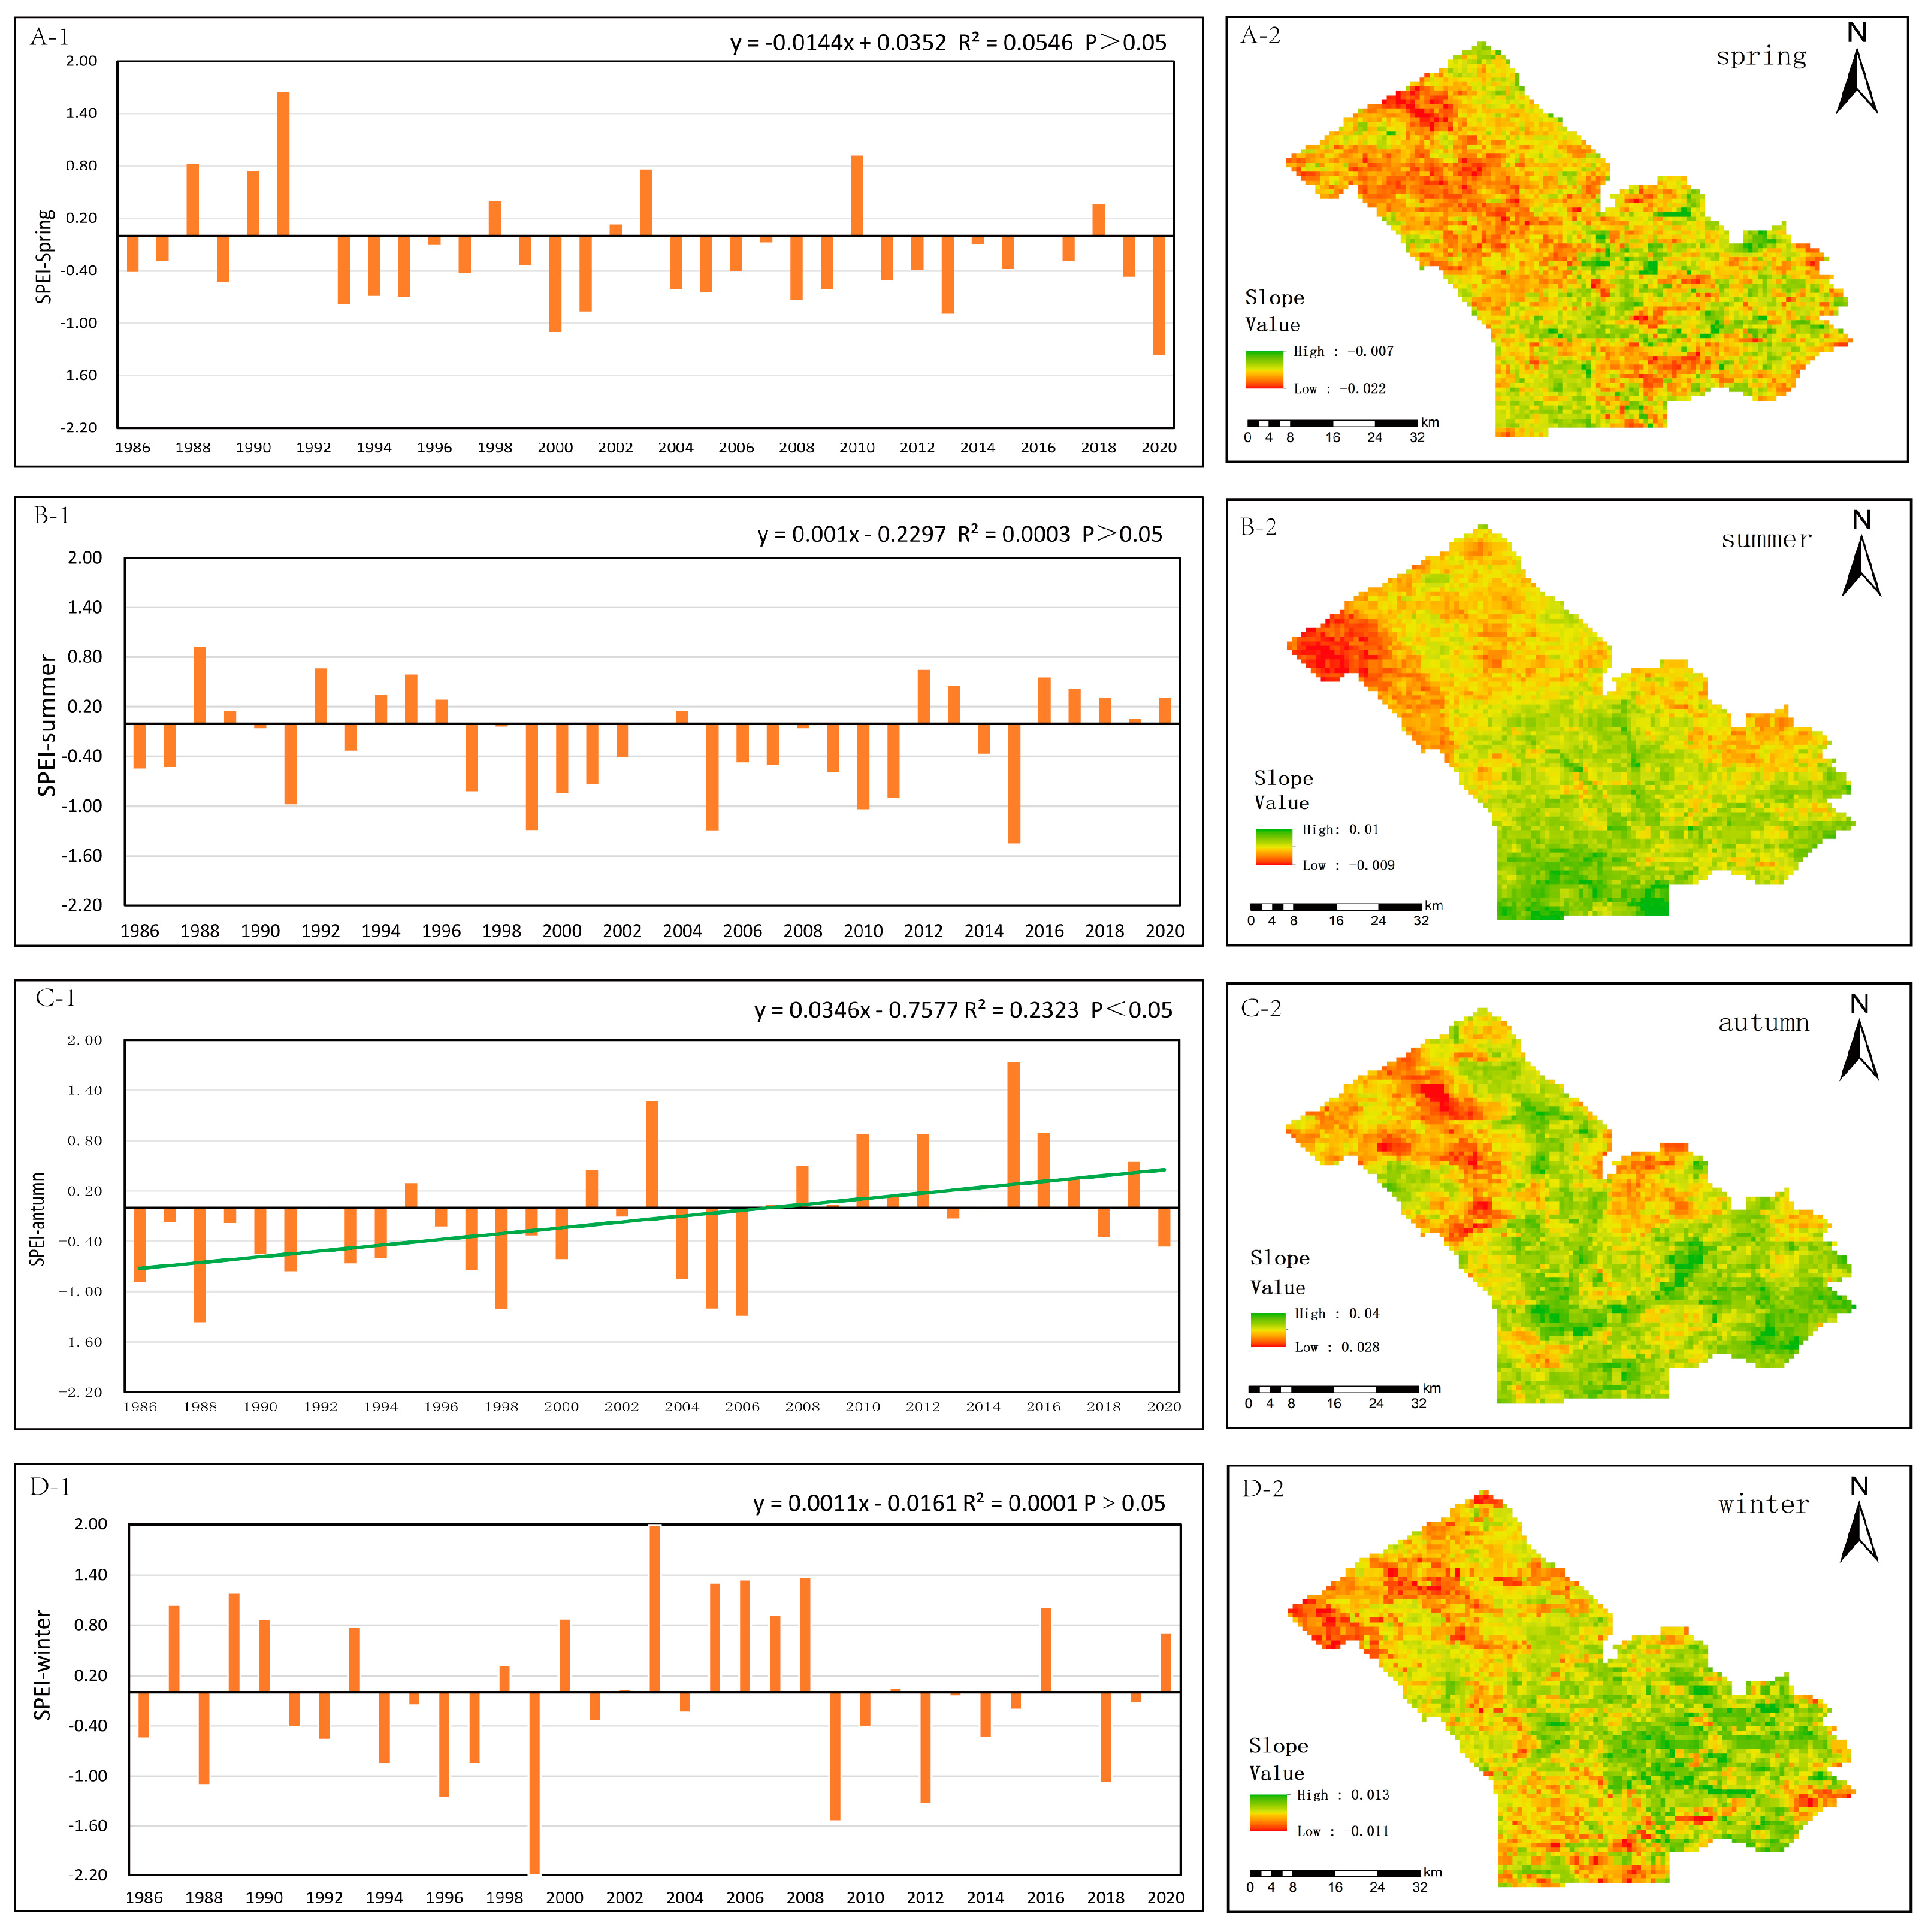
This article provides a more in-depth analysis of the patterns of variations in SPEI throughout various seasons. The winter SPEI values range from −2.2 to 2, with an average of 0.0039. The lowest value was recorded in 1999, while the highest value was observed in 2003. Upon examining Figure 4, it is clear that there is a significant fluctuation in the winter SPEI values from year to year. Specifically, there are 9 years where the winter SPEI values fall below −0.5, and out of those, 6 years meet the criteria for moderate drought. Geographically, the winter SPEI values exhibit a declining pattern from the eastern region to the western region. The decline in SPEI values is primarily focused in the western region of the study area, suggesting the possibility of a severe winter drought in the western half of the Shendong Mining Area.
The spring SPEI values exhibit a range of −1.36 to 1.65, with an average value of −0.22. The minimum value was seen in 2020, while the maximum value occurred in 2016. There is a total of 13 years in which the spring SPEI values fall below −0.5, indicating mild drought conditions. Among these years, 2000 and 2020 meet the criteria for moderate drought. Spring marks the commencement of the period when plants start to develop, and the primary factor influencing their growth is precipitation. However, the majority of the Shendong Mining Area is characterized by a moderate continental climate, which experiences limited rainfall throughout the spring season, making it more susceptible to spring droughts. This indicates a greater diversity and complexity in the natural environment during spring. Geographically, the spring SPEI values exhibit a negative trend, suggesting a decline from east to west. This suggests that the severity of drought in the Shendong Mining Area worsens from east to west throughout the spring season.
The summer SPEI values range from −1.45 to 0.92, with an average of −0.21. The minimum value was recorded in 2015, while the second-lowest values were observed in 1999 and 2005. The highest value, on the other hand, was recorded in 1988. There is a total of 11 years in which the summer SPEI values fall below −0.5, indicating mild drought conditions. Among these years, 1999, 2005, 2010, and 2015 meet the criteria for moderate drought. These occurrences seem to follow a pattern with a cycle of approximately 5 years. The summer SPEI values exhibit a distinct pattern of decreasing from southeast to northwest. Specifically, the areas with lower SPEI values are primarily located in the northwestern part of the study area, while the southeastern part experiences higher values. This suggests that the trend of summer SPEI values is significantly influenced by the topography on both sides of the study area.
The fall SPEI values exhibit a range of variation from −1.36 to 1.74, with an average value of −0.135. The lowest value was recorded in 1988, while the highest value was observed in 2016. This suggests a stronger tendency towards increased wetness during autumn over time. All drought episodes in the study area took place up to and including 2006. Out of them, 8 years experienced mild drought and 6 years experienced moderate drought. Since 2007, the research area has experienced normal or humid conditions during the autumn season. Geographically, the fall SPEI values exhibit a pattern of being greater in the southern region and lesser in the northern region. However, all values are positive, suggesting that the study area is experiencing an overall increase in humidity throughout autumn. The trend is most pronounced in the southern region.
Significance tests were conducted on the SPEI values for different seasons, and it was found that only autumn passed the significance test at the 0.05 level, with a linear trend slope of 0.0346 per autumn, while winter, spring, and summer did not. This indicates that the phenomenon of autumn drought shows a more apparent linear relationship with time and can be further analyzed and discussed.
Seasonally, the trend of SPEI values generally exhibits a cycle of declining in spring, somewhat rising in certain regions during summer, increasing in fall, and partially declining in certain regions during winter. This trend aligns with the typical patterns of natural geographic events, suggesting that the seasonal trend of SPEI values is impacted by global atmospheric movements, particularly in the Northern Hemisphere. The western portion of the research region, which is in closer proximity to the Maowusu Sandy Land, has more pronounced drought conditions on various time scales compared to the eastern portion.

3.2. Spatial and Temporal Distribution of Vegetation

Figure 5 illustrates the regional distribution of the average vegetation cover in the Shendong Mining Area from 1986 to 2020 [29], which obviously has great differences in spatial distribution. Combining the Digital Elevation Model (DEM) of the research area, it is evident that the spatial distribution of NDVI in the study area exhibits a consistent pattern: as altitude increases, the average NDVI value decreases (Table 3). Furthermore, the rate of change in NDVI also decelerates or even exhibits negative growth as altitude increases. After categorizing the average vegetation coverage of the Shendong Mining Area over multiple years into three groups using equal intervals and combining intervals with fewer data points, it was found that the higher-vegetation area (0.3–0.6) is primarily located in the southeast of the mining area, with sporadic distribution in other parts, making up approximately 14.1% of the study area. The low-vegetation area (0–0.2), on the other hand, is mainly found in the northern region of the study area and areas with intensive mining activities, accounting for about 17.2% of the study area. The medium-vegetation area encompasses regions where shrubs, bushes, or scant vegetation prevail, constituting around 68.7% of the area. The biological conditions in this area are relatively fragile [30].
The time series analysis of the annual NDVI mean (NDVI_Mean) and maximum value (NDVI_Max) from 1986 to 2020 has been conducted. Following the MK test, it was determined that the NDVI_Max exhibits statistical significance at the 0.05 level. Over the period of 1986 to 2020, NDVI_Max ranged between 0.36 and 0.8, with a peak of 0.8 observed in both 2014 and 2018, while the lowest value of 0.36 occurred in 2010. The linear trend rate was calculated as being at a rate of increase of approximately 0.0048 per year, indicating a weak upward trend in NDVI and favorable vegetation growth within the study area.
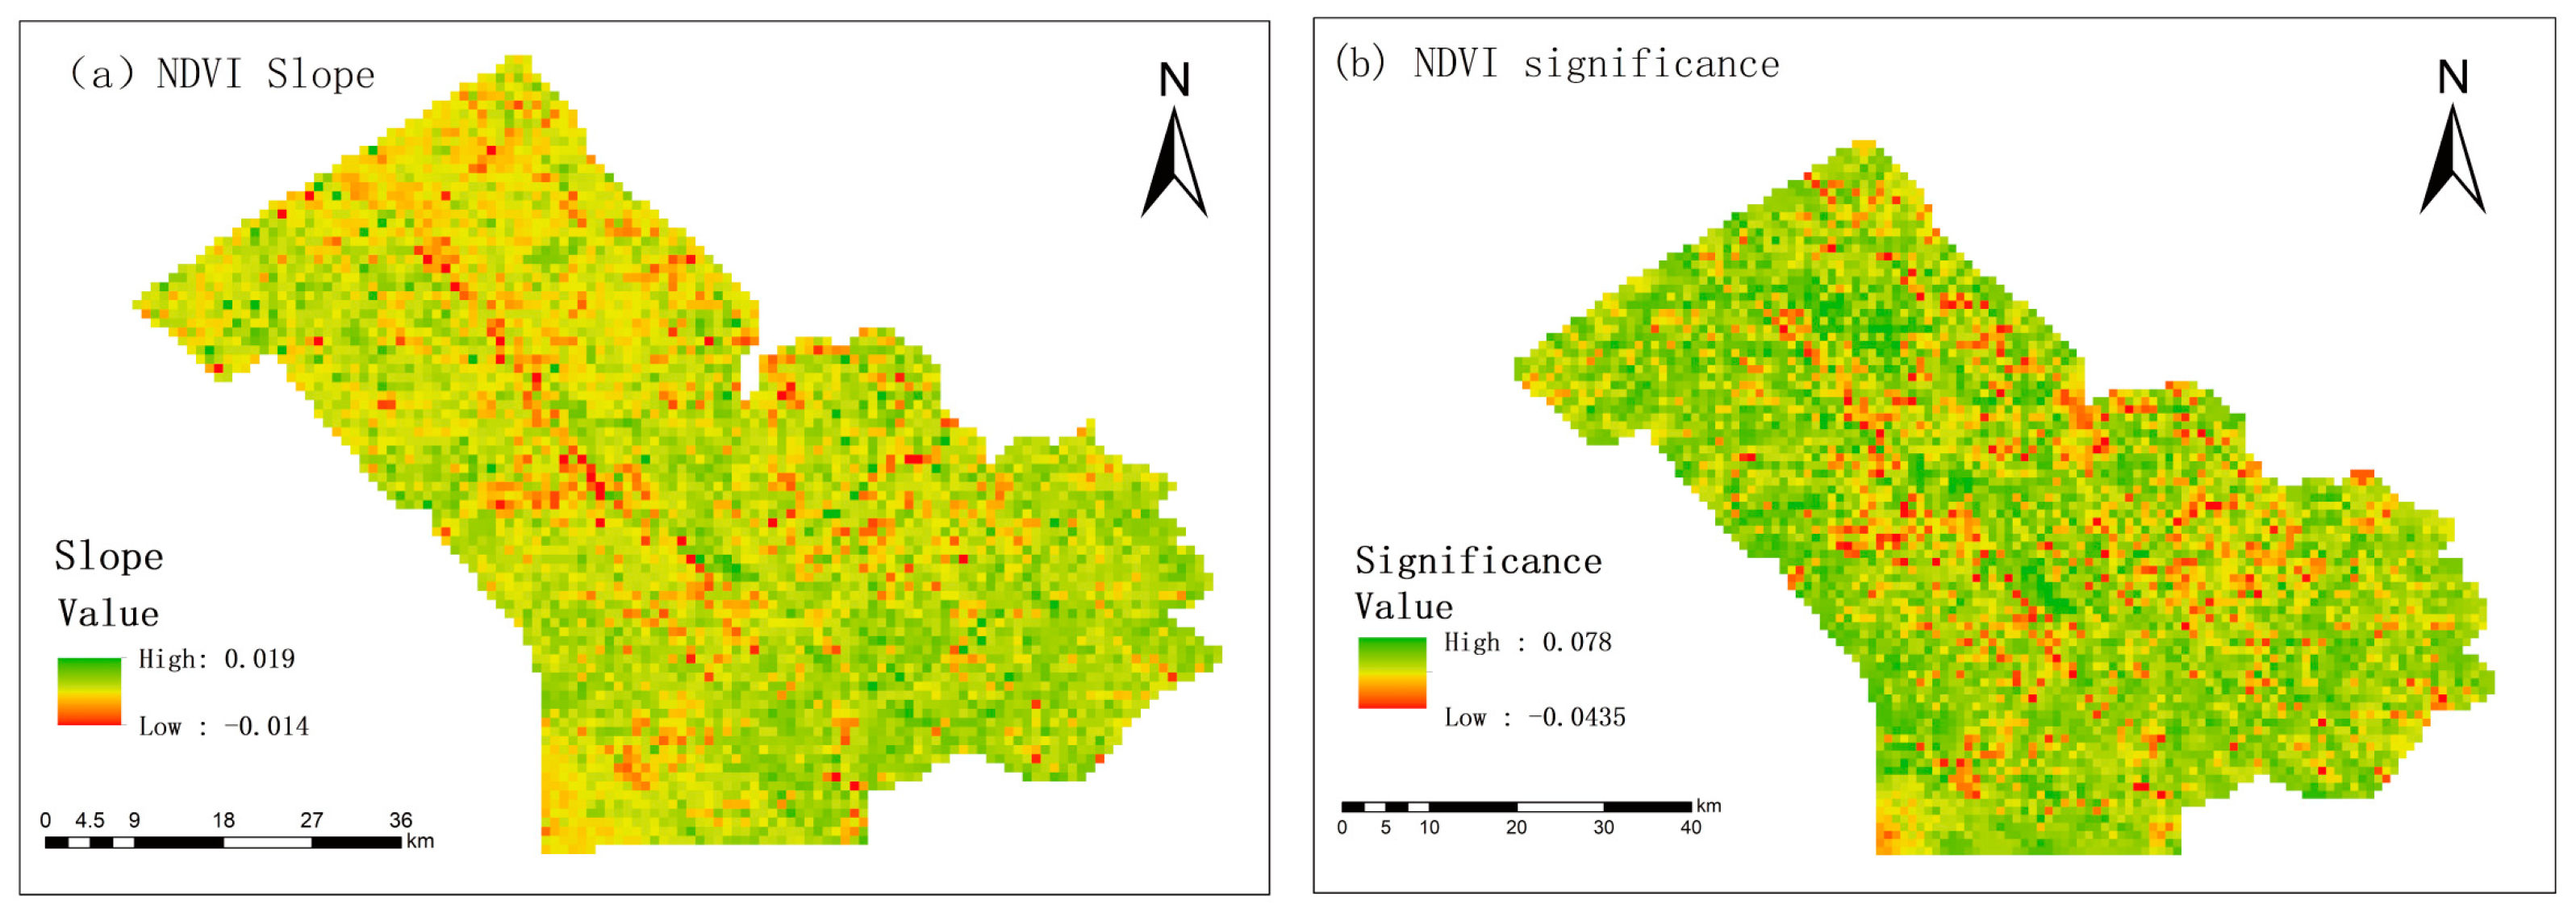
According to Figure 6, the MK test revealed a steady upward trend in the overall multi-year average vegetation cover in the Shendong Mining Area from 1986 to 2020, encompassing approximately 96.8% of the study area. The decrease accounted for only 3.2 percent. This finding aligns with the global pattern of plant growth in arid regions, as indicated by previous research [31]. Approximately 3.8% of the region has a declining pattern, primarily concentrated in areas affected by significant mining activities. The majority of the research area, around 81.7%, has a statistically insignificant upward trend, suggesting a gradual improvement in average vegetation cover that is not readily apparent. Furthermore, around 14.5% of the region exhibits a notable upward tendency, indicating that the ecological conditions in non-mining areas surpass those in mining areas [10].

3.3. Correlation Analysis

3.3.1. Correlation Analysis between SPEI and NDVI at Different Time Scales

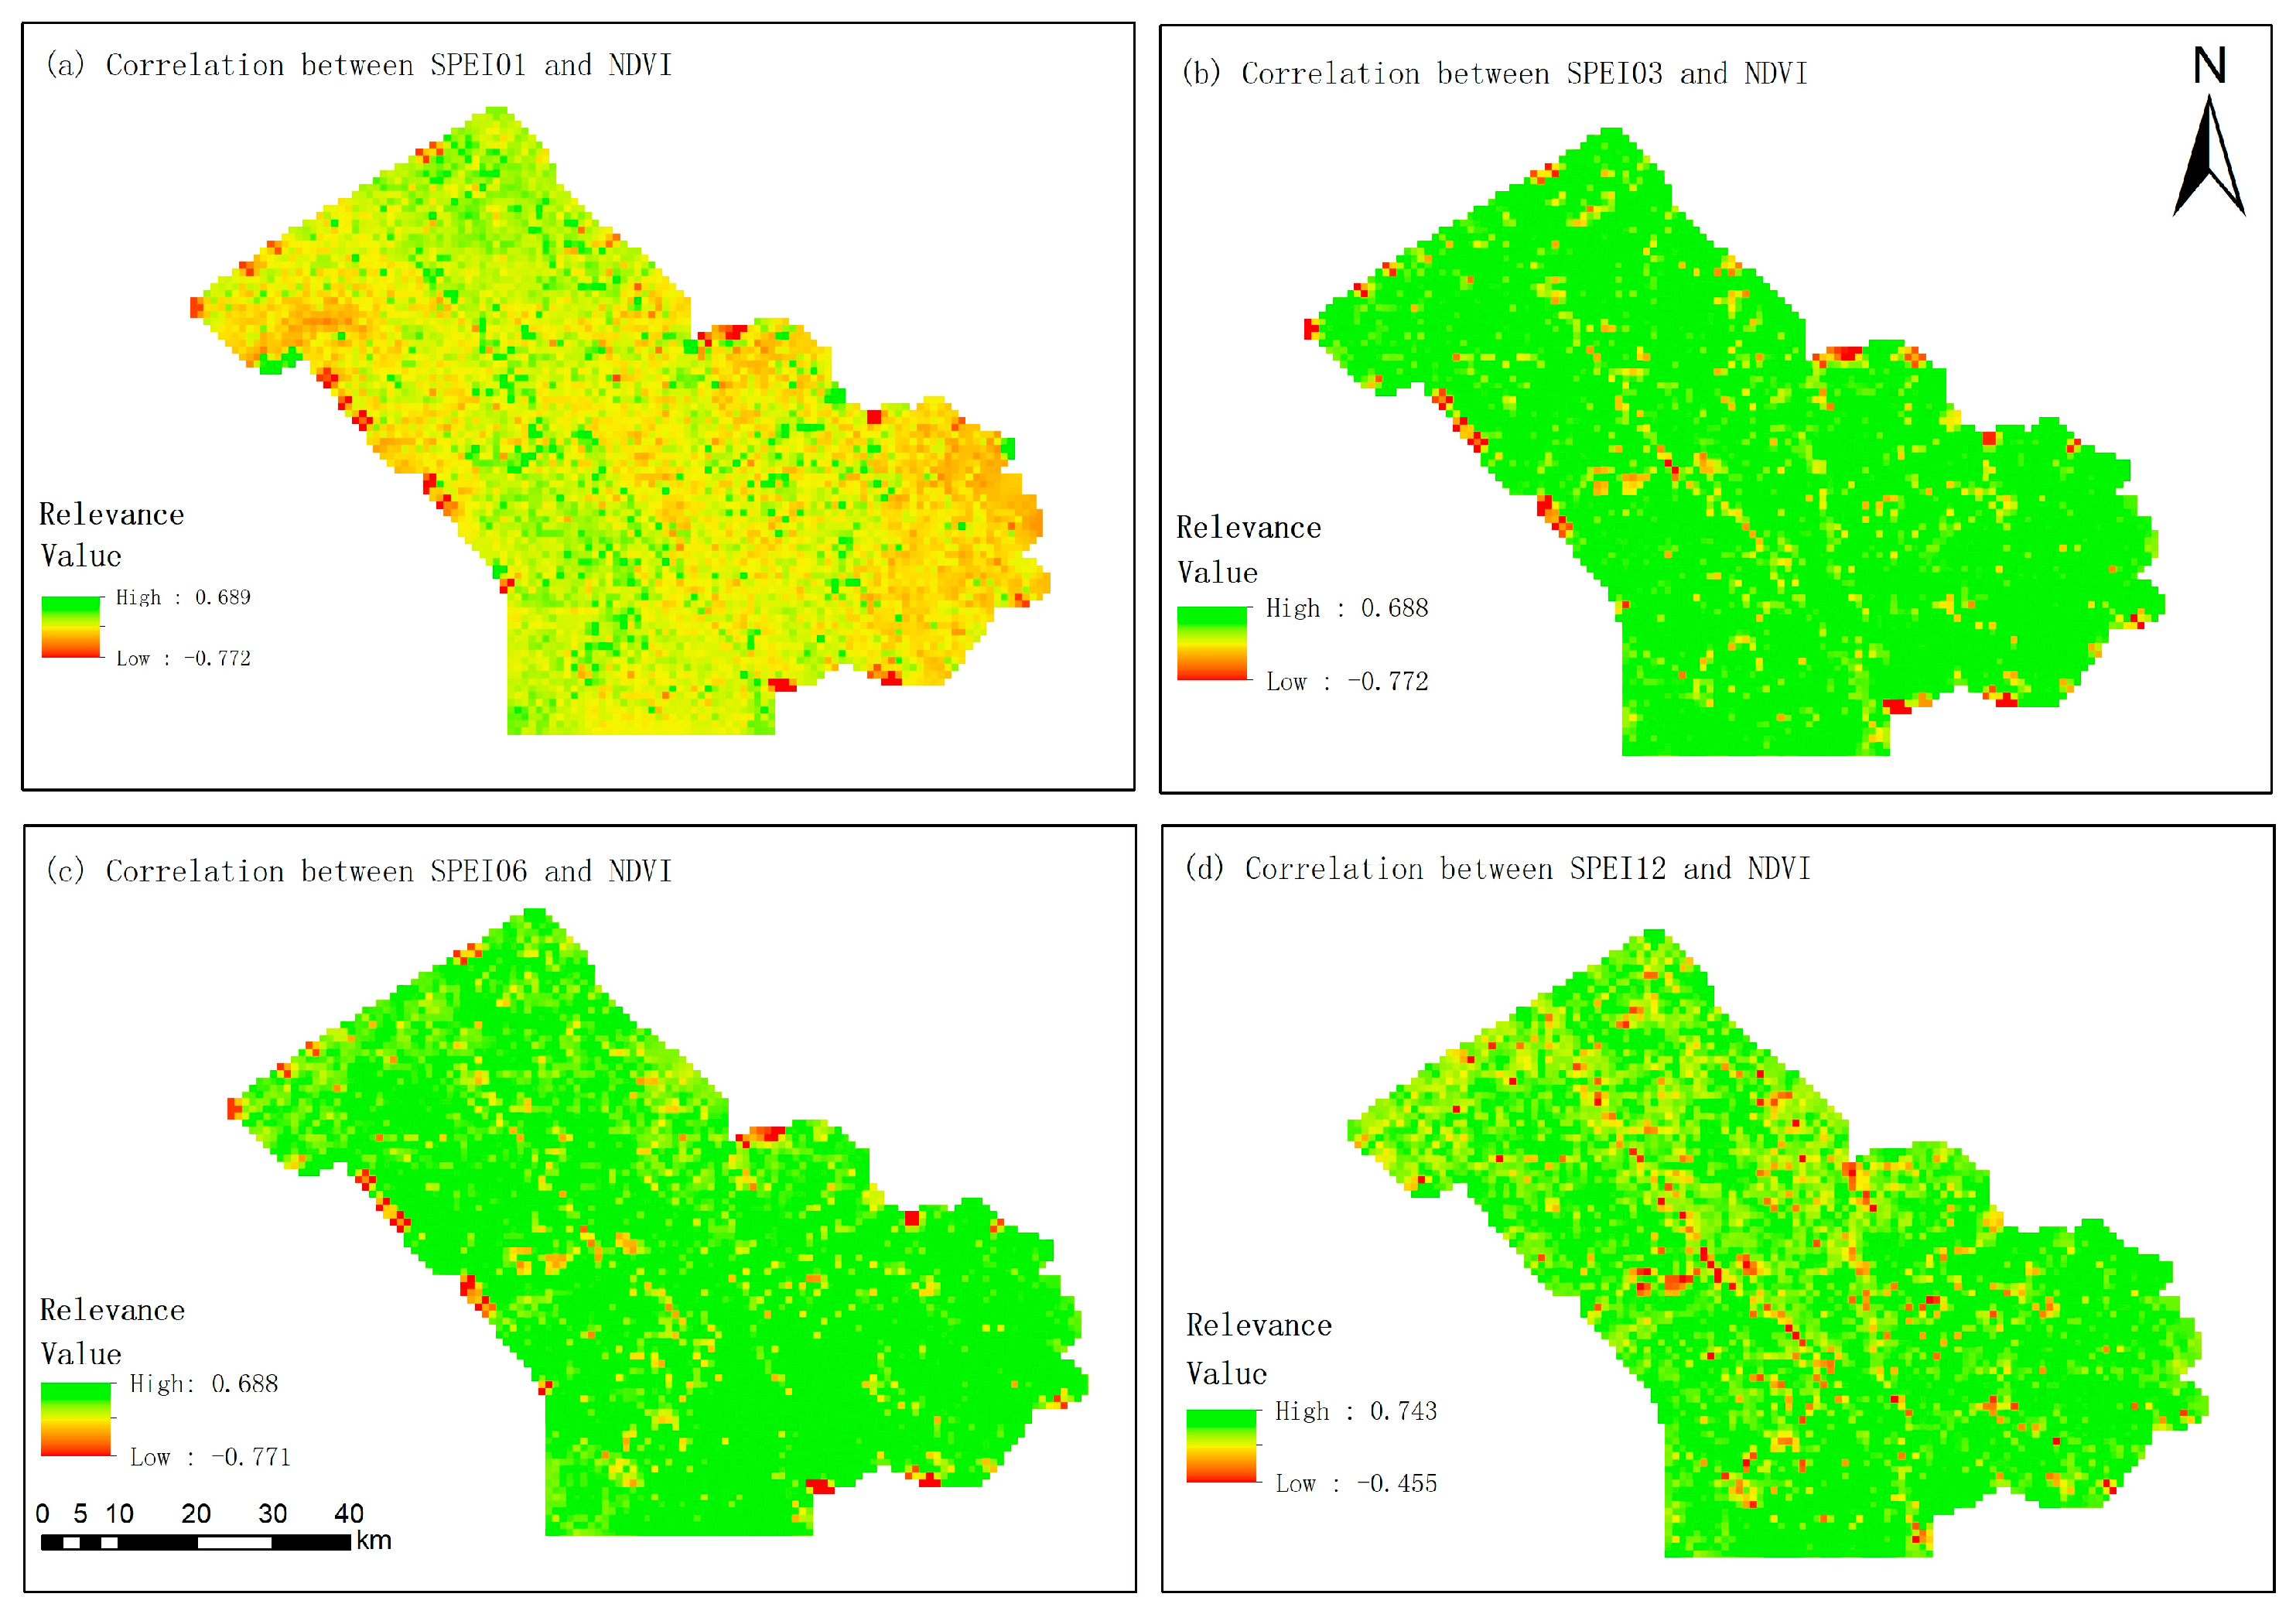
By analyzing the pixel values of the connection between various time scales of SPEI and annual NDVI, we may more accurately assess the impact of meteorological drought on vegetation. The correlation patterns between SPEI values and NDVI at different time scales (1, 3, 6, and 12 months) are consistent, as depicted in Figure 7. The correlation coefficients range from −0.77 to 0.69 for the 1-month scale, −0.77 to 0.69 for the 3-month scale, −0.77 to 0.69 for the 6-month scale, and −0.46 to 0.74 for the 12-month scale. The association between SPEI and NDVI remains consistent across the three scales, excluding the 12-month scale. The association at the 12-month scale varies within a narrower range due to the impact of annual temperature and precipitation, as well as the comparatively low precipitation in the Shendong Mining Area. The majority of the research area exhibits a color palette consisting of light yellow and light green, which signifies a strong positive association between the SPEI and NDVI. This implies that regions with elevated NDVI values also tend to have higher SPEI values, indicating a greater abundance of vegetation in more humid climates.
Currently, there is a noticeable upward tendency in the global vegetation response to drought over time. Over a significant period of time, vegetation has the ability to more effectively acclimate to drought conditions and modify its approach to water usage [32]. The regions where the SPEI shows a positive correlation with NDVI for the time scales of 1, 3, 6, and 12 months cover 11.72%, 95.76%, 95.82%, and 95.75% of the total area under investigation, respectively. With the exception of the 1-month period, the correlation at all other scales is approximately 95%. At the 1-month scale, the area exhibiting significant connection represents only 3.2% of the total research area. This percentage increases to approximately 55% at the 3-month scale, around 58.9% at the 6-month scale, and approximately 85.5% at the 12-month scale. As the time scale increases, the correlation between SPEI and NDVI also increases, suggesting that NDVI has a significant impact on SPEI values over a long period of time. Previous research on meteorological drought in the Yangtze River Basin have shown that NDVI is more sensitive to SPEI [33]. This aligns with the results of the current paper.

3.3.2. Correlation between Drought and Vegetation in Different Land Use Types

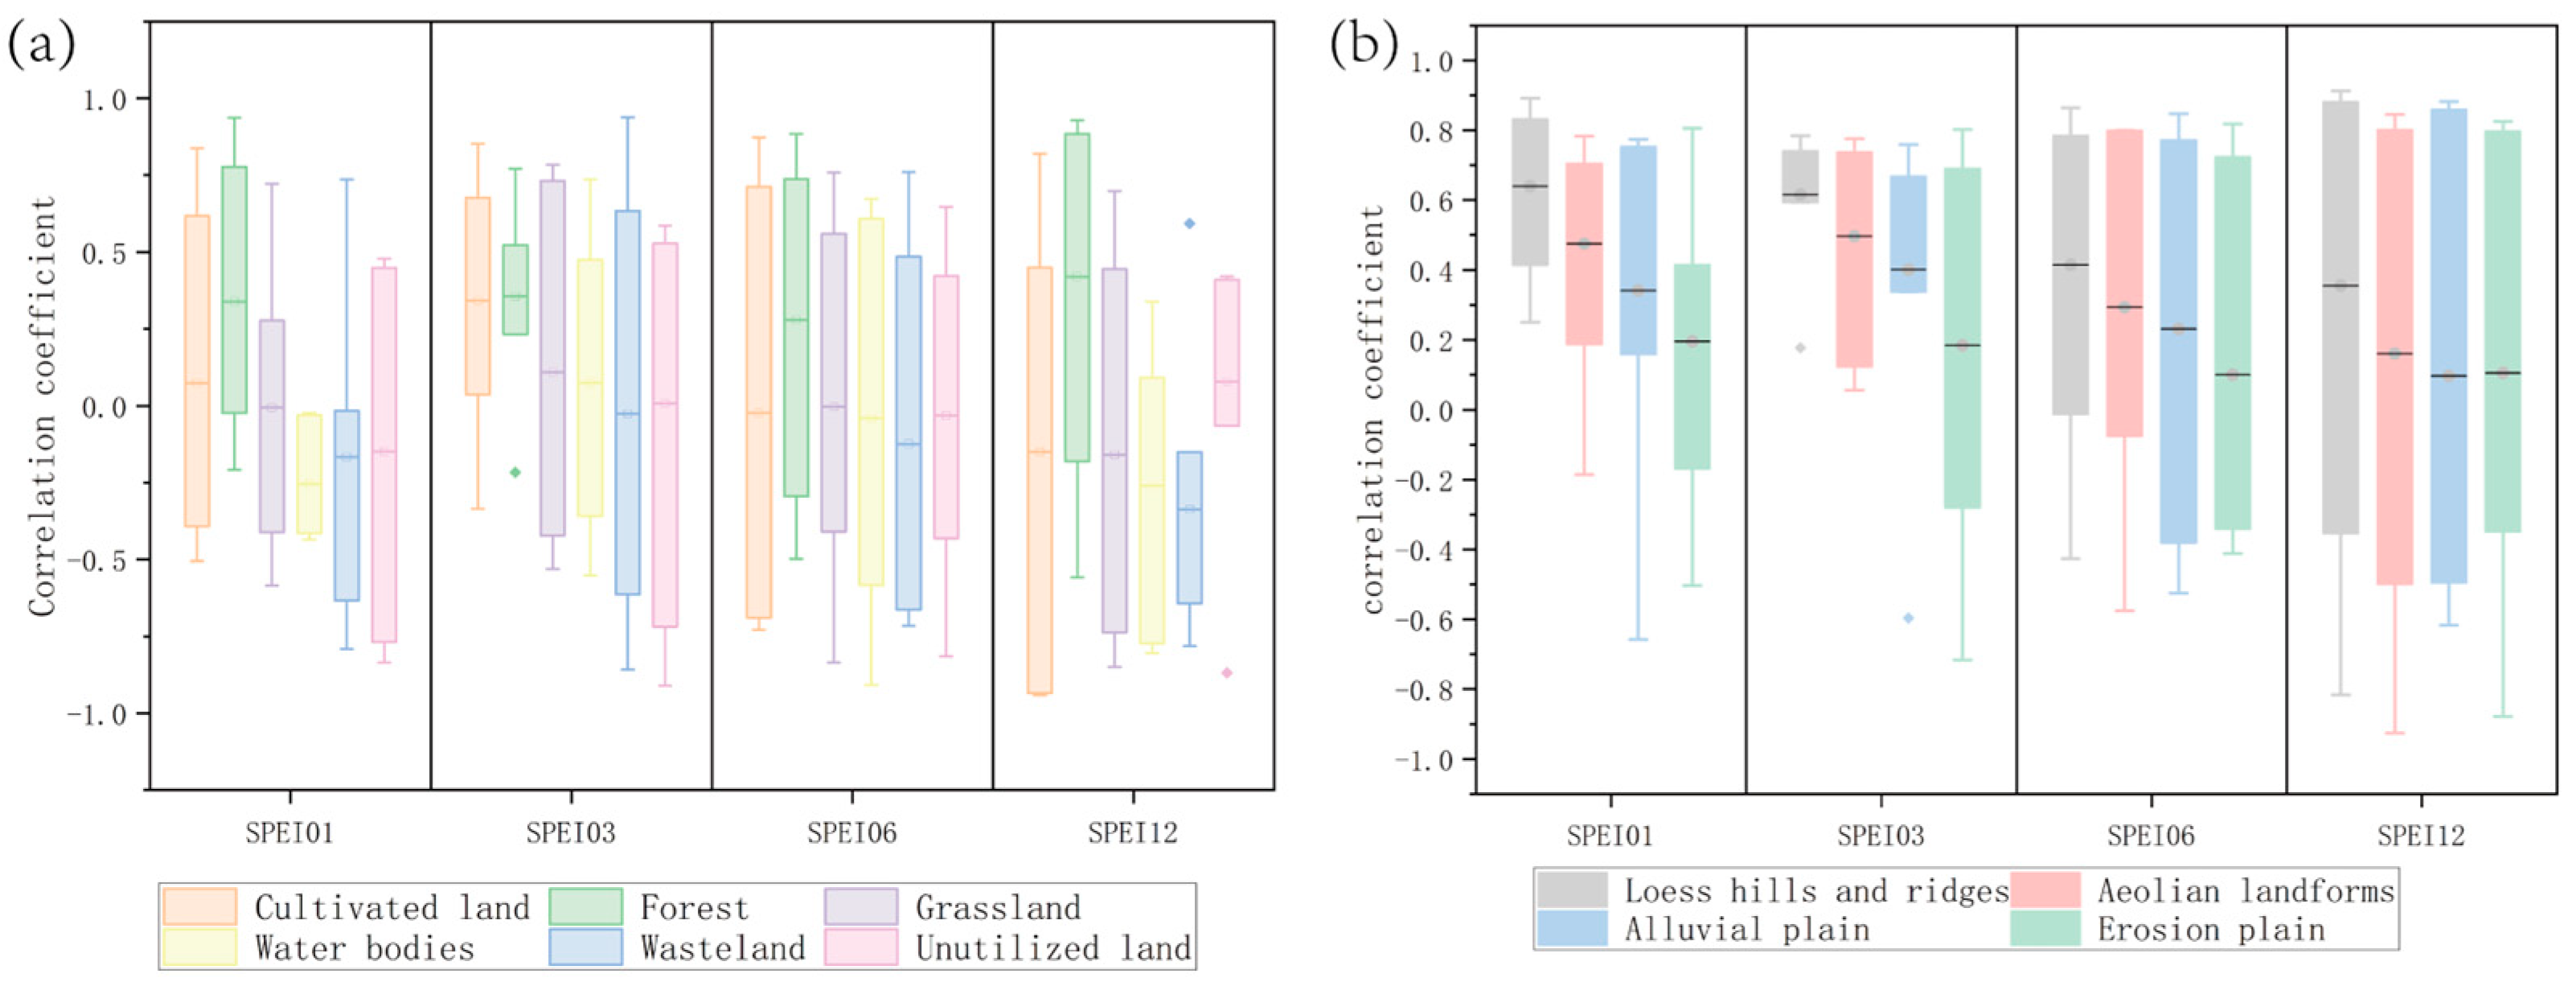
Table 4 reveals that, when considering a 1-month timeframe, there is a positive correlation between SPEI values and arable land as well as forests. The strongest correlation, reaching 33.9%, is observed with forests. The remaining data exhibit a negative association with grasslands, water bodies, barren land, and unused land, with the most significant negative correlation observed for water bodies at −25.4%. When looking at a 3-month timeframe, the SPEI values show a negative correlation of −2.6% only with barren land. On the other hand, they show a positive correlation with the other land types. The largest positive correlation is observed with forests at 35.6%, followed by arable land at 34.2%. When considering a time period of 6 months, the SPEI values show a positive correlation of 27.9% only with forests, while they exhibit a negative correlation with all other types of land, with the lowest correlation of −12.5% seen for barren land. When considering a 12-month timeframe, there is a positive relationship between SPEI values and forests and un-used land, with forests having the highest correlation at 42%. On the other hand, there is a negative relationship between SPEI values and the remaining land types, with barren land having the lowest correlation at −33.7%. Observations reveal a positive correlation between SPEI values and forest, and a negative correlation between SPEI values and barren land across four different time scales. Generally, SPEI and NDVI exhibited a high degree of correlation across various land use types at the 3-month scale. The 3-month scale not only accounted for the lag of vegetation soil water but also excluded the potential impacts of different stages of vegetation growth on the results over an extended time period. Hence, this paper contends that the 3-month scale provides a more accurate representation of the fundamental changes in land use in the Shendong Mining Area. When examining the distribution of land use in the entire study region, forests make up a mere 0.15% of the total area, while barren land accounts for only 1.06%. The predominant land use types in the study area are desert grasslands, which make up approximately 85% of the total area under investigation. Desert grasslands exhibit a clear pattern of becoming increasingly wet over on a 3-month scale, and a distinct occurrence of drought on a 12-month scale.

3.3.3. Correlation between Drought and Vegetation of Different Landforms

Based on the “Topographic Atlas of the People’s Republic of China (1:1 million)” and the imagery of the study area, the site can be classified into four micro-geomorphological units: mid-elevation loess ridges and hills, aeolian landforms, denudation plains, and low-altitude alluvial and floodplain landforms. The loess ridge and hill geomorphological type has the strongest link with drought, whereas the denudation plain type has the weakest correlation (Table 5). The vegetation growth of the loess ridge and hill geomorphological type is generally superior to that of the other geomorphological types, providing evidence for the overall increase in moisture levels in the study area (Figure 8). The correlations over the four considered time scales exhibit a gradual reduction, progressing from loess ridges and hills to aeolian landforms, then to alluvial and floodplain landforms, and finally to denudation plains. As the temporal scale increases, the link between drought and geomorphological vegetation decreases. The loess ridge and hill geomorphological type on the SPEI01 scale exhibits the highest correlation, reaching 63.9%. Conversely, the alluvial and floodplain landforms on the SPEI12 scale demonstrate the lowest correlation, measuring only 9.7%. Additionally, the denudation plains on the SPEI12 scale display a correlation of approximately 10.5%.

3.4. Interaction and Factor Analysis

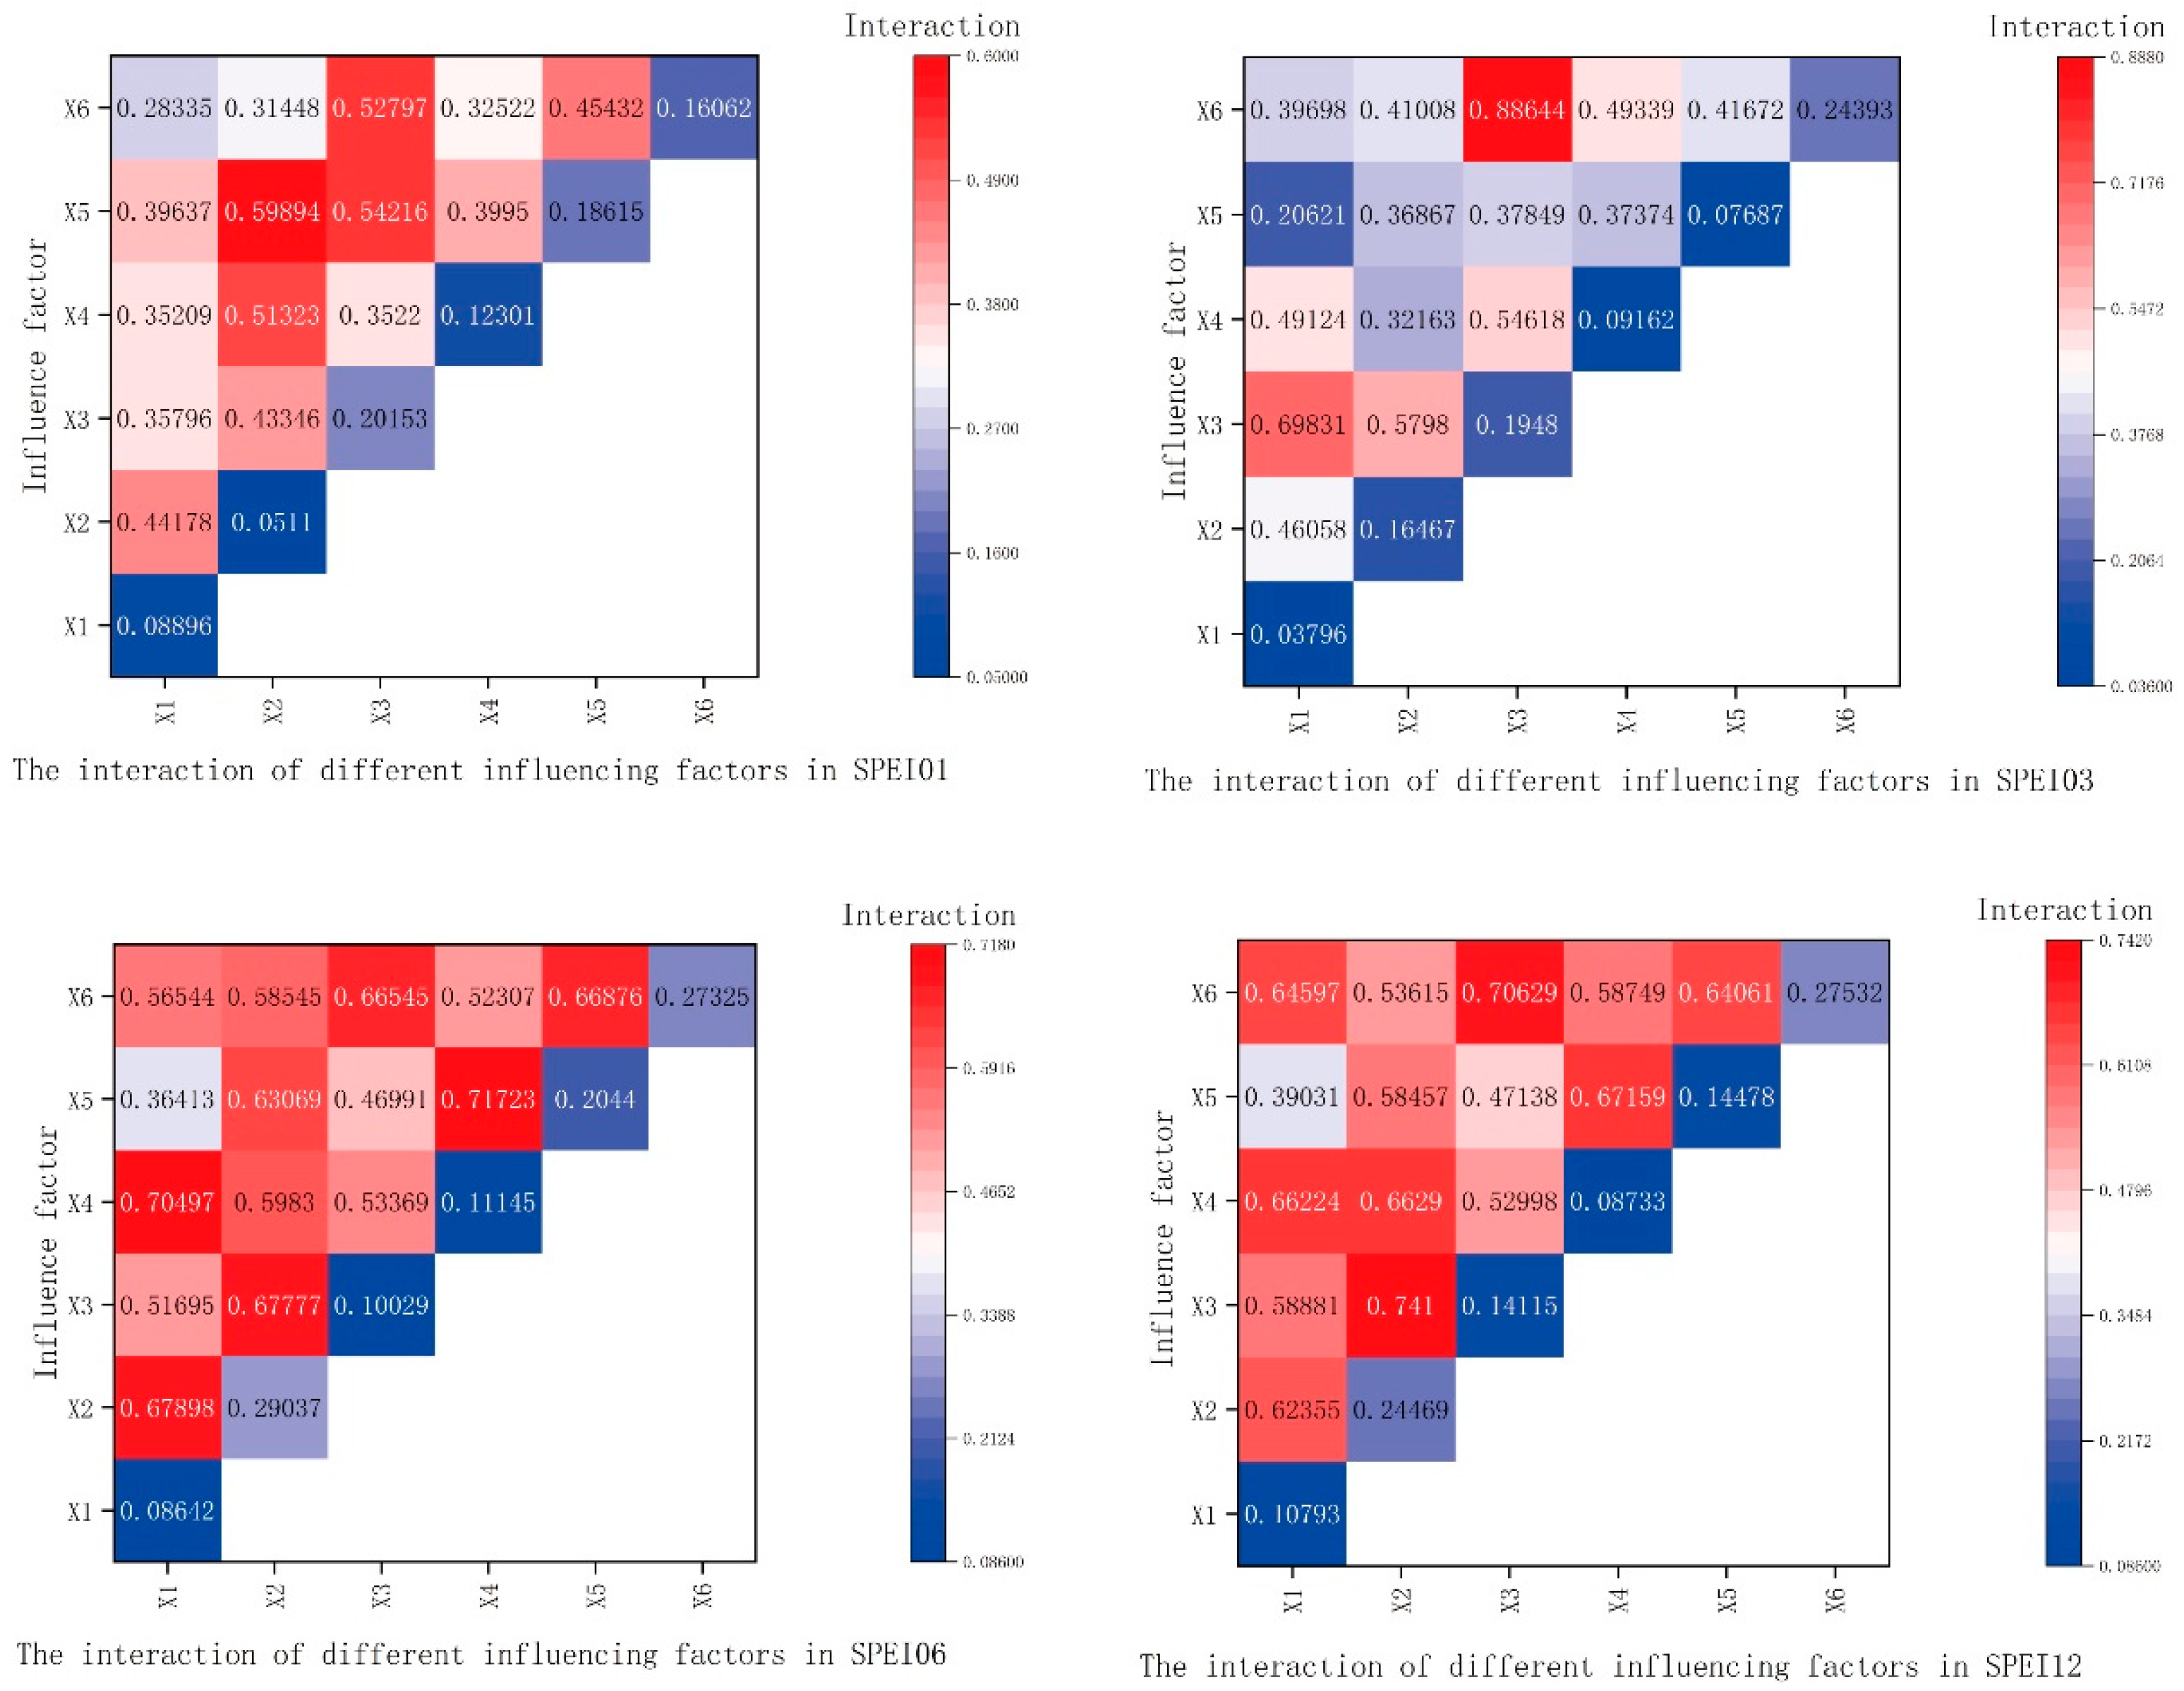
This paper presents an introduction to five meteorological components (temperature(X1), precipitation(X2), relative humidity(X3), relative wind speed(X4), and sunshine duration(X5)) and the NDVI(X6) as variables that influence the SPEI. It also employs the Geographic Detector for verification analysis and provides the subsequent results:
As can be seen from Figure 9, the NDVI exhibits a robust ability to explain SPEI values over different time scales, namely 1 month, 3 months, 6 months, and 12 months. Notably, the 12-month scale demonstrates statistical significance at a level of 0.1. The interaction between relative humidity and NDVI has a considerable impact on SPEI values across all time scales, taking into account the interactive impacts of numerous components. However, on the 1-month scale, the impact factors of these interactive effects do not reach 0.6. The synergistic impacts of temperature and precipitation, temperature and relative wind speed, precipitation and relative humidity, sunshine duration and NDVI, and other combinations exert a substantial influence on SPEI values at the 6- and 12-month timeframes. The 3-month scale of SPEI values is greatly influenced by relative humidity and temperature. On the other hand, the 12-month scale is significantly affected by the interaction between temperature and NDVI, as well as precipitation and wind speed. The majority of interactive effects exhibit non-linear enhancement. The interaction between NDVI and precipitation demonstrates dual-factor enhancement at the scales of 3, 6, and 12 months. Similarly, the interaction between NDVI and temperature, as well as relative wind speed, exhibits dual-factor enhancement at the 1-month scale. Likewise, the interaction between relative humidity and relative wind speed demonstrates dual-factor enhancement at the 1-month scale.
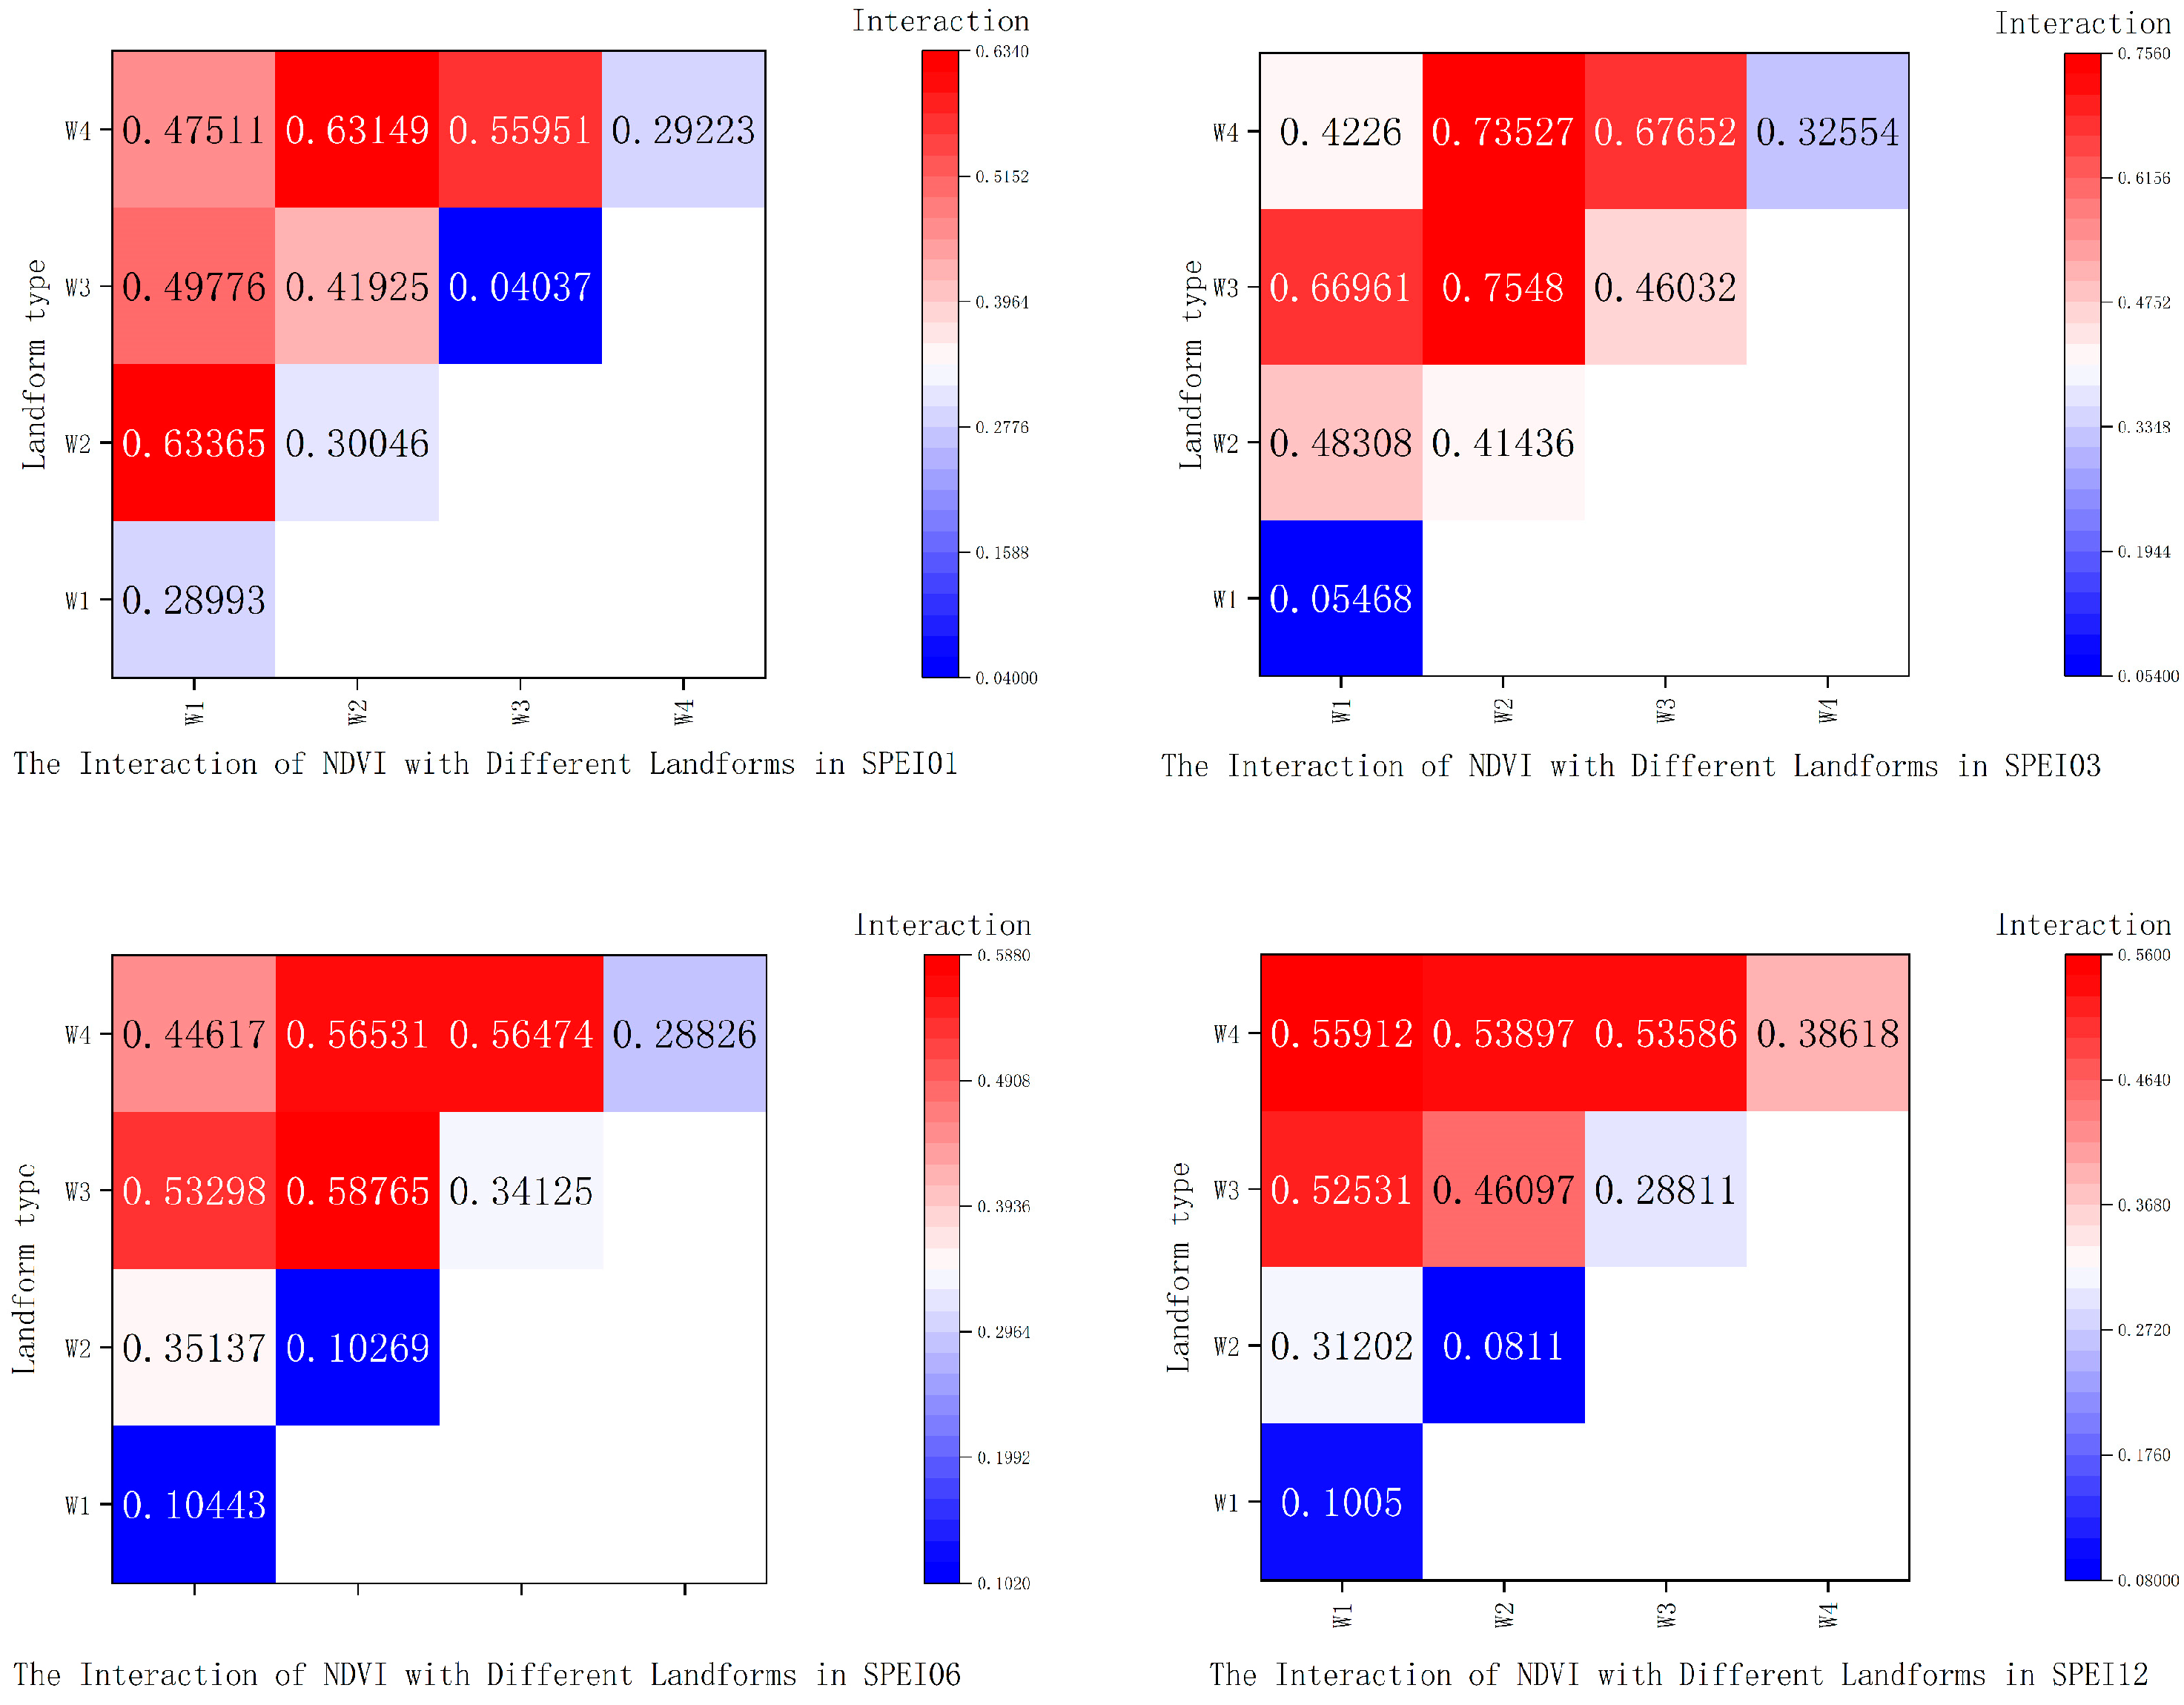
The provided information establishes that the NDVI has the most substantial influence on the SPEI, hence demonstrating the practical value of this study. This study subsequently examines the response of the NDVI to the SPEI across several geomorphological classifications. When examining the influence of various types of landforms on SPEI values (Figure 10), it was found that the alluvial and floodplain landform at low altitudes has a substantial impact on SPEI values at the 3-month time scale with a statistical significance of p < 0.05. Additionally, it has a significant impact at the 6-month time scale with a statistical significance of p < 0.1. When examining the influence of various terrains, only the interacting effects on the 1- and 3-month scales significantly affect the change in SPEI values by more than 0.6. The changes seen on the 6- and 12-month scales are not very noticeable. The relationship between aeolian landforms and denudation plains has a notable influence on SPEI values at the 1-month and 3-month scales. The impact of the interaction between loess ridges and hills and aeolian landforms is only significant at the 1-month scale. However, the interactions between alluvial and floodplain landforms with loess ridges and hills, denudation plains, and aeolian landforms have a significant impact on SPEI values at the 3-month scale. With the exception of the 3-month scale, where the multi-factor effect is mostly focused on dual-factor enhancement, the other three scales primarily exhibit non-linear enhancement. This suggests that the 3-month timeframe is more effective in forecasting future development trends.
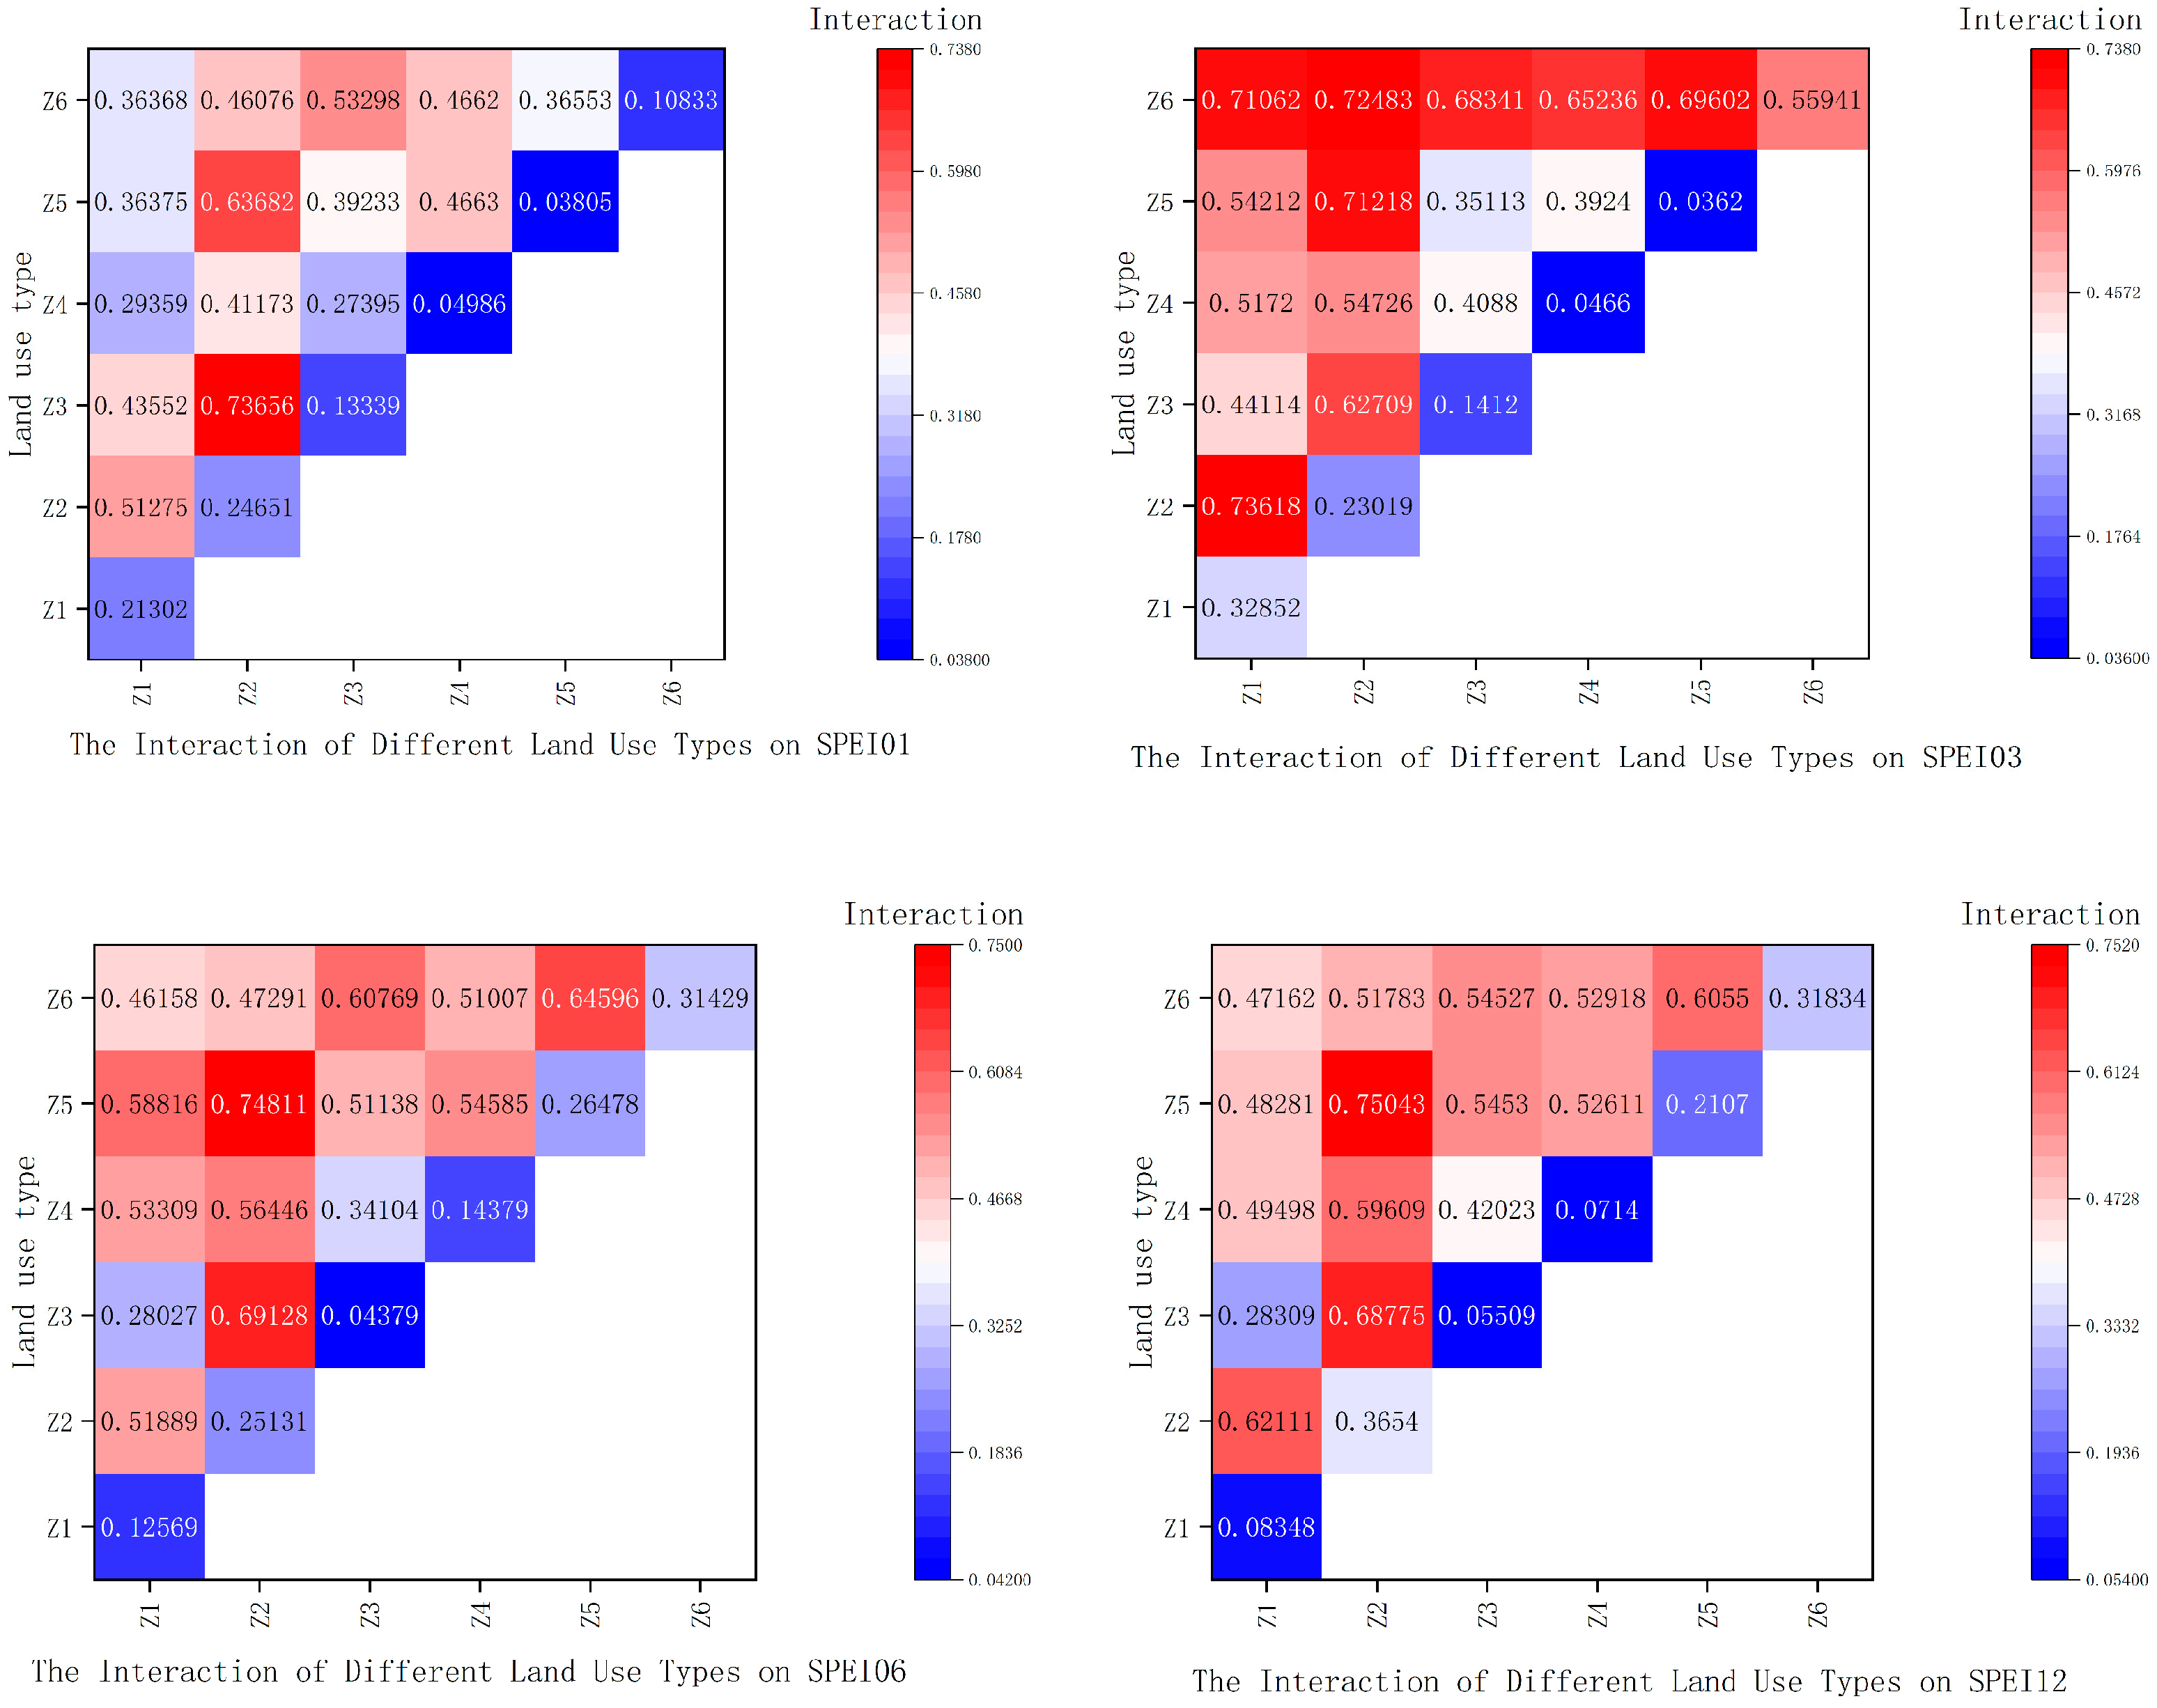
When examining the specific effects of various land use types (Figure 11), it was found that unused land has a significant influence on SPEI values over a 3-month scale, with statistical significance at a level of p < 0.01. Additionally, forests have a significant impact on SPEI values over a 12-month scale, passing the significance test with a level of p < 0.1. Other land use forms failed to meet the criteria for statistical significance at various time scales. The correlation between forests and barren land, as well as grasslands, significantly affects the SPEI values across all time scales. The correlation between barren land and unused land has a substantial impact at time intervals of 3, 6, and 12 months. The relationship between grasslands and unused land has a considerable impact on SPEI values at 3- and 6-month time scales. The correlation between arable land and forests has a substantial influence throughout the periods of 3- and 12-month scales. Unused land at the 3-month timeframe exhibits a significant impact on other land use categories, in addition to its own effects. At all the time scales, there is a dual-factor enhancement in the interaction between arable land and grasslands, as well as unused land. The correlation between forests and unused land exhibits a simultaneous increase in two factors at 3-, 6-, and 12-month scales. Similarly, the correlation between arable land and unused land demonstrates a simultaneous increase in two factors at 1-, 3-, and 6-month scales. On the other hand, the correlation between grasslands and arable land, as well as unused land, only exhibits a simultaneous increase in two factors at the 3-month scale. The relationship between arable land and water bodies only exhibits a mutually beneficial effect at the monthly scale. Non-linear amplification is observed in other land use interactions across all time scales. At the 3-month scale, it is evident that the majority of multi-factor interactions exhibit linear relationships, which demonstrate a reliable and predictable trend. This further confirms the importance of this research in further investigating the occurrence of meteorological drought on a seasonal scale, which is consistent with the conclusion above.

4. Discussion

4.1. Distribution Characteristics of Drought in the Study Area

Where the precipitation is relatively low, the study area is situated in an environmentally fragile zone at the intersection of Shanxi, Shaanxi, and Inner Mongolia. The numerical analysis shows that the linear trends of SPEI values on different time scales are not statistically significant. This finding aligns with the results of the Geographic Detector, which indicate that the non-linear enhancement is the key factor influencing the trends. In all of the time scales, the mean SPEI values are negative, suggesting that the research area is now experiencing dry conditions. However, there has been a substantial increase in humidity since 2016, indicating major changes in the natural environment of the study area over the previous decade. On the monthly scale, the majority of the study area exhibits a declining pattern, particularly on the eastern side. This aligns with the research conducted by Xiao Anguo et al., who employed modal decomposition to analyze the spatial and temporal features of dry and wet variations in the northwest region. Their findings indicate a general tendency towards drought on a monthly basis [34]. Several researchers have endeavored to examine the distinctions between monthly scales and other scales in relation to flash droughts, aiming to differentiate the various effects of prolonged and brief meteorological droughts on vegetation alterations. Flash droughts are drought occurrences that occur relatively quickly over a short period of time [35]. Certain regions within the study area experience significant coal mining activities that have a large-scale and high-intensity impact. These disturbances alter the surface and result in reduced vegetation cover, ultimately affecting the regional drought condition. Specifically, the northwest side of the study area, which is near the Maowusu Sandy Land, is more susceptible to drought due to precipitation factors [36]. On the other hand, the southeast side is close to an ecologically fragile area at the pastoral–agricultural boundary. This region has a substantial water storage capacity for agriculture and animal husbandry, which could contribute to the observed regional drought trend. Simultaneously, the northwest region of China is located in the central part of the Eurasian continent and is strongly affected by the atmospheric circulation of the continent. This might result in different levels of anomalous sinking motion and inadequate supply of water vapor. Furthermore, scientific evidence has demonstrated that the variations in the El Niño–Southern Oscillation (ENSO) have a definite influence on drought occurrences in the Loess Plateau region. Specifically, the El Niño phenomenon causes abnormal rises in sea temperatures and more frequent meteorological droughts. This was observed during the periods of 1986–1987 and 1997–1998, when El Niño events took place and intensified the drought conditions in the study area. These findings align with the conclusions presented in this paper [37].
This research examines the long-term variations in SPEI values throughout different seasons throughout the year. Numerically, with the exception of two years of intense winter drought, the remaining years experienced only moderate drought. During winter, the Mongolian–Siberian high-pressure system forms in central Asia, bringing powerful dry winds from the northwest. As it moves into northern China, it can cause cold wave events characterized by reduced precipitation and lower temperatures. The proximity of the western section of the study region to the origin of winter winds increases its susceptibility to drought patterns. During the spring season, the northern region experiences reduced rainfall and increased evaporation, leading to the formation of spring drought. As a result, the study area exhibits a noticeable intensification of drought conditions, particularly in the vicinity of the Maowusu Sandy Land. During summer, the interaction between water and heat enhances, resulting in an upward fluctuation in the trend of SPEI values in the southern region of the study area. The delay in the absorption of precipitation by vegetation causes a lag effect [38]. Despite the presence of summer rainfall in the study area, the conditions for vegetation in terms of water and heat are more favorable in autumn. As a result, the SPEI values in the study area exhibit a consistent upward trend during autumn, with the south experiencing a faster rate of increase compared to the north. Ji Zhenxia et al. discovered that the initiation and termination of the vegetation growth season are greatly influenced by seasonal climate factors. Precipitation in spring primarily determines the beginning of the season, while temperature in autumn mainly determines its end [39]. These findings have a crucial impact on the restoration of vegetation in mining areas.
More precisely, it can be noted that the areas where the rate of change in SPEI values is relatively low are predominantly located in close proximity to the clusters of mines in the research area. Due to the mining activities involving coal, the surface in close proximity to the mines is susceptible to collapse and deformation. Additionally, the rate at which surface water infiltrates is rapid, which further aggravates soil erosion. It is evident that the presence of human activities, particularly mining, in the study area has a substantial influence on the observed changes in SPEI values. Recently, the Shendong Mining Area has implemented numerous land reclamation projects following coal mining. These efforts have resulted in a decrease in soil erosion, the establishment of wind-break and sand-fixing vegetation, an enhancement in the water retention capacity of the area, and subsequently, an increase in surface water content. In general, the severity of surface dryness is decreasing, and there is a significant improvement in vegetation coverage [24].

4.2. Temporal and Spatial Changes in Vegetation Coverage in the Study Area

The NDVI has greater values in the southeast region and lower values in the northwest region. Through the recent completion of ecological restoration initiatives in the Shendong Mining Area, vegetation cover has significantly improved over time. The mean annual NDVI in the research area varies between 0.2 and 0.3, with areas showing improvement comprising over 50% of the total study area [40]. Nevertheless, several regions have experienced a drop in vegetation cover in recent years due to the impact of mining activities and the presence of human activities. Previous studies have shown that in arid and semi-arid regions where shrubs and other low vegetation dominate, changes in vegetation cover are highly influenced by numerous factors [24]. Among these factors, precipitation plays a more significant role in vegetation recovery in Northern Shaanxi compared to temperature [41]. This study revealed that regions with more vegetation cover are primarily situated in the southeastern part of the study area. These regions are closer to the monsoon climate zone, which offers more favorable conditions in terms of water and heat combination. Consequently, the NDVI values in these areas are significantly higher [42].
The research region is predominantly covered by low vegetation, as shown by the low NDVI values. The areas with low NDVI values are primarily located in the northern part of the study area. The predominance of low shrub vegetation in the research region is primarily found on the north side, characterized by its relatively low height and limited coverage. The medium vegetation cover area is located in the southeastern part of the research area, which is closer to the monsoon climate and receives more copious precipitation. This area is characterized by mountainous topography rather than plateaus, with more pronounced variations in elevation, resulting in considerably higher vegetation coverage. Regarding the trend in NDVI changes, there is an overall increase, which aligns with previous research [43]. However, areas with low NDVI values that are impacted by mining and human activities show a slower rate of increase. On the other hand, the southeast region, which has concentrated high value areas, exhibits a less significant increase in the NDVI. This suggests that other factors also influence the changes in the NDVI in this region.

4.3. Impact of Land Use and Landform Types on SPEI

Forests exhibit the strongest positive relationship with SPEI values over other land use types, while barren land demonstrates the most pronounced negative correlation. Meteorological conditions remain the primary natural cause. Forests, being a form of plant ecosystem that requires a lot of water, are naturally very responsive to the specific biological conditions of their surroundings [44]. Forests possess robust water storage and retention capacities, and their transpiration rates are also high. Consequently, areas with forests have a generally healthy local ecosystem and have relatively high SPEI values. In contrast, baren land lacks significant vegetation cover and has limited flora diversity, little precipitation, and high evaporation. Forests exhibit exceptional vegetation regeneration capacities, possibly attributed to the durability of their root systems and the regenerative capacity of trees [45]. Furthermore, the research area has a temperate continental environment characterized by significant fluctuations in temperature throughout the year and substantial year-to-year variations in rainfall. These climatic conditions can potentially hinder the region’s vegetation regeneration capacity [46]. Furthermore, the research area is characterized by extensive mining operations, and human activities exert a significant influence on vegetation, resulting in numerous instances of surface collapses and vegetation degradation. These factors might further worsen the prevailing drought conditions in the region.
Based on the research findings, the type of landforms can have a major impact on how plants respond to meteorological droughts during a period of 1- and 3-month scales. However, the influence of landforms on vegetation response becomes less clear over longer time scales. As the altitude increases, the air moisture content is lower in geomorphological units such as mid-altitude loess ridges and aeolian landforms compared to low-altitude alluvial and floodplain landforms. The evaporation speed is faster in these areas, and the surface of loess ridges is uneven with steep terrain, loose soil, and sparse vegetation. This makes it difficult to retain water, leading to soil erosion and worsening drought conditions. Consequently, drought phenomena are intensified [47]. The correlation between denudation plains and drought is relatively low at all scales, likely due to the flat terrain of the denudation plains. This flat terrain promotes water retention and distribution, preventing rapid water loss and inhibiting the occurrence of drought.

4.4. Factors Affecting the Spatiotemporal Variation in SPEI

Numerous drought indices, such as SPEI, SPI, SMDI, and MCI, have been extensively utilized in research. Some scholars merely discuss the spatiotemporal distribution characteristics of the drought index. Some scholars have further investigated the response relationship between the drought index and vegetation growth. Hao Yan et al. examined the spatiotemporal characteristics of the response of the net primary productivity of vegetation to meteorological drought on a national scale [48]. The construction method of the SPEI in that paper is in accordance with that in this paper, and it can be observed that the SPEI demonstrates good adaptability to different scale study areas. Research conducted on a national scale can better grasp the macro characteristics; however, its guiding significance for the specific regional vegetation ecological restoration and coping with drought is limited. Therefore, the Shendong Mining Area is selected as a typical area in this paper when choosing the research area, and the research results can offer references for the ecological restoration work in the subsequent mining area. The study by Gao Yu et al. on the temporal and spatial variation in drought in North China and its impact on vegetation is largely consistent with the method adopted in this paper [49]. It is notable that the Copula function is employed in this paper to fit the SPEI and NVDI, thereby obtaining the joint distribution function, which can better elucidate the relationship between SPEI and NDVI. But unfortunately, this method is not applicable to the study on the micro area. Even though the accuracy of the NDVI-related dataset can be enhanced to approximately 30 m, the SPEI is currently mainly calculated through interpolation of meteorological stations, making it difficult to improve to a higher precision, and there are certain errors [50].
However, at present, few scholars have conducted further studies on the influencing factors after discussing the response relationship. Therefore, this paper not only carried out a confirmatory study on the influencing factors but also paid particular attention to the impact of NDVI differences on the SPEI response in different landforms and terrains, in order to better refine the relationship between the SPEI and NDVI on a small regional scale. Furthermore, human activities have an impact on the alterations in NDVI values, which subsequently influence SPEI values. Over the past few years, the Shendong Mining Area has implemented numerous ecological restoration and land consolidation initiatives. These projects have altered the physical and chemical characteristics of the soil in the study region, consequently impacting vegetation cover and the fluctuations in SPEI values [9].
To summarize, the annual average SPEI values show constant variations throughout all time scales, except for the monthly scale. The monthly scale is influenced by air motion and is prone to unexpected droughts. The variations in SPEI values at the seasonal level exhibit evident periodic patterns, which are strongly linked to the development cycle of vegetation, water requirements, and evaporation. Water scarcity in arid regions restricts the growth of plants, and prolonged lack of water encourages the development of root systems. This allows vegetation to withstand extended periods of drought by implementing effective water usage techniques and improving their ability to adapt to challenging conditions [45]. The influence of the NDVI on the variations in SPEI values surpasses that of other meteorological factors, while the influence of geomorphological types on SPEI values is marginally smaller on a long-term scale compared to a short-term scale. Forests and barren lands have a greater impact on the fluctuations in SPEI values. The influence of natural land use types on SPEI values is more significant compared to artificial intervention, suggesting that artificial ecological restoration can somewhat enhance the regional climatic dry conditions.

5. Conclusions

Firstly, the study area has a general tendency towards increased wetness, with a more rapid rate of change in recent years. Seasonally, there are predictable cyclic alterations. This study revealed that between 1986 and 2020, the level of wetness in the southern region of the Shendong Mining Area exhibited a more noticeable increase compared to the northern region. Furthermore, the rate of this increase has intensified since 2016. The Shendong Mining Area is susceptible to drought throughout the spring, with the possibility of drought occurring in the western region of the mining area during the summer and winter, due to the influence of climatic conditions. In fall, the area experiences favorable conditions for the mixing of water and heat, with a milder level of meteorological drought.
Furthermore, there is a distinct geographical variation in NDVI values, with higher values observed in the southeastern region and lower values in the northwestern region. The majority of locations within the research area exhibit a positive trend in vegetation regeneration. In regions characterized by lower elevation, the combination of water and heat conditions is more favorable, making them suited for the growth of irrigation agriculture. Additionally, these locations exhibit significantly higher NDVI values. In regions characterized by elevated topography, the temperature tends to be comparatively lower, while the wind speed is higher. These factors influence the thickness of the soil layer and the accumulation of nutrients, leading to relatively lower values of NDVI. Vegetation cover in most places has experienced a partial restoration in recent years, mostly due to the progress made in ecological restoration programs. The recovery impacts have been particularly notable in important management areas.
The impact of regional meteorological drought on vegetation cover in the Shendong Mining Area is significant. However, when examined on a smaller level, it becomes more apparent that it is influenced by various other factors. The relationship between NDVI and SPEI values shows a higher proportion of significant positive correlation as the time scale increases, influenced by meteorological variables. The correlation between variables is notably strong on a monthly basis, representing less than 5% of the Shendong Mining Area. However, when considering a longer timeframe of 12 months, the correlation encompasses almost 85% of the research area. When assessing the immediate effects of the NDVI on the SPEI, it is important to take into account not only changes in the natural environment and climate, but also other aspects such as human activities. Specifically, human activities during the spring season are more likely to contribute to drought occurrences. The long-term incidence of drought in the area is mostly attributed to alterations in the natural environment, with human impact gradually receding.
Forests and barren lands exert a significant influence on SPEI values despite occupying a relatively smaller geographical extent. The predominant land use in the area is grassland, which has a relatively minor influence on SPEI. The surfaces of temperate grasslands are adorned with herbaceous plants, which have an impact on the movement and rate of evaporation of soil moisture. The topography is predominantly level and with little vegetation transpiration; the water cycle process is less complex; and the variation in precipitation and evaporation is relatively mild. When implementing ecological restoration projects, it is advisable to create a varied assemblage of vegetation, primarily consisting of drought-tolerant low shrubs and herbaceous plants, in order to reduce water loss.
As the time scale decreases, the altitude increases, and the terrain gradient becomes steeper, the association with drought becomes stronger. The mid-altitude loess ridge area in the Shendong Mining Area exhibits a loose soil composition and inadequate water retention capacity, which is strongly associated with the frequency of drought occurrences. The alluvial and floodplain regions at lower altitudes possess soil that is highly productive. While there are some indications of human activity, the connection with drought episodes remains relatively weak. Hence, it is advisable to give priority to the rehabilitation of the loess ridge regions that are experiencing significant soil erosion.

Author Contributions

Conceptualization, Z.C. and X.Z.; methodology, Z.C. and S.W.; software, H.Q. and H.X.; validation, H.Q. and Z.C.; formal analysis, Z.C., X.Z. and H.Z.; writing—original draft preparation, H.Q.; writing—review and editing, H.Z., Z.C., X.Z., H.X. and S.W.; visualization, H.Q. All authors have read and agreed to the published version of the manuscript.

Funding

The author(s) declare that financial support was received for the research, authorship, and/or publication of this article. This work was supported by the State Key Project of the National Natural Science Foundation of China—Key projects of the joint fund for regional innovation and development (grant number U22A20620 U21A20108); the Doctoral Science Foundation of Henan Polytechnic University (grant number B2021-20); and the China Shenhua Shendong Science and Technology Innovation Project (grant number E210100573).

Data Availability Statement

The 1 km resolution monthly precipitation dataset (1901–2022) and the 1 km resolution monthly temperature dataset (1901–2022) of China are from the Tibetan Plateau Data Center (https://www.tpdc.ac.cn/home) (accessed on 9 March 2024). The daily surface meteorological dataset (V3.0) (1951–2020) of China is from the National Meteorological Information Center (https://data.cma.cn/). The three datasets of LANDSAT/LT05/C01/T1_8DAY_NDVI, LANDSAT/LE07/C01/T1_8DAY_NDVI, and LANDSAT/LC08/C01/T1_8DAY_NDVI are from Google Earth Engine (https://earthengine.google.com/). The land use type data comes from the 1985-2022 provincial-level annual land surface cover product (CLCD) of China, produced by the team of Professors Yang Jie and Huang Xin from Wuhan University (https://zenodo.org/records/4417809) (accessed on 28 March 2024). The geomorphological-type data come from the ““Topographic Atlas of the People’s Republic of China (1:1 million)”” by the Earth Resources Data Cloud (https://www.tpdc.ac.cn/home) (accessed on 28 March 2024).

Acknowledgments

The authors thank all the reviewers for their insightful suggestions, which have greatly improved the quality of this paper.

Conflicts of Interest

The authors declare no conflicts of interest.

References

  1. Core Writing Team; Pachauri, R.K.; Meyer, L.A. (Eds.) Climate Change 2014: Synthesis Report. In Contribution of Working Groups I, II and III to the Fifth Assessment Report of the Intergovernmental Panel on Climate Change; IPCC: Geneva, Switzerland, 2014. [Google Scholar]
  2. Mann, M.E.; Zhang, Z.; Rutherford, S.; Bradley, R.; Hughes, M.; Shindell, D.; Ammann, C.; Faluvegi, G.; Ni, F. Global signatures and dynamical origins of the Little Ice Age and Medieval Climate Anomaly. Science 2009, 326, 1256–1260. [Google Scholar] [CrossRef] [PubMed]
  3. Diffenbaugh, N.S.; Scherer, S.J. Observational and model evidence of stronger heat waves under global warming. Proc. Natl. Acad. Sci. USA 2011, 108, 16745–16750. [Google Scholar]
  4. Dai, A. Drought under global warming: A review. Wiley Interdiscip. Rev. Clim. Change 2012, 3, 57–79. [Google Scholar] [CrossRef]
  5. Trenberth, K.E. Changes in precipitation with climate change. Clim. Res. 2011, 47, 123–138. [Google Scholar] [CrossRef]
  6. Hoerling, M.; Kumar, A. The perfect ocean for drought. Science 2003, 299, 691–694. [Google Scholar] [CrossRef] [PubMed]
  7. UNEP. The Front Line: Shoreline to Alpine Summit—The Global Environmental Outlook for the Environment; United Nations Environment Programme: Nairobi, Kenya, 2008. [Google Scholar]
  8. Wilhite, D.A. Drought and Water Crises: Science, Technology, and Management Issues; CRC Press: Boca Raton, FL, USA, 2005. [Google Scholar]
  9. Smith, T.; Boers, N. Global vegetation resilience linked to water availability and variability. Nat. Commun. 2023, 14, 498. [Google Scholar] [CrossRef] [PubMed]
  10. Liu, K.; Li, X.; Wang, S.; Zhou, G. Past and future adverse response of terrestrial water storages to increased vegetation growth in drylands. npj Clim. Atmos. Sci. 2023, 6, 113. [Google Scholar] [CrossRef]
  11. Lian, X.; Piao, S.; Chen, A.; Huntingford, C.; Fu, B.; Li, L.Z.X.; Huang, J.; Sheffield, J.; Berg, A.M.; Keenan, T.F.; et al. Multifaceted characteristics of dryland aridity changes in a warming world. Nat. Rev. Earth Environ. 2021, 2, 232–250. [Google Scholar] [CrossRef]
  12. Chen, Y.N.; Li, Y.P.; Li, Z.; Liu, Y.C.; Huang, W.J.; Liu, X.G.; Feng, M.Q. Analysis of the Impact of Global Climate Change on Dryland Areas. Adv. Earth Sci. 2022, 37, 111–119. [Google Scholar]
  13. Sungmin, O.; Seon, K.P. Global ecosystem responses to flash droughts are modulated by background climate and vegetation conditions. Commun. Earth Environ. 2024, 5, 88. [Google Scholar]
  14. Liu, H.; Jiang, L.L.; Liu, B. The characteristics of drought in China over the past 40 years and its impact on vegetation changes. Acta Ecol. Sin. 2023, 43, 7936–7949. [Google Scholar]
  15. Zhang, Y.; Gu, T.; He, S.; Cheng, F.; Wang, J.; Ye, H.; Zhang, Y.; Su, H.; Li, Q. Extreme drought along the tropic of cancer (Yunnan section) and its impact on vegetation. Sci. Rep. 2024, 14, 7508. [Google Scholar] [CrossRef] [PubMed]
  16. Zhang, G.X.; Su, X.L.; Hao, L.N.; Wu, H.J. Response of vegetation to drought based on NDVI and scPDSI datasets from 1982 to 2015 across China. Trans. Chin. Soc. Agric. Eng. 2019, 35, 145–151. [Google Scholar]
  17. Wang, T.Y.; Wang, P.; Wu, Z.N. Progress in the study of ecological resilience of vegetation under drought stress. Adv. Earth Sci. 2023, 38, 790–801. [Google Scholar]
  18. Ding, Y.B. Research on the Response of Different Types of Vegetation in Northern China to Drought and the Future Trend of Vegetation Coverage Change. Master’s Thesis, Northwest A&F University, Xianyang, China, 2021. [Google Scholar]
  19. Li, Y.Y.; Dong, G.T.; Xue, H.Z.; Zheng, Y.C.; Lian, Y.K. Impact of multi-timescale meteorological drought on vegetation from 1982 to 2020 in the Yellow River Basin. J. Soil Water Conserv. 2024, 38, 187–196. [Google Scholar]
  20. Wang, Z.; Fu, B.; Wu, X. Vegetation resilience does not increase consistently with greening in China’s Loess Plateau. Commun. Earth Environ. 2023, 4, 336. [Google Scholar] [CrossRef]
  21. Ma, W.S.; Ma, C.; Zhao, P.F.; Liu, W.W.; Ma, W. Trend of NDVI3g change and climatic response from 1982 to 2013 in the Lu’an mining area. Environ. Sci. Res. 2017, 30, 1050–1058. [Google Scholar]
  22. Ma, J.Z.; Hao, L. Spatiotemporal variation characteristics of drought in the Xilingol grassland based on SPI and SPEI indices. Pratacultural Sci. 2021, 38, 2327–2339. [Google Scholar]
  23. Lu, J.Q.; Meng, F.H.; Luo, M. The Impact of Meteorological and Hydrological Drought Changes in the Inner Mongolia Section of the Yellow River Basin on Vegetation NDVI [J/OL]. Renmin Pearl River 2024, 45, 1–14. [Google Scholar]
  24. Xu, J.; Wang, L.; Wang, Y. Spatiotemporal dynamics of vegetation NDVI from 2000 to 2017 in the Shendong mining area. Res. Soil Water Conserv. 2021, 28, 153–158. [Google Scholar]
  25. Shao, T.Y.; Bao, S.Q.; Wang, N. Monitoring of spatiotemporal dynamic changes of drought based on TVDI—Taking the Shendong mining area as an example. J. Irrig. Drain. 2023, 42, 59–66. [Google Scholar]
  26. Wang, X.Y.; Yang, J.; Lin, L.G. Study on the spatiotemporal variation rules of vegetation coverage in Shaanxi Province based on Sen+Mann-Kendall. Agric. Technol. 2023, 43, 62–66. [Google Scholar]
  27. Liu, X.J.; Xiao, J. Research on the runoff variation of the Weihe River from 1956 to 2016 based on the MK test and wavelet analysis method. Shaanxi Water Resour. 2023, 9, 32–34. [Google Scholar]
  28. Wang, Y.B.; Zhang, G.Y.; Liu, Y.Y. Research on the evolution of vegetation pattern and its driving mechanism in the Yanhe River Basin. J. Ecol. Rural. Environ. 2024, 1–23. [Google Scholar]
  29. Tian, J.X. Research on the Warming and Humidification Trend of Climate in Northwest China and Its Impact on Vegetation Restoration. Master’s Thesis, Nanjing Forestry University, Nanjing, China, 2023. [Google Scholar]
  30. Zhao, Y.Q.; Wei, T.X. Changes in vegetation coverage and influencing factors from 1990 to 2020 in typical counties of the Loess Plateau. Res. Arid. Zone 2024, 41, 147–156. [Google Scholar]
  31. Li, X.; Wang, X.K.; Liu, X.H. Spatiotemporal change and climatic factor detection of vegetation NDVI from 2000 to 2020 in Shaanxi Province. Res. Soil Water Conserv. 2024, 31, 443–453. [Google Scholar]
  32. Yue, H.; Liu, Y.; Zhu, R. Monitoring of ecological environment changes in the Shendong mining area based on remote sensing ecological indices. Bull. Soil Water Conserv. 2019, 39, 101–107+114. [Google Scholar]
  33. Li, D.; An, L.; Zhong, S.; Shen, L.; Wu, S. Declining coupling between vegetation and drought over the past three decades. Glob. Chang. Biol. 2024, 30, e17141. [Google Scholar] [CrossRef] [PubMed]
  34. Dong, X.; Zhou, Y.; Liang, J.; Zou, D.; Wu, J.; Wang, J. Assessment of Spatiotemporal Patterns and the Effect of the Relationship between Meteorological Drought and Vegetation Dynamics in the Yangtze River Basin Based on Remotely Sensed Data. Remote Sens. 2023, 15, 3641. [Google Scholar] [CrossRef]
  35. Xiao, A.G.; Maidimu, M.; Huang, C.J. Spatiotemporal characteristics of dry and wet changes in Northwest China from 1901 to 2020. Quat. Sci. 2023, 43, 1730–1738. [Google Scholar]
  36. Yuan, X.; Wang, Y.M.; Zhang, M. Some thoughts on sudden drought research. J. Atmos. Sci. 2020, 43, 1086–1095. [Google Scholar]
  37. Lin, J.; Bo, W.; Dong, X.; Zhang, R.; Yan, J.P.; Chen, T. Evolution of vegetation cover and impacts of climate change and human activities in arid regions of Northwest China: A Mu Us Sandy Land case. Environ. Dev. Sustain. 2024, 3, 1–20. [Google Scholar] [CrossRef]
  38. Wang, J.R.; Sun, C.J.; Zheng, Z.J.; Li, X.M. Drought characteristics and their relationship with atmospheric circulation in the Loess Plateau over the past 57 years. Acta Ecol. Sin. 2021, 41, 5340–5351. [Google Scholar]
  39. Gao, X.Y.; Hao, H.C.; Zhang, X.Q.; Chen, Y.N. Response of vegetation water use efficiency changes to meteorological elements in arid areas of Northwest China—Taking Xinjiang as an example. Arid. Zone Geogr. 2023, 46, 1111–1120. [Google Scholar]
  40. Ji, Z.X.; Pei, T.T.; Chen, Y.; Qin, G.X.; Hou, Q.Q.; Xie, B.P.; Wu, H.W. Changes in vegetation phenology in the Loess Plateau and its response to seasonal climate change. Acta Ecol. Sin. 2021, 41, 6600–6612. [Google Scholar]
  41. Li, H.T.; Li, N.; Xian, M.R. Spatiotemporal change analysis of vegetation coverage in the Shendong mining area based on MODIS. For. Constr. 2021, 5, 47–52. [Google Scholar]
  42. Kong, X.; Mao, J.; Chen, H.; Wang, Y.; Zhang, Y.; Shi, X.; Jin, M. Exploring the environmental drivers of vegetation seasonality changes in the northern extratropical latitudes: A quantitative analysis. Environ. Res. Lett. 2023, 18, 094071. [Google Scholar] [CrossRef]
  43. Zhou, L.H.; Zhang, K. Spatiotemporal change of vegetation coverage and its influencing factors in Yan’an City from 2000 to 2020. Bull. Soil Water Conserv. 2023, 43, 356–365. [Google Scholar]
  44. Song, Y.; Jiao, W.; Wang, J.; Wang, L. Increased global vegetation productivity despite rising atmospheric dryness over the last two decades. Earth’s Future 2022, 10, e2021EF002634. [Google Scholar] [CrossRef]
  45. Matthew, P.D.; Erika, K.W.; William, K.S. Reduced tree growth in the semiarid United States due to asymmetric responses to intensifying precipitation extremes. Sci. Adv. 2019, 5, eaaw0667. [Google Scholar]
  46. Liu, S.H.; Xue, L.Q.; Ying, X.; Yang, M.J.; Liu, Y.H.; Han, Q.; Ma, J.T. Dynamic process of ecosystem water use efficiency and response to drought in the Yellow River Basin, China. Sci. Total Environ. 2024, 934, 173339. [Google Scholar] [CrossRef] [PubMed]
  47. Yu, J.H.; Wang, W.G.; Chen, Z.F. The impact of global arid areas’ saturated vapor pressure deficit and root zone soil moisture changes on vegetation productivity and its causes. Acta Ecol. Sin. 2024, 11, 1–12. [Google Scholar]
  48. Hao, Y.; Zhang, J.; Li, B.Q. Response characteristics of NPP of vegetation to meteorological drought in China from 2001 to 2020. Hydropower Energy Sci. 2024, 8, 17–21. [Google Scholar]
  49. Gao, Y.; Zhang, L.Y.; Yang, W.T. Temporal and spatial variation of drought and its impact on NDVI in North China. Chin. J. Agrometeorol. 2019, 45, 374–389. [Google Scholar]
  50. Shan, W.; Jin, X.B.; Meng, X.S.; Yang, X.Y.; Xu, Z.G.; Gu, Z.M.; Zhou, Y.K. Dynamic monitoring of land consolidation ecological environment quality based on multi-source remote sensing data. Trans. Chin. Soc. Agric. Eng. 2019, 35, 234–242. [Google Scholar]
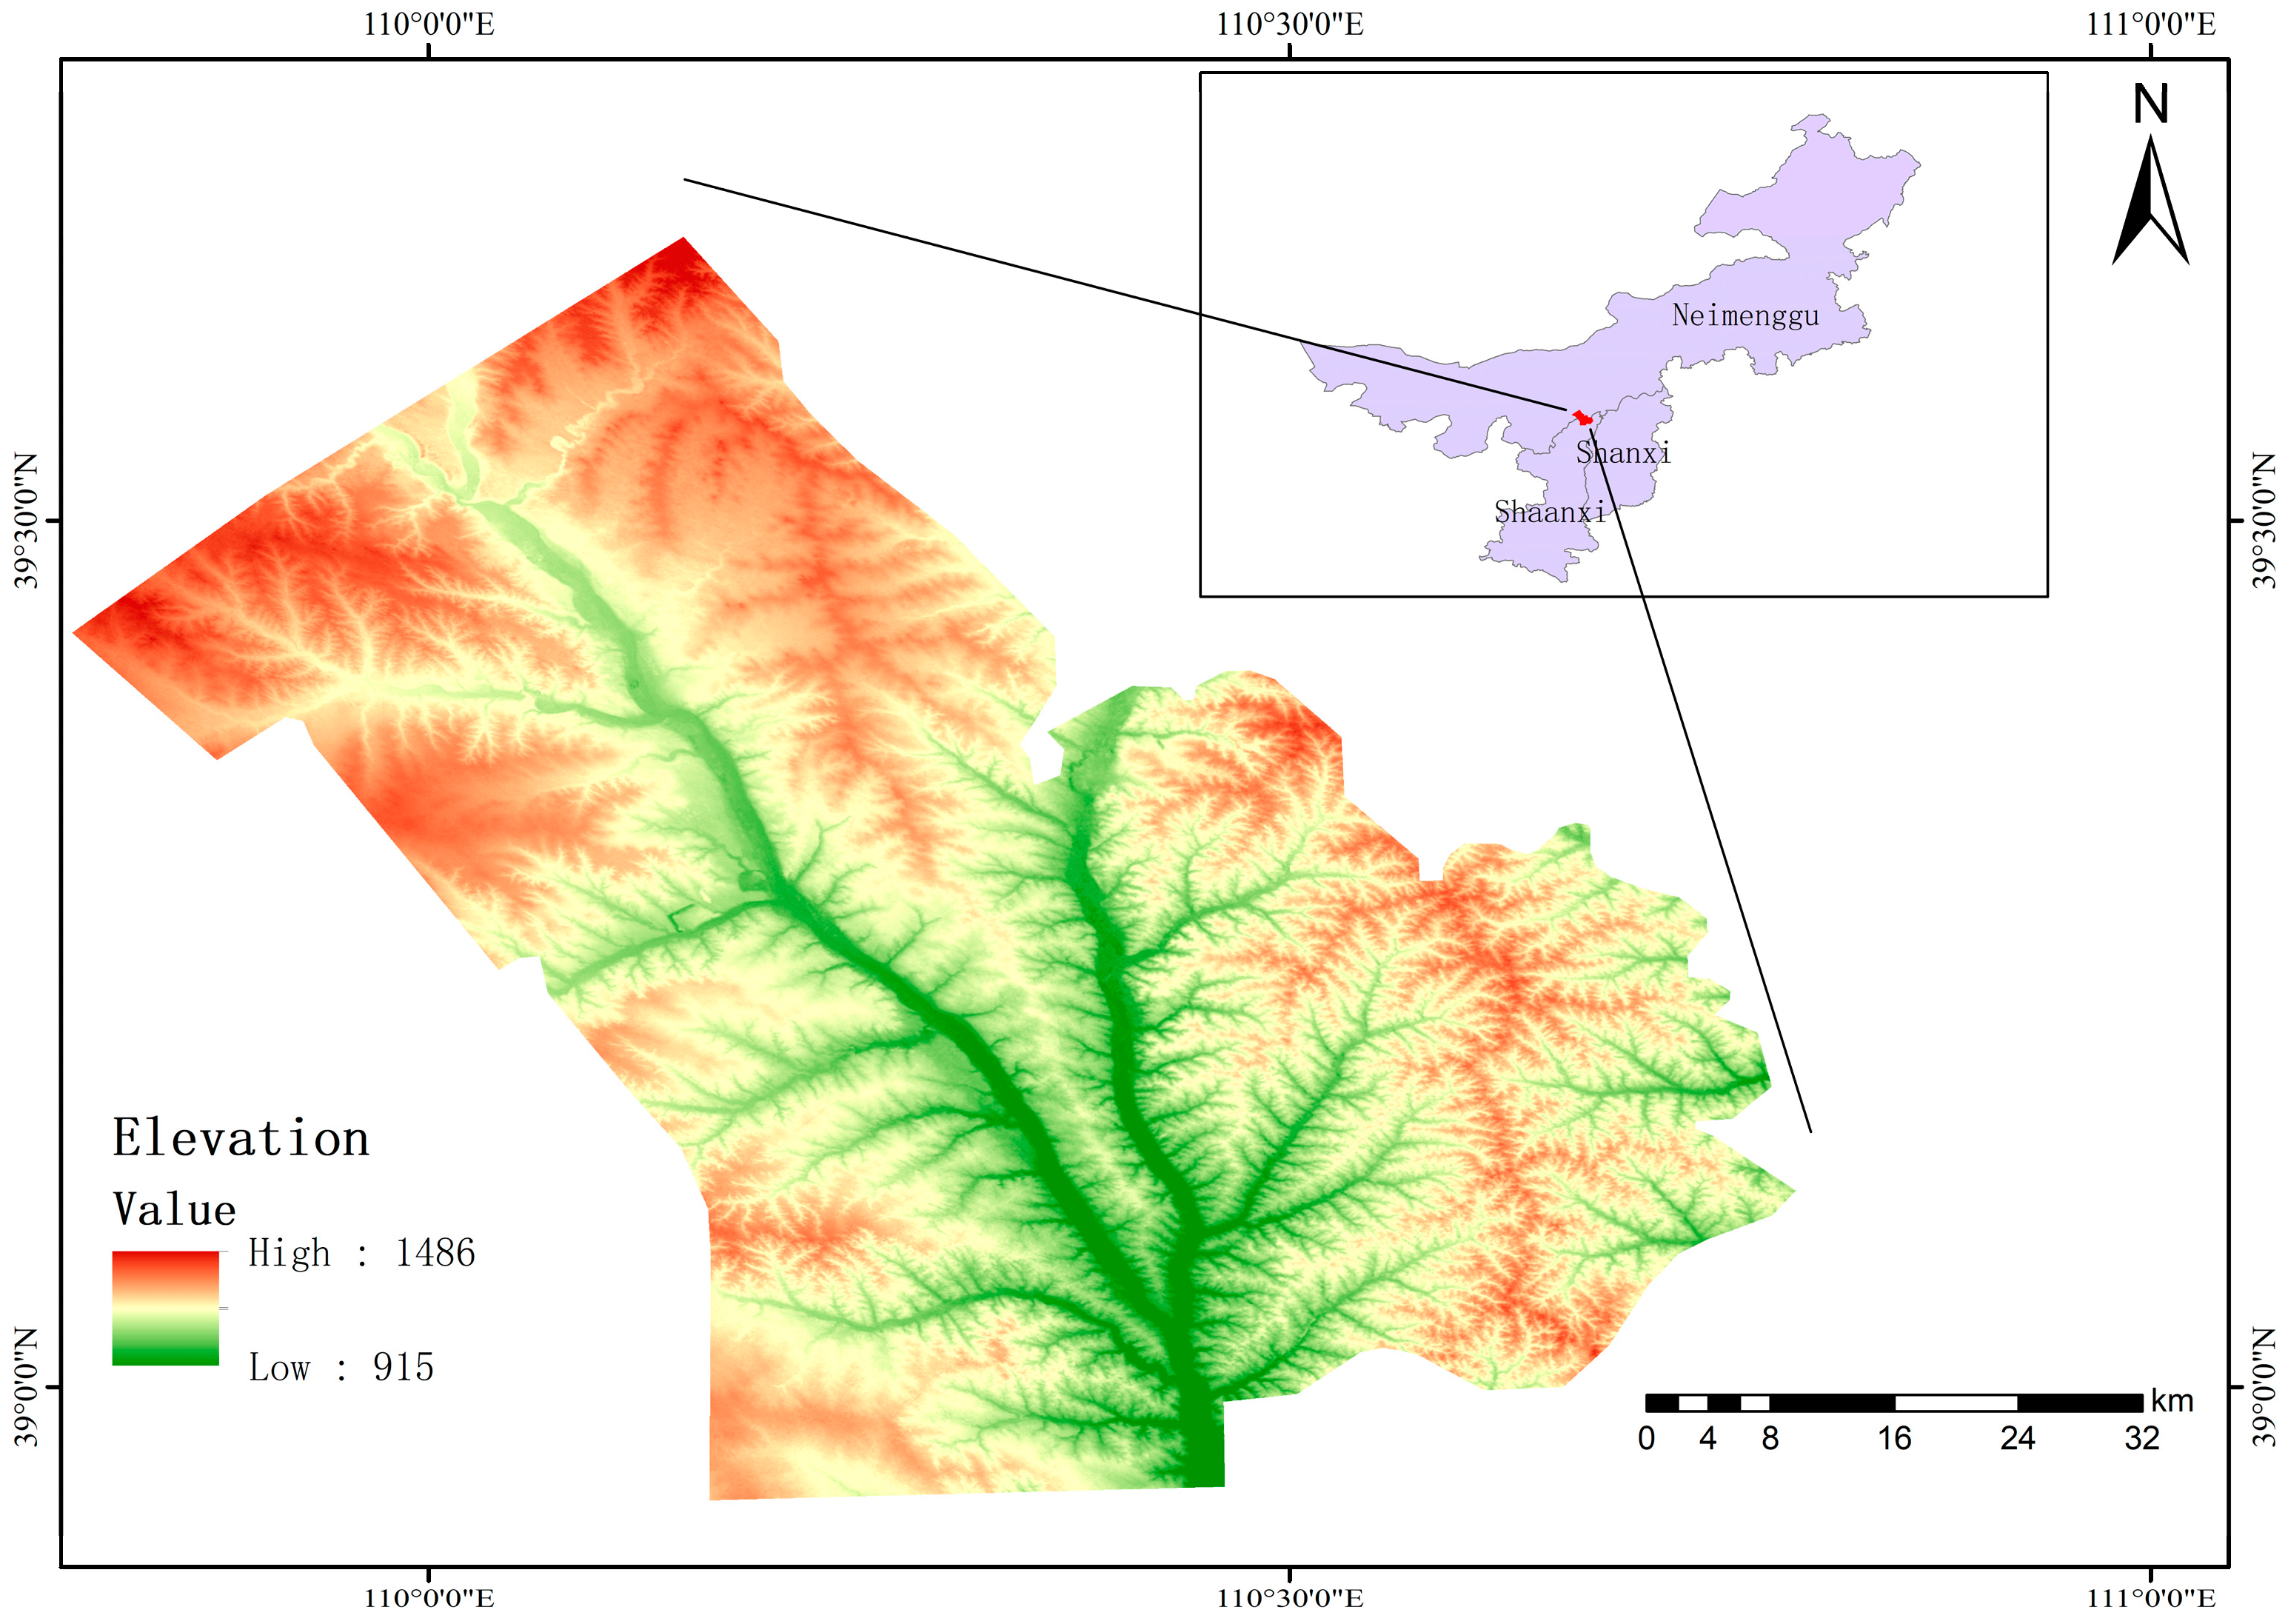
Figure 1. Scope of the study area.
Remotesensing 16 02843 g001
Figure 2. Distribution of land use types in different years.
Remotesensing 16 02843 g002
Figure 3. Changes and spatial trends of SPEI at different time scales in the Shendong Mining Area from 1986 to 2020. (A-1,B-1,C-1,D-1) are respectively the bar graphs of the annual mean values of SPEI on 1, 3, 6 and 12 month scales. (A-2,B-2,C-2,D-2) are respectively the spatial distribution maps of the increase and decrease trend of SPEI from 1986 to 2020 on the scale of 1, 3, 6 and 12 months.
Remotesensing 16 02843 g003
Figure 4. Changes and spatial trends of SPEI in different seasons of Shendong Mining Area from 1986 to 2020. (A-1,B-1,C-1,D-1) are the average bar charts of SPEI in spring, summer, autumn and winter respectively, and (C-1) also has A straight line because its significance p < 0.5. (A-2,B-2,C-2,D-2) are the spatial distribution maps of SPEI increase and decrease in spring, summer, autumn and winter from 1986 to 2020, respectively.
Remotesensing 16 02843 g004
Figure 5. The temporal and spatial variations in NDVI annual average values and time series variations in maximum values from 1986 to 2020.
Remotesensing 16 02843 g005
Figure 6. The slope trend (a) and significance test (b) spatial distribution of NDVI from 1986 to 2020.
Remotesensing 16 02843 g006
Figure 7. Spatial distribution of correlation between SPEI and NDVI at different time scales from 1986 to 2020.
Remotesensing 16 02843 g007
Figure 8. (a) Correlation coefficients between SPEI at different time scales and NDVI of different landform types. (b) Correlation coefficients between SPEI at different time scales and NDVI of different land use types.
Remotesensing 16 02843 g008
Figure 9. The interaction between different time scales and influencing factors on SPEI.
Remotesensing 16 02843 g009
Figure 10. The interaction of NDVI with different landforms at different time scales in SPEI.
Remotesensing 16 02843 g010
Figure 11. The interaction of NDVI with different land use types at different time scales in SPEI.
Remotesensing 16 02843 g011
Table 1. SPEI classification criteria.
GradeTypeSPEI Value
1Extremely wet2 < SPEI
2Severely wet1.5 < SPEI ≤ 2
3Moderately moist1 < SPEI ≤ 1.5
4Mildly moist0.5 < SPEI ≤ 1
5Normal dry and wet conditions−0.5 < SPEI ≤ 0.5
6Mild drought−1.0 < SPEI ≤ −0.5
7Moderate drought−1.5 < SPEI ≤ −1.0
8Severe drought−2.0 < SPEI ≤ −1
9Extreme droughtSPEI ≤ −2.0
Table 2. Types of Geodetector factor interaction.
Interaction TypeDescription
Non-linear attenuationq(X1∩X2) < min[q(X1),q(X2)]
Single-factor non-linear attenuationmin[q(X1),q(X2)] < q(X1∩X2) < max[q(X1),q(X2)]
Double-factor enhancementq(X1∩X2) > max[q(X1),q(X2)]
Independentq(X1∩X2) = q(X1) + q(X2)
Non-linear enhancementq(X1∩X2) > q(X1) + q(X2)
Table 3. Correlation matrix.
LayerNDVINDVI_SlpoeDEM
NDVI1.00/−1.33645
NDVI_slpoe/1.00−1.15056
DEM−1.33645−1.150561.00
Table 4. Correlation between NDVI and SPEI values of different land use types at different time scales.
RelatedFarmlandForestsGrasslandsWaterWastelandUnutilized
SPEI010.070.34−0.01−0.25−0.17−0.15
SPEI030.340.360.110.07−0.030.01
SPEI06−0.020.280.00−0.04−0.12−0.03
SPEI12−0.150.42−0.16−0.26−0.340.08
Table 5. Correlation between NDVI and SPEI values of different landforms at different time scales.
RelevanceMiddle-Altitude Loess Hills and RidgesMid-Altitude Aeolian LandformsLow-Altitude Alluvial PlainMiddle-Altitude Erosion Plain
SPEI010.640.480.340.20
SPEI030.620.500.400.18
SPEI060.410.290.230.10
SPEI120.350.160.100.11
Disclaimer/Publisher’s Note: The statements, opinions and data contained in all publications are solely those of the individual author(s) and contributor(s) and not of MDPI and/or the editor(s). MDPI and/or the editor(s) disclaim responsibility for any injury to people or property resulting from any ideas, methods, instructions or products referred to in the content.