Article

SHAP-Driven Explainable Artificial Intelligence Framework for Wildfire Susceptibility Mapping Using MODIS Active Fire Pixels: An In-Depth Interpretation of Contributing Factors in Izmir, Türkiye

1
Department of Geomatics Engineering, Mersin University, Yenişehir, Mersin 33110, Türkiye
2
Geomatics Engineering Department, Istanbul Okan University, Tuzla, Istanbul 34959, Türkiye
*
Author to whom correspondence should be addressed.
Remote Sens. 2024, 16(15), 2842; https://doi.org/10.3390/rs16152842
Submission received: 25 May 2024 / Revised: 29 July 2024 / Accepted: 31 July 2024 / Published: 2 August 2024
(This article belongs to the Special Issue Artificial Intelligence for Natural Hazards (AI4NH))

Abstract

:
Wildfire susceptibility maps play a crucial role in preemptively identifying regions at risk of future fires and informing decisions related to wildfire management, thereby aiding in mitigating the risks and potential damage posed by wildfires. This study employs eXplainable Artificial Intelligence (XAI) techniques, particularly SHapley Additive exPlanations (SHAP), to map wildfire susceptibility in Izmir Province, Türkiye. Incorporating fifteen conditioning factors spanning topography, climate, anthropogenic influences, and vegetation characteristics, machine learning (ML) models (Random Forest, XGBoost, LightGBM) were used to predict wildfire-prone areas using freely available active fire pixel data (MODIS Active Fire Collection 6 MCD14ML product). The evaluation of the trained ML models showed that the Random Forest (RF) model outperformed XGBoost and LightGBM, achieving the highest test accuracy (95.6%). All of the classifiers demonstrated a strong predictive performance, but RF excelled in sensitivity, specificity, precision, and F-1 score, making it the preferred model for generating a wildfire susceptibility map and conducting a SHAP analysis. Unlike prevailing approaches focusing solely on global feature importance, this study fills a critical gap by employing a SHAP summary and dependence plots to comprehensively assess each factor’s contribution, enhancing the explainability and reliability of the results. The analysis reveals clear associations between factors such as wind speed, temperature, NDVI, slope, and distance to villages with increased fire susceptibility, while rainfall and distance to streams exhibit nuanced effects. The spatial distribution of the wildfire susceptibility classes highlights critical areas, particularly in flat and coastal regions near settlements and agricultural lands, emphasizing the need for enhanced awareness and preventive measures. These insights inform targeted fire management strategies, highlighting the importance of tailored interventions like firebreaks and vegetation management. However, challenges remain, including ensuring the selected factors’ adequacy across diverse regions, addressing potential biases from resampling spatially varied data, and refining the model for broader applicability.

1. Introduction

Forests are invaluable natural assets, providing economic, ecological, and cultural benefits. However, they face threats from rapid urban growth, unauthorized logging, and wildfires [1,2]. Climate change exacerbates these risks, with higher temperatures and prolonged droughts increasing forest susceptibility to fires globally [3]. Wildfires, now among the most significant hazards to natural ecosystems, devastate millions of hectares of forests annually [4]. They can be ignited by factors such as dry litter friction, lightning, inadequate rainfall, rising temperatures, deforestation, hot winds, and poor land management [5]. Controlling wildfires is challenging, but various maps can help mitigate risks and damage. Wildfire susceptibility maps are crucial for identifying regions prone to future fires based on specific traits, aiding in wildfire management decisions [6].
The effective management of natural resources demands a comprehensive understanding of wildfire catalysts, encompassing ignition sites, weather conditions, and human impacts. Early wildfire detection initially relied on lookout towers and manual observation [7]. Over time, advancements led to the use of biomass sensors and deep learning algorithms have been applied to satellite or drone images for more precise detection [8,9]. Despite these technological advancements, it remains crucial for researchers to identify areas that are more prone to wildfires and understand the key variables that contribute to wildfire ignition. By pinpointing these high-risk areas and influential factors, effective wildfire prevention and management strategies can be developed. The variables influencing wildfires can vary significantly between regions, underscoring the importance of tailored approaches to prevention, control, and mitigation [10,11]. Furthermore, grasping the environmental and physical mechanisms behind wildfire occurrences is essential. Scientific research, particularly in modeling fire spread and assessing risk, is crucial for crafting robust fire management strategies. Enhanced comprehension of wildfire dynamics empowers scientists to predict future occurrences and identify underlying drivers, fueling the growing interest in wildfire susceptibility studies [12,13].
Thanks to the expanding availability of data sources and advanced data management tools, Geographic Information Systems (GIS) and Remote Sensing (RS) play vital roles in understanding and managing wildfire susceptibility across both time and space [14,15]. These technologies excel in creating models and analyzing fire patterns, as well as predicting susceptibility. Researchers employ various approaches under the umbrella of RS and GIS, which can be tailored to the unique characteristics and complexities of each study area. These approaches typically fall into three broad types: physical models, statistical models, and machine learning (ML) techniques. Physical models use mathematics rooted in heat transfer, biomass combustion dynamics, and fluid mechanics to simulate fire behavior and predict its spread [16]. Statistical methods in wildfire research, such as Multi-Criteria Decision Analysis (MCDA), aim to evaluate the connections between fire occurrences and various conditioning factors. These methods quantitatively assess the probability of fire incidents by analyzing multiple criteria. Common approaches within the MCDA framework include hierarchical and network-based techniques, as well as fuzzy logic [17]. These methods rely heavily on expert opinions gathered through pairwise comparisons to determine the relative importance of various factors contributing to wildfires [18].
In contrast, data-driven ML methods have emerged as a significant advancement in spatial hazard modeling, aiming to identify and model nonlinear relationships between wildfire occurrences and conditioning factors. The ML methods used in wildfire research rely on existing fire inventories for training, offering rapid data processing compared to traditional statistical methods like MCDA [19]. ML techniques are particularly adept at generating wildfire susceptibility maps, outperforming many statistical approaches. Various ML algorithms are utilized independently for this purpose, including neural networks, decision trees, logistic regression, and support vector machines. Decision tree-based ensemble methods such as Random Forest (RF), Gradient Boosting, AdaBoost, eXtreme Gradient Boosting (XGBoost), and Light Gradient Boosting (LightGBM) machines are commonly employed to improve model efficiency in assessing wildfire risks and susceptibility [15,20,21]. Choosing the right ML approach involves considerations such as dataset size, reliability, computational requirements, and the specific objectives of the analysis. To determine the most effective algorithm for wildfire susceptibility mapping, analysts frequently rely on performance metrics to assess and compare the accuracy of various methods, since no single algorithm can achieve perfect results across all applications [22].
ML methods are increasingly favored by researchers and decision makers for evaluating and mapping an area’s susceptibility to various phenomena, including wildfires. Newer ML algorithms offer an improved computational efficiency and address challenges related to prediction accuracy and utility, particularly regarding data quantity, quality, and spatial–temporal patterns [23,24]. Despite this, managers and planners face significant challenges in implementing ML algorithms due to concerns regarding explainability, transparency, and the integration of knowledge. ML models are often perceived as opaque because of their reliance on vast datasets and complex algorithms, leading to a lack of understanding about their decision-making processes [25].
To address concerns about model opacity, the concept of eXplainable Artificial Intelligence (XAI) has emerged, aiming to develop transparent and interpretable models. XAI involves creating tools for user visualization and interaction to enhance understanding of the decision-making process. The benefits of XAI are numerous, including fostering trust in AI models, ensuring ethical usage, and identifying and rectifying biases [26]. Existing research on XAI related to wildfires primarily emphasizes global feature importance, often neglecting the examination of variations in contributing factors [27]. In this study, we tried to address this gap. Integrating local explainable algorithms like SHapley Additive exPlanations (SHAP) can further enhance the acceptance of ML models in decision making by enhancing the comprehension and explainability of model outputs [6,28,29].
This study presents a novel approach by employing an explainable ML technique to map wildfire susceptibility in Izmir province, Türkiye. Areas dominated by pure stands of red pine and black pine forests as well as maquis formations across Izmir Province are considered fire-prone zones. This province falls within the First Degree Fire-Sensitive Regions of the Turkish General Directorate of Forestry. Following Muğla and Antalya Provinces, Izmir is among the areas in Türkiye where forest fires are most frequently observed, particularly during the summer months, due to high temperatures and low humidity [30,31]. Previous research on the same study area has focused on several key aspects: determining the spatial and temporal patterns of forest fire risk using changes in land surface temperature and in situ meteorological measurements [32], estimating burned areas and fire damage severity using spectral indices [33,34], and examining fire activity alongside climate data statistics, including the length and severity of the fire season [35]. However, developing a comprehensive wildfire susceptibility map for this province remains essential for formulating an efficient emergency response plan for potential future fire incidents.
The primary aim of this study is to elucidate the roles of topographic, climatic, anthropogenic, and vegetation-related factors in the susceptibility model while assessing their individual significance and understanding the underlying reasoning behind specific model decisions. This research seeks to provide insights into how well-known decision tree-based ensemble ML methods generate predictions for wildfire occurrences. To achieve this, the study intends to analyze model outcomes using various SHAP plots.
While SHAP-based wildfire susceptibility mapping studies are increasingly becoming pioneering in wildfire research [36,37,38,39,40,41,42], this study, to the best of our knowledge, is the first to apply SHAP in the Aegean–Mediterranean region. In essence, the key contributions and innovations encompass:
(1)
Establishing a spatial ML framework for mapping wildfire susceptibility using well-known decision tree-based ensemble models, namely RF, XGBoost, and LightGBM, and identifying the best-performing model through comprehensive metrics evaluation.
(2)
Examining the relationship between the best model and conditioning factors through SHAP outputs by employing SHAP summary plots to derive the overall contribution of each factor to the prediction, providing a comprehensive view of factor importance and SHAP dependence plots to assess the isolated impact of individual factors on the model’s predictions, offering valuable insights into the influence of each contributing factor.
(3)
And exploring spatial variations in model outcomes to predict wildfire susceptibility across the study area.
While many studies on wildfire susceptibility mapping typically rely on wildfire data provided by governmental agencies, some researchers face challenges when official records are limited or absent. In such cases, alternative approaches involve compiling data from RS products. These methods might include using RS images to detect fire scars, a process that involves analyzing multi-temporal images and conducting multiple classifications. However, a prevalent trend among researchers is to utilize active fire data derived from freely available RS products, such as MODIS products. These datasets offer real-time information on active fire pixels, making them valuable for developing wildfire inventories [43]. Reflecting this trend, the current study opted to leverage these free active fire data resources instead of relying on local administrative wildfire inventories.

2. Materials

2.1. Study Area

The selected study area for this research is Izmir Province in Turkey (Figure 1), located between the latitudes 37°52′N and 39°35′N and longitudes 26°11′E and 28°52′E. Covering approximately 11,580.28 km2, forests make up about 46% of Izmir Province’s total area. The predominant forest species in the region are Turkish pine (Pinus brutia Ten.) and black pine (Pinus nigra Arn.). Izmir Province features a characteristic Mediterranean climate, marked by hot, dry summers and mild, rainy winters. The coastal regions are particularly affected by these climatic conditions, while the interior regions, influenced by local topography, also exhibit similar weather patterns. Most winter precipitation occurs as rain, with annual totals between 700 and 1000 mm. The peak of summer heat is typically experienced in July and August [37].
The study area has experienced numerous fires in the past and remains highly susceptible to wildfires. Consequently, creating a wildfire susceptibility map for this province is crucial for developing an effective emergency action plan for future fire events [32,44,45].

2.2. Wildfire Inventory

Governmental agencies often oversee wildfire records, but these inventories are not always publicly available and can be incomplete or inaccurate, particularly in rural or sparsely populated regions. In Türkiye, the authorities track wildfire-affected areas but do not keep official records of fires in other types of vegetation, such as agricultural lands, wetlands, or peri-urban zones. As a result, RS satellites have become essential for detecting and monitoring active fires and for mapping burned areas. Unlike maps of burned areas, active fire detection methods can identify and measure ongoing fires and may also estimate the Fire Radiative Power, which is associated with the rate of fuel consumption and smoke production [13,46,47].
The widespread availability of free active fire location data, such as that provided by MODIS products, has garnered significant interest from the research community [48]. Fires, with radiometric temperatures ranging from 750 to 1200 Kelvin, emit substantial thermal energy within or near the shortwave and middle infrared spectrum, making them stand out against the cooler ambient temperatures. Active fire detection methods typically identify these heightened signals through spectral radiance or brightness temperature measurements [49]. Due to these advantages, some researchers have used MODIS data to create maps indicating wildfire susceptibility [19].
The MODIS Active Fire Collection 6 product identifies active fires by extracting brightness temperatures from MODIS instrument channels. It detects fires at a 1 km spatial resolution during satellite passes, conducting several tests on potential burning pixels to minimize false detections. This product provides global monthly fire pixel data, including geographic coordinates, acquisition dates, and other details for each detected fire pixel [50,51]. Monthly files can be downloaded from the University of Maryland’s repositories [52], and NASA’s Fire Information for Resource Management System (FIRMS) offers shapefiles and other geospatial formats of the product [53]. The data include a ‘confidence’ column, ranging from 0% to 100%, to help users assess the reliability of each hotspot/fire pixel. Additionally, the ‘type’ column indicates the predicted type of hotspot, such as presumed vegetation fire, active volcano, other static land sources, or offshore sources.
For this study, monthly composites from 2001 to 2023 were downloaded and cropped to match the study area’s boundaries, focusing exclusively on vegetation and forest fires while excluding non-vegetation fires. To ensure data quality, only fire pixels with a minimum confidence level of 95% were selected and compiled into a vector shapefile. The reliability of the wildfire inventory was verified by comparing the vector database with 30 m Landsat images using the Google Earth Engine. Landsat composites, using the Normalized Burn Ratio, were employed to confirm whether each fire pixel corresponded to a burned area based on its location and acquisition date. After this validation process, a final vector file with 340 fire pixels was prepared for model training (Figure 1). To prevent bias in the models, an equal number of non-wildfire samples (340) were randomly selected alongside the wildfire samples. The wildfire samples were stratified as follows: 154 samples in coniferous forests, 102 samples in broadleaved forests, and 84 samples in non-forest areas. To ensure a representative distribution, the non-wildfire samples were stratified equally across these vegetation types. Additionally, to minimize spatial autocorrelation, non-wildfire samples were excluded from a 2 km buffer zone around each wildfire center.

2.3. Conditioning Factors

Wildfire probability is influenced by various climatic, topographical, anthropogenic, and vegetation-related factors. In this study, the main factors affecting wildfire ignition and spread were incorporated to create a wildfire susceptibility map, enabling the algorithms to pinpoint areas with a higher fire risk. Table 1 provides the data sources for the conditioning factors used.
Topography significantly influences the climate of a region, affecting the spatial and temporal variability in climatic factors, thereby impacting wildfires before and during their occurrence. Elevation and slope are crucial metrics for defining regional topography, with numerous studies linking them to fire severity [54]. Aspect is important for predicting the direction of sunlight and surface temperature at specific locations, while both slope and aspect affect fuel type distribution [55]. The Topographic Wetness Index (TWI), which measures water accumulation and surface runoff in a basin, has been found to greatly influence the delineation of burned areas, especially in high-elevation regions [56]. In this study, a Digital Elevation Model (DEM) was created using 30 m resolution digital elevation data from NASA JPL’s Shuttle Radar Topography Mission (SRTM). From this DEM, maps of slope, aspect, elevation, and TWI were generated (Figure 2).
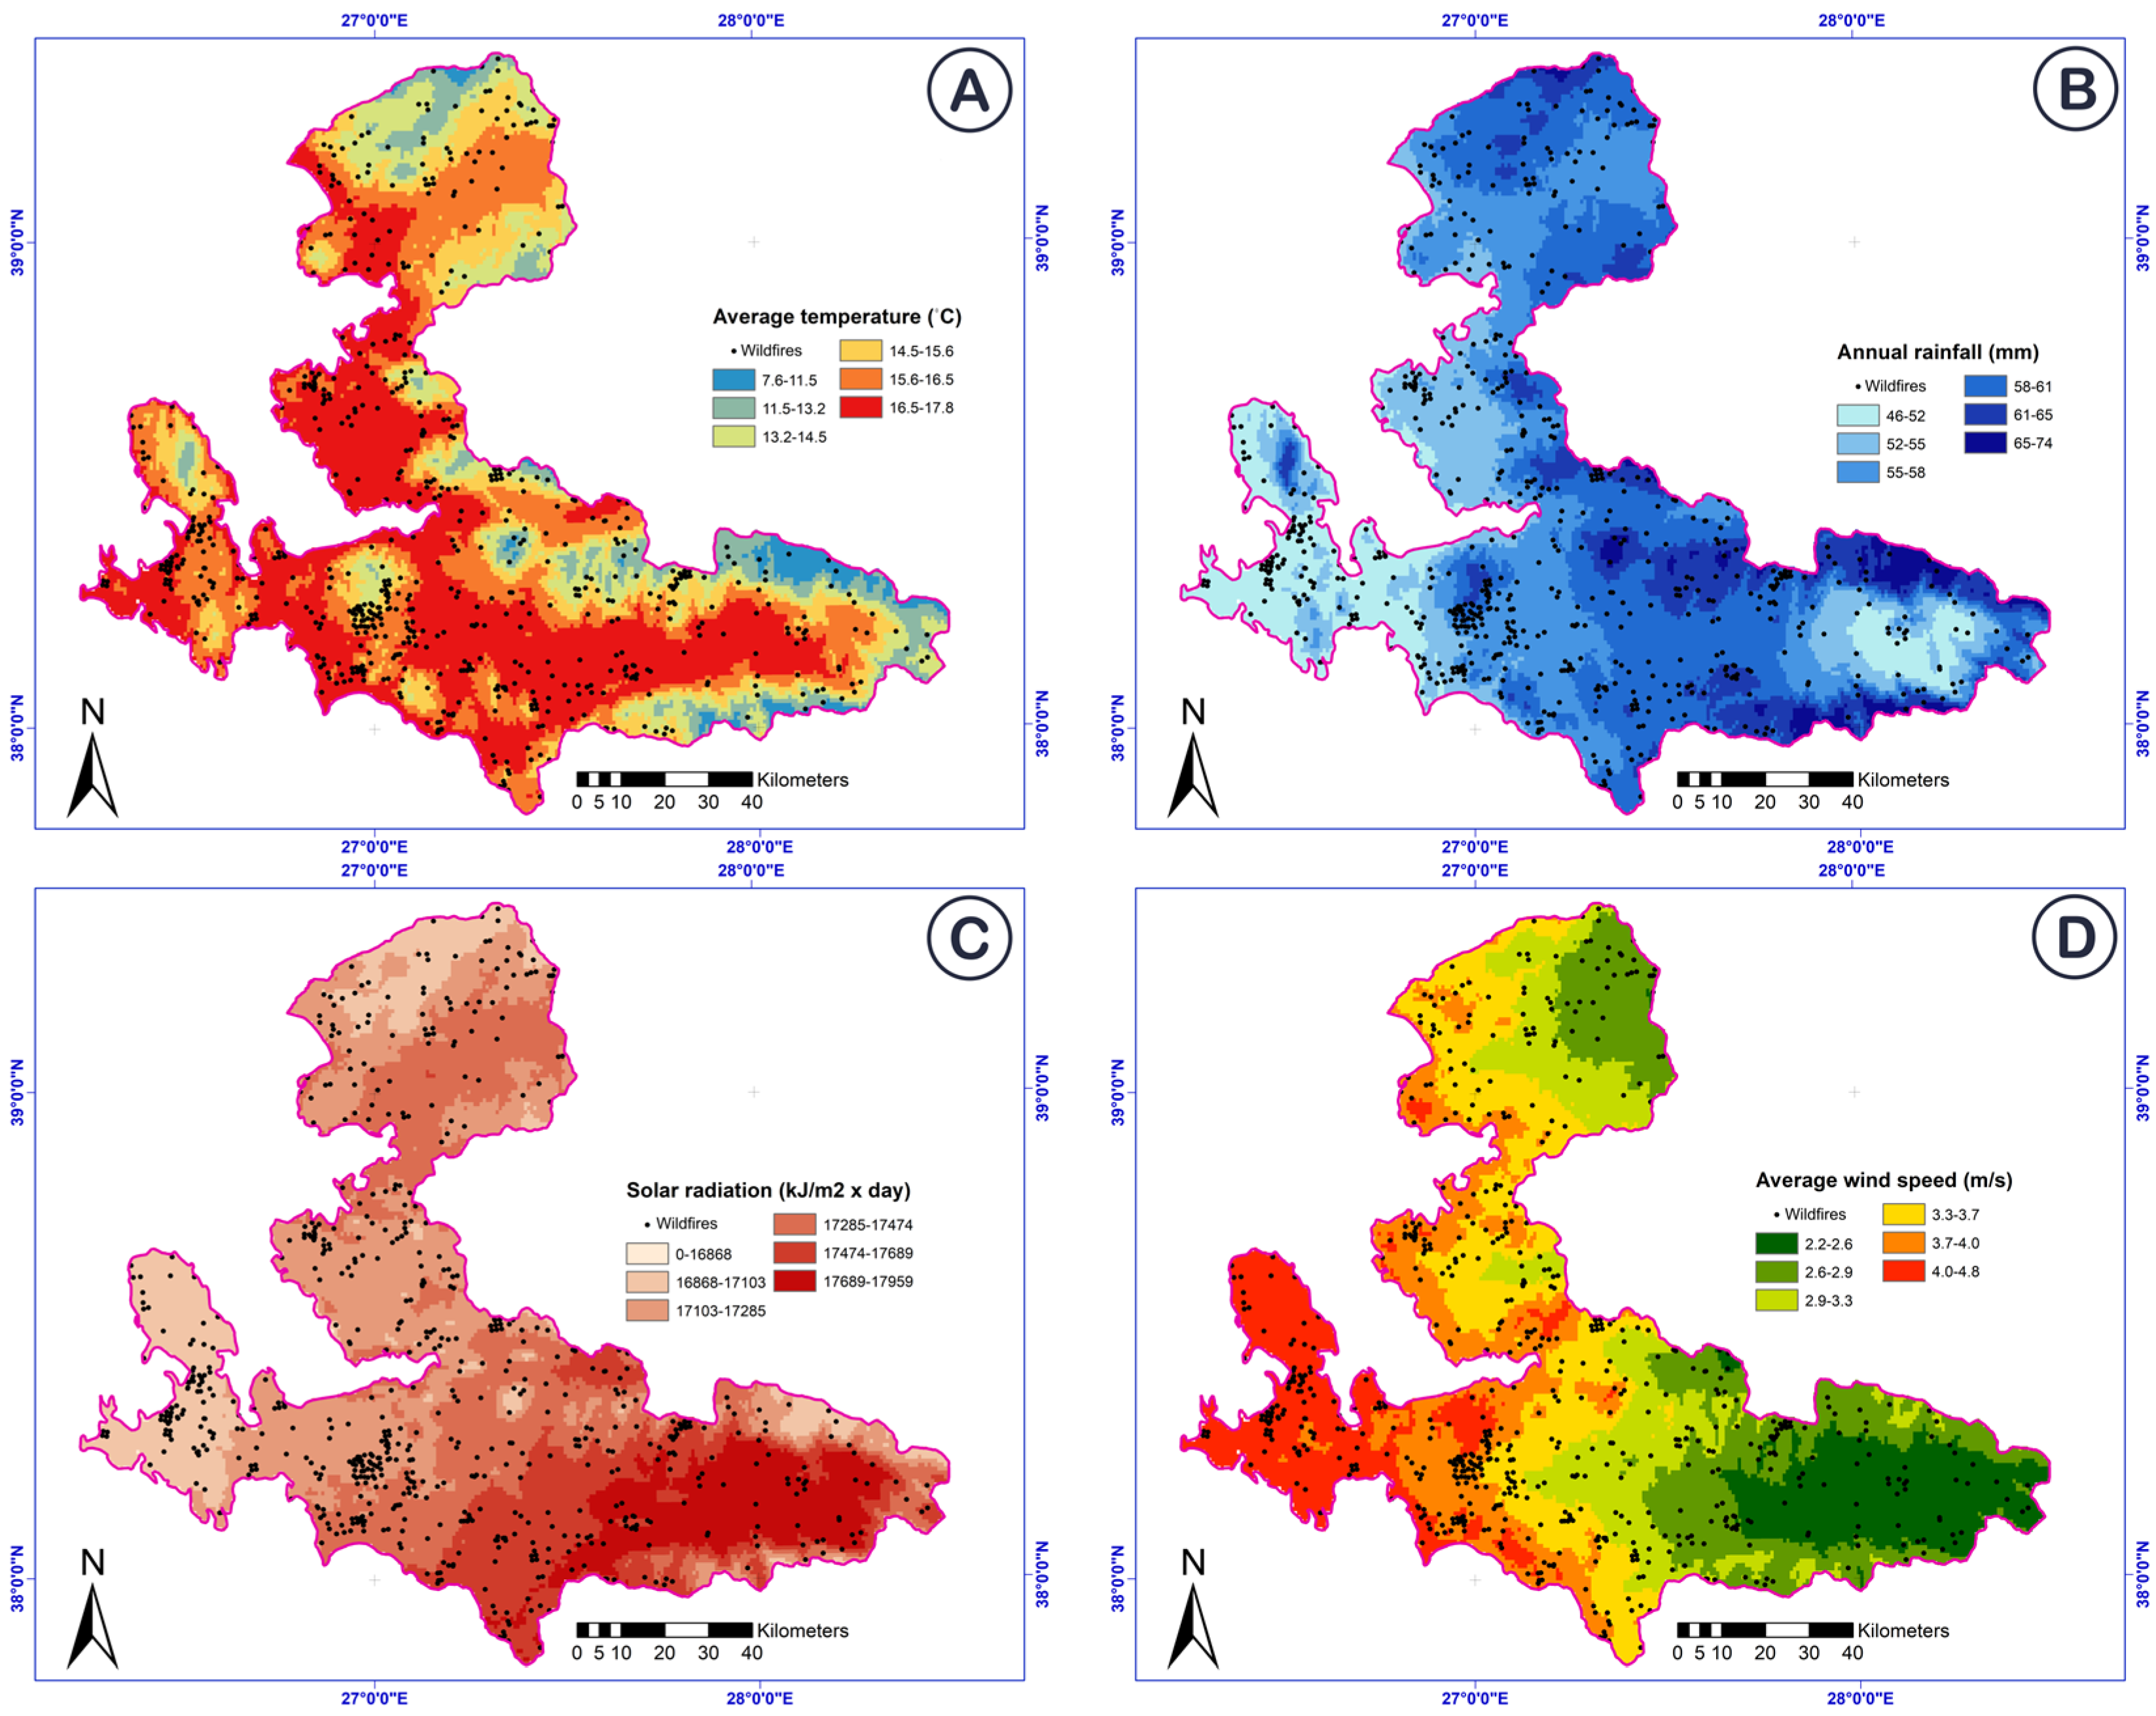
Climatic factors play a critical role in the initiation, spread, and control of wildfires. Extreme conditions such as high temperatures, strong winds, low rainfall, and increased solar radiation can significantly exacerbate wildfire activity [39,40,57]. In this study, WorldClim v.2.1 datasets were utilized for all climatic factors. These datasets offer spatially interpolated climate information for global land areas, providing high-accuracy data at a fine spatial resolution (around 1 km2 for Türkiye). GEOTIFF files for average annual temperature (°C), annual rainfall (mm), solar radiation (kJ m−2 day−1), and average annual wind speed (m/s) were downloaded from the WorldClim database and cropped to match the study area (Figure 3).
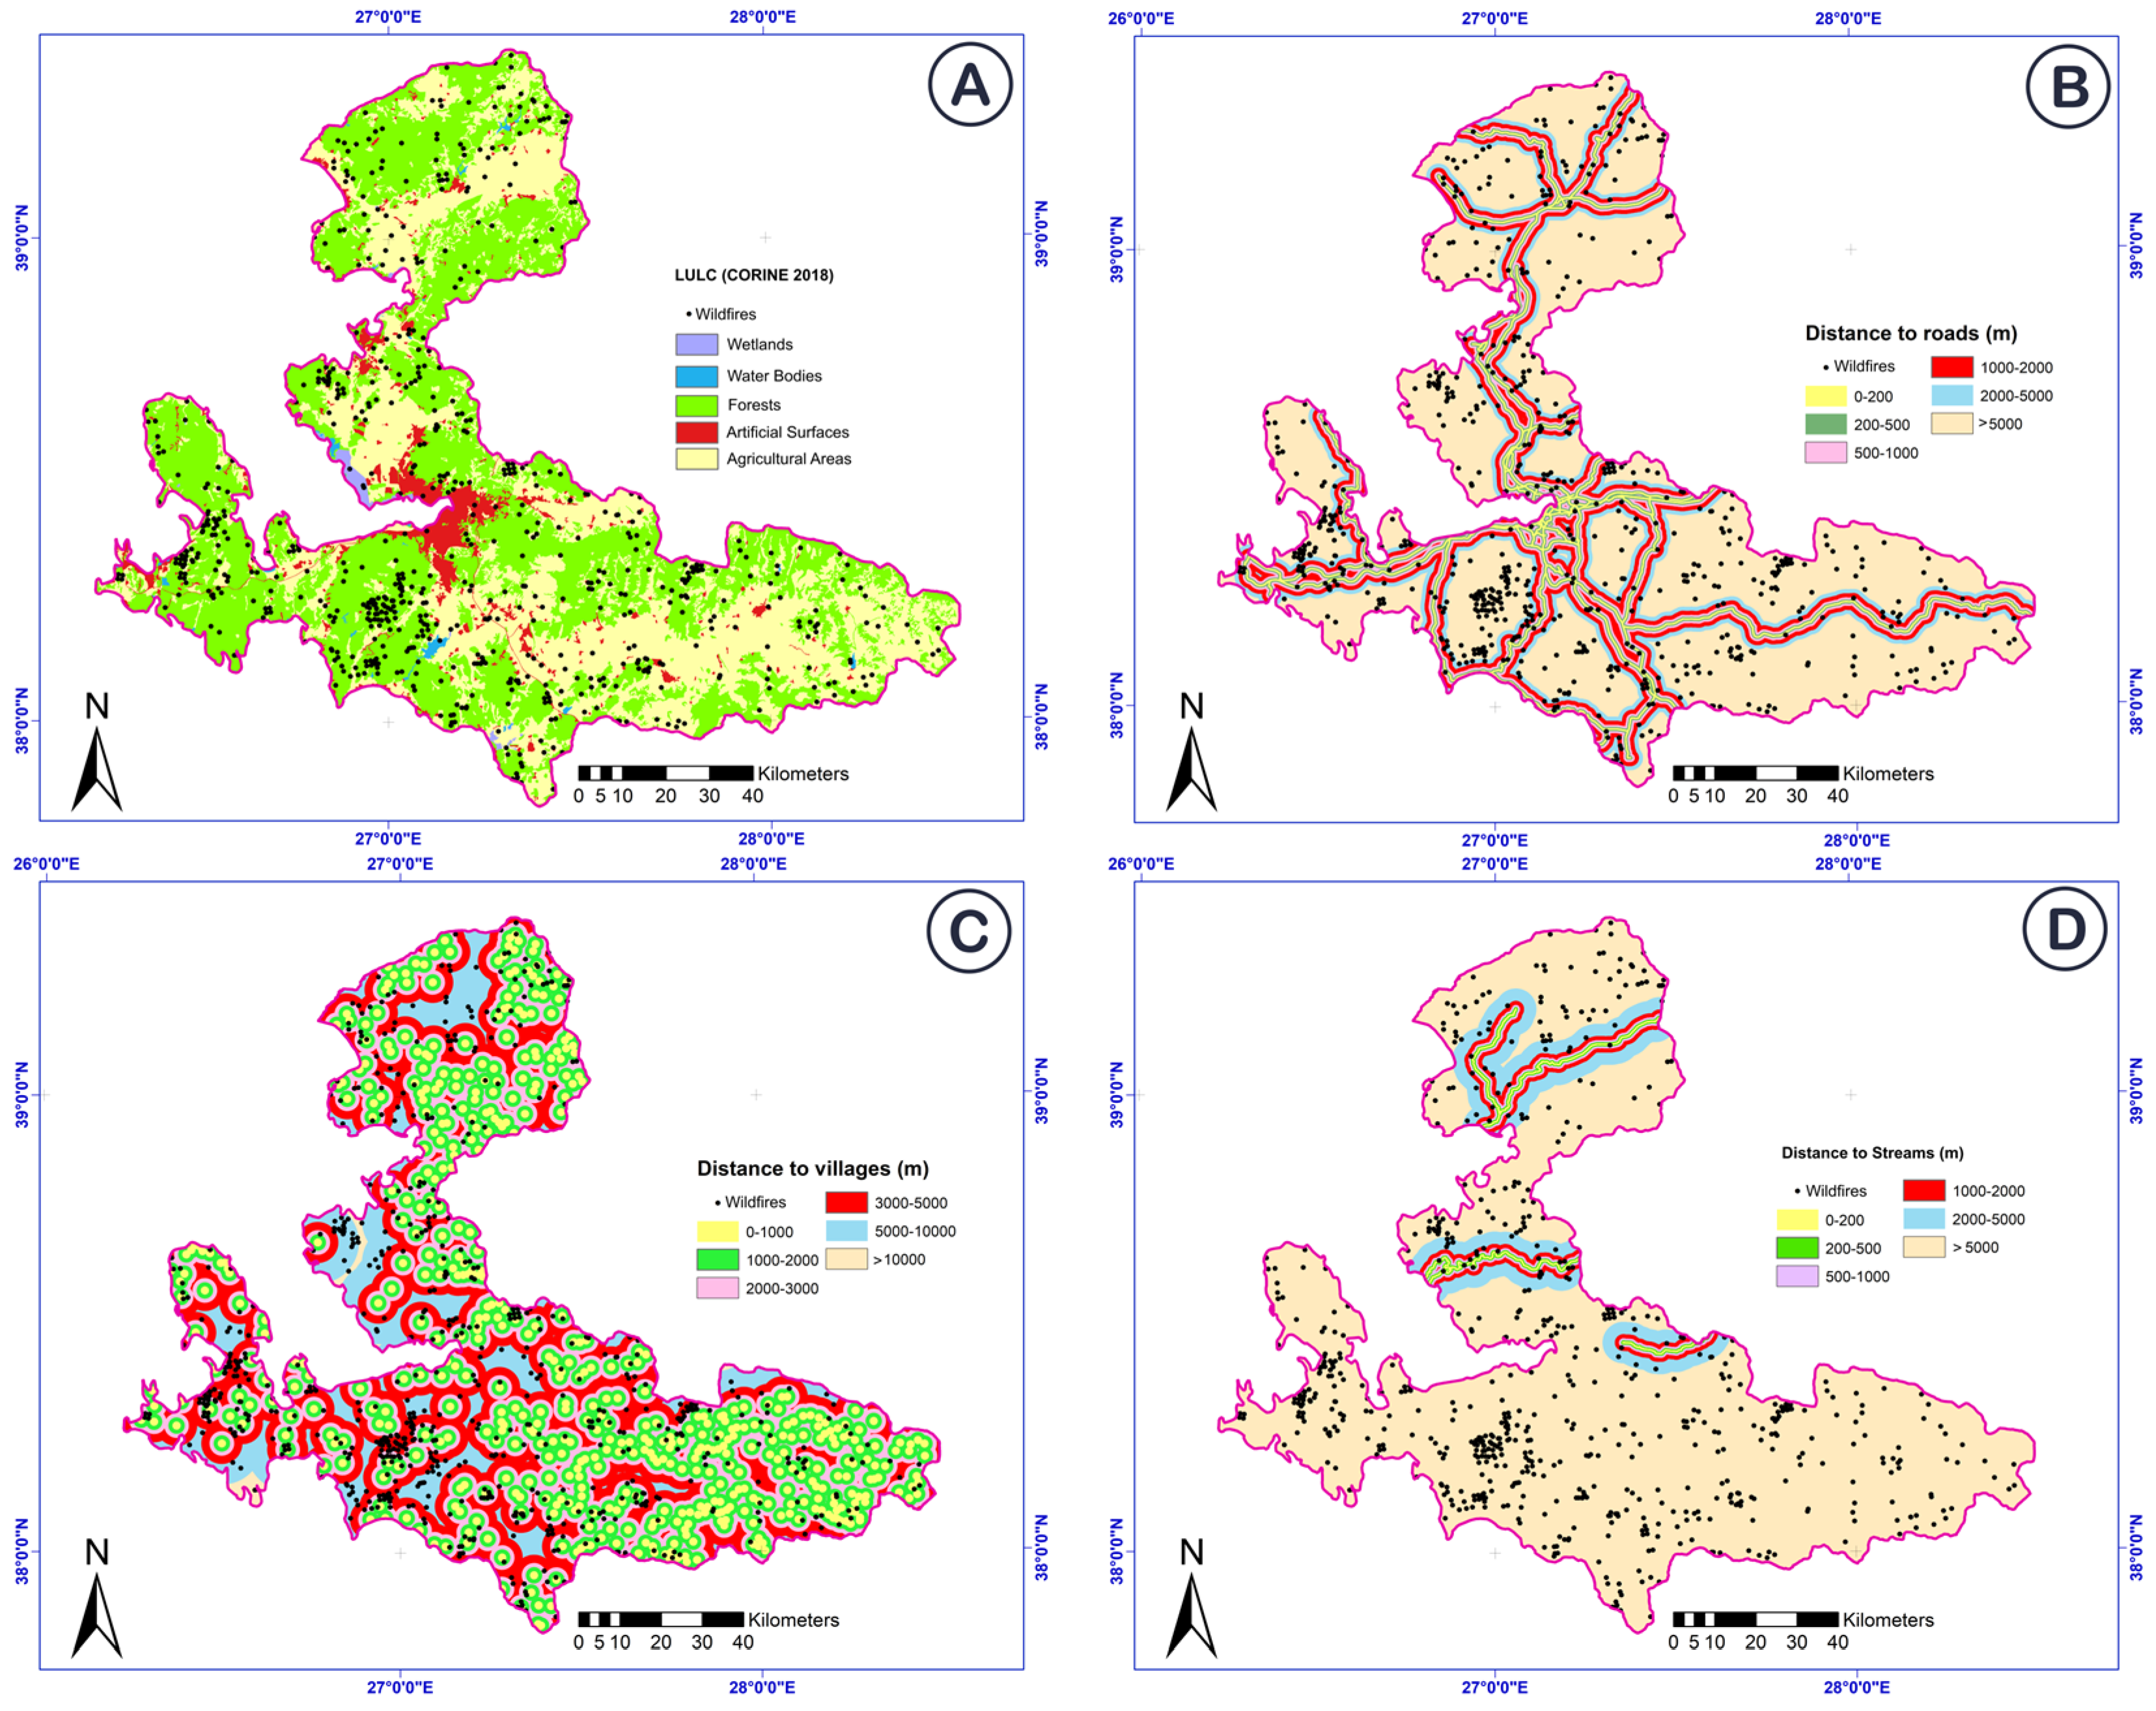
Anthropogenic activities significantly influence wildfire risks. Land use and land cover (LULC) are key factors in fire ignition [58], with the distance to roads [37] and villages [56] increasing the likelihood of fires in rural and forested areas. Additionally, the preference for living near streams heightens fire risks in those areas [3]. For LULC information, this study utilized the 2018 Coordination of Information on the Environment (CORINE) map. Produced by the European Environment Agency from satellite imagery, CORINE data are widely used in Europe for susceptibility mapping and site selection studies [16]. This study used level 1 CORINE 2018 data, categorizing land into five classes: artificial surfaces, agricultural areas, water bodies, wetlands, and forests. Additionally, distance maps to rivers, roads, and villages were created using data from Open Street Maps. The anthropogenic factors can be seen in Figure 4.
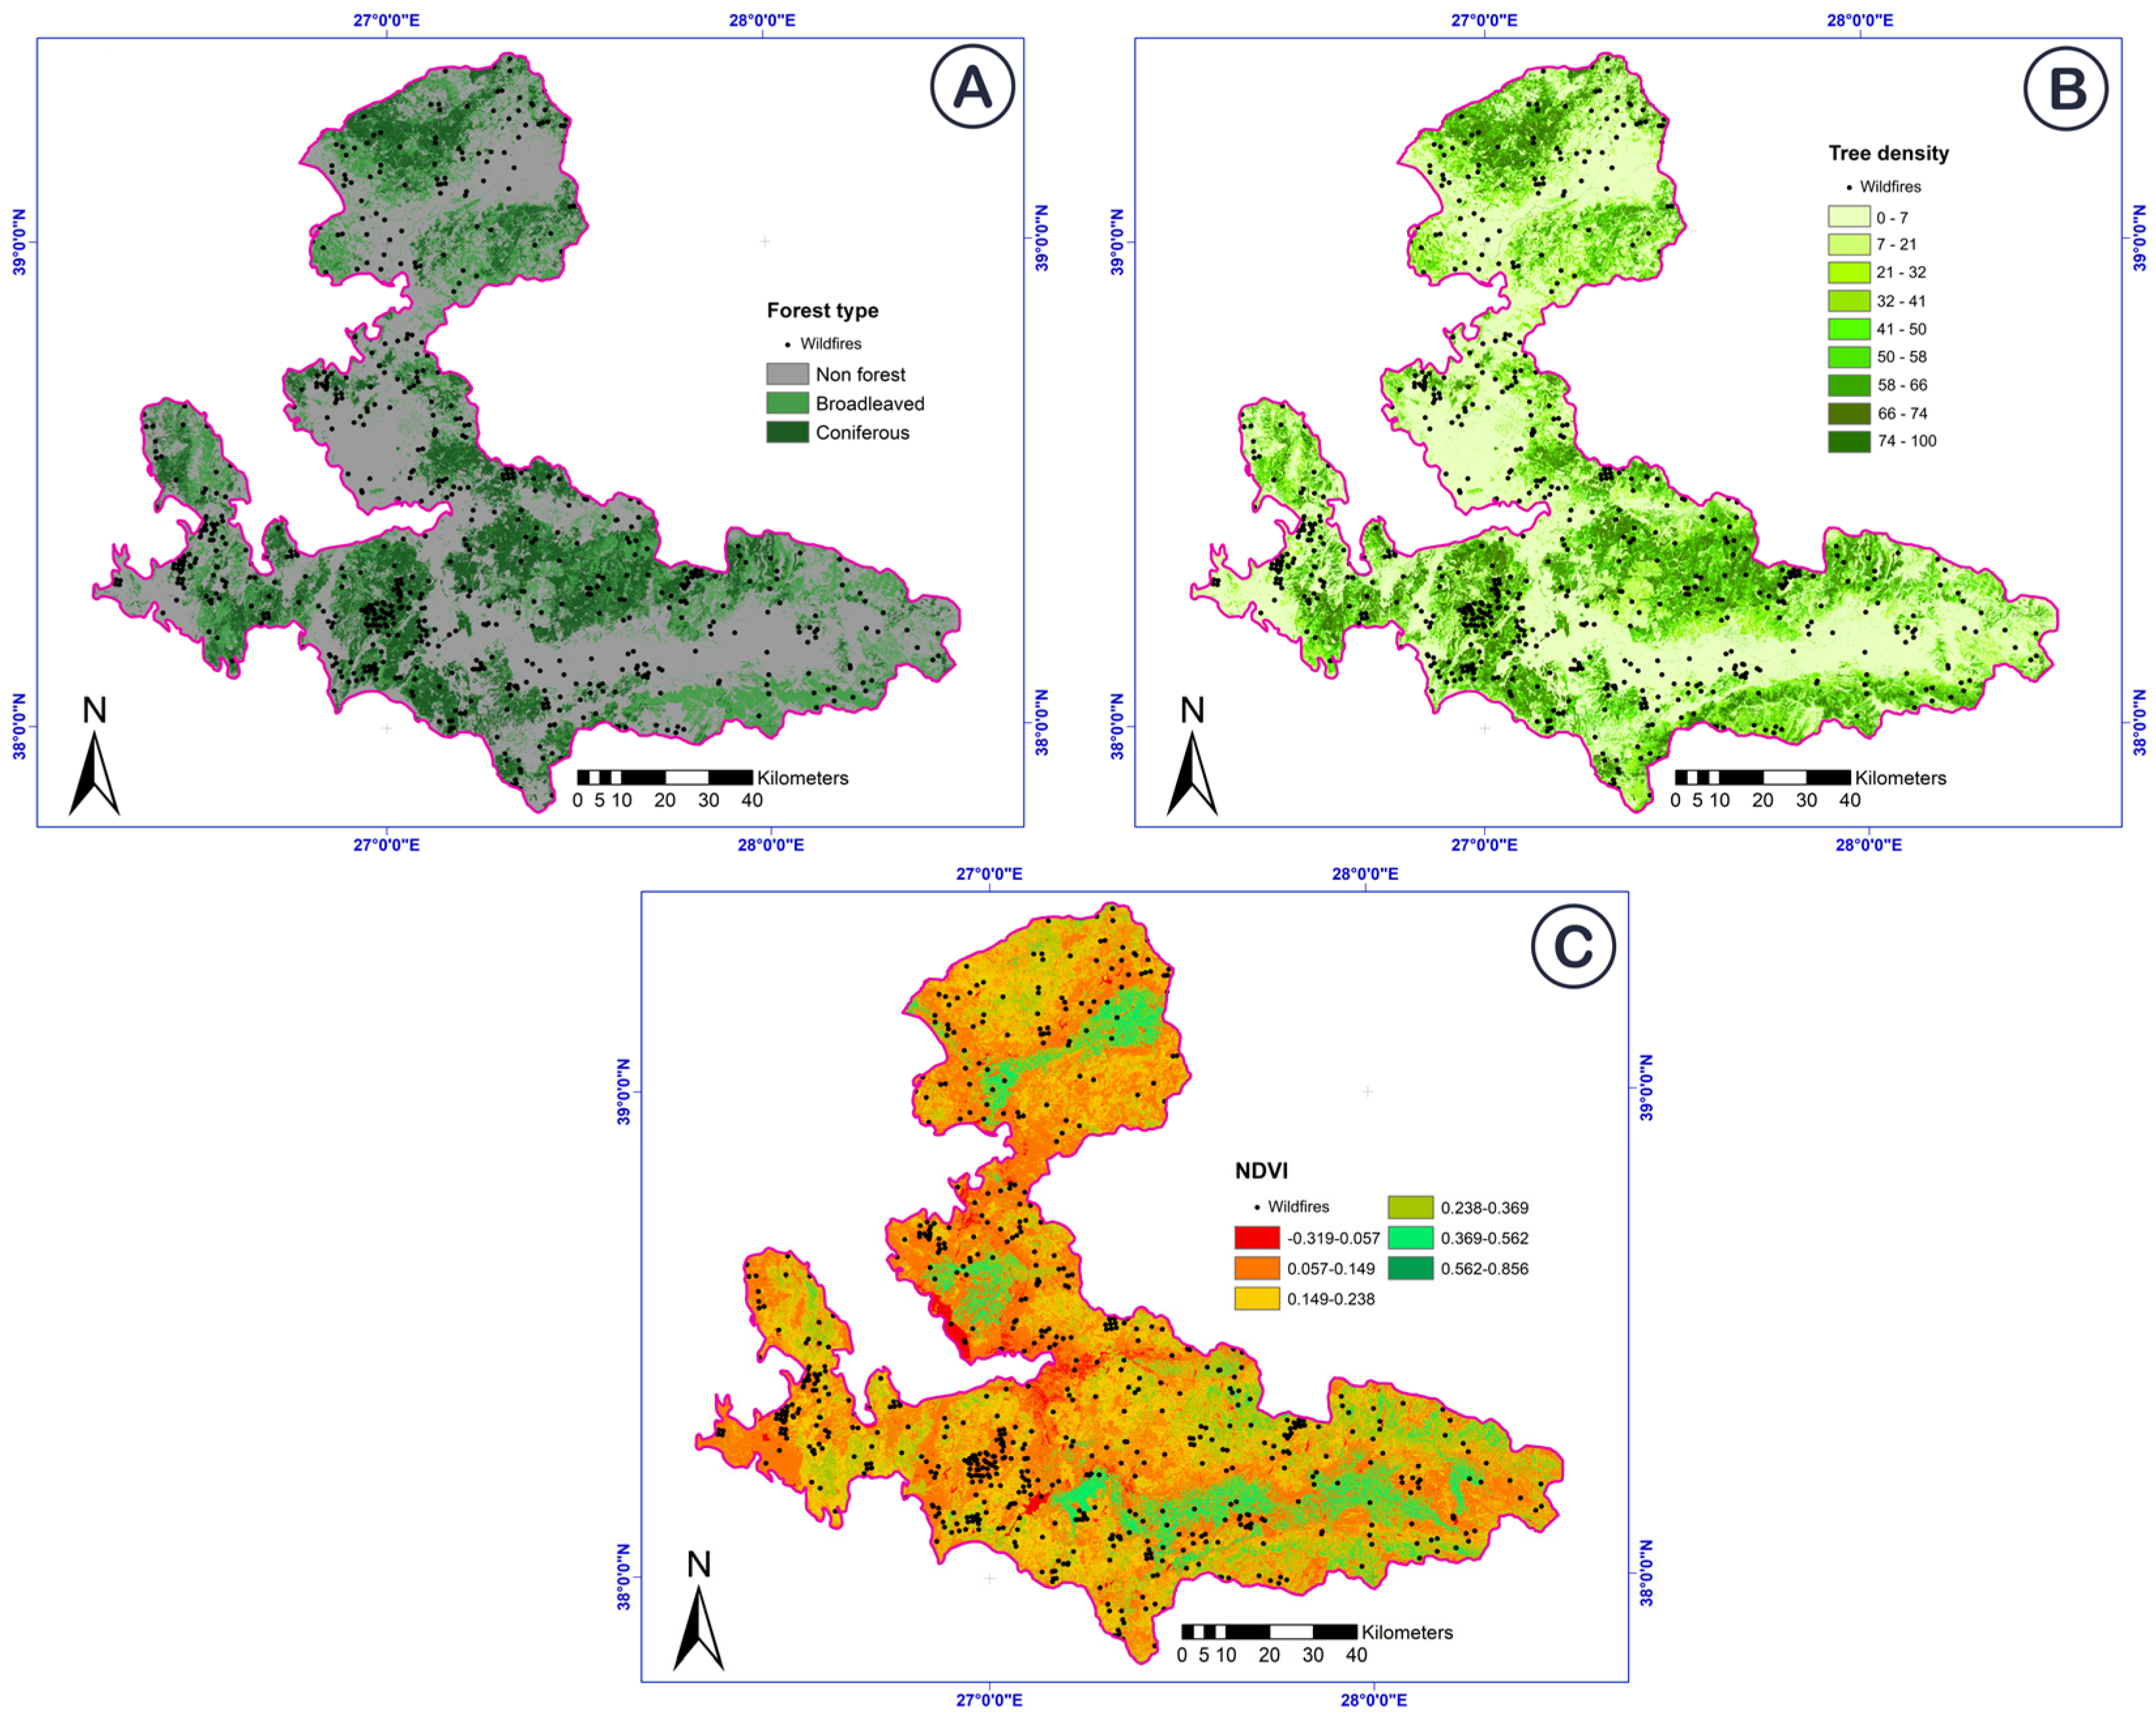
Last but not least, vegetation-related factors are also crucial in determining wildfire risks. Tree species significantly influence fire occurrence, with coniferous trees being particularly susceptible due to their highly flammable resin and rapid ignition in low humidity [12]. For this study, 2018 forest type data with a 10 m resolution from the Copernicus Land Monitoring Service were used. Additionally, tree cover density, which correlates with the spread of wildfires, was considered. Dense forests are more prone to fires because tree canopies serve as the primary fuel layer in crown fires [20,24]. The study utilized 2018 tree cover density data from the Copernicus Land Monitoring Service, with density expressed as a percentage from 0 to 100%. Furthermore, the Normalized Difference Vegetation Index (NDVI), a satellite-based measure of plant vitality, plays a critical role in assessing wildfire risks [21,59]. The NDVI was calculated from recent Landsat 8 reflectance images using Google Earth Engine, with the near-infrared (NIR) and red bands. Vegetation-related factors can be seen in Figure 5.
All spatial layers were converted to the WGS84 coordinate system and rasterized at a 30 m resolution using ArcGIS 10.4 software. For visualization, the layers were categorized using the natural break method. Pixel values from these rasterized layers, corresponding to both wildfire and non-wildfire samples, were compiled into a data frame to train and validate machine learning classifiers.

3. Methodology

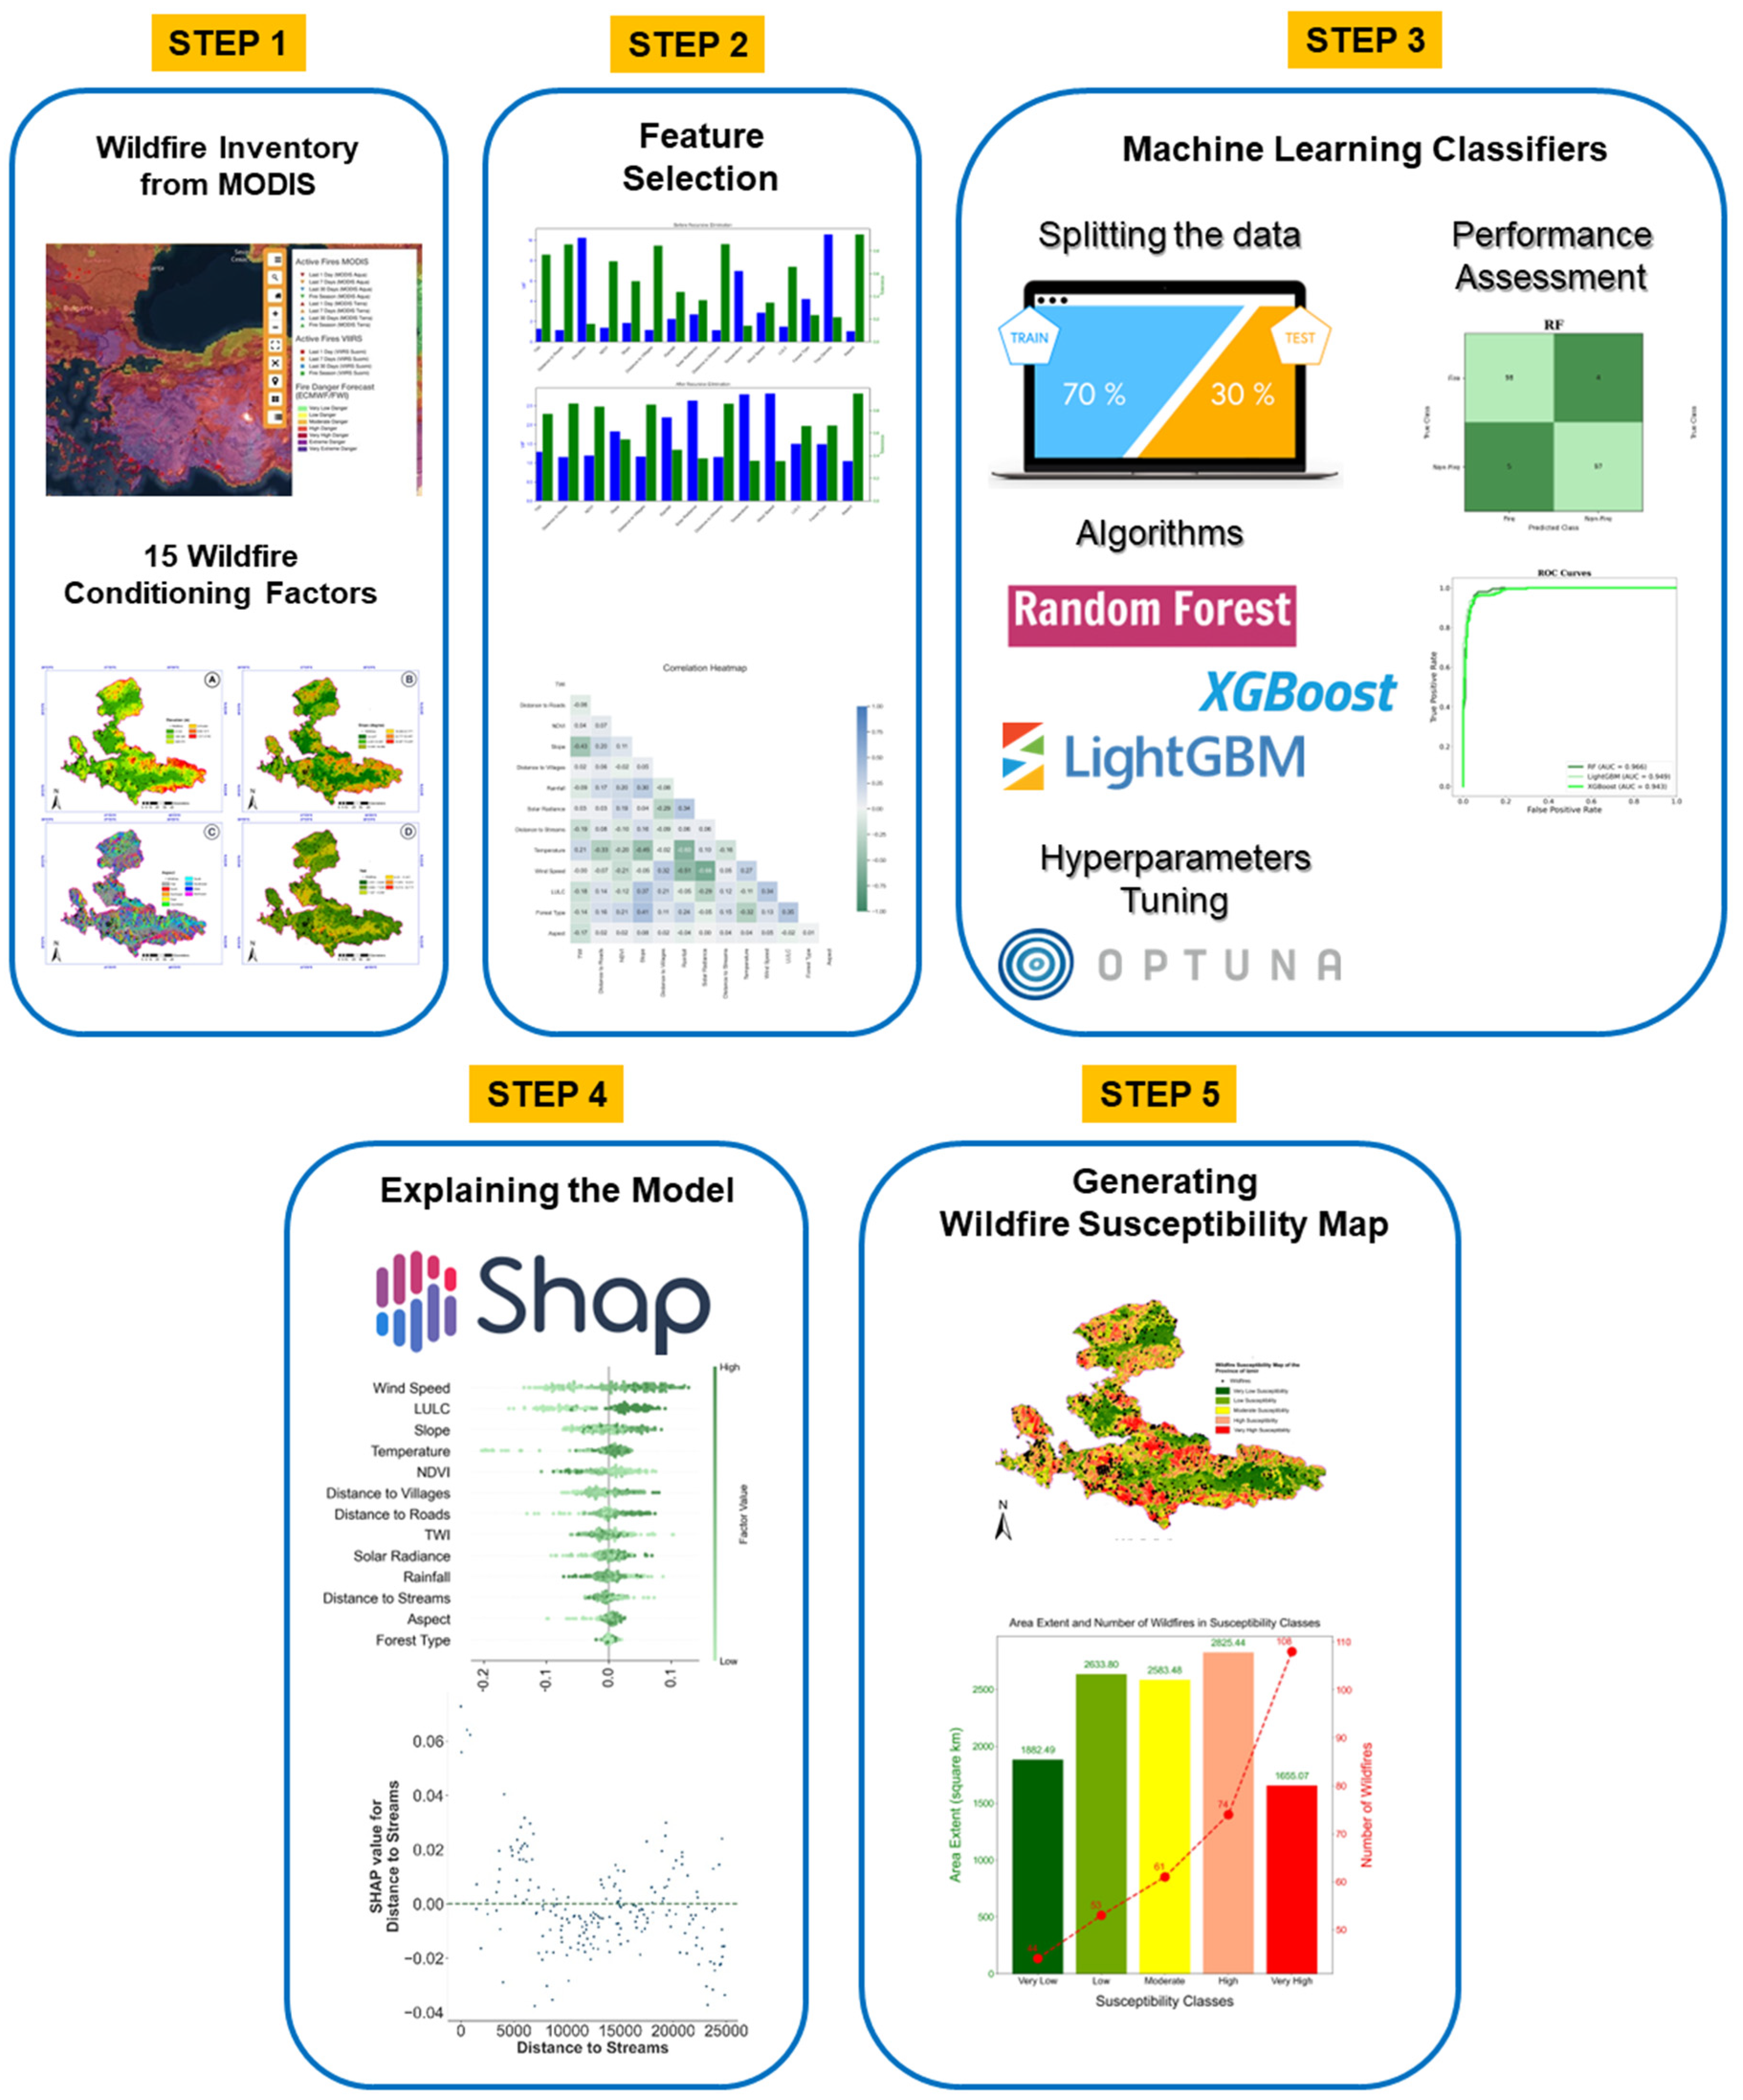
The research methodology is structured into five key steps: (1) Data preparation: Assemble an input data frame that includes both wildfire and non-wildfire samples along with the corresponding wildfire conditioning factor values. These data are then split into training and testing subsets. (2) Feature selection: Conduct a multicollinearity test and calculate Pearson’s correlation coefficients to identify and eliminate any inappropriate or redundant conditioning factors. (3) Performance evaluation: Compare the predictive performance of the classifiers. (4) Explainability: Utilize the SHAP technique to interpret the contribution of each conditioning factor for a local explanation of the classifiers’ predictions. (5) Susceptibility mapping: Generate wildfire susceptibility maps using the best performing classifier. Figure 6 summarizes the steps in the research methodology employed in this study.

3.1. Feature Selection

The effectiveness and dependability of wildfire susceptibility maps are largely contingent on the meticulous selection of conditioning factors that accurately represent local conditions. Thus, a multicollinearity analysis is crucial for identifying and eliminating any collinear, inappropriate, or redundant conditioning factors. This process is required to avoid the complications caused by a high dimensionality when training classifiers. Researchers typically employ multicollinearity tests for this purpose, utilizing two primary metrics: the Variance Inflation Factor (VIF) and Tolerance (TOL). A conditioning factor is deemed problematic if its VIF surpasses 10 or its TOL is less than 0.1, indicating multicollinearity issues. These factors must be excluded until all remaining factors exhibit satisfactory VIF and TOL values [12,24]. Additionally, in this study, Pearson’s correlation coefficients were calculated to complement the multicollinearity test.

3.2. ML Classifiers

This study generated wildfire susceptibility maps using three decision tree-based ensemble ML classifiers: Random Forest (RF), XGBoost, and LightGBM. To evaluate the models’ predictive performance, the input data frame was split into training and testing sets. Each classifier was trained on a random sample consisting of 70% of the data, which included 476 samples (238 wildfire and 238 non-wildfire). The remaining 204 samples (102 wildfire and 102 non-wildfire) were reserved for performance evaluation. For the RF model, the scikit-learn package in Python 3.8.0 was utilized for train–test splitting, model training, and performance assessment. The XGBoost and LightGBM classifiers were trained and evaluated using the xgboost and lightgbm libraries in Python, respectively.

3.2.1. Random Forest (RF)

RF, introduced by Breiman in 2001 [60], enhances decision tree accuracy and is widely used for regression and classification tasks due to its robustness. RF uses the bagging method, starting with a bootstrapped dataset. Decision trees are built from a subset of variables, with classifications determined by majority vote across multiple trees. Key hyperparameters shaping the model include the number of trees (NT), number of splits (NS), and depth (d). NT, the total number of trees, impacts accuracy and complexity, while NS, the minimum samples required to split nodes, affects underfitting risk. Depth influences how well the model captures data variations without overfitting. Balancing these hyperparameters is crucial for an optimal RF model, which outputs classifications using Equation (1):
Y ^ = 1 q N = 1 N h k X
where h X is a set of k th decision tree and X is the vector of the input factors.

3.2.2. eXtreme Gradient Boosting Machines (XGBoost)

XGBoost, a state-of-the-art ML algorithm, excels in classification tasks by sequentially constructing and refining weak learners, primarily decision trees [61]. It incorporates a regularization term to enhance robustness and prevent overfitting, and uses a second-order Taylor series expansion for more accurate performance assessments. XGBoost is designed for speed and efficiency on large datasets, balancing accurate predictions with complexity management. Unlike bagging, which combines predictions from independent trees to reduce variability (as in RF), boosting in XGBoost sequentially builds trees that correct predecessor errors to minimize bias. The objective of XGBoost is to minimize the regularized objective function, as expressed in Equation (2):
Φ = i l y ^ i , y i + k Ω f k
In Equation (2), the first term represents the loss function, measuring the discrepancy between the target class y i and the predicted class y ^ i . The second term, detailed below, serves as a penalty to regulate model complexity and prevent overfitting:
Ω f = γ T + 1 2 λ w 2
Here, in Equation (3), T denotes the number of leaves in the tree, w represents the score of each leaf, and γ and λ are regularization parameters. XGBoost uses an iterative approach to minimize the objective function during each step t , as shown in Equation (4):
L t = i = 1 n l y i , y ^ i t 1 + f t x i + Ω f t

3.2.3. Light Gradient Boosting Machine (LightGBM)

The LightGBM is a notable ML advancement, excelling in classification tasks. Its key feature is the efficient handling of categorical features using Gradient-based One-Side Sampling, making it effective for large-scale datasets with sparse variables. Unlike XGBoost, LightGBM uses a leaf-wise tree growth strategy, focusing on nodes with the highest loss reduction to enhance performance in large datasets and complex feature interactions [62]. The primary workflow of the LightGBM algorithm is as follows:
F n x = α 0 f 0 x + α 1 f 1 x + + α n f n x
In Equation (5), the classifier starts with n decision trees, and each training sample is initially assigned a weight of 1 / n . The weak classifier f ( x ) is then trained to determine its strength α . The classifier iteratively updates these weights through successive rounds of training until it converges to the final classifier F n x .

3.2.4. Hyperparameters Tuning

In order to optimize prediction performance, analysts must specify and tune hyperparameters, which are variables within ML algorithms that are not constant. Hyperparameter tuning is essential before finalizing the predictor model, as it allows classifiers to effectively manage relationships within the dataset. To fine-tune the hyperparameters of all classifiers, the Optuna hyperparameter optimization framework was utilized. Optuna leverages Bayesian optimization, specifically using the Tree-structured Parzen Estimator algorithm, to enhance tuning efficiency. Unlike traditional methods such as grid search and random search, Optuna provides computational efficiency and reduces the risk of settling on local optimum values [63].

3.3. Performance Assessment

To evaluate the performance of classifiers, several key measures are employed, which are grounded in the confusion matrix. This matrix lays the foundation for performance metrics by categorizing predictions into four groups:
  • True Positives ( t p ): The number of actual fires correctly identified as fires;
  • True Negatives ( t n ): The number of non-fires correctly identified as non-fires;
  • False Positives ( f p ): The number of non-fires incorrectly identified as fires;
  • False Negatives ( f n ): The number of fires incorrectly identified as non-fires.
These categories are crucial for calculating various binary classification metrics [64]. For a single class C, the counts ( t p ,   f n ,   f p ,   t n ) are used to determine sensitivity, specificity, precision, accuracy, and the F-1 score. Table 2 showcases these metrics, but two standout measures for performance evaluation are the Receiver Operating Characteristic (ROC) curve and the Area Under the ROC Curve (AUC). The ROC curve is a probability curve used in binary classification tasks, plotting the True Positive Rate against the False Positive Rate. The AUC represents the overall classification accuracy, with higher values indicating a better performance. An AUC exceeding 0.9 signifies near-excellent classification performance.

3.4. Explainability of Classifiers with SHAP Method

The explainability of ML models, a key topic in XAI, highlights the significance of conditioning factors in predicted outcomes. This transparency enables analysts to understand what the ML model prioritizes when evaluating wildfire susceptibility [27,41,65]. XAI techniques can be categorized into two primary types: global and local approaches. Global explanations provide insight into the overall influence of essential conditioning factors on average predictions. Examples of global methods include permutation feature importance, mean decrease impurity, and information gain. In contrast, local explainability focuses on individual (sample-wise) predictions, allowing analysts to discern which conditioning factors significantly impact specific outcomes. This granular view reveals how each factor affects predictions at the sample level. A noteworthy local technique is SHapley Additive exPlanations (SHAP), which is gaining prominence for its ability to elucidate the contributions of conditioning factors to individual predictions [26].
The SHAP technique is grounded in Shapley values, a concept from game theory introduced by Lloyd Shapley in 1951 [66]. To elucidate the application of SHAP values in the context of wildfire susceptibility mapping using ML classifiers, we considered three conditioning factors, Factor A, Factor B, and Factor C, which collectively predict wildfire susceptibility. The Shapley values method can be employed to fairly attribute the importance of each factor. Assuming that Factor A is used alone, it predicts a susceptibility score of 10 points. Factor B alone predicts 20 points, and Factor C alone predicts 25 points. When Factors A and B are combined, they might predict a susceptibility score of 40 points. Factors A and C together might predict 30 points, while Factors B and C together might predict 50 points. When all three factors are used collectively, they predict 90 points, indicating a very high susceptibility to wildfires. To determine the contribution of each factor, all possible combinations and sequences in which the factors can be used are considered. The marginal contribution of a factor is the difference it makes to the prediction when added to a subset of other factors. Mathematically, for a set of N factors, where S is a coalition subset of factors, and f(S) is the total value of the subset S, the Shapley value for factor i is given in Equation (6):
ϕ i = 1 N ! S N i S ! N S 1 ! N f S i f S
In this case, the contribution of Factor A is calculated by considering the difference it makes when included in different subsets of factors. When Factor A is used alone, its contribution is represented as f(A). When used with Factor B, its contribution is f(A,B) − f(B). When all three factors are used together, the contribution of Factor A is f(A,B,C) − f(B,C). By averaging these contributions across all possible combinations, the Shapley value for Factor A is obtained. Thus, Shapley values provide a clear and equitable measure of the importance of each conditioning factor in the machine learning model [67].
In this study, the SHAP method was implemented using the SHAP library in Python [68,69]. This library is a powerful tool for interpreting and explaining the outputs of ML models by offering a variety of visualizations. SHAP can also provide a global explanation by aggregating individual predictions. The SHAP framework includes model-specific explainability methods such as Linear SHAP for linear models with independent features, Tree SHAP for decision tree-based ensemble algorithms, and Deep SHAP for deep learning models. Given that this study employs decision tree-based ensemble algorithms, the TreeSHAP module was utilized.
In this study, two types of SHAP visualizations were adopted to enhance the explainability of the classifiers. The first is the SHAP summary plot, which serves as an effective alternative to the traditional feature importance plot. This plot not only includes the important contributing factors but also illustrates the range of effects of these factors within the dataset. A color bar indicates the impact of contributing factors: those that influence the model’s outcome positively are highlighted in one color, while those that have a negative impact are represented in a contrasting color. The horizontal dots for each contributing factor display the distribution of the Shapley values for each data instance. Additionally, SHAP dependence plots were used to analyze the interactions between the contributing factor values and their influence on the model outcome (Shapley values). These plots illustrate the variation of the model outcome by specific contributing factor values, helping to identify patterns or trends between the contributing factor values and their corresponding Shapley values [70]. In this study, such plots were instrumental in understanding how the values of any contributing factor influence wildfire susceptibility and in identifying critical thresholds.

4. Results and Discussions

4.1. Multicollinearity Results

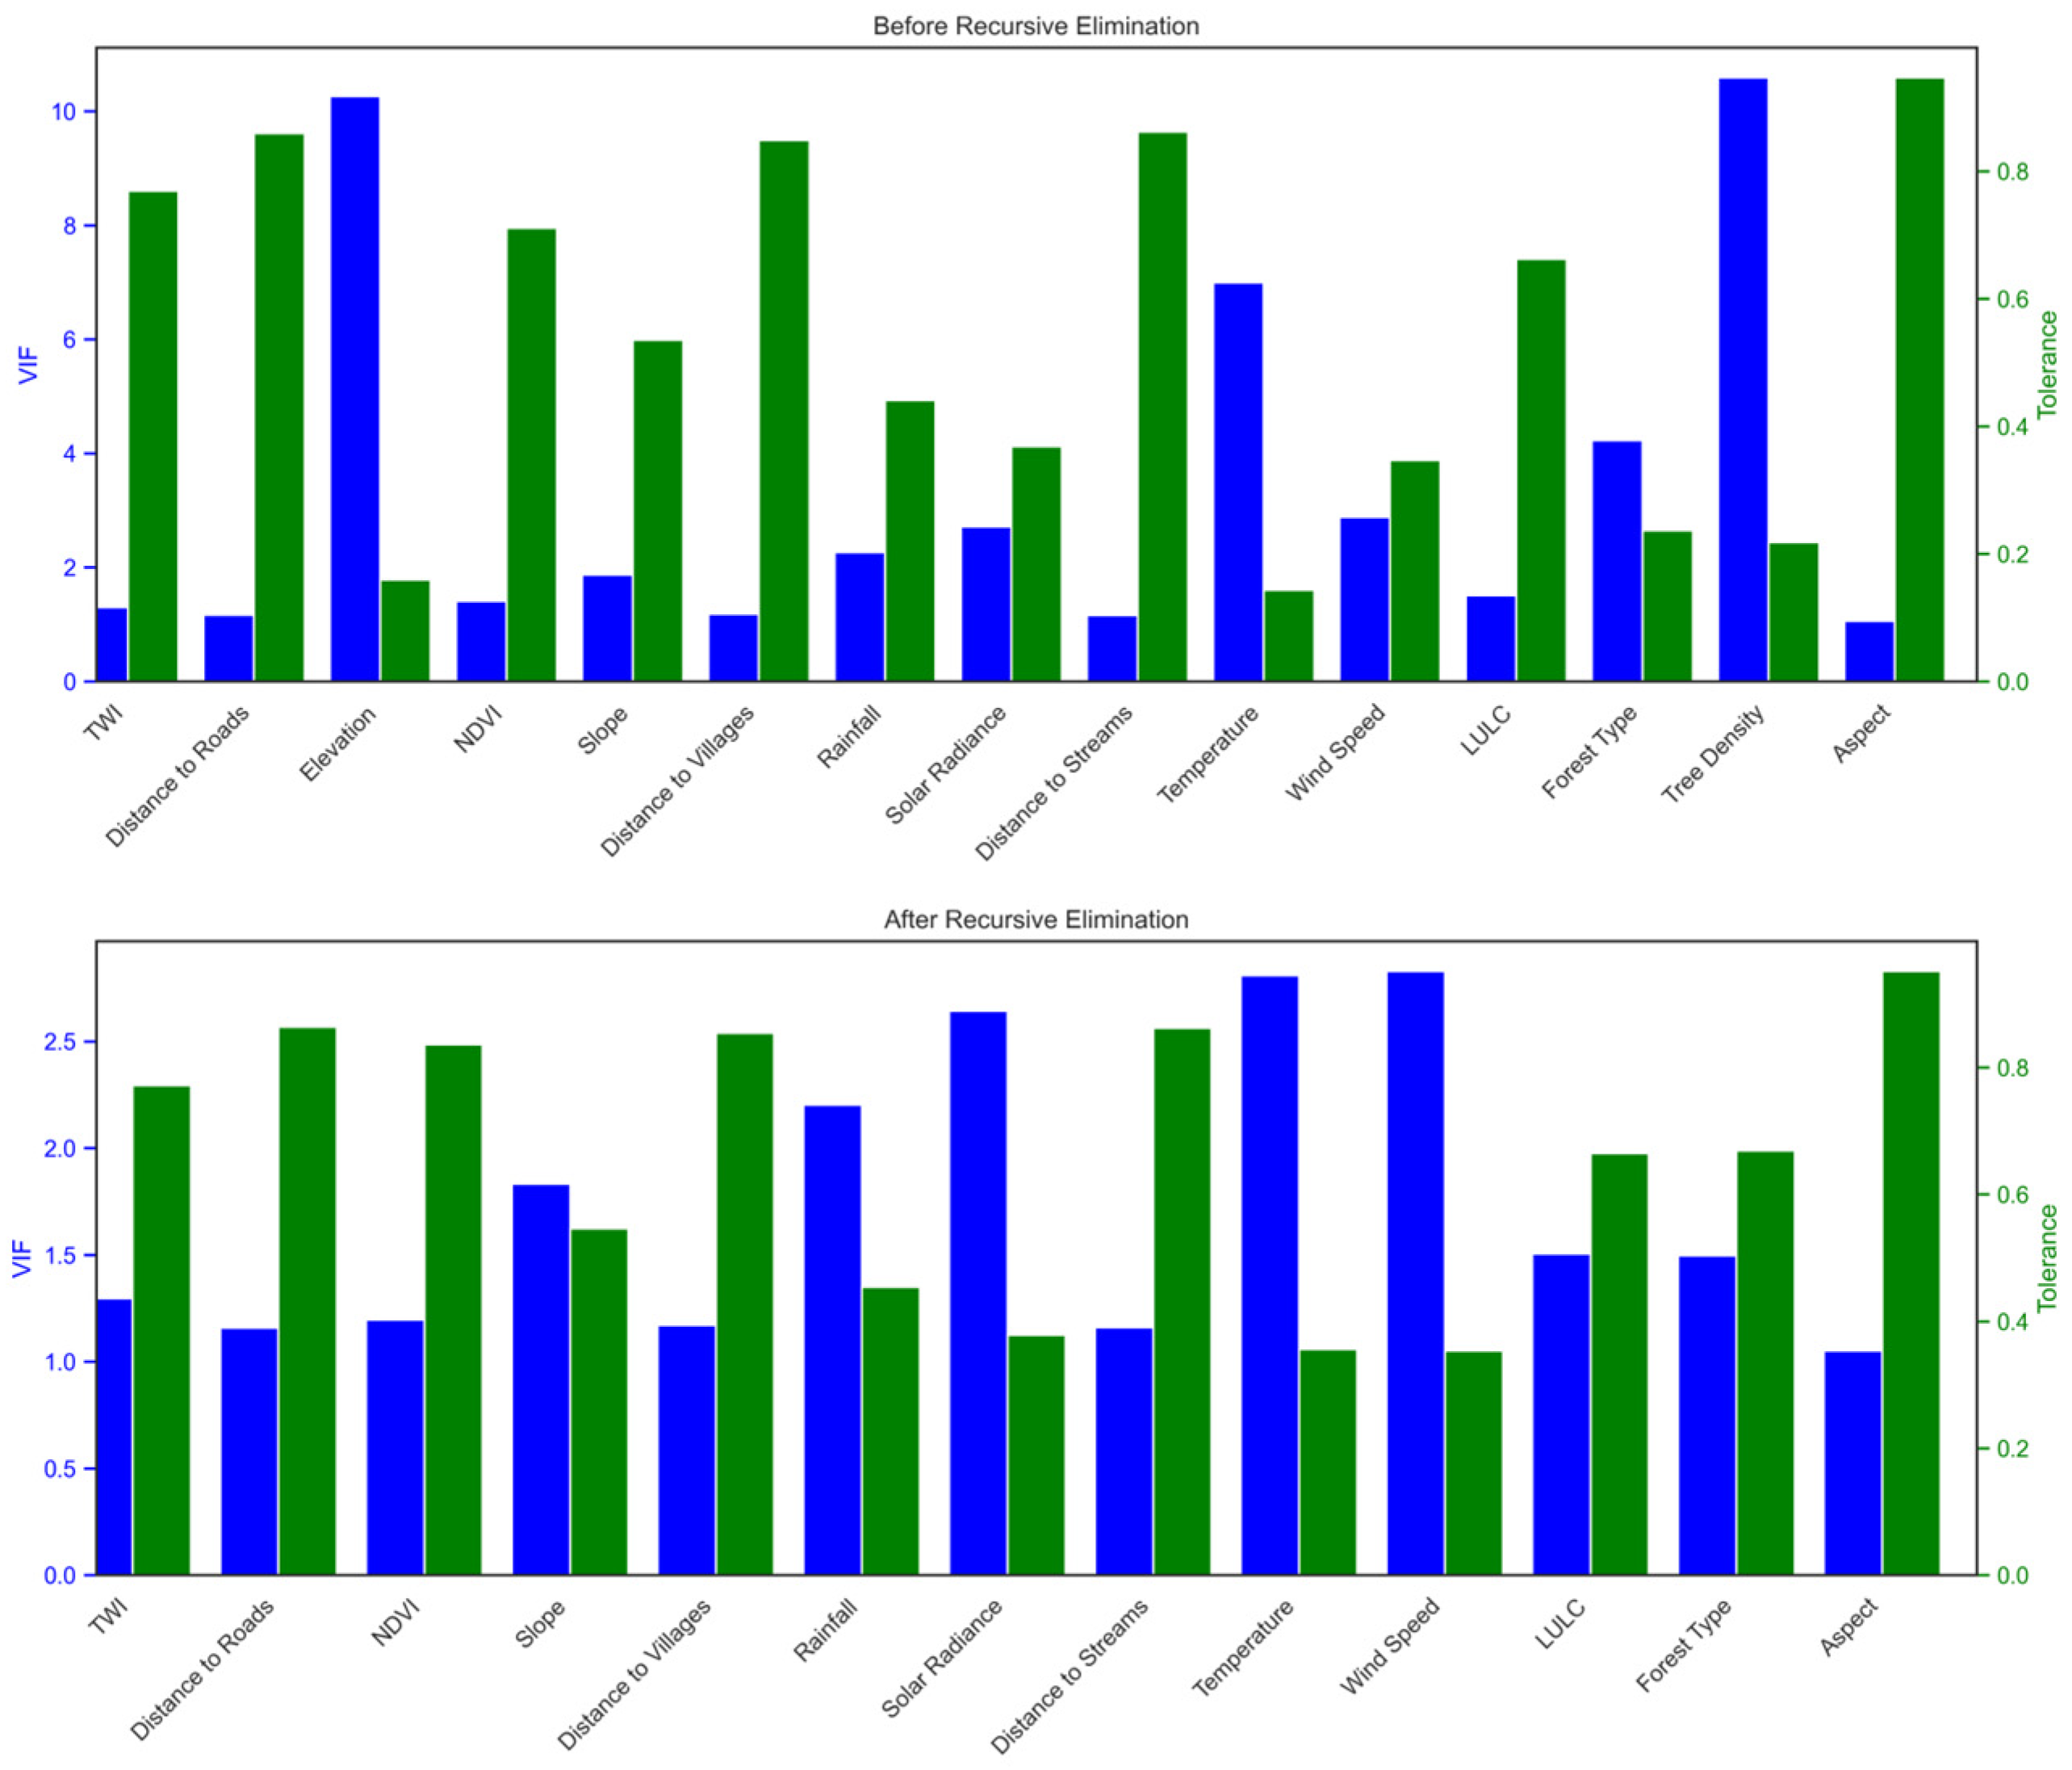
The calculated VIF and TOL values reveal the presence of multicollinearity in certain factors (Figure 7—upper). We identified this issue due to some VIF values exceeding 10. To resolve this, we employed a recursive elimination strategy, starting with the factor with the highest VIF value and continuing until no factors exhibited multicollinearity problems. Through this process, we retained 13 factors, specifically removing the elevation and tree density factors. After elimination, the highest VIF was reduced to 2.82, and the lowest TOL was 0.35 (Figure 7—lower). Consequently, the remaining factors were deemed suitable for classification processes as they no longer exhibited multicollinearity issues.
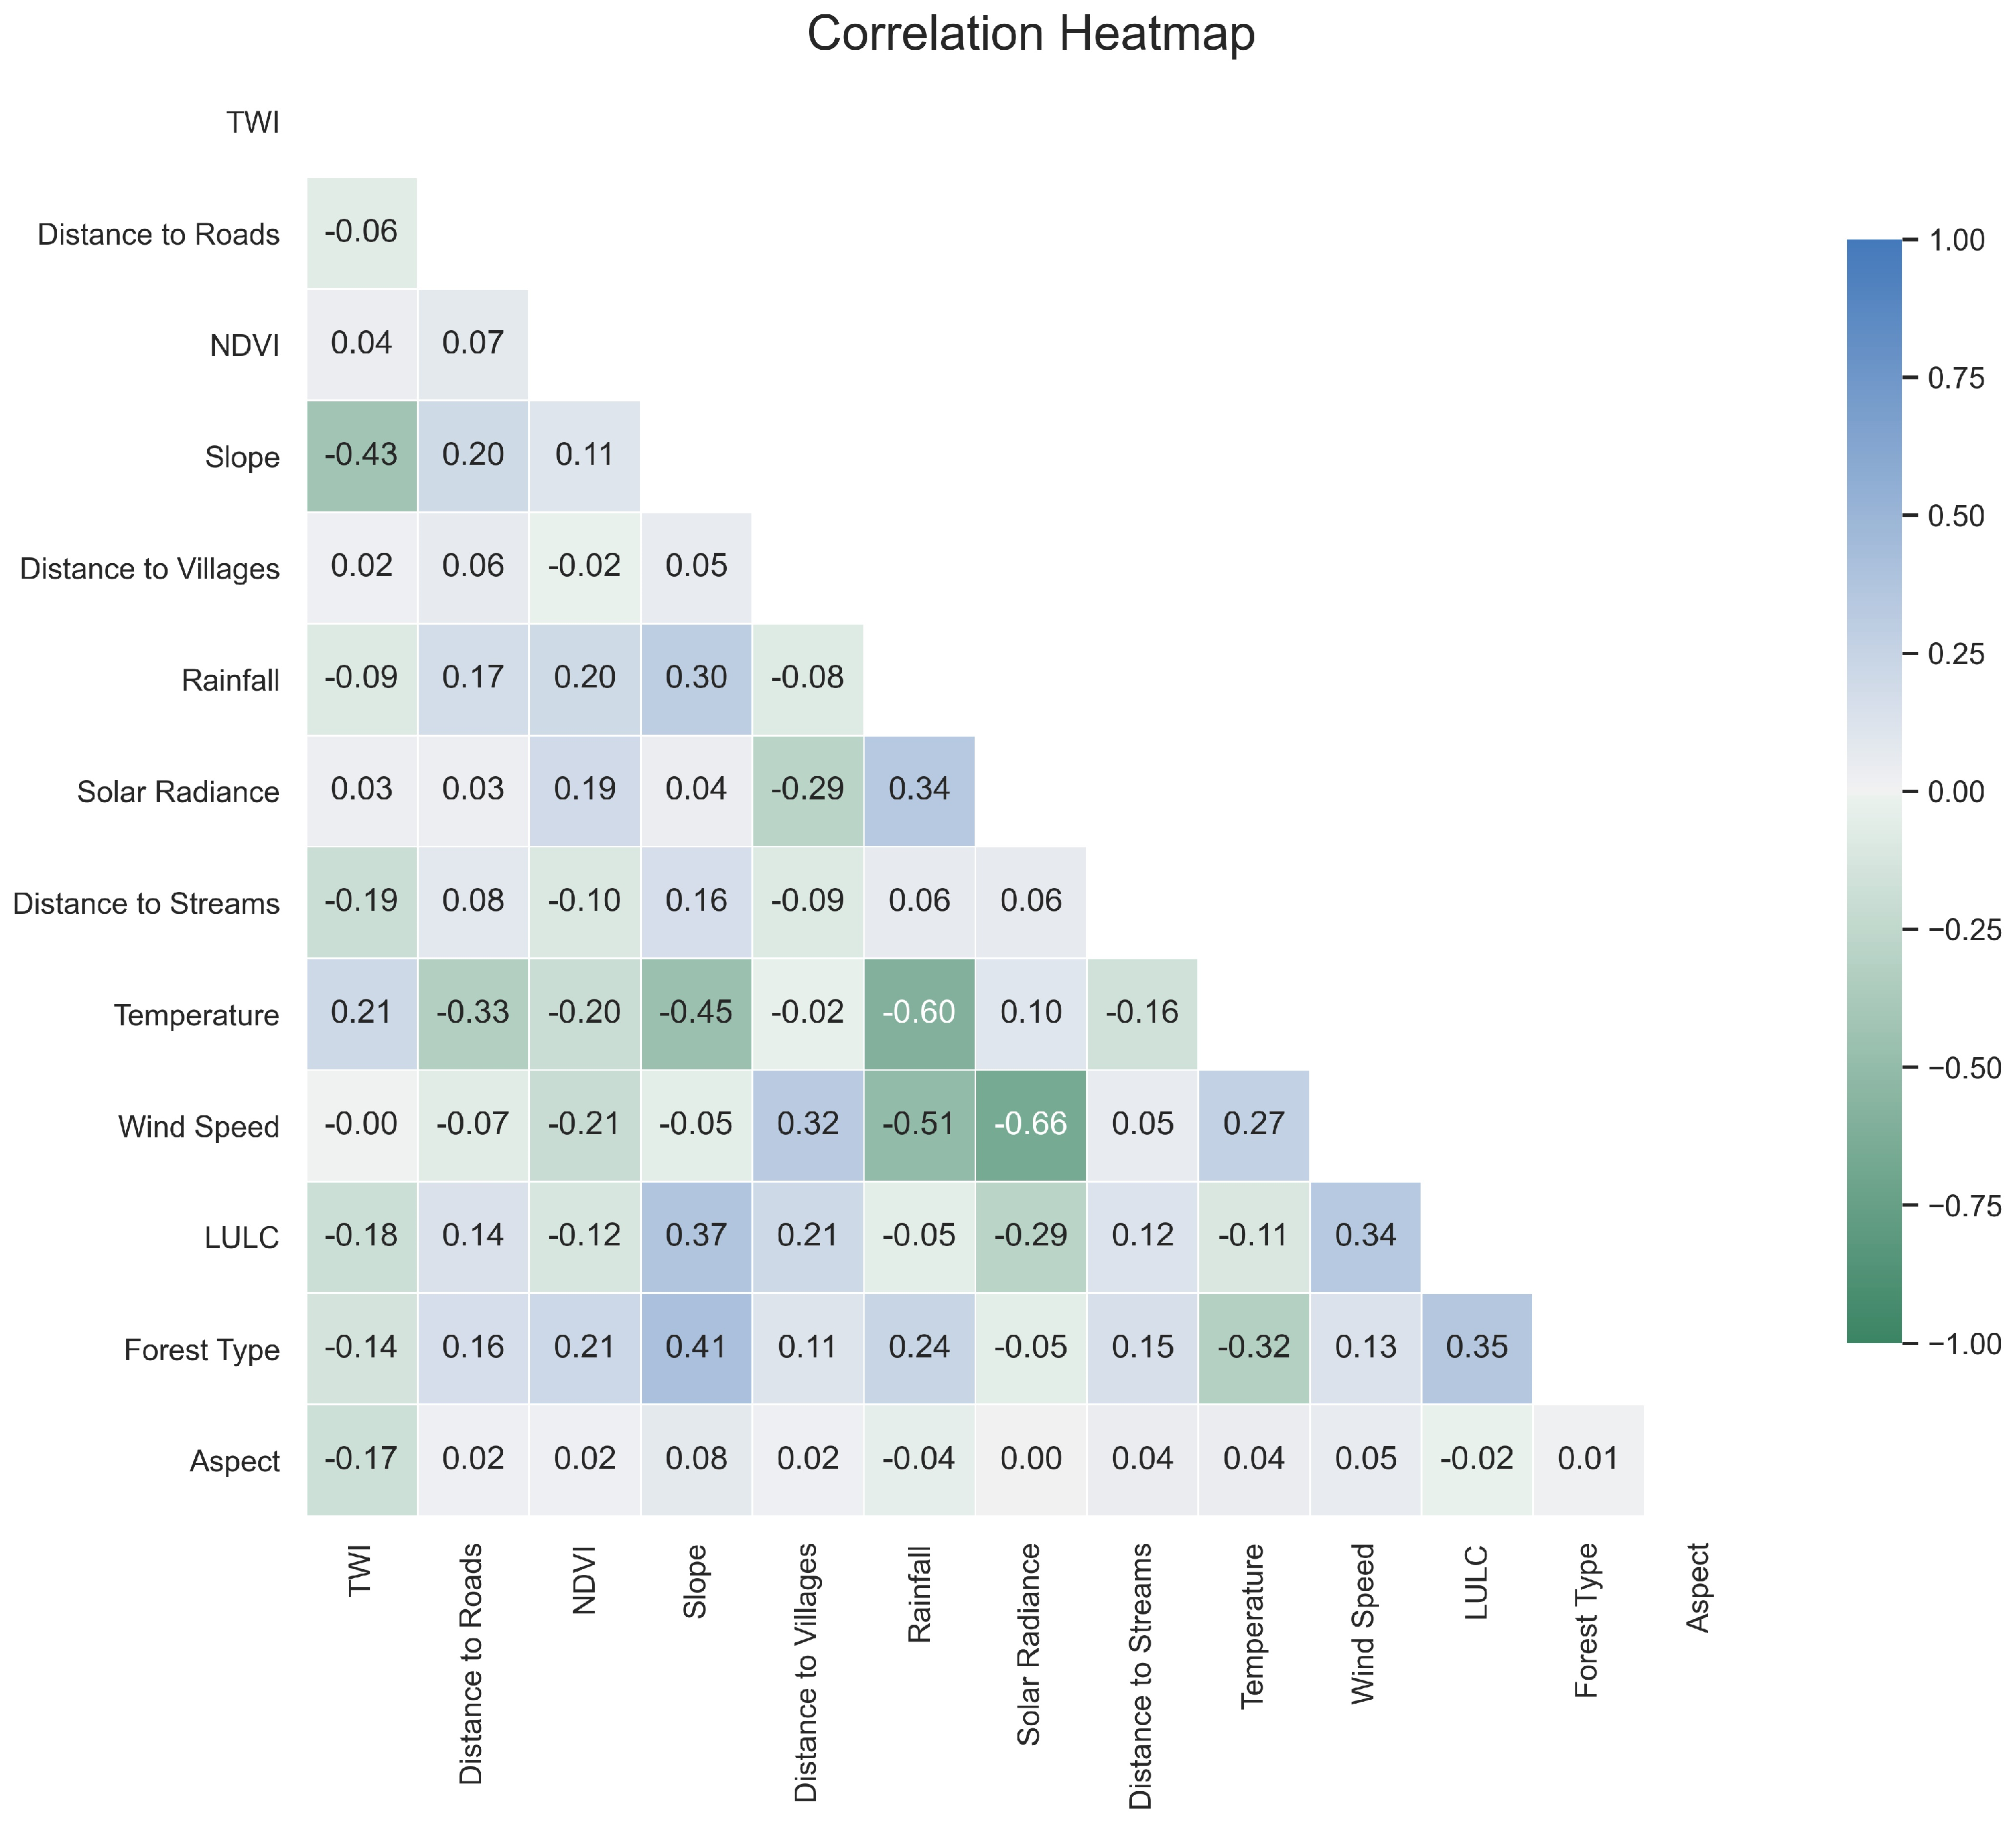
To validate the findings of the multicollinearity assessment, Pearson’s correlation coefficients were calculated for these 13 factors. As shown in Figure 8, the highest correlation value was observed between Wind Speed and Solar Radiance, with a coefficient of −0.66. Overall, the matrix indicates that most factor pairs do not have significant correlations, with partially correlated pairs remaining below the threshold of 0.8.
We conducted thorough multicollinearity analysis and Pearson correlation matrix evaluations, identifying elevation and tree density as highly correlated variables in our wildfire susceptibility dataset. While recognizing that 83% of fire samples are in lower elevation areas (less than 150 m) and 72% are in dense tree density zones (more than 50% tree density), we evaluated the impact of these variables on model performance. We observed a 3.1% decrease in accuracy for our RF model when elevation and tree density were included. Therefore, we decided to exclude these variables to improve model accuracy and interpretability, as their high correlation with other variables compromised the overall performance. Given that a significant number of fire samples are already concentrated in lower elevations and dense tree areas, further interpretation of the effects of elevation and tree density on wildfire susceptibility was deemed redundant. To effectively capture terrain characteristics while mitigating multicollinearity risks, we considered alternative variables such as slope, aspect, and composite indices like the TPI. This approach aligns with best practices in feature selection, optimizing model performance while maintaining practical relevance and enhancing the robustness and applicability of our predictive models in risk assessment contexts.

4.2. Tuned Hyperparameters

In this study, we used the Optuna hyperparameter optimization framework to fine-tune the hyperparameters for all classifiers. The search space for hyperparameters included specified ranges for exploration during the optimization process. Optuna systematically evaluated various hyperparameter configurations within the defined search space, resulting in optimized hyperparameters that improved the predictive performance of the classifiers on the dataset. The fine-tuned hyperparameters for each classifier are as follows:
  • RF: {n_estimators: 611}, {min_samples_split: 3}, {max_depth: 11}, {min_samples_leaf: 3};
  • XGBoost: {n_estimators: 509}, {eta (learning_rate): 0.01145}, {max_depth: 12}, {subsample: 0.9854};
  • LightGBM: {n_estimators: 399}, {eta (learning_rate): 0.01227}, {max_depth: 12}, {subsample: 0.90390}.

4.3. Classifier Performance

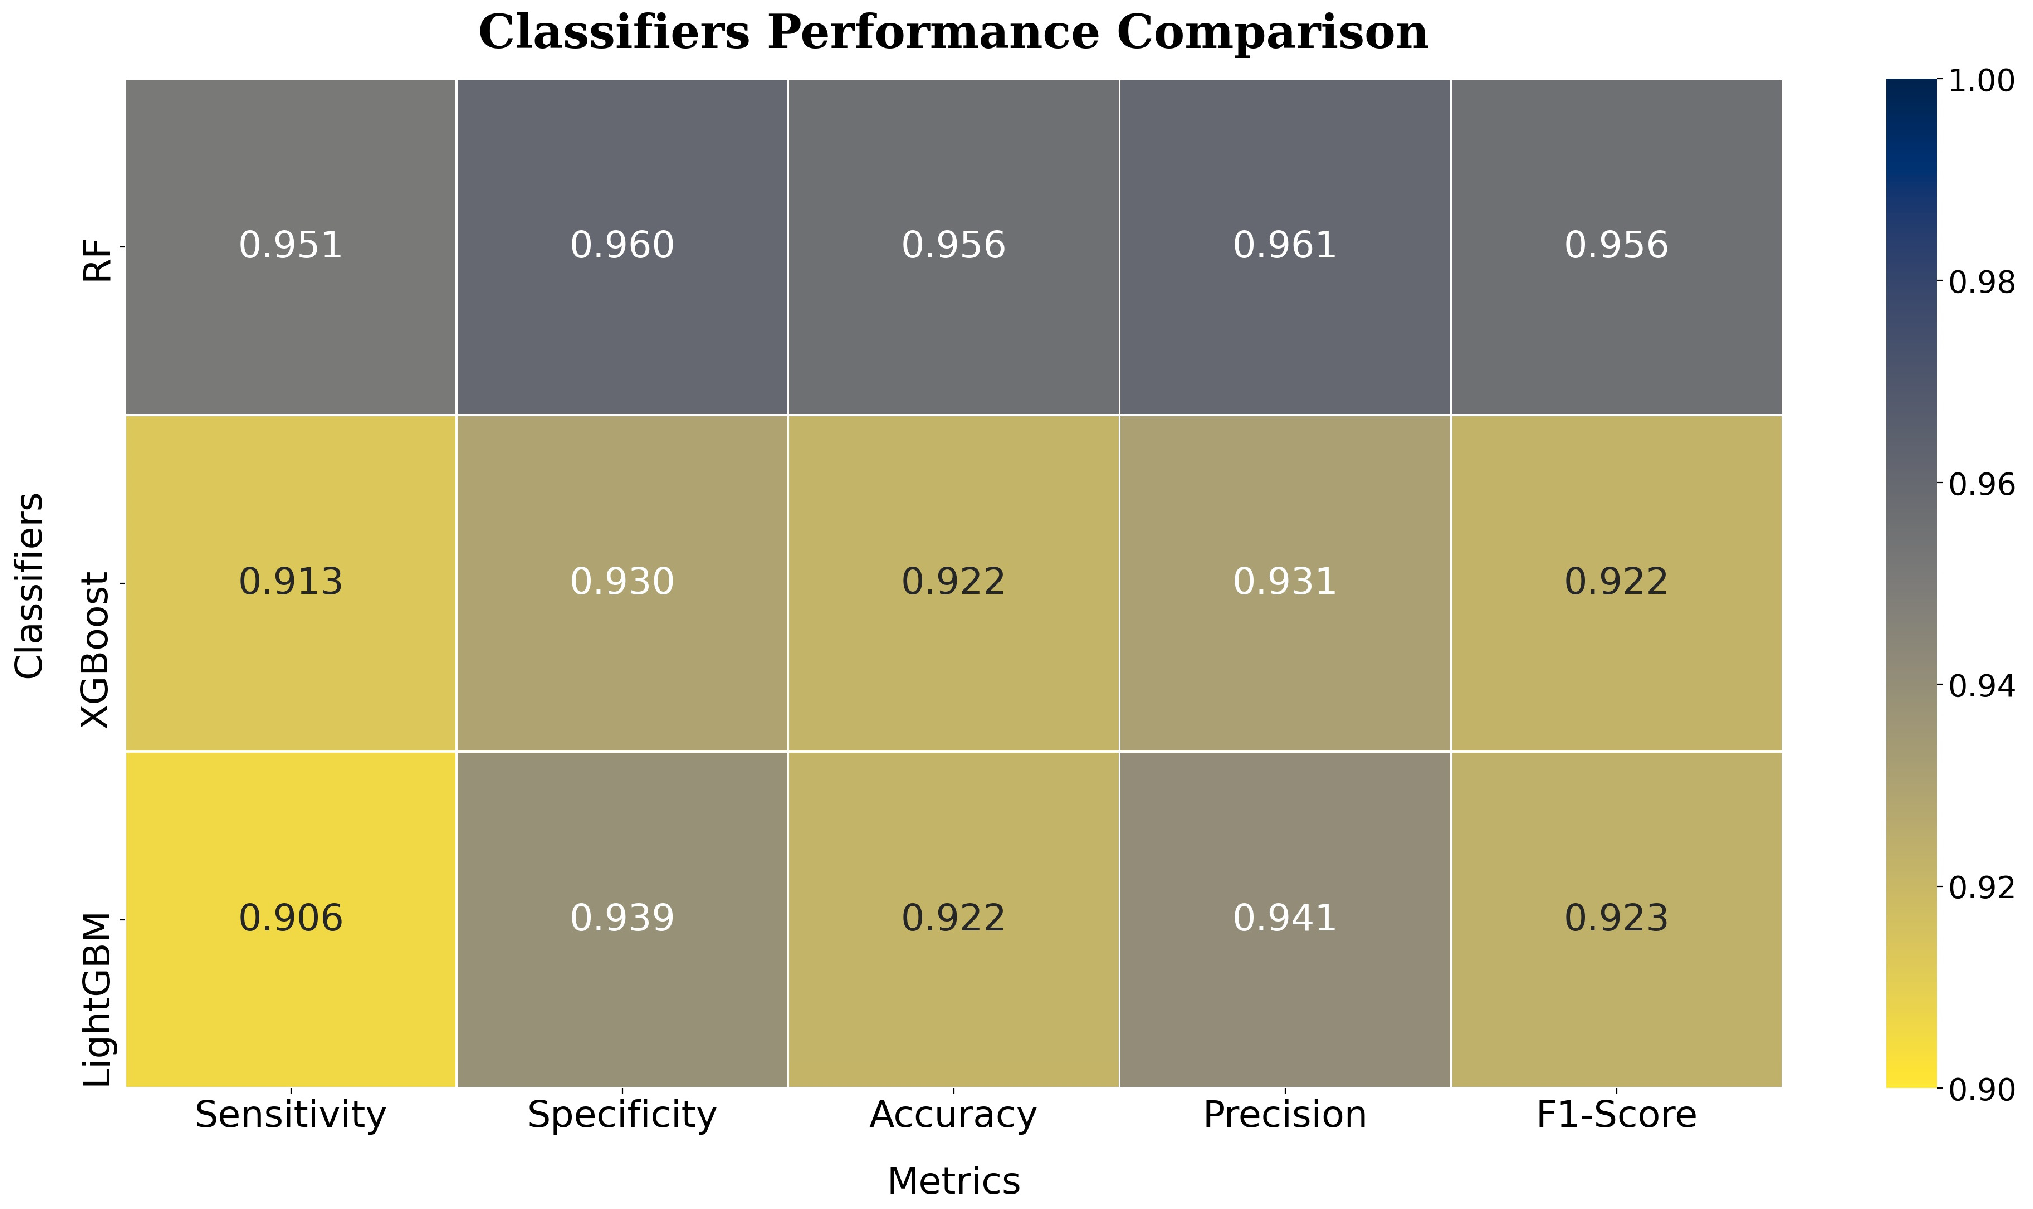
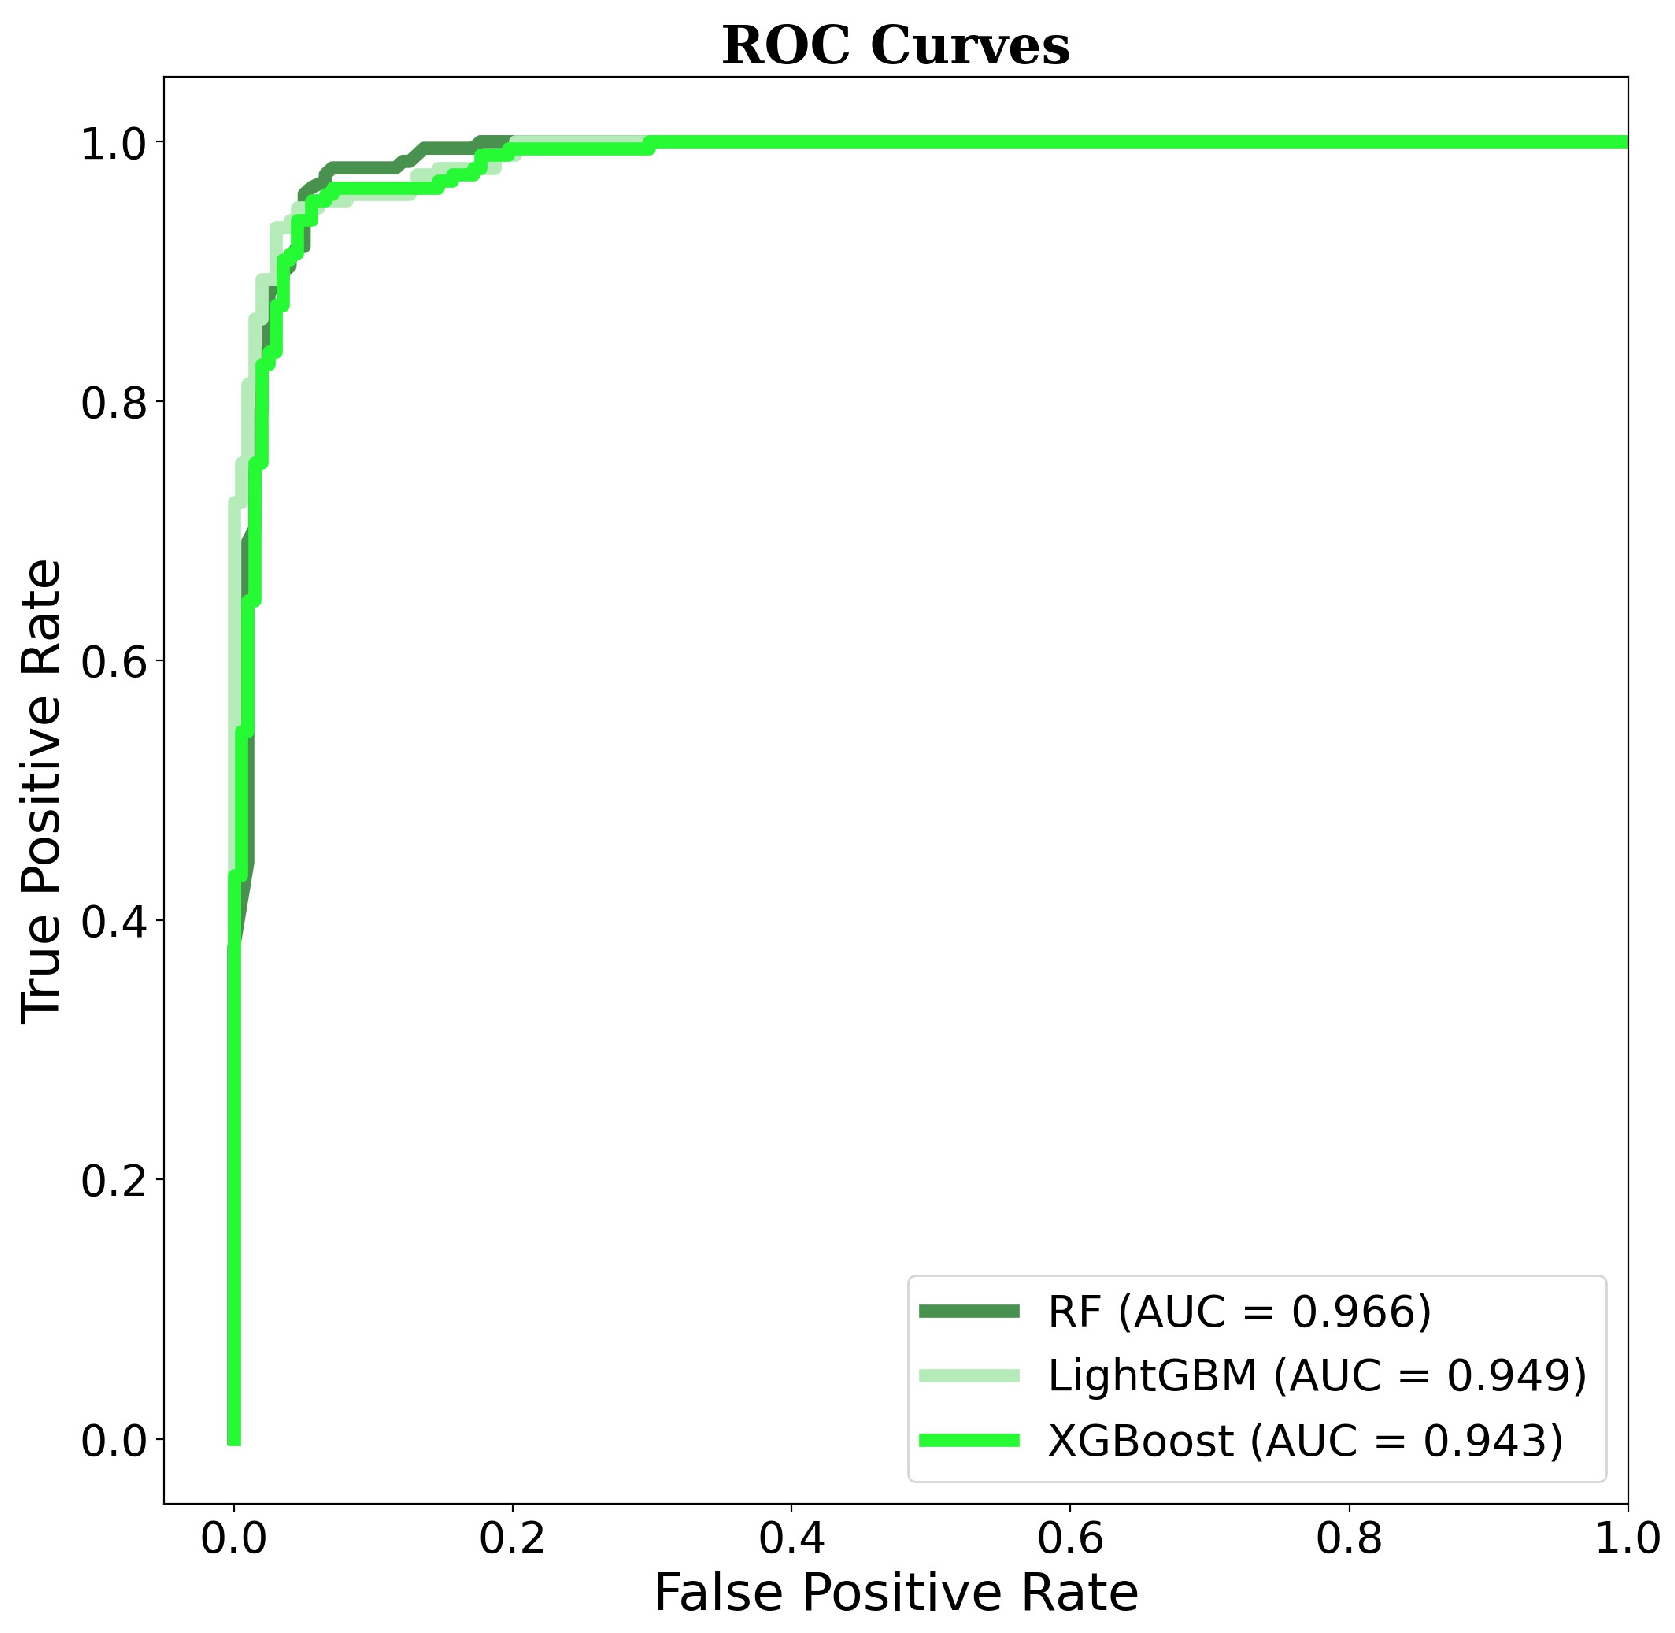
The evaluation of the trained ML models, illustrated in Figure 9 through confusion matrices, provides key metrics such as sensitivity, specificity, accuracy, precision, and F-1 score, summarized in Figure 10. Additionally, Figure 11 displays ROC curves and AUC results. The performance assessment shows that the RF model achieved the highest test accuracy at 95.6%, outperforming XGBoost and LightGBM, both of which achieved 92.2%. RF surpassed other ensemble algorithms by approximately 3.4%. Furthermore, RF exhibited the highest precision score (96.1%), closely followed by LightGBM (94.1%). RF also led in sensitivity (95.1%), specificity (96.0%), and F-1 score (95.6%). Figure 10 highlights RF’s superior prediction accuracy. However, all of the classifiers demonstrated scores above 90%, indicating a strong predictive performance. Examining the AUC values in Figure 11 underscores the robust performance of all the algorithms for wildfire susceptibility in this case study. A higher AUC value indicates a classifier’s effectiveness in avoiding false classifications. The RF classifier excelled with a 96.6% AUC, showing a slightly superior discrimination capacity compared to the other classifiers, including LightGBM (94.9%) and XGBoost (94.3%), which had similarly high AUC values.
An analysis of the confusion matrices for each classifier highlighted the RF model’s precision in classifying wildfire and non-wildfire samples in the test set. The RF model accurately classified 98 out of 102 wildfire samples and 97 out of 102 non-wildfire samples, demonstrating a superior performance in both categories. This resulted in a 96.0% accuracy for wildfire classification and a 95.1% accuracy for non-wildfire classification. Based on these impressive results, we chose to generate a wildfire susceptibility map and utilize SHAP analysis using the RF classifier’s output.
In ML research, the effectiveness of classification models is heavily influenced by the architecture of the algorithm, the number of input variables, and their interactions. As a result, determining the most appropriate algorithm for a specific problem is a complex task. Previous studies [24,38,56,71,72,73,74] have found that decision tree-based ensemble algorithms like RF, XGBoost, and LightGBM often surpass traditional algorithms in performance. Consequently, this study exclusively utilized these decision tree-based ensemble algorithms, which demonstrated exceptional performance across various metrics. The minor variations in evaluation metrics among the employed ML models can be attributed to the specific characteristics of the metrics and the distinct structures of the models used in this research [75].

4.4. SHAP-Based Feature Importance (Summary Plots)

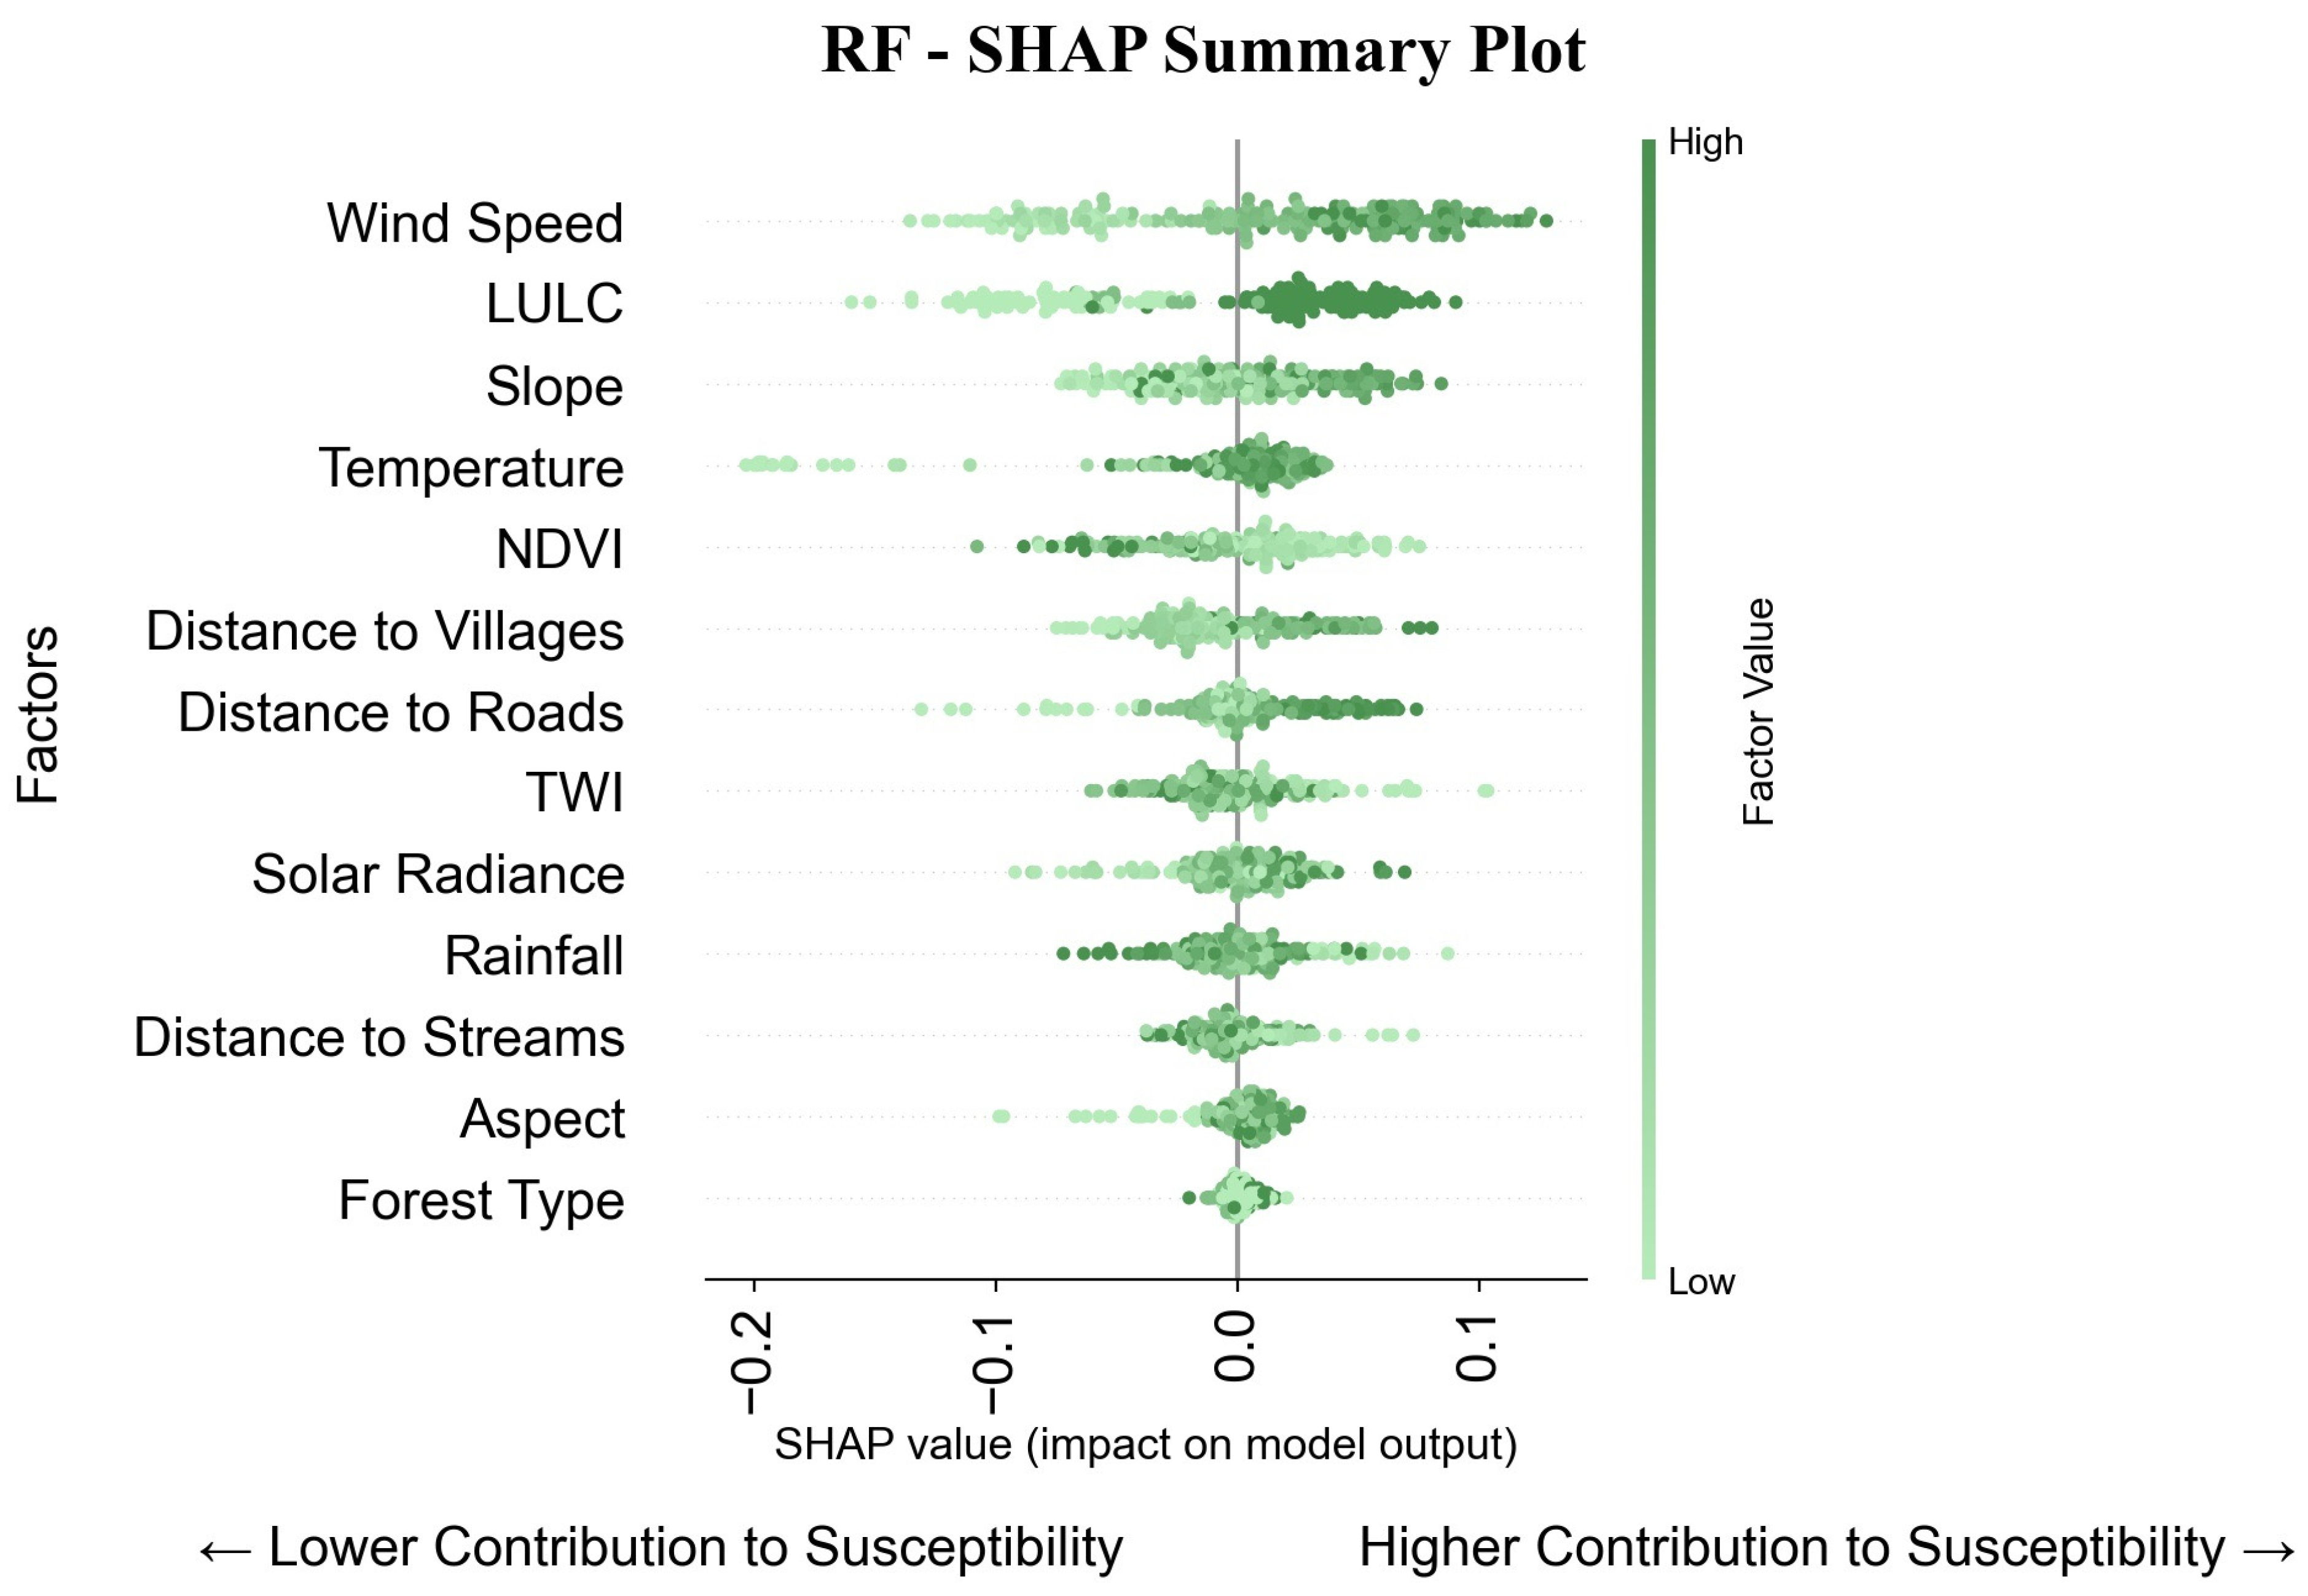
Figure 12 presents a detailed SHAP summary plot that illustrates individual wildfire samples and their corresponding SHAP values based on the input conditioning factors. After generating the RF classifier, the conditioning factors are ranked according to their contributions. The x-axis represents the SHAP values, and the y-axis lists the conditioning factors. Each dot on the plot represents a wildfire sample, with color intensity indicating the factor value—lighter green tones represent lower values, while darker green tones indicate higher values. In the RF classifier model, LULC, wind speed, and distance to villages are identified as the top three most significant factors.
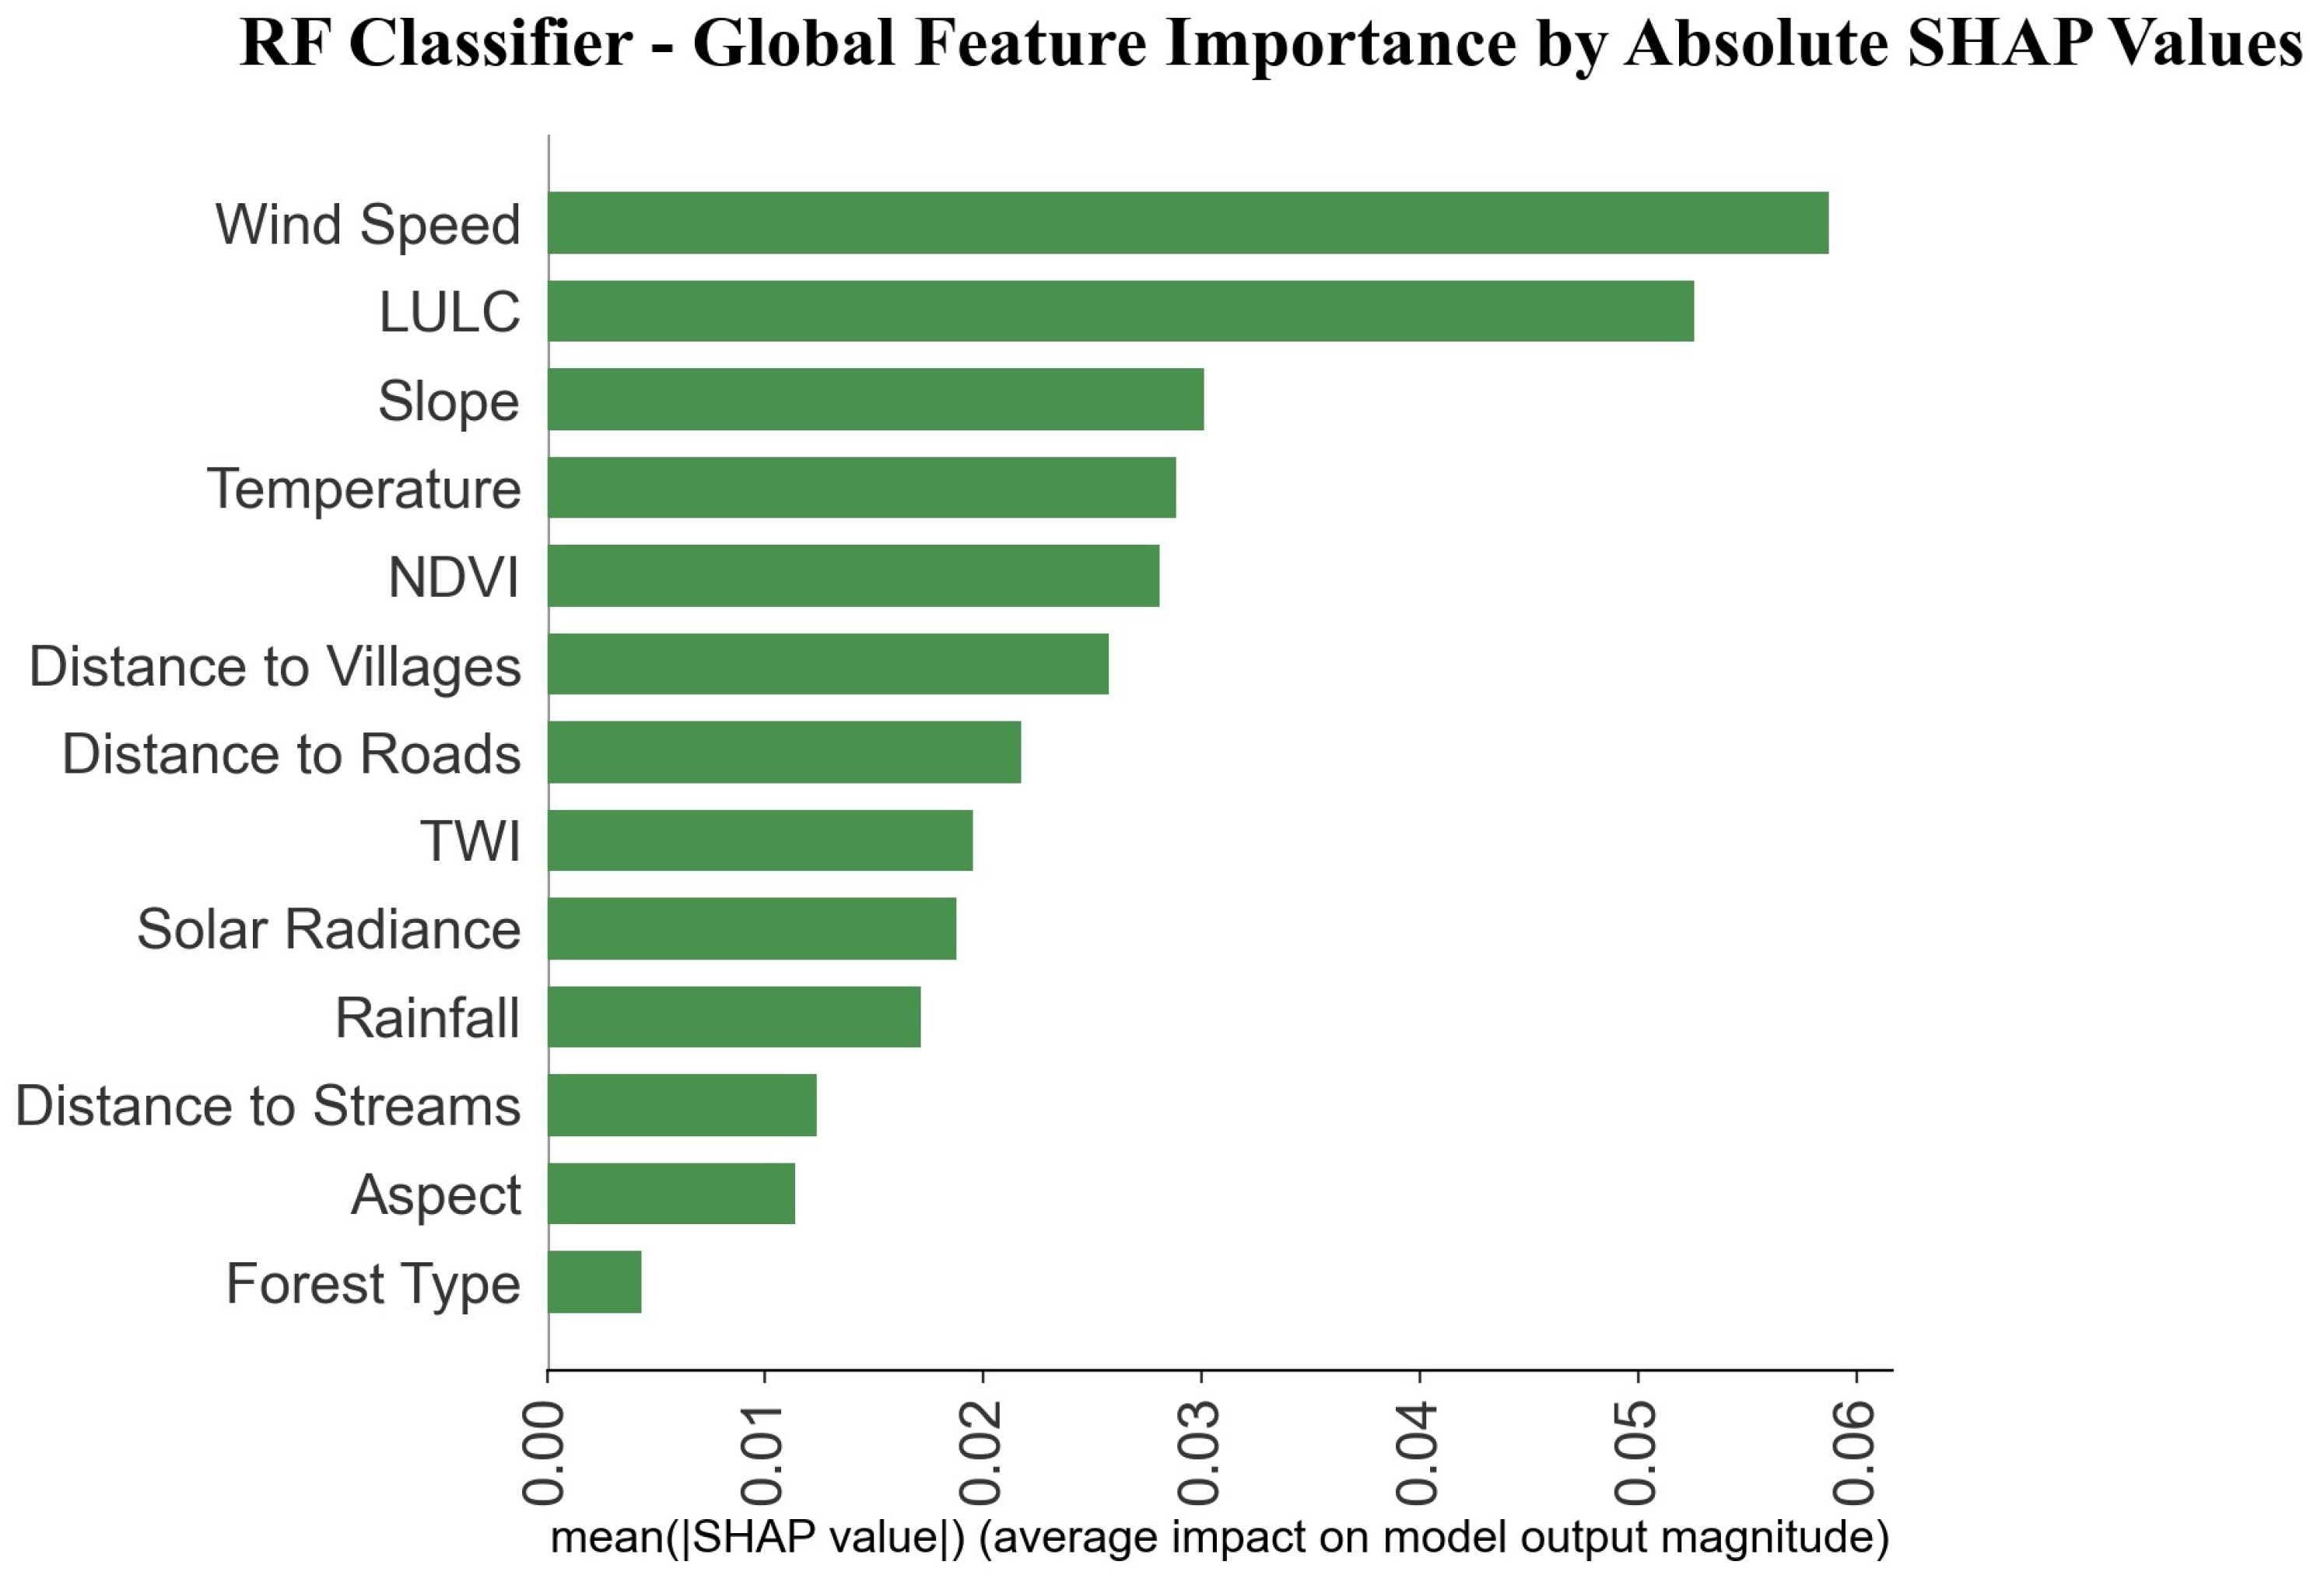
Figure 13 provides absolute SHAP values for all input conditioning factors, crucial for understanding their significant impact on predicting wildfire occurrence in the study area. These values illustrate each factor’s magnitude of influence, where higher absolute mean values indicate greater contributions to the prediction process. This plot complements the sample-wise SHAP values depicted in Figure 12 by offering a global view of feature importance based on SHAP analysis.
In Figure 12, the top five influential factors show elevated SHAP values, indicating that higher values of these factors correlate with increased wildfire likelihood. Conversely, as seen in the fifth row of Figure 12, wildfire samples with higher NDVI values exhibit negative SHAP values, suggesting that higher NDVI decreases the probability of wildfireoccurrence. Additionally, the RF classifier identifies forest type, aspect, and distance to streams as the least influential factors for wildfire occurrence in the region.
While the SHAP summary plots provide insights into factor contributions, they do not address how varying feature values impact predictive accuracy. To overcome this limitation, SHAP dependence plots, which assess individual feature effects on predictions, become indispensable tools.

4.5. SHAP Dependence Plots

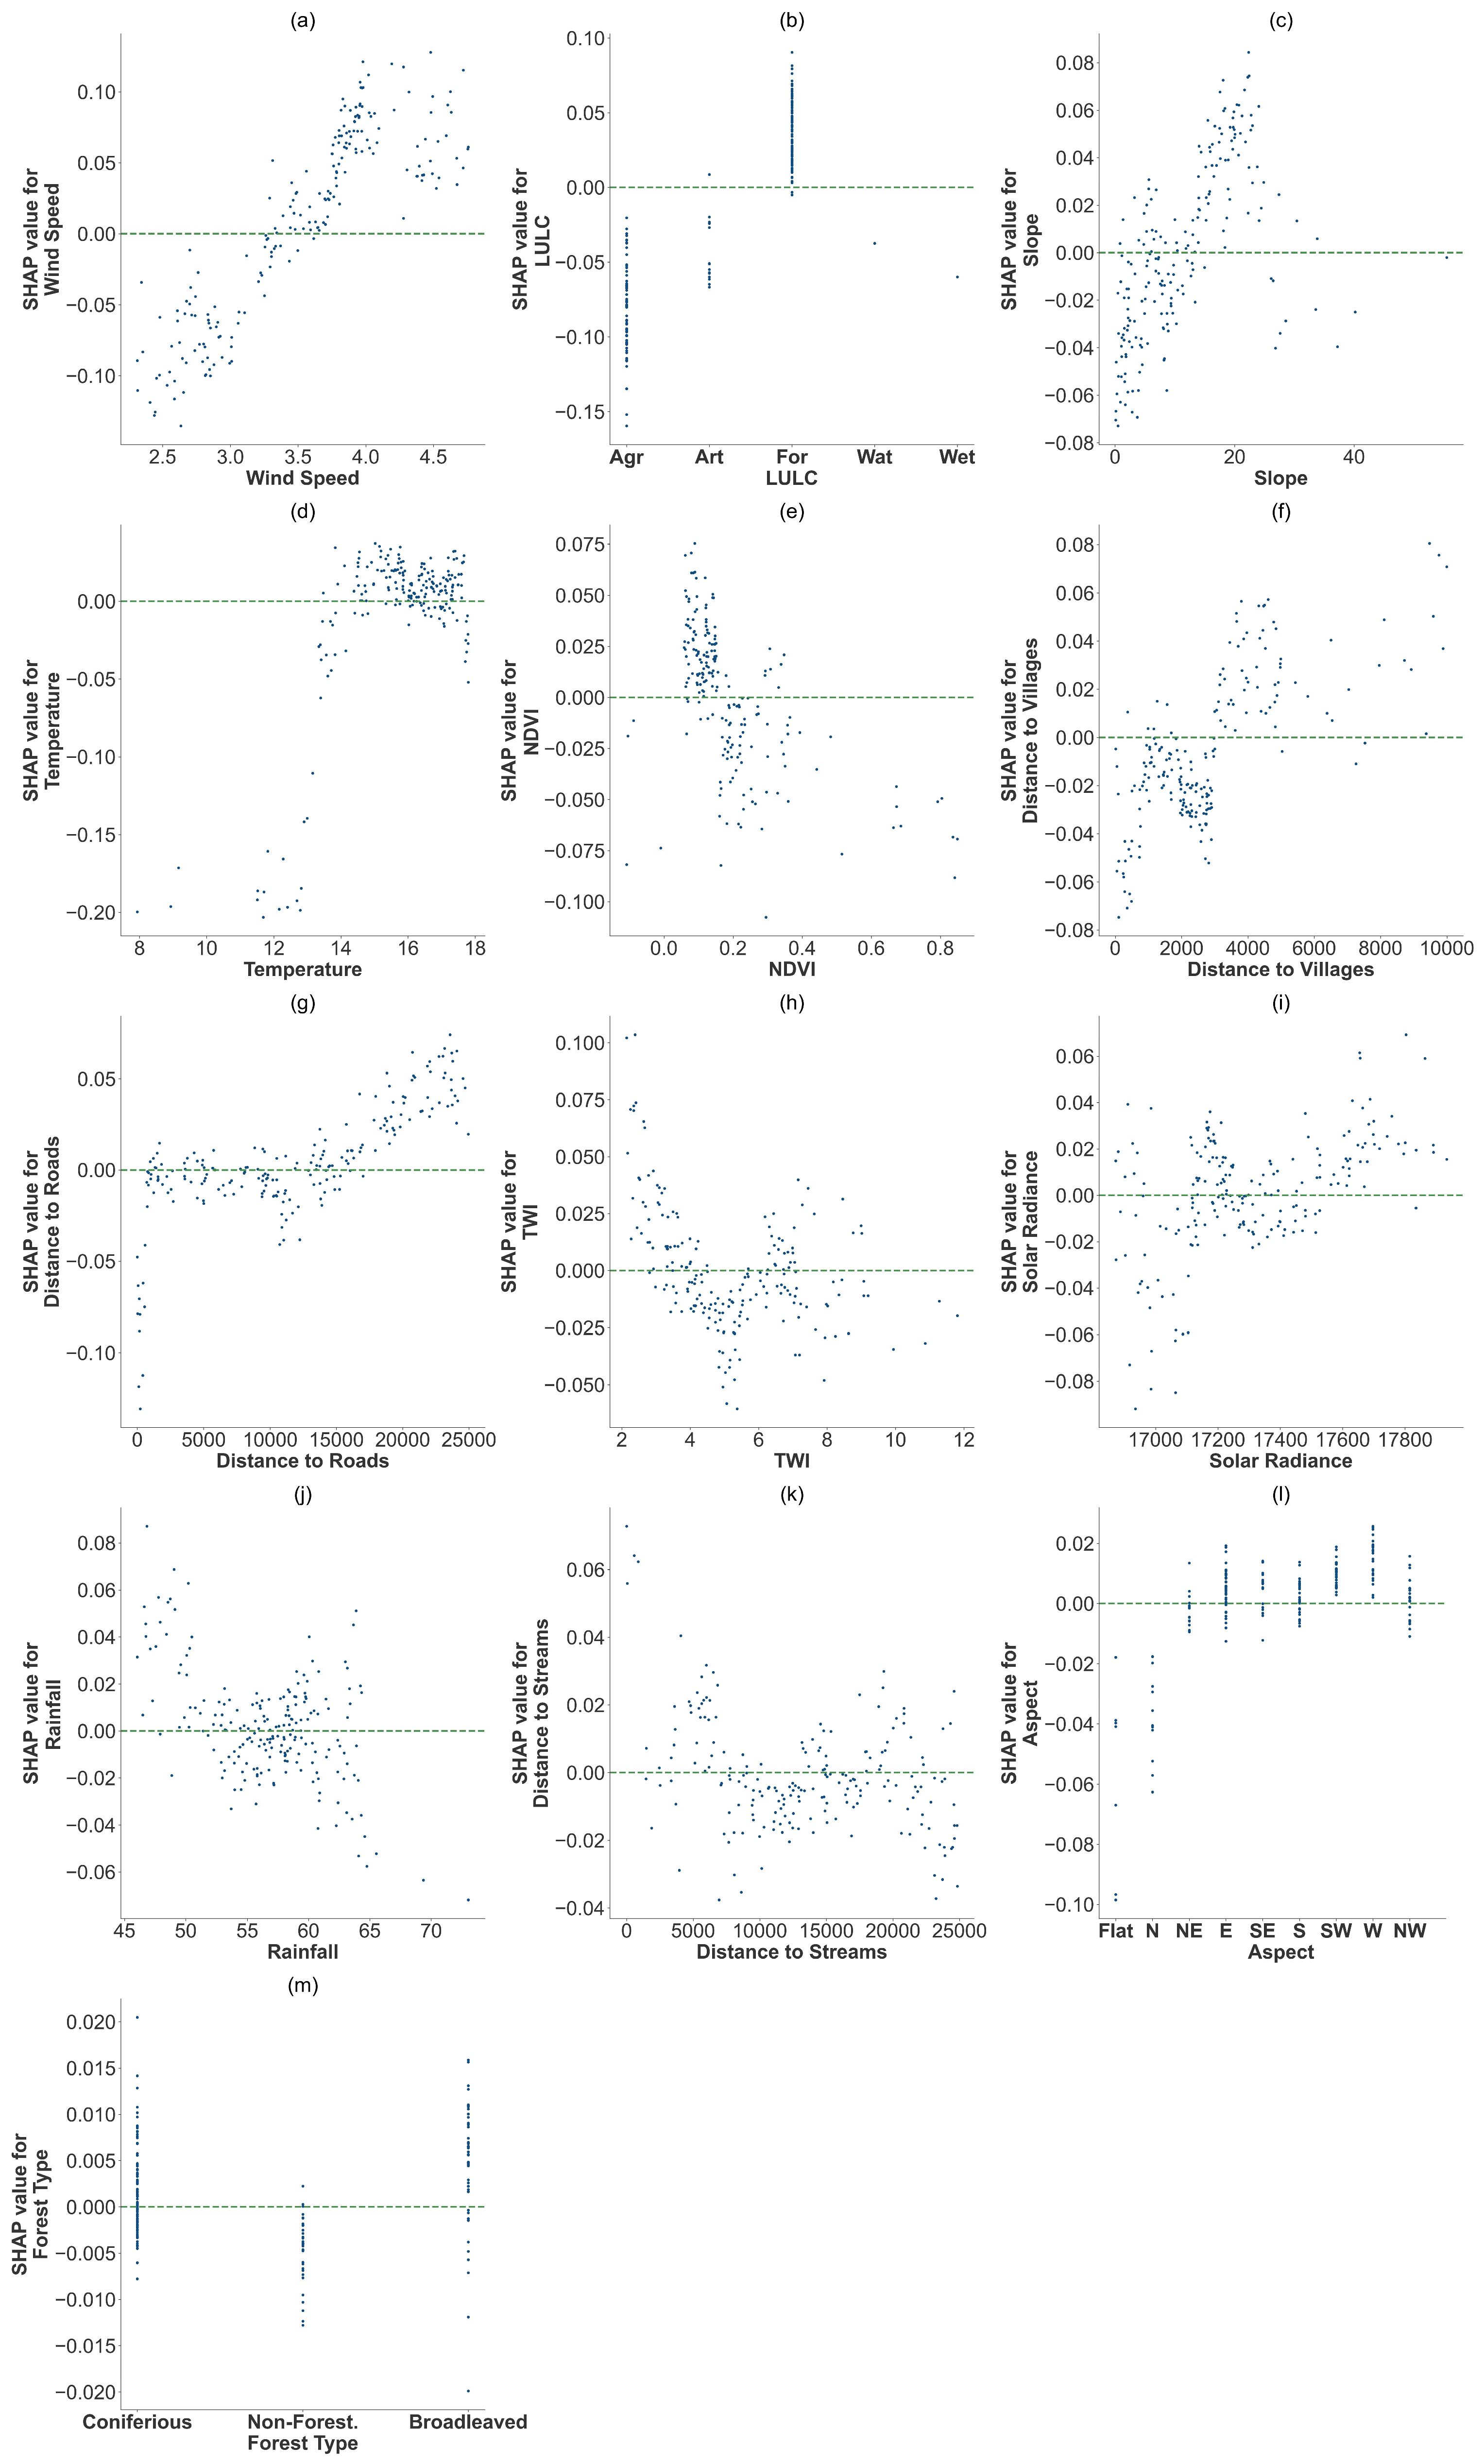
This study included generating SHAP dependence plots (Figure 14) for all input factors to elucidate their association with SHAP values. These plots aimed to uncover potential threshold effects by examining how SHAP values vary across different factor values.
In Figure 14a, it is observed that samples with wind speed values exceeding 3.5 m/s exhibit positive SHAP values, indicating that higher wind speeds increase wildfire susceptibility in the study area. This finding is consistent with results from previous studies [27,76], which highlight the significant impact of higher wind speeds on fire behavior and propagation. In Izmir Province, as expected, higher wind speeds accelerate the spread of flames and drying out vegetation, facilitating more rapid fire ignition and propagation [37].
Figure 14b illustrates that different LULC classes exhibit varying levels of wildfire susceptibility. Predictably, forested regions are more vulnerable to wildfires due to the abundance of vegetation that serves as fuel. Conversely, agricultural lands and artificial surfaces demonstrate lower wildfire susceptibility, likely due to managed landscapes and reduced fuel availability.
Figure 14c indicates that slope values greater than 8 degrees yield positive SHAP values, suggesting that steeper slopes are more susceptible to wildfires. Steeper slopes are generally expected to promote fire spread due to fuel continuity and the additional wind effect that can exacerbate fire susceptibility [77]. This expectation is confirmed for the Izmir province as well. Even though fire susceptibility generally increases with steeper slopes; however, beyond a certain threshold (more than 20%), the samples exhibit negative SHAP values. This suggests that the slope factor’s contribution to fire susceptibility is complex and warrants further investigation, as other studies have also observed a unimodal distribution for fire susceptibility in relation to slope [21,54].
Notably, Figure 14d shows that wildfire samples with average annual temperature values above 14 degrees Celsius positively contribute to wildfire occurrence. This finding is also in line with comparable studies [39,40,78]. Elevated temperatures enhance plant evaporation, leading to decreased moisture content in combustible materials, thereby increasing the likelihood of fire occurrence [3].
SHAP values linked to the NDVI factor (Figure 14e) reveal that samples with NDVI values below 0.20 significantly contribute to wildfire susceptibility, suggesting areas with very sparse vegetation are more prone to fires, a finding supported by existing literature [6].
Regarding distance to villages (Figure 14f), locations farther than 4000 m from villages generally exhibit positive SHAP values, indicating increased fire susceptibility with greater distance from villages. Similar findings have been reported in previous studies [21,59]. This trend can be attributed to the fact that remote areas are often less monitored and maintained, resulting in a higher accumulation of flammable materials. Additionally, the response time for firefighting efforts is typically longer in these distant locations, allowing fires to spread more extensively before being controlled. Moreover, human activities that could potentially prevent or quickly address fire outbreaks are less frequent in these remote areas.
Conversely, Figure 14g shows that locations very near roads (within 1000 m) have negative SHAP values, implying reduced fire susceptibility near roads. This observation is substantiated by a few recent studies [37]. The rationale behind this phenomenon may stem from roads serving as effective firebreaks that disrupt the continuity of flammable materials and impede the spread of fires. Moreover, proximity to roads facilitates easier access for firefighting operations, leading to faster response times and more efficient fire suppression efforts. Furthermore, heightened human activity near roads enhances the likelihood of early fire detection and prompt intervention.
Figure 14h illustrates the impact of TWI on wildfire susceptibility. According to the SHAP values, TWI values from two to four positively contribute to wildfire susceptibility, although this contribution decreases over the range. Between TWI values of four and six, there is a negative contribution, likely due to increased moisture levels reducing fire risk. For TWI values above six, the contributions are mixed, with both positive and negative impacts, possibly reflecting varying micro-environments and moisture conditions that influence fire behavior differently.
Solar radiance values above 17,400 kJ/m2 × day (Figure 14i) predominantly contribute positively to wildfire susceptibility. High solar radiance levels increase surface temperatures and accelerate evaporation, reducing the moisture content in vegetation. Consequently, dry vegetation becomes more susceptible to ignition and facilitates the rapid spread of fires, especially when coupled with other contributing factors like wind and terrain characteristics prevalent in the area [6].
Figure 14j suggests that rainfall does not exhibit a distinct threshold effect, with SHAP values scattered uniformly. While a few samples with lower rainfall values show higher positive SHAP values, the majority of samples cluster around zero SHAP values. Reduced rainfall typically results in drier conditions, which can heighten susceptibility to wildfires, consistent with findings from prior research [5,38]. Nonetheless, the lack of a pronounced threshold effect in our SHAP analysis suggests that even minor fluctuations in rainfall levels may exert incremental rather than categorical influences on fire susceptibility. Thus, in regions such as the Izmir Province, characterized by relatively consistent annual rainfall patterns, the association between rainfall and wildfire susceptibility likely manifests as a gradual continuum rather than discrete thresholds.
In relation to distance to streams (Figure 14k), no clear threshold effect is evident, but as the samples become closer to the streams, they show generally positive SHAP values. This finding in Izmir Province challenges the common assumption that areas near rivers are less susceptible to fires, typically due to higher humidity, soil moisture, and vegetation moisture content [6,55]. Another study conducted in the same area confirms that certain samples located near streams predominantly yield negative or zero SHAP values [37]. Several factors may contribute to this phenomenon. Firstly, these areas are more accessible to human activity, increasing the likelihood of accidental fires. Secondly, while vegetation near streams may contain moisture, it can also include species that are flammable or susceptible to ignition during dry conditions. Consequently, despite the protective aspects of streamside vegetation, local factors such as human behavior and specific vegetation types collectively influence the heightened fire susceptibility observed in the Izmir province.
The aspect factor (Figure 14l), while less influential overall, generally contributes positively to wildfire susceptibility in most directions, except for flat, north, and northeastern aspects. In Mediterranean geography, south-facing slopes typically receive more direct sunlight and may therefore experience drier conditions, enhancing vegetation flammability. Conversely, flat and northern aspects receive less sunlight and retain more moisture, reducing fire susceptibility [24].
Lastly, Figure 14m indicates that forest type does not distinctly affect SHAP values between coniferous and broadleaved forests, suggesting no clear preference for fire occurrence between these forest types. However, a greater number of samples in broadleaved forests demonstrate positive SHAP values. This observation may be influenced by several factors specific to the region. Izmir Province’s forest ecosystems likely exhibit similar characteristics in terms of fuel load, vegetation structure, and fire behavior potential across both coniferous and broadleaved forests. To better understand the impact of forest type, a more detailed forest type dataset should be utilized.

4.6. Generated Susceptibility Map

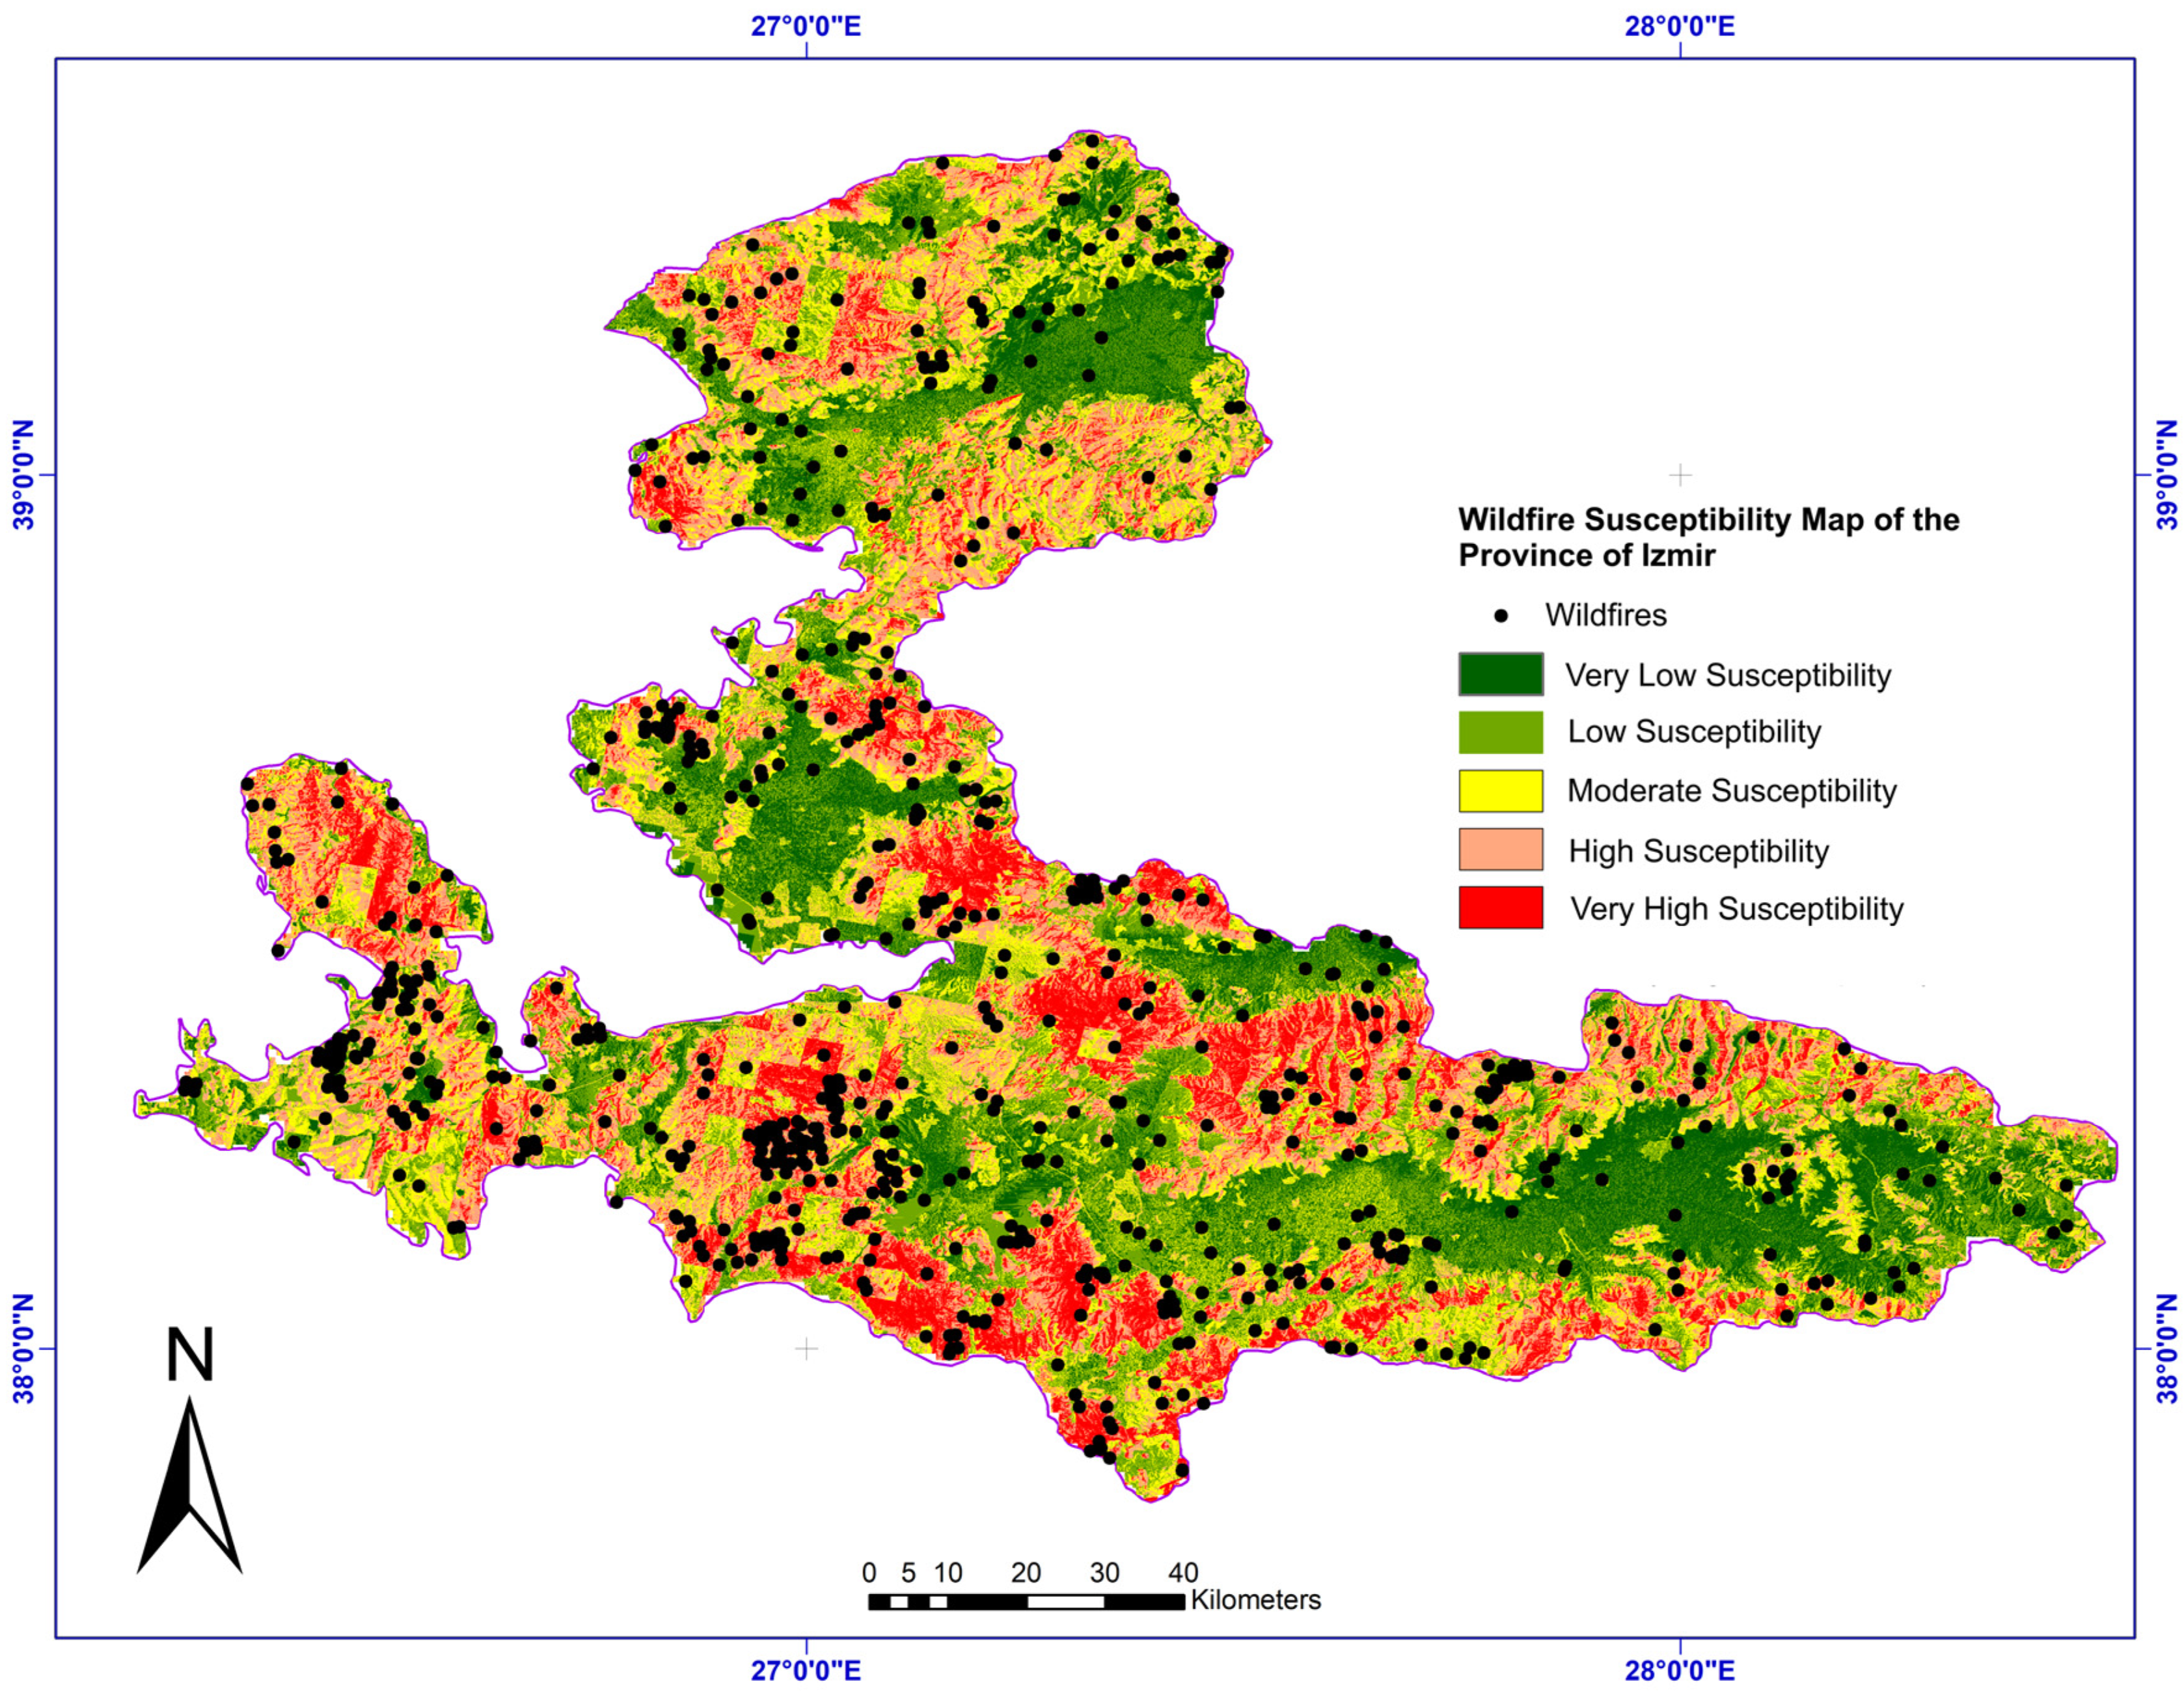
The RF classifier, recognized for its superior performance, was employed alongside thirteen wildfire conditioning factors to generate a susceptibility map for Izmir. Illustrated in Figure 15, this map highlights the potential risk of wildfire incidents across different areas based on relevant conditioning variables. Among the various methods available for classifying such maps, the natural break classification method is notably prevalent. This method is particularly effective for interpreting results near class boundaries as it determines class intervals based on input data, ensuring optimal grouping [79,80]. Consequently, the natural break classification method was applied to categorize the susceptibility map derived from the RF classifier. The map’s pixels were classified into five distinct categories: very high, high, moderate, low, and very low, providing a standardized system for comparing the outcomes.
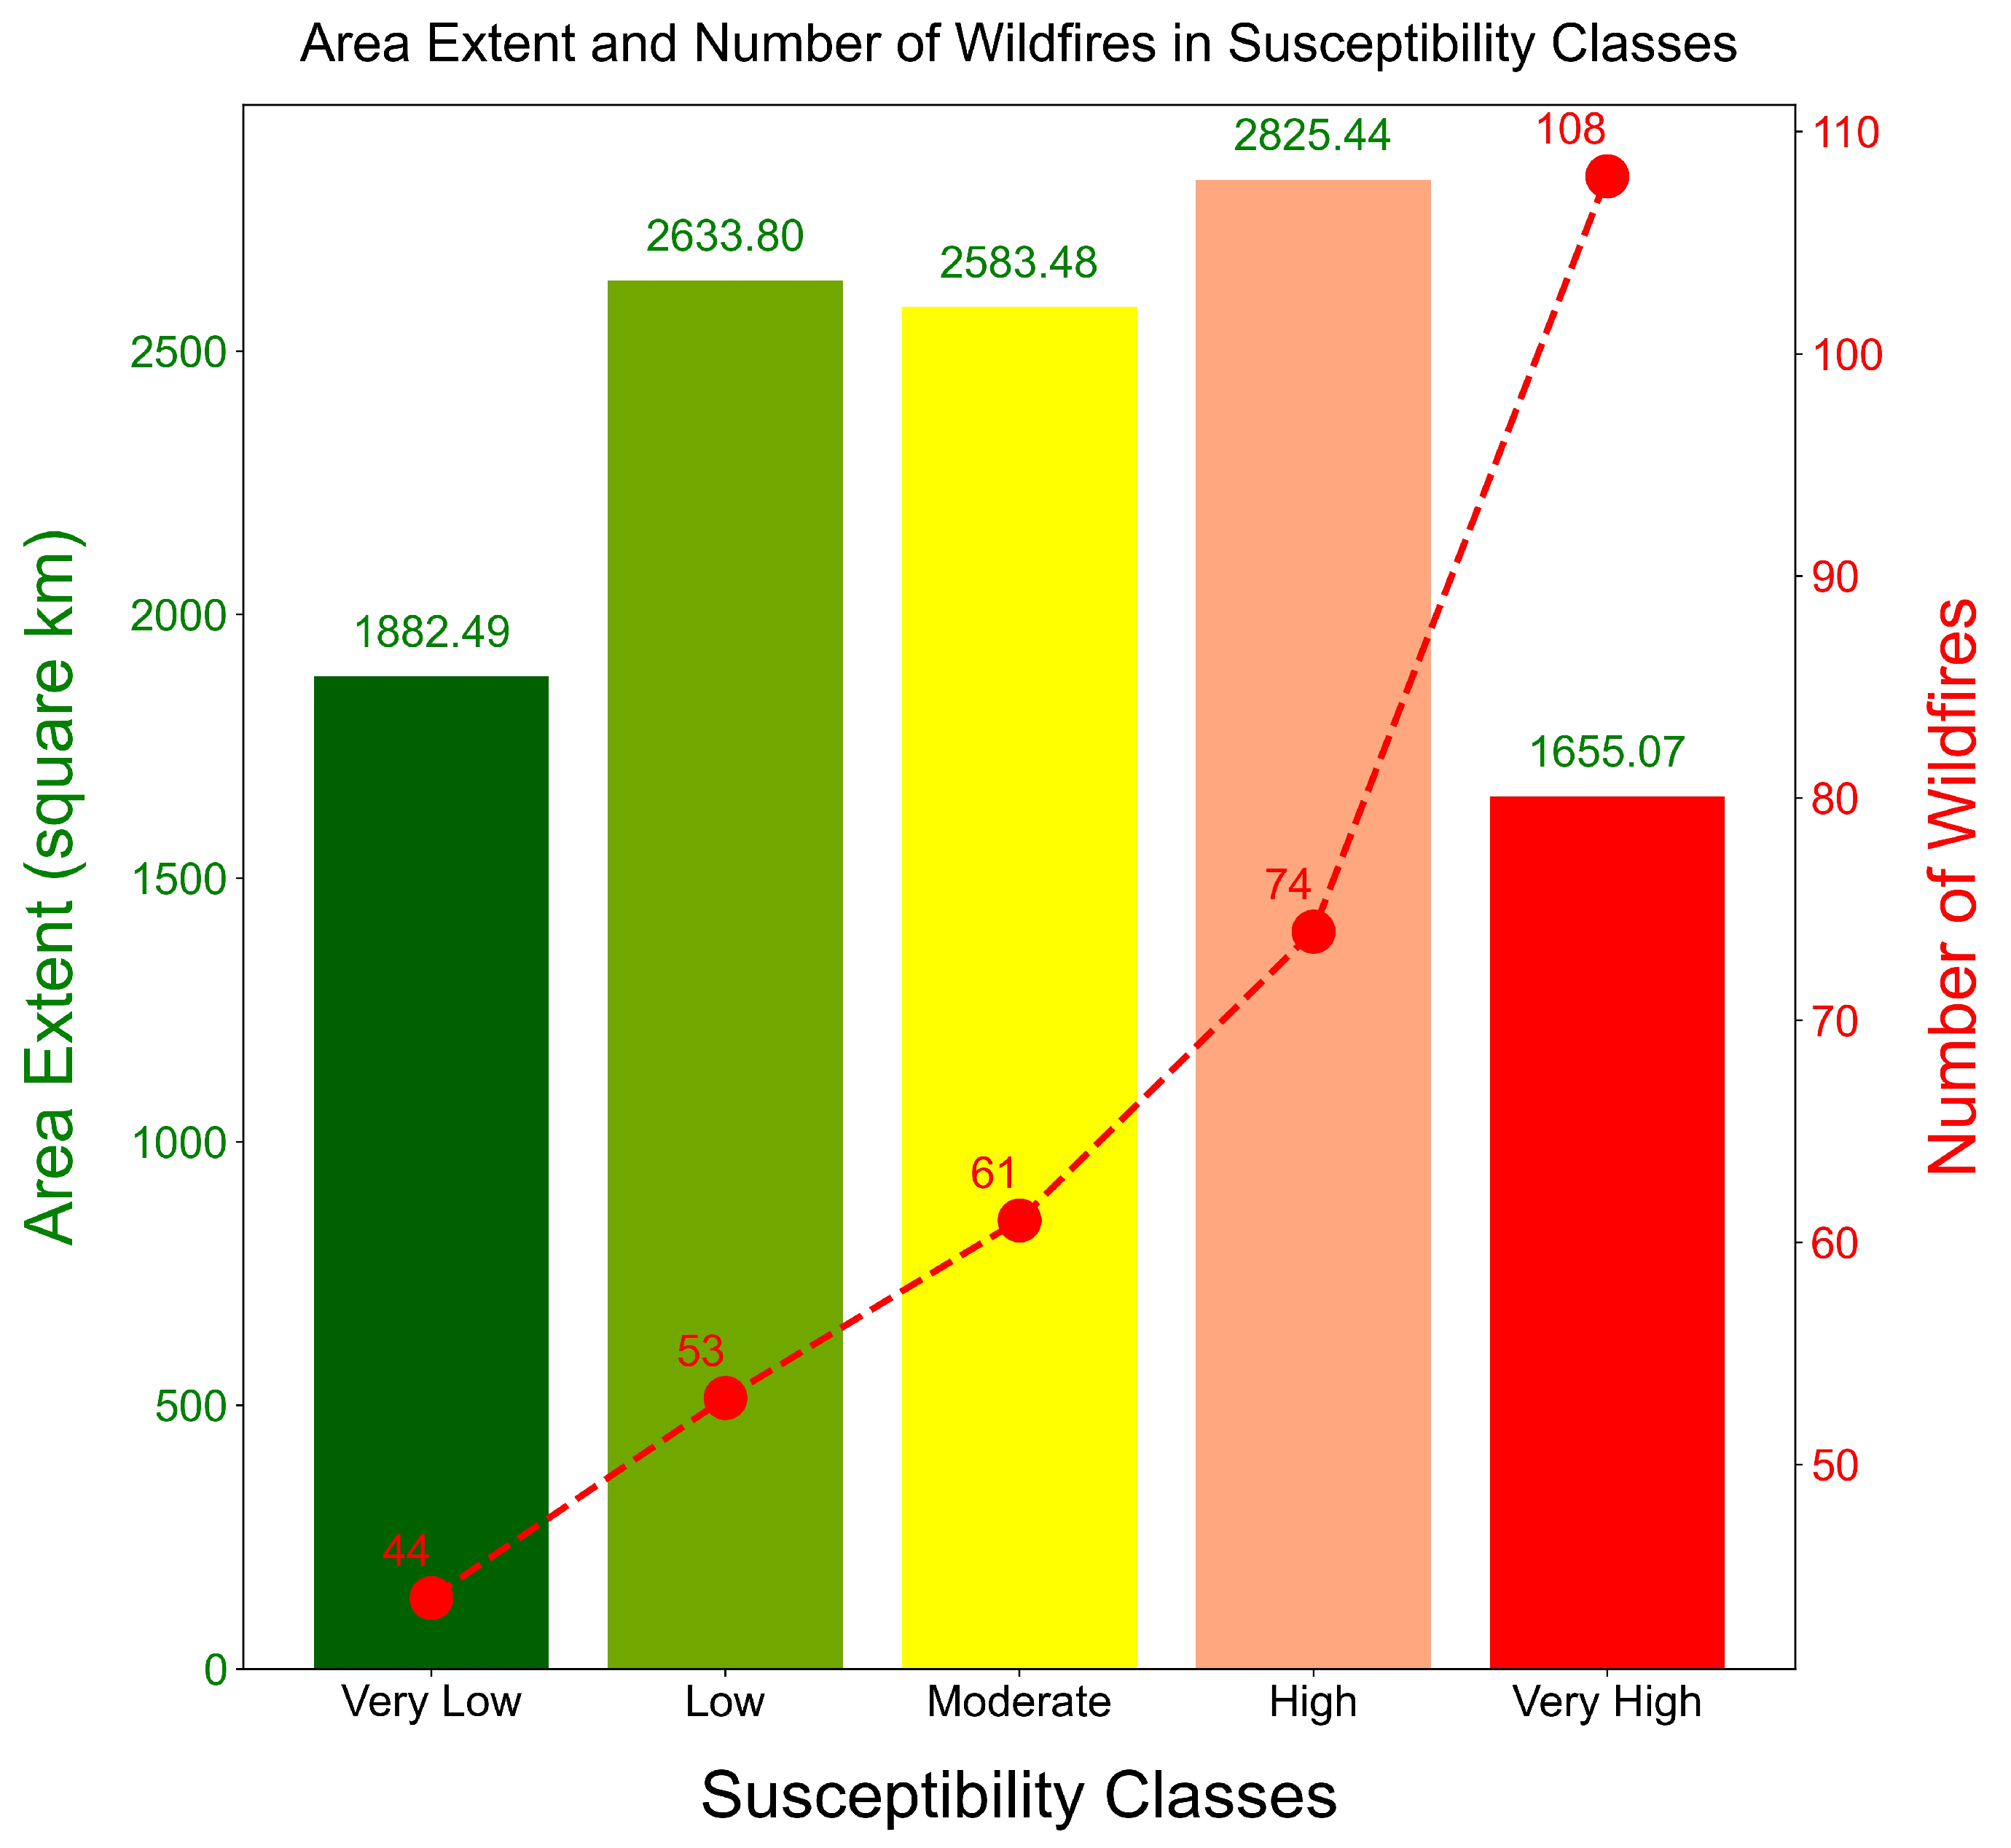
Figure 16 presents the spatial distribution of susceptibility classes generated by RF classifier and the corresponding wildfire samples within these classes. The data reveal that the province of Izmir has substantial areas categorized as moderately to very highly susceptible to wildfires. The RF model determined that 14.3% of the study area falls under very high wildfire susceptibility, 24.4% under high, 22.3% under moderate, 22.7% under low, and 14.3% under very low susceptibility. Notably, a significant portion of wildfire samples (68.84%) align with the very high susceptibility areas. The area extent in square kilometers for each susceptibility class is depicted in green on each bar in Figure 16. The number of wildfire samples corresponding to these susceptibility classes is indicated by the red dashed line. This highlights the province’s pronounced susceptibility to wildfires, underscoring the need for heightened awareness and precautionary measures. The concentration of highly susceptible zones in flat and coastal regions near settlements and agricultural lands underscores the serious threat wildfires pose to human health and safety.

4.7. Contributions to the Community, Lessons Learned, and Limitations

The wildfire susceptibility map generated in this study provides valuable insights into high-risk areas within the Province of Izmir, offering information on the likelihood of wildfire occurrence in specific locations. This map is crucial for various stakeholders such as forest managers, land management agencies, and emergency responders, enabling them to make informed decisions regarding fire risk mitigation strategies.
The adoption of the SHAP method in this study proves instrumental in understanding the factors driving the model’s predictions of wildfire susceptibility. By identifying critical factors contributing to high-risk areas, researchers and practitioners can develop targeted strategies to mitigate fire hazards effectively. The explainability provided by SHAP facilitates the development of more robust fire management approaches.
Technically, feature importance signifies the ranking of variables that significantly influence prediction accuracy. Understanding how these variables relate to the probability of fire initiation aids in leveraging them for future predictions and research. Ultimately, this knowledge helps in devising proactive fire control strategies tailored to specific environmental conditions and risk factors identified through the model [27]. Integrating these findings into a comprehensive fire management framework enhances preparedness, response efficiency, and community resilience. This includes leveraging technological advancements for real-time monitoring, fostering community engagement for fire awareness and prevention, and fostering interdisciplinary collaboration among researchers, policymakers, and local stakeholders to address the multifaceted challenges posed by wildfires effectively.
The results of this study offer important insights into the factors affecting wildfire susceptibility in Izmir Province:
  • Firstly, the identification of critical factors through SHAP analysis and dependence plots elucidates their complex interactions in shaping fire ignition and spread dynamics.
  • Secondly, these insights enable stakeholders to prioritize mitigation efforts. For instance, areas distant from villages require heightened attention due to higher fuel accumulation and longer response times for firefighting efforts. Conversely, the roads serve as a natural firebreak and facilitate quicker responses and interventions.
  • Thirdly, adaptation strategies must consider regional characteristics. Factors like wind speed and solar radiance significantly amplify fire risk, necessitating tailored interventions such as firebreaks on steep slopes and vegetation management strategies near water bodies to mitigate moisture fluctuations and vegetation flammability.
  • Furthermore, the variability in rainfall patterns highlights the necessity for continuous environmental monitoring to discern nuanced shifts in fire susceptibility. This adaptive approach will ensure timely adjustments in preventive measures to address evolving climatic conditions and their influence on fire behavior.
Of course, there are some limitations: (1) Wildfire susceptibility is influenced by numerous factors, which can vary significantly by region. Although this study incorporated 13 wildfire conditioning factors, it is worth questioning whether these are sufficient for predicting wildfire susceptibility in all areas. (2) The data used in this study came from diverse sources and varied in spatial scales. To standardize these scales for computational purposes, resampling was utilized. However, this process might inadvertently exclude critical information relevant to wildfire factors, potentially impacting the model’s predictive performance. (3) Previous research suggests that the selection of sampling areas and the ratio of non-wildfire to wildfire samples are crucial for accurate susceptibility assessments. In this study, non-wildfire and wildfire samples were randomly selected at a 1:1 ratio, which could affect the results. There is a risk that random sampling might misclassify areas prone to wildfires as non-wildfire samples, leading to an inaccurate assessment of their susceptibility. Furthermore, the 1:1 sampling ratio may not accurately represent real-world conditions, potentially influencing the model’s accuracy and sensitivity. (4) The model developed in this study was applied to the province of Izmir, showing promise for broader application across regions with varying characteristics. However, despite its strong performance in Izmir, the model may need adjustments to ensure its effectiveness in different environments. (5) The results of this study are based on a limited sample size, which may affect the generalizability of the findings. The model’s performance might vary if applied to a larger area or with a more extensive dataset. Additionally, the small differences in model performance suggest that various ML approaches could yield similarly effective results.
Considering these points, future research will aim to develop methods that standardize wildfire factor scales while minimizing information loss. Additionally, it will focus on identifying optimal sampling areas and proportions for non-wildfire samples to improve the model’s predictive accuracy.

5. Conclusions

This study has presented a novel approach to mapping wildfire susceptibility in Izmir Province, Türkiye, by employing explainable ML techniques. The primary aim was to understand the contributions of various topographic, climatic, anthropogenic, and vegetation-related factors to wildfire susceptibility and to interpret the underlying reasoning behind the ML models’ decisions. By leveraging SHAP plots, we provided insights into how these factors influence wildfire predictions, marking a pioneering effort in forestry literature, especially within the Aegean–Mediterranean region.
Key objectives achieved in this research include establishing a spatial ML framework using RF, XGBoost, and LightGBM models, examining the relationship between the best-performing model and conditioning factors through SHAP outputs, and exploring spatial variations in model outcomes to predict wildfire susceptibility. Our methodology incorporated various conditioning factors, validated active fire data from MODIS products, and produced a detailed wildfire susceptibility map for Izmir Province.
The results highlight that 14.3% of the study area falls under very high wildfire susceptibility, with significant portions of wildfire samples aligning with high-risk zones. This underscores the necessity of effective emergency action plans and fire management strategies tailored to the region’s unique environmental and climatic conditions.
Additionally, this study has contributed valuable lessons to the community, emphasizing the importance of understanding factor interactions, prioritizing mitigation efforts, and adapting strategies to regional characteristics. The adoption of SHAP analysis facilitated a deeper understanding of the factors driving wildfire susceptibility, aiding in the development of targeted interventions and enhancing community resilience.
Despite its contributions, the study acknowledges limitations, including the potential insufficiency of the selected conditioning factors, the impact of resampling on data accuracy, the representativeness of the sampling ratio, and limited number of training samples. Future research will focus on refining these aspects to improve the model’s predictive performance and applicability across different regions.

Author Contributions

Conceptualization, M.C.I. and O.A.; methodology, M.C.I. and O.A.; software, M.C.I. and O.A.; validation, M.C.I.; formal analysis, M.C.I.; data curation, O.A.; writing—original draft preparation, M.C.I. and O.A.; writing—review and editing, M.C.I. and O.A.; visualization, M.C.I. and O.A. All authors have read and agreed to the published version of the manuscript.

Funding

This research received no external funding.

Data Availability Statement

The original contributions presented in the study are included in the article, further inquiries can be directed to the corresponding author.

Acknowledgments

We would like to acknowledge the journal editor and anonymous reviewers for their constructive comments. Special thanks to NASA for providing the MODIS products.

Conflicts of Interest

The authors declare no conflicts of interest.

References

  1. Chas-Amil, M.L.; Prestemon, J.P.; McClean, C.J.; Touza, J. Human-Ignited Wildfire Patterns and Responses to Policy Shifts. Appl. Geogr. 2015, 56, 164–176. [Google Scholar] [CrossRef]
  2. Tuffour-Mills, D.; Antwi-Agyei, P.; Addo-Fordjour, P. Trends and Drivers of Land Cover Changes in a Tropical Urban Forest in Ghana. Trees For. People 2020, 2, 100040. [Google Scholar] [CrossRef]
  3. Akıncı, H.A.; Akıncı, H. Machine Learning Based Forest Fire Susceptibility Assessment of Manavgat District (Antalya), Turkey. Earth Sci. Inform. 2023, 16, 397–414. [Google Scholar] [CrossRef]
  4. Vieira, D.C.S.; Borrelli, P.; Jahanianfard, D.; Benali, A.; Scarpa, S.; Panagos, P. Wildfires in Europe: Burned Soils Require Attention. Environ. Res. 2023, 217, 114936. [Google Scholar] [CrossRef] [PubMed]
  5. Abdollahi, A.; Pradhan, B. Explainable Artificial Intelligence (XAI) for Interpreting the Contributing Factors Feed into the Wildfire Susceptibility Prediction Model. Sci. Total Environ. 2023, 879, 163004. [Google Scholar] [CrossRef]
  6. Iban, M.C.; Sekertekin, A. Machine Learning Based Wildfire Susceptibility Mapping Using Remotely Sensed Fire Data and GIS: A Case Study of Adana and Mersin Provinces, Turkey. Ecol. Inform. 2022, 69, 101647. [Google Scholar] [CrossRef]
  7. Barmpoutis, P.; Papaioannou, P.; Dimitropoulos, K.; Grammalidis, N. A Review on Early Forest Fire Detection Systems Using Optical Remote Sensing. Sensors 2020, 20, 6442. [Google Scholar] [CrossRef]
  8. Govil, K.; Welch, M.L.; Ball, J.T.; Pennypacker, C.R. Preliminary Results from a Wildfire Detection System Using Deep Learning on Remote Camera Images. Remote Sens. 2020, 12, 166. [Google Scholar] [CrossRef]
  9. Prakash, M.; Neelakandan, S.; Tamilselvi, M.; Velmurugan, S.; Priya, S.B.; Martinson, E.O. Deep Learning-Based Wildfire Image Detection and Classification Systems for Controlling Biomass. Int. J. Intell. Syst. 2023, 2023, 7939516. [Google Scholar] [CrossRef]
  10. Koutsias, N.; Martínez-Fernández, J.; Allgöwer, B. Do Factors Causing Wildfires Vary in Space? Evidence from Geographically Weighted Regression. GIScience Remote Sens. 2010, 47, 221–240. [Google Scholar] [CrossRef]
  11. Aldersley, A.; Murray, S.J.; Cornell, S.E. Global and Regional Analysis of Climate and Human Drivers of Wildfire. Sci. Total Environ. 2011, 409, 3472–3481. [Google Scholar] [CrossRef] [PubMed]
  12. Li, W.; Xu, Q.; Yi, J.; Liu, J. Predictive Model of Spatial Scale of Forest Fire Driving Factors: A Case Study of Yunnan Province, China. Sci. Rep. 2022, 12, 19029. [Google Scholar] [CrossRef] [PubMed]
  13. Wang, W.; Zhao, F.; Wang, Y.; Huang, X.; Ye, J. Seasonal Differences in the Spatial Patterns of Wildfire Drivers and Susceptibility in the Southwest Mountains of China. Sci. Total Environ. 2023, 869, 161782. [Google Scholar] [CrossRef] [PubMed]
  14. Piralilou, S.T.; Einali, G.; Ghorbanzadeh, O.; Nachappa, T.G.; Gholamnia, K.; Blaschke, T.; Ghamisi, P. A Google Earth Engine Approach for Wildfire Susceptibility Prediction Fusion with Remote Sensing Data of Different Spatial Resolutions. Remote Sens. 2022, 14, 672. [Google Scholar] [CrossRef]
  15. Singha, C.; Swain, K.C.; Moghimi, A.; Foroughnia, F.; Swain, S.K. Integrating Geospatial, Remote Sensing, and Machine Learning for Climate-Induced Forest Fire Susceptibility Mapping in Similipal Tiger Reserve, India. For. Ecol. Manag. 2024, 555, 121729. [Google Scholar] [CrossRef]
  16. Or, D.; Furtak-Cole, E.; Berli, M.; Shillito, R.; Ebrahimian, H.; Vahdat-Aboueshagh, H.; McKenna, S.A. Review of Wildfire Modeling Considering Effects on Land Surfaces. Earth-Sci. Rev. 2023, 245, 104569. [Google Scholar] [CrossRef]
  17. Sinha, A.; Nikhil, S.; Ajin, R.S.; Danumah, J.H.; Saha, S.; Costache, R.; Rajaneesh, A.; Sajinkumar, K.S.; Amrutha, K.; Johny, A.; et al. Wildfire Risk Zone Mapping in Contrasting Climatic Conditions: An Approach Employing AHP and F-AHP Models. Fire 2023, 6, 44. [Google Scholar] [CrossRef]
  18. Rivière, M.; Lenglet, J.; Noirault, A.; Pimont, F.; Dupuy, J.-L. Mapping Territorial Vulnerability to Wildfires: A Participative Multi-Criteria Analysis. For. Ecol. Manag. 2023, 539, 121014. [Google Scholar] [CrossRef]
  19. Alkhatib, R.; Sahwan, W.; Alkhatieb, A.; Schütt, B. A Brief Review of Machine Learning Algorithms in Forest Fires Science. Appl. Sci. 2023, 13, 8275. [Google Scholar] [CrossRef]
  20. Kanwal, R.; Rafaqat, W.; Iqbal, M.; Weiguo, S. Data-Driven Approaches for Wildfire Mapping and Prediction Assessment Using a Convolutional Neural Network (CNN). Remote Sens. 2023, 15, 5099. [Google Scholar] [CrossRef]
  21. Babu, K.N.; Gour, R.; Ayushi, K.; Ayyappan, N.; Parthasarathy, N. Environmental Drivers and Spatial Prediction of Forest Fires in the Western Ghats Biodiversity Hotspot, India: An Ensemble Machine Learning Approach. For. Ecol. Manag. 2023, 540, 121057. [Google Scholar] [CrossRef]
  22. Albahri, A.S.; Khaleel, Y.L.; Habeeb, M.A.; Ismael, R.D.; Hameed, Q.A.; Deveci, M.; Homod, R.Z.; Albahri, O.S.; Alamoodi, A.H.; Alzubaidi, L. A Systematic Review of Trustworthy Artificial Intelligence Applications in Natural Disasters. Comput. Electr. Eng. 2024, 118, 109409. [Google Scholar] [CrossRef]
  23. Yue, W.; Ren, C.; Liang, Y.; Liang, J.; Lin, X.; Yin, A.; Wei, Z. Assessment of Wildfire Susceptibility and Wildfire Threats to Ecological Environment and Urban Development Based on GIS and Multi-Source Data: A Case Study of Guilin, China. Remote Sens. 2023, 15, 2659. [Google Scholar] [CrossRef]
  24. Alkan Akinci, H.; Akinci, H.; Zeybek, M. Comparison of Diverse Machine Learning Algorithms for Forest Fire Susceptibility Mapping in Antalya, Türkiye. Adv. Space Res. 2024, 74, 647–667. [Google Scholar] [CrossRef]
  25. Gevaert, C.M.; Carman, M.; Rosman, B.; Georgiadou, Y.; Soden, R. Fairness and Accountability of AI in Disaster Risk Management: Opportunities and Challenges. Patterns 2021, 2, 100363. [Google Scholar] [CrossRef] [PubMed]
  26. Ghaffarian, S.; Taghikhah, F.R.; Maier, H.R. Explainable Artificial Intelligence in Disaster Risk Management: Achievements and Prospective Futures. Int. J. Disaster Risk Reduct. 2023, 98, 104123. [Google Scholar] [CrossRef]
  27. Ochoa, C.; Bar-Massada, A.; Chuvieco, E. A European-Scale Analysis Reveals the Complex Roles of Anthropogenic and Climatic Factors in Driving the Initiation of Large Wildfires. Sci. Total Environ. 2024, 917, 170443. [Google Scholar] [CrossRef] [PubMed]
  28. Iban, M.C.; Bilgilioglu, S.S. Snow Avalanche Susceptibility Mapping Using Novel Tree-Based Machine Learning Algorithms (XGBoost, NGBoost, and LightGBM) with EXplainable Artificial Intelligence (XAI) Approach. Stoch. Environ. Res. Risk Assess. 2023, 37, 2243–2270. [Google Scholar] [CrossRef]
  29. Aydin, H.E.; Iban, M.C. Predicting and Analyzing Flood Susceptibility Using Boosting-Based Ensemble Machine Learning Algorithms with SHapley Additive ExPlanations. Nat. Hazards 2023, 116, 2957–2991. [Google Scholar] [CrossRef]
  30. Partigöç, N.S.; Dinçer, C. The Multi–Disaster Risk Assessment: A-GIS Based Approach for Izmir City. Int. J. Eng. Geosci. 2024, 9, 61–76. [Google Scholar] [CrossRef]
  31. Özdemir, F.B.; Demir, N. 2019 İzmir Karabağlar İlçesi Orman Yangın Alanının Uydu Görüntüleri İle Analizi. Turk. J. Remote Sens. GIS 2021, 3, 20–33. [Google Scholar] [CrossRef]
  32. Çolak, E.; Sunar, F. Evaluation of Forest Fire Risk in the Mediterranean Turkish Forests: A Case Study of Menderes Region, Izmir. Int. J. Disaster Risk Reduct. 2020, 45, 101479. [Google Scholar] [CrossRef]
  33. Öncü, G.; Çorumluoğlu, Ö. Assessment of Forest Fire Damage Severity By Remote Sensing Techniques. Int. J. Environ. Geoinform. 2023, 10, 151–158. [Google Scholar] [CrossRef]
  34. Kesgin Atak, B.; Ersoy Tonyaloğlu, E. Evaluating Spectral Indices for Estimating Burned Areas in the Case of Izmir/Turkey. Eurasian J. For. Sci. 2020, 8, 49–59. [Google Scholar] [CrossRef]
  35. Ertugrul, M.; Varol, T.; Ozel, H.B.; Cetin, M.; Sevik, H. Influence of Climatic Factor of Changes in Forest Fire Danger and Fire Season Length in Turkey. Environ. Monit. Assess. 2021, 193, 28. [Google Scholar] [CrossRef]
  36. Yue, W.; Ren, C.; Liang, Y.; Lin, X.; Yin, A.; Liang, J. Wildfire Risk Assessment Considering Seasonal Differences: A Case Study of Nanning, China. Forests 2023, 14, 1616. [Google Scholar] [CrossRef]
  37. Eker, R.; Alkiş, K.C.; Aydın, A. Assessment of Large-Scale Multiple Forest Disturbance Susceptibilities with AutoML Framework: An Izmir Regional Forest Directorate Case. J. For. Res. 2024, 35, 65. [Google Scholar] [CrossRef]
  38. Thi Hang, H.; Mallick, J.; Alqadhi, S.; Bindajam, A.A.; Abdo, H.G. Exploring Forest Fire Susceptibility and Management Strategies in Western Himalaya: Integrating Ensemble Machine Learning and Explainable AI for Accurate Prediction and Comprehensive Analysis. Environ. Technol. Innov. 2024, 35, 103655. [Google Scholar] [CrossRef]
  39. Tran, T.T.K.; Janizadeh, S.; Bateni, S.M.; Jun, C.; Kim, D.; Trauernicht, C.; Rezaie, F.; Giambelluca, T.W.; Panahi, M. Improving the Prediction of Wildfire Susceptibility on Hawai‘i Island, Hawai‘i, Using Explainable Hybrid Machine Learning Models. J. Environ. Manag. 2024, 351, 119724. [Google Scholar] [CrossRef]
  40. Bilucan, F.; Teke, A.; Kavzoglu, T. Susceptibility Mapping of Wildfires Using XGBoost, Random Forest and AdaBoost: A Case Study of Mediterranean Ecosystem. In International Conference on Mediterranean Geosciences Union; Springer Nature: Cham, Switzerland, 2024; pp. 99–101. [Google Scholar]
  41. Qayyum, F.; Jamil, H.; Alsboui, T.; Hijjawi, M. Wildfire Risk Exploration: Leveraging SHAP and TabNet for Precise Factor Analysis. Fire Ecol. 2024, 20, 10. [Google Scholar] [CrossRef]
  42. Cilli, R.; Elia, M.; D’Este, M.; Giannico, V.; Amoroso, N.; Lombardi, A.; Pantaleo, E.; Monaco, A.; Sanesi, G.; Tangaro, S.; et al. Explainable Artificial Intelligence (XAI) Detects Wildfire Occurrence in the Mediterranean Countries of Southern Europe. Sci. Rep. 2022, 12, 16349. [Google Scholar] [CrossRef] [PubMed]
  43. Li, X.; Li, J.; Haghani, M. Application of Remote Sensing Technology in Wildfire Research: Bibliometric Perspective. Fire Technol. 2024, 60, 579–616. [Google Scholar] [CrossRef]
  44. Akyürek, Ö. Spatial and Temporal Analysis of Vegetation Fires in Europe. Nat. Hazards 2023, 117, 1105–1124. [Google Scholar] [CrossRef]
  45. Eker, R.; Çınar, T.; Baysal, İ.; Aydın, A. Remote Sensing and GIS-Based Inventory and Analysis of the Unprecedented 2021 Forest Fires in Türkiye’s History. In Natural Hazards; Springer: Berlin/Heidelberg, Germany, 2024. [Google Scholar] [CrossRef]
  46. Akyürek, Ö. Türkiye’deki 2000–2021 Yılları Arasındaki Bitki Örtüsü Yangınlarının Mekânsal Analizi. Turk. J. Remote Sens. GIS 2023, 4, 33–46. [Google Scholar] [CrossRef]
  47. Bilgiç, E.; Tuna Tuygun, G.; Gündüz, O. Development of an Emission Estimation Method with Satellite Observations for Significant Forest Fires and Comparison with Global Fire Emission Inventories: Application to Catastrophic Fires of Summer 2021 over the Eastern Mediterranean. Atmos. Environ. 2023, 308, 119871. [Google Scholar] [CrossRef]
  48. Justice, C.O.; Giglio, L.; Korontzi, S.; Owens, J.; Morisette, J.T.; Roy, D.; Descloitres, J.; Alleaume, S.; Petitcolin, F.; Kaufman, Y. The MODIS Fire Products. Remote Sens. Environ. 2002, 83, 244–262. [Google Scholar] [CrossRef]
  49. Dennison, P.; Charoensiri, K.; Roberts, D.; Peterson, S.; Green, R. Wildfire Temperature and Land Cover Modeling Using Hyperspectral Data. Remote Sens. Environ. 2006, 100, 212–222. [Google Scholar] [CrossRef]
  50. Boschetti, L.; Roy, D.P.; Giglio, L.; Huang, H.; Zubkova, M.; Humber, M.L. Global Validation of the Collection 6 MODIS Burned Area Product. Remote Sens. Environ. 2019, 235, 111490. [Google Scholar] [CrossRef] [PubMed]
  51. Fornacca, D.; Ren, G.; Xiao, W. Performance of Three MODIS Fire Products (MCD45A1, MCD64A1, MCD14ML), and ESA Fire_CCI in a Mountainous Area of Northwest Yunnan, China, Characterized by Frequent Small Fires. Remote Sens. 2017, 9, 1131. [Google Scholar] [CrossRef]
  52. Giglio, L.; Schroeder, W.; Justice, C.O. The Collection 6 MODIS Active Fire Detection Algorithm and Fire Products. Remote Sens. Environ. 2016, 178, 31–41. [Google Scholar] [CrossRef]
  53. Giglio, L.; Boschetti, L.; Roy, D.P.; Humber, M.L.; Justice, C.O. The Collection 6 MODIS Burned Area Mapping Algorithm and Product. Remote Sens. Environ. 2018, 217, 72–85. [Google Scholar] [CrossRef] [PubMed]
  54. Tran, T.T.K.; Bateni, S.M.; Rezaie, F.; Panahi, M.; Jun, C.; Trauernicht, C.; Neale, C.M.U. Enhancing Predictive Ability of Optimized Group Method of Data Handling (GMDH) Method for Wildfire Susceptibility Mapping. Agric. For. Meteorol. 2023, 339, 109587. [Google Scholar] [CrossRef]
  55. Rezaie, F.; Panahi, M.; Bateni, S.M.; Lee, S.; Jun, C.; Trauernicht, C.; Neale, C.M.U. Development of Novel Optimized Deep Learning Algorithms for Wildfire Modeling: A Case Study of Maui, Hawai‘i. Eng. Appl. Artif. Intell. 2023, 125, 106699. [Google Scholar] [CrossRef]
  56. Mishra, M.; Guria, R.; Baraj, B.; Nanda, A.P.; Santos, C.A.G.; Silva, R.M.D.; Laksono, F.A.T. Spatial Analysis and Machine Learning Prediction of Forest Fire Susceptibility: A Comprehensive Approach for Effective Management and Mitigation. Sci. Total Environ. 2024, 926, 171713. [Google Scholar] [CrossRef]
  57. Guo, M.; Yao, Q.; Suo, H.; Xu, X.; Li, J.; He, H.; Yin, S.; Li, J. The Importance Degree of Weather Elements in Driving Wildfire Occurrence in Mainland China. Ecol. Indic. 2023, 148, 110152. [Google Scholar] [CrossRef]
  58. Pragya; Kumar, M.; Tiwari, A.; Majid, S.I.; Bhadwal, S.; Sahu, N.; Verma, N.K.; Tripathi, D.K.; Avtar, R. Integrated Spatial Analysis of Forest Fire Susceptibility in the Indian Western Himalayas (IWH) Using Remote Sensing and GIS-Based Fuzzy AHP Approach. Remote Sens. 2023, 15, 4701. [Google Scholar] [CrossRef]
  59. Shi, C.; Zhang, F. A Forest Fire Susceptibility Modeling Approach Based on Integration Machine Learning Algorithm. Forests 2023, 14, 1506. [Google Scholar] [CrossRef]
  60. Breiman, L. Random Forests. Mach. Learn. 2001, 45, 5–32. [Google Scholar] [CrossRef]
  61. Chen, T.; Guestrin, C. XGBoost. In Proceedings of the 22nd ACM SIGKDD International Conference on Knowledge Discovery and Data Mining, San Francisco, CA, USA, 13–17 August 2016; ACM: New York, NY, USA, 2016; pp. 785–794. [Google Scholar]
  62. Ke, G.; Meng, Q.; Finley, T.; Wang, T.; Chen, W.; Ma, W.; Ye, Q.; Liu, T.-Y. LightGBM: A Highly Efficient Gradient Boosting Decision Tree. In Proceedings of the 31st International Conference on Neural Information Processing Systems, Long Beach, CA, USA, 4–9 December 2017; Curran Associates Inc.: Red Hook, NY, USA, 2017; pp. 3149–3157. [Google Scholar]
  63. Akiba, T.; Sano, S.; Yanase, T.; Ohta, T.; Koyama, M. Optuna: A Next-Generation Hyperparameter Optimization Framework. In Proceedings of the 25th ACM SIGKDD International Conference on Knowledge Discovery & Data Mining, Anchorage, AK, USA, 4–8 August 2019; ACM: New York, NY, USA, 2019; pp. 2623–2631. [Google Scholar]
  64. Canbek, G.; Sagiroglu, S.; Temizel, T.T.; Baykal, N. Binary Classification Performance Measures/Metrics: A Comprehensive Visualized Roadmap to Gain New Insights. In Proceedings of the 2017 International Conference on Computer Science and Engineering (UBMK), London, UK, 5–7 July 2017; pp. 821–826. [Google Scholar]
  65. Li, H.; Vulova, S.; Rocha, A.D.; Kleinschmit, B. Spatio-Temporal Feature Attribution of European Summer Wildfires with Explainable Artificial Intelligence (XAI). Sci. Total Environ. 2024, 916, 170330. [Google Scholar] [CrossRef]
  66. Shapley, L.S. Stochastic Games. Proc. Natl. Acad. Sci. USA 1953, 39, 1095–1100. [Google Scholar] [CrossRef]
  67. Bhattacharya, A. Applied Machine Learning Explainability Techniques: Make ML Models Explainable and Trustworthy for Practical Applications Using LIME, SHAP, and More; Packt Publishing: Birmingham, UK, 2022. [Google Scholar]
  68. Lundberg, S.M.; Erion, G.; Chen, H.; DeGrave, A.; Prutkin, J.M.; Nair, B.; Katz, R.; Himmelfarb, J.; Bansal, N.; Lee, S.-I. From Local Explanations to Global Understanding with Explainable AI for Trees. Nat. Mach. Intell. 2020, 2, 56–67. [Google Scholar] [CrossRef] [PubMed]
  69. Lundberg, S.M.; Lee, S.-I. A Unified Approach to Interpreting Model Predictions. In Proceedings of the Advances in Neural Information Processing Systems, Long Beach, CA, USA, 4–9 December 2017; Guyon, I., Luxburg, U.V., Bengio, S., Wallach, H., Fergus, R., Vishwanathan, S., Garnett, R., Eds.; Curran Associates, Inc.: Red Hook, NY, USA, 2017; Volume 30. [Google Scholar]
  70. Li, Z. Extracting Spatial Effects from Machine Learning Model Using Local Interpretation Method: An Example of SHAP and XGBoost. Comput. Environ. Urban Syst. 2022, 96, 101845. [Google Scholar] [CrossRef]
  71. Sarkar, M.S.; Majhi, B.K.; Pathak, B.; Biswas, T.; Mahapatra, S.; Kumar, D.; Bhatt, I.D.; Kuniyal, J.C.; Nautiyal, S. Ensembling Machine Learning Models to Identify Forest Fire-Susceptible Zones in Northeast India. Ecol. Inform. 2024, 81, 102598. [Google Scholar] [CrossRef]
  72. Mehmood, K.; Anees, S.A.; Luo, M.; Akram, M.; Zubair, M.; Khan, K.A.; Khan, W.R. Assessing Chilgoza Pine (Pinus gerardiana) Forest Fire Severity: Remote Sensing Analysis, Correlations, and Predictive Modeling for Enhanced Management Strategies. Trees For. People 2024, 16, 100521. [Google Scholar] [CrossRef]
  73. Berardi, D.; Galuppi, M.; Libertà, A.; Lombardi, M. Geostatistical Modeling of Wildfire Occurrence Probability: The Case Study of Monte Catillo Natural Reserve in Italy. Fire 2023, 6, 427. [Google Scholar] [CrossRef]
  74. Gao, T.; Wang, L.; Gao, X. Using Machine Learning and Aggregated Remote Sensing Data for Wildfire Occurrence Prediction and Feature Selection: A Case Study in California. In Proceedings of the Computing in Civil Engineering 2023, Reston, VA, USA, 25–28 January 2024; American Society of Civil Engineers: Reston, VA, USA, 2024; pp. 52–59. [Google Scholar]
  75. Bilgili, A.; Arda, T.; Kilic, B. Explainability in Wind Farm Planning: A Machine Learning Framework for Automatic Site Selection of Wind Farms. Energy Convers. Manag. 2024, 309, 118441. [Google Scholar] [CrossRef]
  76. Ning, J.; Yang, G.; Zhang, Y.; Geng, D.; Wang, L.; Liu, X.; Li, Z.; Yu, H.; Zhang, J.; Di, X. Smoke Exposure Levels Prediction Following Laboratory Combustion of Pinus Koraiensis Plantation Surface Fuel. Sci. Total Environ. 2023, 881, 163402. [Google Scholar] [CrossRef] [PubMed]
  77. Sharma, S.K.; Aryal, J.; Shao, Q.; Rajabifard, A. Characterizing Topographic Influences of Bushfire Severity Using Machine Learning Models: A Case Study in a Hilly Terrain of Victoria, Australia. IEEE J. Sel. Top. Appl. Earth Obs. Remote Sens. 2023, 16, 2791–2807. [Google Scholar] [CrossRef]
  78. Gao, C.; Lin, H.; Hu, H. Forest-Fire-Risk Prediction Based on Random Forest and Backpropagation Neural Network of Heihe Area in Heilongjiang Province, China. Forests 2023, 14, 170. [Google Scholar] [CrossRef]
  79. Moayedi, H.; Mehrabi, M.; Bui, D.T.; Pradhan, B.; Foong, L.K. Fuzzy-Metaheuristic Ensembles for Spatial Assessment of Forest Fire Susceptibility. J. Environ. Manag. 2020, 260, 109867. [Google Scholar] [CrossRef]
  80. Tang, X.; Machimura, T.; Li, J.; Liu, W.; Hong, H. A Novel Optimized Repeatedly Random Undersampling for Selecting Negative Samples: A Case Study in an SVM-Based Forest Fire Susceptibility Assessment. J. Environ. Manag. 2020, 271, 111014. [Google Scholar] [CrossRef] [PubMed]
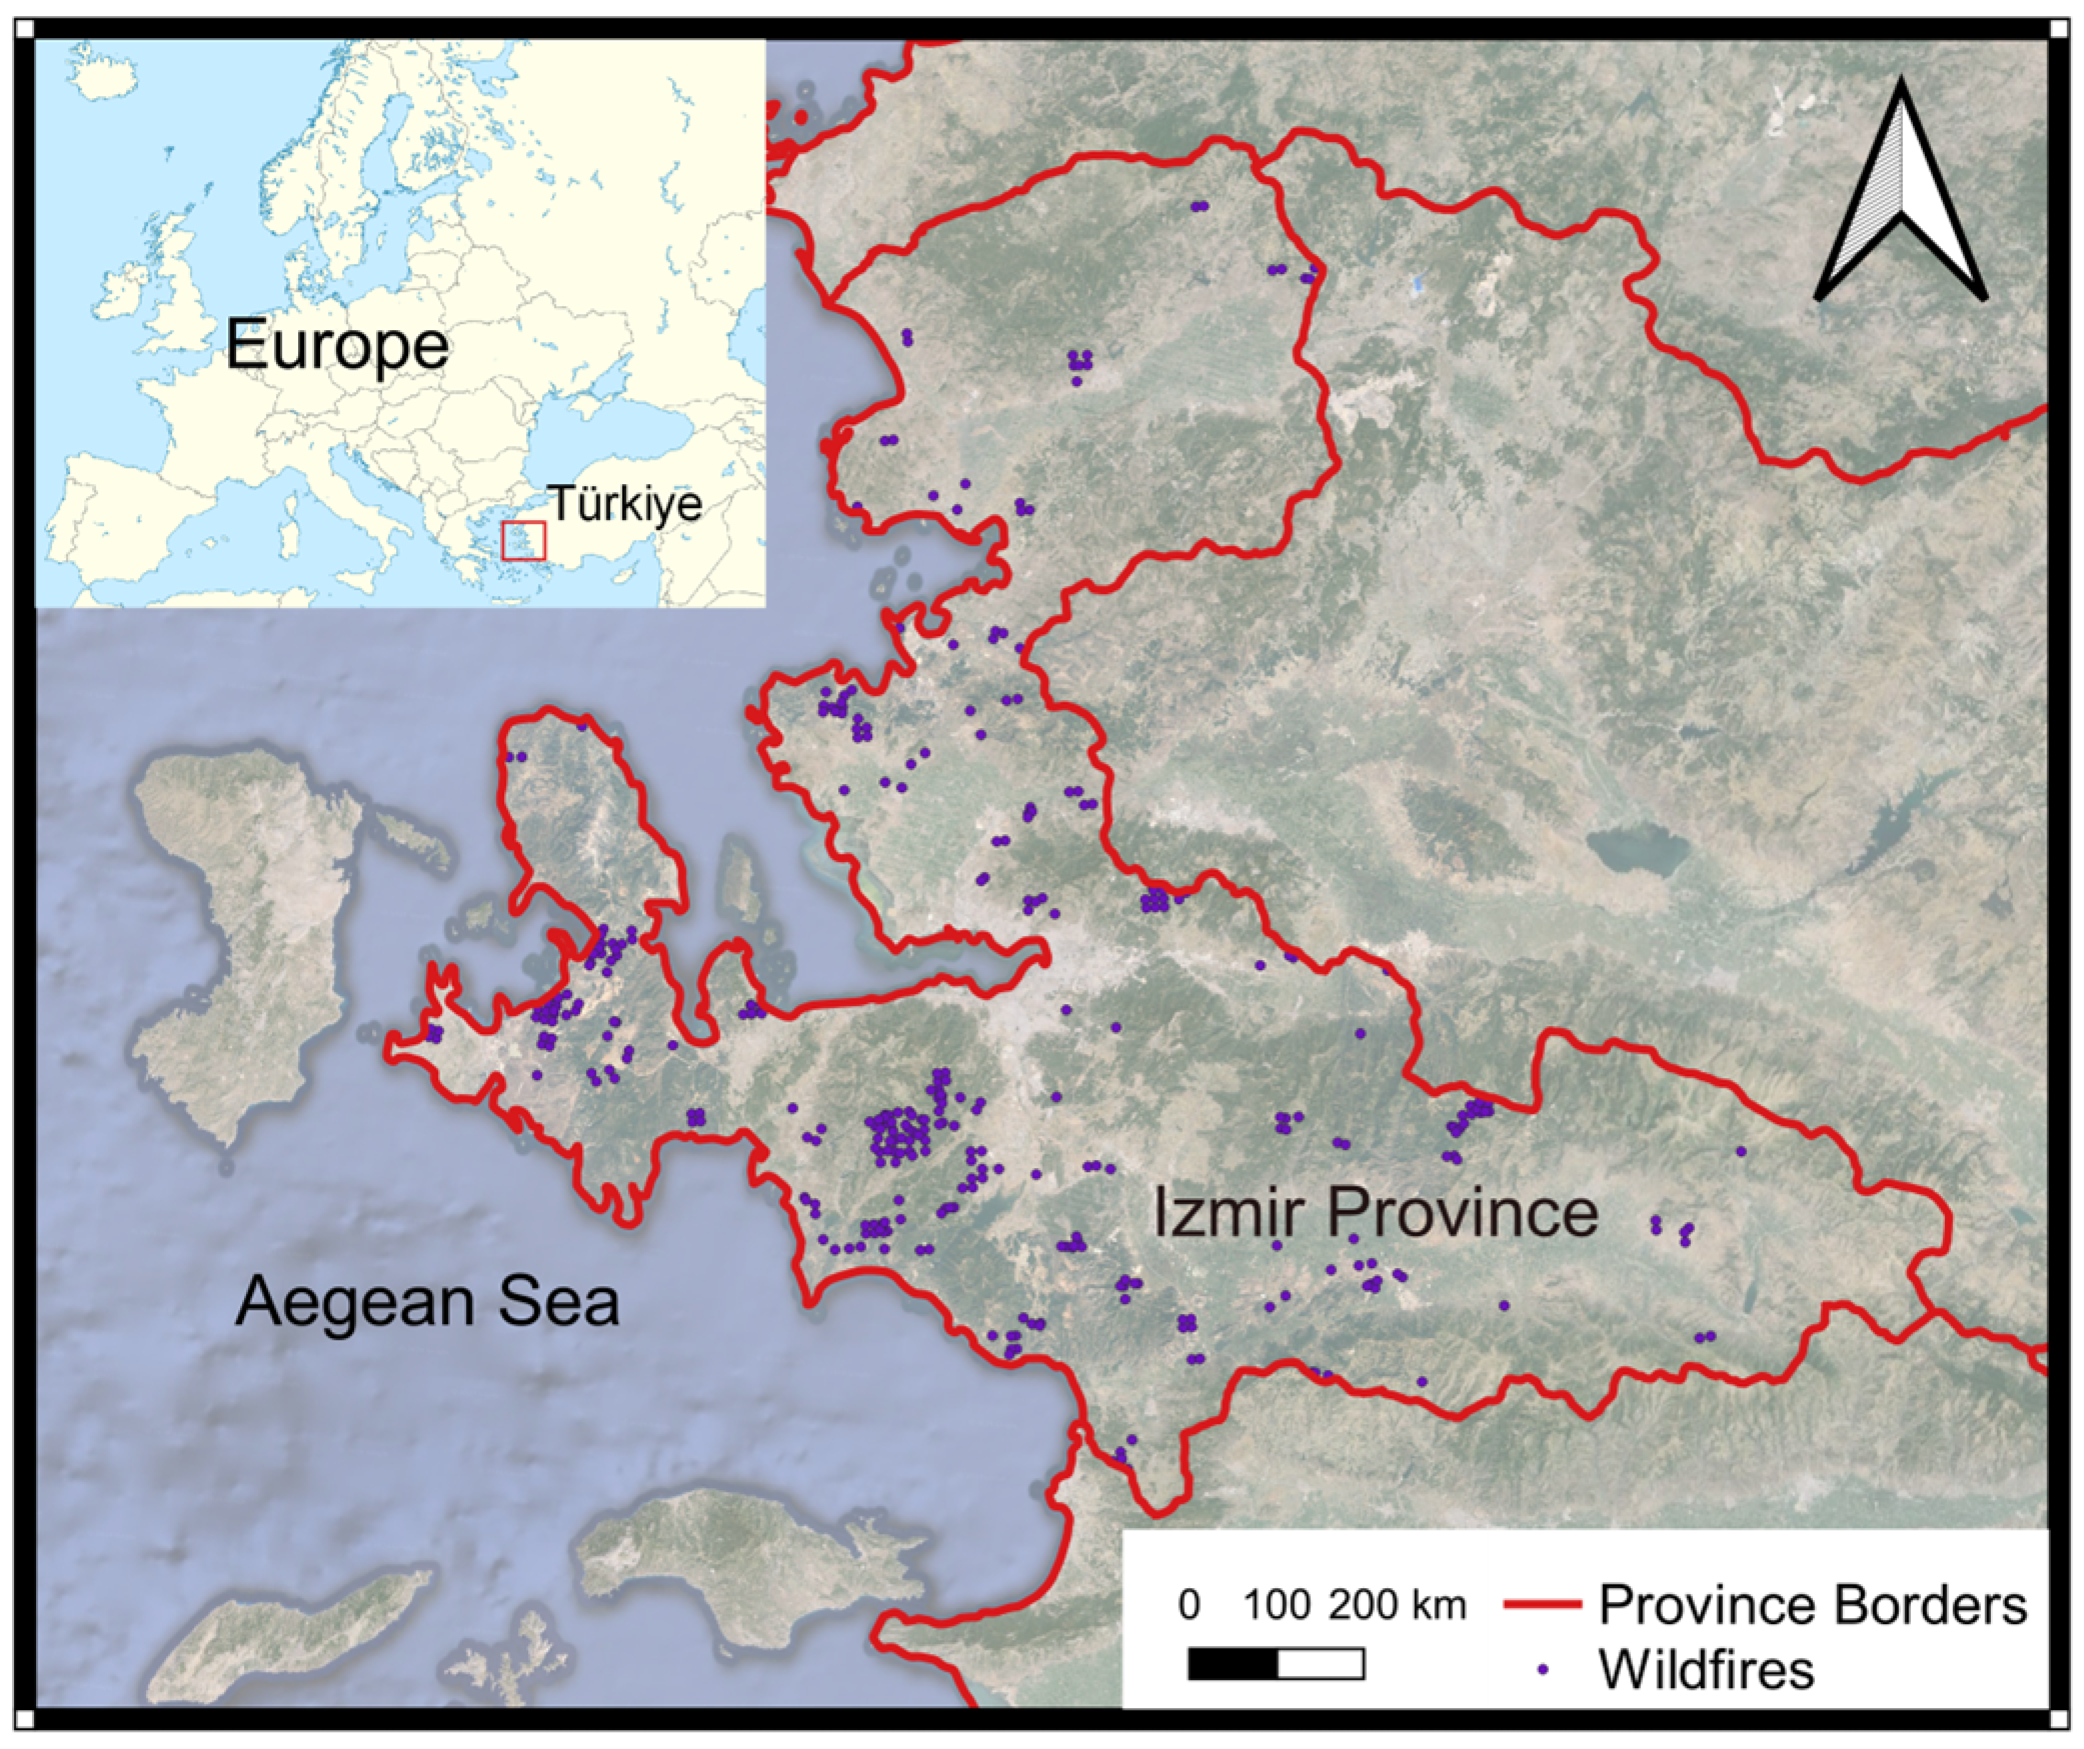
Figure 1. Study area and wildfire inventory.
Remotesensing 16 02842 g001
Figure 2. Topographical conditioning factors: (A) elevation, (B) slope, (C) aspect, (D) TWI.
Remotesensing 16 02842 g002
Figure 3. Climatic conditioning factors: (A) annual average temperature, (B) annual rainfall, (C) annual solar radiation, (D) annual average wind speed.
Remotesensing 16 02842 g003
Figure 4. Anthropogenic conditioning factors: (A) LULC, (B) distance to roads, (C) distance to villages, (D) distance to streams.
Remotesensing 16 02842 g004
Figure 5. Vegetation-related conditioning factors: (A) forest type, (B) tree cover density, (C) NDVI.
Remotesensing 16 02842 g005
Figure 6. Summary of the research methodology steps utilized in the study.
Remotesensing 16 02842 g006
Figure 7. Multicollinearity test results (upper) before recursive elimination and (lower) after recursive elimination and selected factors.
Remotesensing 16 02842 g007
Figure 8. Pearson’s correlation coefficient matrix.
Remotesensing 16 02842 g008
Figure 9. Confusion matrixes.
Remotesensing 16 02842 g009
Figure 10. Classifiers’ performance comparison.
Remotesensing 16 02842 g010
Figure 11. ROC curves.
Remotesensing 16 02842 g011
Figure 12. SHAP summary plot of RF classifier’s output.
Remotesensing 16 02842 g012
Figure 13. Global feature importance by absolute SHAP values.
Remotesensing 16 02842 g013
Figure 14. Each factor’s SHAP dependence plots.
Remotesensing 16 02842 g014
Figure 15. Generated wildfire susceptibility map for the province of Izmir.
Remotesensing 16 02842 g015
Figure 16. Area extent of susceptibility classes and number of wildfire samples corresponding to each susceptibility class.
Remotesensing 16 02842 g016
Table 1. Conditioning factors used in this study and their sources/resolutions.
Factor TypeSources and ResolutionConditioning FactorsMinMaxMean
TopographicalSRTM DEM (30 m)Elevation (m)02148211
Slope (degrees)075.42911.02
Aspect (degrees)0360114.3
Topographic Wetness Index (TWI)2.03125.7174.12
ClimaticWorldClim v.2.1 Database (~1 km)Average Temperature (°C) 7.617.815.1
Annual Rainfall (mm)467458.8
Solar Radiation (kJ/m2 × day)017,95917,346.9
Average Wind Speed (m/s)2.24.83.32
AnthropogenicOpen Street MapsDistance to Streams (m)051,31325,001.7
Distance to Roads (m)026,43214,011.1
Distance to Villages (m)010,8192012.6
CORINE 2018Land Use Land Cover (LULC)---
Vegetation-
related
Copernicus Land Monitoring
Service (10 m)
Forest Type---
Tree Cover Density (%)010034.2
Landsat 8 (30 m)Normalized Difference Vegetation Index (NDVI)−0.3190.8560.151
Table 2. Performance metrics for ML classifiers.
MetricFormula
Sensitivity t p t p + f n
Specificity t n f p + t n
Accuracy t p + t n t p + f n + f p + t n
Precision t p t p + f p
F1-score 2 × P r e c i s i o n × R e c a l l P r e c i s i o n + R e c a l l
AUC 1 2 t p t p + f n + t n t n + f p
Disclaimer/Publisher’s Note: The statements, opinions and data contained in all publications are solely those of the individual author(s) and contributor(s) and not of MDPI and/or the editor(s). MDPI and/or the editor(s) disclaim responsibility for any injury to people or property resulting from any ideas, methods, instructions or products referred to in the content.