Article

An Accurate and Robust Multimodal Template Matching Method Based on Center-Point Localization in Remote Sensing Imagery

College of Intellgence Science and Technology, National University of Defense Technology, Changsha 410073, China
*
Author to whom correspondence should be addressed.
Remote Sens. 2024, 16(15), 2831; https://doi.org/10.3390/rs16152831
Submission received: 27 June 2024 / Revised: 30 July 2024 / Accepted: 31 July 2024 / Published: 1 August 2024
(This article belongs to the Topic Computer Vision and Image Processing, 2nd Edition)

Abstract

:
Deep learning-based template matching in remote sensing has received increasing research attention. Existing anchor box-based and anchor-free methods often suffer from low template localization accuracy in the presence of multimodal, nonrigid deformation and occlusion. To address this problem, we transform the template matching task into a center-point localization task for the first time and propose an end-to-end template matching method based on a novel fully convolutional Siamese network. Furthermore, we propose an adaptive shrinkage cross-correlation scheme, which improves the precision of template localization and alleviates the impact of background clutter without adding any parameters. We also design a scheme that leverages keypoint information to assist in locating the template center, thereby enhancing the precision of template localization. We construct a multimodal template matching dataset to verify the performance of the method in dealing with differences in view, scale, rotation and occlusion in practical application scenarios. Extensive experiments on a public dataset, OTB, the proposed dataset, as well as a remote sensing dataset, SEN1-2, demonstrate that our method achieves state-of-the-art performance.

1. Introduction

Template matching is the process of finding given image templates in source images of the same scene, which were taken by the same or different sensors at the same or different times, from the same or different viewpoints [1]. It has received increasing attention due to its numerous applications in remote sensing [2,3,4], object detection [5,6,7], object tracking [8,9,10] and medical image processing [11].
Similarity metrics are designed to evaluate the degree of matching between the template image and each search region, identifying the location parameters with the maximum similarity. Traditional methods rely on pixel-level information in the corresponding regions for similarity matching, such as the sum of squared differences (SSD), zero-mean normalized cross-correlation (ZNCC), sum of absolute differences (SAD), normalized cross-correlation (NCC) and mutual information (MI). However, these methods face challenges in accurately localizing objects in practical scenarios, such as multimodal scenarios and those with low imaging resolutions, significant variations in object scale and shape and occlusion. To address the above challenges, numerous improved template matching methods have emerged. Local feature-based methods [12,13,14] exhibit strong invariance to rotation and scaling variations but perform poorly when dealing with viewpoint changes and occlusion. Global feature-based methods [15,16,17] are suitable for texture feature extraction but still fail in the presence of scale and lighting variations. Additionally, researchers have proposed new similarity measures [18,19,20,21] to enhance the robustness of these methods. Although these methods improve the robustness of template matching, challenges such as scale variations and background clutter still significantly impact the accuracy and robustness of template matching.
With the development of deep learning technology, deep learning-based template matching methods [1,22,23,24] have achieved state-of-the-art results on various template matching datasets. Existing deep learning-based methods can be categorized into two groups: anchor-based methods and anchor-free methods. The anchor-based methods generate dense anchor boxes, use a classification network to find candidate regions of the template and, finally, accurately locate the template through a regression network. The anchor-free methods locate the template based on a similarity measure between the template and source image features.
In some practical tasks, the prediction accuracy of the object center is more crucial. As Figure 1b shows, anchor-based methods locate the object by predicting bounding boxes; however, bounding boxes with the same confidence have different prediction accuracy for the object center. These methods indirectly predict the object center point through anchor boxes, resulting in low accuracy. Additionally, anchor-based methods have three drawbacks, including the need for many anchor boxes and the imbalance of positive and negative samples and hand-crafted anchor boxes, which increase the processing complexity and reduce the robustness and accuracy of the model. As Figure 1c shows, anchor-free methods based on the center point directly predict the object center; however, these methods do not effectively utilize the prior information in the anchor box, leading to inaccurate localization.
In this study, our motivation is to propose a robust template matching framework for multimodal images to achieve high template localization accuracy without introducing an additional computational overhead. The proposed method uses a Siamese network as the overall architecture and transforms the template matching task into a center-point localization task. The entire network consists of feature extraction, a cross-correlation operation and center-point localization.
We use ResNet-50 [25] as the backbone network for the Siamese feature extraction network. Inspired by the idea of the encoder–decoder structure [26], we add deconvolution layers after the pretraining model, reducing the computational complexity while ensuring improved localization accuracy. Additionally, we introduce feature concatenation modules to enhance the robustness in scenarios with significant scale variations.
Through the visual analysis of the depth-by-depth cross-correlation outputs, we observe that the same object exhibits high response values in the same channel while suppressing the responses in other channels. Therefore, we design a novel cross-correlation scheme based on an adaptive shrinkage attention module. This scheme both enhances the attention on high-response channels and dynamically eliminates a proportion of the object-similar features from the feature map, improving the object localization accuracy.
We also use a center point to represent the localization result. To fully use the abundant prior information in the anchor box, we add a corner-point localization branch and an offset prediction branch to assist in locating the object center, enhancing the localization accuracy.
The main contributions of this work are as follows.
  • We propose a robust multimodal template matching method that transforms the template matching task into a center-point localization task, alleviating the problem of low accuracy.
  • We present a novel encoder–decoder Siamese feature extraction network, which enhances the robustness to large-scale variations and reduces the computational complexity.
  • We design an adaptive shrinkage cross-correlation method to dynamically remove a proportion of the similar features from the object, effectively improving the localization accuracy without adding additional parameters.
  • We build a new multimodal template matching dataset covering scenarios where the template matching task suffers from variations in rotation, viewing angle, occlusion and heterogeneity in practical applications.
The remainder of this article is organized as follows. Section 2 describes the related work on template matching and the proposed method in detail. Section 3 discusses our experimental results. Section 5 concludes this article.

2. Materials and Methods

2.1. Template Matching Methods

Template matching methods can be broadly divided into two main categories. The first is the traditional template matching methods, including the feature-based method [12,13,14,15,16,17], the model-based parameter transformation method [27,28,29] and the similarity measurement design method [18,19,20,21]. For example, SIFT [12] detects local feature points and generating descriptors for matching, and ORB [14] combines FAST keypoint detection with rotation-sensitive BRIEF descriptors to enhance the rotation invariance of features by assigning directions to each key point and utilizing these directions. Although they exhibit better scale invariance and rotation invariance, they are more sensitive to light changes. HOG [15] captures the global image features by calculating the distribution of gradient directions in the local unit. Although it is not sensitive to light changes, it is unable to deal with occlusion. To model specific parameter transformations between template and search images, fast affine template matching (FATM) [28] employs affine transformations on finite fields and utilizes second-order differential operators for feature extraction. Although the design effectively improves the robustness, it is often unable to deal with complex scenes containing background clutter. In addition, some methods enhance the robustness by designing new similarity measures. Best-buddies similarity (BBS) [18] introduces a symmetrized similarity measure that computes the similarity between point pairs as mutual nearest neighbors. Quality-aware template matching (QATM) [21] utilizes a convolutional neural network (CNN) to train the template matching network and employs a quality perception loss function to enhance the matching accuracy. While these methods effectively address occlusion and background clutter challenges, they struggle to accurately localize objects in scenarios involving significant scale differences.
The second category improves the performance based on deep learning technology. The refined single-shot multibox detector (RSSD) [22] combines the advantages of data-driven deep learning methods and manual template matching methods. Additionally, it improves the detection accuracy by incorporating spatial template matching strategies. An unsupervised object instance detection method [23] can detect a specific object instance by learning a generic template representation. A template matching method [24] for the registration of synthetic aperture radar (SAR) and optical images utilizes a Siamese architecture as a feature extractor and employs image preprocessing techniques to enhance the matching accuracy. Another template matching method [1] transforms the template matching task into a classification regression task, introducing channel attention mechanisms and distance intersection-over-union (DIoU) loss functions to improve the performance. Template matching methods based on deep learning exhibit high accuracy and strong robustness to changes in scale, rotation and lighting. However, most methods indirectly predict the object center point through anchor boxes, and the few methods that directly predict the center point do not consider the prior information within the anchor boxes, leading to lower accuracy in center-point prediction. In this paper, we apply keypoint-based object detectors to template matching tasks. We use the center point to represent the position of the object and completely disregard the estimation of other attributes, transforming the template matching task into a center-point localization task.

2.2. Fully Convolutional Siamese Networks

The fully convolutional Siamese network extracts features and calculates the similarity through convolutional operations. This approach is similar to the working mechanism of template matching tasks. As a no-anchor method, SiamFC [8] calculates the similarity between different positions by performing correlation convolution on the features of two different branches. Although this method significantly improves the efficiency, it struggles to effectively handle scale variations, leading to lower localization accuracy. Inspired by region proposal networks (RPNs) in object detection, SiamRPN [30] integrates RPNs in SiamFC, greatly enhancing the efficiency and accuracy of the tracker. SiamRPN++ [31] addresses the performance degradation problem when using deep neural networks as feature extraction networks in fully convolutional Siamese networks. Although anchor-based networks can effectively handle interference and scale variations, they require the definition of numerous hyperparameters and the selection of positive and negative samples, resulting in weak generalizability. The fully convolutional one-stage object detector (FCOS) [32] introduces anchor-free object detection to address this problem. SiamFC++ [33], SiamCAR [34], SiamBAN [35] and Ocean [36] also apply this idea to object tracking, removing predefined anchors in the network and significantly enhancing the tracker robustness.
In summary, compared to no-anchor networks, anchor-free fully convolutional Siamese networks exhibit greater localization precision and a better ability to handle scale differences, while also demonstrating better generalization abilities and lower computational complexity than anchor-based networks. Therefore, we adopt an anchor-free method for template matching localization and design a deep neural network based on an encoder–decoder structure as the feature extraction network to improve the localization accuracy and effectively handle scale variations.

2.3. Attention Modules

Attention modules focus the model on the most important regions of the feature map, improving the performance and robustness. Attention modules can be divided into two types: channel and spatial. Channel attention modules assign weights to feature maps on each channel. For instance, the SE [37] attention module reweights the channel characteristics by performing squeezing first and then excitation. In contrast, the spatial attention module assigns weights to feature maps based on the importance of spatial location information. However, the channel and spatial attention modules ignore the information interaction between the space and channel. The convolutional block attention module (CBAM) [38] uses channel and spatial attention modules in series to obtain a two-dimensional spatial attention coefficient matrix. In contrast, the bottleneck attention module (BAM) [39] combines the two modules in parallel. These combinations are inconsistent with the attention mechanisms of the human brain because they either process all features in one channel or in the same spatial location, making it impossible to calculate 3D weights efficiently. In addition, considerable data computing power is needed due to the structural parameters in their networks.
In this paper, we propose the adaptive shrinkage attention module, a new attention module based on SimAM [40]. It utilizes an energy function to compute 3D attention weights for feature maps and dynamically eliminates a proportion of the similar features from the object in the relevant feature map. Importantly, this enhancement is achieved without introducing any additional parameters.

2.4. Proposed Method

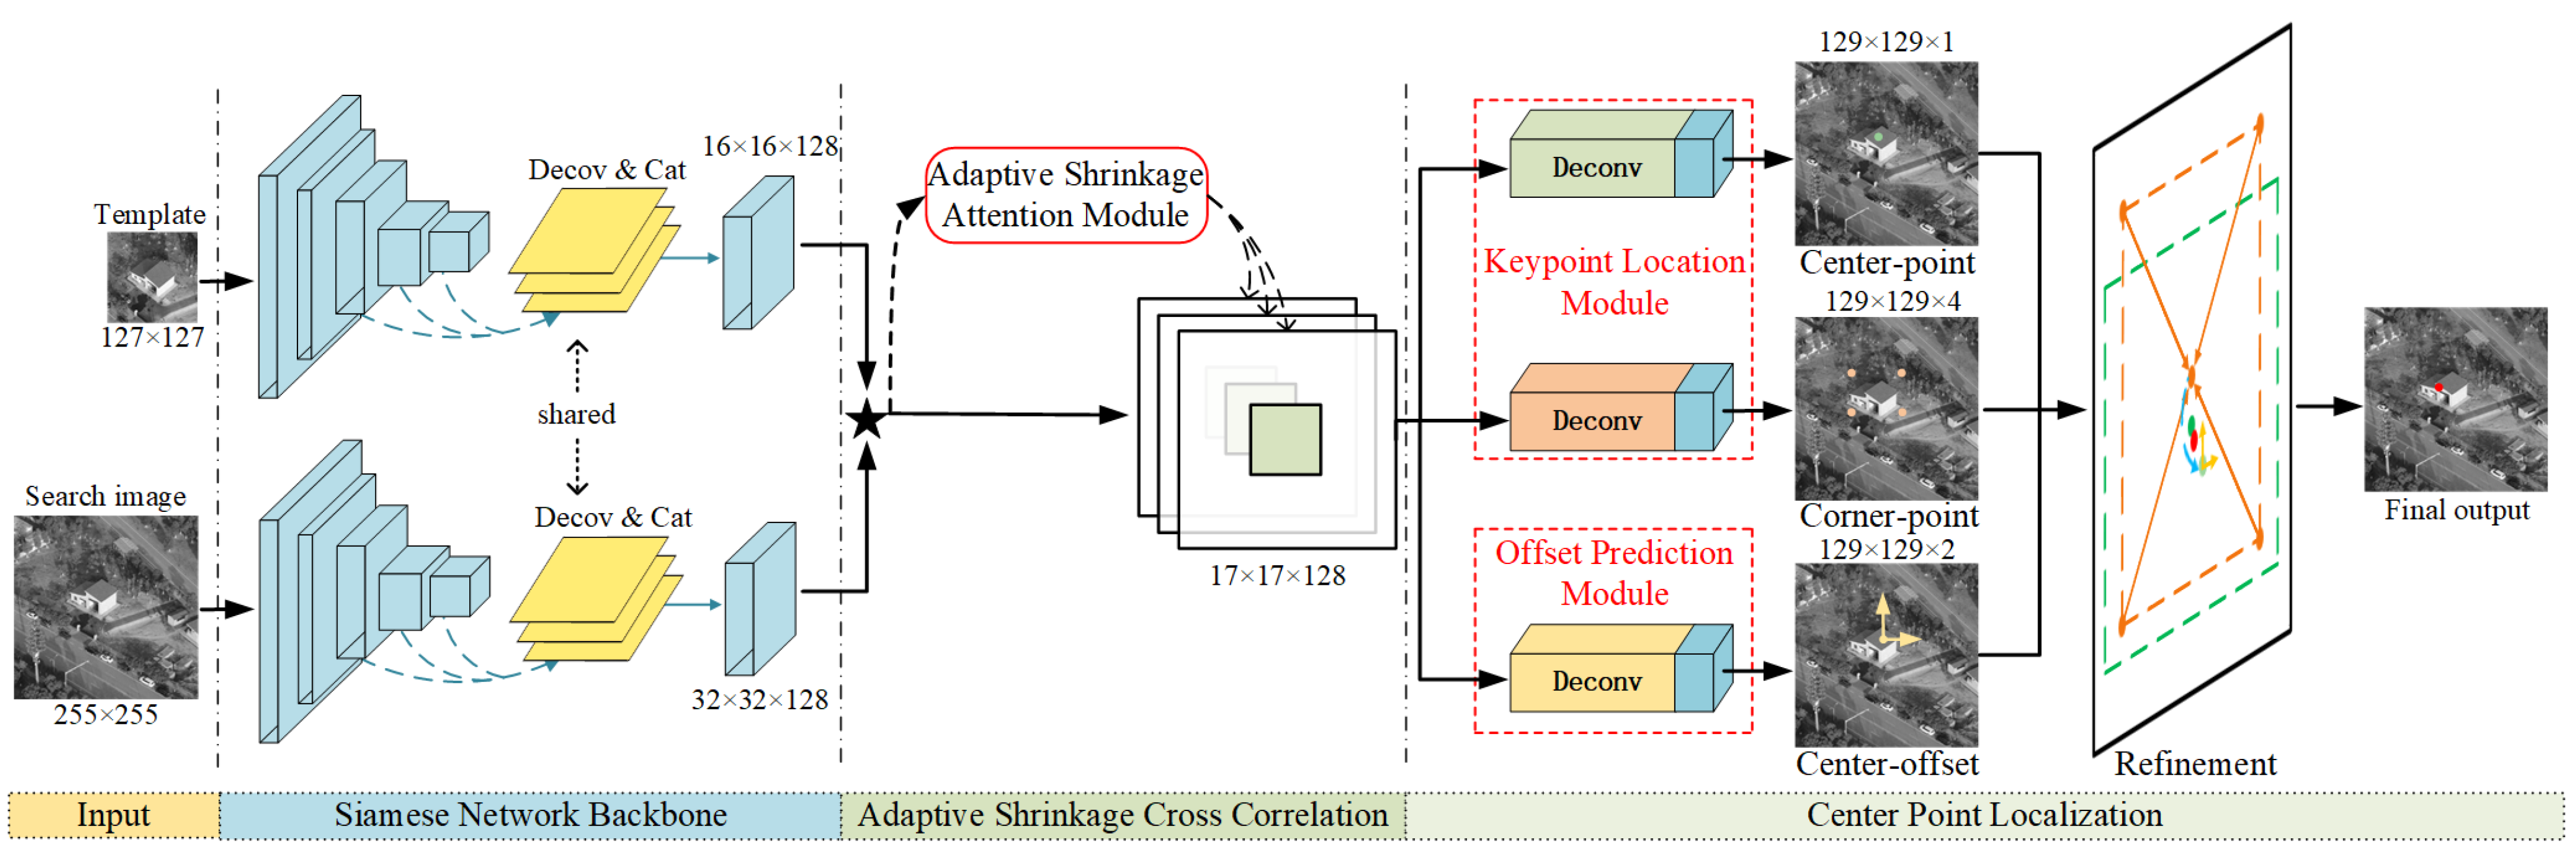
As Figure 2 shows, the proposed method comprises three main components: the Siamese network backbone, adaptive shrinkage cross-correlation and center-point localization. The Siamese network backbone is responsible for extracting feature maps from the template image and searching for image inputs. The adaptive shrinkage cross-correlation performs a convolution operation on the two feature maps and assigns weights to generate a correlation feature map. The center-point localization component consists of a keypoint location module and an offset prediction module and outputs the final position of the object. Specifically, the keypoint location module optimizes the object center location based on the corner-point location. The offset prediction module predicts the local offsets of the corresponding center point.

2.4.1. Siamese Network Backbone

SiamRPN++ [31] successfully addressed the performance degradation problem associated with using deep convolutional neural networks (DCNNs) as feature extraction networks in fully convolutional Siamese networks. However, this has led to a surge in the number of computations in the model and limits the effective use of pretrained models. To overcome this challenge, our network adopts the ResNet-50 pretrained model as the backbone network. Although ResNet-50, with continuous convolutional striding, can extract high-level semantic features, the network stride of the final feature map is 32, which adversely affects the localization precision. Research [41] has demonstrated that as the network depth of the Siamese tracker increases, the network stride should be set to 4 or 8 instead of increasing proportionally. To solve this problem, inspired by the encoding–decoding structure [26], we maintain the architecture of the ResNet-50 pretrained model and add deconvolution layers after the pretrained model. This architecture improves the localization accuracy of the network and significantly reduces the computational resources needed.
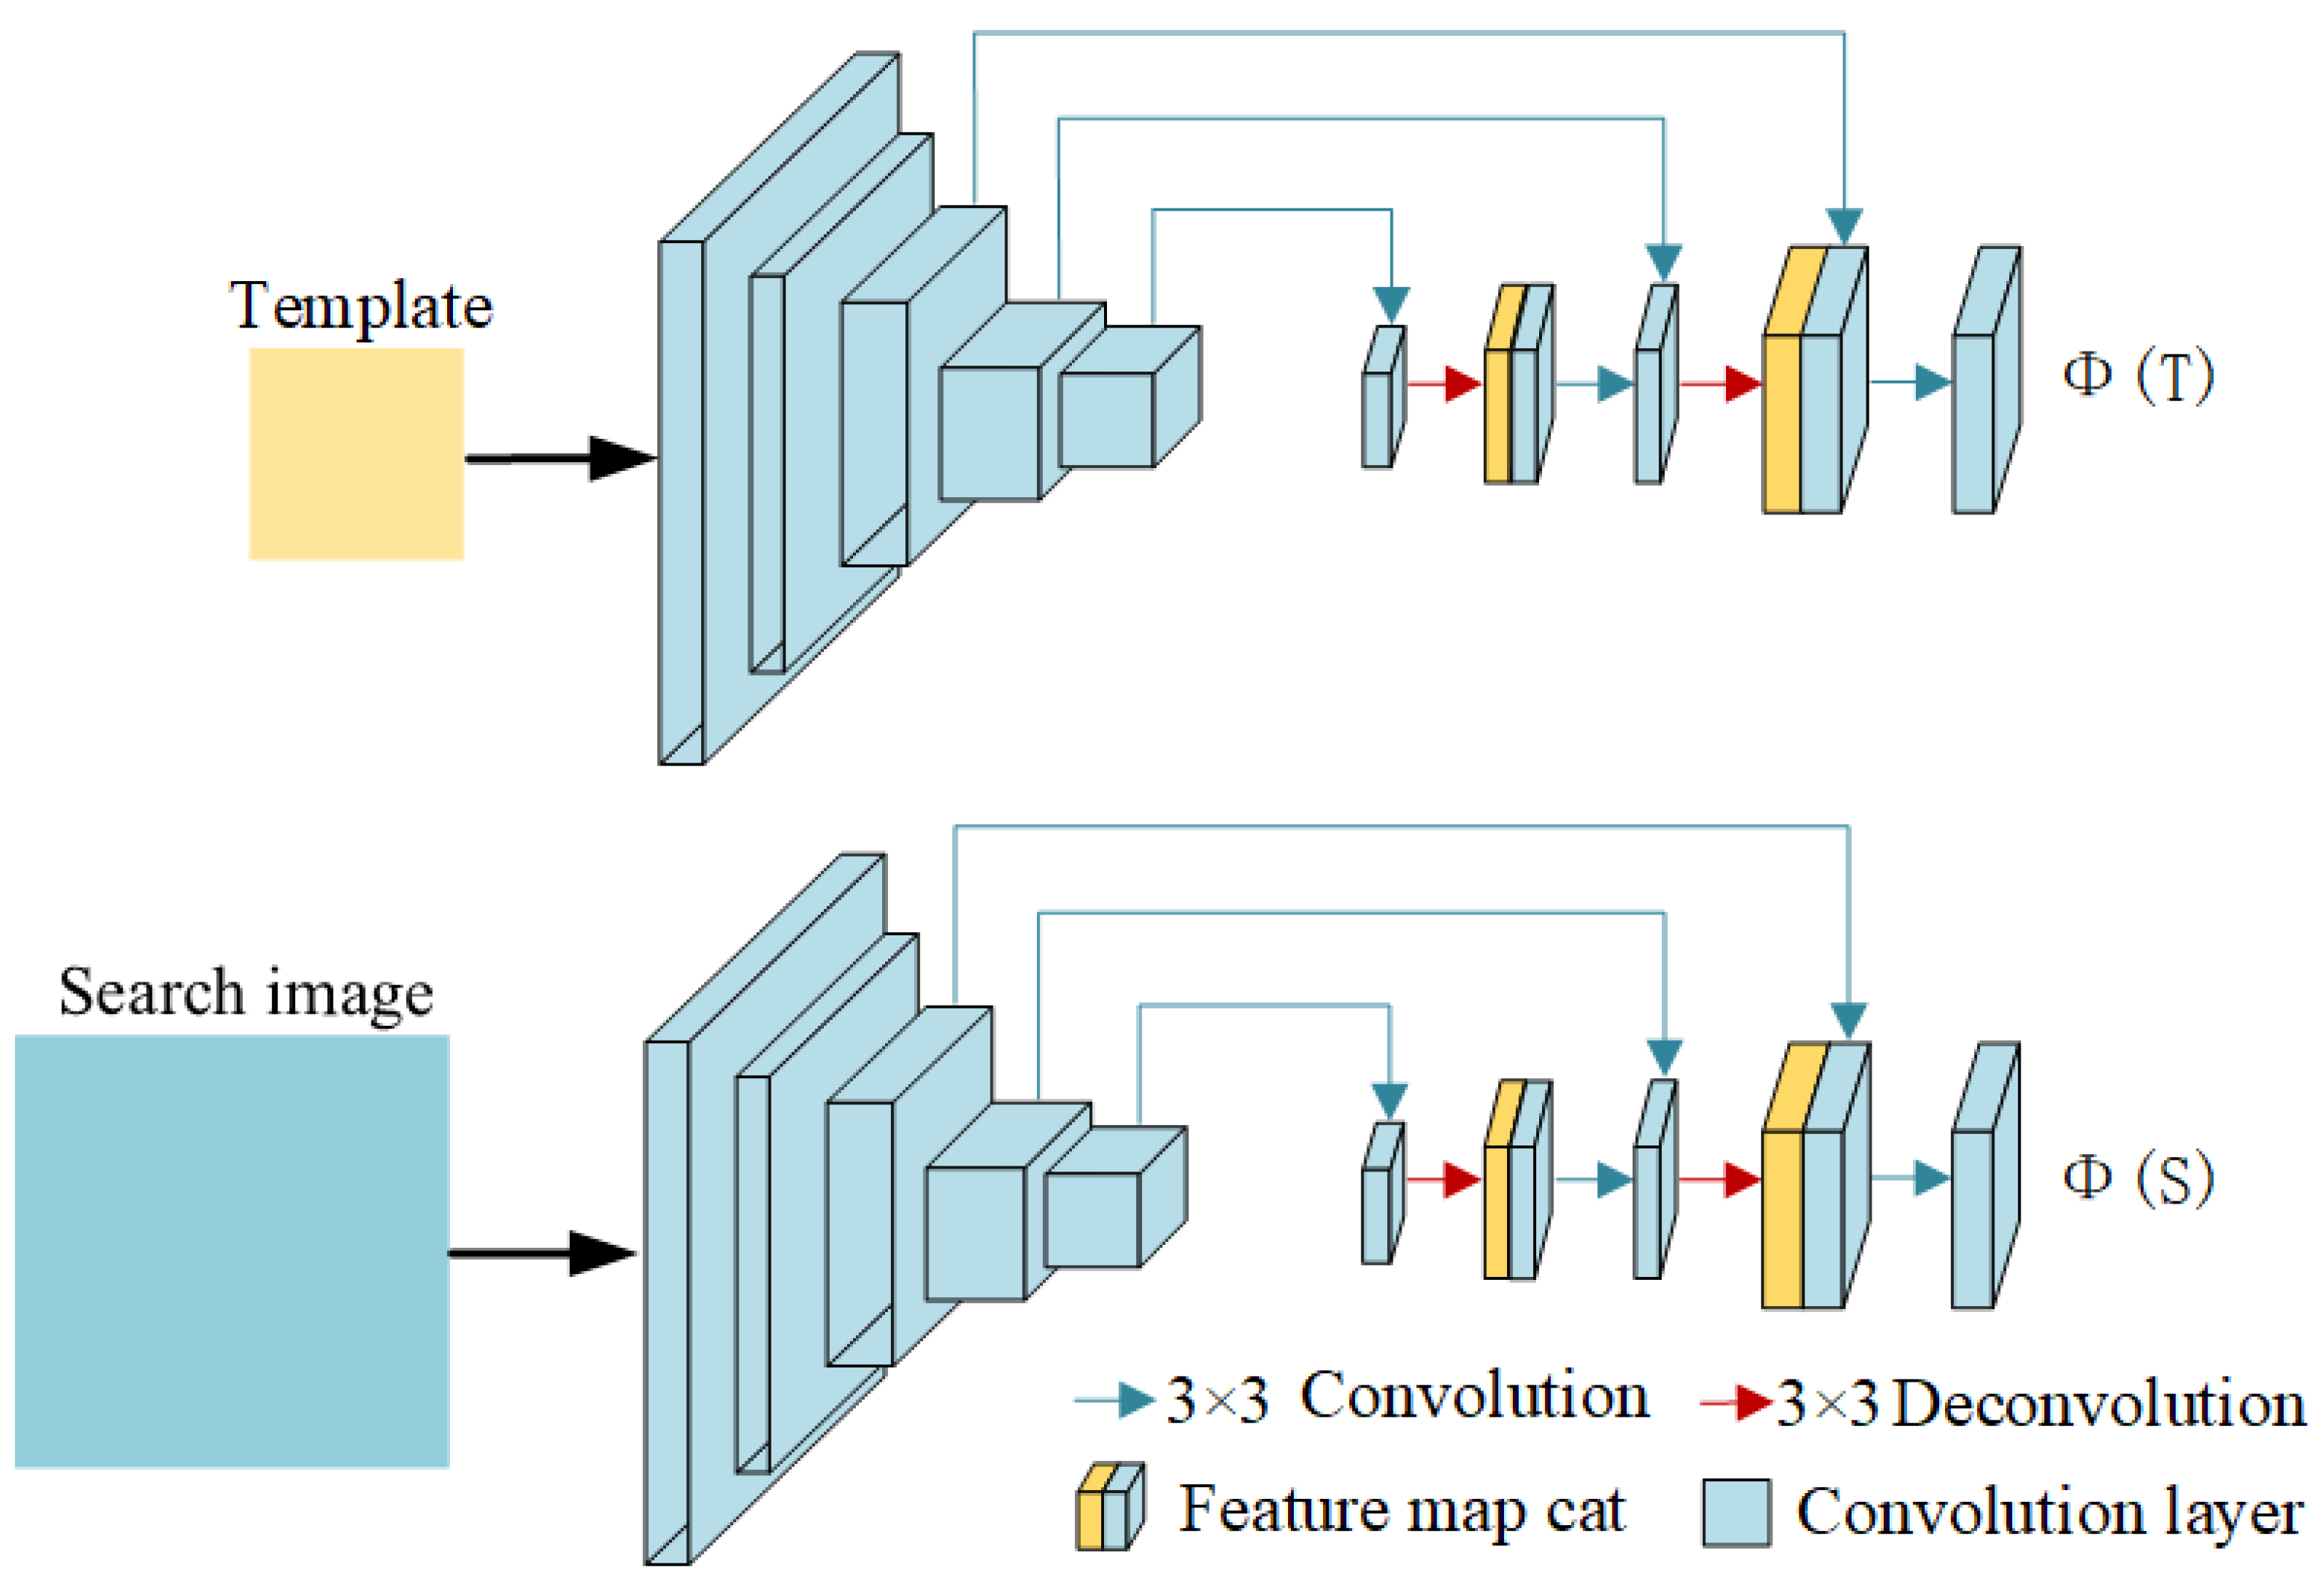
As Figure 3 shows, the Siamese network backbone consists of two identical branches. One branch takes the template image T as input and outputs the template feature map φ ( T ) . The other branch takes the search image S as input and generates the search feature map φ ( S ) . The two branches share parameters within the same network to ensure consistent feature extraction. We add feature concatenation modules at the same scale after each deconvolution layer to compensate for the information loss caused by deconvolution, enabling the network to extract features of different scales. Specifically, we employ a 3 × 3  convolutional layer in the last three-stage outputs and concatenate the convolution and deconvolution results. Table 1 shows the details of our backbone architecture.

2.4.2. Adaptive Shrinkage Cross-Correlation

The cross-correlation operation is a crucial step in associating the output information from the two branches and computing the similarity. To accomplish this, we employ φ (T) as a kernel to perform convolution with φ (S)
R = φ ( T ) × φ ( S ) ,
where R denotes the correlation feature map and * denotes the cross-correlation operation.
SiamRPN++ [31] introduced depthwise cross-correlation, which reduces the computational cost of the network and facilitates the deployment and application of the model. It usually consists of a depth-by-depth convolution module and a 1 × 1 convolution layer. Since the number of channels in the correlation feature map aligns with the input feature maps in our network, we retain only the depth-by-depth convolution module in the depthwise cross-correlation.
We observe a phenomenon in the visual analysis of the depth-by-depth convolution module output: objects belonging to the same category exhibit strong activation patterns on specific channels, while the activations of the other channels are suppressed. The spatial inhibition effect has also been observed in neuroscience. The response map directly impacts the precision of subsequent center-point localization prediction and the pixels with spatial suppression effects are more important; thus, we enhance the localization precision by focusing on these pixels.
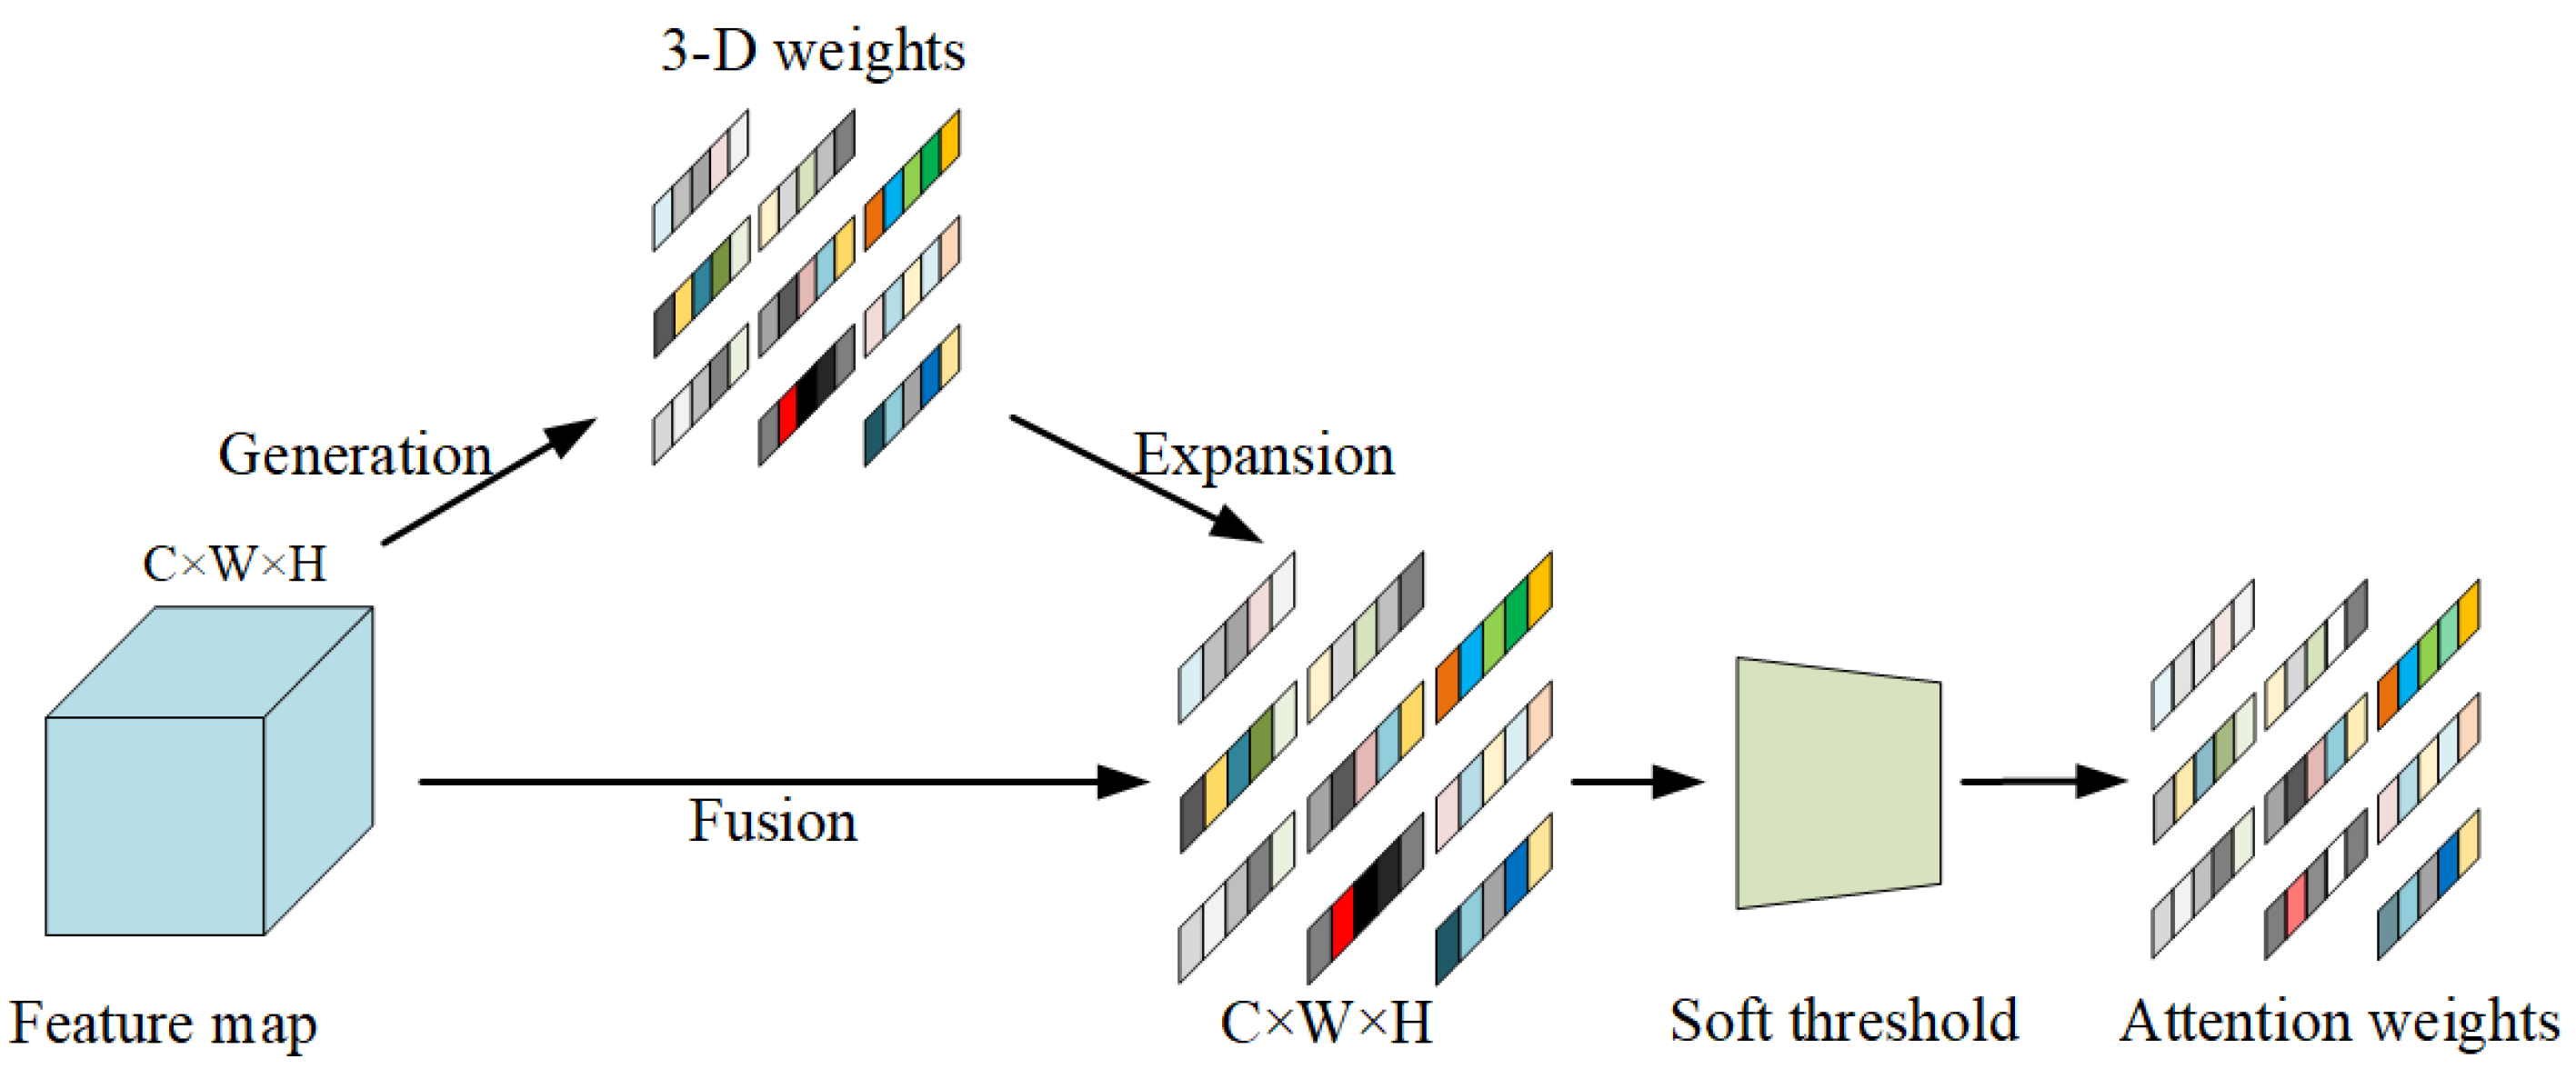
According to the above analysis and inspired by [40], we propose the adaptive shrinkage attention module, a cross-correlation scheme that combines depth-by-depth convolution with an adaptive shrinkage attention module. As Figure 4 shows, our module jointly considers channel information and location information, generating uniform 3D attention weights without additional parameters. By measuring the linear separability of different neurons within the same channel, the module treats pixels in the feature map as neurons and defines the following minimum energy function:
e p * = 4 ( σ ^ 2 + λ ) ( p u ^ ) 2 + 2 σ ^ 2 + 2 λ ,
where u ^ = 1 N 1 i = 1 N 1 x i , σ ^ 2 = 1 N 1 i = 1 N 1 ( x i u ^ ) 2 . p represents each pixel of the correlation feature map and x i represents the values of the other pixels. In addition, λ is a hyperparameter for the regularization term, which we set as λ = 0.0001 . Equation (2) indicates that lower energy corresponds to stronger spatial suppression effects and greater importance. According to the definition of the attention mechanism, we limit the range of the weight values; the pixel weight corresponding to the minimum energy function can be formulated as
X ˜ = sigmoid ( 1 E ) × X ,
where E denotes the minimum energy weight. X ˜ represents the output feature map. Furthermore, to mitigate the influence of background clutter and regions with similar feature objects, the module applies a soft threshold operation to the generated attention weights. Through training, the adaptive shrinkage attention module highlights the regions that contribute the most to the final prediction and effectively inhibits the activation of other channels, improving the localization precision.

2.4.3. Center-Point Localization

Figure 2 shows that the center-point localization network comprises a keypoint location module and an offset prediction module. Both modules receive features from the output of the adaptive shrinkage cross-correlation. The keypoint location module consists of a center-point location branch and a corner-point location branch. These branches generate a center-point heatmap p w × h × 1 c e n t e r and a corner-point heatmap p w × h × 4 c o r n e r , respectively, predicting the positions of the center point and corner points. Moreover, the offset prediction module outputs a center-offset heatmap p w × h × 2 o f f s e t to predict the offset of the refined object center point. We adopt a structure of three deconvolution layers followed by one convolutional layer on the detection head of each branch to ensure the prediction precision. The specific network parameters are provided in Table 1. Batch normalization and rectified linear unit (ReLU) activation functions are applied after each deconvolution layer.
We can map each location on the input search image onto the predicted heatmap. The corresponding coordinates are denoted as
c h m = x r e f w r e f 2 + w 2 , y r e f h r e f 2 + h 2 T ,
where x r e f and y r e f represent the locations on the input search image. w, h, w r e f and h r e f represent the width and height of the output heatmap and the input search image, respectively. In the center-point heatmap, the value at each location represents the probability that the corresponding input location is predicted to be the object. In the corner-point heatmap, the 4D vector at each location represents the probability that the corresponding input location is predicted to be the four corner points of the object. In the center-offset map, the 2D vector at each location represents the deviation error in the x and y directions caused by the stride. As Section 3.1.2 shows, the network outputs the final location result after adjusting the output of the center-point localization branch based on the other two branches.

2.4.4. Ground Truth and Loss

Since the center point, corner points and offset of the object are all represented based on points, the location on the heatmap corresponding to the object is considered a positive sample. In contrast, all other positions are considered negative samples. We calibrate the heatmap using a 2D Gaussian distribution to address the imbalance between positive and negative samples and control the proportion of negative samples in the loss function, and we calibrate the heatmap using a 2D Gaussian distribution:
p h m * = exp x x h m 2 + y y h m 2 2 σ p 2 .
Here, σ is a hyperparameter related to the object size, and  p h m * represents the ground-truth heatmap label for each branch. Let p h m be the predicted heatmap score. The keypoint location module employs a modified focal loss as the loss function, given by
L = x , y p x , y p h m p x , y * p h m * ( 1 p x , y ) α log p x , y p x , y * = 1 1 p x , y * β p x , y α log 1 p x , y o t h e r w i s e ,
where α and β are adjustable hyperparameters. In our experiments, we set α = 2 and β = 4 . Let L c e n and L c o r denote the losses of the center-point location branch and the corner-point location branch, respectively.
The localization may lose some precision when mapping from a lower-resolution heatmap to the input search image due to operations such as dimensionality lifting. To compensate for the discretization error caused by the network stride, we introduce the offset prediction module. The center offset on the heatmap can be calculated as
o p * = ( x c x c , y c y c ) ,
where o p * is the center offset and · represents the floor operation. We use the smooth L 1 Loss at the center offset:
L o f f = 1 N N = 1 N S m o o t h L 1 L o s s ( o p * , o p ) ,
where o p * and o p represent the offsets of the ground truth and the network prediction, respectively. Only the offset prediction for the location of the object center point is considered; all other locations are ignored. Thus, the overall loss is optimized as
L = λ 1 L c e n + λ 2 L c o r + λ 3 L o f f ,
where λ 1 , λ 2 and λ 3 are the hyperparameters that regulate the balance of each task. In our experiments, we set λ 1 = 1 , λ 2 = 1 and λ 3 = 1 and carry out ablation experiments with different weights, as described in Section 3.3.6.
Finally, we summarize the proposed method in Algorithm 1.
Algorithm 1 Center-Point Localization
 Input:
initial template image T; search image S;
 Output:
template matching localization results and scores { p final , P final } ;
 1:
{ φ ( T ) } l = 3 5 T # extract features by Siamese network backbone;
 2:
{ φ ( S ) } l = 3 5 S # extract features by Siamese network backbone;
 3:
R← { φ ( S ) } l = 3 5 * { φ ( T ) } l = 3 5 # depthwise adaptive shrinkage cross-correlation;
 4:
{ p cen , P cen } C e n t e r L o c a t e { R } # center-point location branch;
 5:
{ t , l , b , r } C o r n e r L o c a t e { R } # corner-point location branch;
 6:
{ p cor , P cor } P o s t P r o c e s s i n g { t , l , b , r } # corner-point location branch;
 7:
o p O f f s e t { R } # offset prediction module;
 8:
{ p opt , P final } R e f i n e { p cen , p cor } # refine the center point using Equation (9);
 9:
p final A d j u s t { p opt , o p } # adjust the center point using Equation (5);
10:
return  { p final , P final }

3. Results

3.1. Implementation Details

3.1.1. Training

We initialize the backbone of the Siamese network with the pretrained ResNet-50 model on ImageNet and freeze the parameters in the first four layers. We sample pairs of template images and search images from the GOT-10K, ImageNet VID, ImageNet DET and COCO datasets to create the training dataset. The size of the template images is set to 127 × 127 pixels, and the size of the search images is set to 255 × 255 pixels. We add random offsets when sampling the search images to prevent the network from biasing the response toward the image center during training. We optimize the training using stochastic gradient descent (SGD) on four GPUs simultaneously, with a minibatch size of 32 pairs. The model is trained for a total of 20 epochs. In the first 5 epochs, the learning rate increases from 0.001 to 0.005 at equal intervals, while, in the subsequent 15 epochs, the learning rate decays exponentially from 0.005 to 0.0005. We freeze the parameters of the backbone network during the first 10 epochs, and, in the remaining 10 epochs, we train the entire network end-to-end. The weight decay and momentum are set to 0.0001 and 0.9, respectively.

3.1.2. Testing

During the test phase, the model takes image pairs of any size as input. The output consists of the center-point heatmap, corner-point heatmap and center offset with their corresponding confidence scores. We use the location with the highest confidence score on the center-point heatmap as the initial position of the predicted center point. Then, we refine the initial position by identifying the location with the highest confidence scores among the four channels of the corner-point heatmap, as described in Equation (10), where ω is a hyperparameter related to the importance of the center point. In our experiments, we set ω = 0.9 . We adopt the bilinear feature interpolation method, as shown in Figure 1d, to accurately obtain the confidence scores of the center point obtained from the four corner points. Finally, we determine the final position and score of the center point in the search image with the adjustment of the center offset.
p o p t = ( 1 ω ) p cor + ω p c e n .

3.1.3. Evaluation Datasets

We evaluate our method on the standard OTB template matching dataset [42]. This dataset consists of 105 template image pairs collected from 35 annotated color videos, which encompass various challenges encountered in practical applications, such as scale variations, illumination changes, occlusion, complex deformations and in-plane/out-of-plane rotations. Each image pair consists of a template image with annotations (frame f) and a search image (frame f + 20 ) randomly selected from the videos.
We create a dataset named Hard350 and evaluate our method to assess the performance of the template matching method in a practical application scenario. We use a DJI unmanned ariel vehicle (UAV) to collect infrared and visible light videos for common application objects such as buildings, bridges and vehicles, covering different weather conditions, including sunny, cloudy, light rain and haze. During the data collection process, we actively control the UAV to capture the same object from different angles and scales to simulate various challenges of template matching. Specifically, we select 10 pairs of infrared and visible light videos for 10 different objects in all videos. From each video sequence, we select 10 pairs of images that exhibit variations in rotation, viewing angle, occlusion and heterogeneity. For each image pair, we apply three random offsets to the center location when selecting the search image, resulting in a total of 300 samples. Additionally, considering the limited inherent scale differences between the images, we randomly select 5 images from each video sequence and create image pairs by scaling one image up to 1.5 times its size. We also apply random offsets to the center location of the search image in each pair, resulting in a total of 50 test samples. The combined data from these two sets form the final test dataset, which consists of 350 samples.

3.1.4. Evaluation Metrics

Since our method completely disregards the prediction of the object bounding box and predicts only the object center point, we use the mean center error (MCE) and success rate (SR) to evaluate the performance of the template matching method on OTB and Hard350.
We use the center error (CE) as the evaluation metric for a single sample. The MCE is defined as the mean CE of all image pairs. SR5 and SR10 are defined as the ratios of successfully recognized samples to the total number of test samples, where recognition is considered successful if the CE is less than 5 and 10, respectively. CE is given by the following formula:
C E = ( x p x g ) 2 + ( y p y g ) 2 ,
where ( x p , y p ) and ( x g , y g ) represent the predicted center position and the ground-truth center position of the template in the search image, respectively.

3.2. Comparison to State of the Art

We compare our method with state-of-the-art template matching methods on the standard template matching dataset OTB and the proposed dataset Hard350.

3.2.1. Quantitative Evaluation

OTB. We evaluate the proposed method on the OTB dataset. Table 2 shows the MCE and SR of our method compared to SSD, SAD, NCC, BBS, DDIS, QATM and a robust Siamese network-based template matching method (RSTM [1]). Our method outperforms the other methods on this dataset. The advantages of our method stem from the proposed simple yet effective design of the detection head network. Specifically, compared to the second-best-performing method, our method reduces the MCE value by 8.928 pixels and improves the SR5 and SR10 scores by 29.5 and 29.5 points, respectively, demonstrating better robustness and accuracy. These results indicate that our center-point localization subnetwork can effectively integrate prior bounding box information and center point information to provide more accurate and efficient information for template matching object localization.
Hard350. We evaluate our method on the Hard350 dataset to further validate the efficacy of our method in practical applications. In this experiment, we compare our method with a range of state-of-the-art template matching methods, including SSD, SAD, NCC, BBS, DDIS, QATM and RSTM. Table 2 shows the MCE and SR of the compared methods. The proposed method ranks first in terms of both the MCE and the SR. Compared to the second-ranked method, our method reduces the MCE value by 1.196 pixels and improves the SR5 and SR10 scores by 1.1 points and 6.9 points, respectively. Notably, this dataset encompasses different practical application scenarios. Therefore, the results of the experiment demonstrate that our template matching method can achieve excellent performance in practical application scenarios.

3.2.2. Qualitative Evaluation

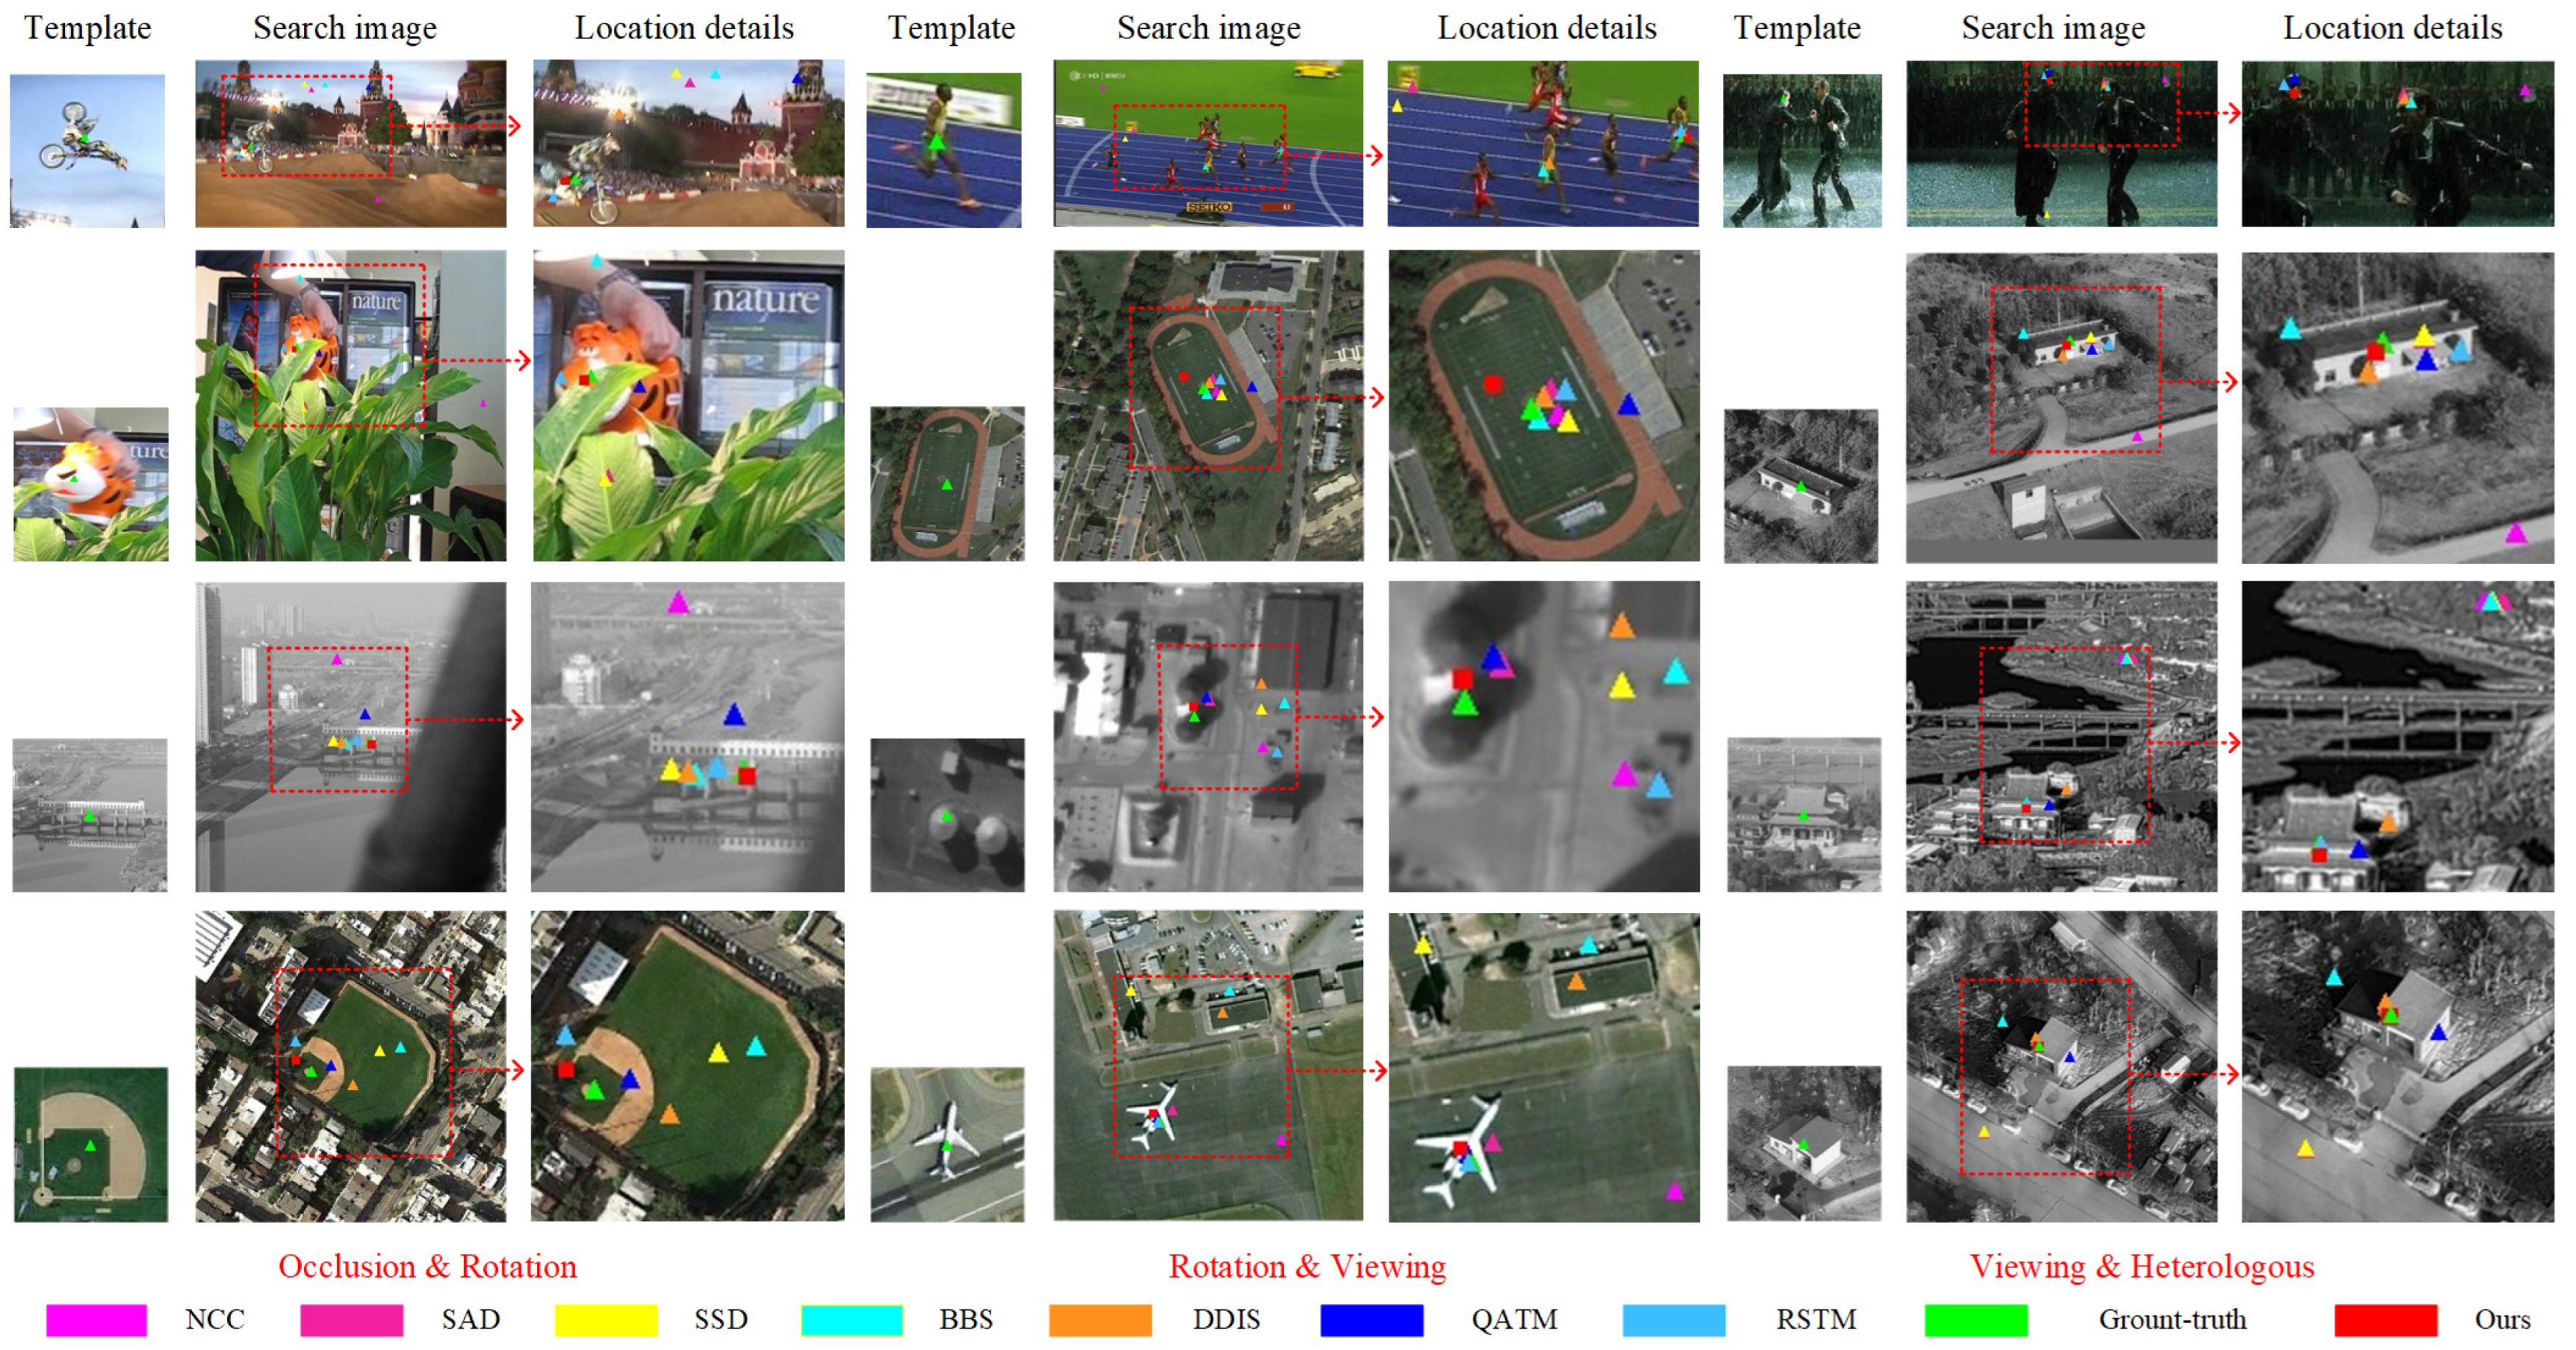
In this experiment, we select four challenging sequences from the OTB dataset (i.e., bolt, motor-rolling, matrix and tiger1), four challenging sequences from the Hard350 dataset (i.e., house, factory, attic, bridge) and four pairs of challenging remote sensing images on the web, which include rotation, occlusion, heterogeneous images, viewing angle differences, similar objects and lighting variations.
Figure 5 shows the qualitative evaluation results of our method, the ground truth and the other seven methods. The ground truth is the center point position coordinates of the template object on the search image, obtained from the annotation file in the OTB public dataset and the SEN1-2 dataset and annotated by professional tools in the Hard350 dataset. In the bolt sequence, due to interference from similar athletes, all methods except QATM, RSTM and our method fail to accurately locate the object. In the motor-rolling sequence, only RSTM and our method accurately locate the object due to its rotational deformation. In the attic sequence, some methods (NCC, SAD, SSD and BBS) fail to locate the object because the template and search images come from visible light and infrared videos, respectively. In the bridge sequence, a small portion of the bridge is occluded by other objects, resulting in decreased localization precision for other methods. In the house and factory sequences, despite some methods being able to locate the object, only our method maintains higher accuracy due to changes in viewing angle. For the matrix and tiger1 sequences, the other five methods fail to recognize the object due to lighting variations, and only QATM, RSTM and our method can accurately locate the center point of the object. It is evident that our method achieves better performance in complex scenes.
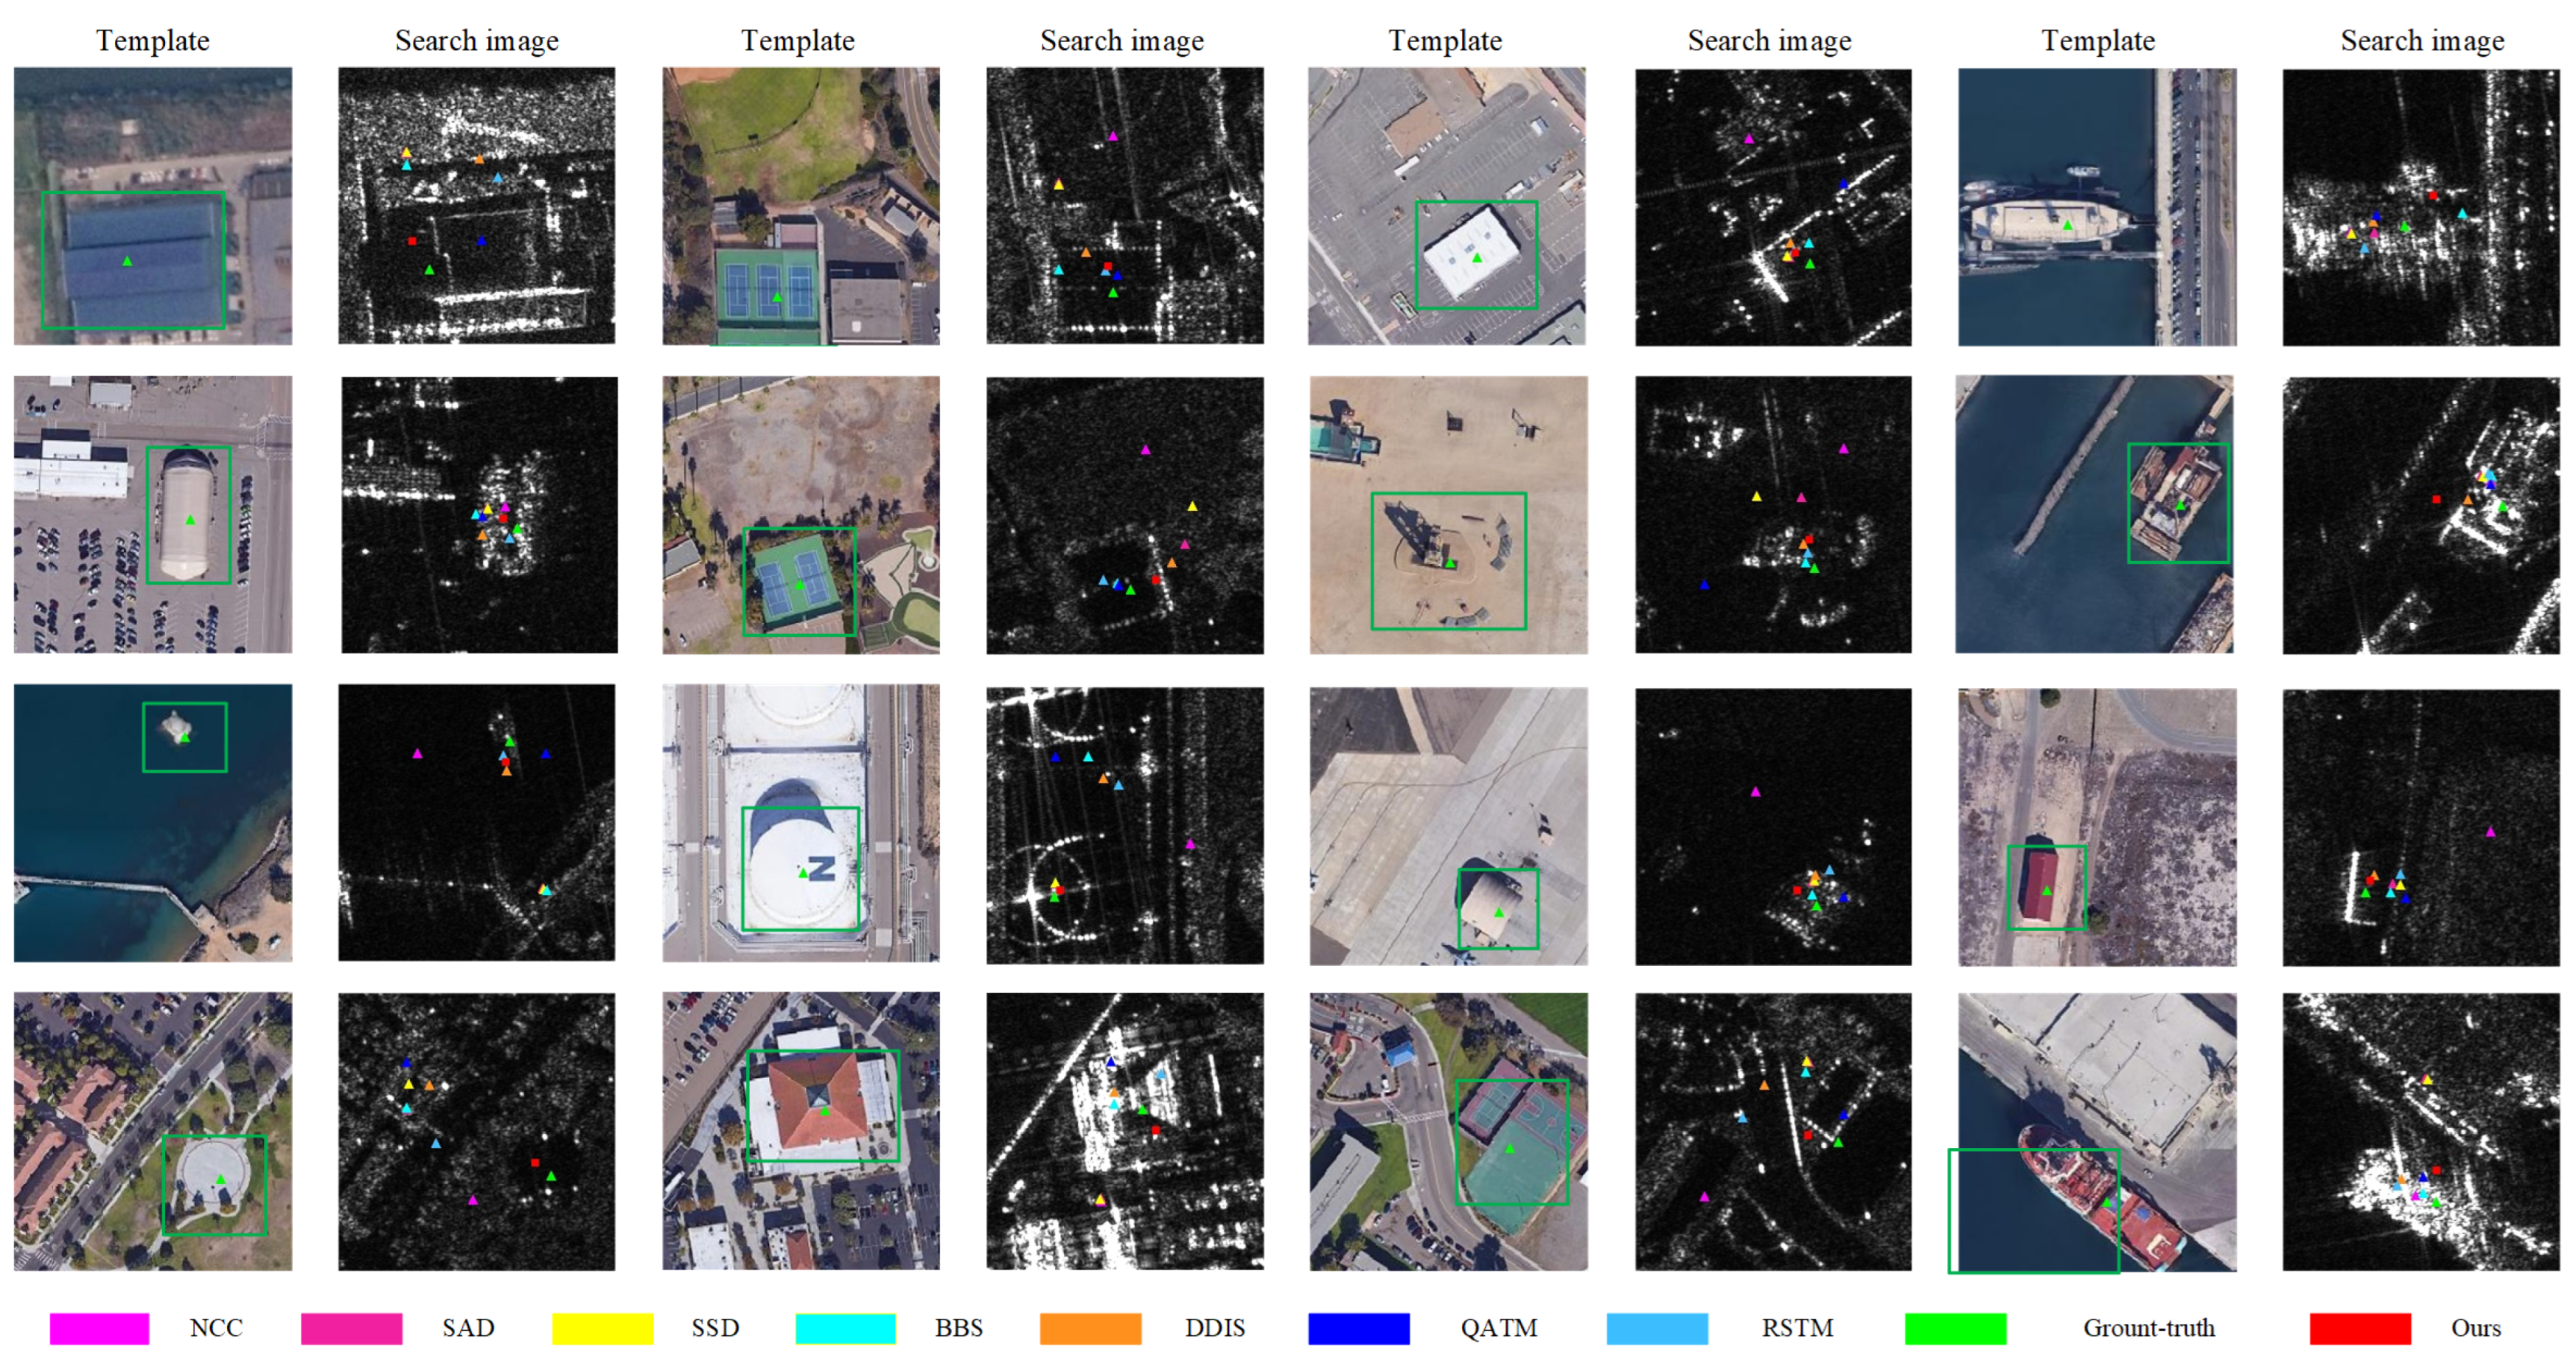
In addition, we select some multimodal remote sensing image pairs (consisting of SAR images and optical images) from the SEN1-2 dataset [43], and the results are shown in Figure 6. The figure shows that our method maintains good performance when dealing with multimodal images and small target images.

3.3. Ablation Study

In this section, we first study the impact of the proposed feature concatenation modules, adaptive shrinkage cross-correlation module and center-point localization module on the performance of our method. Next, we investigate the contributions of the fine-tuning scheme, multilevel feature concatenation modules, adaptive shrinkage attention module and detection head branch to the overall matching and localization performance. Finally, we perform a sensitivity analysis on the weight parameters of the keypoint location module in our final predicted position (Equation (10)). All ablation experiments are conducted on the OTB dataset. However, similar results can be obtained on the Hard350 dataset.

3.3.1. Ablation Study on Network Framework

We use the backbone network without feature concatenation modules, depthwise cross-correlation without an adaptive shrinkage attention module and the detection head with only the center-point detection branch as the baseline to evaluate the impact of the proposed three modules on the performance of the overall network. As Table 3 shows, when each of the three modules is individually added to the baseline, the localization precision of the model does not reflect good performance. However, when the respective additional modules are incorporated, the performance improves. When the baseline is combined with all three modules, the model achieves the best performance, with an MCE of only 5.263 pixels and an SR10 of 92.4 points, which indicates that all three modules contribute to our method.

3.3.2. Ablation Study on the Fine-Tuning Scheme

In this experiment, we freeze the weights of the first two layers of the pretrained ResNet-50 model, as we consider them to capture general features related to template matching methods to explore the impact of fine-tuning layers in pretrained models on feature extraction for the object. As Table 4 shows, when fine-tuning the layers, including layer 3, the network performance significantly decreases, indicating that the features extracted by the network become specific to the training dataset, reducing the generalization ability and robustness of the model. However, when fine-tuning layers 4 and 5, the performance of the network remains similar, and the best performance is achieved when only layer 5 is fine-tuned. This validates the rationale of our fine-tuning scheme for pretrained models, as it not only improves the generalization ability and convergence of the model but also prevents overfitting.

3.3.3. Ablation Study on Feature Concatenation Modules

The output of the Siamese network backbone combines feature maps generated by multiple convolutional layers. We study the performance of both a single-layer feature output and multilevel feature concatenation module output. As Table 5 shows, when the output only contains features from a single layer, conv4 performs the best. In contrast, the performance decreases for shallower layers. When the output fuses two layers of features, all fusion approaches improve the performance compared to the single-layer feature output, with conv4 and conv5 fusion being most effective. When three layers of features are fused, our method achieves the best performance, with a decrease of 0.668 pixels in the MCE compared to the single-layer feature output.

3.3.4. Ablation Study on the Adaptive Shrinkage Attention Module

We compare the proposed adaptive shrinkage attention module with the depthwise cross-correlation method to investigate its role in the adaptive shrinkage cross-correlation module. As Table 5 shows, after using adaptive shrinkage cross-correlation, the MCE decreases by 1.089 pixels. This is because the adaptive shrinkage attention module allows the subsequent center-point localization module to focus more on the channels and regions with higher responses in the relevant feature maps.

3.3.5. Ablation Study on the Detection Head Branch

We conduct ablation experiments by combining the center-point localization branch with each of these two branches separately to study the contributions of the corner-point localization branch and the center-point offset prediction branch. As Table 5 shows, when only the corner-point localization branch or the center-point offset prediction branch is added, the performance of the method improves; however, the former achieves a larger decrease in the MCE by 0.587 pixels compared to the latter. When both branches are added to the center-point localization network, the model achieves the best performance, with MCE values of 5.263 pixels on the OTB dataset. This validates the effectiveness of the corner-point localization branch in correcting the location results of the center-point localization branch. It also demonstrates that the center-point offset prediction branch can effectively mitigate the influence of the network stride on the localization results, improving the localization precision and SR of the model.

3.3.6. Parameter Sensitivity Analysis

We test different weights (in Equation (9)) on OTB to study the impact of different weights in the multitask loss function on the model performance. As Table 6 shows, the MCE does not change significantly with the change in weight; the model achieves the best performance when λ 1 , λ 2 and λ 3 are set to 1. This indicates that the proposed method is not sensitive to small changes in the multitask weight values. It also suggests that we can simply allocate uniform multitask weights as the loss function to train the model.
In addition, we test various values (in Equation (10)) to explore the effect of the center-point location branch under different weighting values. As Table 7 shows, as ω changes from 0 to 0.9, the MCE of our method gradually decreases. When ω is set to 0.9, the model performs the best, with MCE, SR5 and SR10 values of 5.236 pixels, 79 points and 92.4 points, respectively. However, as ω continues to increase, the performance of our method decreases. When ω is set to 0 or 1, which means that the final localization results will only rely on the outputs of either the corner localization branch or the center-point localization branch, our method does not perform well. This indicates the importance of both the center-point location branch and the corner-point location branch in accurate prediction. It also validates that our fusion scheme for the prediction of the center point improves the precision of template matching localization.

4. Discussion

4.1. The Advantages of Our Method

Our method enhances the precision of the template localization of the object center point. The quantitative experiments on the public dataset OTB and the ablation studies demonstrate that our method can fully leverage the keypoints of the object to refine the center-point position and further accurately locate the object by predicting the offset, thereby improving the precision of template matching. Additionally, the results of the quantitative experiments on the proposed Hard350 dataset indicate that our method can maintain high localization accuracy in practical application scenarios.
Our method exhibits greater robustness in handling image variations. The qualitative experiments on the OTB, Hard350 and SEN1-2 datasets show that the proposed method can accurately locate objects in challenging situations, such as those with viewpoint differences, scale variations, occlusion, rotation variations and image heterogeneity. The ablation studies on the encoder–decoder structure in the feature extraction network and the adaptive shrinkage attention module indicate that the two designs effectively extract multi-scale features from the input images and reduce the impact of similar features on the matching results, thereby enhancing the robustness to image variations.
Furthermore, our method is more lightweight. In the design of the feature extraction network, we adjust the network stride to 8 to achieve higher localization accuracy. However, in the feature extraction network design of SiamRPN++, adjusting the network stride to 8 results in a model computation rate of 4.5 × 10 10 FLOPs, while ours is only 5.4 × 10 9 FLOPs. As shown in Table 8, we also compare the running times of other methods on the OTB dataset. Since our method requires the prediction and integration of information from multiple keypoints, it is not the fastest in terms of running time. However, compared to most methods, our method maintains a relatively fast running speed while ensuring the highest accuracy.

4.2. Limitations and Potential Improvements

Although our method achieves impressive performance compared to the state-of-the-art template matching methods, we observe in the experiments that it does not perform well under severe occlusion, which still poses challenges for template matching. Our method can handle scenes with a small amount of occlusion, but it fails to accurately locate the object in scenes with severe occlusion as we do not introduce a module in the network to address occlusion.
At present, our method is trained based on public datasets for object tracking and object recognition tasks. Consequently, the method exhibits superior template matching performance in visible light image scenarios compared to the performance in infrared and SAR image scenarios. Therefore, a large number of image data from infrared and SAR images in application scenarios can be used to train the model to improve the performance in multiple application scenarios.
In addition, we have moderately reduced the parameter count and computational load of the model, while ensuring the localization accuracy of our method. However, more effective and direct methods can still be employed to improve the computational efficiency in terms of the lightweight design, including model compression, pruning, knowledge distillation and other techniques.

5. Conclusions

In this paper, we propose an end-to-end template matching method based on a fully convolutional Siamese network, transforming the template matching task into a center-point localization task and completely disregarding all attributes except for the center point during object localization. We propose a novel feature extraction network, which reduces the computational complexity while ensuring high localization accuracy. Upon observing that objects of the same category exhibit strong activation patterns in specific channels, we design an adaptive shrinkage attention module and combine the module with depth-by-depth cross-correlation operations to improve the localization precision. Additionally, we employ a keypoint localization branch to assist the center-point localization branch in predicting the object, so as to fully utilize the prior information in the object keypoints. We also create a dataset to confirm the performance of the method in a practical application scenario. Extensive experiments on the public OTB and SEN1-2 and the proposed practical application dataset demonstrate that our method achieves state-of-the-art performance and can effectively operate in scenarios with viewpoint differences, partial occlusion and cluttered backgrounds.

Author Contributions

Conceptualization, J.Y. and Y.Z.; methodology, J.Y., Y.Z. and P.S.; software, J.Y.; validation, W.X. and S.B.; formal analysis, J.Y., Y.Z. and W.X.; investigation, J.Y. and Y.Z.; resources, Y.Z.; data curation, J.Y., W.X. and S.B.; writing—original draft preparation, J.Y.; writing—review and editing, Y.Z., W.X. and P.S.; visualization, J.Y. and Y.Z.; supervision, Y.Z., W.X. and P.S.; project administration, S.B.; funding acquisition, Y.Z. All authors have read and agreed to the published version of the manuscript.

Funding

This work was supported by the National Natural Science Foundation of China under Grant 62273353.

Data Availability Statement

The original data for the Hard350 dataset presented in the study are openly available in github at https://github.com/Burton123456/Hard350.git accessed on 30 July 2024.

Conflicts of Interest

The authors declare no conflict of interest.

References

  1. Ren, Q.; Zheng, Y.; Sun, P.; Xu, W.; Zhu, D.; Yang, D. A Robust and Accurate End-to-End Template Matching Method Based on the Siamese Network. IEEE Geosci. Remote Sens. Lett. 2022, 19, 1–5. [Google Scholar] [CrossRef]
  2. Martin-Lac, V.; Petit-Frere, J.; Le Caillec, J.M. A Generic, Multimodal Geospatial Data Alignment System for Aerial Navigation. Remote Sens. 2023, 15, 4510. [Google Scholar] [CrossRef]
  3. Hui, T.; Xu, Y.; Zhou, Q.; Yuan, C.; Rasol, J. Cross-Viewpoint Template Matching Based on Heterogeneous Feature Alignment and Pixel-Wise Consensus for Air- and Space-Based Platforms. Remote Sens. 2023, 15, 2426. [Google Scholar] [CrossRef]
  4. Hikosaka, S.; Tonooka, H. Image-to-Image Subpixel Registration Based on Template Matching of Road Network Extracted by Deep Learning. Remote Sens. 2022, 14, 5360. [Google Scholar] [CrossRef]
  5. Felzenszwalb, P.F.; Girshick, R.B.; McAllester, D.; Ramanan, D. Object Detection with Discriminatively Trained Part-Based Models. IEEE Trans. Pattern Anal. Mach. Intell. 2010, 32, 1627–1645. [Google Scholar] [CrossRef] [PubMed]
  6. Lin, Z.; Davis, L.S.; Doermann, D.; DeMenthon, D. Hierarchical Part-Template Matching for Human Detection and Segmentation. In Proceedings of the 2007 IEEE 11th International Conference on Computer Vision, Rio de Janeiro, Brazil, 14–21 October 2007; pp. 1–8. [Google Scholar] [CrossRef]
  7. Zheng, Y.; Sun, P.; Zhou, Z.; Xu, W.; Ren, Q. ADT-Det: Adaptive Dynamic Refined Single-Stage Transformer Detector for Arbitrary-Oriented Object Detection in Satellite Optical Imagery. Remote Sens. 2021, 13, 2623. [Google Scholar] [CrossRef]
  8. Cen, M.; Jung, C. Fully Convolutional Siamese Fusion Networks for Object Tracking. In Proceedings of the 2018 25th IEEE International Conference on Image Processing (ICIP), Athens, Greece, 7–10 October 2018; pp. 3718–3722. [Google Scholar] [CrossRef]
  9. Hou, B.; Cui, Y.; Ren, Z.; Li, Z.; Wang, S.; Jiao, L. Siamese Multi-Scale Adaptive Search Network for Remote Sensing Single-Object Tracking. Remote Sens. 2023, 15, 4359. [Google Scholar] [CrossRef]
  10. Zhang, T.; Liu, S.; Ahuja, N.; Yang, M.H.; Ghanem, B. Robust Visual Tracking Via Consistent Low-Rank Sparse Learning. Int. J. Comput. Vis. 2015, 111, 171–190. [Google Scholar] [CrossRef]
  11. Litjens, G.; Kooi, T.; Bejnordi, B.E.; Setio, A.A.A.; Ciompi, F.; Ghafoorian, M.; van der Laak, J.A.; van Ginneken, B.; Sánchez, C.I. A survey on deep learning in medical image analysis. Med. Image Anal. 2017, 42, 60–88. [Google Scholar] [CrossRef] [PubMed]
  12. Lowe, D. Object recognition from local scale-invariant features. In Proceedings of the Seventh IEEE International Conference on Computer Vision, Kerkyra, Greece, 20–27 September 1999; Volume 2, pp. 1150–1157. [Google Scholar] [CrossRef]
  13. Bay, H.; Ess, A.; Tuytelaars, T.; Van Gool, L. Speeded-Up Robust Features (SURF). Comput. Vis. Image Underst. 2008, 110, 346–359. [Google Scholar] [CrossRef]
  14. Rublee, E.; Rabaud, V.; Konolige, K.; Bradski, G. ORB: An efficient alternative to SIFT or SURF. In Proceedings of the 2011 International Conference on Computer Vision, Barcelona, Spain, 6–13 November 2011; pp. 2564–2571. [Google Scholar] [CrossRef]
  15. Dalal, N.; Triggs, B. Histograms of oriented gradients for human detection. In Proceedings of the 2005 IEEE Computer Society Conference on Computer Vision and Pattern Recognition (CVPR’05), San Diego, CA, USA, 20–25 June 2005; Volume 1, pp. 886–893. [Google Scholar] [CrossRef]
  16. Ojala, T.; Pietikainen, M.; Maenpaa, T. Multiresolution gray-scale and rotation invariant texture classification with local binary patterns. IEEE Trans. Pattern Anal. Mach. Intell. 2002, 24, 971–987. [Google Scholar] [CrossRef]
  17. Viola, P.; Jones, M. Rapid object detection using a boosted cascade of simple features. In Proceedings of the 2001 IEEE Computer Society Conference on Computer Vision and Pattern Recognition, CVPR 2001, Kauai, HI, USA, 8–14 December 2001; Volume 1, p. I. [Google Scholar] [CrossRef]
  18. Dekel, T.; Oron, S.; Rubinstein, M.; Avidan, S.; Freeman, W.T. Best-Buddies Similarity for robust template matching. In Proceedings of the 2015 IEEE Conference on Computer Vision and Pattern Recognition (CVPR), Boston, MA, USA, 7–12 June 2015; pp. 2021–2029. [Google Scholar] [CrossRef]
  19. Talmi, I.; Mechrez, R.; Zelnik-Manor, L. Template Matching with Deformable Diversity Similarity. In Proceedings of the 2017 IEEE Conference on Computer Vision and Pattern Recognition (CVPR), Honolulu, HI, USA, 21–26 July 2017; pp. 1311–1319. [Google Scholar] [CrossRef]
  20. Kat, R.; Jevnisek, R.; Avidan, S. Matching Pixels Using Co-occurrence Statistics. In Proceedings of the 2018 IEEE/CVF Conference on Computer Vision and Pattern Recognition, Salt Lake City, UT, USA, 18–23 June 2018; pp. 1751–1759. [Google Scholar] [CrossRef]
  21. Cheng, J.; Wu, Y.; AbdAlmageed, W.; Natarajan, P. QATM: Quality-Aware Template Matching for Deep Learning. In Proceedings of the 2019 IEEE/CVF Conference on Computer Vision and Pattern Recognition (CVPR), Long Beach, CA, USA, 15–20 June 2019; pp. 11545–11554. [Google Scholar] [CrossRef]
  22. Hou, B.; Ren, Z.; Zhao, W.; Wu, Q.; Jiao, L. Object Detection in High-Resolution Panchromatic Images Using Deep Models and Spatial Template Matching. IEEE Trans. Geosci. Remote Sens. 2020, 58, 956–970. [Google Scholar] [CrossRef]
  23. Mercier, J.P.; Garon, M.; Giguère, P.; Lalonde, J.F. Deep Template-based Object Instance Detection. In Proceedings of the 2021 IEEE Winter Conference on Applications of Computer Vision (WACV), Waikoloa, HI, USA, 3–8 January 2021; pp. 1506–1515. [Google Scholar] [CrossRef]
  24. Wu, W.; Xian, Y.; Su, J.; Ren, L. A Siamese Template Matching Method for SAR and Optical Image. IEEE Geosci. Remote Sens. Lett. 2022, 19, 1–5. [Google Scholar] [CrossRef]
  25. He, K.; Zhang, X.; Ren, S.; Sun, J. Deep Residual Learning for Image Recognition. In Proceedings of the 2016 IEEE Conference on Computer Vision and Pattern Recognition (CVPR), Las Vegas, NV, USA, 27–30 June 2016; pp. 770–778. [Google Scholar] [CrossRef]
  26. Ronneberger, O.; Fischer, P.; Brox, T. U-Net: Convolutional Networks for Biomedical Image Segmentation. In Medical Image Computing and Computer-Assisted Intervention—MICCAI 2015; Navab, N., Hornegger, J., Wells, W.M., Frangi, A.F., Eds.; Springer: Cham, Switzerland, 2015; pp. 234–241. [Google Scholar]
  27. Tian, Y.; Narasimhan, S.G. Globally Optimal Estimation of Nonrigid Image Distortion. Int. J. Comput. Vis. 2012, 98, 279–302. [Google Scholar] [CrossRef]
  28. Zhang, C.; Akashi, T. Fast Affine Template Matching over Galois Field. In Proceedings of the British Machine Vision Conference, Swansea, UK, 7–10 September 2015. [Google Scholar]
  29. Korman, S.; Reichman, D.; Tsur, G.; Avidan, S. FasT-Match: Fast Affine Template Matching. In Proceedings of the 2013 IEEE Conference on Computer Vision and Pattern Recognition, Portland, OR, USA, 23–28 June 2013; pp. 2331–2338. [Google Scholar] [CrossRef]
  30. Li, B.; Yan, J.; Wu, W.; Zhu, Z.; Hu, X. High Performance Visual Tracking with Siamese Region Proposal Network. In Proceedings of the 2018 IEEE/CVF Conference on Computer Vision and Pattern Recognition, Salt Lake City, UT, USA, 18–23 June 2018; pp. 8971–8980. [Google Scholar] [CrossRef]
  31. Li, B.; Wu, W.; Wang, Q.; Zhang, F.; Xing, J.; Yan, J. SiamRPN++: Evolution of Siamese Visual Tracking With Very Deep Networks. In Proceedings of the 2019 IEEE/CVF Conference on Computer Vision and Pattern Recognition (CVPR), Long Beach, CA, USA, 15–20 June 2019; pp. 4277–4286. [Google Scholar] [CrossRef]
  32. Tian, Z.; Shen, C.; Chen, H.; He, T. FCOS: Fully Convolutional One-Stage Object Detection. In Proceedings of the 2019 IEEE/CVF International Conference on Computer Vision (ICCV), Seoul, Republic of Korea, 27 October–2 November 2019; pp. 9626–9635. [Google Scholar] [CrossRef]
  33. Xu, Y.; Wang, Z.; Li, Z.; Yuan, Y.; Yu, G. SiamFC++: Towards Robust and Accurate Visual Tracking with Target Estimation Guidelines. Proc. AAAI Conf. Artif. Intell. 2020, 34, 12549–12556. [Google Scholar] [CrossRef]
  34. Guo, D.; Wang, J.; Cui, Y.; Wang, Z.; Chen, S. SiamCAR: Siamese Fully Convolutional Classification and Regression for Visual Tracking. In Proceedings of the 2020 IEEE/CVF Conference on Computer Vision and Pattern Recognition (CVPR), Seattle, WA, USA, 13–19 June 2020; pp. 6268–6276. [Google Scholar] [CrossRef]
  35. Chen, Z.; Zhong, B.; Li, G.; Zhang, S.; Ji, R.; Tang, Z.; Li, X. SiamBAN: Target-Aware Tracking With Siamese Box Adaptive Network. IEEE Trans. Pattern Anal. Mach. Intell. 2023, 45, 5158–5173. [Google Scholar] [CrossRef] [PubMed]
  36. Zhang, Z.; Peng, H.; Fu, J.; Li, B.; Hu, W. Ocean: Object-Aware Anchor-Free Tracking. In Computer Vision—ECCV 2020; Vedaldi, A., Bischof, H., Brox, T., Frahm, J.M., Eds.; Springer: Cham, Switzerland, 2020; pp. 771–787. [Google Scholar]
  37. Hu, J.; Shen, L.; Sun, G. Squeeze-and-Excitation Networks. In Proceedings of the 2018 IEEE/CVF Conference on Computer Vision and Pattern Recognition, Salt Lake City, UT, USA, 18–23 June 2018; pp. 7132–7141. [Google Scholar] [CrossRef]
  38. Woo, S.; Park, J.; Lee, J.Y.; Kweon, I.S. CBAM: Convolutional Block Attention Module; Springer: Cham, Switzerland, 2018. [Google Scholar]
  39. Park, J.; Woo, S.; Lee, J.Y.; Kweon, I.S. BAM: Bottleneck Attention Module. arXiv 2018, arXiv:1807.06514. [Google Scholar]
  40. Yang, L.; Zhang, R.Y.; Li, L.; Xie, X. SimAM: A Simple, Parameter-Free Attention Module for Convolutional Neural Networks. In Proceedings of the International Conference on Machine Learning, Online, 18–24 July 2021. [Google Scholar]
  41. Zhang, Z.; Peng, H. Deeper and Wider Siamese Networks for Real-Time Visual Tracking. In Proceedings of the 2019 IEEE/CVF Conference on Computer Vision and Pattern Recognition (CVPR), Long Beach, CA, USA, 15–20 June 2019; pp. 4586–4595. [Google Scholar] [CrossRef]
  42. Wu, Y.; Lim, J.; Yang, M.H. Online Object Tracking: A Benchmark. In Proceedings of the 2013 IEEE Conference on Computer Vision and Pattern Recognition, Portland, OR, USA, 23–28 June 2013; pp. 2411–2418. [Google Scholar] [CrossRef]
  43. Schmitt, M.; Hughes, L.H.; Zhu, X. The SEN1-2 Dataset for Deep Learning in SAR-Optical Data Fusion. arXiv 2018, arXiv:1807.01569. [Google Scholar] [CrossRef]
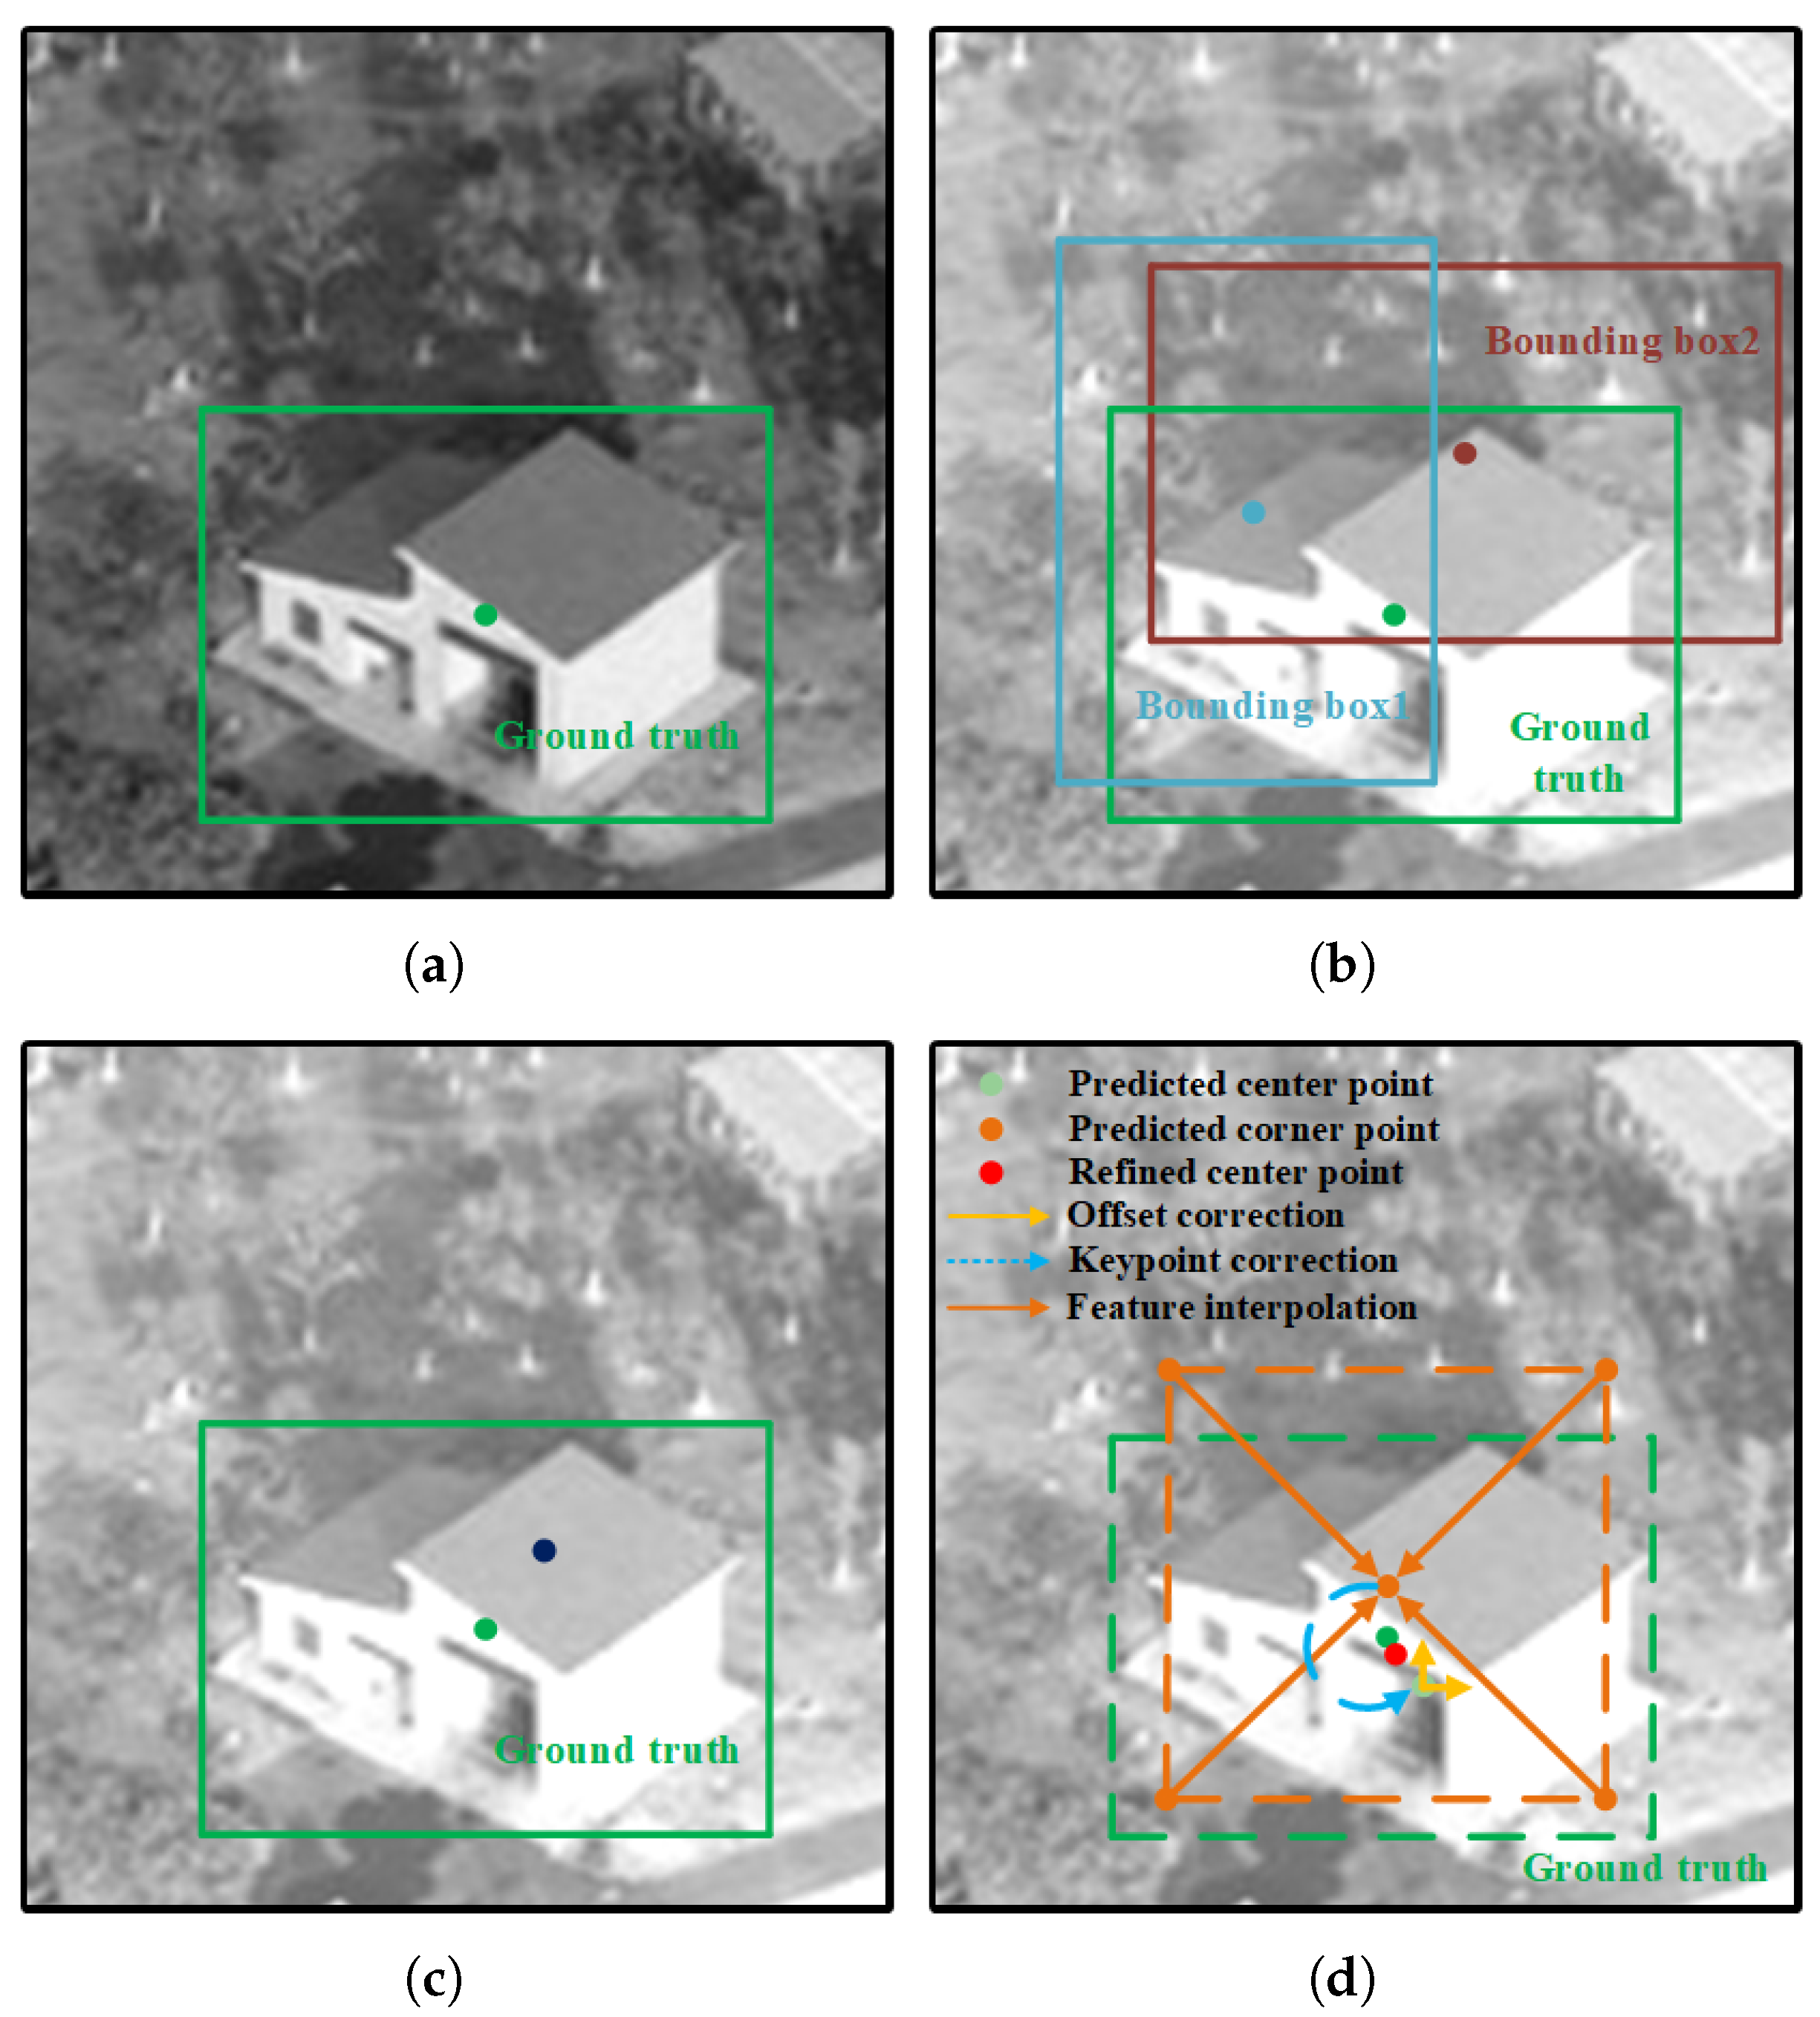
Figure 1. Template matching accuracy is strongly affected by anchor-based or anchor-free mechanisms. The anchor-based methods infer the matching result indirectly through bounding boxes, and the anchor-free method cannot effectively make use of the prior information in the anchor frame, resulting in low accuracy. Our method exploits both anchor-based and anchor-free methods, resulting in high accuracy. (a) Raw image. (b) Anchor-based. (c) Center point-based anchor-free. (d) Ours.
Remotesensing 16 02831 g001
Figure 2. Overview of the proposed template matching framework, which includes a Siamese network backbone followed by adaptive shrinkage cross-correlation and center-point localization. In the center-point localization, four keypoints in the anchor box modify the center point and output the final position after correcting the offset prediction module. The details of the refinement are shown in Figure 1d.
Remotesensing 16 02831 g002
Figure 3. The architecture of the Siamese network backbone. Inspired by the encoding–decoding structure, we maintain the same architecture of the ResNet-50 pretrained model, followed by the deconvolutional layers and the feature concatenation modules.
Remotesensing 16 02831 g003
Figure 4. Structure of the adaptive shrinkage attention module.
Remotesensing 16 02831 g004
Figure 5. Some challenging examples chosen from the OTB and Hard350 datasets and other challenging remote sensing images on the web, i.e., bolt, motor-rolling, matrix, tiger1, house, factory, attic, bridge.
Remotesensing 16 02831 g005
Figure 6. Some multimodal remote sensing image pairs (consisting of SAR images and optical images) from the SEN1-2 dataset.
Remotesensing 16 02831 g006
Table 1. The details of our backbone architecture.
Block Backbone Search Branch
Output Size
Template Branch
Output Size
conv1
max pool
conv2_x
conv3_x
conv4_x
conv5_x
ResNet50
pretrained model
8 × 84 × 4
decode53 × 3, 1288 × 84 × 4
decode4 [ 3 × 3   3 × 3 , s = 2 , d e c o n v 3 × 3   ] 16 × 16 8 × 8
decode3 [ 3 × 3   3 × 3 , s = 2 , d e c o n v 3 × 3   ] 32 × 32 16 × 16
xcorrcross-correlation17 × 17
deconv13 × 3, 128, s = 2 33 × 33
deconv23 × 3, 128, s = 2 65 × 65
deconv33 × 3, 128, s = 2 129 × 129
conv_1
conv_2
conv_3
3 × 3, 1
3 × 3, 1
3 × 3, 1
129 × 129
Table 2. Results of quantitative evaluation on the OTB and Hard350 datasets.
MethodOTBHard350
MCE SR5 SR10 MCE SR5 SR10
SSD71.9870.3620.41933.190.4290.589
NCC82.5790.3240.37139.3640.40.526
SAD73.8250.0670.12431.0620.4310.557
BBS38.490.490.6216.620.350.62
DDIS26.530.510.6913.890.30.54
QATM29.9670.5430.72412.420.1630.523
RSTM14.1910.4950.62911.1160.4890.751
Ours5.2630.790.9249.920.50.82
Table 3. Ablation study of the network framework on OTB. ‘Fusion’, ‘PFA’ and ‘Head’ represent feature concatenation modules after the ResNet-50 pretrained model, adaptive shrinkage cross-correlation and the overall head branch, respectively.
FusionPFAHeadMCESR5SR10
      7.1720.7430.895
      11.5970.40.667
      13.0860.3710.648
   6.0830.7620.914
   9.1760.7330.848
   11.9250.4290.648
5.2630.790.924
Table 4. Ablation study of the fine-tuning scheme on OTB. L3, L4 and L5 represent conv3, conv4 and conv5 of the ResNet-50 pretrained model, respectively.
L3L4L5MCESR5SR10
61.2690.0570.076
      45.270.1710.257
   39.8980.2190.371
   8.1190.7430.857
   7.9970.7240.857
      7.0530.7430.886
      5.2630.790.924
Table 5. Ablation study of the proposed method on OTB. D3, D4 and D5 represent decoder3, decoder4 and decoder5, respectively. ‘PFA’ represents adaptive shrinkage cross-correlation. ‘Center’, ‘Corner’ and ‘Offset’ represent the center-point location branch, the corner-point location branch and the offset prediction module, respectively.
D3D4D5PFACenterCornerOffsetMCE
               9.287
               7.317
               13.77
            7.506
            7.175
            7.023
         6.649
      6.083
   5.496
   5.745
5.263
Table 6. Results under different weighting values of the multitask loss function on OTB and Hard350.
λ 1 λ 2 λ 3 MCE
OTBHard350
0.51.01.07.2715.099
1.00.51.07.96211.589
1.01.00.57.99712.171
1.00.50.56.459.521
0.51.00.56.80810.964
0.50.51.06.3512.028
1.01.01.05.2639.92
Table 7. Results under different weighting values of the center-point location branch in the test phase on OTB.
ω 00.20.40.60.80.91
MCE10.2338.7337.2926.1615.3975.2635.404
SR50.3520.4480.5240.6380.7330.790.781
SR100.6480.7140.7810.8290.9140.9240.924
Table 8. Running speeds of different template matching methods on the OTB dataset.
MethodSSDNCCSADBBSDDISQATMRSTMOurs
Speed (s/pairs)1.4520.0042.17124.0802.7171.0940.0170.037
Disclaimer/Publisher’s Note: The statements, opinions and data contained in all publications are solely those of the individual author(s) and contributor(s) and not of MDPI and/or the editor(s). MDPI and/or the editor(s) disclaim responsibility for any injury to people or property resulting from any ideas, methods, instructions or products referred to in the content.