The Nonlinear Relationship and Synergistic Effects between Built Environment and Urban Vitality at the Neighborhood Scale: A Case Study of Guangzhou’s Central Urban Area
Abstract
1. Introduction
2. Materials and Methods
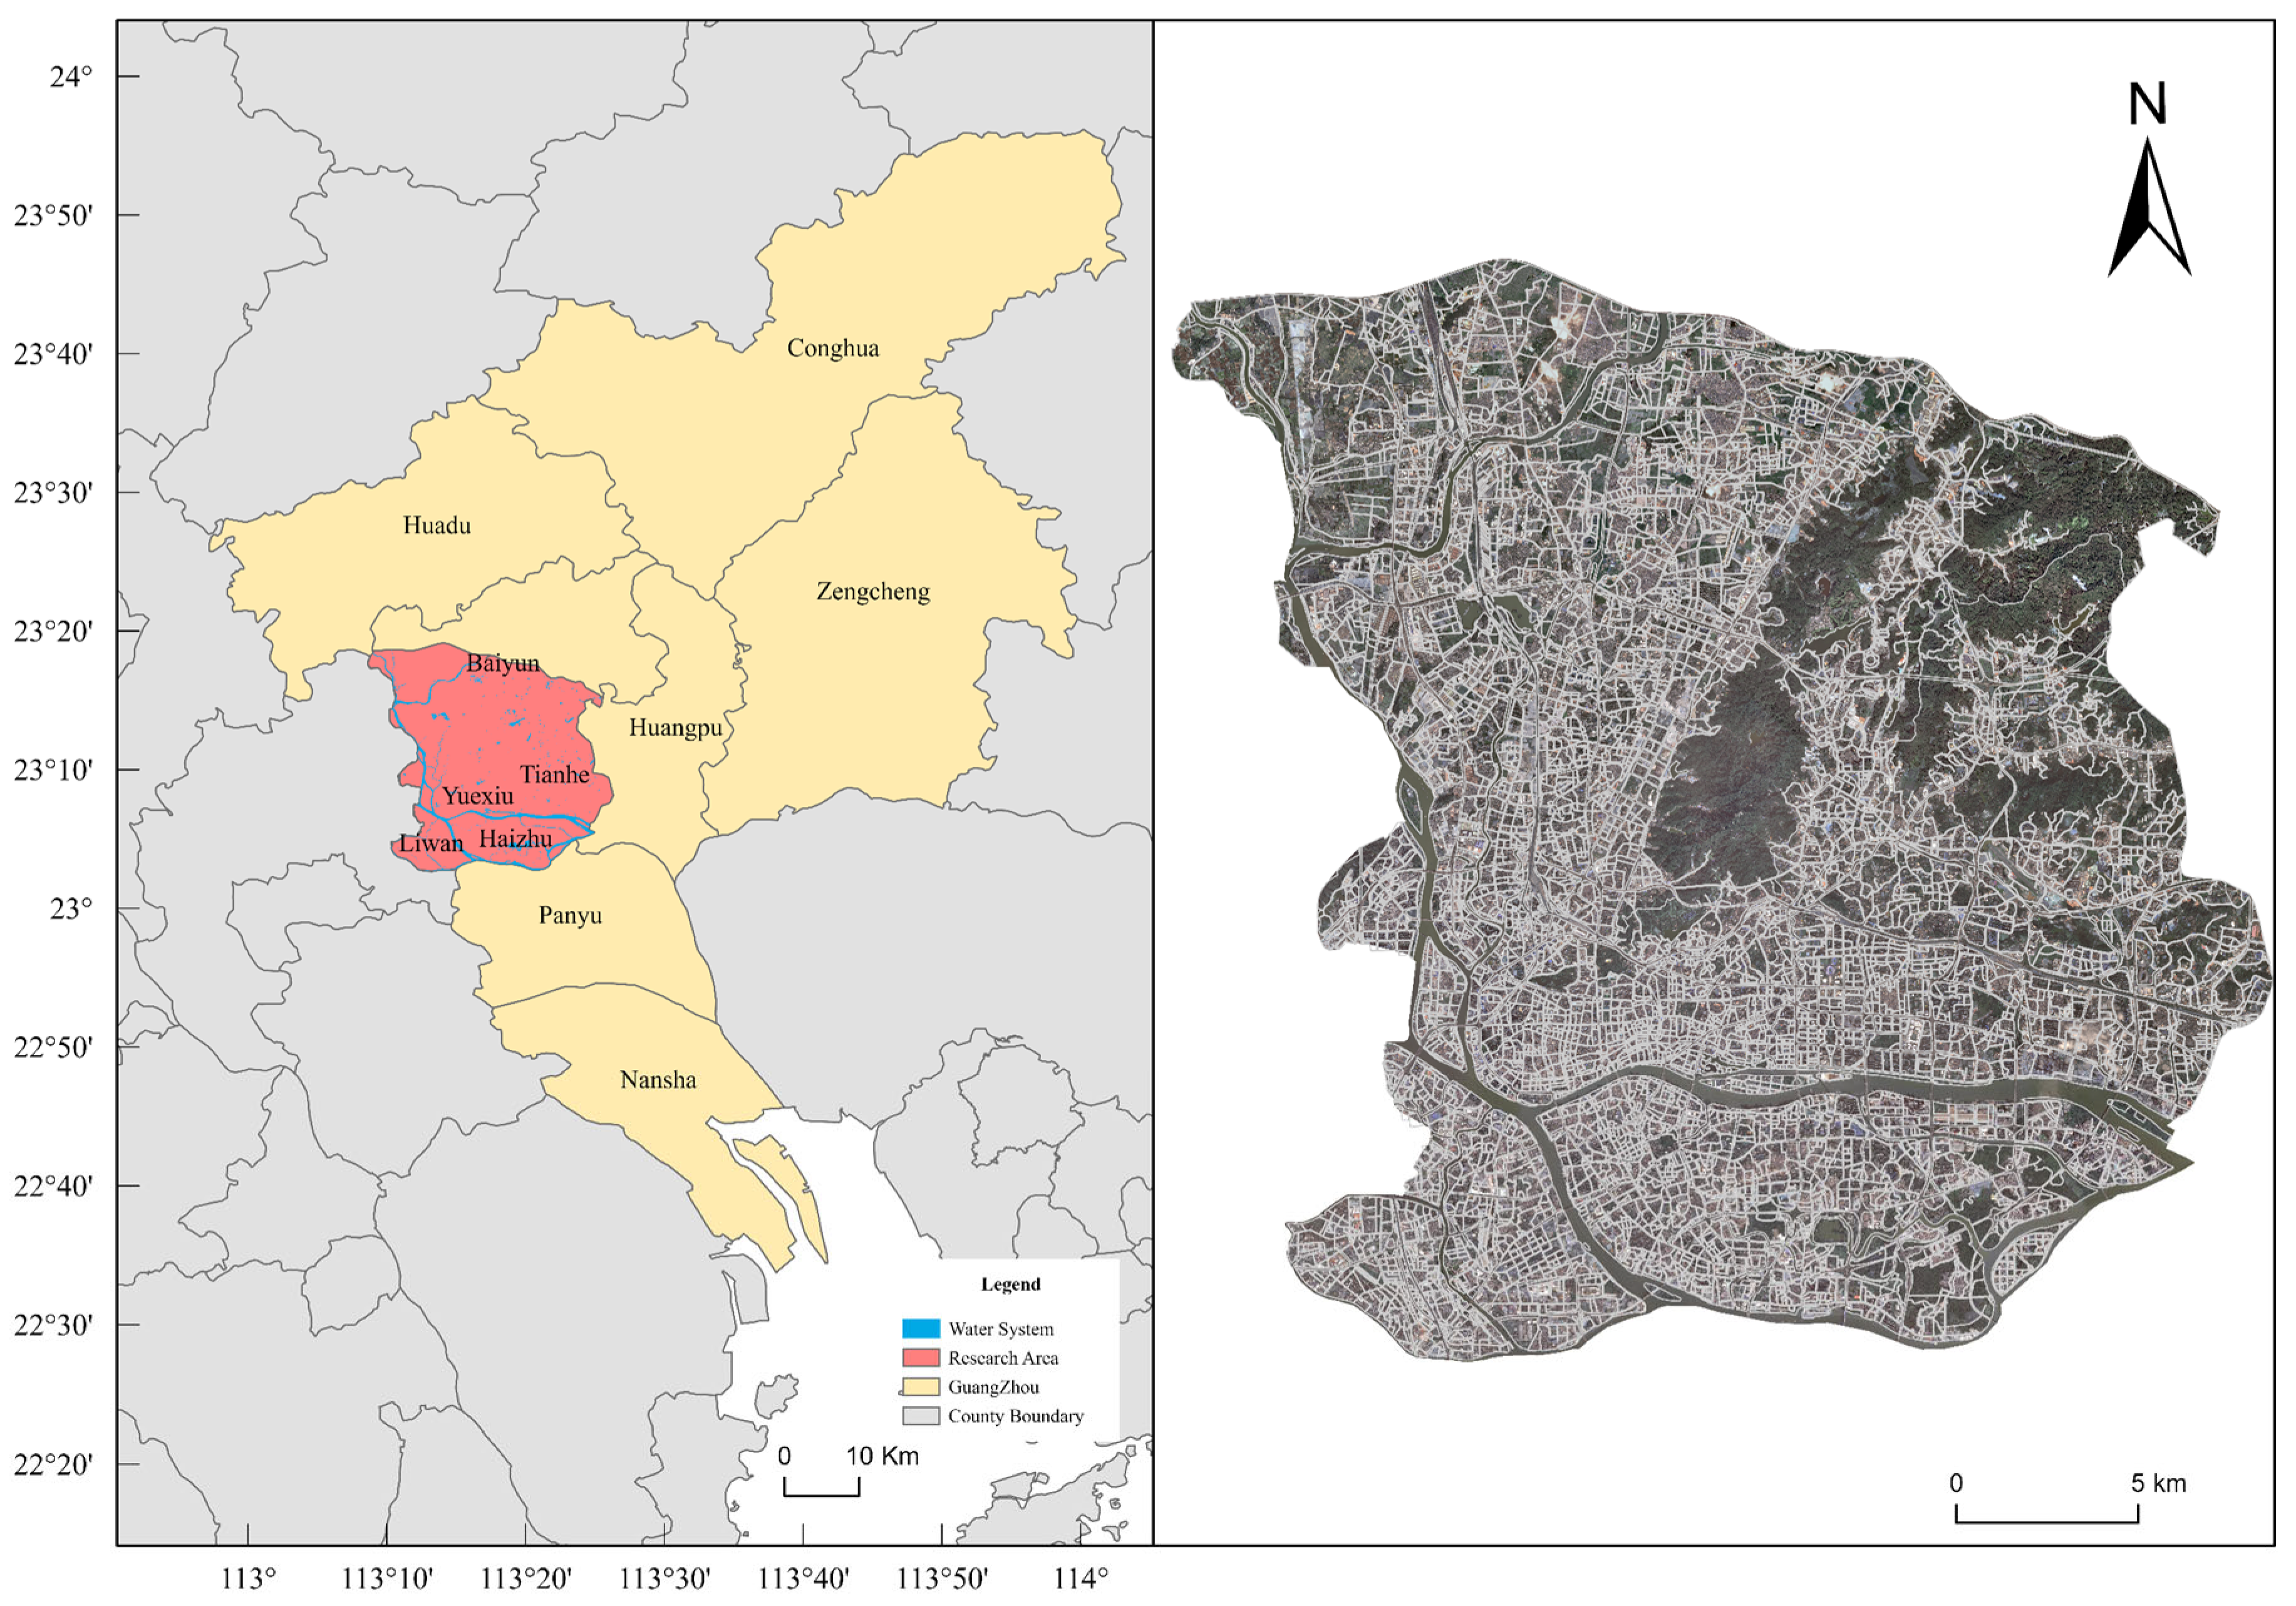
2.1. Overview of the Study Area
2.2. Overview of the Study Area Research Framework
2.3. Data Sources and Processing
2.3.1. Basic Dataset
2.3.2. Comprehensive Urban Vitality Model Dataset
2.3.3. Built Environment Dataset
2.4. Research Methods
2.4.1. Construction of Urban Vitality Indicators
- Metrics for Measuring Economic Vitality
- (1)
- Indicator Standardization
- (2)
- Calculating Indicator Weights
- Metrics for Measuring Social Vitality
- Metrics for Measuring Cultural Vitality
- Metrics for Measuring Ecological Vitality
- Method for Calculating Comprehensive Urban Vitality
2.4.2. Method for Analyzing Nonlinear Relationships and Synergistic Effects
3. Results
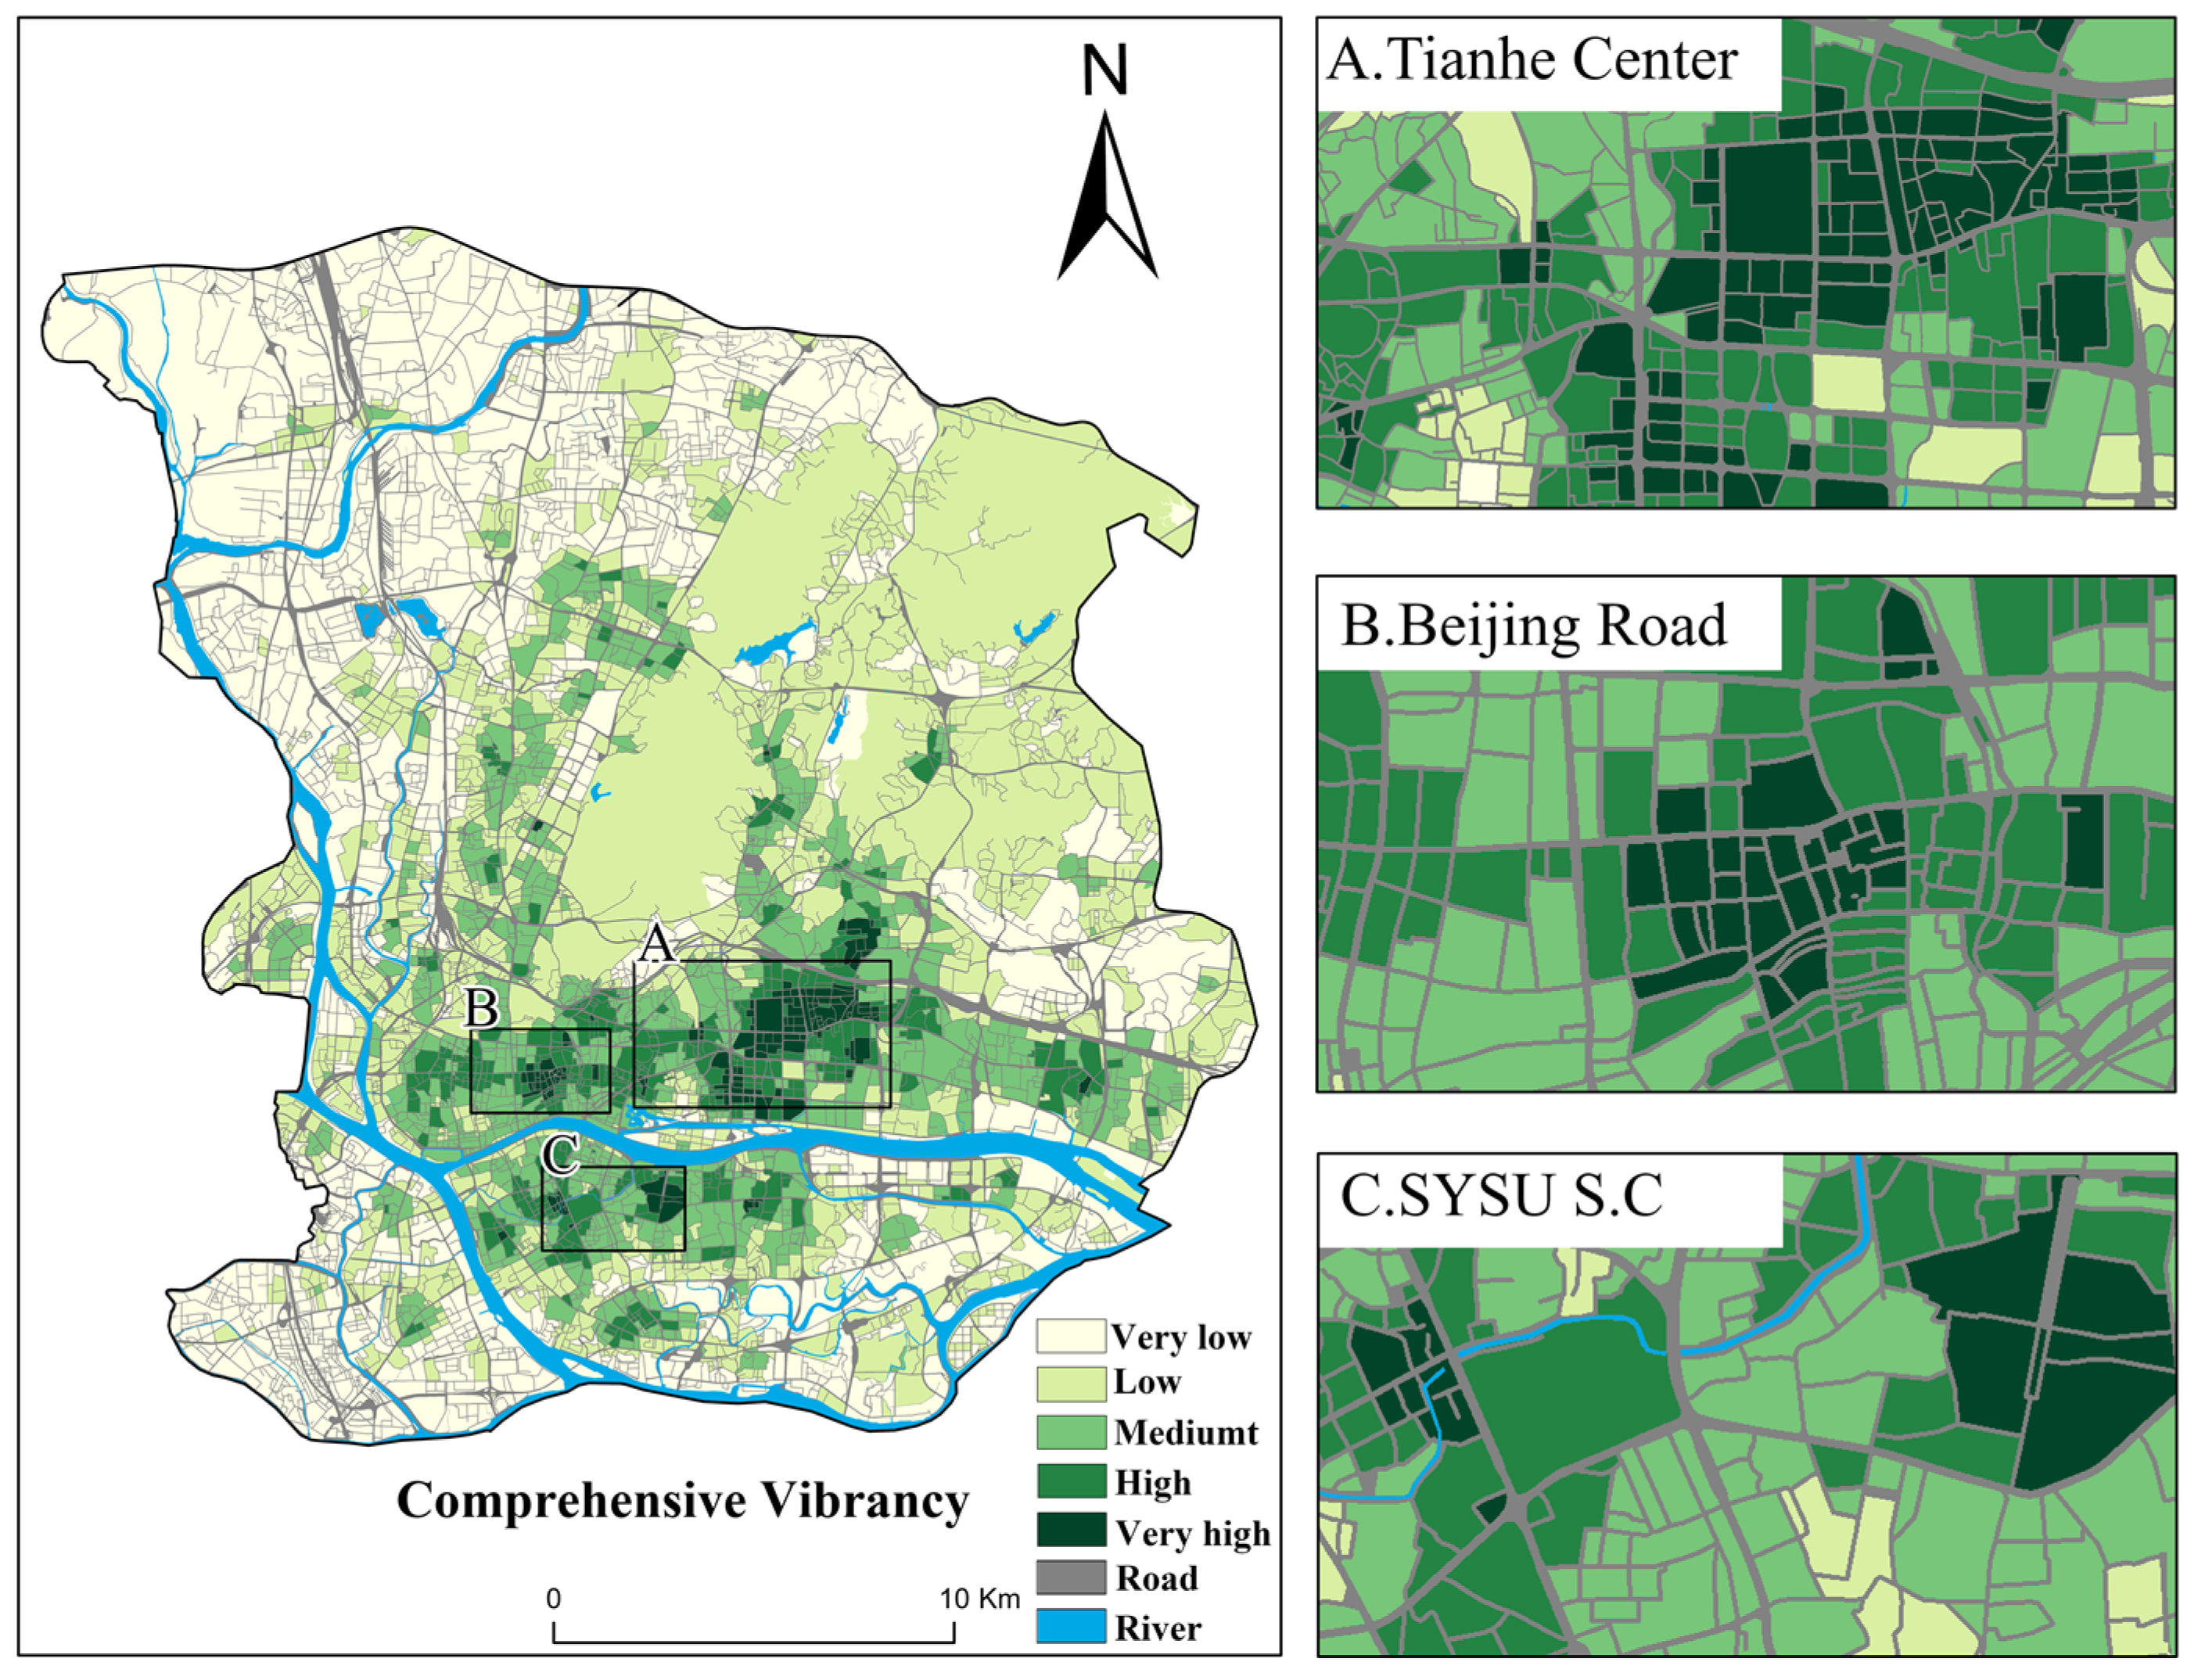
3.1. Spatial Characteristics of Urban Vitality
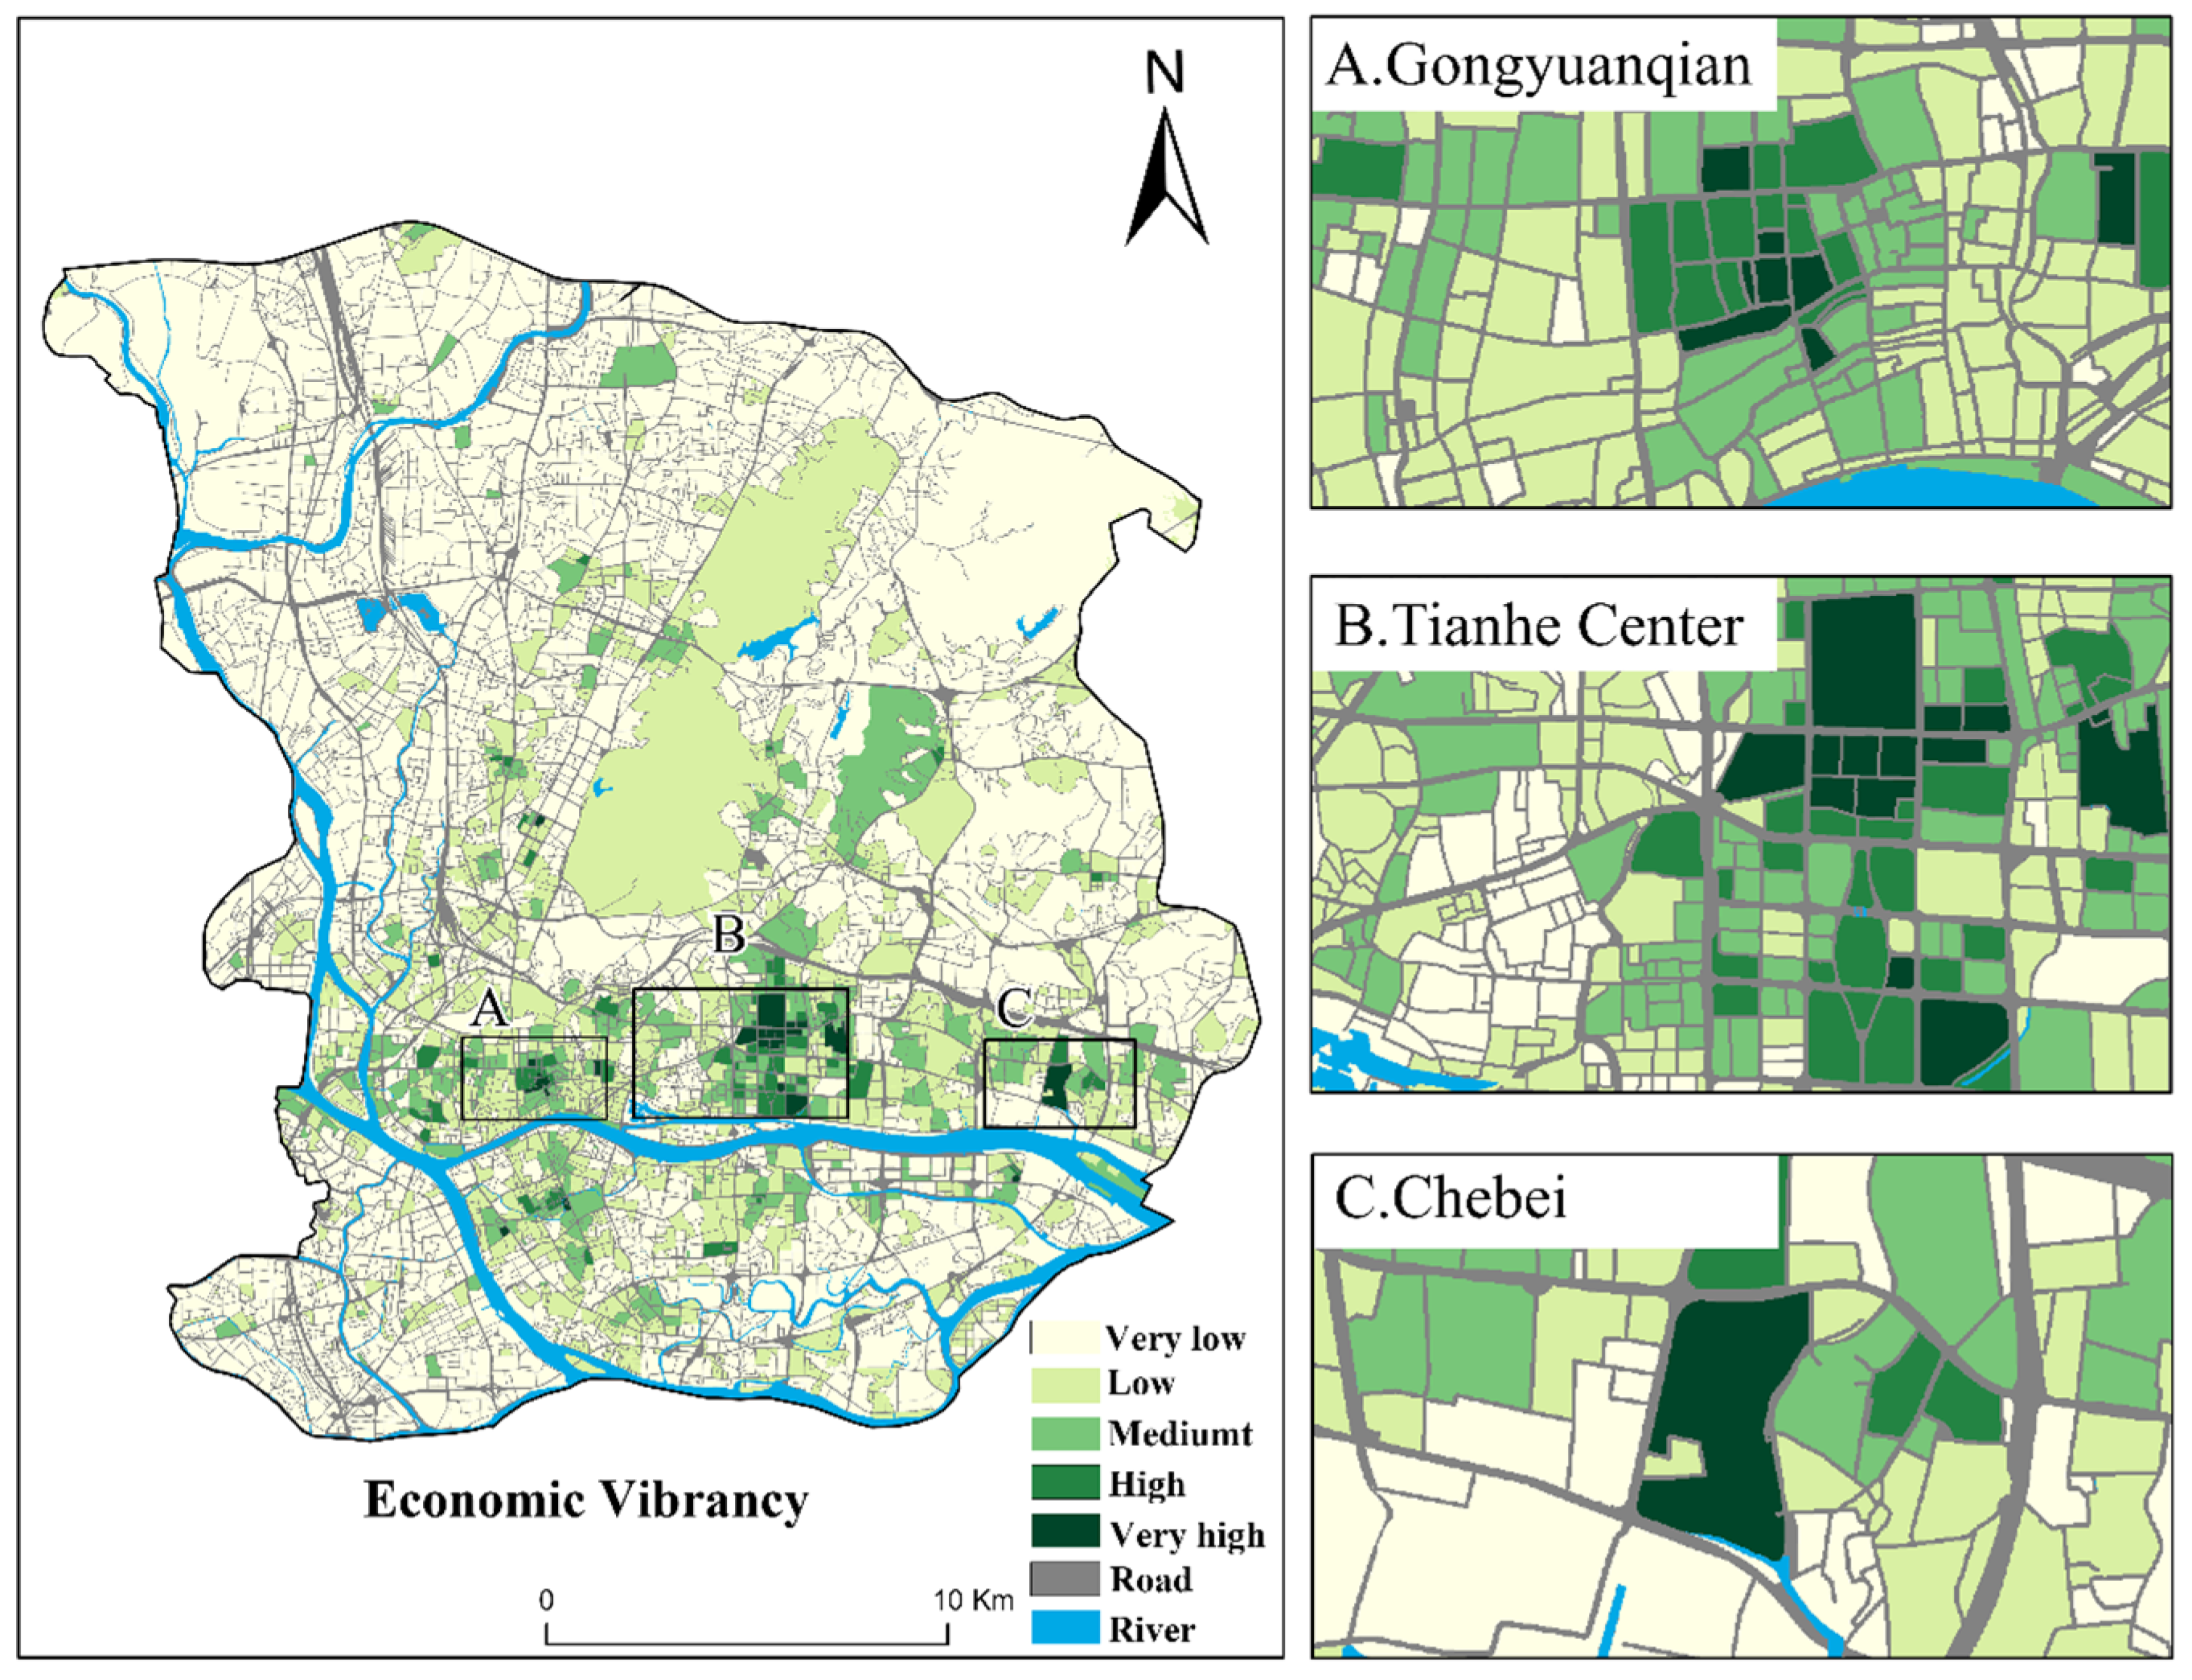
3.1.1. Spatial Distribution of Economic Vitality
3.1.2. Spatial Distribution of Social Vitality
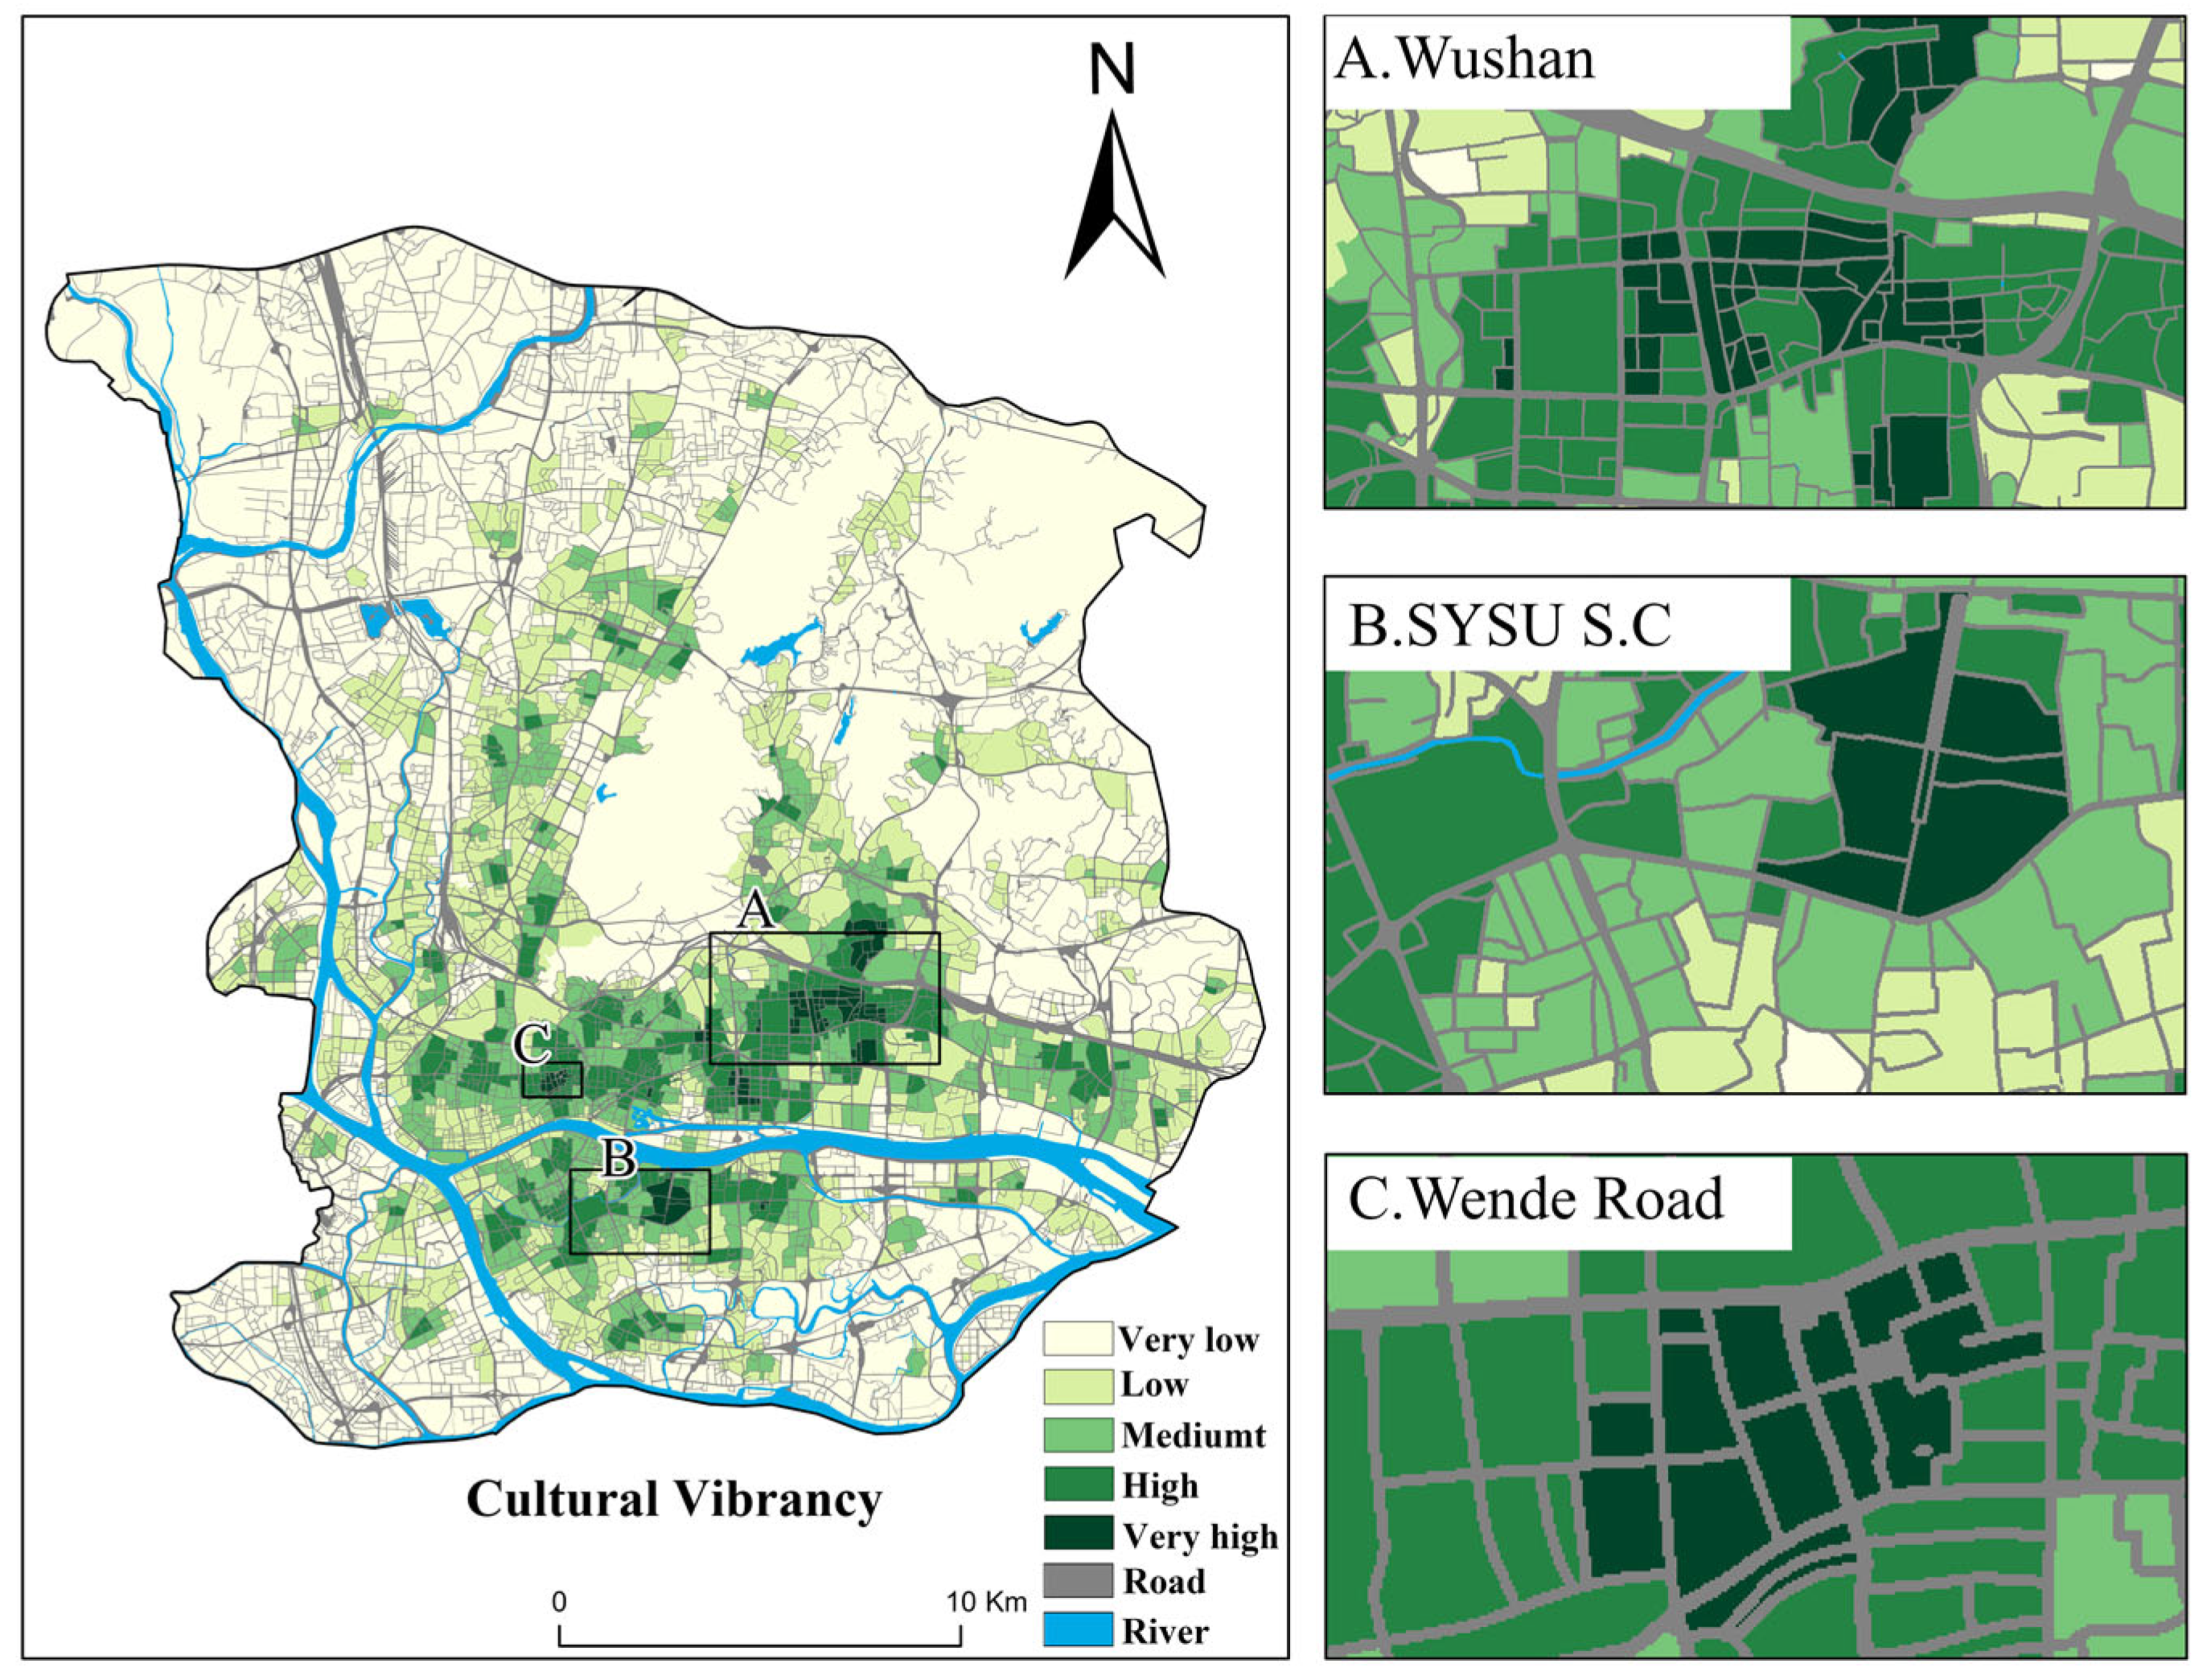
3.1.3. Spatial Distribution of Cultural Vitality
3.1.4. Spatial Distribution of Ecological Vitality
3.1.5. Spatial Distribution of Ecological Vitality
3.2. The Comprehensive Impact of the Built Environment on Urban Vitality
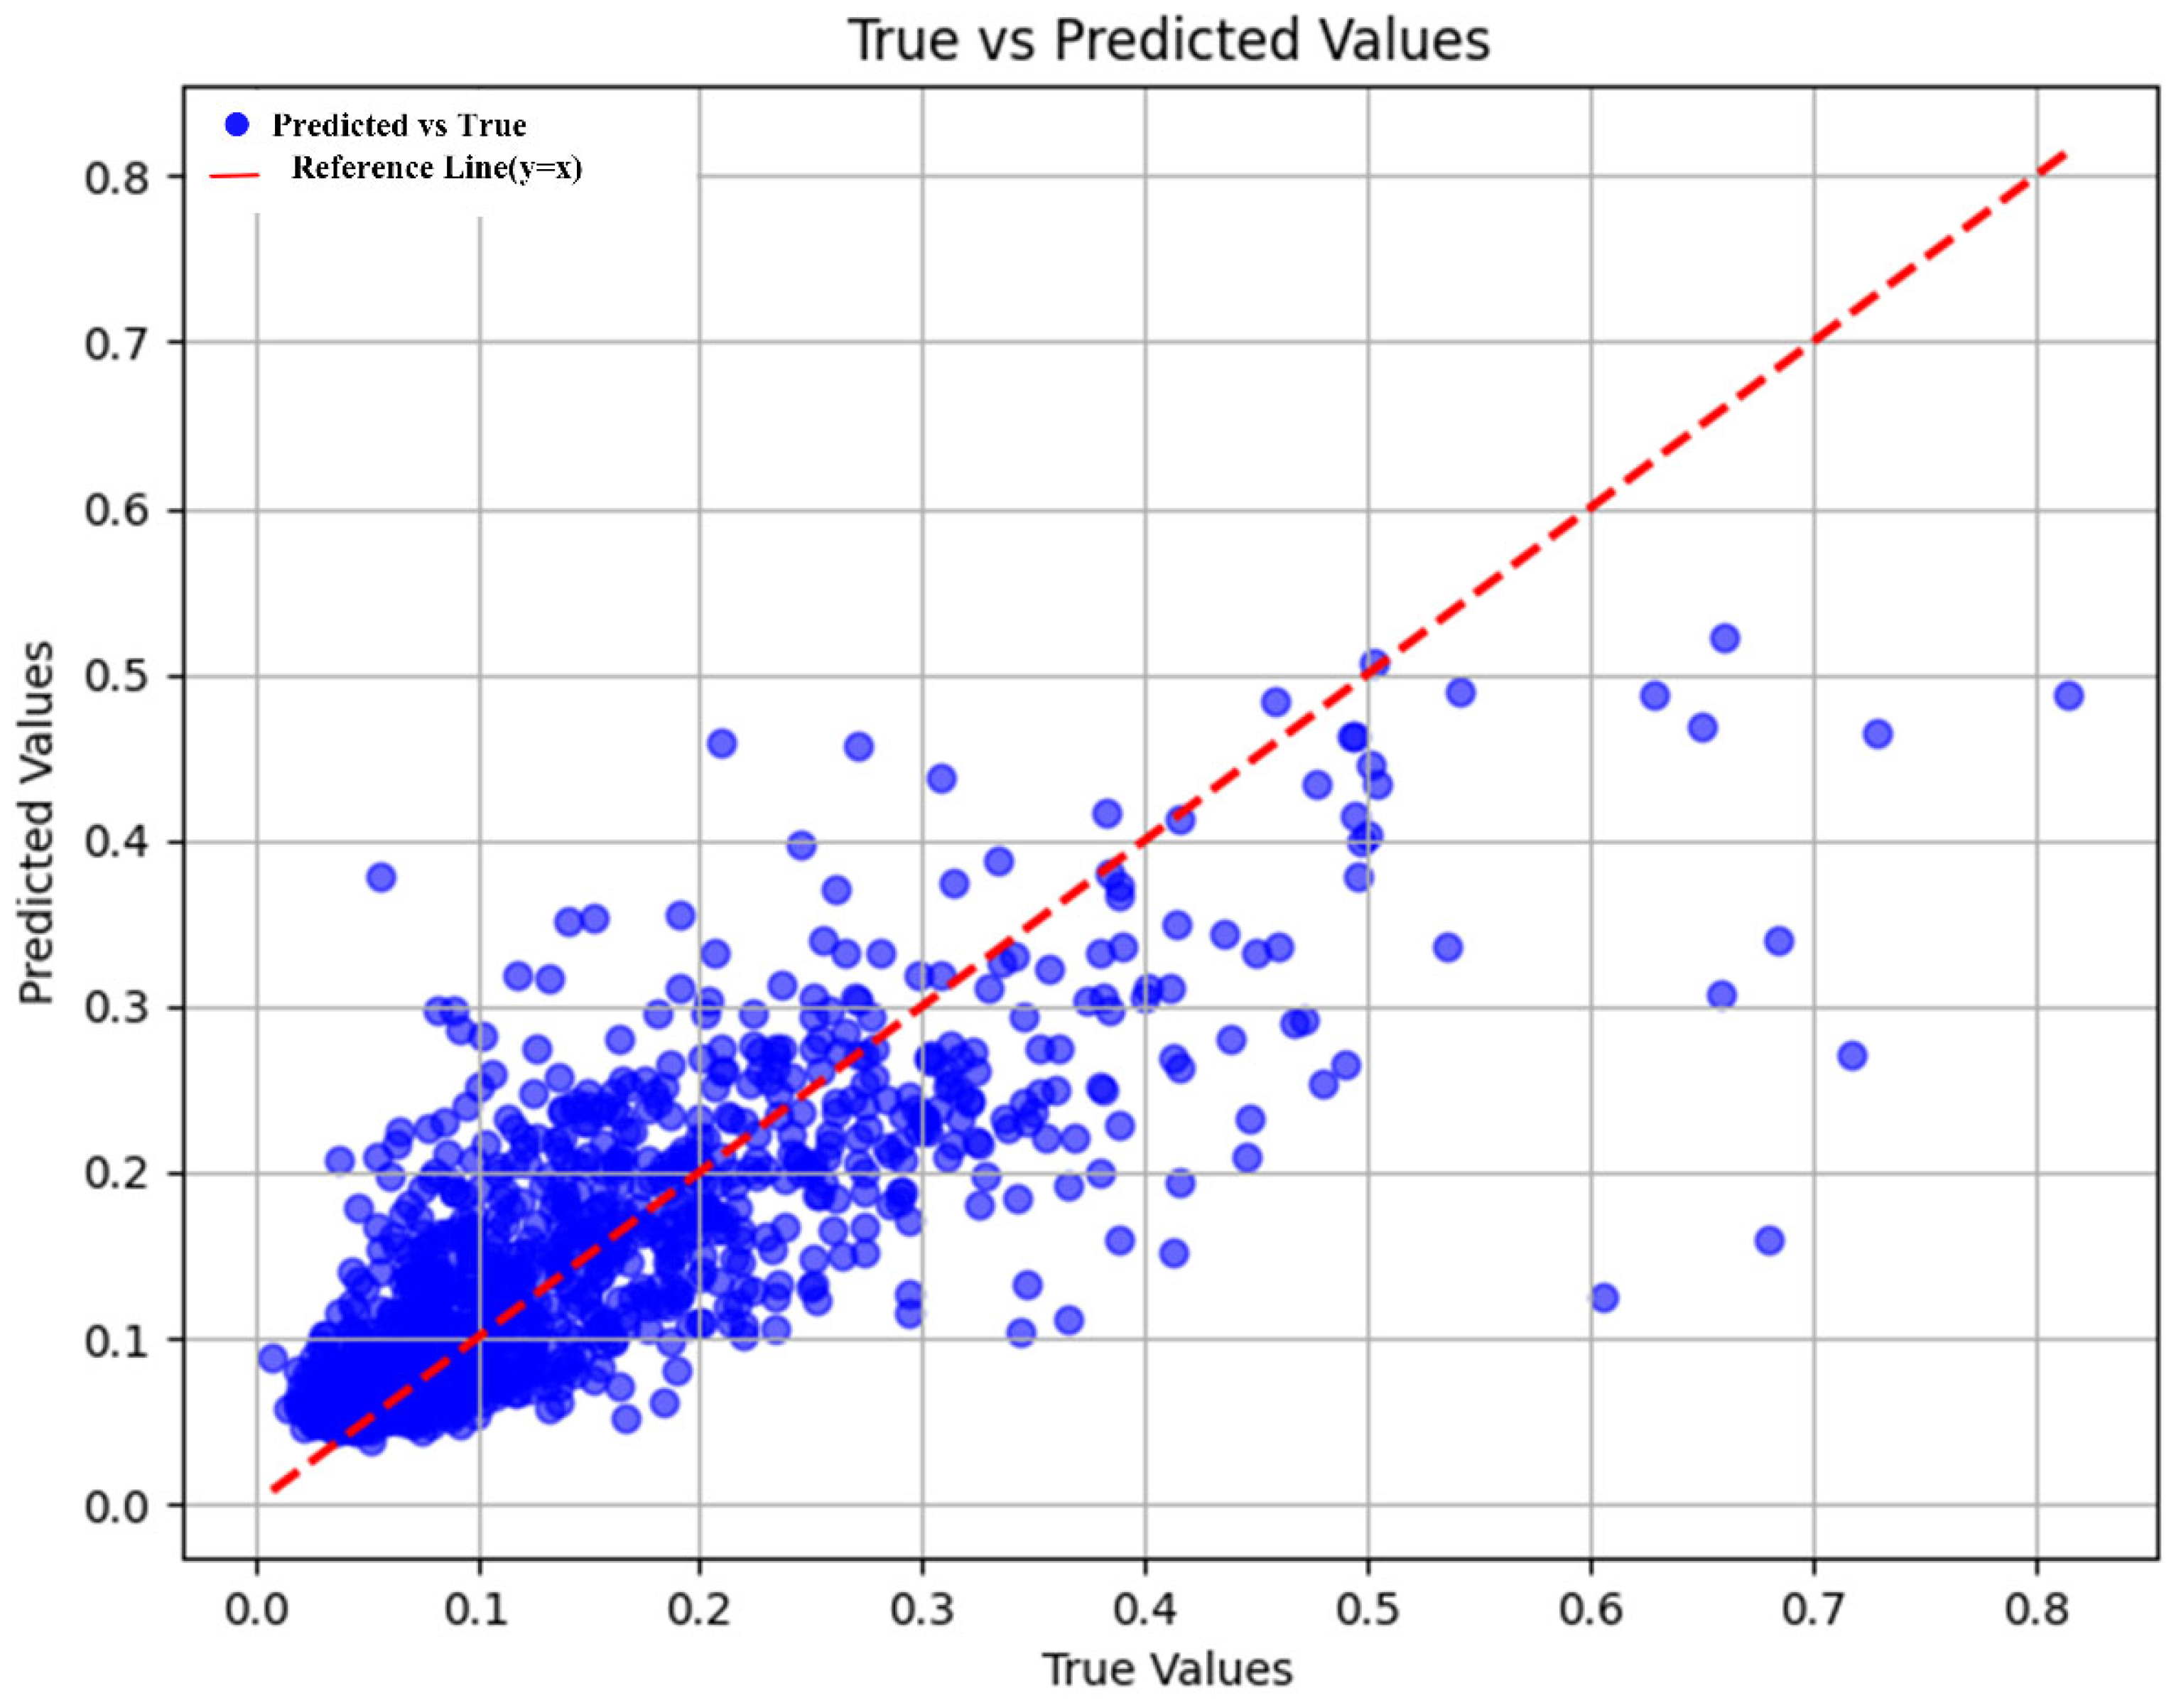
3.2.1. XGBoost Model Validation
| MSE | RMSE | MAE | R-Squared | |
|---|---|---|---|---|
| XGBoost | 0.0053 | 0.0724 | 0.0487 | 0.6057 |
| OLS | 0.0071 | 0.0843 | / | 0.497 |
3.2.2. Relative Importance of Built Environment Indicators
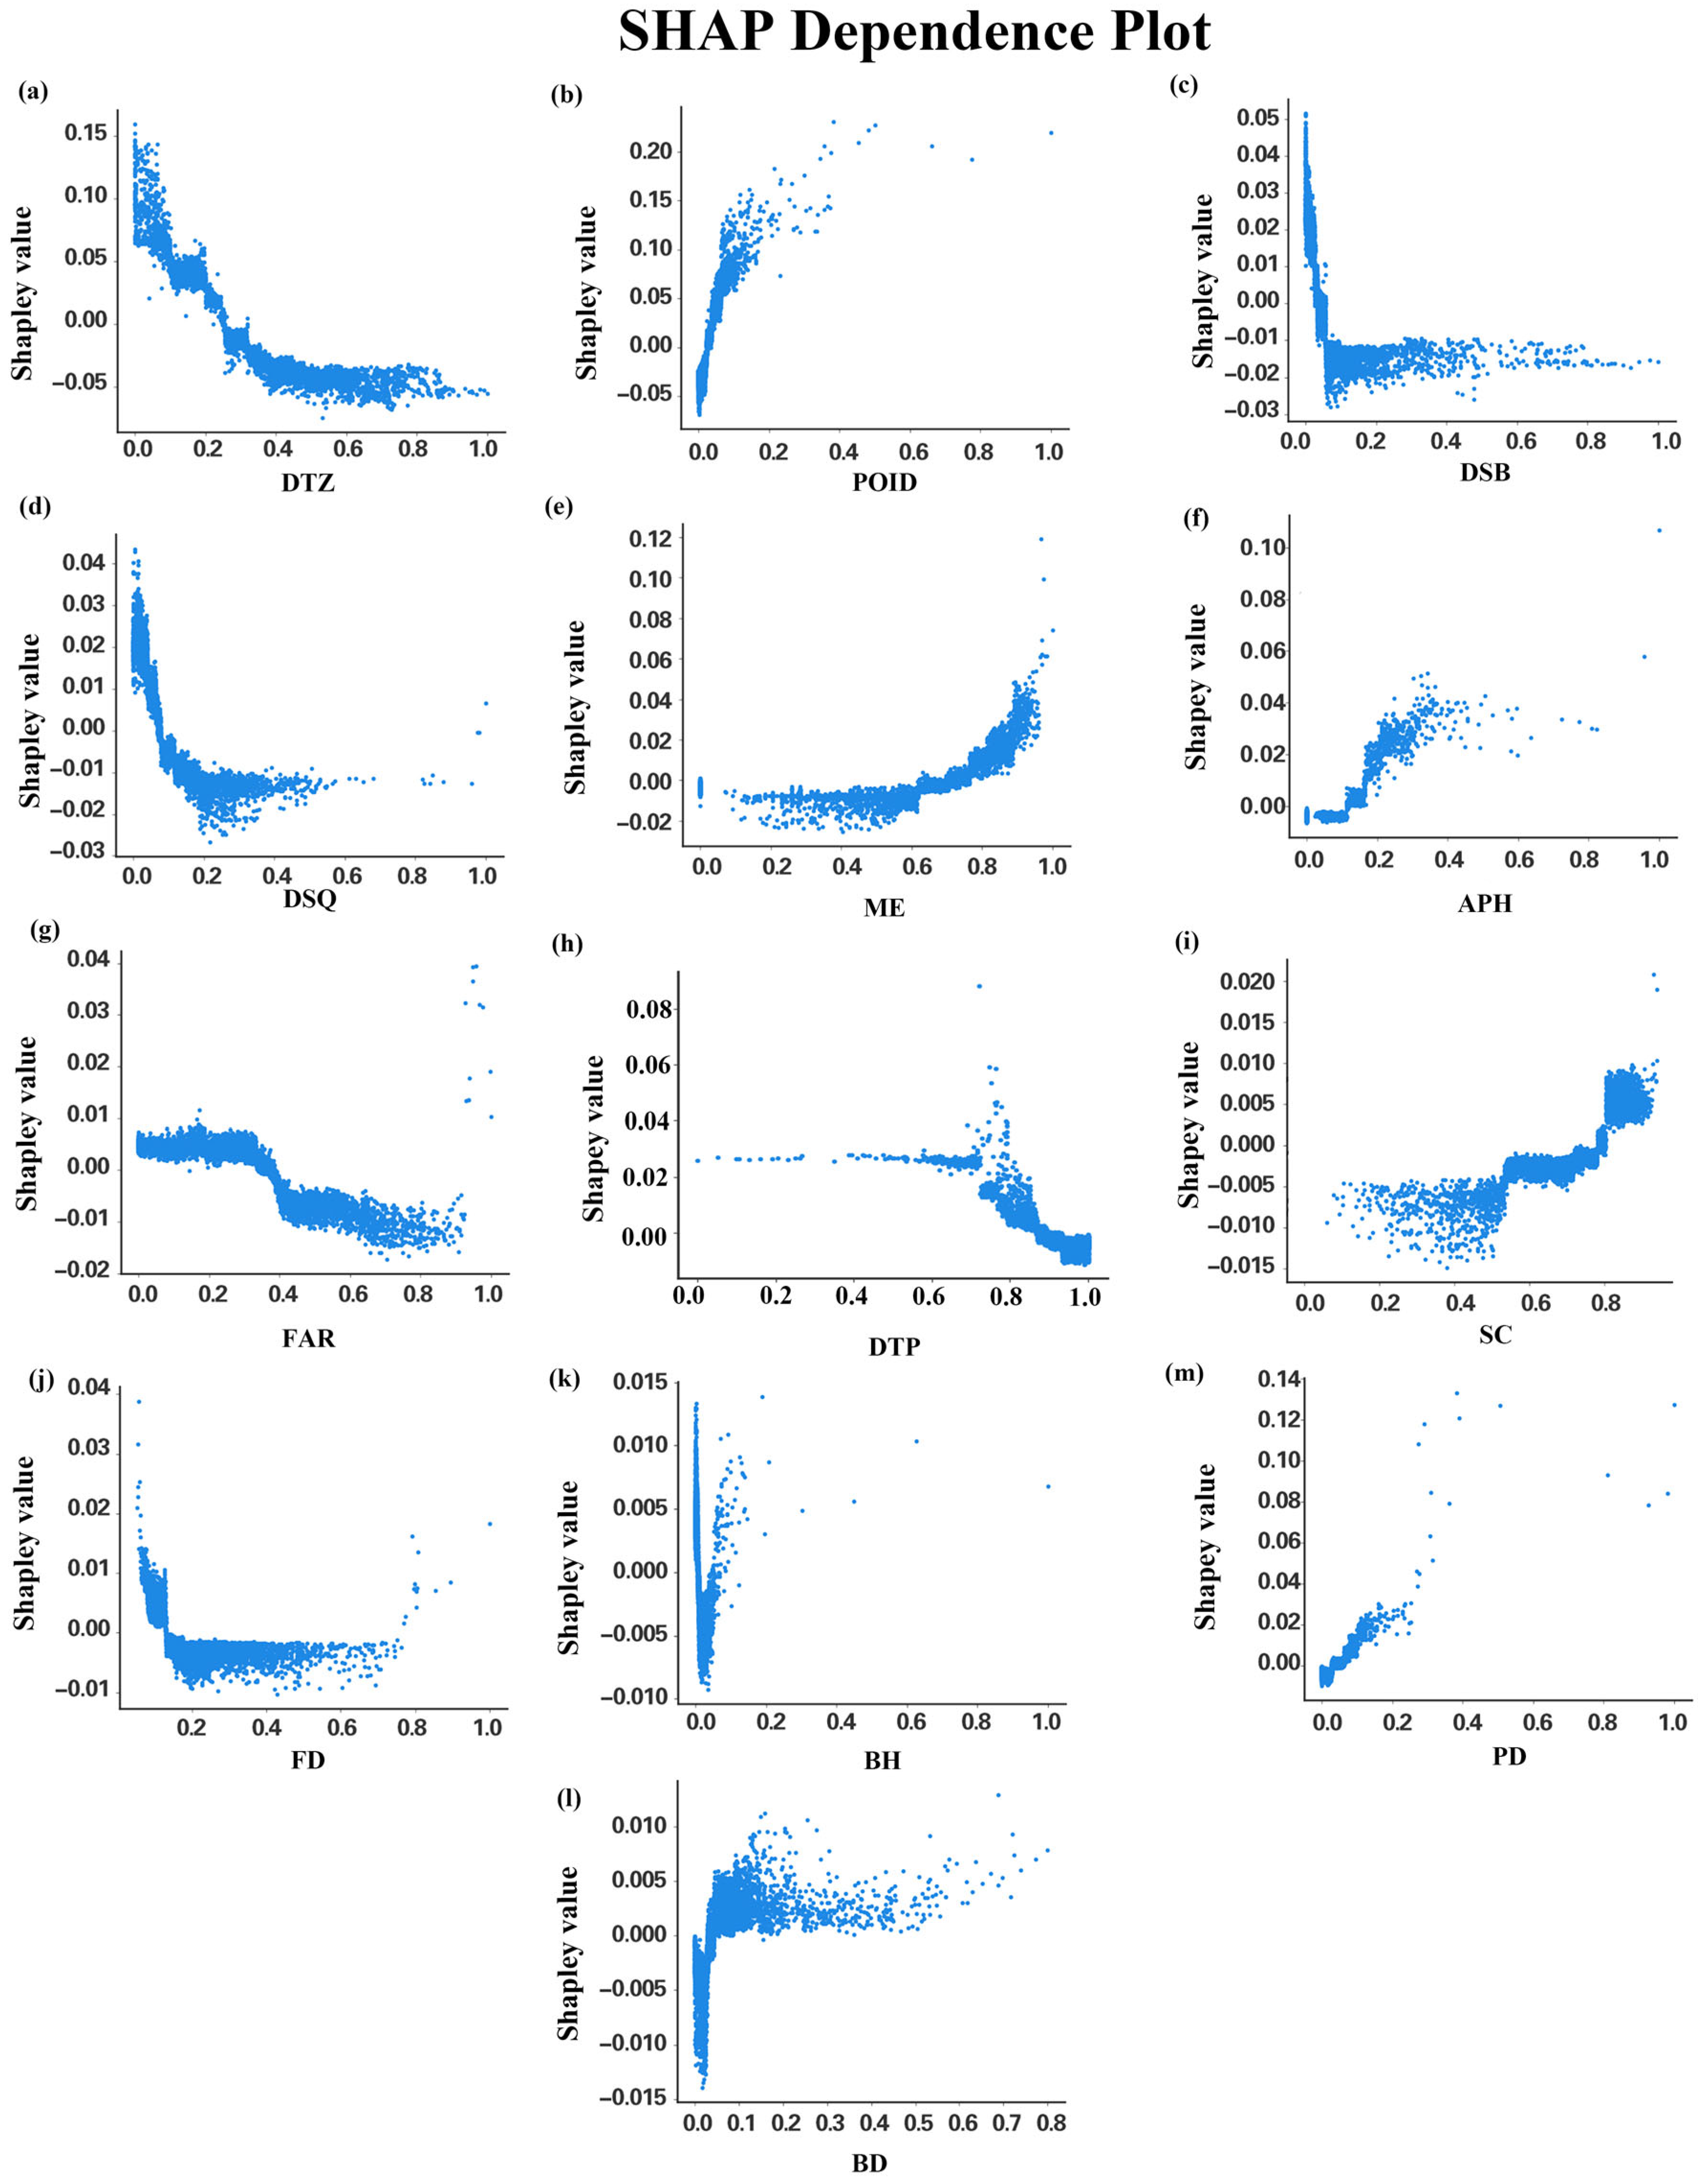
3.2.3. The Nonlinear Relationship between the Built Environment and Urban Vitality
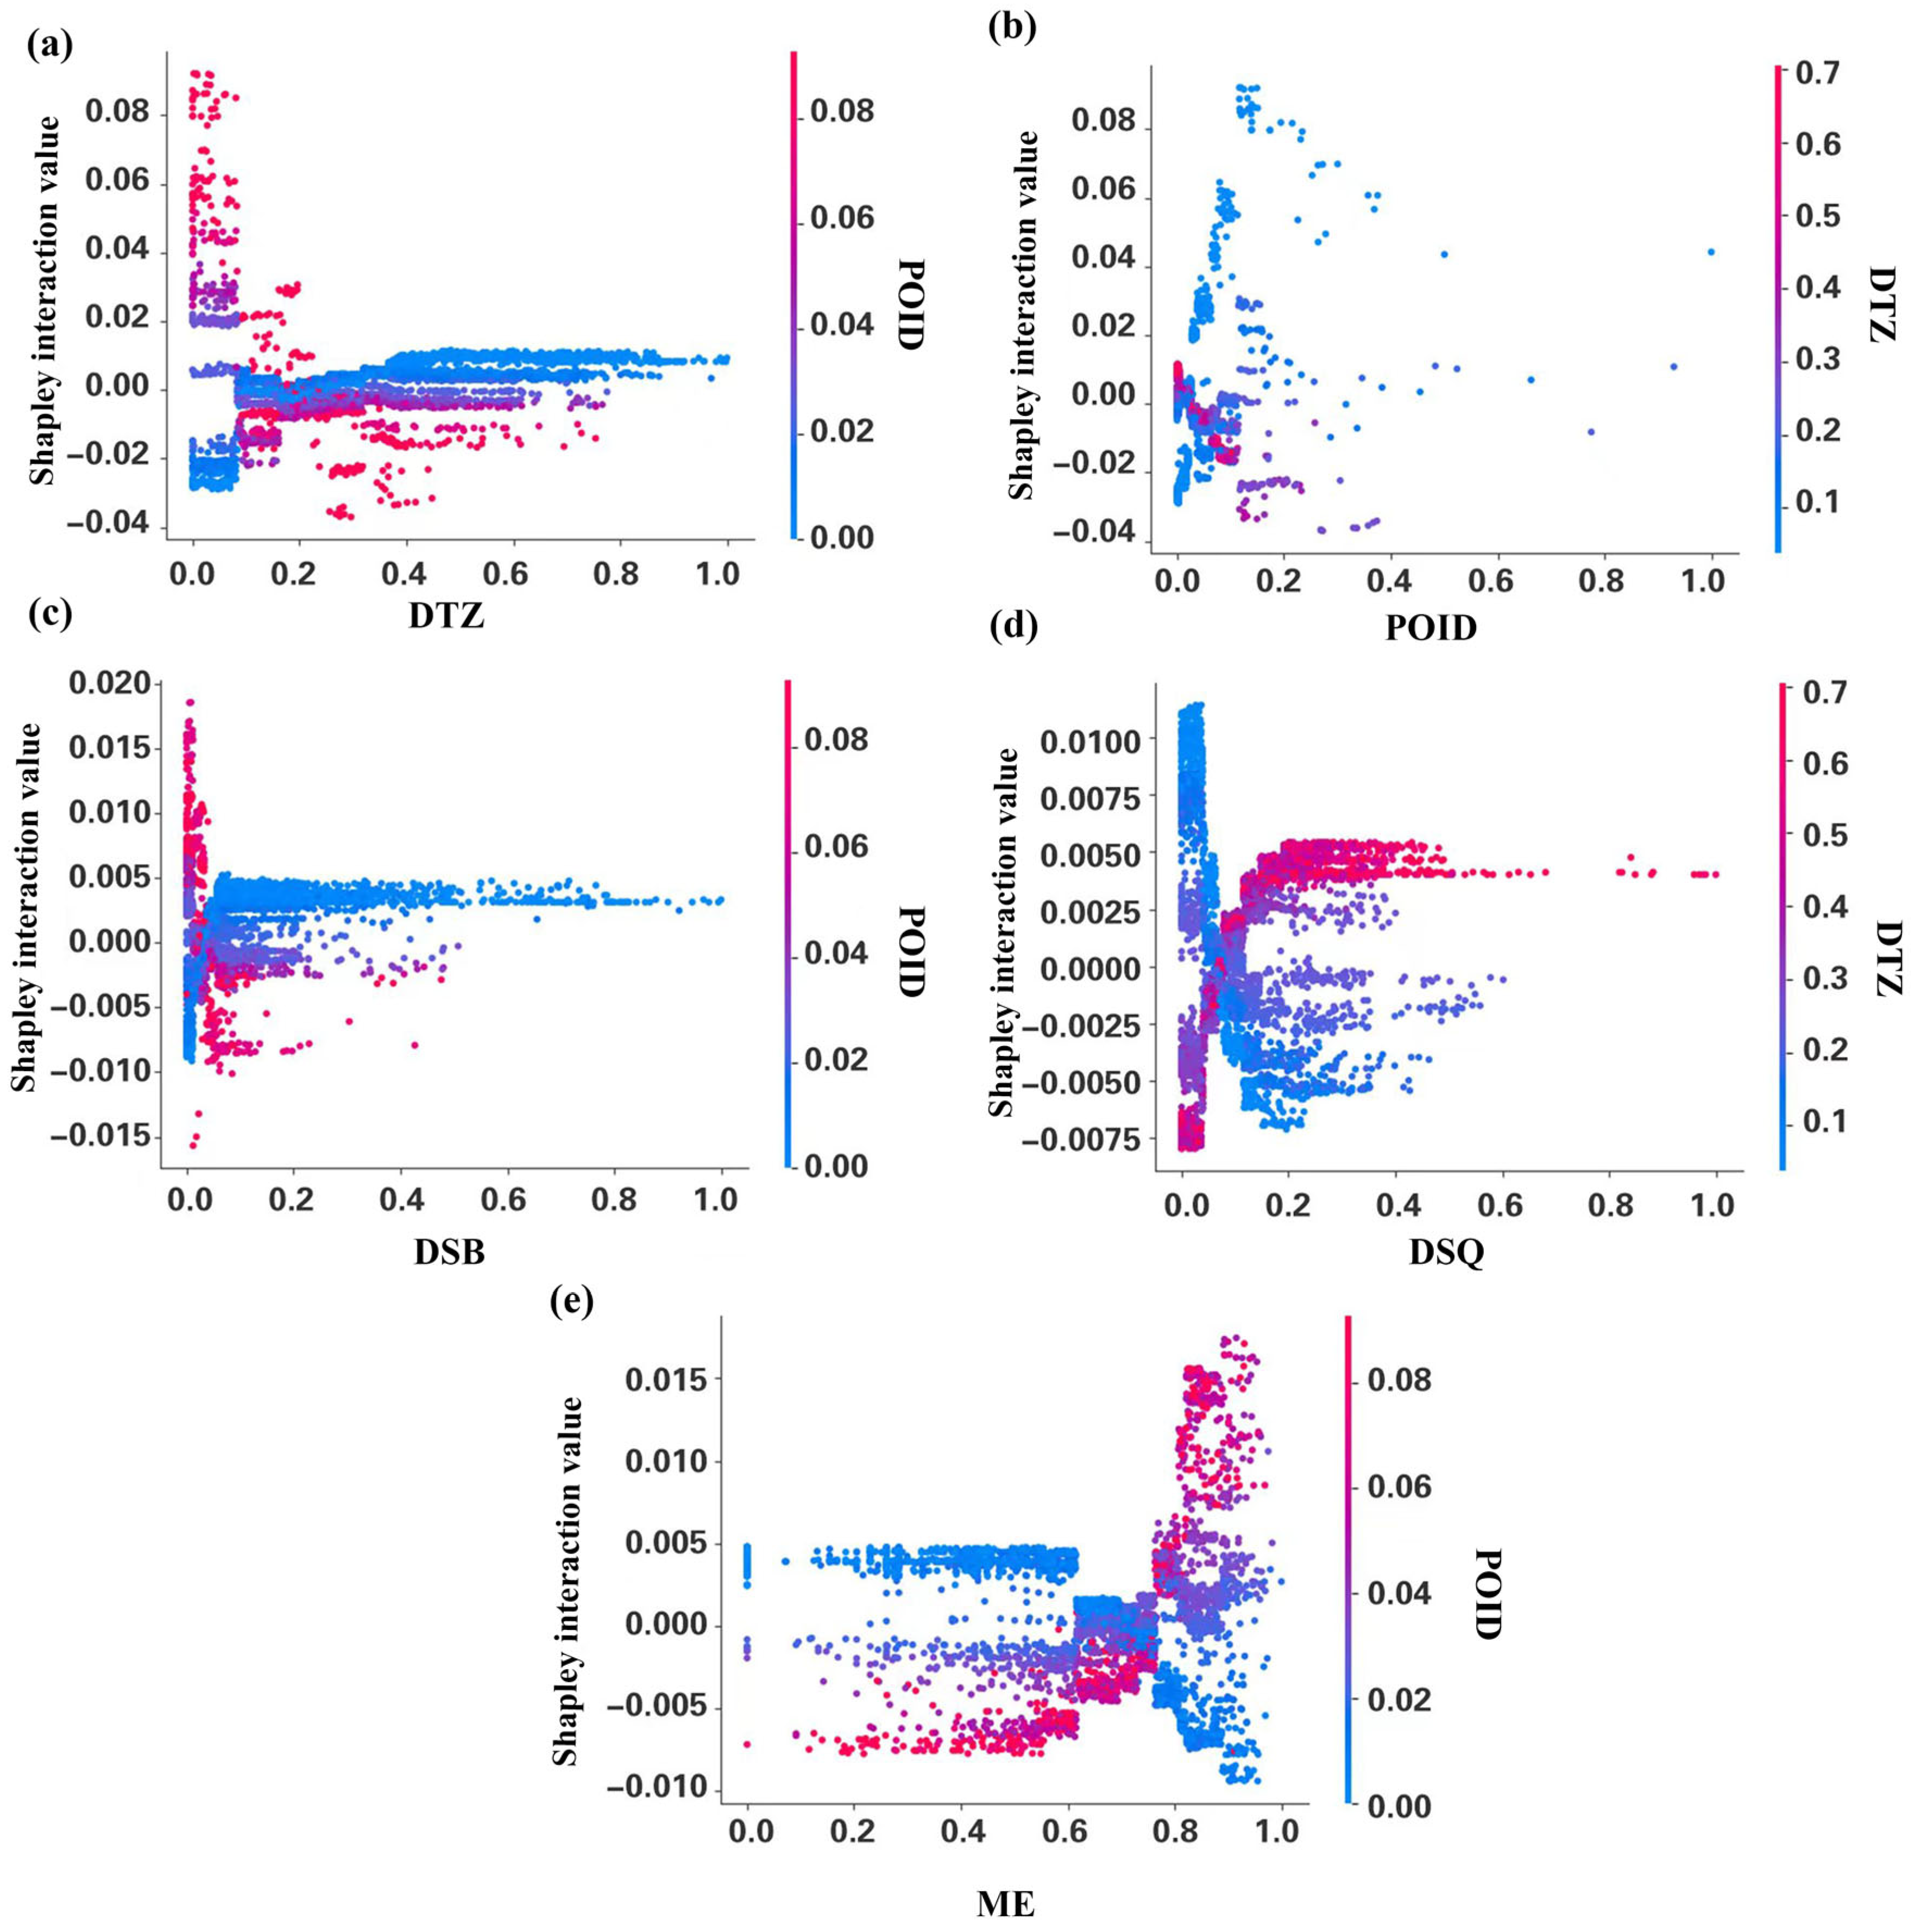
3.2.4. The Synergistic Effects of the Built Environment on Urban Vitality
4. Discussion
4.1. Comparative Analysis of the Spatial Distribution of Urban Vitality
4.2. Analysis of the Impact of Built Environment Factors on Urban Vitality
4.2.1. The Impact of Single Indicators on Urban Vitality
4.2.2. Synergistic and Threshold Effects of Variables on Urban Vitality
4.3. Theoretical and Practical Implications
4.4. Limitations and Future Research Directions
- Comparative empirical studies from multi-scale and multi-regional perspectives should be conducted to explore the similarities and differences between built environment indicator systems and urban vitality at different scales. Comparative studies across different scales can help reveal how factors influencing urban vitality perform at various levels. Multi-scale comparisons will aid in developing a more comprehensive and flexible indicator system for a more precise assessment and enhancement of urban vitality [77]. Cross-city comparative studies can identify general patterns and regional characteristics of different cities [15].
- Future research can investigate the temporal variation characteristics of vitality to dynamically explore trends in urban vitality changes and the evolving relationships with influencing factors over time [6]. By collecting and analyzing data across multiple time points, long-term trends and periodic fluctuations in urban vitality can be identified, providing deeper insights into how urban vitality evolves over time and the impact of influencing factors at different temporal stages.
- Future research could consider employing other regression models to better reveal the complex impacts of multiple factors on urban vitality. Additionally, the application of new interpretative methods could provide a deeper understanding of the synergistic effects of multiple factors within the built environment on urban vitality.
- In future research, clustering models could be employed to conduct spatial clustering of SHAP values. When combined with fixed effects models, this method can provide deeper insights into the reasons behind the spatial variation in how built environment factors synergistically impact urban vitality.
5. Conclusions
Author Contributions
Funding
Data Availability Statement
Acknowledgments
Conflicts of Interest
References
- Jin, X.; Long, Y.; Sun, W.; Lu, Y.; Yang, X.; Tang, J. Evaluating cities’ vitality and identifying ghost cities in China with emerging geographical data. Cities 2017, 63, 98–109. [Google Scholar] [CrossRef]
- Katz, P. The New Urbanism. In Toward an Architecture of Community; McGraw-Hill: New York, NY, USA, 1994. [Google Scholar]
- Halepoto, I.A.; Sahito, A.A.; Uqaili, M.A.; Chowdhry, B.S.; Riaz, T. Multi-criteria assessment of smart city transformation based on SWOT analysis. In Proceedings of the 2015 5th National Symposium on Information Technology: Towards New Smart World (NSITNSW), Riyadh, Saudi Arabia, 17–19 February 2015; pp. 1–6. [Google Scholar]
- Montgomery, J. Making a city: Urbanity, vitality and urban design. J. Urban Des. 1998, 3, 93–116. [Google Scholar] [CrossRef]
- Li, M.; Shen, Z.; Hao, X. Revealing the relationship between spatio-temporal distribution of population and urban function with social media data. GeoJournal 2016, 81, 919–935. [Google Scholar] [CrossRef]
- Chen, Y.; Yu, B.; Shu, B.; Yang, L.; Wang, R. Exploring the spatiotemporal patterns and correlates of urban vitality: Temporal and spatial heterogeneity. Sustain. Cities Soc. 2023, 91, 104440. [Google Scholar] [CrossRef]
- Chen, Z.; Dong, B.; Pei, Q.; Zhang, Z. The impacts of urban vitality and urban density on innovation: Evidence from China’s Greater Bay Area. Habitat Int. 2022, 119, 102490. [Google Scholar] [CrossRef]
- Gao, C.; Li, S.; Sun, M.; Zhao, X.; Liu, D. Exploring the Relationship between Urban Vibrancy and Built Environment Using Multi-Source Data: Case Study in Munich. Remote Sens. 2024, 16, 1107. [Google Scholar] [CrossRef]
- Jacobs, J. The Death and Life of Great American Cities; Vintage Canada: Toronto, ON, Canada, 2017. [Google Scholar]
- Jia, C.; Liu, Y.; Du, Y.; Huang, J.; Fei, T. Evaluation of Urban Vibrancy and Its Relationship with the Economic Landscape: A Case Study of Beijing. ISPRS Int. J. Geo-Inf. 2021, 10, 72. [Google Scholar] [CrossRef]
- Landry, C. The Creative City: A Toolkit for Urban Innovators; Routledge: Oxfordshire, UK, 2012. [Google Scholar]
- Magurran, A.E. Ecological Diversity and Its Measurement; Springer Science & Business Media: Berlin/Heidelberg, Germany, 2013. [Google Scholar]
- Wang, C.; Wang, B.; Wang, Q.; Lei, Y. Nonlinear associations between urban vitality and built environment factors and threshold efects:A case study of central Guangzhou City. Prog. Geogr. 2023, 42, 79–88. (In Chinese) [Google Scholar] [CrossRef]
- Wang, Z.; Liu, Y.; Luo, X.; Tong, Z.; An, R. Nonlinear relationship between urban vitality and the built environment based on multi-source data:A case study of the main urban area of Wuhan City at the weekend. Beijing Univ. J. Nat. Sci. 2023, 42, 716–729. (In Chinese) [Google Scholar]
- Li, Z.; Zhao, G. Revealing the Spatio-Temporal Heterogeneity of the Association between the Built Environment and Urban Vitality in Shenzhen. ISPRS Int. J. Geo-Inf. 2023, 12, 433. [Google Scholar] [CrossRef]
- Li, J.; Lin, S.; Kong, N.; Ke, Y.; Zeng, J.; Chen, J. Nonlinear and Synergistic Effects of Built Environment Indicators on Street Vitality: A Case Study of Humid and Hot Urban Cities. Sustainability 2024, 16, 1731. [Google Scholar] [CrossRef]
- Zou, H.; Liu, R.; Cheng, W.; Lei, J.; Ge, J. The Association between Street Built Environment and Street Vitality Based on Quantitative Analysis in Historic Areas: A Case Study of Wuhan, China. Sustainability 2023, 15, 1732. [Google Scholar] [CrossRef]
- Shi, Y.; Zheng, J.; Pei, X. Measurement Method and Influencing Mechanism of Urban Subdistrict Vitality in Shanghai Based on Multisource Data. Remote Sens. 2023, 15, 932. [Google Scholar] [CrossRef]
- Lu, S.; Shi, C.; Yang, X. Impacts of Built Environment on Urban Vitality: Regression Analyses of Beijing and Chengdu, China. Int. J. Environ. Res. Public Health 2019, 16, 4592. [Google Scholar] [CrossRef] [PubMed]
- Li, Q.; Cui, C.; Liu, F.; Wu, Q.; Run, Y.; Han, Z. Multidimensional Urban Vitality on Streets: Spatial Patterns and Influence Factor Identification Using Multisource Urban Data. ISPRS Int. J. Geo-Inf. 2021, 11, 2. [Google Scholar] [CrossRef]
- Oke, T.R.; Mills, G.; Christen, A.; Voogt, J.A. Urban Climates; Cambridge University Press: Cambridge, UK, 2017. [Google Scholar]
- Wang, J.; Liu, W.; Sha, C.; Zhang, W.; Liu, Z.; Wang, Z.; Wang, R.; Du, X. Evaluation of the impact of urban morphology on commercial building carbon emissions at the block scale–A study of commercial buildings in Beijing. J. Clean. Prod. 2023, 408, 137191. [Google Scholar] [CrossRef]
- Yao, L.; Li, T.; Xu, M.; Xu, Y. How the landscape features of urban green space impact seasonal land surface temperatures at a city-block-scale: An urban heat island study in Beijing, China. Urban For. Urban Green. 2020, 52, 126704. [Google Scholar] [CrossRef]
- Licón-Portillo, J.A.; Martínez-Torres, K.E.; Chung-Alonso, P.; Herrera Peraza, E.F. From Block to City Scale: Greenery’s Contribution to Cooling the Urban Environment. Urban Sci. 2024, 8, 41. [Google Scholar] [CrossRef]
- Fan, L.; Zhang, D. Research on the Influence Mechanism and Spatial Heterogeneity Characteristics of Block Vitality in Beijing: Based on Multiscale Geographically Weighted Regression. City Plan. Rev. 2022, 46, 27–37. [Google Scholar]
- Cao, X.; Mokhtarian, P.L.; Handy, S.L. Do changes in neighborhood characteristics lead to changes in travel behavior? A structural equations modeling approach. Transportation 2007, 34, 535–556. [Google Scholar] [CrossRef]
- Racine, F. Developments in urban design practice in Montreal: A morphological perspective. Urban Morphol. 2016, 20, 122–137. [Google Scholar] [CrossRef]
- Jiang, Y.; Han, Y.; Liu, M.; Ye, Y. Street vitality and built environment features: A data-informed approach from fourteen Chinese cities. Sustain. Cities Soc. 2022, 79, 103724. [Google Scholar] [CrossRef]
- Fu, R.; Zhang, X.; Yang, D.; Cai, T.; Zhang, Y. The Relationship between Urban Vibrancy and Built Environment: An Empirical Study from an Emerging City in an Arid Region. Int. J. Environ. Res. Public Health 2021, 18, 525. [Google Scholar] [CrossRef] [PubMed]
- Wang, Y.; Qiu, W.; Jiang, Q.; Li, W.; Ji, T.; Dong, L. Drivers or Pedestrians, Whose Dynamic Perceptions Are More Effective to Explain Street Vitality? A Case Study in Guangzhou. Remote Sens. 2023, 15, 568. [Google Scholar] [CrossRef]
- Wu, C.; Ye, X.; Ren, F.; Du, Q. Check-in behaviour and spatio-temporal vibrancy: An exploratory analysis in Shenzhen, China. Cities 2018, 77, 104–116. [Google Scholar] [CrossRef]
- Li, M.; Pan, J. Assessment of Influence Mechanisms of Built Environment on Street Vitality Using Multisource Spatial Data: A Case Study in Qingdao, China. Sustainability 2023, 15, 1518. [Google Scholar] [CrossRef]
- Gan, Z.; Yang, M.; Feng, T.; Timmermans, H.J.P. Examining the relationship between built environment and metro ridership at station-to-station level. Transp. Res. Part D Transp. Environ. 2020, 82, 102332. [Google Scholar] [CrossRef]
- Zhang, W.; Zhao, Y.; Cao, X.; Lu, D.; Chai, Y. Nonlinear effect of accessibility on car ownership in Beijing: Pedestrian-scale neighborhood planning. Transp. Res. Part D Transp. Environ. 2020, 86, 102445. [Google Scholar] [CrossRef]
- Ding, C.; Cao, X.; Liu, C. How does the station-area built environment influence Metrorail ridership? Using gradient boosting decision trees to identify non-linear thresholds. J. Transp. Geogr. 2019, 77, 70–78. [Google Scholar] [CrossRef]
- Xiao, L.; Lo, S.; Liu, J.; Zhou, J.; Li, Q. Nonlinear and synergistic effects of TOD on urban vibrancy: Applying local explanations for gradient boosting decision tree. Sustain. Cities Soc. 2021, 72, 103063. [Google Scholar] [CrossRef]
- Ding, C.; Cao, X.; Næss, P. Applying gradient boosting decision trees to examine non-linear effects of the built environment on driving distance in Oslo. Transp. Res. Part A Policy Pract. 2018, 110, 107–117. [Google Scholar] [CrossRef]
- Dong, W.; Cao, X.; Wu, X.; Dong, Y. Examining pedestrian satisfaction in gated and open communities: An integration of gradient boosting decision trees and impact-asymmetry analysis. Landsc. Urban Plan. 2019, 185, 246–257. [Google Scholar] [CrossRef]
- Yang, L.; Ao, Y.; Ke, J.; Lu, Y.; Liang, Y. To walk or not to walk? Examining non-linear effects of streetscape greenery on walking propensity of older adults. J. Transp. Geogr. 2021, 94, 103099. [Google Scholar] [CrossRef]
- Liu, J.; Wang, B.; Xiao, L. Non-linear associations between built environment and active travel for working and shopping: An extreme gradient boosting approach. J. Transp. Geogr. 2021, 92, 103034. [Google Scholar] [CrossRef]
- Ramraj, S.; Uzir, N.; Sunil, R.; Banerjee, S. Experimenting XGBoost algorithm for prediction and classification of different datasets. Int. J. Control Theory Appl. 2016, 9, 651–662. [Google Scholar]
- Yi, Z.; Liu, X.C.; Markovic, N.; Phillips, J. Inferencing hourly traffic volume using data-driven machine learning and graph theory. Comput. Environ. Urban Syst. 2021, 85, 101548. [Google Scholar] [CrossRef]
- Hong, H.; Naghibi, S.A.; Pourghasemi, H.R.; Pradhan, B. GIS-based landslide spatial modeling in Ganzhou City, China. Arab. J. Geosci. 2016, 9, 1–26. [Google Scholar] [CrossRef]
- Lundberg, S.M.; Erion, G.; Chen, H.; DeGrave, A.; Prutkin, J.M.; Nair, B.; Katz, R.; Himmelfarb, J.; Bansal, N.; Lee, S.I. From Local Explanations to Global Understanding with Explainable AI for Trees. Nat. Mach. Intell. 2020, 2, 56–67. [Google Scholar] [CrossRef]
- Luo, Y.; Liu, Y.; Tong, Z.; Wang, N.; Rao, L. Capturing gender-age thresholds disparities in built environment factors affecting injurious traffic crashes. Travel Behav. Soc. 2023, 30, 21–37. [Google Scholar] [CrossRef]
- Xi, Y.; Hou, Q.; Duan, Y.; Lei, K.; Wu, Y.; Cheng, Q. Exploring the Spatiotemporal Effects of the Built Environment on the Nonlinear Impacts of Metro Ridership: Evidence from Xi’an, China. ISPRS Int. J. Geo-Inf. 2024, 13, 105. [Google Scholar] [CrossRef]
- Chen, L.; Yao, X.; Liu, Y.; Zhu, Y.; Chen, W.; Zhao, X.; Chi, T. Measuring Impacts of Urban Environmental Elements on Housing Prices Based on Multisource Data-A Case Study of Shanghai, China. ISPRS Int. J. Geo-Inf. 2020, 9, 106. [Google Scholar] [CrossRef]
- Kim, M.; Kim, D.; Kim, G. Examining the Relationship between Land Use/Land Cover (LULC) and Land Surface Temperature (LST) Using Explainable Artificial Intelligence (XAI) Models: A Case Study of Seoul, South Korea. Int. J. Environ. Res. Public Health 2022, 19, 15926. [Google Scholar] [CrossRef] [PubMed]
- Ewing, R.; Cervero, R. Travel and the Built Environment: A meta-analysis. J. Am. Plan. Assoc. 2010, 76, 265–294. [Google Scholar] [CrossRef]
- Huang, C.; Xiao, C.; Rong, L. Integrating Point-of-Interest Density and Spatial Heterogeneity to Identify Urban Functional Areas. Remote Sens. 2022, 14, 4201. [Google Scholar] [CrossRef]
- Sung, H.; Lee, S.; Cheon, S. Operationalizing Jane Jacobs’s Urban Design Theory: Empirical vercification from the great city of Seoul, Korea. J. Plan. Educ. Res. 2015, 35, 117–130. [Google Scholar] [CrossRef]
- Mouratidis, K. Urban planning and quality of life: A review of pathways linking the built environment to subjective well-being. Cities 2021, 115, 103229. [Google Scholar] [CrossRef]
- Xu, F.; Zhen, F.; Qin, X.; Wang, X.; Wang, F. From central place to central flow theory: An exploration of urban catering. In Tourism Places in Asia: Destinations, Stakeholders and Consumption; Routledge: Oxfordshire, UK, 2018; pp. 121–142. [Google Scholar]
- Senecal, S.; Nantel, J. The influence of online product recommendations on consumers’ online choices. J. Retail. 2004, 80, 159–169. [Google Scholar] [CrossRef]
- Long, Y.; Huang, C.C. Does block size matter? The impact of urban design on economic vitality for Chinese cities. Environ. Plan. B Urban Anal. City Sci. 2017, 46, 406–422. [Google Scholar] [CrossRef]
- Ye, Y.; Li, D.; Liu, X. How block density and typology affect urban vitality: An exploratory analysis in Shenzhen, China. Urban Geogr. 2018, 39, 631–652. [Google Scholar] [CrossRef]
- Liu, L.; Dong, Y.; Lang, W.; Yang, H.; Wang, B. The Impact of Commercial-Industry Development of Urban Vitality: A Study on the Central Urban Area of Guangzhou Using Multisource Data. Land 2024, 13, 250. [Google Scholar] [CrossRef]
- Yang, J.; Cao, J.; Zhou, Y. Elaborating non-linear associations and synergies of subway access and land uses with urban vitality in Shenzhen. Transp. Res. Part A Policy Pract. 2021, 144, 74–88. [Google Scholar] [CrossRef]
- Masoudi, M. Estimation of the spatial climate comfort distribution using tourism climate index (TCI) and inverse distance weighting (IDW) (case study: Fars Province, Iran). Arab. J. Geosci. 2021, 14, 363. [Google Scholar] [CrossRef]
- Chion, M. Producing Urban Vitality: The Case of Dance in San Francisco. Urban Geogr. 2013, 30, 416–439. [Google Scholar] [CrossRef]
- Chen, Y.; Liu, X.; Li, X.; Liu, X.; Yao, Y.; Hu, G.; Xu, X.; Pei, F. Delineating urban functional areas with building-level social media data: A dynamic time warping (DTW) distance based k -medoids method. Landsc. Urban Plan. 2017, 160, 48–60. [Google Scholar] [CrossRef]
- Li, X. Recognition of Urban Polycentric Structure Based on Spatial Aggregation Characteristics of POl Elements: A Case of Zhengzhou City. J. Peking Univ. Nat. Sci. Ed. 2020, 56, 692–702. (In Chinese) [Google Scholar] [CrossRef]
- Wu, J.; Li, J.; Ma, Y. A Comparative Study of Spatial and Temporal Preferences for Waterfronts in Wuhan based on Gender Differences in Check-In Behavior. ISPRS Int. J. Geo-Inf. 2019, 8, 413. [Google Scholar] [CrossRef]
- Huang, S.; Tang, L.; Hupy, J.P.; Wang, Y.; Shao, G. A commentary review on the use of normalized difference vegetation index (NDVI) in the era of popular remote sensing. J. For. Res. 2021, 32, 1–6. [Google Scholar] [CrossRef]
- Chen, T.; Guestrin, C. Xgboost: A scalable tree boosting system. In Proceedings of the 22nd ACM SIGKDD International Conference on Knowledge Discovery and Data Mining, San Francisco, CA, USA, 13–17 August 2016; pp. 785–794. [Google Scholar]
- Lundberg, S.M.; Lee, S.-I. A unified approach to interpreting model predictions. In Proceedings of the Advances in Neural Information Processing Systems, Long Beach, CA, USA, 4–9 December 2017; pp. 4765–4774. [Google Scholar]
- Liu, D.; Shi, Y. The Influence Mechanism of Urban Spatial Structure on Urban Vitality Based on Geographic Big Data: A Case Study in Downtown Shanghai. Buildings 2022, 12, 569. [Google Scholar] [CrossRef]
- Wang, Y.; Yue, X.; Zhang, H.o.; Su, Y.; Qin, J. Relationship between Urban Floating Population Distribution and Livability Environment: Evidence from Guangzhou’s Urban District, China. Sustainability 2021, 13, 13477. [Google Scholar] [CrossRef]
- Yue, W.; Chen, Y.; Zhang, Q.; Liu, Y. Spatial Explicit Assessment of Urban Vitality Using Multi-Source Data: A Case of Shanghai, China. Sustainability 2019, 11, 638. [Google Scholar] [CrossRef]
- Tao, T.; Wu, X.; Cao, J.; Fan, Y.; Das, K.; Ramaswami, A. Exploring the Nonlinear Relationship between the Built Environment and Active Travel in the Twin Cities. J. Plan. Educ. Res. 2020, 43, 637–652. [Google Scholar] [CrossRef]
- Liu, J.; Xiao, L. Non-linear relationships between built environment and commuting duration of migrants and locals. J. Transp. Geogr. 2023, 106, 103517. [Google Scholar] [CrossRef]
- Mouratidis, K.; Poortinga, W. Built environment, urban vitality and social cohesion: Do vibrant neighborhoods foster strong communities? Landsc. Urban Plan. 2020, 204, 103951. [Google Scholar] [CrossRef]
- Pan, Z.; Xu, J.; Guo, Y.; Hu, Y.; Wang, G. Deep Learning Segmentation and Classification for Urban Village Using a Worldview Satellite Image Based on U-Net. Remote Sens. 2020, 12, 1574. [Google Scholar] [CrossRef]
- De Nadai, M.; Staiano, J.; Larcher, R.; Sebe, N.; Quercia, D.; Lepri, B. The death and life of great Italian cities: A mobile phone data perspective. In Proceedings of the 25th International Conference on World Wide Web, Montreal, QC, Canada, 11–15 April 2016; pp. 413–423. [Google Scholar]
- Wu, L.; Zhi, Y.; Sui, Z.; Liu, Y. Intra-urban human mobility and activity transition: Evidence from social media check-in data. PLoS ONE 2014, 9, e97010. [Google Scholar] [CrossRef] [PubMed]
- Li, X.; Li, Y.; Jia, T.; Zhou, L.; Hijazi, I.H. The six dimensions of built environment on urban vitality: Fusion evidence from multi-source data. Cities 2022, 121, 103482. [Google Scholar] [CrossRef]
- Gao, F.; Li, S.; Tan, Z.; Wu, Z.; Zhang, X.; Huang, G.; Huang, Z. Understanding the modifiable areal unit problem in dockless bike sharing usage and exploring the interactive effects of built environment factors. Int. J. Geogr. Inf. Sci. 2021, 35, 1905–1925. [Google Scholar] [CrossRef]





| Data Name | Year | Data Source |
|---|---|---|
| Guangzhou Administrative Boundaries | 2023 | https://www.webmap.cn/, accessed on 6 February 2023. |
| Guangzhou Main Urban Area Road Network | 2023 | https://www.openstreetmap.org/, accessed on 19 February 2023. |
| GF-2 Data | 2023 | https://www.cpeos.org.cn/, accessed on 7 December 2023. https://www.cpeos.org.cn/, accessed on 29 April 2024. |
| GF-6 Data | 2024 | |
| Guangzhou Baidu Heatmap Data | 2023 | https://map.baidu.com/, accessed on 26 March 2024. |
| Guangzhou Social Perception Data | 2023 | https://www.dianping.com/, accessed on 15 January 2024. |
| Guangzhou Main Urban Area POI | 2023 | https://ditu.amap.com/, https://map.baidu.com/, accessed on 23 January 2024. |
| Guangzhou Main Urban Area Building Data | 2023 | https://www.tianditu.gov.cn, https://ditu.amap.com/, accessed on 21 April 2023. |
| Guangzhou Main Urban Area Transportation Stations | 2023 | https://ditu.amap.com/, https://map.baidu.com/, accessed on 29 April 2023. |
| Guangzhou Main Urban Area Housing Price Data | 2023 | https://www.anjuke.com/, accessed on 7 December 2023. |
| Guangzhou Population Data | 2022 | https://landscan.ornl.gov/, accessed on 1 September 2023. |
| Data Name | Source | Quantity and Type | Data Content |
|---|---|---|---|
| Dianping Store Count | https://www.dianping.com/ (Accessed on 15 January 2024) | 141,350 locations | Reflects industry living density |
| Dianping User Reviews | https://www.dianping.com/ (Accessed on 16 January 2024) | 7,783,935 reviews | Reflects consumer behavior |
| Dianping Store Ratings | https://www.dianping.com/ (Accessed on 17 January 2024) | 4093 total, 3,507,296 ratings | Reflects store service quality |
| Company and Cultural Facilities (POI) | https://map.baidu.com/, https://ditu.amap.com/ (Accessed on 17 October 2023) | 48,681 company POI points 15,240 cultural facilities POI points | Reflects business environment and urban layout |
| Baidu Heatmap | https://huiyan.baidu.com/ (Accessed on 4 November 2023) | 875,559 hotspots, vector map | Reflects population flow and activity |
| Vegetation Index | https://www.cpeos.org.cn/ (Accessed on 29 April 2024) | Raster TIFF format | Reflects the lushness of surface vegetation |
| Influencing Factors | Indicator | Positive/Negative | Meaning | |
|---|---|---|---|---|
| Internal Attributes | Location | Street Location (DTZ) | Negative | Reflects the accessibility of the block to the city center |
| Spatial Form | Spatial Compactness (SC) | Positive | Indicates the intricacy of the spatial layout within the block | |
| Fractal Dimension (FD) | Positive | Reflects the complexity of the block’s form | ||
| Functional Form | POI Mix Degree (ME) | Positive | Reflects the mixing degree of various functional POI densities | |
| POI Density (POID) | Positive | Indicates the concentration of different Points of Interest (POIs) within the area | ||
| Population Characteristics | Population Density (PD) | Positive | Reflects the population density within the block | |
| External Environment | Accessibility | Square (DSQ) | Negative | Reflects the accessibility of squares within the block |
| Park (DTP) | Negative | Reflects the accessibility of parks within the block | ||
| Subway Station (DSB) | Negative | Reflects the accessibility of subway stations within the block | ||
| Building Function | Housing Price Level (APH) | Positive | Indicates the housing quality within the area | |
| Building Density (BD) | Positive | Reflects the block’s vacancy rate and building density | ||
| Floor Area Ratio (FAR) | Positive | Indicates the level of development within the area | ||
| Building Height (BH) | Positive | Indicates the mean height of buildings within the area |
| Vitality Dimension | Data Type | Weight |
|---|---|---|
| Economic Vitality | Block Store Comprehensive Rating | 0.015 |
| Block Store Total Review Count | 0.024 | |
| Enterprise Company Density | 0.079 | |
| Dianping Store Density | 0.154 | |
| Social Vitality | Baidu Heatmap | 0.247 |
| Cultural Vitality | Cultural Facility POI Density | 0.425 |
| Ecological Vitality | NDVI | 0.056 |
| Hyperparameter | Description | Optimal Hyperparameter |
|---|---|---|
| max_depth | Specifies the maximum depth of each tree | 5 |
| learning_rate | Determines the contribution of each tree in the model | 0.1 |
| colsample_bytree | Specifies the subsample ratio of columns when constructing each tree | 0.8 |
| subsample | Subsampling ratio of the training instance | 0.9 |
| min_child_weight | Minimum sum of instance weight (hessian) needed in a child | 1 |
| n_estimators | Number of trees to be constructed | 200 |
Disclaimer/Publisher’s Note: The statements, opinions and data contained in all publications are solely those of the individual author(s) and contributor(s) and not of MDPI and/or the editor(s). MDPI and/or the editor(s) disclaim responsibility for any injury to people or property resulting from any ideas, methods, instructions or products referred to in the content. |
© 2024 by the authors. Licensee MDPI, Basel, Switzerland. This article is an open access article distributed under the terms and conditions of the Creative Commons Attribution (CC BY) license (https://creativecommons.org/licenses/by/4.0/).
Share and Cite
Ling, Z.; Zheng, X.; Chen, Y.; Qian, Q.; Zheng, Z.; Meng, X.; Kuang, J.; Chen, J.; Yang, N.; Shi, X. The Nonlinear Relationship and Synergistic Effects between Built Environment and Urban Vitality at the Neighborhood Scale: A Case Study of Guangzhou’s Central Urban Area. Remote Sens. 2024, 16, 2826. https://doi.org/10.3390/rs16152826
Ling Z, Zheng X, Chen Y, Qian Q, Zheng Z, Meng X, Kuang J, Chen J, Yang N, Shi X. The Nonlinear Relationship and Synergistic Effects between Built Environment and Urban Vitality at the Neighborhood Scale: A Case Study of Guangzhou’s Central Urban Area. Remote Sensing. 2024; 16(15):2826. https://doi.org/10.3390/rs16152826
Chicago/Turabian StyleLing, Zhenxiang, Xiaohao Zheng, Yingbiao Chen, Qinglan Qian, Zihao Zheng, Xianxin Meng, Junyu Kuang, Junyu Chen, Na Yang, and Xianghua Shi. 2024. "The Nonlinear Relationship and Synergistic Effects between Built Environment and Urban Vitality at the Neighborhood Scale: A Case Study of Guangzhou’s Central Urban Area" Remote Sensing 16, no. 15: 2826. https://doi.org/10.3390/rs16152826
APA StyleLing, Z., Zheng, X., Chen, Y., Qian, Q., Zheng, Z., Meng, X., Kuang, J., Chen, J., Yang, N., & Shi, X. (2024). The Nonlinear Relationship and Synergistic Effects between Built Environment and Urban Vitality at the Neighborhood Scale: A Case Study of Guangzhou’s Central Urban Area. Remote Sensing, 16(15), 2826. https://doi.org/10.3390/rs16152826


