Article

Surface Subsidence Characteristics and Causes Analysis in Ningbo Plain by Sentinel-1A TS-InSAR

1
Department of Surveying Engineering, Guangdong University of Technology, Guangzhou 510006, China
2
Key Laboratory for City Cluster Environmental Safety and Green, Development of the Ministry of Education, Guangdong University of Technology, Guangzhou 510006, China
3
College of Natural Resources and Environment, South China Agricultural University, Guangzhou 510642, China
4
School of Civil and Environmental Engineering, the University of New South Wales (UNSW), Sydney, NSW 2052, Australia
5
Geoscience Australia, Canberra, ACT 2609, Australia
*
Author to whom correspondence should be addressed.
Remote Sens. 2024, 16(13), 2438; https://doi.org/10.3390/rs16132438
Submission received: 7 May 2024 / Revised: 24 June 2024 / Accepted: 29 June 2024 / Published: 3 July 2024
(This article belongs to the Special Issue Remote Sensing in Urban Natural Hazards Monitoring)

Abstract

:
In recent years, the Ningbo Plain has experienced significant surface subsidence due to urbanization and industrialization, combined with the area’s unique geological and hydrological conditions. To study the surface subsidence and its causes in the Ningbo Plain, this study analyzed 166 scenes of Sentinel-1A SAR images between January 2018 and June 2023. The time series interferometric synthetic aperture radar (TS-InSAR) technique was used to acquire surface subsidence information in the area. The causes of subsidence were analyzed. The results show that: (1) the annual deformation rate of the Ningbo Plain ranges from −44 mm/yr to 12 mm/yr between 2018 and 2023. A total of 15 major subsidence zones were identified by using both the subsidence rate map and optical imagery. The most severe subsidence occurred in the northern industrial park of Cixi City, with a maximum subsidence rate of −37 mm/yr. The study reveals that the subsidence issue in the main urban area has been significantly improved compared to the 2017 subsidence data from the Ningbo Bureau of Natural Resources and Planning. However, three new subsidence areas have emerged in the main urban area, located, respectively, in Gaoqiao Town, Lishe Town, and Qiuyi Village, with maximum rates of −29 mm/year, −24 mm/year, and −23 mm/year, respectively. (2) The causes of subsidence were analyzed using various data, including land use data, geological data, groundwater-monitoring data, and transportation network data. It is found that a strong link exists between changes in groundwater levels, compressible layer thickness, and surface subsidence. The groundwater levels changes and the soft soil layer thickness are the main natural factors causing subsidence in the Ningbo Plain. Additionally, the interaction between static loads from large-scale industrial production and urban construction, along with the dynamic loads from transportation networks, contribute significantly to surface subsidence in the Ningbo Plain. The results from this study enhance the understanding of the driving factors of subsidence in the Ningbo Plain, which can provide necessary guidance for the economic development and decision-making in the region, helping to manage and potentially mitigate future subsidence issues.

1. Introduction

Surface subsidence is a common geological disaster globally, resulting from geological conditions or human activities such as groundwater and petroleum extraction, leading to a decrease in local ground elevation [1,2,3,4,5]. Over the past few decades, many countries in the world (such as China, Mexico, Indonesia, etc.) have experienced surface subsidence, leading to significant economic losses [6,7,8,9,10,11], highlighting the importance of addressing the hazards brought by surface subsidence. Surface subsidence not only harms infrastructure, causing economic losses, but could also cause other natural disasters, such as rising sea levels, seawater intrusion, and increased frequency of flooding [12,13,14,15,16]. Currently, the rapid growth of global economic development and ongoing urbanization are increasing the impact of surface subsidence [17,18]. Therefore, it is crucial to use TS-InSAR technology to monitor the changes in surface subsidence over time and space and to analyze its inducing factors [19].
In recent years, China has continuously intensified its efforts towards opening up and cooperation, experiencing unprecedented large-scale urbanization development. Many economically developed cities such as the Beijing–Tianjin–Hebei Urban Agglomeration, Shanghai, Zhuhai, and Xi’an have experienced severe subsidence [20,21,22,23]. The Ningbo Plain is one of the areas in China with the most severe subsidence phenomenon, with the subsidence area continuously expanding since 1964. According to data from 2016, the subsidence area in the urban area of Ningbo has already reached 500 km2 [24]. To date, Ningbo has been one of the cities in China with relatively severe subsidence, with a history of subsidence of more than 50 years, causing the city more than CNY 20 billion in economic losses, affecting the construction and development of the port city [25]. Therefore, the continuous monitoring and analysis of subsidence in the Ningbo Plain is essential for the long-term development of Ningbo. This can provide references for preventing and mitigating the hazards of ground subsidence in the area, thereby reducing unnecessary economic losses caused by subsidence [26].
Traditional methods for monitoring surface subsidence include leveling surveys, the global navigation satellite system (GNSS), hydrostatic leveling and electronic total stations, etc. These methods primarily focus on point measurements; although they offer high accuracy, their spatial coverage is limited. They are restricted to small-scale, short-term measurements, and are costly and time-consuming, making them inadequate for large-scale and long-term monitoring needs [27,28,29]. In recent years, with the continuous development and maturation of interferometric synthetic aperture radar (InSAR) technology, it has provided a simpler and more efficient method for large-scale and long-term ground motion monitoring. InSAR offers advantages such as all-weather capability, wide coverage, low monitoring costs, high temporal resolution, and low human resource requirements [30]. However, as the application of InSAR has deepened, its effectiveness in monitoring subtle deformations has been significantly impacted by various uncertainties like atmospheric delays, reducing measurement accuracy. To overcome the limitations of InSAR technology, researchers have proposed several time series InSAR techniques; for instance, the permanent scatterer InSAR (PS-InSAR) technique proposed by Ferretti et al. [31] and the small baseline subset InSAR (SBAS-InSAR) technique proposed by Berardino et al. [32]. These methods have successfully addressed the issues of temporal and spatial decorrelation and atmospheric delays. Currently, these techniques are widely applied in fields such as earthquake deformation [33,34], volcanic eruptions [35,36], and glaciers [37,38], making them one of the most mainstream deformation-monitoring methods.
In the past, research on subsidence in the Ningbo Plain has been relatively limited. The methods used have generally fallen into two categories: using hydrological and soil models to simulate subsidence and applying TS-InSAR technology to monitor subsidence. Studies using hydrological and soil models to simulate subsidence in Ningbo have been more common. For example, Zheng et al. (1991), Yang et al. (2014), and Yu et al. (2020) utilized numerical simulation methods to analyze subsidence in the Ningbo urban area based on hydrogeological data. The results indicated a correlation between surface subsidence and geological structures as well as declining groundwater levels in the area [39,40,41]. Although hydrogeological models are highly reliable, they require detailed stratigraphic parameters and substantial field data for numerical solution. The research on subsidence in this region based on TS-InSAR technology includes Zhu et al. [42], who monitored ground subsidence in Ningbo in 2018 using 21 scenes of Sentinel-1A data and found that the distribution of subsidence centers was dispersed throughout the area, with a maximum subsidence rate of 22 mm/yr and a total subsidence amount of 30 mm. In 2022, Wen et al. [43] used SBAS technology to monitor the surface subsidence along the Ningbo rail transit line. The results showed that the surface subsidence along the rail transit line in the older urban area centered around Sanjiangkou was relatively stable, and the subsidence rate during subway operation was higher than that during the construction phase. Gao et al. [44] used Radarsat-2C data in 2023 obtain the average subsidence rate of Ningbo in 2020 and evaluated the subsidence risk, concluding that there were no high-risk subsidence areas in Ningbo, but there were more than ten subsidence areas. However, these studies primarily focused on monitoring subsidence in specific areas of the plain from 1991 to 2020, without conducting a detailed analysis of the causes of subsidence. Currently, there is a limited understanding of subsidence trends and rates across the entire Ningbo Plain, as well as the relationship between groundwater and surface deformation in the region. Further quantitative analysis is needed to understand the deformation characteristics caused by natural and anthropogenic factors. Here, we systematically explored the influencing factors of surface subsidence in the Ningbo Plain for the first time.
Building upon previous research, this study utilized TS-InSAR technology and C-band Sentinel-1A data from the European Space Agency with a temporal resolution of 12 days from January 2018 to June 2023 to investigate the large-scale surface subsidence characteristics of the Ningbo Plain, obtaining the spatiotemporal distribution characteristics of subsidence. Subsequently, GPS data were used to validate the accuracy of the TS-InSAR results. The main objectives of this study were as follows: (1) to obtain the latest deformation trends of the Ningbo Plain using TS-InSAR technology; (2) to explore the relationships among various influencing factors of surface deformation by collecting hydrogeological data, land use data, etc. This paper is organized as follows: Section 2 presents the basic information and datasets of the study area. Section 3 elaborates on the research methods and approach. Section 4 analyzes the spatial distribution characteristics of surface subsidence rates in the Ningbo Plain. In Section 5, we focus on the relationship between changes in groundwater levels and the thickness of soft soil with surface subsidence. Additionally, we explore the impact of human activities on subsidence by combining land use types and subway route data. The conclusions are provided in Section 6.

2. Study Area and Materials

2.1. Study Area

The Ningbo Plain (E120°55′–122°16′, N28°51′–30°33′) is located in the middle section of the Chinese coastline, on the southern wing of the Yangtze River Delta, with a total area of approximately 9816 km2 (Figure 1). It possesses a subtropical monsoon climate and is characterized by distinct seasons and abundant rainfall, flat terrain, and an average elevation of 4.7 m. According to local meteorological bureau data, rainfall is relatively frequent from May to October in this region, with an average annual precipitation of 1517.1 mm. The area is part of the Yong River basin, consisting of two major tributaries, Fenghua River and Yao River, along with numerous main stream segments.
The Ningbo Plain has been influenced by multiple sea–land changes during the Quaternary period, resulting in the development of a complex set of continental and marine sedimentary deposits [39,40,41]. The most widespread among them is the Quaternary alluvial layer, which mainly consists of clay, silty clay, and loess clay [45]. Its physical and mechanical properties are characterized by high water content, a large natural void ratio, low strength, high compressibility, and thixotropy properties [46]. In the mid-1960s, the excessive exploitation of groundwater resources for early established factories and residential water use, among other factors, led to subsidence of the ground in Ningbo [47]. According to relevant statistics, during the period from 1986 to 2002, the cumulative subsidence of the first soft soil layer in Ningbo was 133.8 mm, accounting for 66.9% of the total subsidence, while the subsidence of the remaining soil layers was 63.6 mm, accounting for 31.8% of the total subsidence [40]. In order to mitigate subsidence in the region, in mid-2008, the municipal government formulated the “Eleventh Five-Year Plan for Prevention and Control of Ground Subsidence in Ningbo”. The plan designated 23 streets (towns) in Haishu District, Jiangdong District, and Jiangbei District as no-extraction zones, sealing all extraction wells except for water level monitoring and emergency water supply wells. Additionally, subsidence-monitoring facilities were established to strengthen the monitoring of ground subsidence, regulation of groundwater extraction, and prevention of other geological disasters in Ningbo [48].

2.2. Datasets

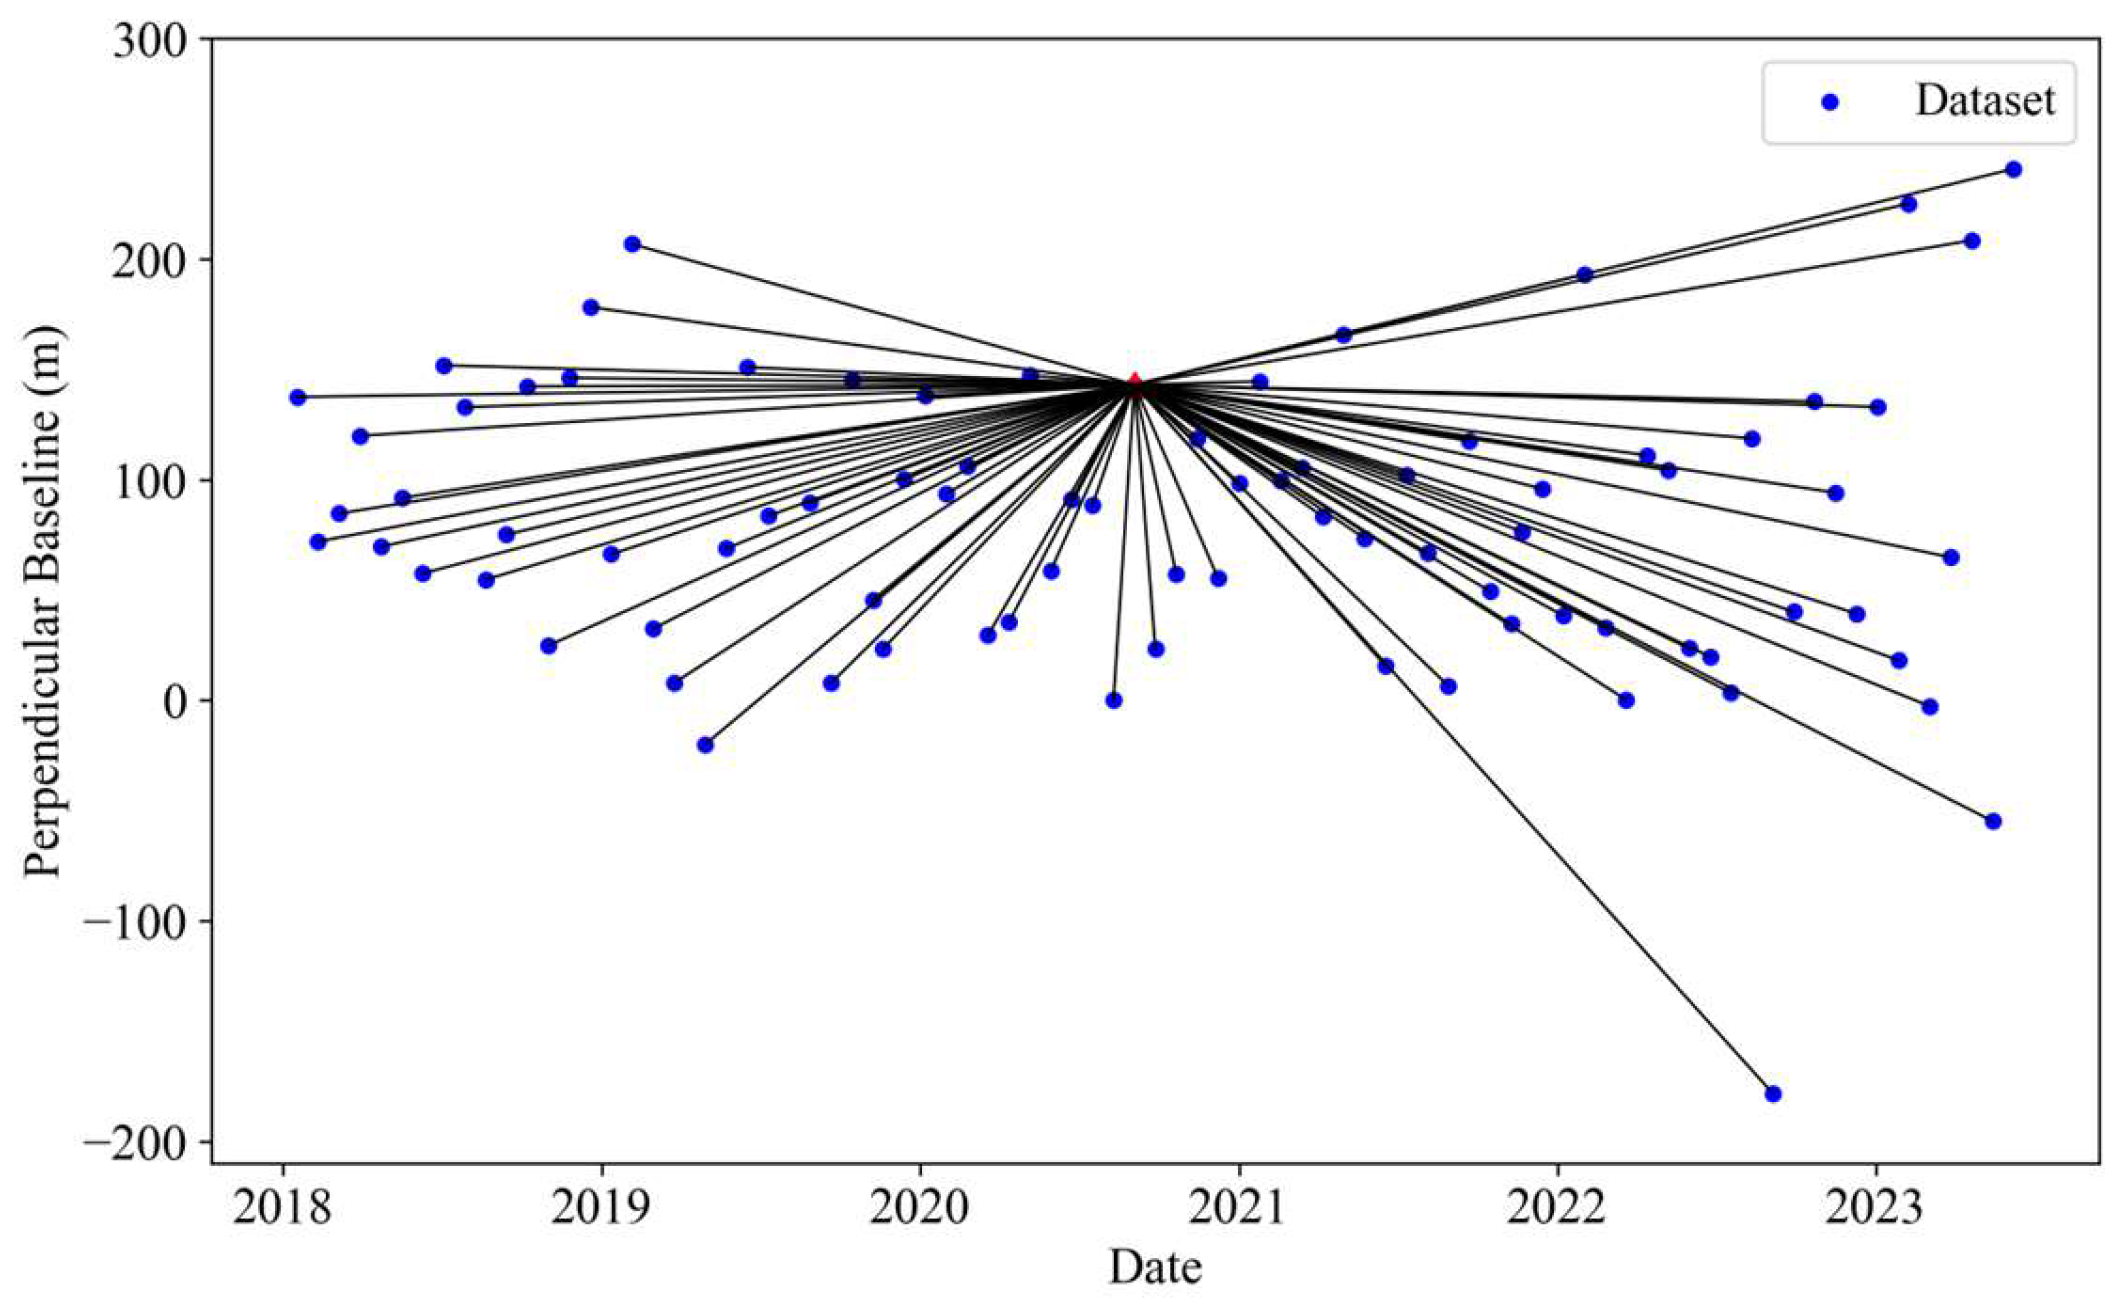
In this study, a total of 166 ascent orbit images from the Sentinel-1A satellite launched by the European Space Agency (ESA) were collected and processed, with the coverage shown in Figure 1a. The satellite is equipped with a C-band SAR antenna, operating in interferometric wide (IW) mode, with a revisit period of 12 days. The 166 SAR images were acquired from frame 91 and frame 96, covering the period from January 2018 to June 2023. The specific parameters of the images are shown in Table 1. The detailed distribution information of the spatiotemporal baselines for these datasets is illustrated in Figure 2.
The experiment utilized the 1-arc-second Shuttle Radar Topography Mission (SRTM) DEM released by NASA to remove topographic phases, and corrected orbit errors using precise data and auxiliary orbit data provided by the European Space Agency [49]. Optical images were obtained from Google Earth, while geological borehole data were sourced from the China Geological Cloud Data Sharing Network [50]. Land use data were obtained from the Pengcheng Laboratory [51], along with data from 26 groundwater-monitoring wells [52] and 2 GPS data points [53].

3. Methodology

3.1. Time Series InSAR Processing

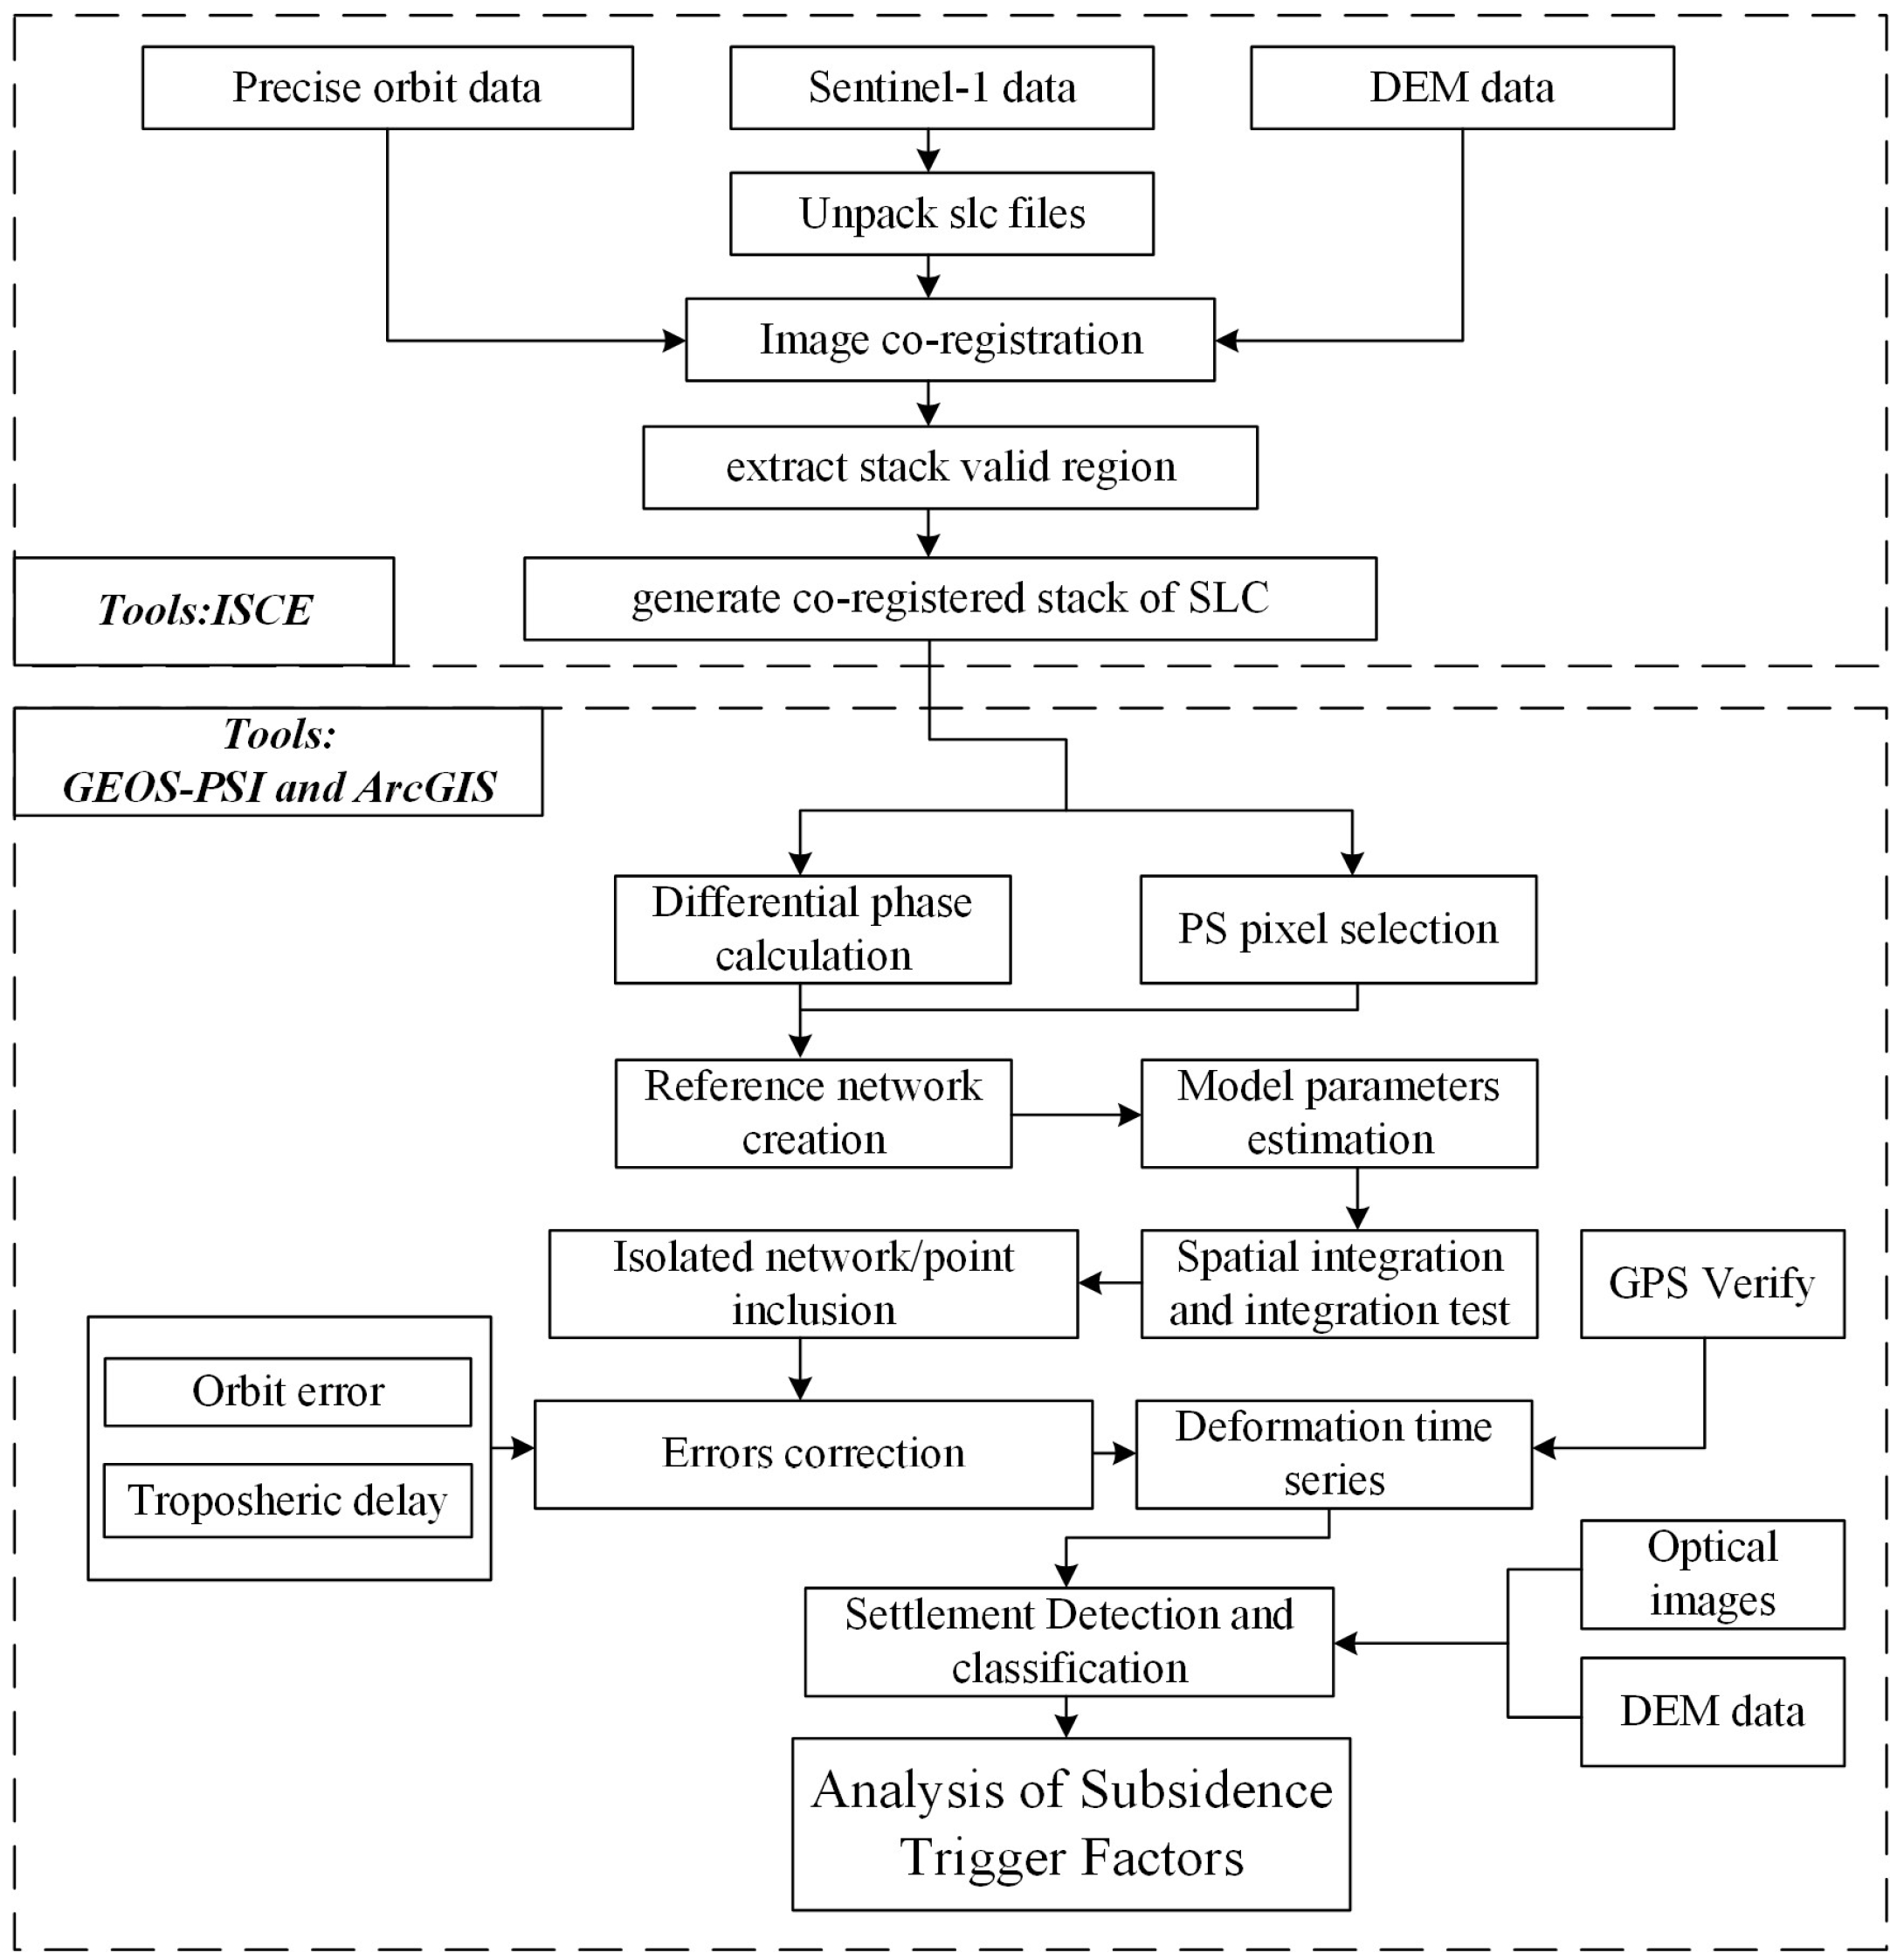
In this study, the TS-InSAR method was employed to monitor subsidence in the study area, consisting primarily of two steps, as shown in Figure 3. Firstly, the open-source InSAR Scientific Computing Environment (ISCE) tool [54] was utilized for preprocessing the data in the study area. Subsequently, the TS-InSAR software, GEO-PSI(v3.7), was used to correct errors in the data and conduct the time series analysis [55,56]. The specific process is outlined as follows:
1. Generation of differential interferograms: The ISCE software (v2.3) was used to generate differential interferograms, during which precise orbit files and 1-degree SRTM DEM were employed to estimate and remove orbit errors and terrain phase components [57]. The differential interferometric phase between the master and slave images can be expressed as:
φ d i f f = W ( φ d e f + φ t o p o + φ f l a t + φ A P S + φ n o i s e )
where W is a phase wrapping operation, φ d e f represents the deformation phase, φ t o p o denotes the residual topographic phase, φ f l a t is the residual flat earth phase, φ A P S stands for the atmospheric delay phase, and φ n o i s e represents the noise phase.
2. Pixel reliability estimation: Due to the interference phase being affected by noise, it is not difficult to identify the PS points based on the stability of the pixel phase [31]. Therefore, the amplitude dispersion index (ADI) was used here to determine stable pixels [31]. For N scene images, the amplitude dispersion index D A of a pixel is expressed as:
D A = σ a a ¯ = i = 1 N S i S ¯ 2 N 1 N i = 1 N S i
In the equation, σ a represents the amplitude standard deviation of a single pixel, a ¯ represents the mean amplitude of a single pixel, S is the complex signal value of the pixel, and N is the number of images. When the amplitude dispersion index of a pixel ( D A ) was below a certain threshold, it was determined as a PS candidate point (PSC) (the threshold was set to 0.4 in the experiment) and included in the next step of the analysis.
3. Reference network construction and model parameter estimation: In simple terms, based on the second step, PSCs with an amplitude dispersion index lower than 0.25 were selected, and an initial reference network was created based on an irregular triangulation network. The phase difference between two adjacent pixels in the irregular triangulation network can be represented as:
φ d i f f = 4 π λ B t v + 4 π λ B r sin θ h + e
In the equation, B t , B , r , λ , and θ , respectively, represent the temporal baseline, perpendicular baseline, distance range, radar wavelength, and local incidence angle. v and h denote the pixel displacement rate and DEM error, while e represents the unmodeled error. The least squares ambiguity decorrelation adjustment (LAMBA) method was used to solve for the model parameters ( v and h ) [58]. To ensure the correctness of the estimation results, the ensemble phase coherence | r | was used to evaluate the model parameters within the arc segment, which can be expressed as [31]:
γ x , y = n = 1 N e x p   ( j φ x , y n j φ M o d e l . x , y n ) N
where γ x , y represents the temporal coherence between two points in the arc segment, φ x , y n represents the differential phase between two points in the arc segment, and φ M o d e l . x , y n represents the differential model phase between two points in the arc segment. When | r | fell below a certain threshold (set to 0.8 in the experiment), the arc segment was excluded.
4. Spatial integration and reference point densification: Due to the elimination of abnormal arc segments in the reference network, isolated PS candidate points and networks may inevitably appear. Therefore, it is necessary to search and identify all isolates, and then perform integrated processing similar to the leveling network adjustment for each network to obtain the displacement rate and DEM error of each reference point. In the process of spatial integration and outlier detection based on least squares M estimation, the abnormal arc segments in the integration are eliminated, and the above steps are repeated until passing the statistical test [52]. In the above process, due to the removal of abnormal points and arc segments, the number of points in the reference network decreases, which is not conducive to displaying the details of deformation. Therefore, in order to increase the number of points, an adaptive estimation strategy was adopted to add some points with poor reliability (PSC) (0.25 < ADI < 0.4) to the reference network [59].
5. Estimation and removal of orbit errors and atmospheric phase: In order to obtain accurate surface deformation, it is necessary to remove errors from the residual phase, with the expression as follows:
φ R e s i d u a l = φ n o n l i n e a r + φ A P S + φ f l a t + φ o r b i t + φ n o i s e
where φ R e s i d u a l is the residual phase, φ n o n l i n e a r is the non-linear phase, φ o r b i t is the orbit errors, φ n o i s e is the noise phase. Prior to this, it is necessary to unwrap the residual phase, consider the long-wave spatial trend in the unwrapped residual phase as the orbit error, and remove the orbit error by performing least squares fitting on the residual phase of each unwrapped interferogram. Since atmospheric errors are usually related to altitude, it is necessary to divide atmospheric errors into two parts: the terrain-independent atmospheric phase and terrain-related atmospheric phase. Here, temporal high-pass filtering and spatial low-pass filtering were used to remove the non-terrain-related atmospheric phase. The terrain-related atmospheric phase was removed by calculating the ratio relationship between the elevation information of measurement points and the unwrapped residual phase [31].
6. Non-linear deformation estimation and acquisition of deformation time series: After eliminating orbit errors and atmospheric errors, the phase was still affected by noise components. Therefore, after unwrapping is completed, spatial low-pass filtering and temporal low-pass filtering were applied successively to each interferogram to obtain information on the non-linear deformation. Finally, linear displacement was added to the non-linear displacement transformation to form the complete surface deformation information [60,61].

3.2. Grey Relation Analysis (GRA) Method

Gray relational analysis, proposed by Deng et al. (1995), is a multivariate statistical analysis method for quantitatively describing and comparing systematic trends [62]. The basic idea is to assess the proximity of two factors based on the similarity of the geometric shape of their sequence curves. The higher the consistency of trend changes between two factors, the higher the degree of correlation; conversely, the lower the degree of correlation. The expression is as follows:
ζ i ( k ) = m i n i   m i n k   x 0 ( k ) x i ( k ) + ρ m a x i   m a x k   x 0 ( k ) x i ( k ) x 0 ( k ) x i ( k ) + ρ m a x i   m a x k   x 0 ( k ) x i ( k )
where ζ i ( k ) is the relation coefficient, x 0 ( k ) represents the reference sequence, x i ( k ) represents subsequences, and ρ represents the distinguish coefficient (general value is 0.5). It is generally considered that a correlation coefficient above 80% indicates a high correlation, while one between 60% and 80% indicates a moderate correlation. Correlation coefficients below 60% indicate a low correlation or that the factor is insignificant [63,64].

3.3. Vertical and Horizontal Deformation

Since Sentinel-1A mainly collects ascending data only in many areas, the vertical and horizontal components of surface deformation cannot be independently inverted. According to relevant studies, deformations in urban areas are mainly vertical [65,66,67], and InSAR is more sensitive to vertical motion compared to horizontal motion. Therefore, we ignored displacement in the horizontal direction. According to the geometric principles of InSAR imaging, the radar line-of-sight (LOS) displacement was converted to vertical displacement, which can be expressed as follows:
d v = d l o s cos θ
where d v represents the vertical displacement, d l o s represents the line-of-sight (LOS) displacement, and θ represents the radar local incidence angle. According to Equation (7), the TS-InSAR displacement was converted to vertical displacement. In the following sections of this paper, we use the vertical subsidence rate derived from the observed LOS velocity [68].

4. Results

4.1. The Spatial Distribution of Surface Subsidence Monitoring

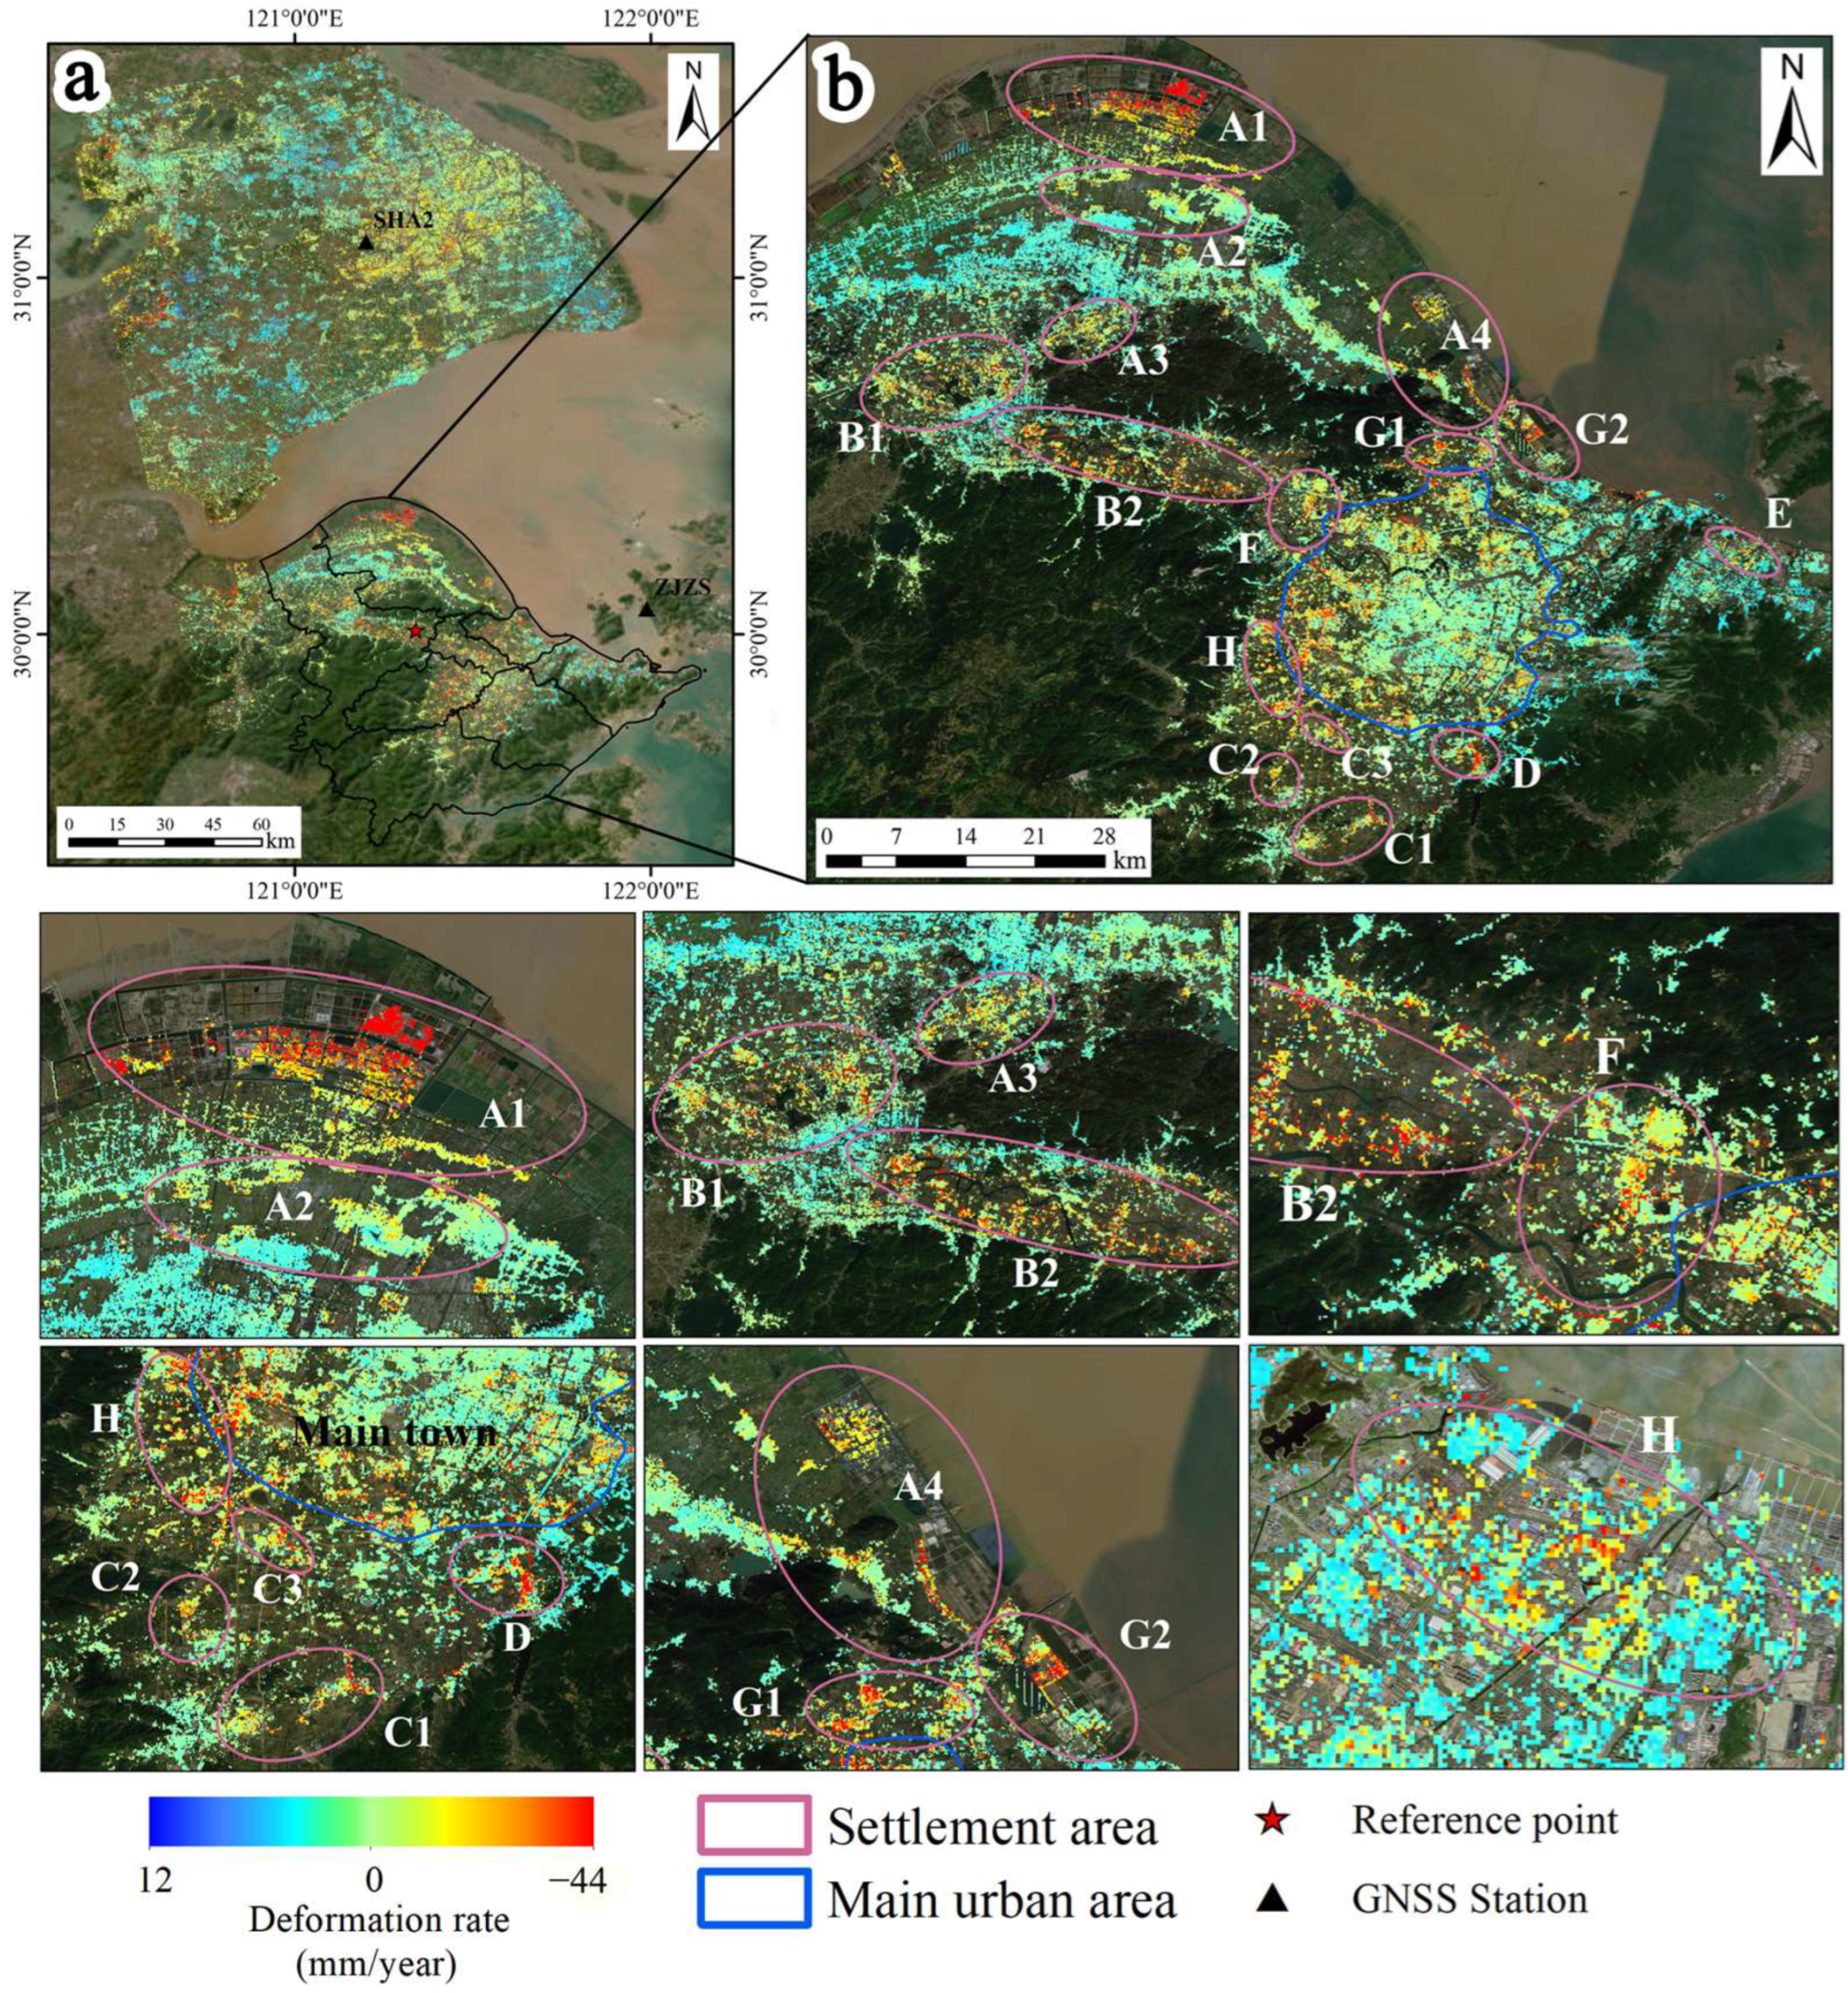
Figure 4 shows the average LOS deformation rate of the Ningbo Plain obtained using TS-InSAR from January 2018 to June 2023. Positive values (blue) indicate targets moving towards the satellite (uplift) along the LOS, while negative values (red) indicate targets moving away from the satellite (subsidence) along the LOS. During the study period, the average subsidence rate in the Ningbo Plain ranged from 12.4 mm/yr to −43.5 mm/yr. According to the Technical Specification for Ground Subsidence Interferometric Radar Data Processing Standards (DD204-11) of the China Geological Survey [69], the surface subsidence in the Ningbo Plain is of a relatively low degree, and the overall trend of surface subsidence is stable.
The distribution of subsidence areas in the Ningbo Plain is relatively scattered, mainly occurring along the edges of towns and the coastline. Therefore, in this study, subsidence is mainly divided into 15 subsidence areas and one main urban subsidence area based on administrative regions, as shown in Figure 4b. Among them, there are four main subsidence areas in Cixi City, namely the North Industrial Park subsidence area (A1), Shengshan subsidence area (A2), Henghe Town subsidence area (A3), and Longshan Town subsidence area (A4). The North Industrial Park subsidence area (A1) experiences the most severe subsidence, with a maximum subsidence rate of −37.1 mm/year. Yuyao City mainly has two subsidence areas, namely the western part of Yuyao North Station subsidence area (b1) and the southeastern subsidence area (B2) of Yuyao. The largest subsidence area is located in the southeastern subsidence area (B2) of Yuyao, with a maximum subsidence rate of −36.3 mm/year. Fenghua has three main subsidence areas, namely the Xiwu Town subsidence area (C1), Jiangkou subsidence area (C2), and Ning’an Road subsidence area (C3). The Ning’an Road subsidence area (C3) experiences the most severe subsidence, with a maximum subsidence rate of −28.7 mm/year. Zhenhai District has two main subsidence areas, namely the eastern industrial park subsidence area (D1) and the subsidence area (D2) centered around the JiuLong Lake Central School. The subsidence in the eastern industrial park area of Zhenhai District (D1) is the most severe, with a maximum subsidence rate of −41.2 mm/year. Haishu District, Jiangbei District, Beilun District, and Yinzhou District each have only one subsidence area, namely the Hengjie Town subsidence area (F), the Cicheng Bridge subsidence area (E), the Jingang Middle Road subsidence area (H), and the Panyi Industrial Park subsidence area (G) in Yinzhou. Their maximum subsidence rates are −25.7 mm/year, −26.1 mm/year, −19.1 mm/year, and −24.3 mm/year.
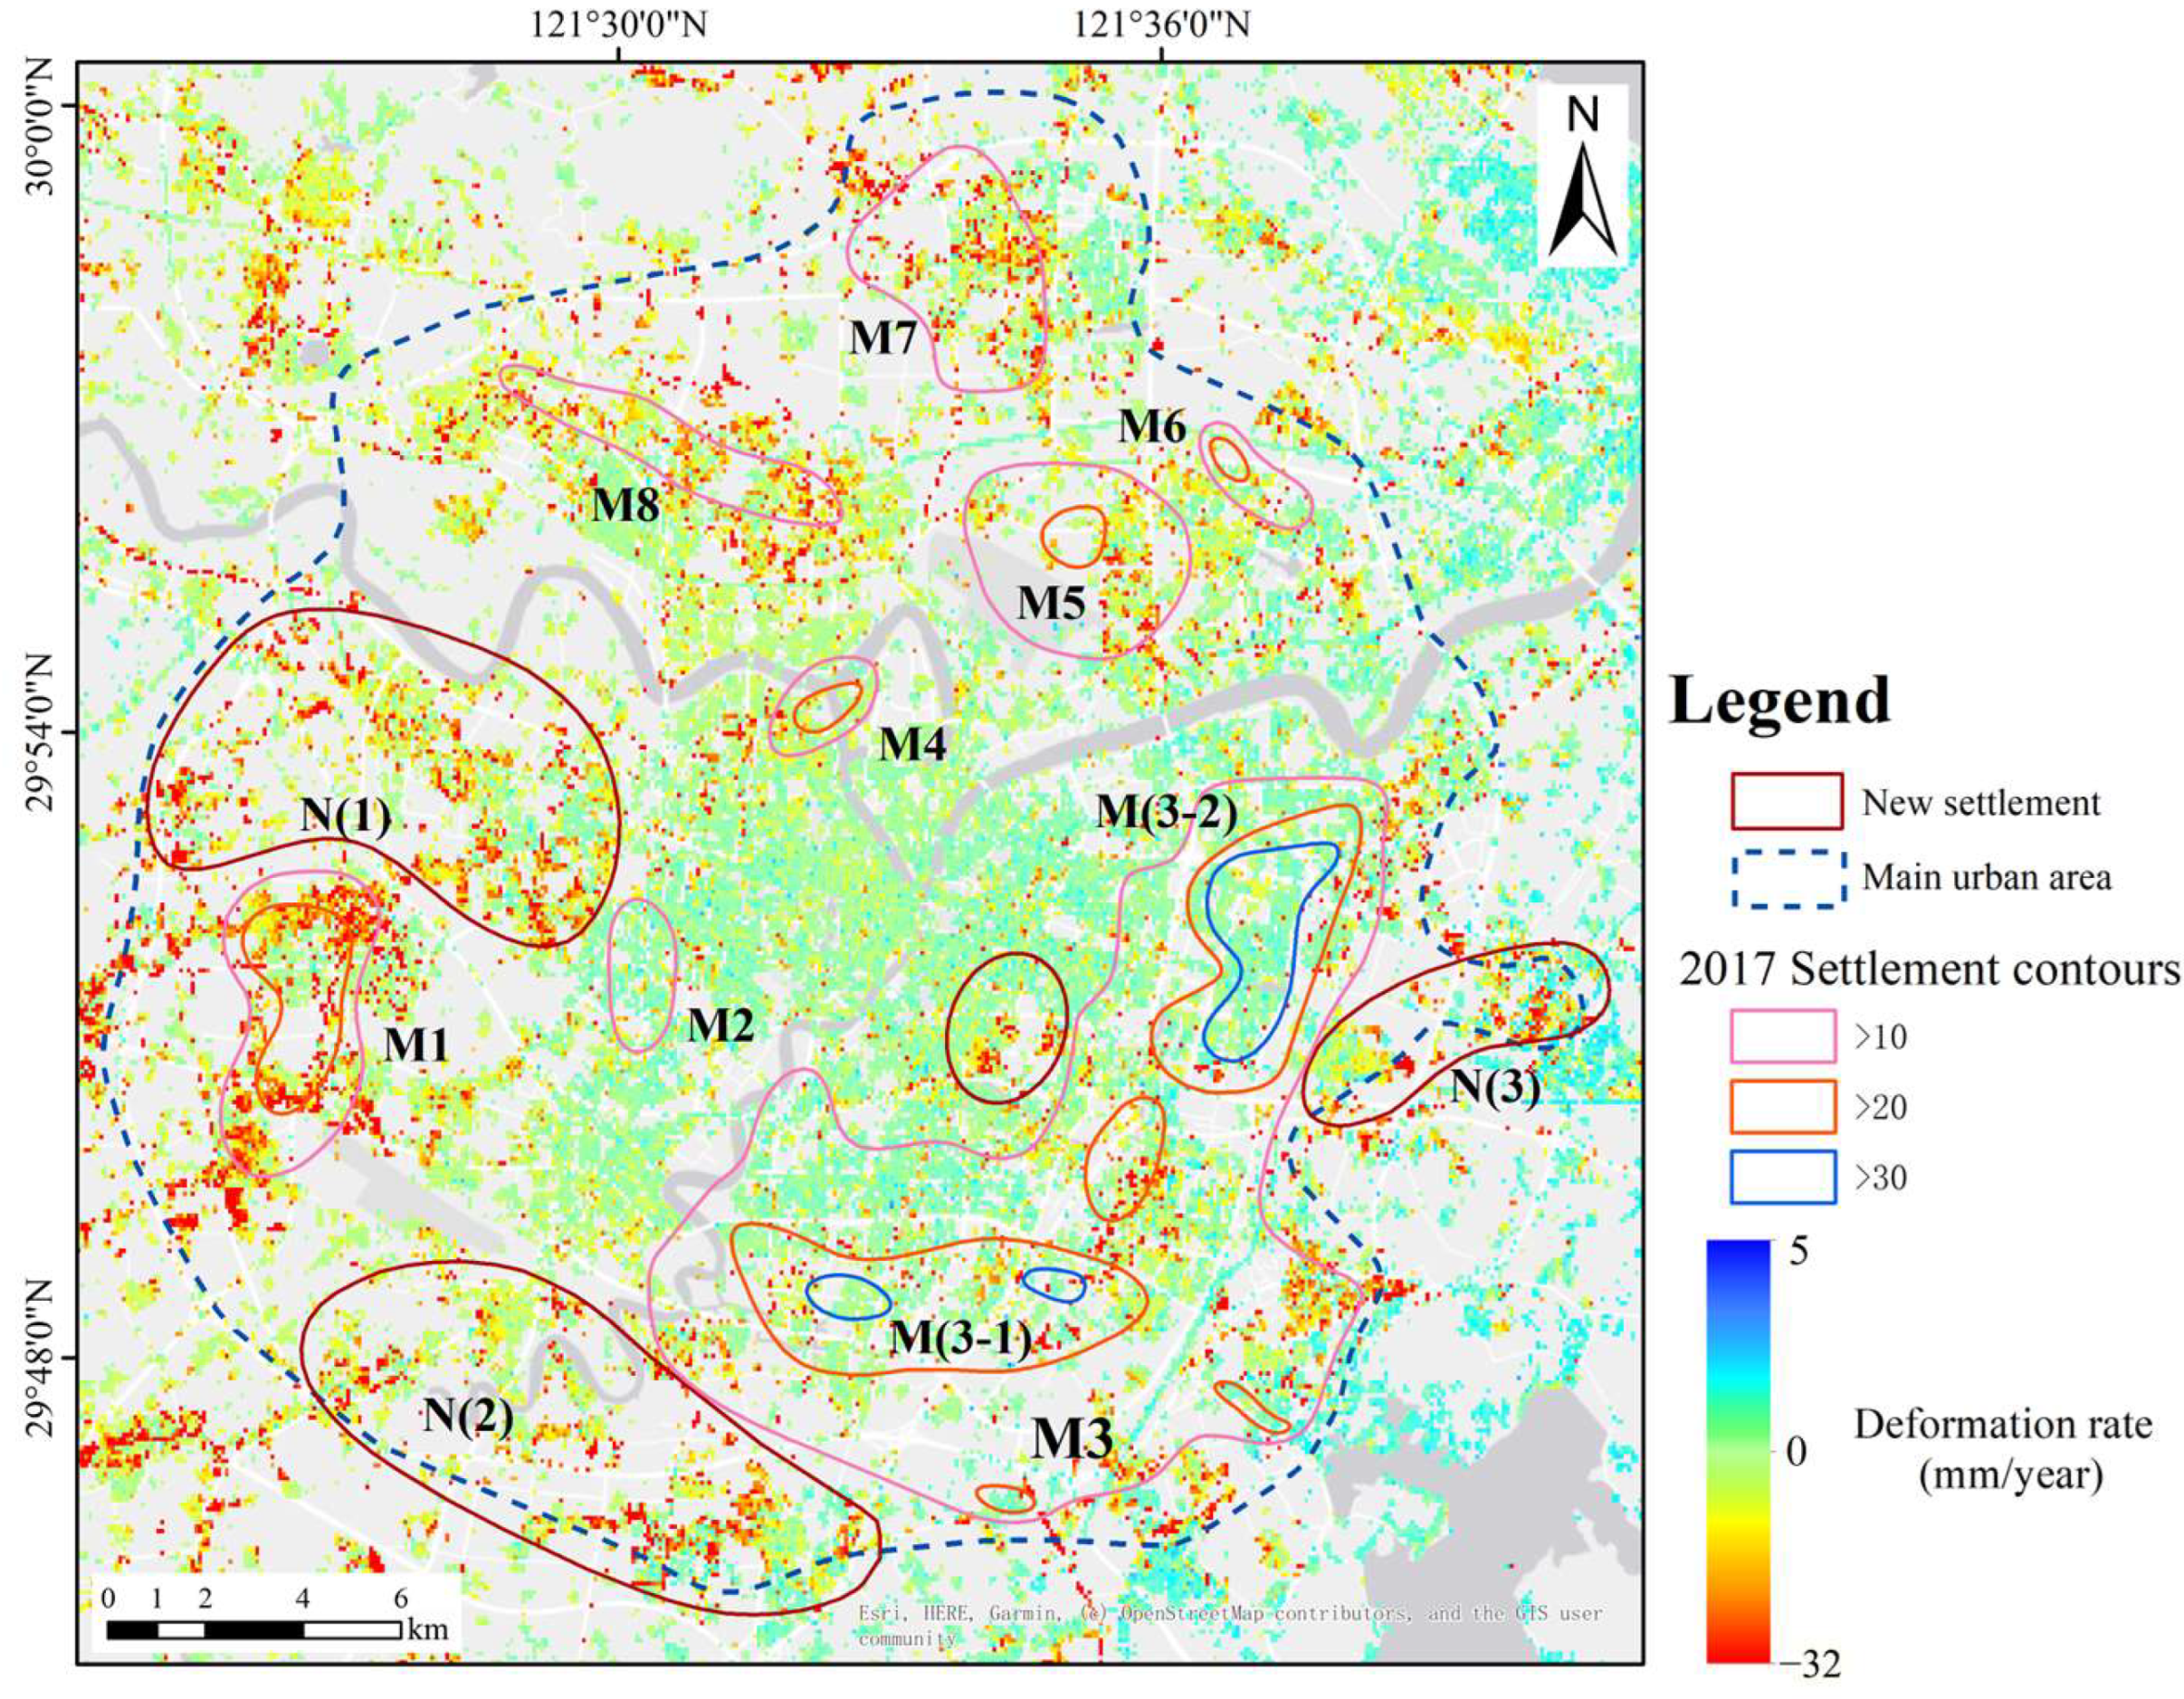
It can be seen from Figure 5 that the annual average subsidence rate in the main urban area ranges from −32.2 to 5.1 mm/year, and the subsidence areas are all located around the city center. The subsidence results of the main urban area were compared with those released by the Ningbo government in 2017 (Table 2). It is found that the subsidence areas of Zhejiang Vocational College of Commerce (M2) and Sanjiangkou (M4) have basically disappeared, with maximum subsidence rates of −9.1 mm/year and −8.9 mm/year, respectively [70]. The subsidence areas and rates of Yinzhou District’s Eastern New Town (M3-2) and Yinzhou Central Area (M3-1) are both decreasing, with maximum subsidence rates of −17.4 mm/year and −30.1 mm/year, respectively. The subsidence area of Yinzhou (M3) shows a trend of expansion towards the northwest, with a maximum subsidence rate of −17.2 mm/year. Meiyan (M5) and Ningbo Botanical Garden (M6) subsidence areas have been controlled, with a maximum subsidence rate of −20.0 mm/year and −16.2 mm/year, respectively. The subsidence rates and ranges of Gulin Town (M1), Luotuo Street (M7), and Zhuangqiao (M8) subsidence areas have increased, with maximum subsidence rates of −22.8 mm/year, −27.1 mm/year, and −20.8 mm/year, respectively. Additionally, three new subsidence areas have been identified in the main urban area, namely Gaoqiao Town (N1), Lishe Town (N2), and Qiuyi Village (N3), with maximum subsidence rates of −28.6 mm/year, −24.0 mm/year, and −23.8 mm/year, respectively.

4.2. Precision Verification of the Subsidence Results

To validate the results of TS-InSAR, we compared the time series from available GNSS stations and from TS-InSAR. These two GNSS stations are located in Shanghai (SHA2) and Zhoushan, Zhejiang Province (ZJZS), covering the time period from January 2018 to October 2021. Typically, GNSS measurements are considered as ground truth for surface deformation. Following Equation (6) mentioned above, the LOS displacement of TS-InSAR was converted to vertical displacement. Subsequently, we employed the ZJZS station as a point of reference to calibrate the values of InSAR relative to the absolute values. For the SHA2 station, we chose InSAR measurement points that were located within a 150 m radius and calculated the average deformation values. We then compared the GNSS time series results with the InSAR time series results [71], as shown in Figure 6. The root mean square error (RMSE) was found to be 0.8 cm, which allowed for the evaluation of the accuracy of the TS-InSAR results.

5. Discussion

5.1. Discussion of the Causes of Surface Subsidence in Different Regions

The detailed subsidence areas in the Ningbo Plain are shown in Figure 4. The factors leading to surface subsidence primarily consist of two aspects: anthropogenic factors including groundwater extraction, large-scale construction and infrastructure projects, and improper land use, as well as natural factors including precipitation, sediment thickness, and fault activity. Subsidence in areas A(1), A(2), A(4), and G(2) is primarily attributed to the presence of thick Quaternary sediments in these regions. Due to the poor mechanical properties of Quaternary sediments, they are highly susceptible to deformation under external disturbance or pressure, leading to significant subsidence. Compared to the aforementioned areas, area E is surrounded by mountains on three sides and has thinner Quaternary sediments. Despite the presence of heavy industrial production in this area, the maximum subsidence rate is only −19.1 mm/year. Further analysis of this phenomenon will be discussed in detail in Section 5.2. Subsidence in areas A(3), B(1), B(2), C(1), C(2), C(3), G(1), H, and F is relatively scattered and mostly located in suburban areas. Compared with Google satellite imagery, it is found that subsidence in these areas is largely concentrated above factories and in densely populated residential areas on the outskirts of towns. Therefore, the main causes of subsidence in these areas may be attributed to increased ground loading due to industrial production, as well as surface subsidence induced by the extraction of groundwater for production and living purposes by factories and surrounding residents. As shown in Figure 5, subsidence areas in the urban area of Ningbo mainly include M(1), M(3), M(7), M(8), N(1), N(2), and N(3), which are primarily distributed on the outskirts of the city and are relatively scattered. Therefore, the main reason for subsidence in the urban area is due to the rapid urbanization of Ningbo, where the intensity of urban construction and development has continuously increased, and large-scale engineering projects have caused the compression and deformation of the soft soil layers, which is one of the main causes of subsidence in the main urban area of Ningbo. Additionally, the relocation of industrial production from the city center to the suburbs and subsequent groundwater extraction have also contributed significantly to the subsidence. Below, we provide a detailed discussion of the four factors influencing subsidence in the Ningbo Plain.

5.2. Exploration of Subsidence Trigger Factors

5.2.1. Impact Analysis of Geological Factor Control Deformation Pattern

Surface subsidence is mainly influenced by two factors: internal and external. Internal factors mainly include the geological conditions (structure, strata, lithology, etc.) of the study area [72,73]. Since the middle of the Quaternary period, the Ningbo Plain has accumulated a set of loose sediments ranging from continental to marine–continental facies under multiple marine–land transitions, with an area of up to 3930.85 km2. Its physical characteristics include high moisture content, significant compressibility, poor mechanical properties, and high sensitivity to external adverse conditions, such as building loads and dynamic loads [40,74]. In geotechnical engineering, the relationship between surface subsidence and the thickness of potentially deformable soil is mainly represented by three different parameters, which can be expressed as [75]:
δ = S × h × D
where δ denotes displacement, S denotes soil modulus, h represents the decrease in effective stress, and it can also denote the decline in piezometric water level, and D denotes potential deformed soil thickness. From the above equation, it can be seen that there is a direct relationship between subsidence and the thickness of soft soil. Moreover, the thicker the soft soil layer, the greater the displacement.
Due to the distribution of thick loose sediments in the Ningbo Plain, the mechanical response of these sediments to increased effective stress is one of the factors controlling the evolution and magnitude of settlement. Therefore, we collected data from 77 geological boreholes in the study area through the China Geological Survey. Based on the borehole data, we constructed a map of Quaternary strata thickness in the study area, as illustrated in Figure 7. To analyze the relationship between soft soil thickness and subsidence, we compared the geological conditions obtained from boreholes with the vertical displacement measured by TS-InSAR to establish their correlation. To this aim, the influence of human activities around boreholes is considered, comparing the average subsidence within a 150 m radius of the boreholes with soft soil thickness to obtain the correlation (Figure 7b). Figure 7b demonstrates a strong correlation between average settlement and soft soil thickness, with an R 2 value of 0.79. The limited number of samples is due to some boreholes lacking PS points or not being influenced by the same human activities. This correlation suggests that surface subsidence increases with increasing soft soil thickness, and vice versa. Furthermore, the thickness of soft soil plays a crucial role in surface settlement occurrence, indicating that soft soil thickness is a potential factor leading to surface settlement.

5.2.2. Response of Subsidence to Groundwater Level Changes

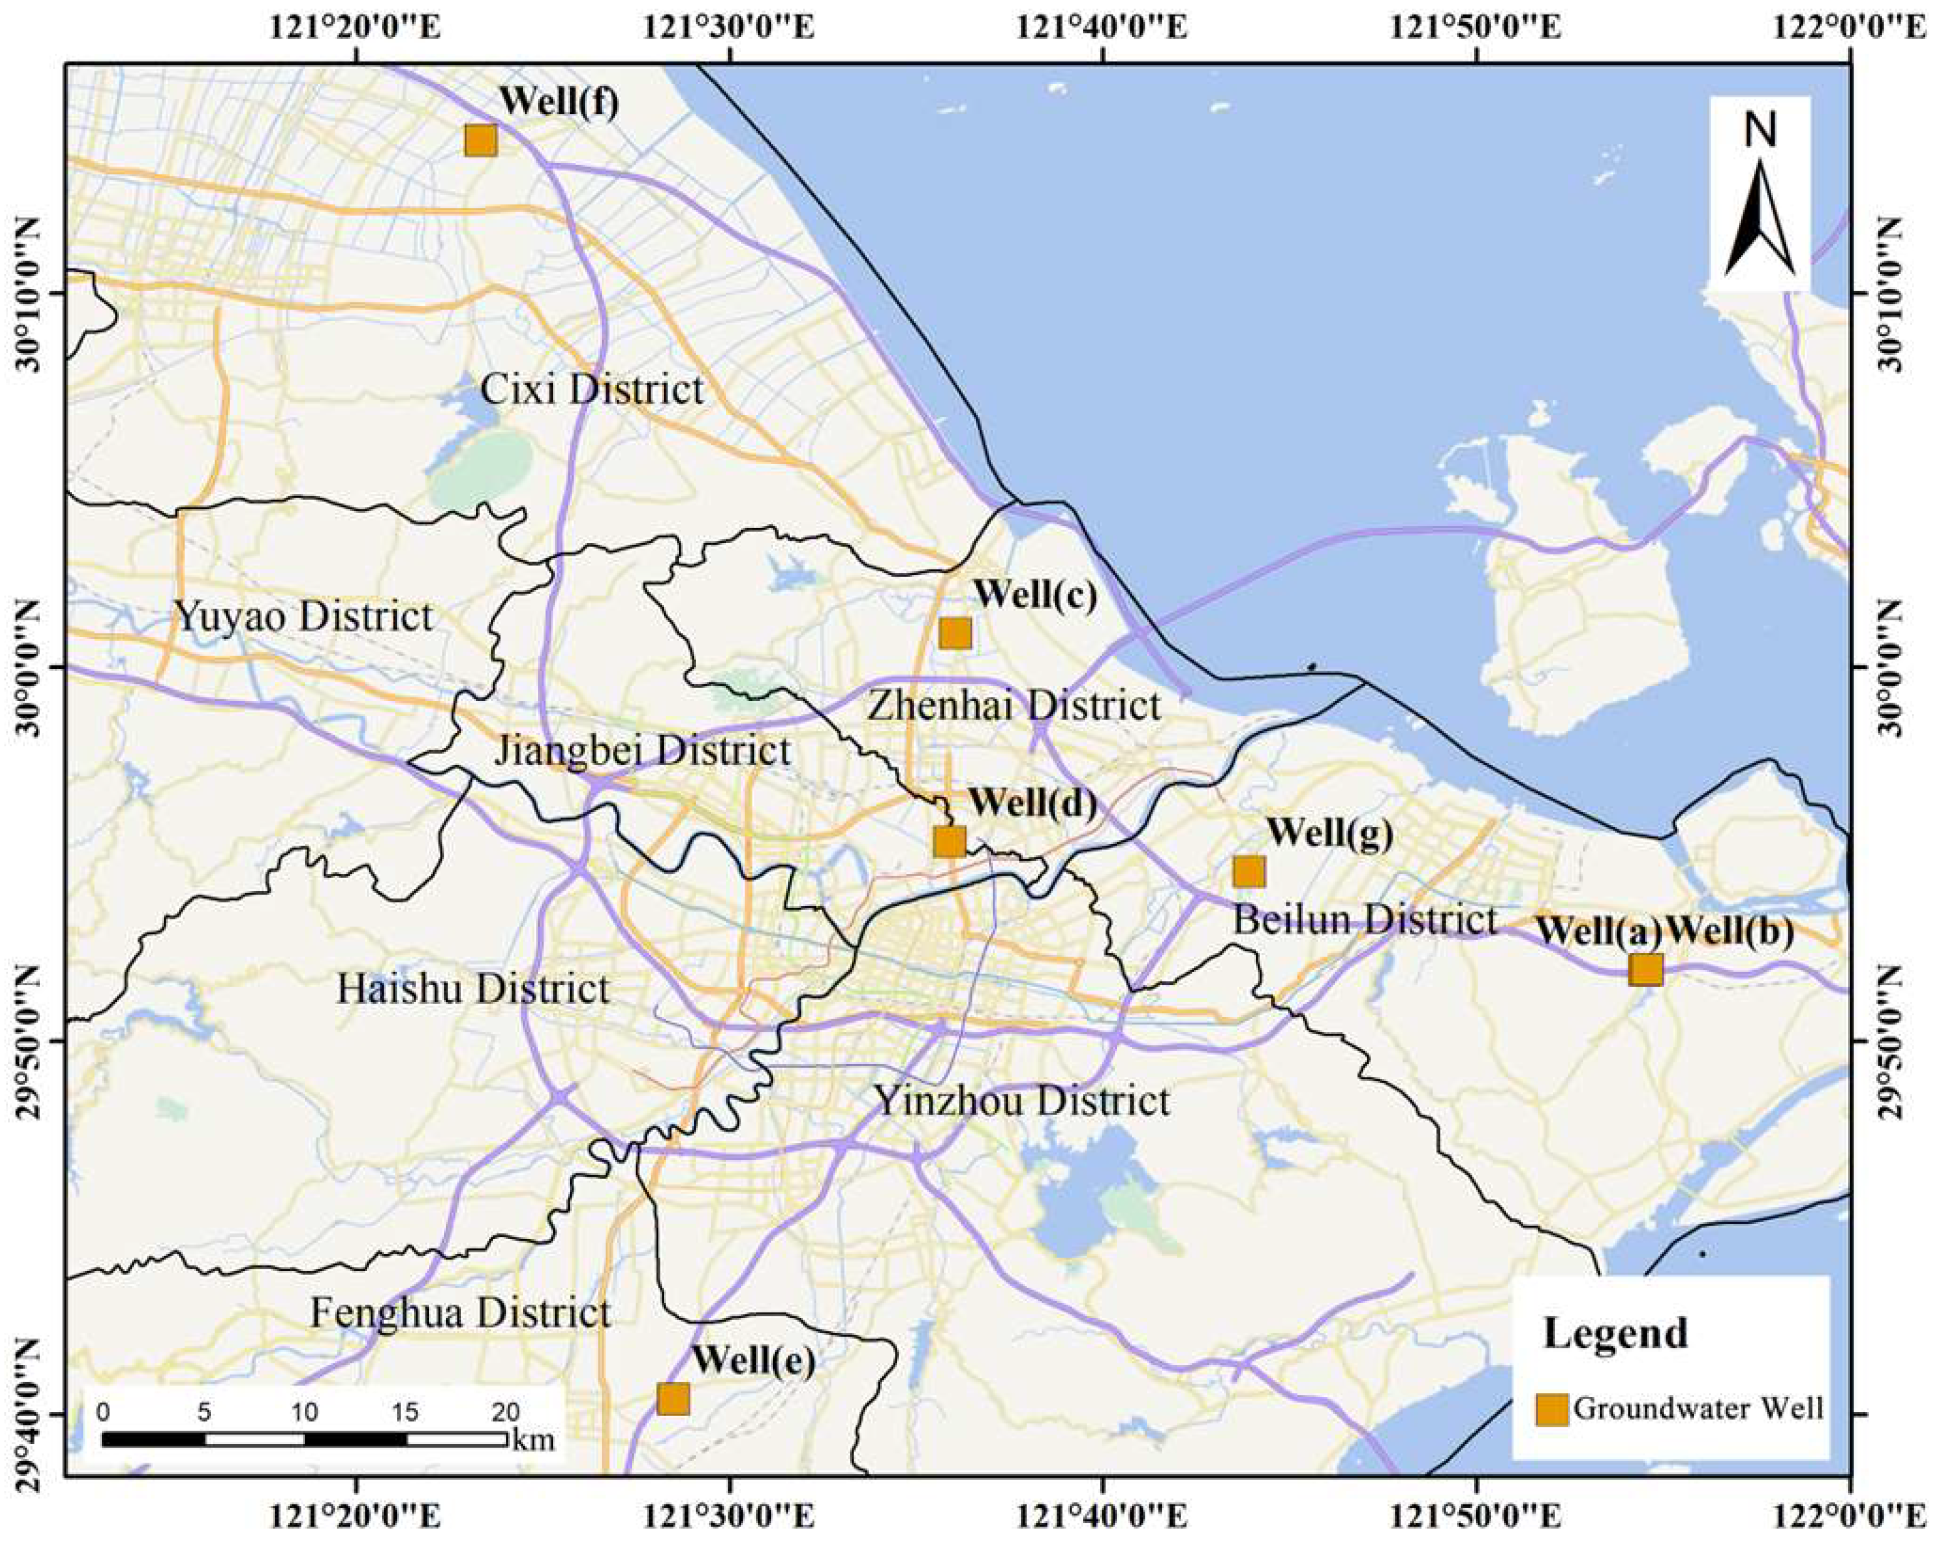
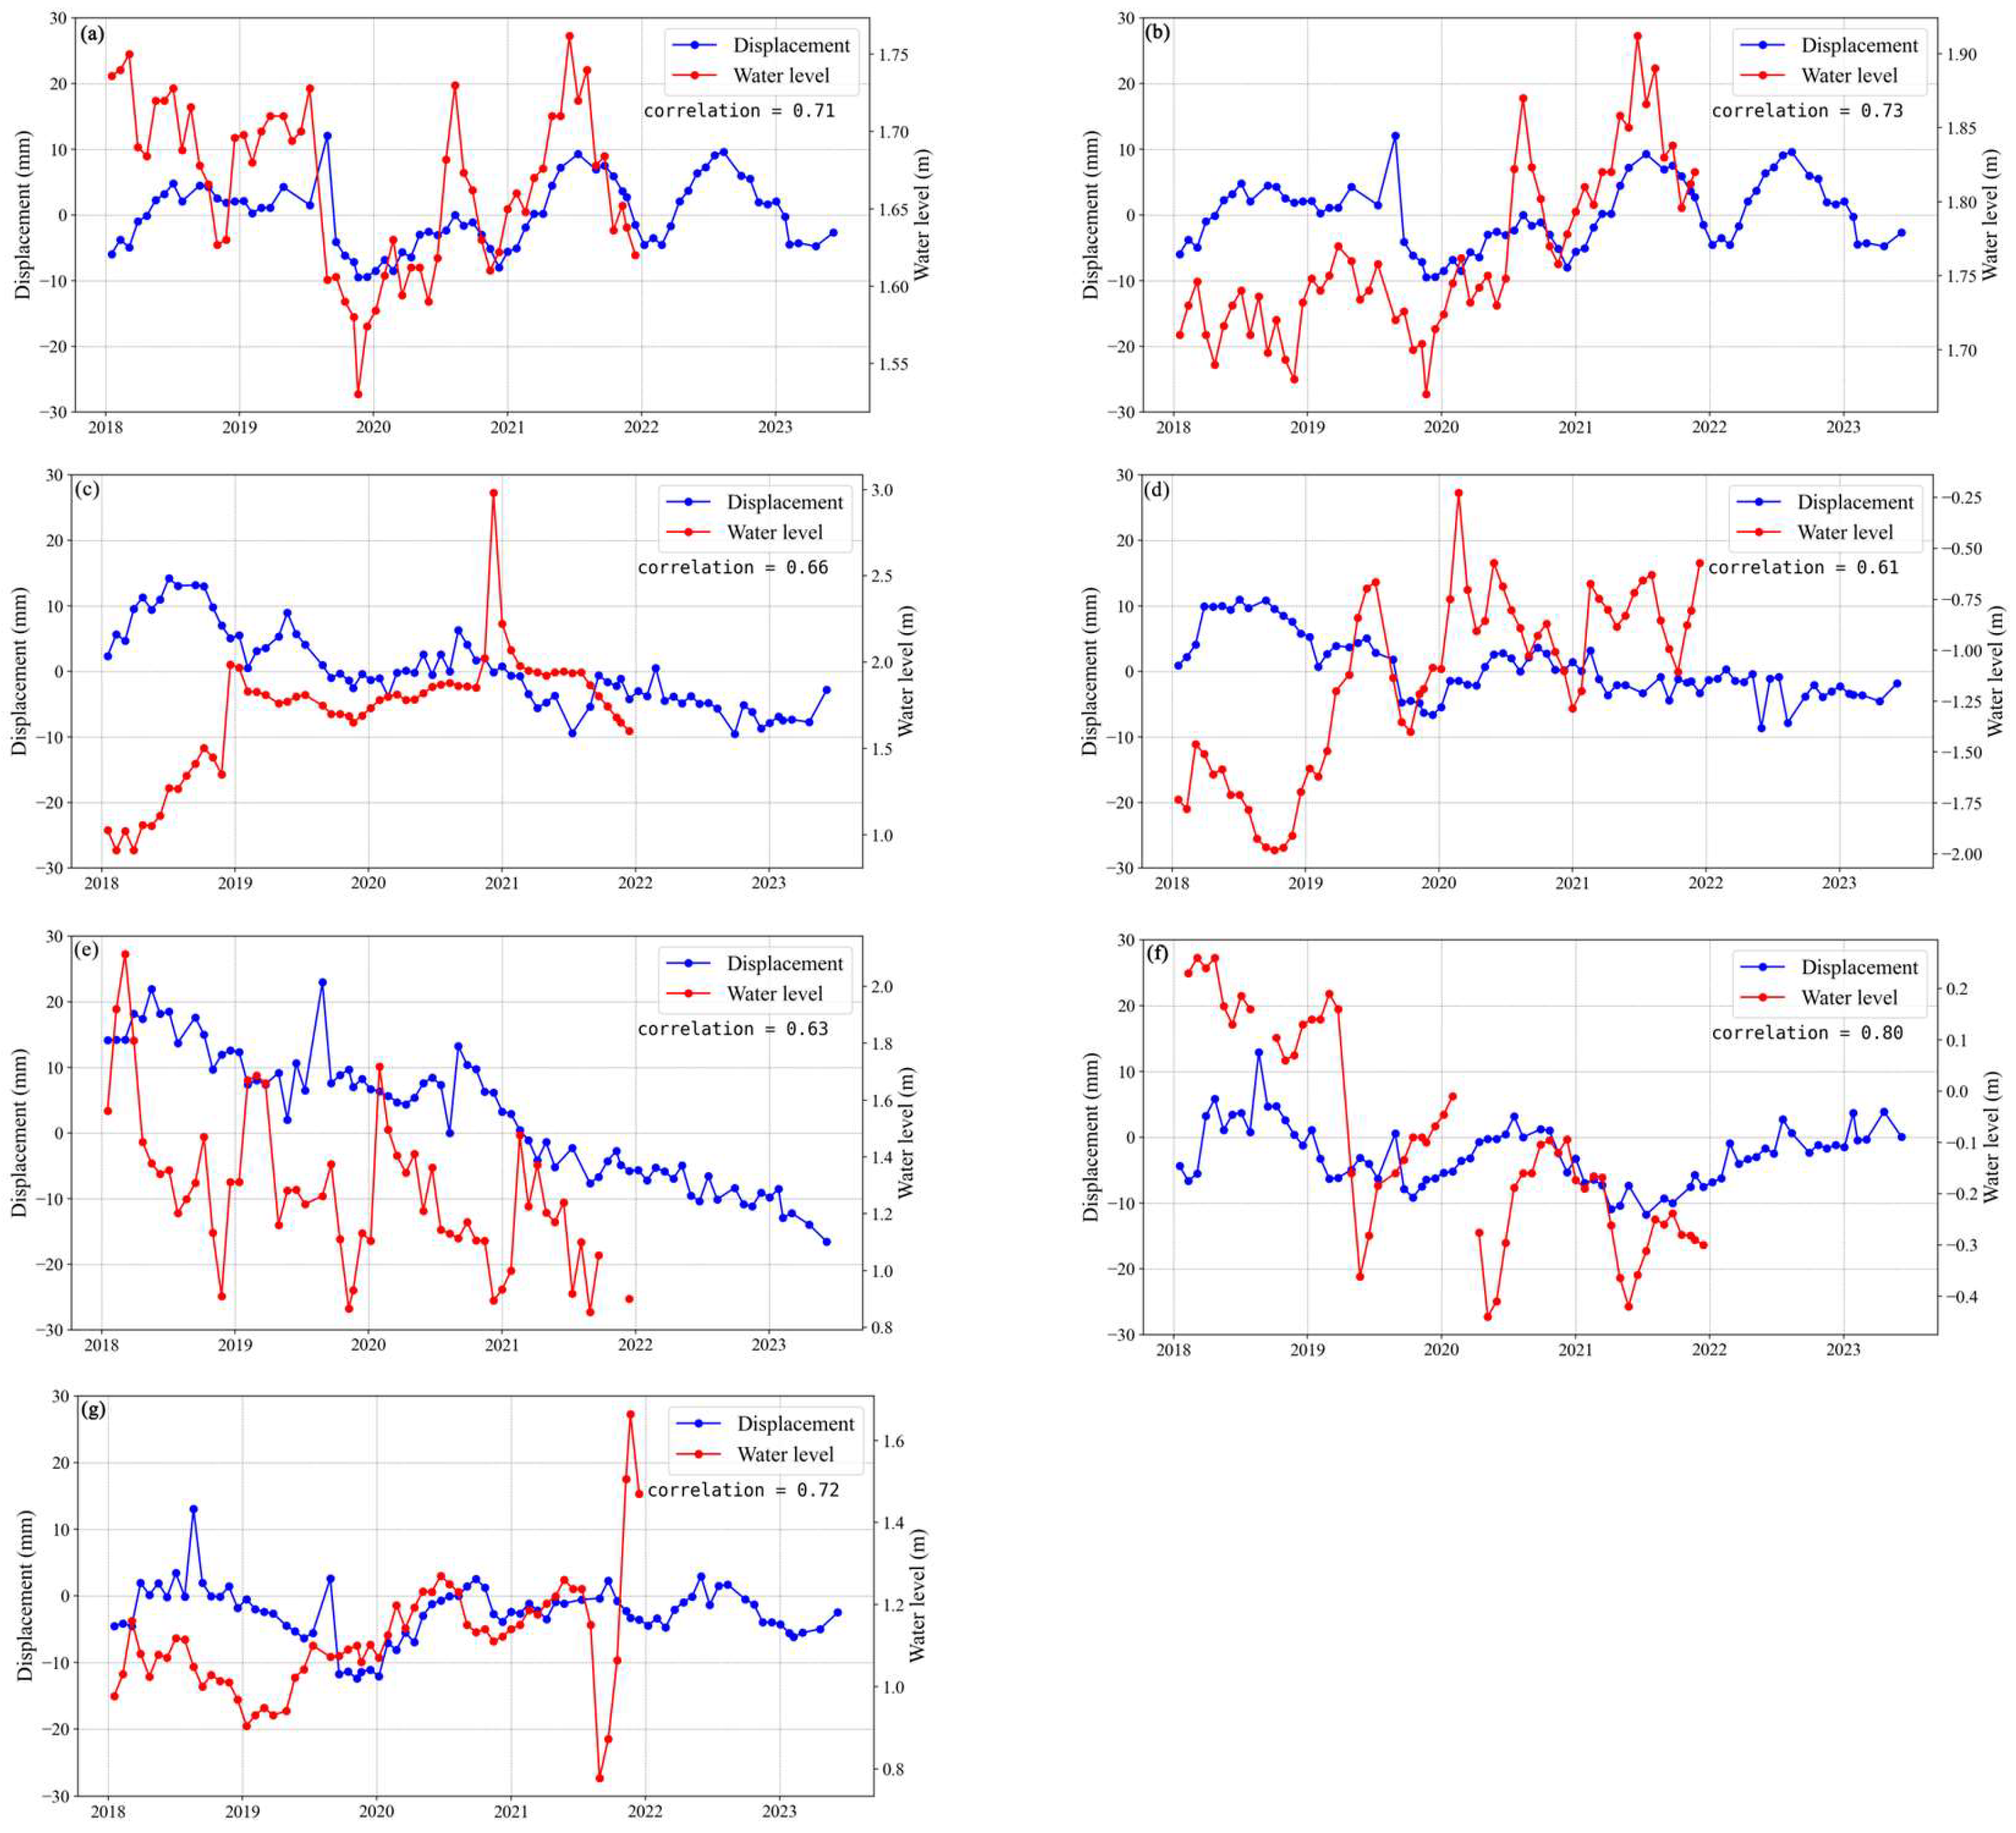
In terms of groundwater utilization, over the past thirty years, the Ningbo Plain has heavily relied on groundwater resources for textile and chemical industry production. Extensive groundwater extraction has led to significant surface subsidence [48]. Although in recent years, some areas of the Ningbo Plain have prohibited groundwater extraction; the rapid economic development of Ningbo City has attracted numerous factories, enterprises, and migrant populations. In order to ensure an adequate supply of water for domestic, industrial, and irrigation purposes, some residents and factories inevitably engage in unauthorized groundwater extraction. According to Equation (7), the decrease in effective piezometric water level ( h ) leads to an increase in effective stress between soil particles, which is closely related to surface subsidence [76,77,78]. Furthermore, the greater the decline in groundwater level, the more significant the surface deformation. Therefore, this study collected data from 26 groundwater-monitoring wells in the Ningbo Plain and conducted a detailed analysis of the data from 7 groundwater-monitoring wells with depths ranging from 16 to 45 m (Figure 8). Other groundwater-monitoring data can be found in the Supplementary Materials (Figures S1 and S2).
To analyze the correlation between groundwater and surface subsidence, we compared the groundwater level observation data from 2018 to 2021 with the average surface subsidence within a 150 m radius of the groundwater-monitoring wells [79]. The comparative analysis results are shown in Figure 9, where the red line represents groundwater level changes and the blue line represents surface subsidence changes. From Figure 9a–c, it can be observed that surface subsidence exhibits similar fluctuations to groundwater; when groundwater levels decline, the surface also sinks accordingly. Conversely, when groundwater levels rise, the trend of surface subsidence either increases or slows down. In Figure 9d, an opposite trend between groundwater and surface subsidence is observed in October 2018 and January 2019, possibly due to subsidence caused by groundwater levels not returning to their original levels. Subsequently, as groundwater levels return to their original levels, the trend of surface subsidence significantly slows down or stops. When groundwater levels were higher than the original levels in 2019, fluctuations in groundwater and subsidence were largely consistent. Figure 9e,f clearly shows the seasonal variation in groundwater levels in the Ningbo Plain. The monitoring data reveal a continuous decline in groundwater levels over four years, accompanied by surface subsidence in the region. The primary reasons for the decline in groundwater levels in the region may be attributed to groundwater extraction by nearby industrial parks and agricultural irrigation. Figure 9g shows evidence that the trend of groundwater level changes is similar to that of surface subsidence. However, there is a clear lag phenomenon between the two. This may be due to the non-elastic deformation of the aquifer in the area. Due to the lack of detailed geological parameters in this area, we were unable to calculate the specific lag time. In addition, we used the Grey Relation Analysis (GRA) method to calculate the consistency of changes between groundwater levels and subsidence time series. The GRA coefficients were as follows: well (a) 0.71, well (b) 0.73, well (c) 0.66, well (d) 0.61, well (e) 0.63, well (f) 0.80, and well (g) 0.72, indicating a close correlation between changes in groundwater levels and subsidence.

5.2.3. Impact Analysis of the Surface Subsidence Impact and Land Use

The continuous increase in urban construction density and the expansion of industrialization scale are also important factors contributing to surface subsidence. According to data from the National Bureau of Statistics, the proportion of secondary and tertiary industries in the economy of Ningbo City has been continuously increasing. By 2022, the proportion of secondary industry is 47.2%, and the proportion of the tertiary industry is 50.4% [80]. The increase in the proportion of secondary and tertiary industries has driven rapid economic growth, while also exacerbating surface subsidence. However, different human activities have different impacts on surface subsidence. Therefore, a detailed analysis of the relationship between subsidence and human activities is necessary.
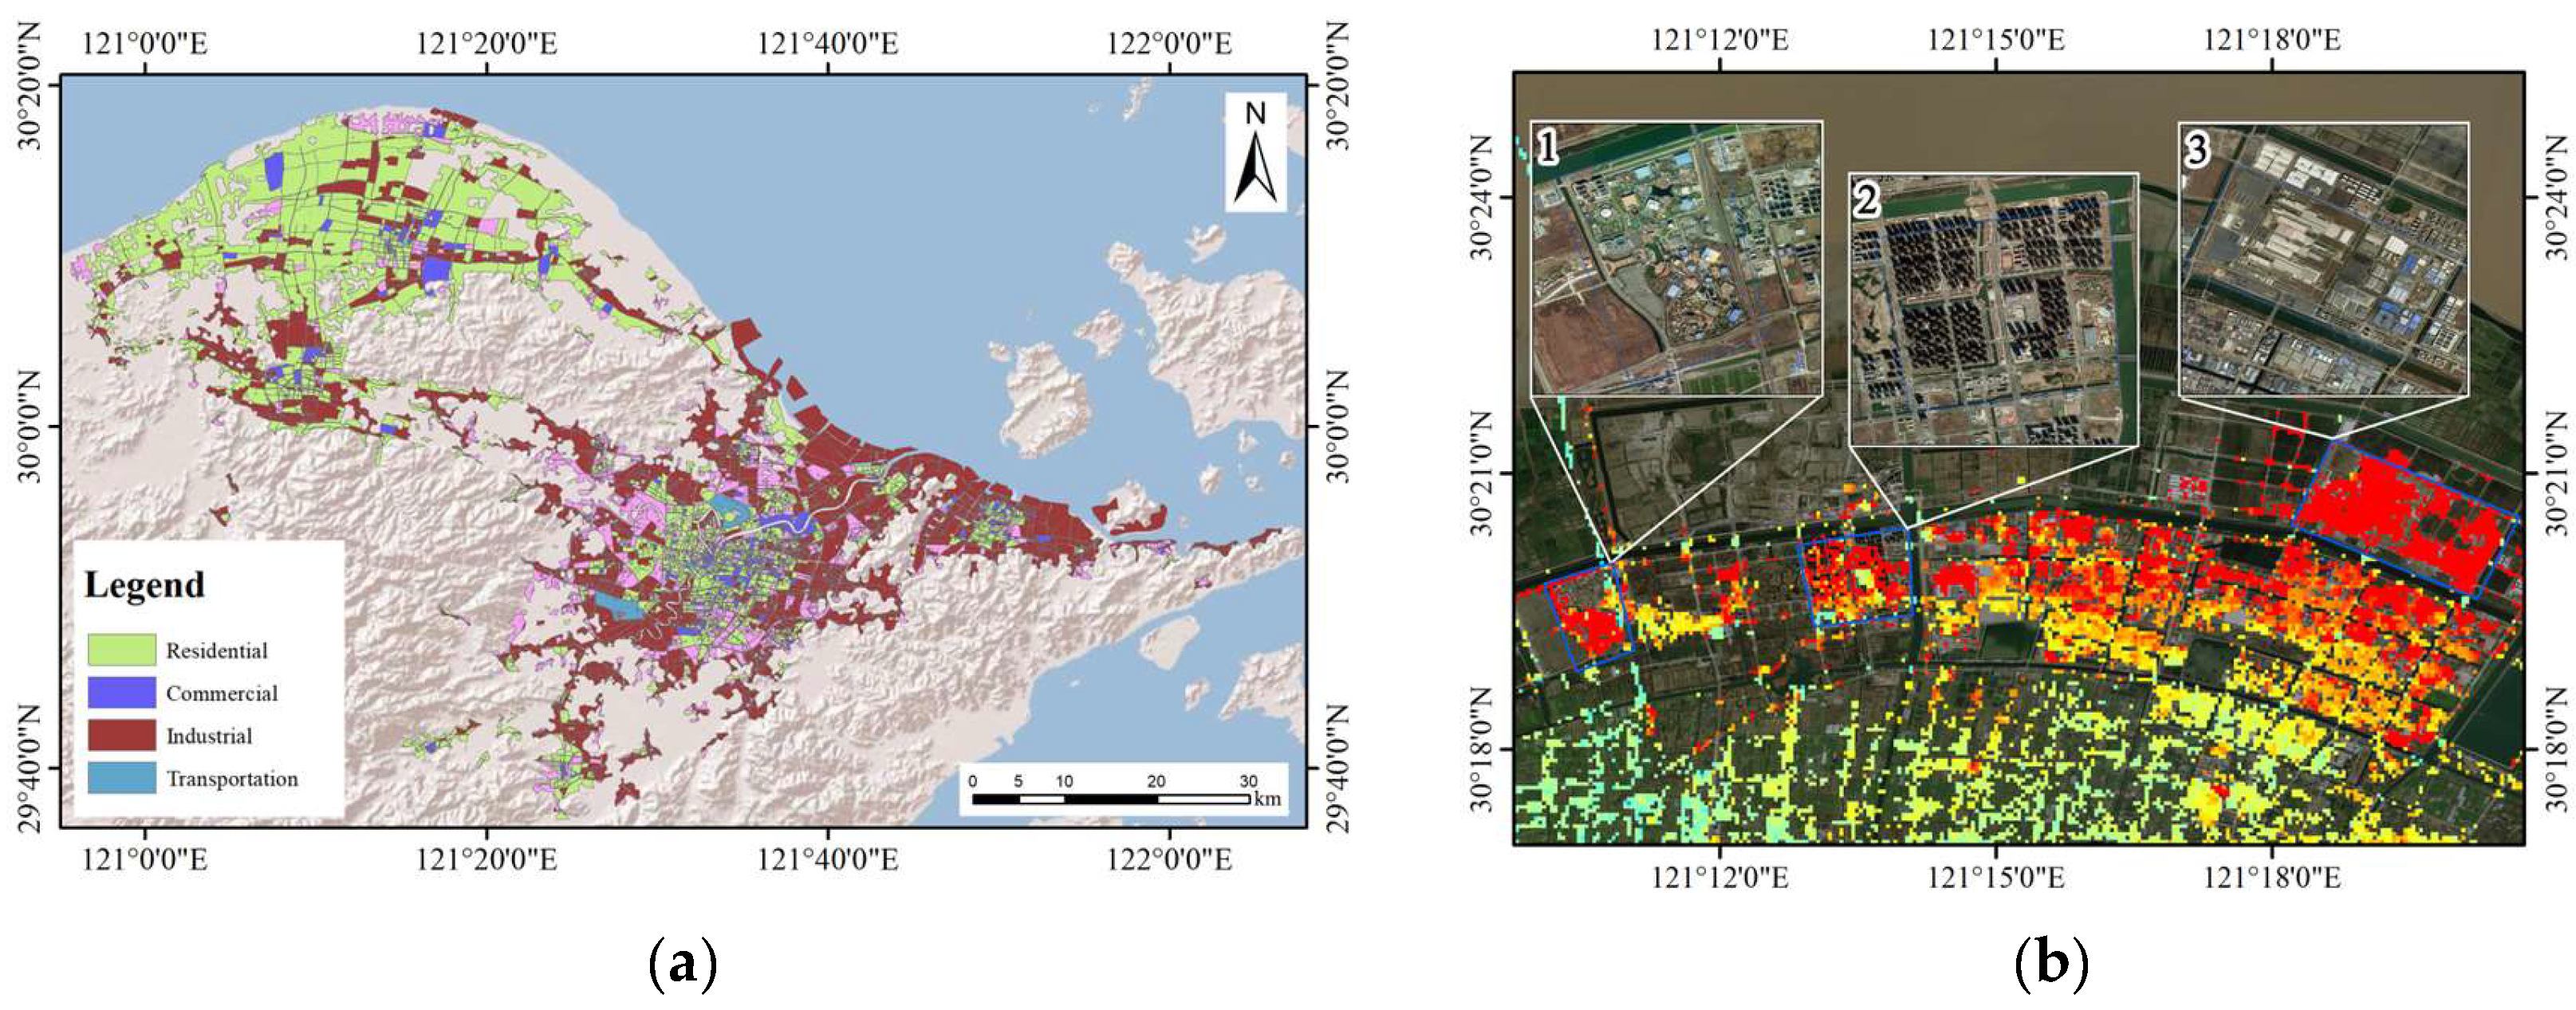
To investigate the relationship between different human activities and subsidence, we analyzed the relationship between different human activities and subsidence using the 2018 Chinese urban land use data released by the Pengcheng Laboratory in 2019 [51]. Firstly, we conducted a human inspection of the data combined with satellite images to ensure their accuracy, as shown in Figure 10a. Here, we categorized the land use types in the Ningbo Plain mainly into residential land, commercial land, industrial land, and transportation land, and conducted a statistical analysis of the subsidence of different land use types, as shown in Table 3. The average subsidence ranking of the above-mentioned land use types is as follows: industrial land > transportation land > commercial land > residential land. Among them, the average subsidence of industrial land is −3.0 mm/year, with the most severe subsidence area located in the Ningbo Public Joint Industrial Park in Cixi City, with an average subsidence of −19.3 mm/year. The average subsidence of transportation land is −2.5 mm/year, with the most severe subsidence area located on Tongtu West Road in Haishu District, with an average subsidence of −13.9 mm/year. The average subsidence of commercial land is −1.6 mm/year, with the most severe subsidence area located in Fantawild Adventure in Cixi City, with an average subsidence of −13.0 mm/year. The average subsidence of residential land is −1.3 mm/year, with the most severe subsidence area located in Hangzhou Bay Century City in Binha Wu Road, with an average subsidence of −16.7 mm/year. Combined with the optical image analysis, it is found that the areas with the most severe average subsidence in residential, commercial, and industrial land are all located in the northern coastal area of Cixi (Figure 10b). Although under the same geological conditions, the subsidence rates in different areas vary with different human activities. Among them, industrial land causes the most severe surface subsidence, followed by residential land and commercial land. The most severe subsidence area of transportation land is located in an area with a relatively thin compressible layer, but its surroundings are all mine accumulation areas, resulting in its subsidence rate exceeding that of commercial land, ranking third in terms of maximum average subsidence. The above results indicate that under the same conditions, industrial production, transportation, and the load of high-rise buildings in human activities have the greatest impact on subsidence in the Ningbo Plain, and these three factors may be the main driving factors for subsidence in the Ningbo Plain.

5.2.4. Analysis of Surface Subsidence and Urban Subway Construction

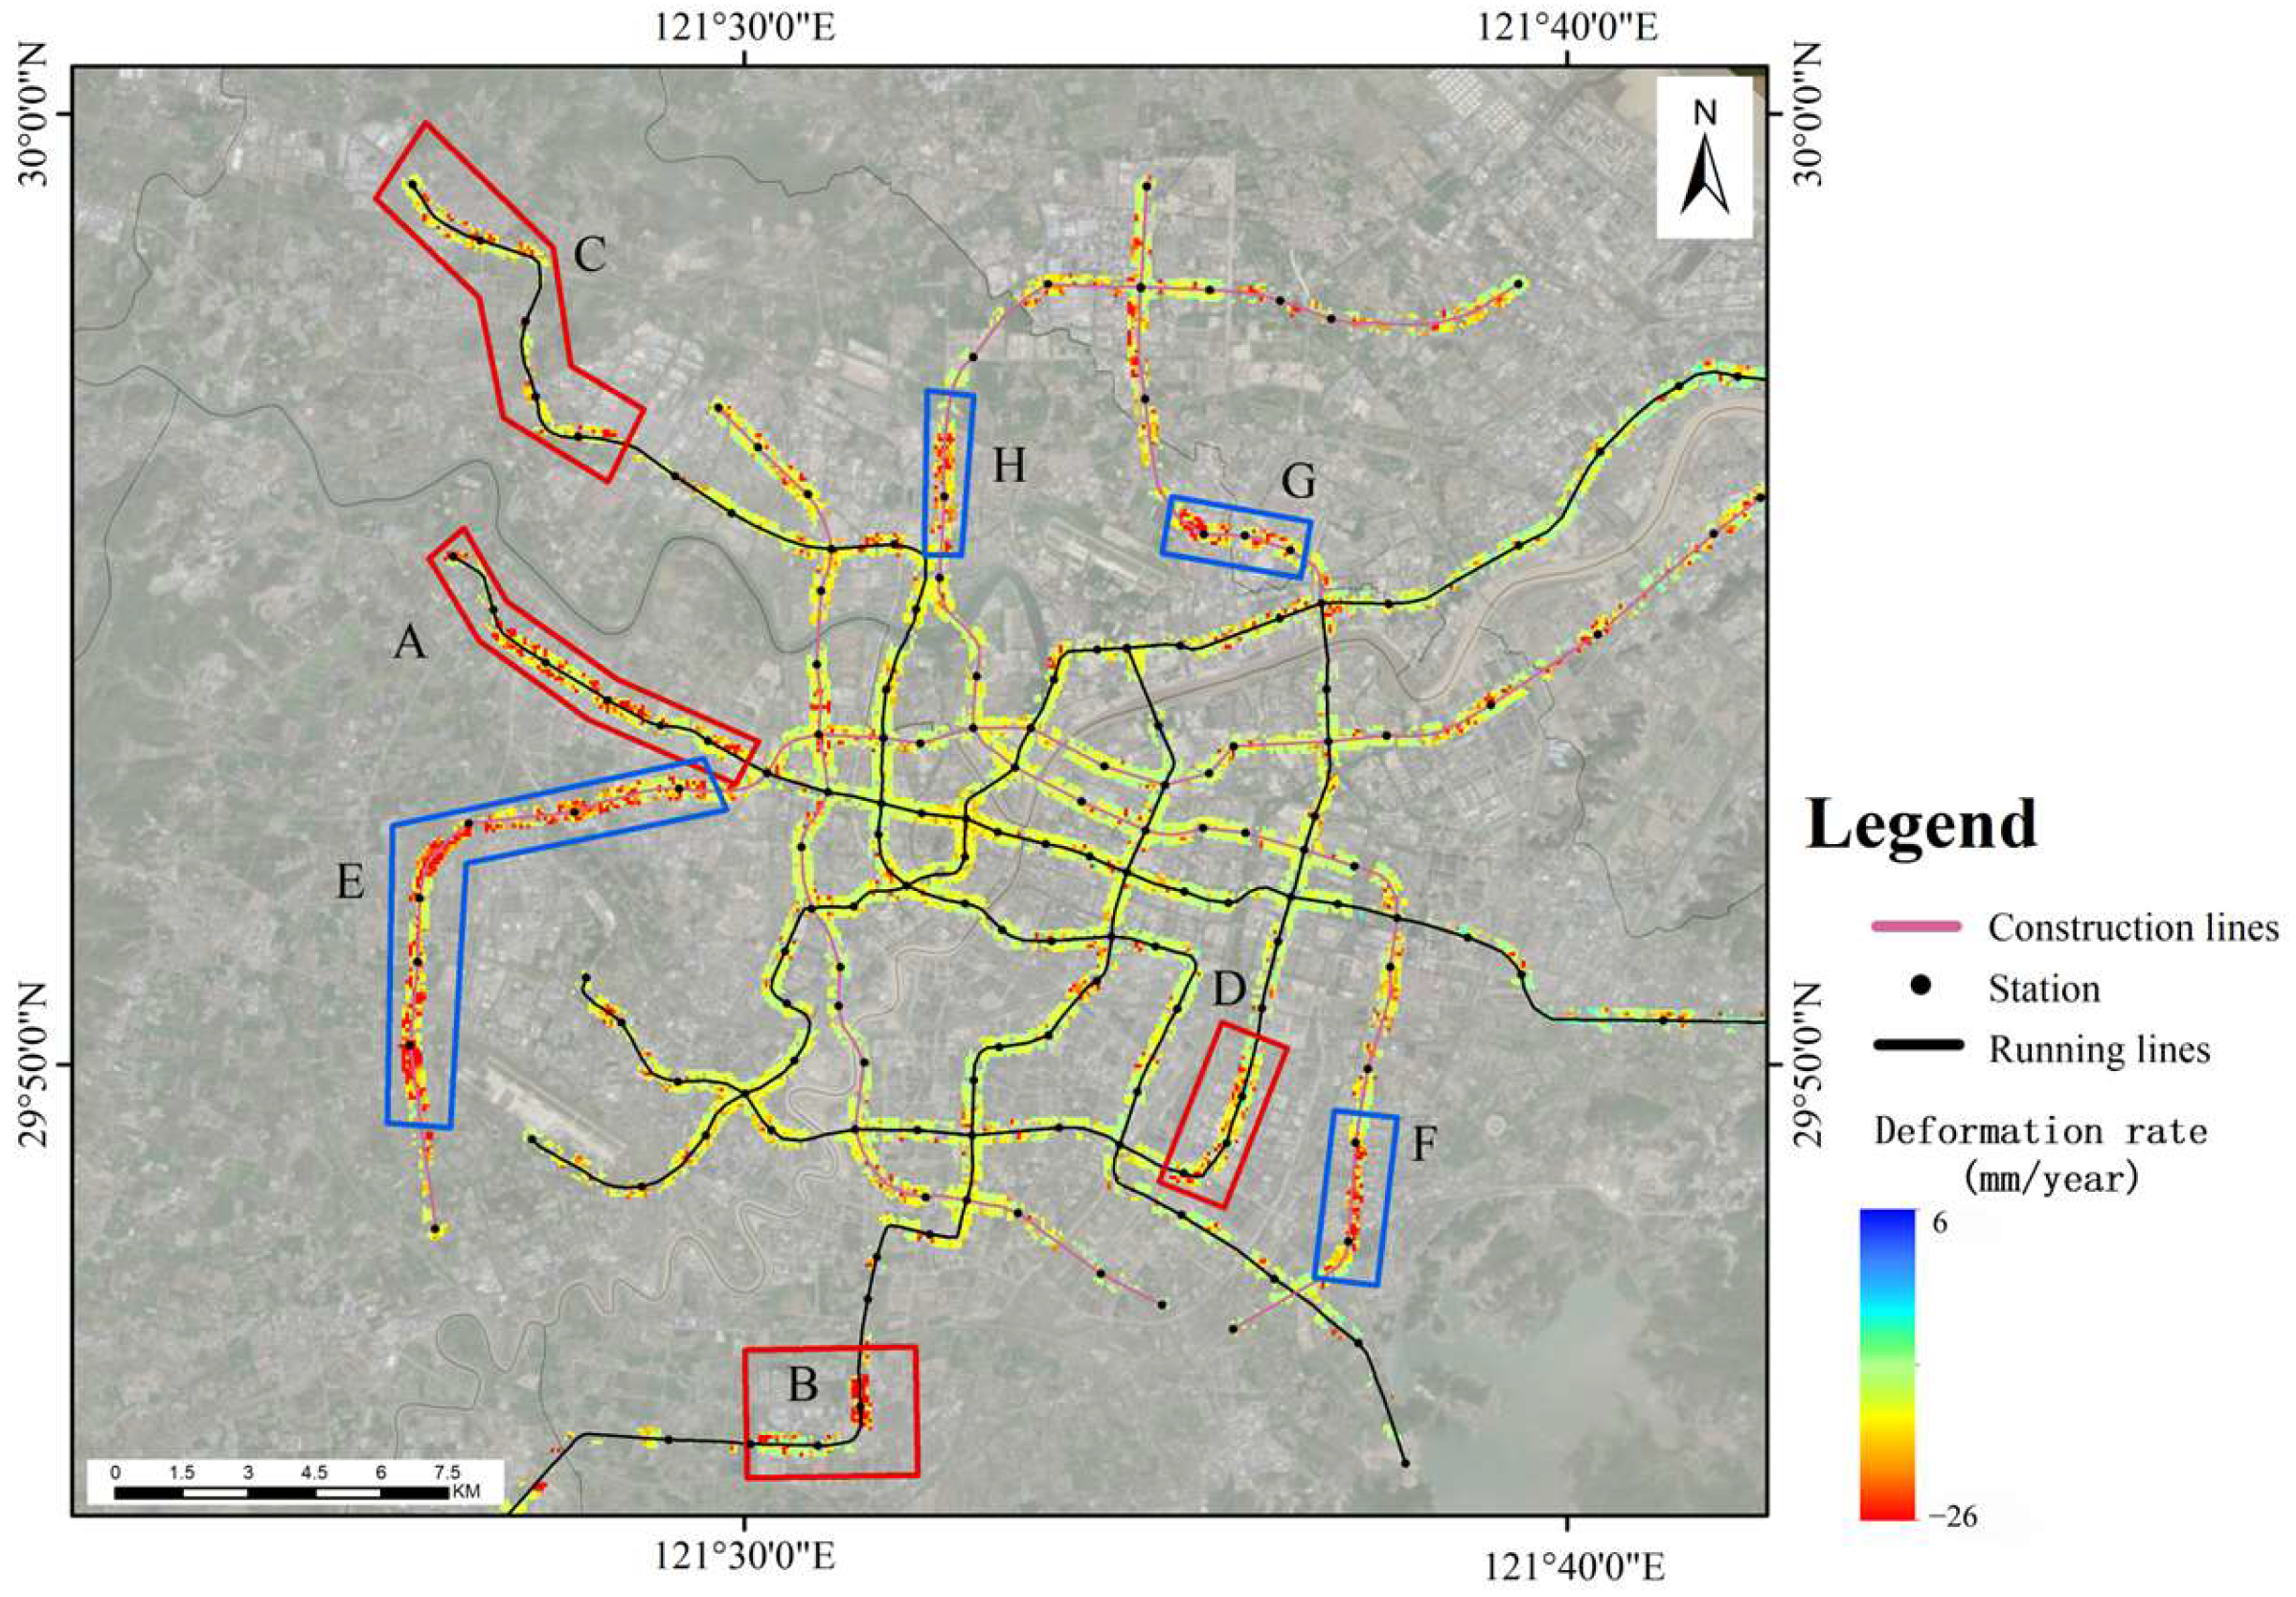
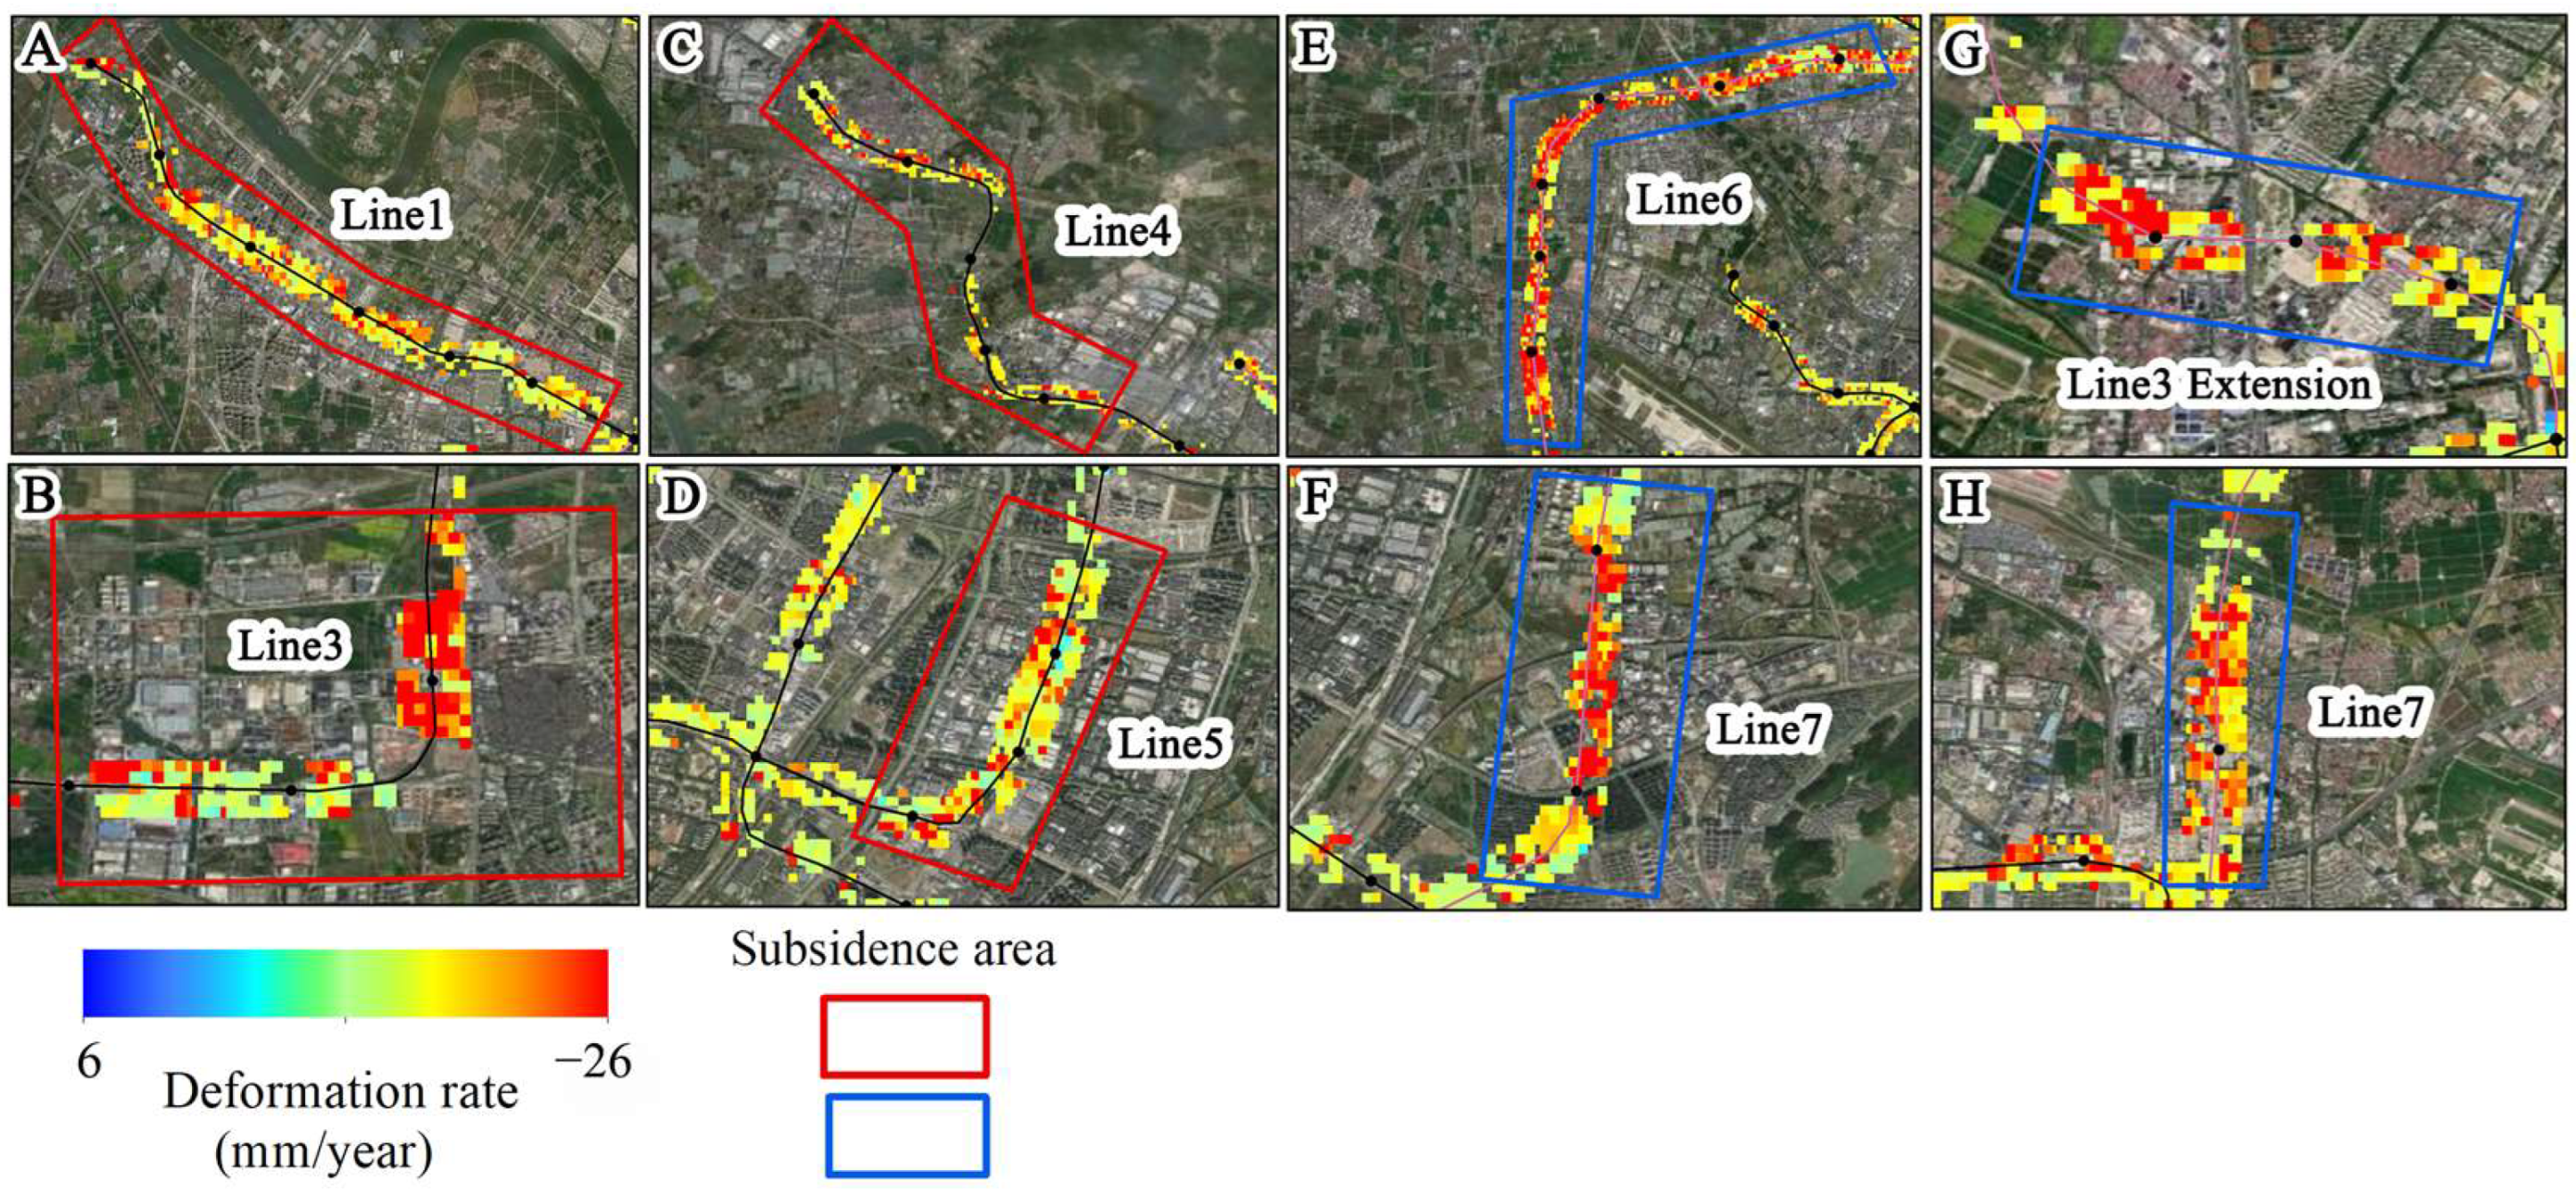
Urban rail transit is an important symbol of modernized cities, which can drive urban development and improve social living conditions [81]. The Ningbo Metro was constructed in 2009, and up to now, there are five operational lines and three lines under construction. Table S2 lists the construction time and operation time of each metro line. Currently, the metro lines in Ningbo basically cover the urban area and continuously extend to the suburbs. The rapid construction of metro lines and the increase in operation line density may exacerbate surface subsidence along the metro lines. Based on the experimental results of TS-InSAR, we extracted the monitoring results within 200 m along the metro lines and analyzed the evolutionary characteristics of surface subsidence along the metro lines. As shown in Figure 11, there is uneven subsidence in the operating section of Line 1’s westward extension, the Xujia Cao Changle line (Figure 12A), with a maximum subsidence rate of −19.9 mm/year. The main subsidence area of Line 3 is between Fangqiao Station’s north section industrial park and Jiangshan Station (Figure 12B), with maximum subsidence rates of −16.7 mm/year. The main subsidence of Line 4 is located between Guanshan River and Cicheng West Station (Figure 12C), with a maximum subsidence of −18.2 mm/year. The subsidence of Line 5 mainly occurs between Xiaying Road and Sigang Station (Figure 12D), with a maximum subsidence of −17.9 mm/year. Line 2, connecting Ningbo Airport to Honglian Station, spans southwest to northeast in Ningbo City, with a total length of 36.85 km, and the overall subsidence is relatively stable.
Among the three lines under construction, except for Line 8, the other two lines pass through active subsidence areas. Among them, Line 6 passes through an active subsidence area for a distance of 15 km (Figure 12E), mainly between Wangchunqiao Station and Ningbo West Station, with a maximum subsidence of −23.9 mm/year. The subsidence area crossed by Line 7 is mainly located between Chengxin Road Station and Dongqian Lake North Station (Figure 12F), as well as near Ningci Road Station (Figure 12H), with maximum subsidence rates of −15.5 mm/year and −15.8 mm/year, respectively. The main subsidence area of the northern extension section of Line 3 is near Meiyuan Station (Figure 12G), with a maximum subsidence of −13.6 mm/year. Through overlay analysis using satellite images, we found that during the operation period, the subway routes in the main urban area tended to be stable in subsidence, with subsidence mainly occurring in densely populated areas of suburban residential neighborhoods. This is because subway construction in suburban areas started relatively late, and the dynamic loads during subway operation and the static loads of structures cause significant disturbance to soft soil, leading to subsidence [82]. Additionally, subway lines under construction traverse long subsidence areas and are mainly located above ground structures. It is essential to pay special attention during future construction stages to prevent further increase in subsidence rates due to construction, which may result in unnecessary economic losses.

6. Conclusions

Based on TS-InSAR technology, 166 scenes of Sentinel-1A images were applied to monitor surface subsidence in the Ningbo Plain from January 2018 to June 2023. The monitoring results show that the overall surface subsidence in the Ningbo Plain was at a relatively low level, with an annual subsidence rate ranging from 12.4 mm/year to −43.5 mm/year. In total, 15 subsidence areas are observed in this region. The subsidence areas are mainly distributed spatially at the edges of urban areas and along coastal areas, with the coastal areas exhibiting higher subsidence rates. The most severe subsidence occurs in the industrial park in the northern part of Cixi, with a maximum subsidence rate of −37.1 mm/year. Compared with the results from 2017, the subsidence area and rate in the main urban area have significantly decreased. The two subsidence areas in the central area have almost disappeared. However, three new subsidence areas have been detected around the main urban area, located in Gaoqiao Town, Lishetown, and Qiuyicun, with maximum subsidence rates of −28.6 mm/year, −24.0 mm/year, and −23.8 mm/year, respectively.
In addition, we investigated the relationship between factors such as groundwater, geological structures, human activities, transportation, and infrastructure construction and surface subsidence. The research results indicate that the main natural factors affecting surface subsidence in the Ningbo Plain are groundwater and geological structures. There is a direct correlation between the TS-InSAR results in the study area and the thickness of soft soil, with a thicker layer of soft soil corresponding to a higher subsidence rate. The correlation between the time series of groundwater levels at 26 locations in the area and subsidence indicates a certain connection between the two. These results suggest that the thickness of the soft soil layer and groundwater play important roles in surface subsidence. Furthermore, apart from being influenced by groundwater extraction, the thickness of the compressible layer also provides necessary conditions for the development of surface subsidence. The investigation of the study area using land use data, transportation network data, and Google imagery indicates that surface subsidence caused by human industrial production and heavy traffic transportation is most severe, with the subsidence rate being related to the thickness of the underlying soft soil. A study of settlement along railway transportation lines found that it was influenced by the construction time of the subway and the dynamic and static loads on the ground. Four settlement areas were identified along operational subway lines, all located in suburban areas, which may endanger the construction and operational safety of the subway. Among the subway lines under construction, two lines traverse active settlement areas, and subsequent construction may lead to surface structure cracking, warranting attention from the relevant authorities.

Supplementary Materials

The following supporting information can be downloaded at: https://www.mdpi.com/article/10.3390/rs16132438/s1, Figure S1: Groundwater monitoring well location map; Figure S2: Comparison of average ground deformation and groundwater level time series variables; Table S1: Groundwater monitoring depths; Table S2: Construction and Operation Times of Ningbo Metro.

Author Contributions

Conceptualization, W.T. and A.H.-M.N.; methodology, W.T., A.H.-M.N. and H.W.; software, A.H.-M.N.; validation, W.T.; formal analysis, W.T., J.K. and Z.D.; investigation, W.T. and J.K.; writing—original draft preparation, W.T.; writing—review and editing, A.H.-M.N., H.W., J.K. and Z.D.; supervision, A.H.-M.N., H.W. and Z.D. All authors have read and agreed to the published version of the manuscript.

Funding

This research was funded by the National Natural Science Foundation of China (grant number 42274016), Program for Guangdong Introducing Innovative and Entrepreneurial Teams (grant number 2019ZT08L213), and Guangdong Forestry Science Data Center (grant number 2021B1212100004).

Data Availability Statement

The Sentinel-1 data used in this study are downloaded from the European Space Agency (ESA) through the ASF Data Hub website https://search.asf.alaska.edu/ (accessed on 10 November 2023). The geology data and Groundwater data used in the study is available at https://geocloud.cgs.gov.cn/ (accessed on 15 November 2023). The land use data used in the study is available at https://data-starcloud.pcl.ac.cn/zh (accessed on 16 November 2023).

Acknowledgments

We express our gratitude to the European Space Agency for providing Sentinel-1A data and POD data free of charge. We also thank the China Geological Survey for providing groundwater data and geological data, and acknowledge the Pengcheng Laboratory for providing land use data.

Conflicts of Interest

The authors declare no conflicts interest.

References

  1. Abidin, H.Z.; Andreas, H.; Gumilar, I.; Sidiq, T.P.; Fukuda, Y. Land subsidence in coastal city of Semarang (Indonesia): Characteristics, impacts and causes. Geomat. Nat. Hazards Risk 2013, 4, 226–240. [Google Scholar] [CrossRef]
  2. Antoniadis, N.; Alatza, S.; Loupasakis, C.; Kontoes, C. Land Subsidence Phenomena vs. Coastal Flood Hazard—The Cases of Messolonghi and Aitolikon (Greece). Remote Sens. 2023, 15, 2112. [Google Scholar] [CrossRef]
  3. Arabameri, A.; Saha, S.; Roy, J.; Tiefenbacher, J.P.; Cerda, A.; Biggs, T.; Pradhan, B.; Thi Ngo, P.T.; Collins, A.L. A novel ensemble computational intelligence approach for the spatial prediction of land subsidence susceptibility. Sci Total Environ. 2020, 726, 138595. [Google Scholar] [CrossRef] [PubMed]
  4. Du, Z.; McCubbine, J.; Garthwaite, M.; Brown, N.; Ng, A.H.M.; Deane, A.; Wang, L.W. Toward a Wide-Scale Land Subsidence Product in Eastern States of Australia. IEEE Trans. Geosci. Remote Sens. 2023, 61, 5213312. [Google Scholar] [CrossRef]
  5. Mishra, V.; Malik, K.; Agarwal, V.; Mishra, P.K.; Jain, K. Impact assessment of unsustainable airport development in the Himalayas using remote sensing: A case study of Pakyong Airport, Sikkim, India. Quat. Sci. Adv. 2024, 13, 100144. [Google Scholar] [CrossRef]
  6. Ng, A.H.-M.; Liu, Z.; Du, Z.; Huang, H.; Wang, H.; Ge, L. A novel framework for combining polarimetric Sentinel-1 InSAR time series in subsidence monitoring—A case study of Sydney. Remote Sens. Environ. 2023, 295, 113694. [Google Scholar] [CrossRef]
  7. Du, Z.; Ge, L.; Ng, A.H.-M.; Zhu, Q.; Zhang, Q.; Kuang, J.; Dong, Y. Long-term subsidence in Mexico City from 2004 to 2018 revealed by five synthetic aperture radar sensors. Land Degrad. Dev. 2019, 30, 1785–1801. [Google Scholar] [CrossRef]
  8. Sorkhabi, O.M.; Nejad, A.S.; Khajehzadeh, M. Evaluation of Isfahan City Subsidence Rate Using InSAR and Artificial Intelligence. KSCE J. Civ. Eng. 2022, 26, 2901–2908. [Google Scholar] [CrossRef]
  9. Neely, W.R.; Borsa, A.A.; Burney, J.A.; Levy, M.C.; Silverii, F.; Sneed, M. Characterization of Groundwater Recharge and Flow in California’s San Joaquin Valley From InSAR-Observed Surface Deformation. Water Resour. Res. 2021, 57, e2020WR028451. [Google Scholar] [CrossRef]
  10. Jiang, H.; Balz, T.; Li, J.; Mishra, V. Preliminary Investigation of Sudden Ground Subsidence and Building Tilt in Balitai Town, Tianjin City, on 31 May 2023. Remote Sens. 2023, 15, 4891. [Google Scholar] [CrossRef]
  11. Guo, H.P.; Bai, J.B.; Zhang, Y.Q.; Wang, L.Y.; Shi, J.S.; Li, W.P.; Zhang, Z.C.; Wang, Y.L.; Zhu, J.Y.; Wang, H.G. The evolution characteristics and mechanism of the land subsidence in typical areas of the North China Plain. Geol. China 2017, 44, 1115–1127. (In Chinese) [Google Scholar]
  12. Zhu, Z.; Vuik, V.; Visser, P.J.; Soens, T.; van Wesenbeeck, B.; van de Koppel, J.; Jonkman, S.N.; Temmerman, S.; Bouma, T.J. Historic storms and the hidden value of coastal wetlands for nature-based flood defence. Nat. Sustain. 2020, 3, 853–862. [Google Scholar] [CrossRef]
  13. Syvitski, J.P.M.; Kettner, A.J.; Overeem, I.; Hutton, E.W.H.; Hannon, M.T.; Brakenridge, G.R.; Day, J.; Vörösmarty, C.; Saito, Y.; Giosan, L.; et al. Sinking deltas due to human activities. Nat. Geosci. 2009, 2, 681–686. [Google Scholar] [CrossRef]
  14. Liu, Z.; Ng, A.H.-M.; Wang, H.; Chen, J.; Du, Z.; Ge, L. Land subsidence modeling and assessment in the West Pearl River Delta from combined InSAR time series, land use and geological data. Int. J. Appl. Earth Obs. Geoinf. 2023, 118, 103228. [Google Scholar] [CrossRef]
  15. Khorrami, M.; Abrishami, S.; Maghsoudi, Y.; Alizadeh, B.; Perissin, D. Extreme subsidence in a populated city (Mashhad) detected by PSInSAR considering groundwater withdrawal and geotechnical properties. Sci. Rep. 2020, 10, 11357. [Google Scholar] [CrossRef] [PubMed]
  16. Galloway, D.L.; Erkens, G.; Kuniansky, E.L.; Rowland, J.C. Preface: Land subsidence processes. Hydrogeol. J. 2016, 24, 547–550. [Google Scholar] [CrossRef]
  17. Bagheri-Gavkosh, M.; Hosseini, S.M.; Ataie-Ashtiani, B.; Sohani, Y.; Ebrahimian, H.; Morovat, F.; Ashrafi, S. Land subsidence: A global challenge. Sci. Total Environ. 2021, 778, 146193. [Google Scholar] [CrossRef]
  18. Kuang, J.; Ng, A.H.; Ge, L. Displacement Characterization and Spatial-Temporal Evolution of the 2020 Aniangzhai Landslide in Danba County Using Time-Series InSAR and Multi-Temporal Optical Dataset. Remote Sens. 2022, 14, 68. [Google Scholar] [CrossRef]
  19. Sheng, H.; Zhou, L.; Huang, C.; Ma, S.; Xian, L.; Chen, Y.; Yang, F. Surface Subsidence Characteristics and Causes in Beijing (China) before and after COVID-19 by Sentinel-1A TS-InSAR. Remote Sens. 2023, 15, 1199. [Google Scholar] [CrossRef]
  20. Dong, S.; Samsonov, S.; Yin, H.; Huang, L. Two-Dimensional Ground Deformation Monitoring in Shanghai Based on SBAS and MSBAS InSAR Methods. J. Earth Sci. 2018, 29, 960–968. [Google Scholar] [CrossRef]
  21. Wang, H.; Feng, G.; Xu, B.; Yu, Y.; Li, Z.; Du, Y.; Zhu, J. Deriving Spatio-Temporal Development of Ground Subsidence Due to Subway Construction and Operation in Delta Regions with PS-InSAR Data: A Case Study in Guangzhou, China. Remote Sens. 2017, 9, 1004. [Google Scholar] [CrossRef]
  22. Zhu, L.; Gong, H.; Li, X.; Li, Y.; Su, X.; Guo, G. Comprehensive analysis and artificial intelligent simulation of land subsidence of Beijing, China. Chin. Geogr. Sci. 2013, 23, 237–248. [Google Scholar] [CrossRef]
  23. Dai, Y.W.; Ng, A.H.-M.; Min, X.Y.; Wang, H.; Zhu, H.L.; Peng, L.C. Ground Deformation Monitoring of Major Cities in the Pearl Delta Region Using Time Series InSAR Technique River. J. Guangdong Univ. Technol. 2019, 36, 92–98. (In Chinese) [Google Scholar]
  24. Zhejiang News. The Subsidence Area of Ningbo Has Reached 500 Square Kilometers. Available online: https://zjnews.zjol.com.cn/zjnews/nbnews/201610/t20161012_1969321.shtml (accessed on 1 November 2023).
  25. Zhao, T.Z.; Hou, Y.S.; Hu, X.F. Study on Countermeasures of Land Subsidence in Ningbo Urbanization. In Proceedings of the 2019 Academic Annual Meeting of Zhejiang Geological Society, Lishui, China, 28 November 2019. (In Chinese). [Google Scholar]
  26. Ningbo Municipal People’s Government. The State of Economic Development. Available online: https://www.ningbo.gov.cn/col/col1229200020/index.html (accessed on 1 November 2023).
  27. Tosi, L.; Strozzi, T.; Da Lio, C.; Teatini, P. Regional and local land subsidence at the Venice coastland by TerraSAR-X PSI. Proc. IAHS 2015, 372, 199–205. [Google Scholar] [CrossRef]
  28. Tosi, L.; Da Lio, C.; Strozzi, T.; Teatini, P. Combining L- and X-Band SAR Interferometry to Assess Ground Displacements in Heterogeneous Coastal Environments: The Po River Delta and Venice Lagoon, Italy. Remote Sens. 2016, 8, 308. [Google Scholar] [CrossRef]
  29. Maghsoudi, Y.; van der Meer, F.; Hecker, C.; Perissin, D.; Saepuloh, A. Using PS-InSAR to detect surface deformation in geothermal areas of West Java in Indonesia. Int. J. Appl. Earth Obs. Geoinf. 2018, 64, 386–396. [Google Scholar] [CrossRef]
  30. Raucoules, D.; Le Mouelic, S.; Carnec, C.; Maisons, C.; King, C. Urban subsidence in the city of Prato (Italy) monitored by satellite radar interferometry. Int. J. Remote Sens. 2003, 24, 891–897. [Google Scholar] [CrossRef]
  31. Ferretti, A.; Prati, C.; Rocca, F. Permanent scatterers in SAR interferometry. IEEE Trans. Geosci. Remote Sens. 2001, 39, 8–20. [Google Scholar] [CrossRef]
  32. Berardino, P.; Fornaro, G.; Lanari, R.; Sansosti, E. A new algorithm for surface deformation monitoring based on small baseline differential SAR interferograms. IEEE Trans. Geosci. Remote Sens. 2002, 40, 2375–2383. [Google Scholar] [CrossRef]
  33. Massonnet, D.; Rossi, M.; Carmona, C.; Adragna, F.; Peltzer, G.; Feigl, K.; Rabaute, T. The displacement field of the Landers earthquake mapped by radar interferometry. Nature 1993, 364, 138–142. [Google Scholar] [CrossRef]
  34. Wang, H.; Wright, T.J.; Liu-Zeng, J.; Peng, L. Strain Rate Distribution in South-Central Tibet from Two Decades of InSAR and GPS. Geophys. Res. Lett. 2019, 46, 5170–5179. [Google Scholar] [CrossRef]
  35. Lanari, R.; Lundgren, P.; Sansosti, E. Dynamic deformation of Etna Volcano observed by satellite radar interferometry. Geophys. Res. Lett. 1998, 25, 1541–1544. [Google Scholar] [CrossRef]
  36. Lu, Z.; Masterlark, T.; Dzurisin, D.; Rykhus, R.; Wicks, C., Jr. Magma supply dynamics at Westdahl volcano, Alaska, modeled from satellite radar interferometry. J. Geophys. Res. Solid Earth 2003, 108, 2354. [Google Scholar] [CrossRef]
  37. Teatini, P.; Castelletto, N.; Ferronato, M.; Gambolati, G.; Janna, C.; Cairo, E.; Marzorati, D.; Colombo, D.; Ferretti, A.; Bagliani, A.; et al. Geomechanical response to seasonal gas storage in depleted reservoirs: A case study in the Po River basin, Italy. J. Geophys. Res. Earth Surf. 2011, 116, F02002. [Google Scholar] [CrossRef]
  38. Li, S.; Benson, C.; Gens, R.; Lingle, C. Motion patterns of Nabesna Glacier (Alaska) revealed by interferometric SAR techniques. Remote Sens. Environ. 2008, 112, 3628–3638. [Google Scholar] [CrossRef]
  39. Zheng, X.X. Ningbo System Control on Land Subsidence. Hydrogeol. Eng. Geol. 1991, 18, 35–37+61. (In Chinese) [Google Scholar]
  40. Yang, L.Q. Numerical Simulation of Land Subsidence Considering Both Effects of Load and Groundwater Exploitation and Applications. Ph.D. Thesis, China University of Geosciences, Wuhan, China, 2014. (In Chinese). [Google Scholar]
  41. Yu, Y.C. Study on Coupling Model of Groundwater and Land Subsidence and Simulation of Emergency Water Supply in Ningbo Urban Area. Master’s Thesis, Chong Qing University, Chongqing, China, 2020. (In Chinese). [Google Scholar]
  42. Zhu, B.Y.; Li, J.C.; Chu, Z.W.; Wang, X.; Sun, J.W.; Yao, F.Y. Ground Subsidence Monitoring Using Sentinel-1 Images in Ningbo City. Bull. Surv. Mapp. 2018, 10, 102–106. (In Chinese) [Google Scholar]
  43. Wen, H.; Hu, Z.H.; Hu, Y.K. Land Subsidence Monitoring along Rail Transit in Ningbo Based on SBAS Technology. Urban Geotech. Investig. Surv. 2022, 162–165. (In Chinese) [Google Scholar]
  44. Gao, F.; Zhao, T.Z.; Wang, W.J.; Zhang, X.L.; Zheng, L.W. Analysis and risk evaluation of current land subsidence in Ningbo City. Chin. J. Geol. Hazard Control 2023, 34, 127–135. (In Chinese) [Google Scholar]
  45. Su, B.L. The Rheological Law of Ningbo Soft Soil and Its Application to Engineering. J. Hebei GEO Univ. 1990, 13, 111–120+2. (In Chinese) [Google Scholar]
  46. Liang, G.Q.; Zhang, M.Q.; Yu, J.Q.; Sun, B.Y. Technical Characteristics of Mild Clay in Coastal Areas of Zhejiang Province. J. China Univ. Min. Technol. 2002, 31, 98–100+104. (In Chinese) [Google Scholar]
  47. Shen, X.Y.; Sun; Zhou, G.Y.; Lin, D.; Zhang, R.T. Physical Mathematics Model and Prediction on Subsidence of Ningbo City. J. Earth Sci. 1989, 14, 135–144. (In Chinese) [Google Scholar]
  48. Wang, Z.F.; Zhang, H.H.; Shen, J. Ningbo actively prevents land subsidence. Decis. Inf. 2009, 46–47. (In Chinese) [Google Scholar]
  49. Farr, T.G.; Rosen, P.A.; Caro, E.; Crippen, R.; Duren, R.; Hensley, S.; Kobrick, M.; Paller, M.; Rodriguez, E.; Roth, L.; et al. The Shuttle Radar Topography Mission. Rev. Geophys. 2007, 45, RG2004. [Google Scholar] [CrossRef]
  50. Geo Cloud. National Digital Core Platform. Available online: https://search.ndcp.cgsi.cn/swzxDrill/map (accessed on 1 March 2023).
  51. Gong, P.; Chen, B.; Li, X.; Liu, H.; Wang, J.; Bai, Y.; Chen, J.; Chen, X.; Fang, L.; Feng, S.; et al. Mapping essential urban land use categories in China (EULUC-China): Preliminary results for 2018. Sci. Bull. 2020, 65, 182–187. [Google Scholar] [CrossRef] [PubMed]
  52. Ng, A.H.-M.; Wang, H.; Dai, Y.; Pagli, C.; Chen, W.; Ge, L.; Du, Z.; Zhang, K. InSAR Reveals Land Deformation at Guangzhou and Foshan, China between 2011 and 2017 with COSMO-SkyMed Data. Remote Sens. 2018, 10, 813. [Google Scholar] [CrossRef]
  53. Wang, H.; Avouac, J.-P.; Shao, Z.; Liu, X.; Wei, W.; Zhan, S.; Dai, X.; Lou, Y. CSES Community Deformation Models in Southwest China, in China Seismic Experimental Site: Theoretical Framework and Ongoing Practice; Li, Y.-G., Zhang, Y., Wu, Z., Eds.; Springer Nature: Singapore, 2022; pp. 111–133. [Google Scholar]
  54. Rosen, P.A.; Gurrola, E.M.; Agram, P.; Cohen, J.; Lavalle, M.; Riel, B.V.; Fattahi, H.; Aivazis, M.A.G.; Simons, M.; Buckley, S.M. The InSAR Scientific Computing Environment 3.0: A Flexible Framework for NISAR Operational and User-Led Science Processing. In Proceedings of the IGARSS 2018—2018 IEEE International Geoscience and Remote Sensing Symposium, Valencia, Spain, 22–27 July 2018; pp. 4897–4900. [Google Scholar]
  55. Herrera, G.; Tomás, R.; Lopez-Sanchez, J.M.; Delgado, J.; Mallorqui, J.J.; Duque, S.; Mulas, J. Advanced DInSAR analysis on mining areas: La Union case study (Murcia, SE Spain). Eng. Geol. 2007, 90, 148–159. [Google Scholar] [CrossRef]
  56. Ng, A.H.M.; Ge, L.L.; Li, X.J.; Zhang, K. Monitoring ground deformation in Beijing, China with persistent scatterer SAR interferometry. J. Geod. 2012, 86, 375–392. [Google Scholar] [CrossRef]
  57. Rodriguez, E.; Morris, C.S.; Belz, J.E.; Chapin, E.; Martin, J.; Daffer, W.; Hensley, S. An Assessment of the SRTM Topographic Products; Technical Report JPL D-31639; Jet Propulsion Laboratory: Pasadena, CA, USA, 2005. [Google Scholar]
  58. Kampes, B.M.; Hanssen, R.F. Ambiguity resolution for permanent scatterer interferometry. IEEE Trans. Geosci. Remote Sens. 2004, 42, 2446–2453. [Google Scholar] [CrossRef]
  59. Ng, A.H.-M.; Ge, L.; Li, X.; Abidin, H.Z.; Andreas, H.; Zhang, K. Mapping land subsidence in Jakarta, Indonesia using persistent scatterer interferometry (PSI) technique with ALOS PALSAR. Int. J. Appl. Earth Obs. Geoinf. 2012, 18, 232–242. [Google Scholar] [CrossRef]
  60. Costantini, M.; Rosen, P.A. A generalized phase unwrapping approach for sparse data. In Proceedings of the IEEE 1999 International Geoscience and Remote Sensing Symposium. IGARSS’99 (Cat. No.99CH36293), Hamburg, Germany, 28 June–2 July 1999. [Google Scholar]
  61. Yang, Q.; Ke, Y.; Zhang, D.; Chen, B.; Gong, H.; Lv, M.; Zhu, L.; Li, X. Multi-Scale Analysis of the Relationship between Land Subsidence and Buildings: A Case Study in an Eastern Beijing Urban Area Using the PS-InSAR Technique. Remote Sens. 2018, 10, 1006. [Google Scholar] [CrossRef]
  62. Tan, X.R.; Deng, J.L. Grey Correlation Analysis: A New Method of Multivariate Statistical Analysis. Stat. Res. 1995, 46–48. (In Chinese) [Google Scholar]
  63. Sun, L.K.; Jing, J.S.; Gen, J.B. Research on the Influence Factors of the Equipment’s Expense Based on the Amend Grey Correlation. Math. Pract. Theory 2012, 42, 140–145. (In Chinese) [Google Scholar]
  64. Zhao, L.; Jiang, X.W.; Li, Y.M.; Luo, Y.; Cui, W.J.; Tian, M.Z.; Wang, S.F.; Tian, L.; Xu, L.; Liu, Y.Z.; et al. Groundwater level changes and its impact on land subsidence in the Beijing Plain during the recent 10 years. Acta Geol. Sin. 2024, 98, 1–15. (In Chinese) [Google Scholar]
  65. Cabral-Cano, E.; Dixon, T.H.; Miralles-Wilhelm, F.; Díaz-Molina, O.; Sánchez-Zamora, O.; Carande, R.E. Space geodetic imaging of rapid ground subsidence in Mexico City. GSA Bull. 2008, 120, 1556–1566. [Google Scholar] [CrossRef]
  66. López-Quiroz, P.; Doin, M.-P.; Tupin, F.; Briole, P.; Nicolas, J.-M. Time series analysis of Mexico City subsidence constrained by radar interferometry. J. Appl. Geophys. 2009, 69, 1–15. [Google Scholar] [CrossRef]
  67. Ortiz-Zamora, D.; Ortega-Guerrero, A. Evolution of long-term land subsidence near Mexico City: Review, field investigations, and predictive simulations. Water Resour. Res. 2010, 46, W01513. [Google Scholar] [CrossRef]
  68. Sun, M.; Du, Y.A.; Liu, Q.Y.; Feng, G.C.; Peng, X.; Liao, C.H. Understanding the Spatial-Temporal Characteristics of Land Subsidence in Shenzhen under Rapid Urbanization Based on MT-InSAR. IEEE J. Sel. Top. Appl. Earth Obs. Remote Sens. 2023, 16, 4153–4166. [Google Scholar] [CrossRef]
  69. Geo Cloud. Technical Regulations for Data Processing of Interferometric Radar. Available online: https://geocloud.cgs.gov.cn/common-search/search/detail?globalId=cpgl_dzcp_jsbz_421_0707020145&networkType=extranet&table_name=cpgl_dzcp&isAccurate=false&keyword=Technical%20regulations%20for%20data%20processing%20of%20interferometric%20radar (accessed on 1 March 2023).
  70. Ningbo Bureau of Natural Resources and Planning. Report on Ground Settlement Monitoring Results in Ningbo City in 2017. Available online: https://zgj.ningbo.gov.cn/art/2018/4/20/art_1229036868_45514081.html (accessed on 1 March 2023).
  71. Tang, W.; Zhan, W.; Jin, B.; Motagh, M.; Xu, Y. Spatial Variability of Relative Sea-Level Rise in Tianjin, China: Insight from InSAR, GPS, and Tide-Gauge Observations. IEEE J. Sel. Top. Appl. Earth Obs. Remote Sens. 2021, 14, 2621–2633. [Google Scholar] [CrossRef]
  72. Chaussard, E.; Wdowinski, S.; Cabral-Cano, E.; Amelung, F. Land subsidence in central Mexico detected by ALOS InSAR time-series. Remote Sens. Environ. 2014, 140, 94–106. [Google Scholar] [CrossRef]
  73. Chen, B.; Gong, H.; Li, X.; Lei, K.; Zhu, L.; Gao, M.; Zhou, C. Characterization and causes of land subsidence in Beijing, China. Int. J. Remote Sens. 2017, 38, 808–826. [Google Scholar] [CrossRef]
  74. Gao, F.; Zhao, T.; Zhu, X.; Zheng, L.; Wang, W.; Zheng, X. Land Subsidence Characteristics and Numerical Analysis of the Impact on Major Infrastructure in Ningbo, China. Sustainability 2023, 15, 543. [Google Scholar] [CrossRef]
  75. Tomás, R.; Herrera, G.; Delgado, J.; Lopez-Sanchez, J.M.; Mallorquí, J.J.; Mulas, J. A ground subsidence study based on DInSAR data: Calibration of soil parameters and subsidence prediction in Murcia City (Spain). Eng. Geol. 2010, 111, 19–30. [Google Scholar] [CrossRef]
  76. Agarwal, V.; Kumar, A.; Gee, D.; Grebby, S.; Gomes, R.L.; Marsh, S. Comparative Study of Groundwater-Induced Subsidence for London and Delhi Using PSInSAR. Remote Sens. 2021, 13, 4741. [Google Scholar] [CrossRef]
  77. Jiang, L.; Bai, L.; Zhao, Y.; Cao, G.; Wang, H.; Sun, Q. Combining InSAR and Hydraulic Head Measurements to Estimate Aquifer Parameters and Storage Variations of Confined Aquifer System in Cangzhou, North China Plain. Water Resour. Res. 2018, 54, 8234–8252. [Google Scholar] [CrossRef]
  78. Parker, A.L.; Pigois, J.P.; Filmer, M.S.; Featherstone, W.E.; Timms, N.E.; Penna, N.T. Land uplift linked to managed aquifer recharge in the Perth Basin, Australia. Int. J. Appl. Earth Obs. Geoinf. 2021, 105, 102637. [Google Scholar] [CrossRef]
  79. He, Y.; Ng, A.H.-M.; Wang, H.; Kuang, J. Understanding the Spatiotemporal Characteristics of Land Subsidence and Rebound in the Lianjiang Plain Using Time-Series InSAR with Dual-Track Sentinel-1 Data. Remote Sens. 2023, 15, 3236. [Google Scholar] [CrossRef]
  80. Ningbo Municipal Statistics Bureau. Press Release on Ningbo’s Economic Operation in 2023. Available online: http://tjj.ningbo.gov.cn/art/2024/1/26/art_1229042910_58919607.html (accessed on 1 March 2024).
  81. Xiao, B.; Zhao, J.; Li, D.; Zhao, Z.; Xi, W.; Zhou, D. The Monitoring and Analysis of Land Subsidence in Kunming (China) Supported by Time Series InSAR. Sustainability 2022, 14, 12387. [Google Scholar] [CrossRef]
  82. Zhou, C.; Gong, H.; Chen, B.; Li, X.; Li, J.; Wang, X.; Gao, M.; Si, Y.; Guo, L.; Shi, M.; et al. Quantifying the contribution of multiple factors to land subsidence in the Beijing Plain, China with machine learning technology. Geomorphology 2019, 335, 48–61. [Google Scholar] [CrossRef]
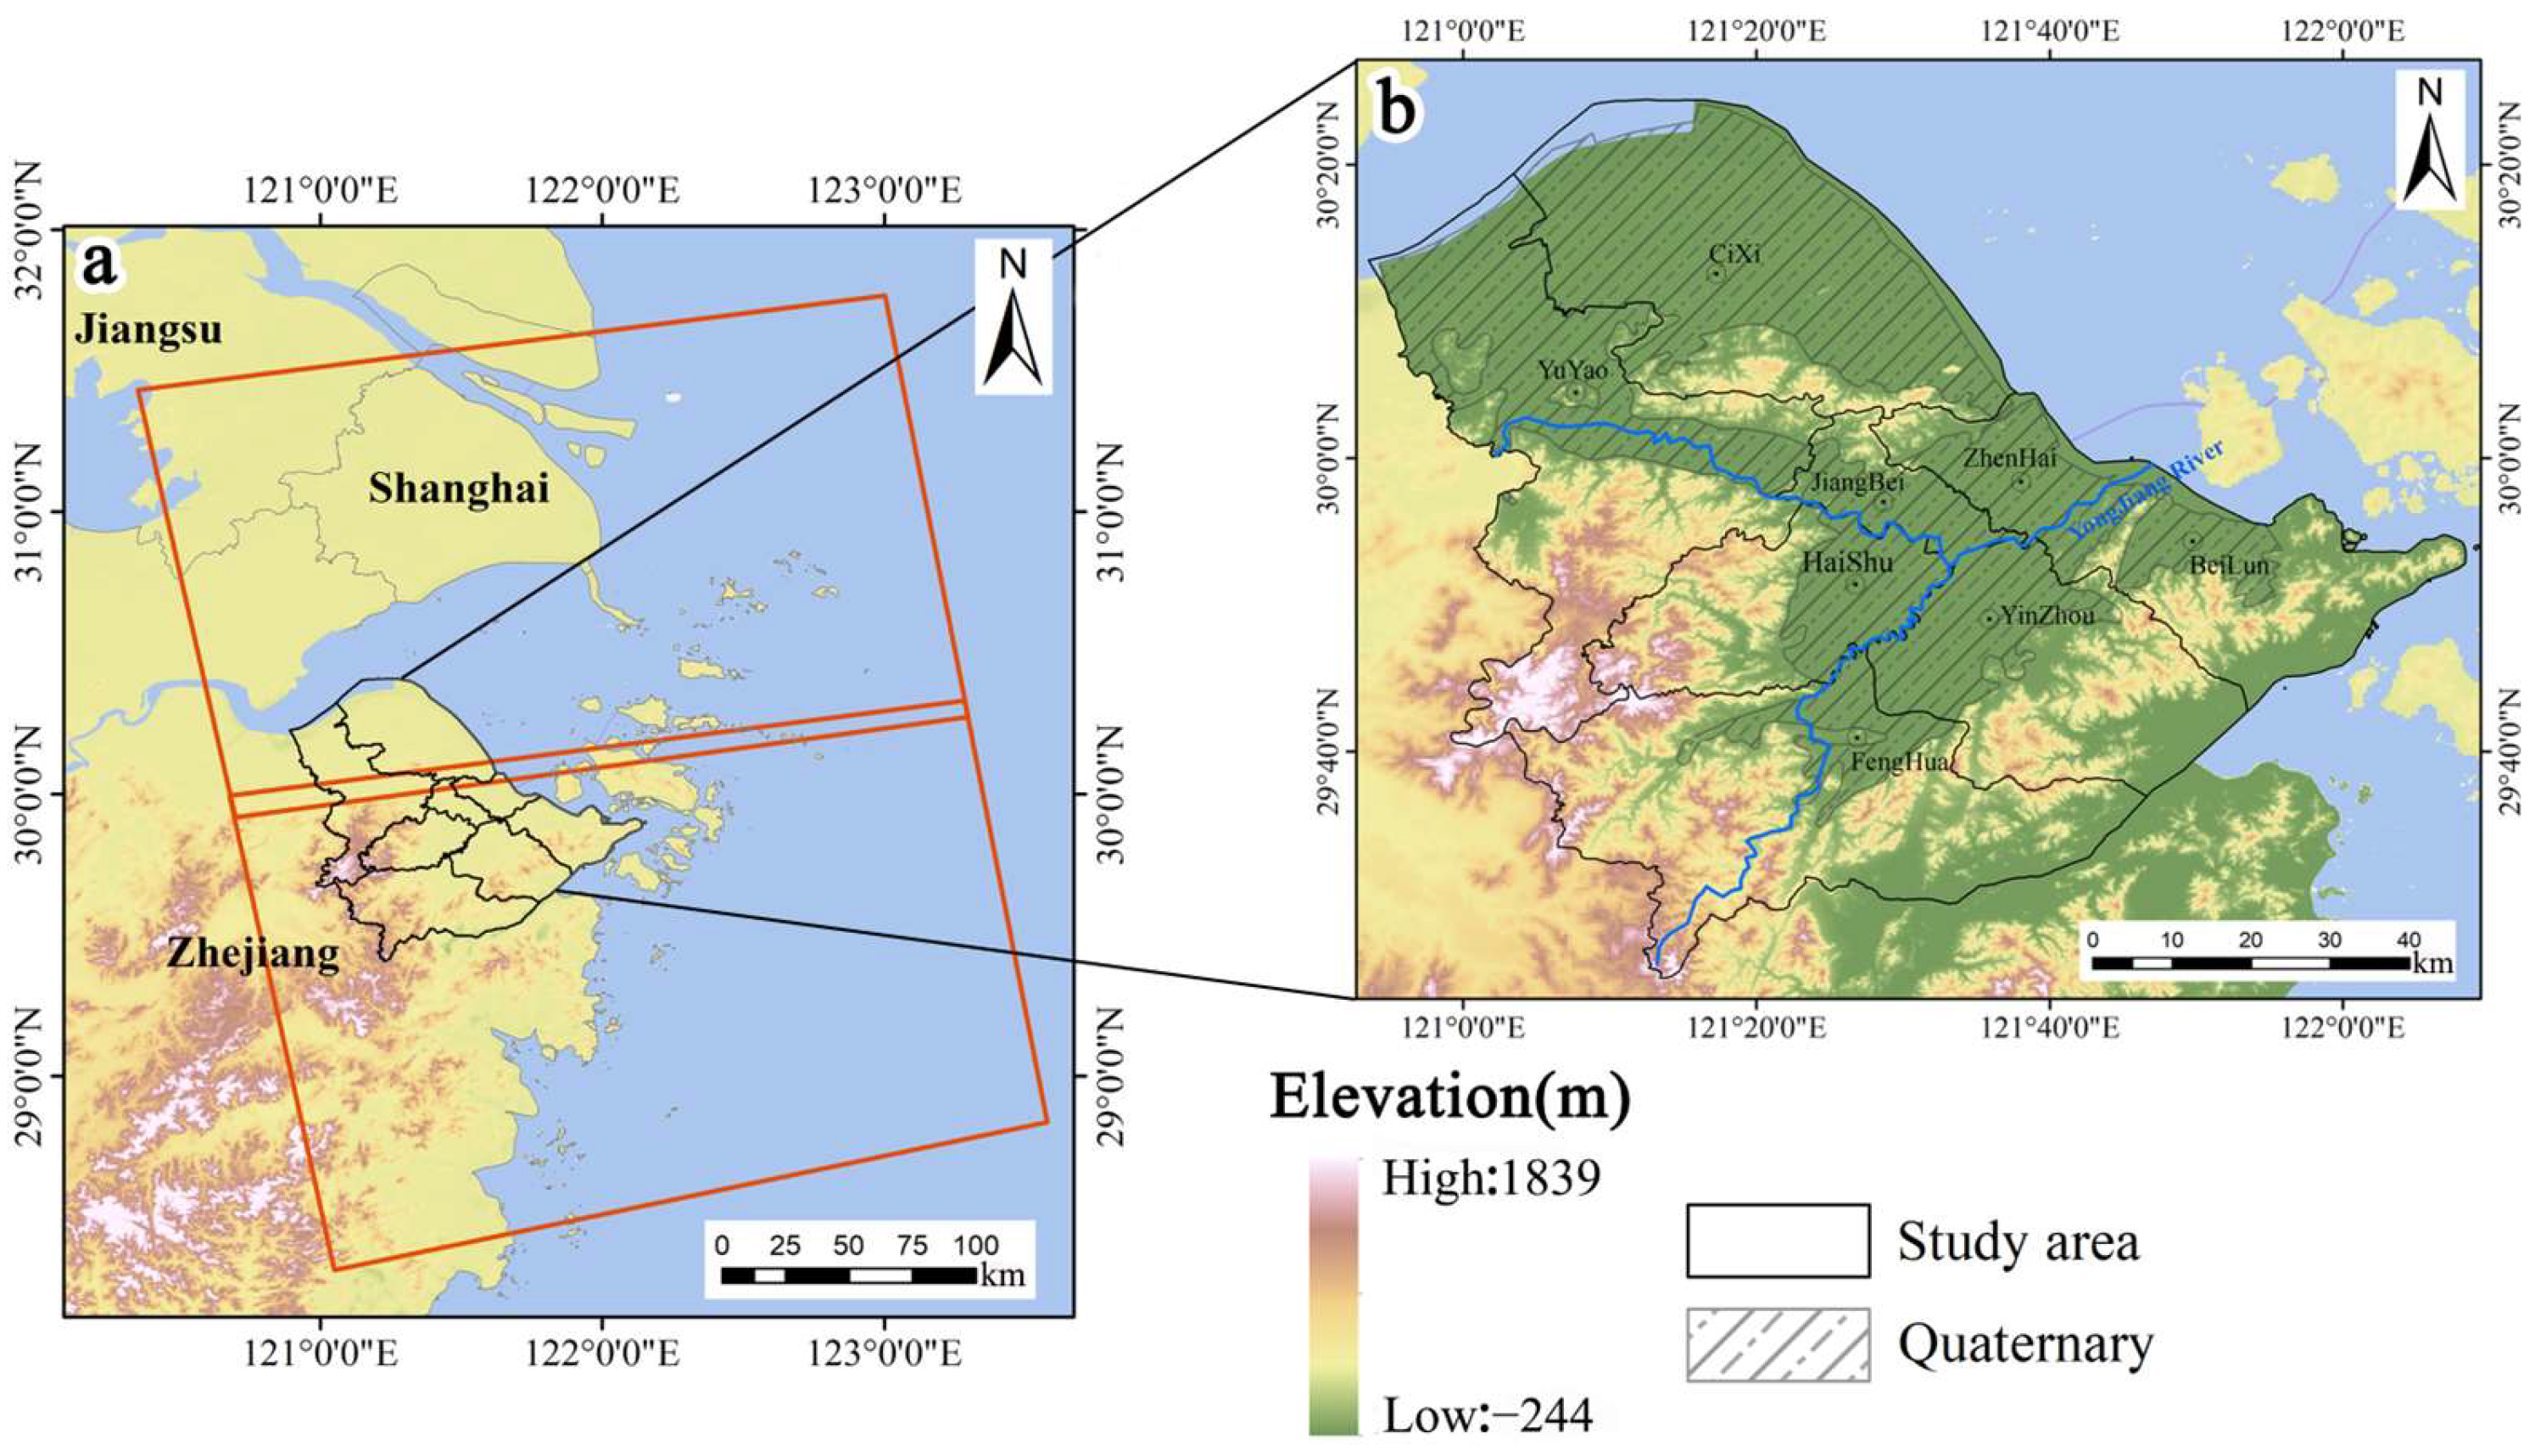
Figure 1. (a) The digital elevation model (DEM) map of Zhejiang Province, China, with the red box indicating the coverage of SAR images, and the black box representing the main research area. (b) Spatial distribution of Quaternary deposit and administrative divisions in the Ningbo Plain.
Remotesensing 16 02438 g001
Figure 2. Space–time baseline combination for the Sentinel-1A dataset.
Remotesensing 16 02438 g002
Figure 3. Workflow of this study.
Remotesensing 16 02438 g003
Figure 4. (a) Average subsidence rate map of the Sentinel-1A data coverage area, with black triangles indicating the GPS locations, black borders representing the extent of the study area, and red pentagrams indicating the locations of reference points. (b) The pink circles are divided according to administrative regions, representing subsidence areas, with blue borders indicating the area where the main urban area of Ningbo city is located.
Remotesensing 16 02438 g004
Figure 5. Map of average displacement velocities in the main urban area. The deep-blue dashed boundary indicates the main urban area boundaries. The blue, orange-red, and pink lines represent the subsidence contour lines released by the Natural Resources and Planning Bureau of Ningbo City in 2017. The red border indicates newly emerged subsidence areas.
Remotesensing 16 02438 g005
Figure 6. Validation of TS-InSAR dataset: Comparison of SHA2 GNSS and TS-InSAR time series.
Remotesensing 16 02438 g006
Figure 7. Correlation between soft soil thickness and ground settlement: (a) Plot of soft soil thickness in borehole. (b) Plot of soft soil thickness versus vertical displacement rate.
Remotesensing 16 02438 g007
Figure 8. Vector map of Ningbo. Orange dots represent groundwater-depth-monitoring stations.
Remotesensing 16 02438 g008
Figure 9. Comparison of average ground deformation and groundwater level time series variables (refer to Figure 8 for the specific locations of (ag)).
Remotesensing 16 02438 g009
Figure 10. (a) The main land use type distribution in the Ningbo Plain. (b) The area where residential, commercial, and industrial land uses experience the greatest average subsidence. Here, ‘1’ represents commercial land use, ‘2’ represents residential land use, and ‘3’ represents industrial land use.
Remotesensing 16 02438 g010
Figure 11. The deformation rate within a 200 m buffer zone of the Ningbo subway lines, where pink indicates the line under construction and black indicates operational status. The red box represents the subsidence area of the operating line, and the blue box represents the subsidence area of the line under construction.
Remotesensing 16 02438 g011
Figure 12. These eight figures magnify the subsidence areas of eight different metro lines shown in Figure 11, with their numbers corresponding to those in Figure 11. The red box represents the subsidence area of the operating railway line, while the blue box represents the subsidence area of the railway line under construction.
Remotesensing 16 02438 g012
Table 1. Specific parameters of used SAR data.
ParameterValueParameterValue
Product typeSLCOrbit directionAscending
Sensor modeIWIncidence angle35.79
BandC-band (5.6 cm)Number of Scenes83
PolarizationVVFrame91 and 96
Relative orbit171Time rangeJanuary 2018–June 2023
Table 2. Comparison of subsidence results.
Subsidence Area2017 Deformation Rate
(mm/year)
2023 Maximum Deformation Rate (mm/year)
M1>20−22.8
M2>10−9.1
M(3-1)>30−17.5
M(3-2)>30−30.6
M4>20−8.9
M5>20−20.0
M6>20−16.2
M7>10−27.1
M8>10−20.1
Table 3. Sedimentation rates for different land use types.
PS NumberAverage Settlement
(mm/year)
Max Average Settlement
(mm/year)
Residential416,706−1.3−16.7
Commercial41,807−1.6−13.0
Industrial357,904−3.1−19.3
Transportation11,517−2.5−12.9
Disclaimer/Publisher’s Note: The statements, opinions and data contained in all publications are solely those of the individual author(s) and contributor(s) and not of MDPI and/or the editor(s). MDPI and/or the editor(s) disclaim responsibility for any injury to people or property resulting from any ideas, methods, instructions or products referred to in the content.