


Time-Series Analysis of Mining-Induced Subsidence in the Arid Region of Mongolia Based on SBAS-InSAR
 , ,
, ,
Abstract

1. Introduction
2. Materials
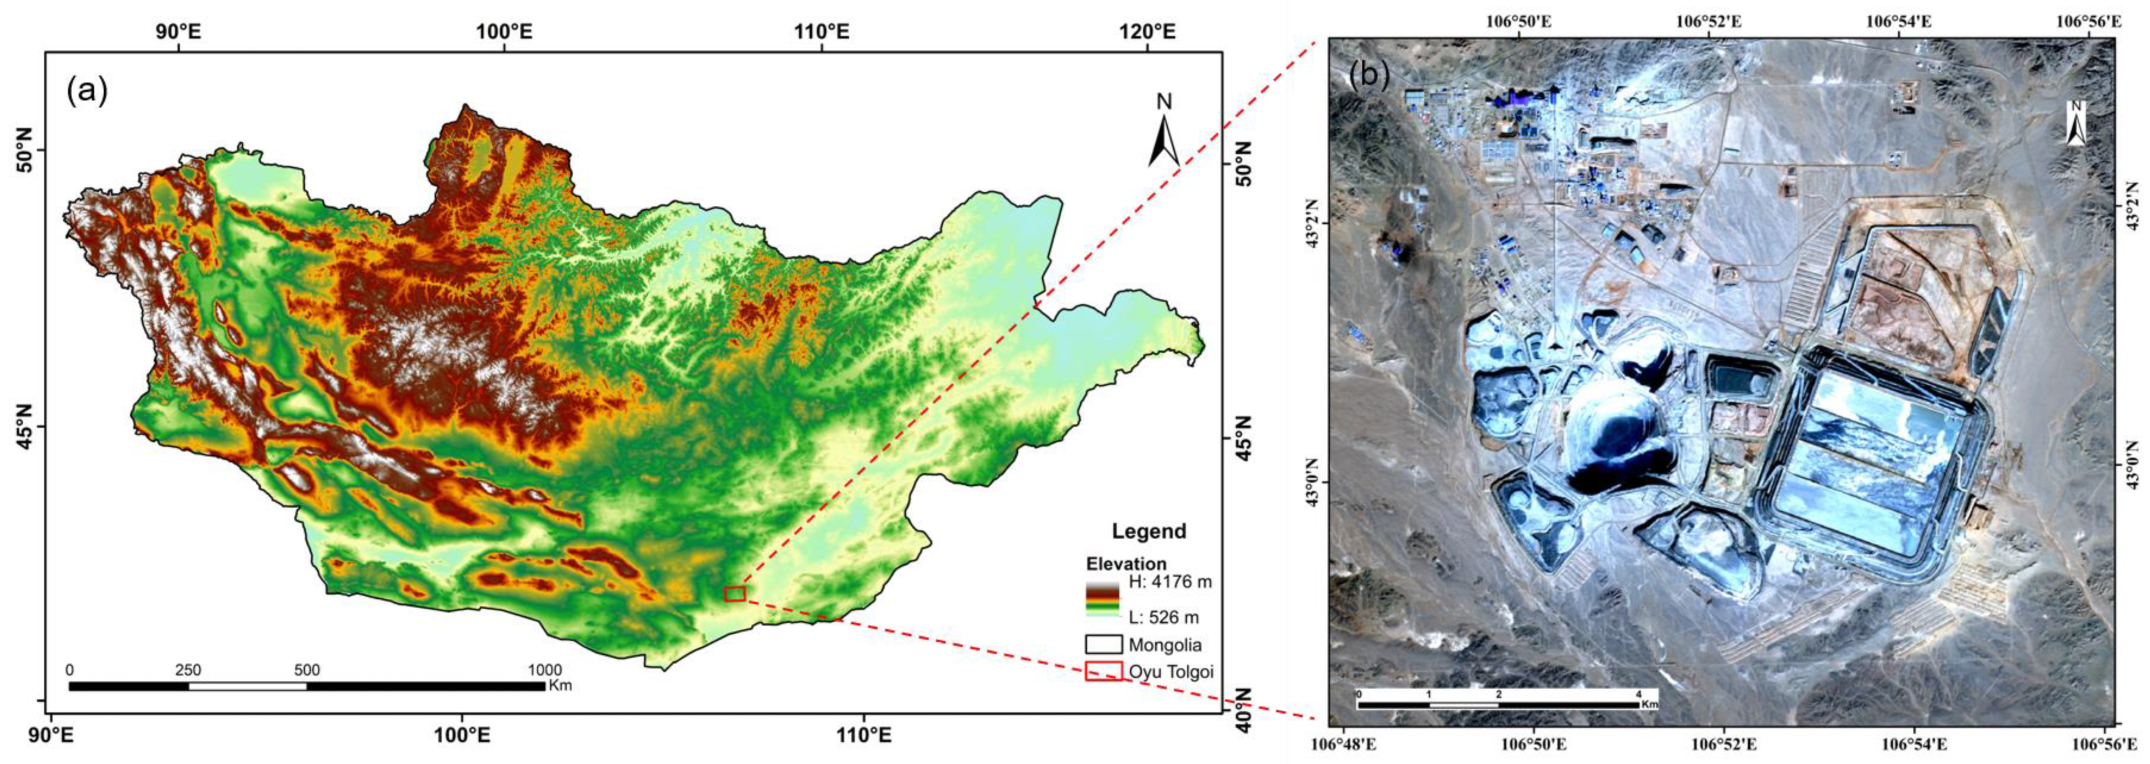
2.1. Study Area
2.2. Datasets
3. Methods
3.1. InSAR, DInSAR, and Time-Series InSAR
3.2. Principles of SBAS-InSAR
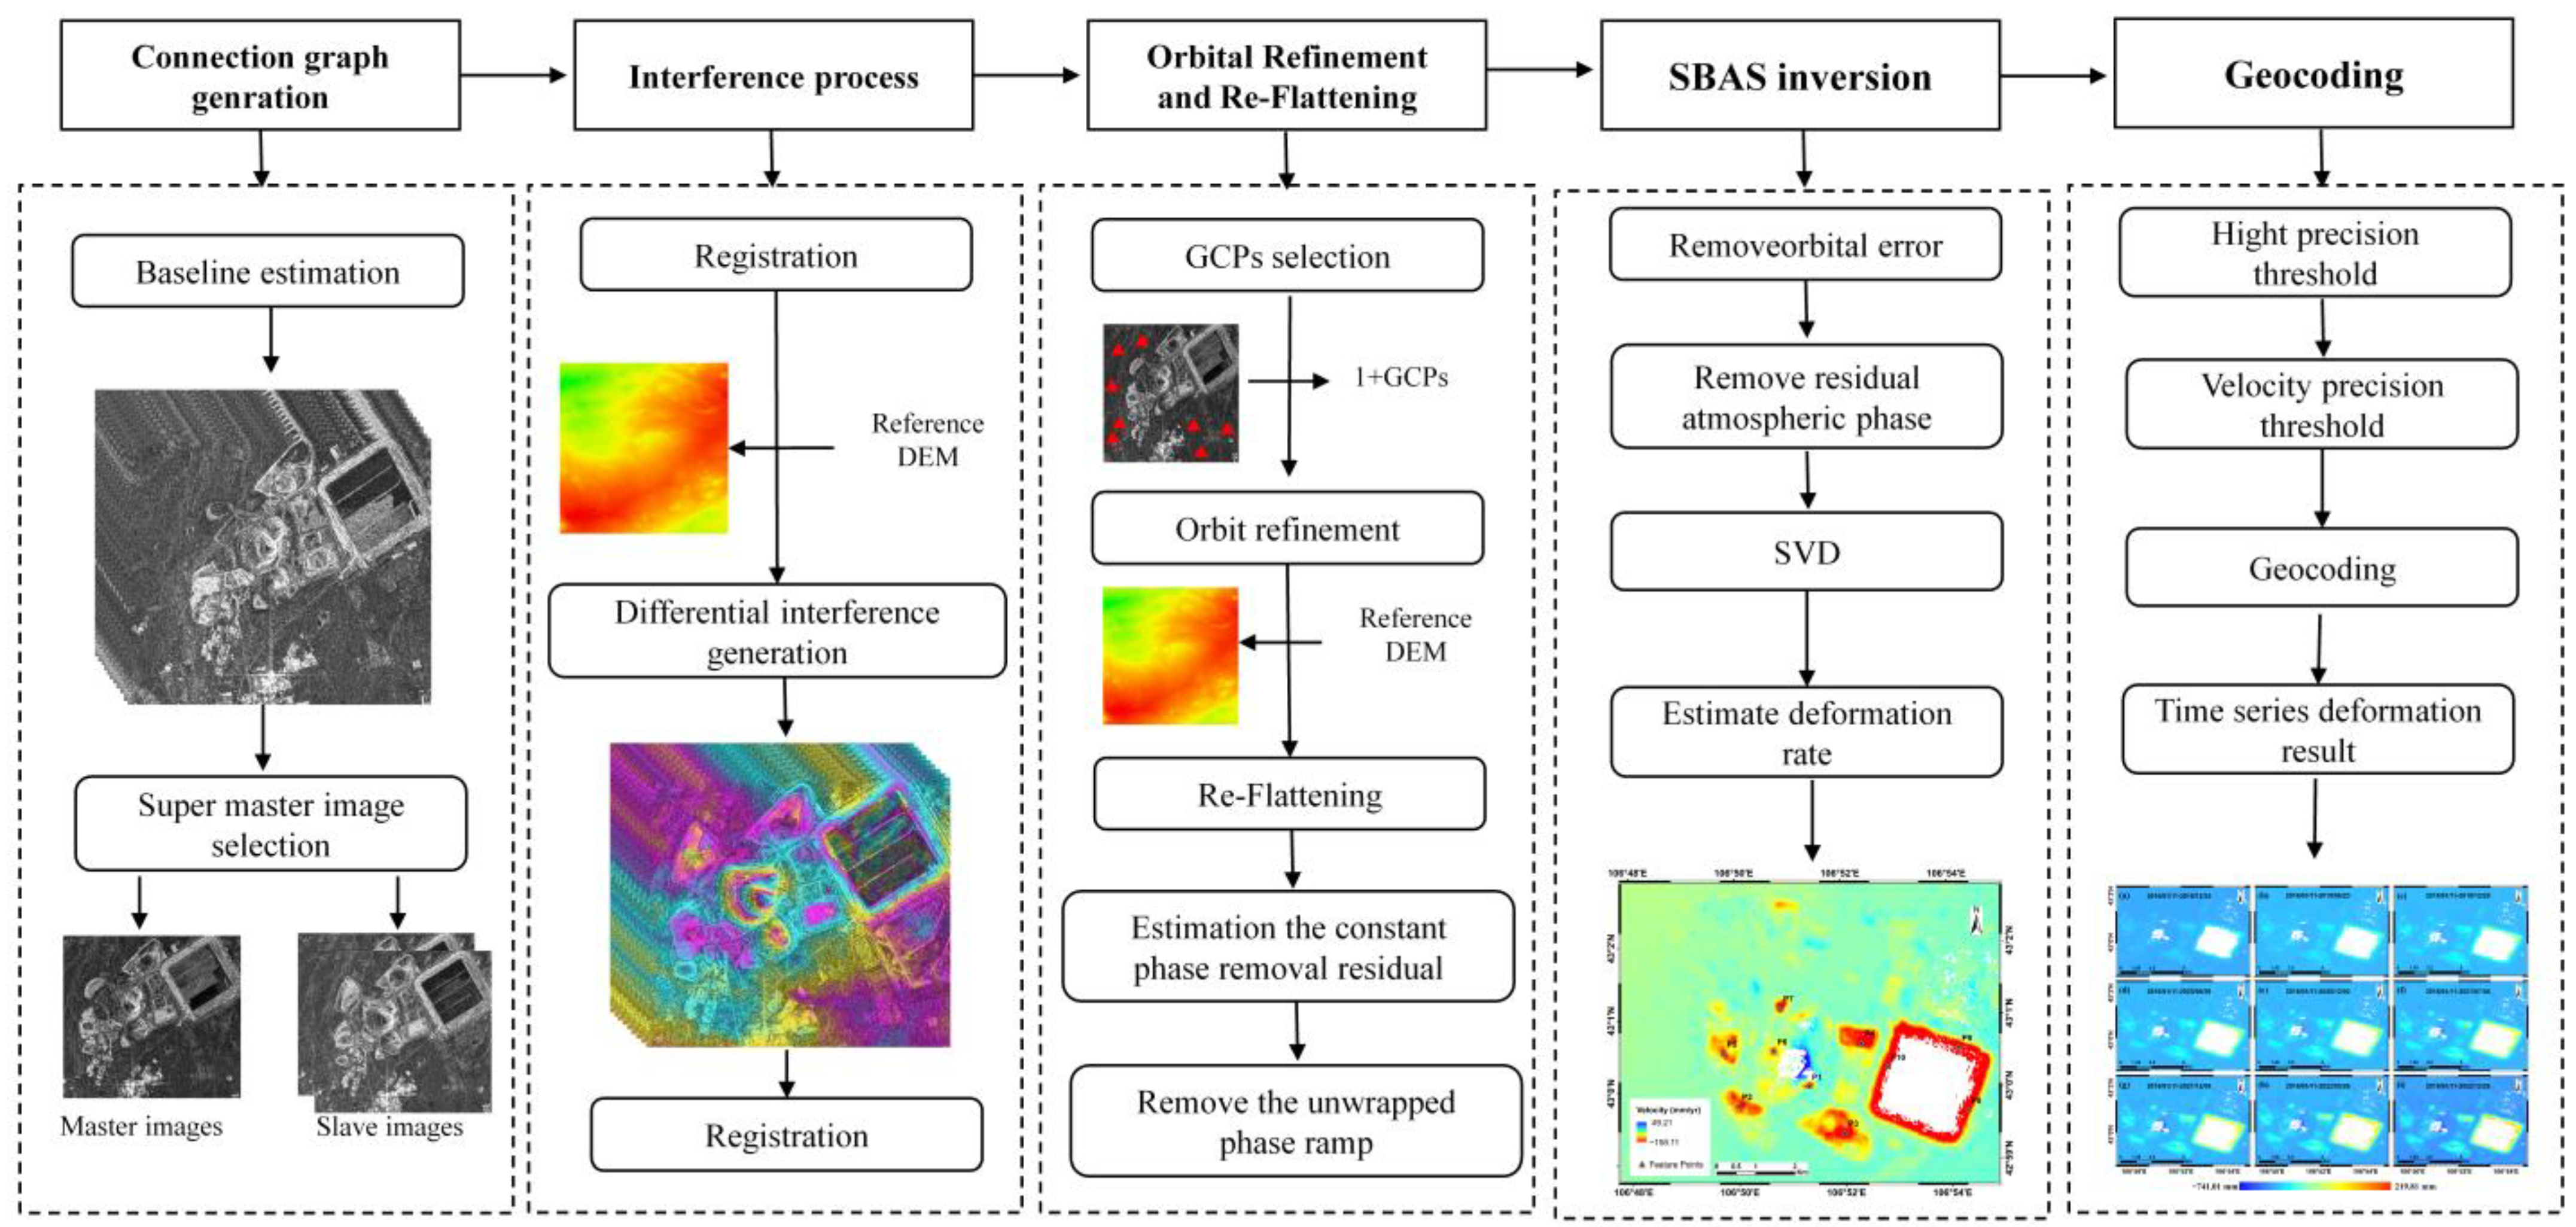
3.3. Data Processing
- (1)
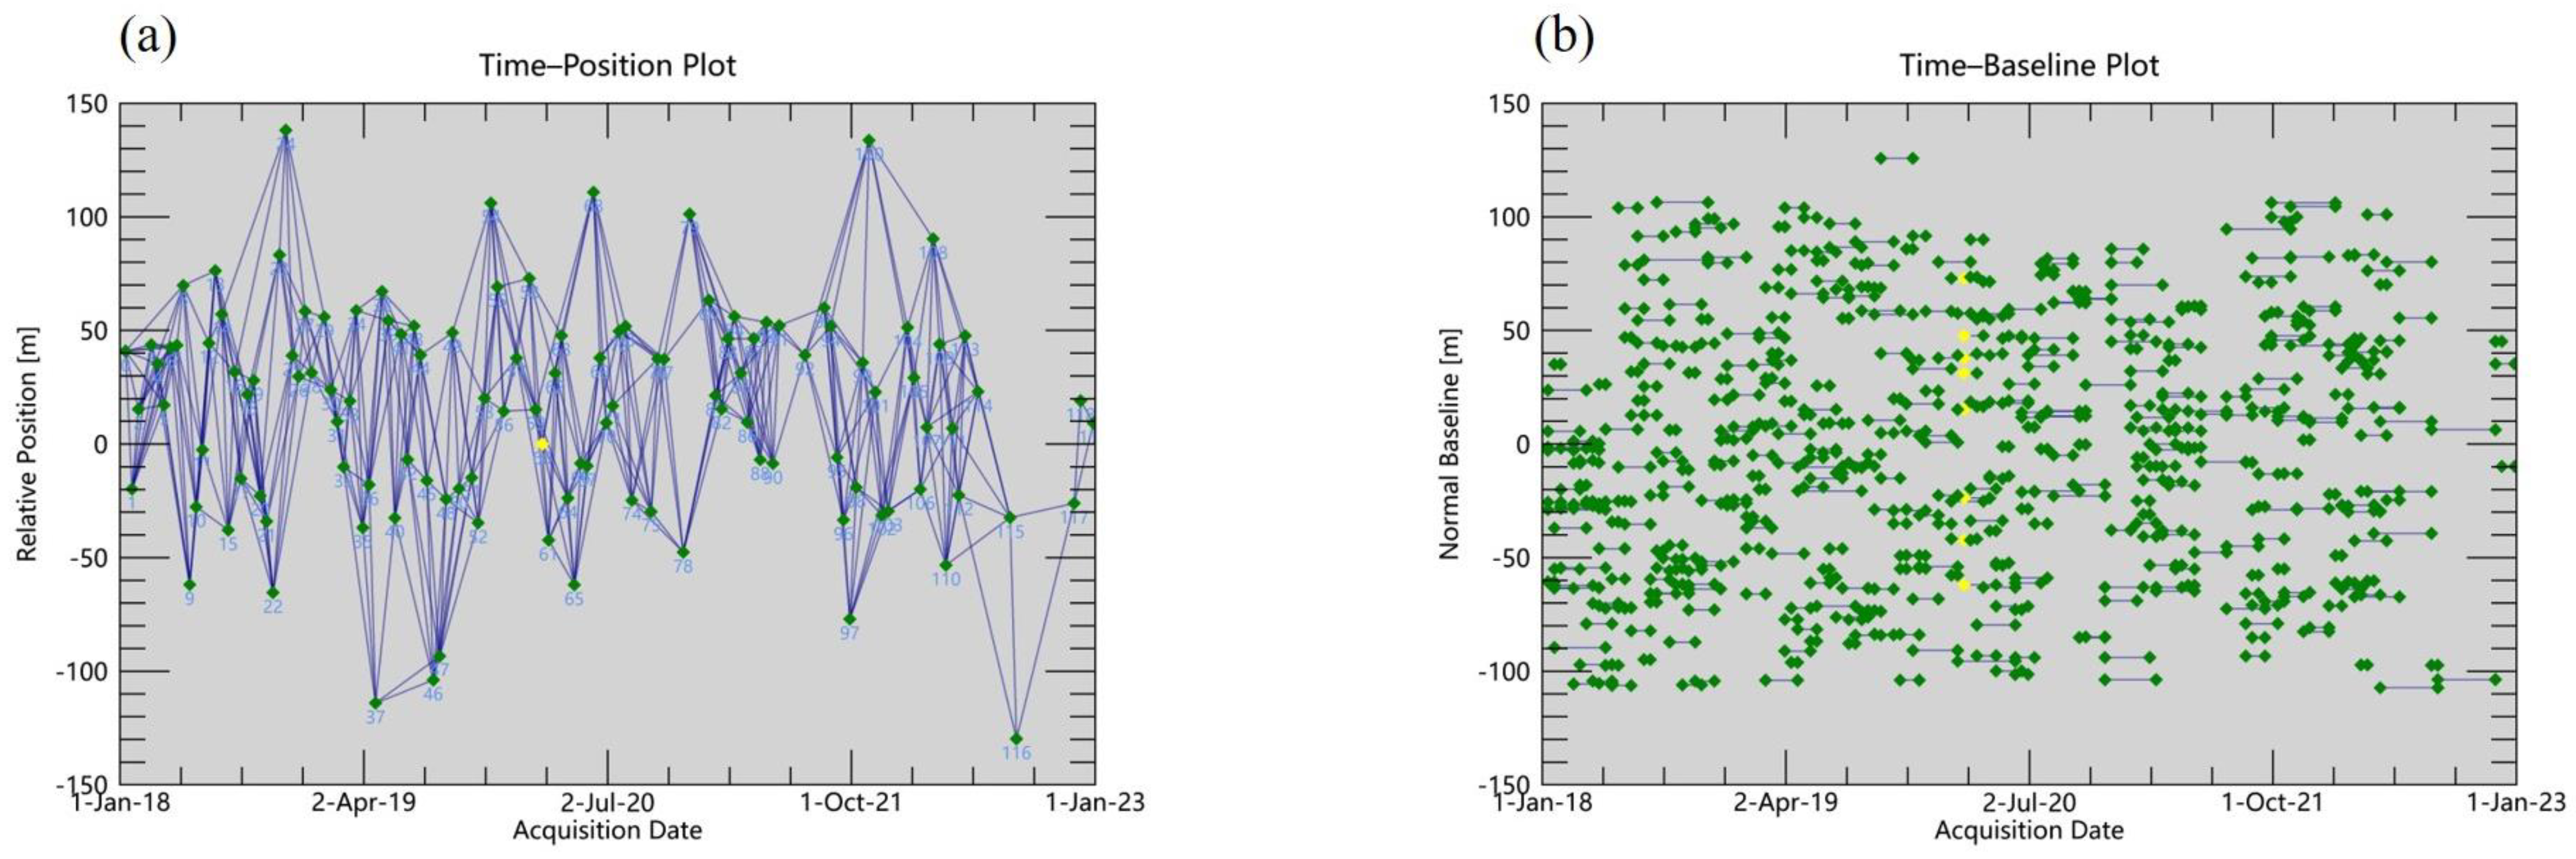
- Connection Graph Generation: This step involves estimating the baseline and selecting the primary image for the dataset. The image taken on March 10 was designated as the super master image, and all other images were processed in a multi-view setup.
- (2)
- Interference Processing: This stage processes all interferometric pairs to generate coherence, perform flattening, filter data, and unwrap phases, resulting in unwrapped interferograms. External Digital Elevation Model (DEM) data were utilized here to simulate and correct the topographic phase, enhancing the accuracy of the results.
- (3)
- Orbit Refining and Re-flattening: Involves selecting control points to refine the orbit and correct the flattened data. The software automatically selects several Ground Control Points (GCPs) to estimate the residual phase in the initial unwrapping phase and remove any residual topographic phase.
- (4)
- SBAS Inversion: Comprises two distinct inversions. The first inversion estimates deformation rates and residual topography. The second inversion processes these estimates further to optimize the deformation results, refining the output for better accuracy. In this step, the SVD method was utilized to invert the time-series deformation results and the time-series surface subsidence maps were generated in the SAR coordinate system.
- (5)
- Geocoding: This final step sets a specific threshold to ensure the reliability of time-series deformation results. These results are then geocoded and converted from the SAR coordinate system to the geographic coordinate system, making them suitable for practical use and analysis.
4. Results
4.1. Characteristics of surface subsidence
4.2. Time-Series Analysis of Surface Subsidence
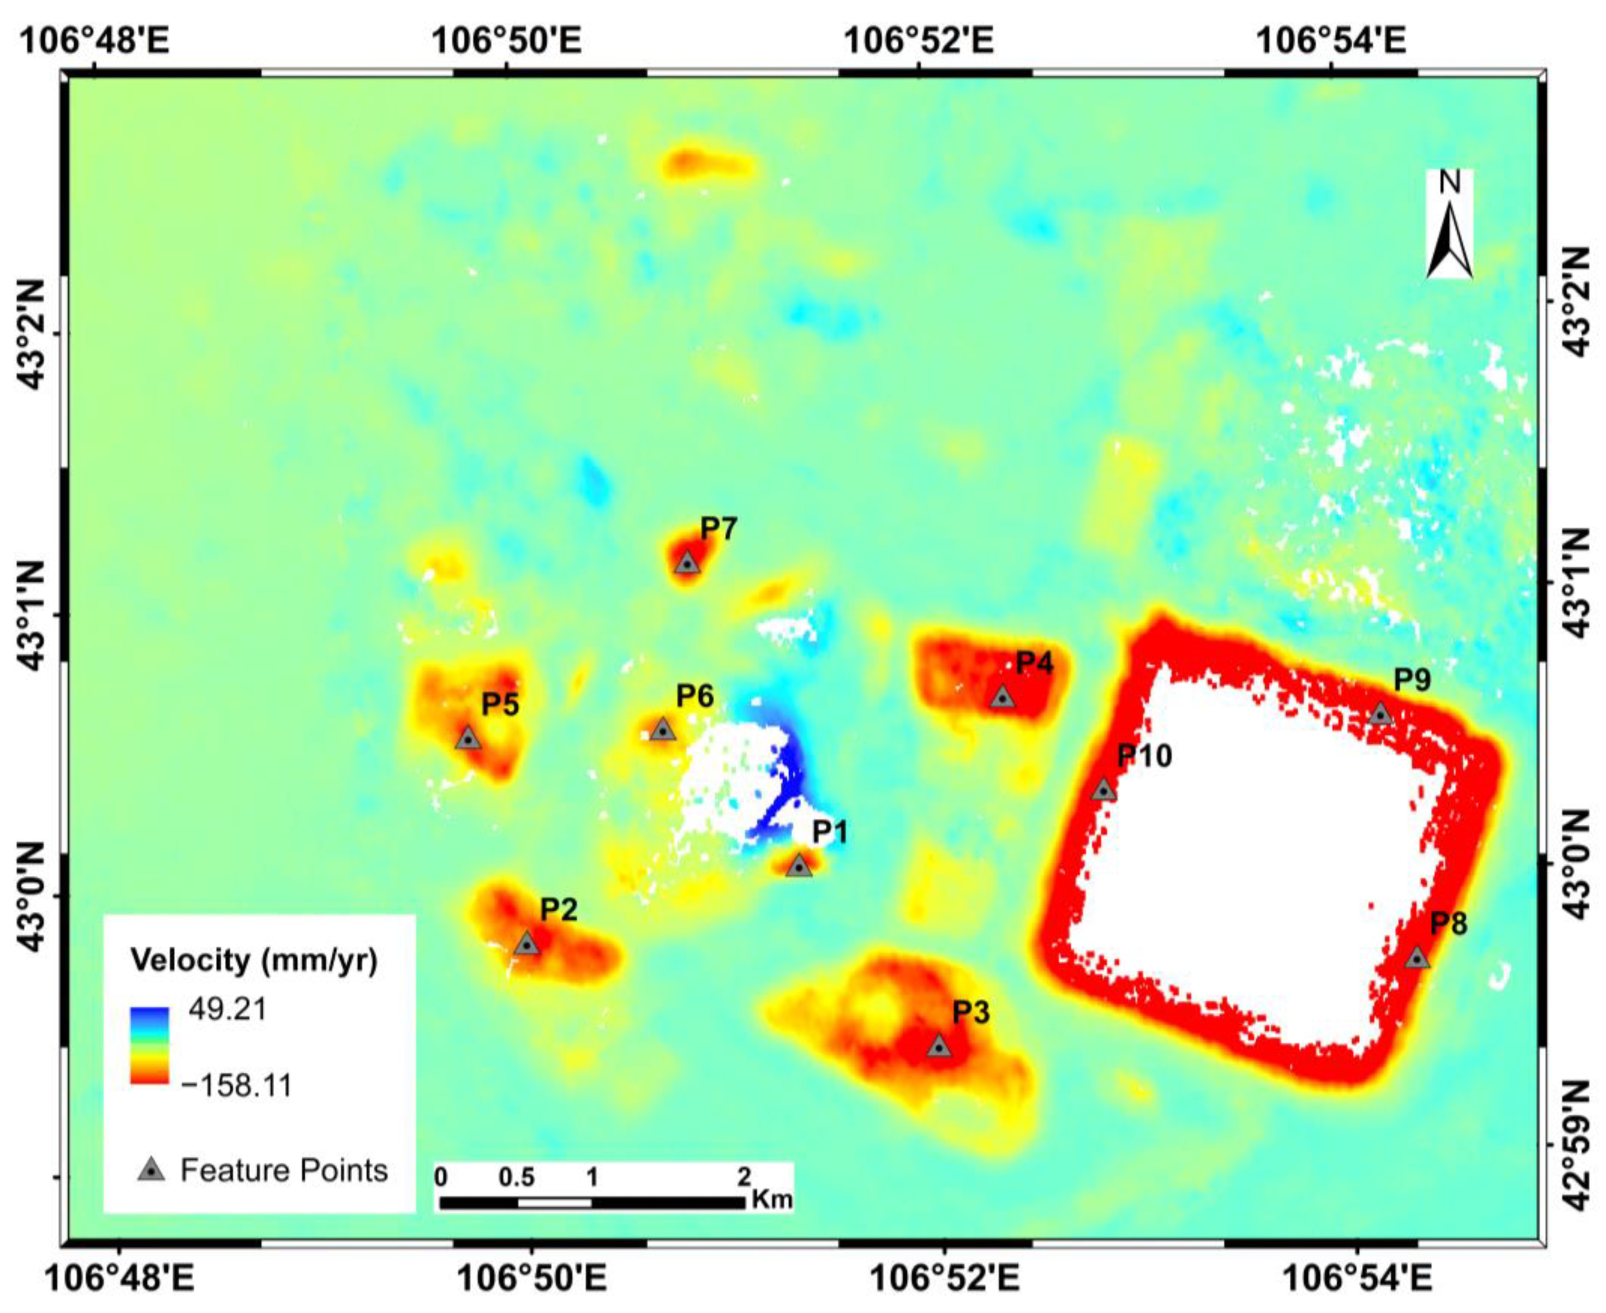
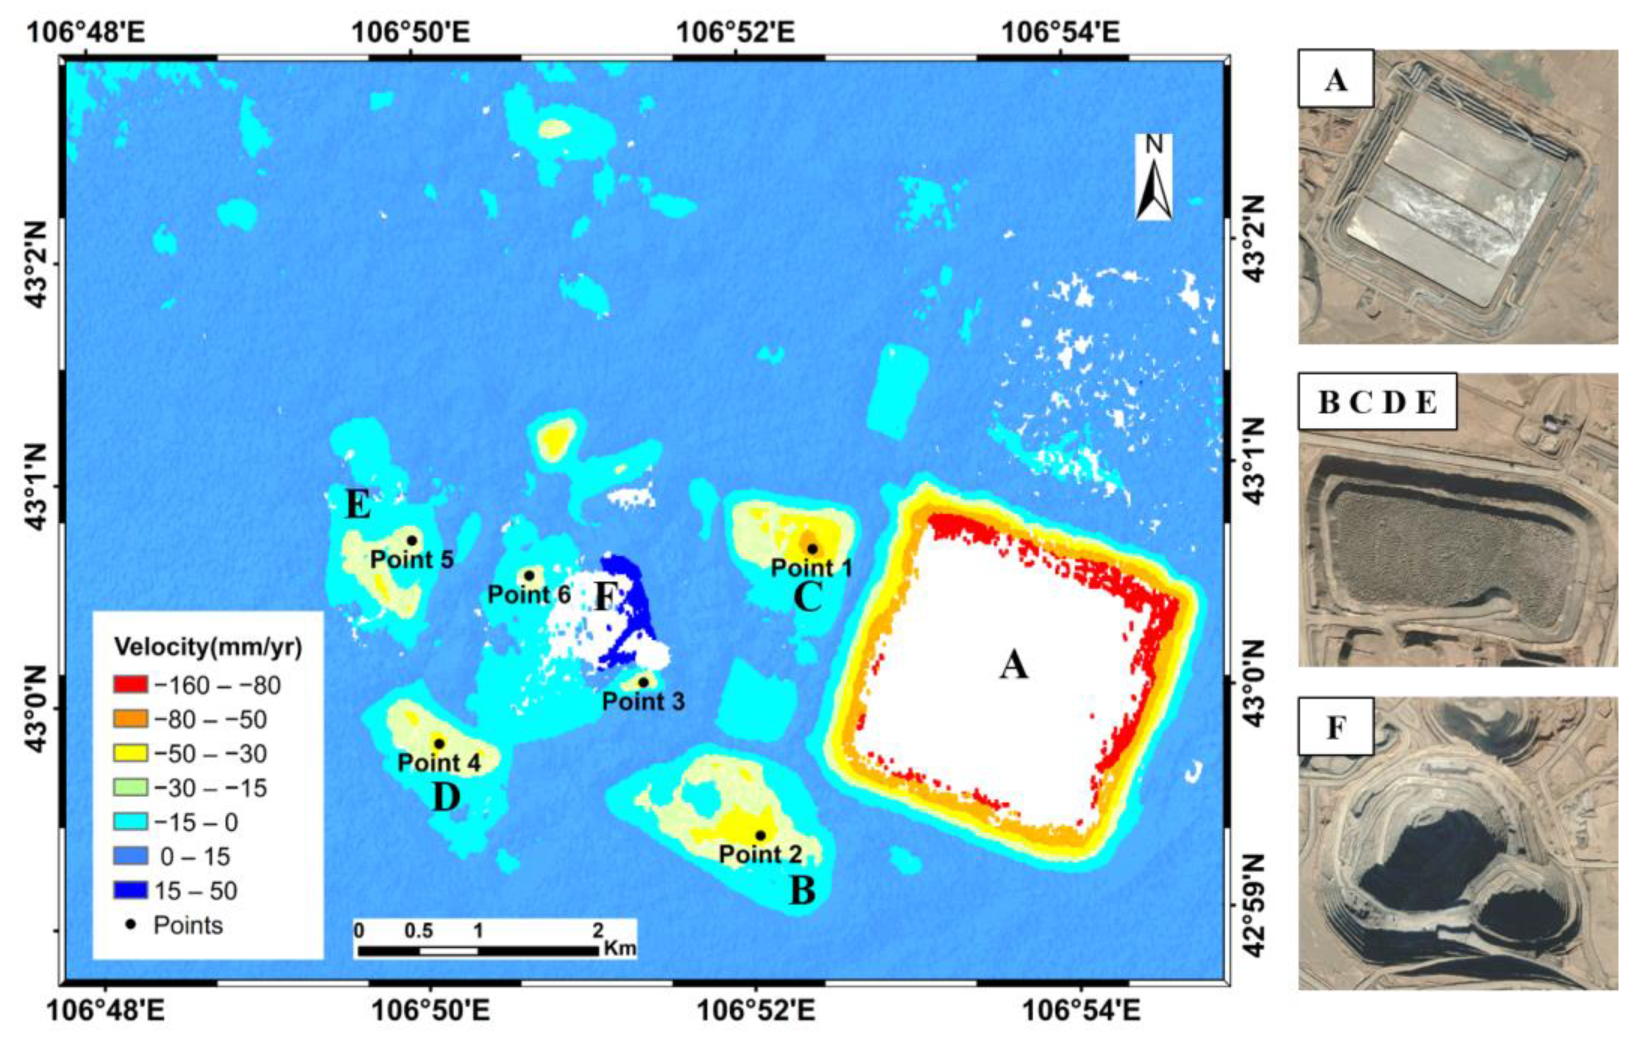
4.3. Deformation Velocity Analysis
- Class I: [−160, −80] mm/year;
- Class II: [−80, −50] mm/year;
- Class III: [−50, −30] mm/year;
- Class IV: [−30, −15] mm/year;
- Class V: [−15, 0] mm/year.
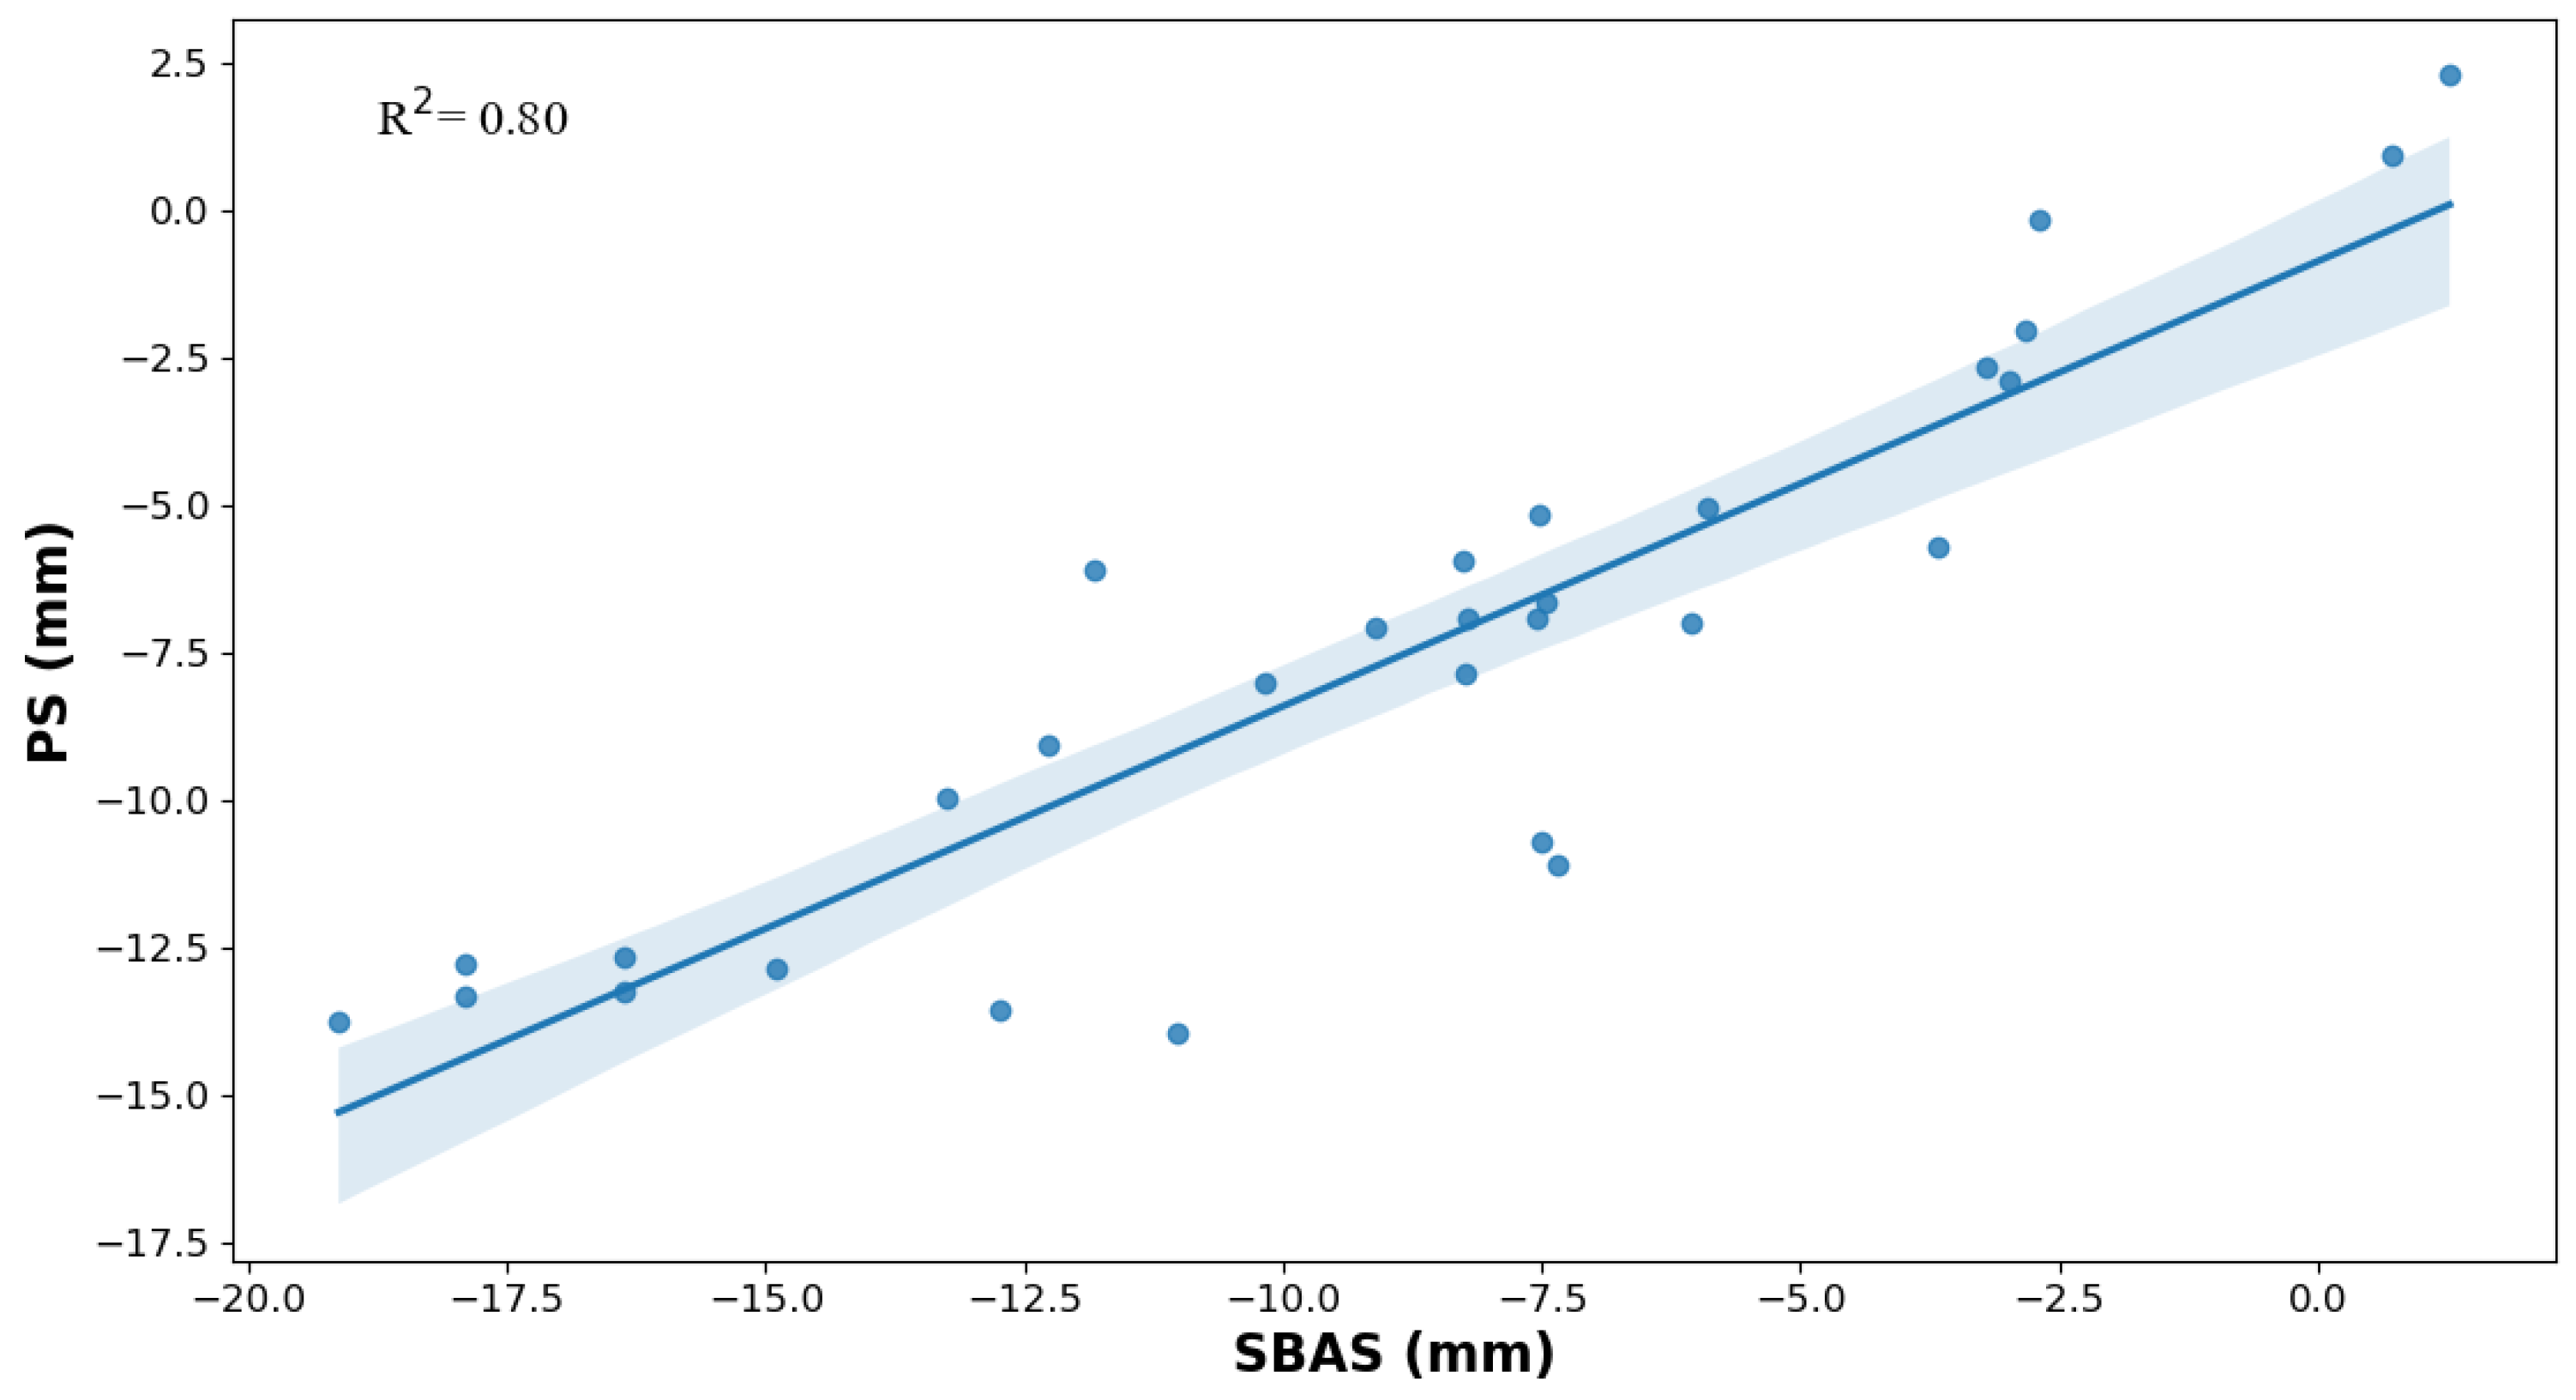
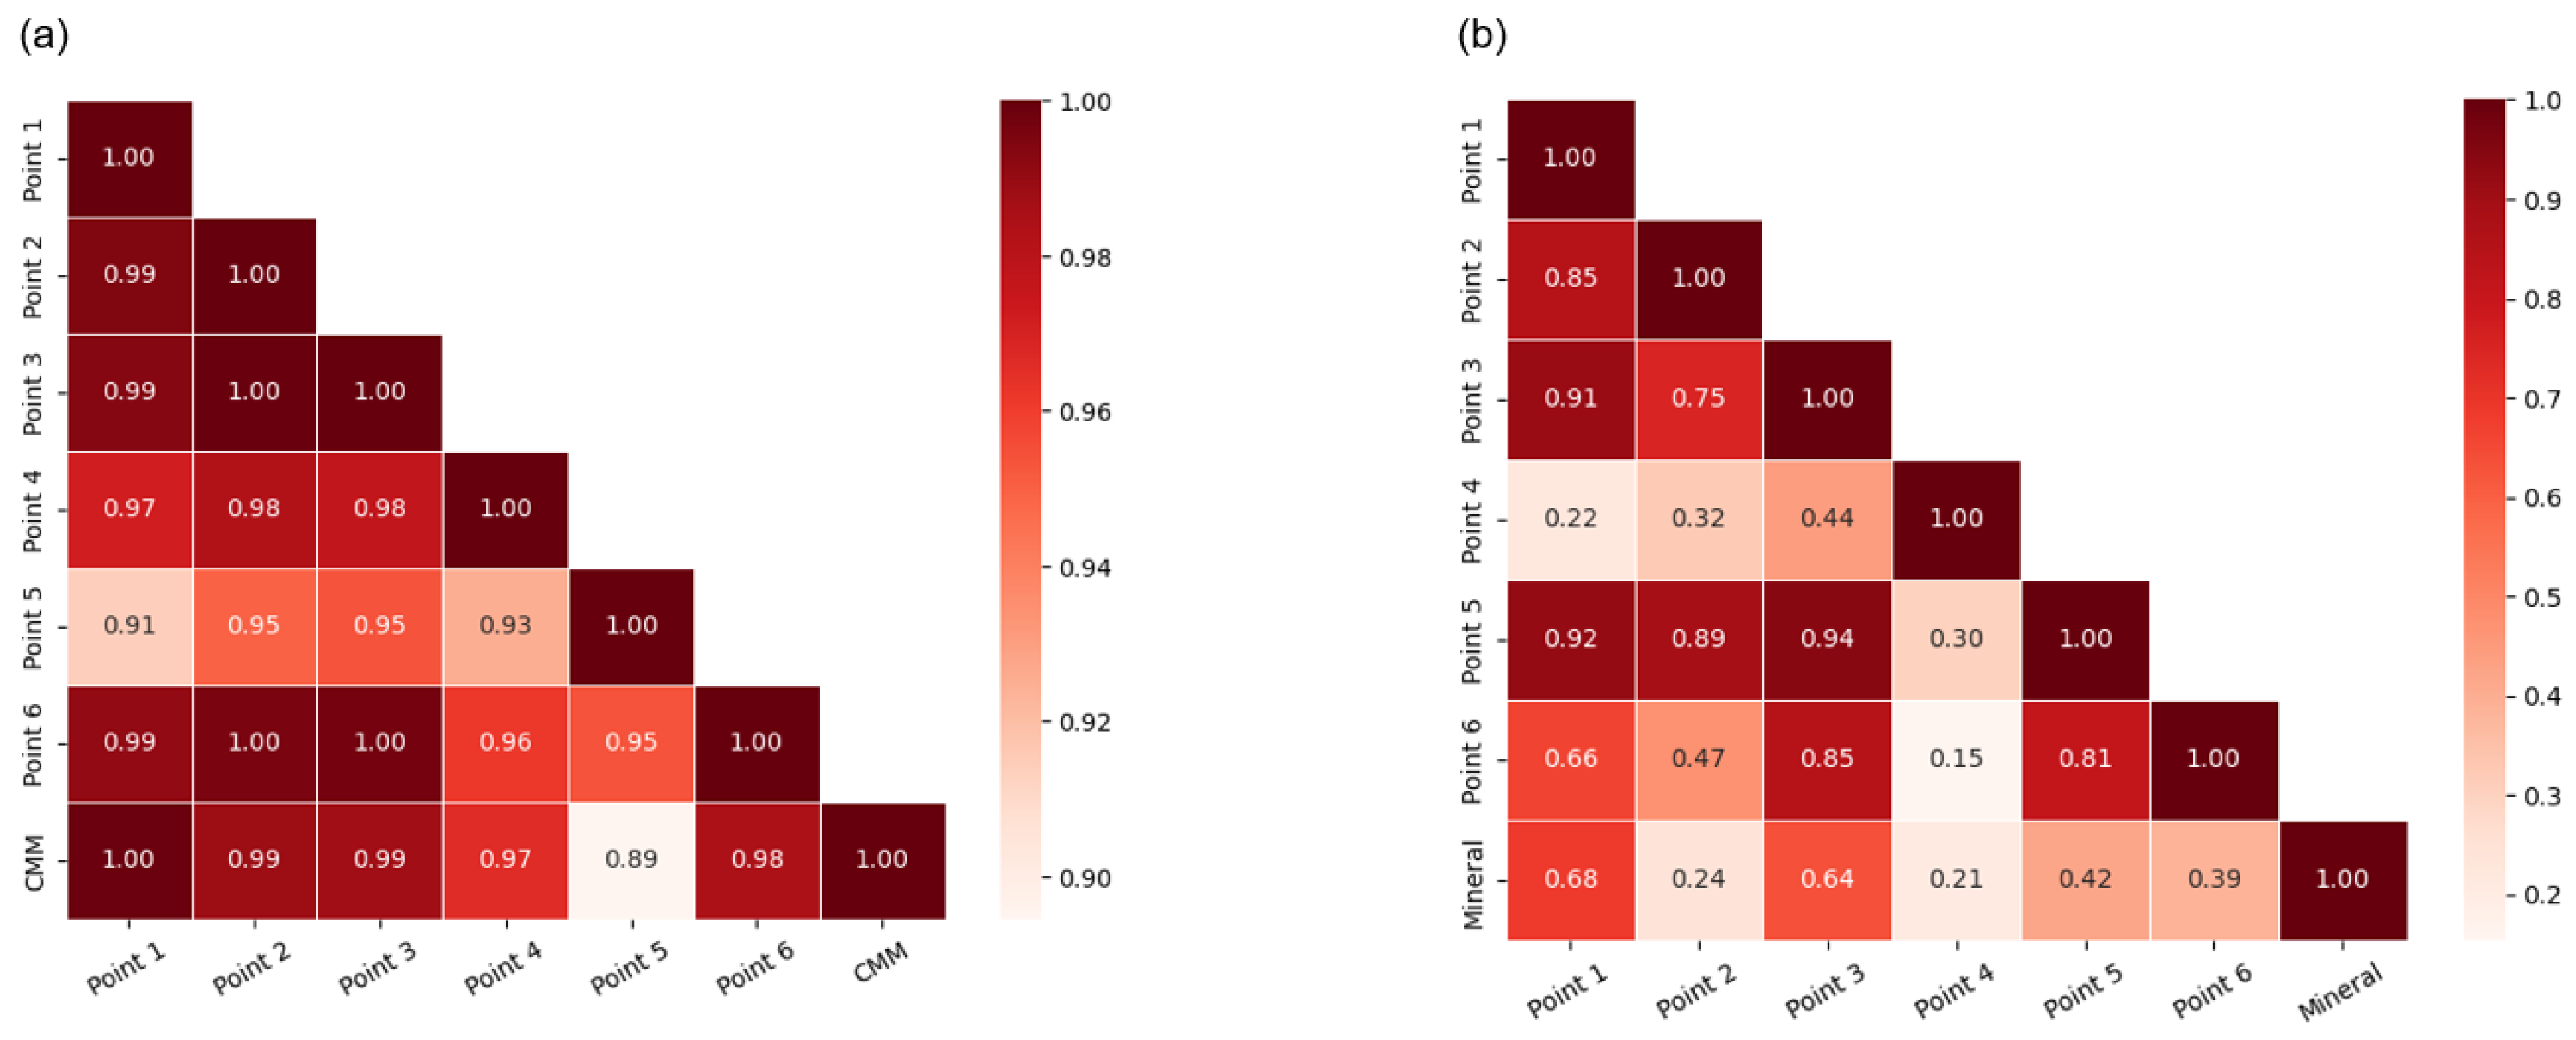
4.4. Precision Analysis of SBAS-InSAR Surface Deformation Results
5. Discussion
- (1)
- Spatial Coverage: SBAS-InSAR’s reliability depends on the coherence of satellite images over time. Rapid landscape changes due to mining or natural processes can disrupt this coherence, limiting the accuracy of subsidence measurements.
- (2)
- Temporal Resolution: the 12-day revisit cycle of the Sentinel-1A satellite may miss rapid subsidence events, potentially leading to underestimations of subsidence rates and extents.
- (3)
- Vertical Accuracy: despite corrections for atmospheric effects, inherent limitations due to atmospheric disturbances and the satellite’s viewing angle may still impact the vertical accuracy of measurements.
- (4)
- Supplementary Data: The study’s validation and analysis of subsidence is limited by the availability and accuracy of measured data, GNSS data, groundwater data, and mining volumes. Correlating subsidence with groundwater levels is also challenged by the sporadic availability and variable accuracy of groundwater data, complicating the establishment of a direct causative relationship.
- (5)
- External Factors and Generalizability: the analysis does not extensively cover other potential subsidence drivers, like geological processes or external human activities, and findings may not apply to other regions with different conditions.
6. Conclusions
Author Contributions
Funding
Data Availability Statement
Acknowledgments
Conflicts of Interest
References
- Schoderer, M.; Karthe, D.; Dombrowsky, I.; Dell’Angelo, J. Hydro-social dynamics of miningscapes: Obstacles to implementing water protection legislation in Mongolia. J. Environ. Manag. 2021, 292, 112767. [Google Scholar] [CrossRef] [PubMed]
- Zandariya, B. Improving the policy framework for financial assurance for mine closure in Mongolia. Resour. Policy 2022, 77, 102628. [Google Scholar] [CrossRef]
- Batdelger, T.; Zagdbazar, M. Does mining improve rural livelihood?: Evidence from Mongolia. Resour. Policy 2022, 78, 102794. [Google Scholar] [CrossRef]
- Fraser, J.; Kunz, N.C.; Batdorj, B. Can mineral exploration projects create and share value with communities? A case study from Mongolia. Resour. Policy 2019, 63, 101455. [Google Scholar] [CrossRef]
- Prior, T.; Giurco, D.; Mudd, G.; Mason, L.; Behrisch, J. Resource depletion, peak minerals and the implications for sustainable resource management. Glob. Environ. Chang. 2012, 22, 577–587. [Google Scholar] [CrossRef]
- Wantzen, K.M.; Mol, J.H. Soil erosion from agriculture and mining: A threat to tropical stream ecosystems. Agriculture 2013, 3, 660–683. [Google Scholar] [CrossRef]
- Zhengfu, B.; Inyang, H.I.; Daniels, J.L.; Frank, O.T.T.O.; Struthers, S. Environmental issues from coal mining and their solutions. Min. Sci. Technol. 2010, 20, 215–223. [Google Scholar]
- Zhang, L.; Zhai, Z.; Zhou, Y.; Liu, S.; Wang, L. The Landscape Pattern Evolution of Typical Open-Pit Coal Mines Based on Land Use in Inner Mongolia of China during 20 Years. Sustainability 2022, 14, 9590. [Google Scholar] [CrossRef]
- Conde, M.; Le Billon, P. Why do some communities resist mining projects while others do not? Extr. Ind. Soc. 2017, 4, 681–697. [Google Scholar] [CrossRef]
- Cui, X.; Wang, J.; Liu, Y. Prediction of progressive surface subsidence above longwall coal mining using a time function. Int. J. Rock Mech. Min. Sci. 2001, 38, 1057–1063. [Google Scholar] [CrossRef]
- Ding, R.; Liu, H.; Yuan, G.; Dong, J. Deformation and subsidence prediction on surface of Yuzhou mined-out areas along middle route project of south-to-north water diversion, China. Open Geosci. 2018, 10, 834–843. [Google Scholar] [CrossRef]
- Siriwardane, H.J.; Amanat, J. Analysis of subsidence caused by underground mining. Int. J. Min. Sci. Technol. 1984, 2, 271–290. [Google Scholar] [CrossRef]
- Simons, M.; Fialko, Y.; Rivera, L. Coseismic deformation from the 1999 M w 7.1 Hector Mine, California, earthquake as inferred from InSAR and GPS observations. Bull. Seismol. Soc. Am. 2002, 92, 1390–1402. [Google Scholar] [CrossRef]
- Nie, L.; Wang, H.; Xu, Y.; Li, Z. A new prediction model for mining subsidence deformation: The arc tangent function model. Nat. Hazards 2018, 75, 2185–2198. [Google Scholar] [CrossRef]
- Wempen, J.M.; McCarter, M.K. Comparison of L-band and X-band differential interferometric synthetic aperture radar for mine subsidence monitoring in central Utah. Int. J. Min. Sci. Technol. 2017, 27, 159–163. [Google Scholar] [CrossRef]
- Hui, X.; Ma, F.; Zhao, H.; Xu, J. Monitoring and statistical analysis of mine subsidence at three metal mines in China. Bull. Seismol. Soc. Am. 2019, 78, 3983–4001. [Google Scholar] [CrossRef]
- Casu, F.; Manzo, M.; Lanari, R. A quantitative assessment of the SBAS algorithm performance for surface deformation retrieval from DInSAR data. Remote Sens. Environ. 2006, 102, 195–210. [Google Scholar] [CrossRef]
- Kim, J.-R.; Lin, C.-W.; Lin, S.-Y. The use of InSAR phase coherence analyses for the monitoring of aeolian erosion. Remote Sens. 2021, 13, 2240. [Google Scholar] [CrossRef]
- Ghorbani, Z.; Khosravi, A.; Maghsoudi, Y.; Mojtahedi, F.F.; Javadnia, E.; Nazari, A. Use of InSAR data for measuring land subsidence induced by groundwater withdrawal and climate change in Ardabil Plain, Iran. Sci. Rep. 2022, 12, 13998. [Google Scholar] [CrossRef] [PubMed]
- Hongming, W.; Ruren, L.; Yiting, Q.; Zhuqing, L.I.; Jun, G. Application of time series InSAR technology in monitoring ground deformation of mining area: A case study at Huolinhe open pit mining area in Inner Mongolia. Chin. J. Geol. Hazard Control 2022, 33, 71–78. [Google Scholar] [CrossRef]
- Zhou, D.; Wang, L.; An, S.; Wang, X.; An, Y. Integration of unmanned aerial vehicle (UAV)-based photogrammetry and InSAR for mining subsidence and parameters inversion: A case study of the Wangjiata Mine, China. Bull. Seismol. Soc. Am. 2022, 81, 343. [Google Scholar] [CrossRef]
- Pawluszek-Filipiak, K.; Borkowski, A. Monitoring mining-induced subsidence by integrating differential radar interferometry and persistent scatterer techniques. Eur. J. Remote Sens. 2021, 54, 18–30. [Google Scholar] [CrossRef]
- Yang, W.; He, Y.; Wang, W.H.; Chen, Y.D.; Chen, Y. InSAR monitoring of 3-D surface deformation in Jinchuan Mining area, Gansu Province. Remote Sens. Nat. Resour. 2022, 34, 177–188. [Google Scholar]
- Wegmttller, U.; Strozzi, T.; Werner, C.; Wiesmann, A.; AG, G.R.S. Sar interferometry for topographic mapping and surface deformation monitoring. FJP 2002, 18, 24–32. [Google Scholar]
- Massonnet, D.; Feigl, K.L. Radar interferometry and its application to changes in the Earth’s surface. Rev. Geophys. 1998, 36, 441–500. [Google Scholar] [CrossRef]
- Rosen, P.A.; Hensley, S.; Joughin, I.R.; Li, F.K.; Madsen, S.N.; Rodriguez, E.; Goldstein, R.M. Synthetic aperture radar interferometry. Proc. IEEE 2000, 88, 333–382. [Google Scholar] [CrossRef]
- Hanssen, R.F. Radar Interferometry: Data Interpretation and Error Analysis; Kluwer Academic Publishers: Dordrecht, The Netherlands, 2001; pp. 1–307. [Google Scholar]
- Ferretti, A.; Prati, C.; Rocca, F. Permanent scatterers in SAR interferometry. IEEE Trans. Geosci. Remote Sens. 2001, 39, 8–20. [Google Scholar] [CrossRef]
- Colesanti, C.; Ferretti, A.; Novali, F.; Prati, C.; Rocca, F. SAR monitoring of progressive and seasonal ground deformation using the permanent scatterers technique. IEEE Trans. Geosci. Remote Sens. 2003, 41, 1685–1701. [Google Scholar] [CrossRef]
- Hooper, A.; Zebker, H.A. Phase unwrapping in three dimensions with application to InSAR time series. JOSA A 2007, 24, 2737–2747. [Google Scholar] [CrossRef] [PubMed]
- Rocca, F. Modeling interferogram stacks. IEEE Trans. Geosci. Remote Sens. 2007, 45, 3289–3299. [Google Scholar] [CrossRef]
- Zhang, P.; Guo, Z.; Guo, S.; Xia, J. Land subsidence monitoring method in regions of variable radar reflection characteristics by integrating PS-InSAR and SBAS-InSAR techniques. Remote Sens. 2022, 14, 3265. [Google Scholar] [CrossRef]
- Berardino, P.; Fornaro, G.; Lanari, R.; Sansosti, E. A new algorithm for surface deformation monitoring based on small baseline differential SAR interferograms. IEEE Trans. Geosci. Remote Sens. 2002, 40, 2375–2383. [Google Scholar] [CrossRef]
- Li, S.; Xu, W.; Li, Z. Review of the SBAS InSAR Time-series algorithms, applications, and challenges. Geod. Geodyn. 2022, 13, 114–126. [Google Scholar] [CrossRef]
- He, Y.; Yan, H.; Yang, W.; Yao, S.; Zhang, L.; Chen, Y.; Liu, T. Time-series analysis and prediction of surface deformation in the Jinchuan mining area, Gansu Province, by using InSAR and CNN–PhLSTM network. IEEE J. Sel. Top. Appl. Earth Obs. Remote Sens. 2022, 15, 6732–6751. [Google Scholar] [CrossRef]
- Li, Z.; Wang, Z.; Liu, W.; Li, X.; Zhou, M.; Zhang, B. Detecting, Monitoring, and Analyzing the Surface Subsidence in the Yellow River Delta (China) Combined with CenterNet Network and SBAS-InSAR. J. Spectrosc. 2022, 2022, 2672876. [Google Scholar] [CrossRef]
- Poland, J.; Davis, G. Subsidence of the land surface in the Tulare-Wasco (Delano) and Los Banos-Kettleman City area, San Joaquin Valley, California. EOS Trans. Am. Geophys. Union 1956, 37, 287–296. [Google Scholar] [CrossRef]
- Motagh, M.; Shamshiri, R.; Haghighi, M.H.; Wetzel, H.U.; Akbari, B.; Nahavandchi, H.; Roessner, S.; Arabi, S. Quantifying groundwater exploitation induced subsidence in the Rafsanjan plain, southeastern Iran, using InSAR time-series and in situ measurements. Eng. Geol. 2017, 218, 134–151. [Google Scholar] [CrossRef]
- Okadera, T.; Wang, Q.X.; Deni, E.; Nakayama, T. Groundwater monitoring for evaluating the pasture carrying capacity and its vulnerability in arid and semi-arid regions: A case study of urban and mining areas in Mongolia. IOP Conf. Ser. Earth Environ. Sci. 2019, 266, 012013. [Google Scholar] [CrossRef]
- Shi, C.; Zhang, D.; You, L.; Li, B.; Zhang, Z.; Zhang, O. Land subsidence as a result of sediment consolidation in the Yellow River Delta. J. Coast. Res. 2007, 23, 173–181. [Google Scholar] [CrossRef]
- Steckler, M.S.; Oryan, B.; Wilson, C.A.; Grall, C.; Nooner, S.L.; Mondal, D.R.; Akhter, S.H.; DeWolf, S.; Goodbred, S.L. Synthesis of the distribution of subsidence of the lower Ganges-Brahmaputra Delta, Bangladesh. Earth-Sci. Rev. 2022, 224, 103887. [Google Scholar] [CrossRef]
- Oyu Tolgoi LLC. Year in Review 2020. 2021. Available online: https://www.ot.mn/media/otnew/content/reports/2020_YiR/20210428_Annual_report_2020-English.pdf (accessed on 7 March 2024).
- Oyu Tolgoi LLC. Year in Review 2022. 2023. Available online: https://www.ot.mn/media/otnew/content/Year_in_review_2022.pdf (accessed on 7 March 2024).
- Parsons, T.; Wu, P.C.; Wei, M.; D’Hondt, S. The weight of New York City: Possible contributions to subsidence from anthropogenic sources. Earth’s Future 2023, 11, e2022EF003465. [Google Scholar] [CrossRef]
- Kratzsch, H. Mining Subsidence Engineering; Springer: Berlin/Heidelberg, Germany, 1983; ISBN 978-3-642-81925-4. [Google Scholar]
- Oyu Tolgoi LLC. Audit Report on Water Use for the Bear Head Project 2016–2020. 2022. Available online: https://www.ot.mn/media/otnew/content/Water_Audit_report_2021_Final_MNG.pdf (accessed on 7 March 2024).
- Nakayama, T.; Wang, Q.; Okadera, T. Evaluation of spatio-temporal variations in water availability using a process-based eco-hydrology model in arid and semi-arid regions of Mongolia. Ecol. Model. 2021, 440, 109404. [Google Scholar] [CrossRef]
- Donnelly, L.J. A review of international cases of fault reactivation during mining subsidence and fluid abstraction. Q. J. Eng. Geol. Hydrogeol. 2009, 42, 73–94. [Google Scholar] [CrossRef]
- Ferretti, A.; Monti-Guarnieri, A.; Prati, C.; Rocca, F.; Massonet, D. InSAR Principles: Guideline for SAR Interferometry Processing and Interpretation; ESA Publication: Noordwijk, The Netherlands, 2007. [Google Scholar]
- Sahu, P.; Lokhande, R.D. An Investigation of Sinkhole Subsidence and its Preventive Measures in Underground Coal Mining. Procedia Earth Planet. Sci. 2015, 11, 63–75. [Google Scholar] [CrossRef]
- Kondolf, G.M.; Schmitt, R.J.P.; Carling, P.; Darby, S.; Arias, M.; Bizzi, S.; Castelletti, A.; Cochrane, T.A.; Gibson, S.; Kummu, M.; et al. Changing sediment budget of the Mekong: Cumulative threats and management strategies for a large river basin. Sci. Total Environ. 2018, 625, 114–134. [Google Scholar] [CrossRef] [PubMed]
- Tang, W.; Zhao, X.; Motagh, M.; Bi, G.; Li, J.; Chen, M.; Chen, H.; Liao, M. Land Subsidence and Rebound in the Taiyuan Basin, Northern China, in the Context of Inter-Basin Water Transfer and Groundwater Management. Remote Sens. Environ. 2022, 269, 112792. [Google Scholar] [CrossRef]


| Sentinel-1A Data Parameters | |||||
|---|---|---|---|---|---|
| No. | Acq. Date | No. | Acq. Date | No. | Acq. Date |
| 1 | 11 January 2018 | 41 | 30 May 2019 | 81 | 7 January 2021 |
| 2 | 23 January 2018 | 42 | 11 June 2019 | 82 | 19 January 2021 |
| 3 | 4 February 2018 | 43 | 23 June 2019 | 83 | 31 January 2021 |
| 4 | 28 February 2018 | 44 | 5 July 2019 | 84 | 12 February 2021 |
| 5 | 12 March 2018 | 45 | 17 July 2019 | 85 | 24 February 2021 |
| 6 | 24 March 2018 | 46 | 29 July 2019 | 86 | 8 March 2021 |
| 7 | 5 April 2018 | 47 | 10 August 2019 | 87 | 20 March 2021 |
| 8 | 17 April 2018 | 48 | 22 August 2019 | 88 | 1 April 2021 |
| 9 | 29 April 2018 | 49 | 3 September 2019 | 89 | 13 April 2021 |
| 10 | 11 May 2018 | 50 | 15 September 2019 | 90 | 25 April 2021 |
| 11 | 23 May 2018 | 51 | 27 September 2019 | 91 | 7 May 2021 |
| 12 | 4 June 2018 | 52 | 21 October 2019 | 92 | 19 May 2021 |
| 13 | 16 June 2018 | 53 | 2 November 2019 | 93 | 6 July 2021 |
| 14 | 28 June 2018 | 54 | 14 November 2019 | 94 | 11 August 2021 |
| 15 | 10 July 2018 | 55 | 26 November 2019 | 95 | 23 August 2021 |
| 16 | 22 July 2018 | 56 | 8 December 2019 | 96 | 4 September 2021 |
| 17 | 3 August 2018 | 57 | 20 December 2019 | 97 | 16 September 2021 |
| 18 | 15 August 2018 | 58 | 13 January 2020 | 98 | 28 September 2021 |
| 19 | 27 August 2018 | 59 | 6 February 2020 | 99 | 10 October 2021 |
| 20 | 8 September 2018 | 60 | 18 February 2020 | 100 | 22 October 2021 |
| 21 | 20 September 2018 | 61 | 1 March 2020 | 101 | 3 November 2021 |
| 22 | 2 October 2018 | 62 | 13 March 2020 | 102 | 15 November 2021 |
| 23 | 14 October 2018 | 63 | 25 March 2020 | 103 | 27 November 2021 |
| 24 | 26 October 2018 | 64 | 6 April 2020 | 104 | 9 December 2021 |
| 25 | 7 November 2018 | 65 | 18 April 2020 | 105 | 14 January 2022 |
| 26 | 19 November 2018 | 66 | 30 April 2020 | 106 | 26 January 2022 |
| 27 | 1 December 2018 | 67 | 12 May 2020 | 107 | 7 February 2022 |
| 28 | 13 December 2018 | 68 | 24 May 2020 | 108 | 19 February 2022 |
| 29 | 25 December 2018 | 69 | 5 June 2020 | 109 | 3 March 2022 |
| 30 | 18 January 2019 | 70 | 17 June 2020 | 110 | 15 March 2022 |
| 31 | 30 January 2019 | 71 | 29 June 2020 | 111 | 27 March 2022 |
| 32 | 11 February 2019 | 72 | 11 July 2020 | 112 | 8 April 2022 |
| 33 | 23 February 2019 | 73 | 23 July 2020 | 113 | 20 April 2022 |
| 34 | 7 March 2019 | 74 | 4 August 2020 | 114 | 2 May 2022 |
| 35 | 19 March 2019 | 75 | 16 August 2020 | 115 | 26 May 2022 |
| 36 | 31 March 2019 | 76 | 21 September 2020 | 116 | 25 July 2022 |
| 37 | 12 April 2019 | 77 | 3 October 2020 | 117 | 6 August 2022 |
| 38 | 24 April 2019 | 78 | 15 October 2020 | 118 | 22 November 2022 |
| 39 | 6 May 2019 | 79 | 20 November 2020 | 119 | 4 December 2022 |
| 40 | 18 May 2019 | 80 | 2 December 2020 | 120 | 28 December 2022 |
| Year | 2018 | 2019 | 2020 | 2021 | 2022 |
|---|---|---|---|---|---|
| Mineral Mined (Million tons) | 91 | 101 | 98 | 85 | 97 |
| Cumulative Mineral Mined (Million tons) | 91 | 192 | 290 | 375 | 473 |
| Year | 2018 | 2019 | 2020 | 2021 | 2022 |
|---|---|---|---|---|---|
| Point 1 | 61.02 | 132.61 | 192.87 | 245.06 | 299.24 |
| Point 2 | 49.76 | 105.44 | 147.36 | 181.81 | 203.41 |
| Point 3 | 24.13 | 71.65 | 103.79 | 127.75 | 147.97 |
| Point 4 | 14.58 | 46.70 | 112.67 | 143.71 | 149.14 |
| Point 5 | 23.47 | 85.88 | 107.60 | 122.97 | 119.72 |
| Point 6 | 11.27 | 53.12 | 69.79 | 93.26 | 109.05 |
| unit: mm | |||||
Disclaimer/Publisher’s Note: The statements, opinions and data contained in all publications are solely those of the individual author(s) and contributor(s) and not of MDPI and/or the editor(s). MDPI and/or the editor(s) disclaim responsibility for any injury to people or property resulting from any ideas, methods, instructions or products referred to in the content. |
© 2024 by the authors. Licensee MDPI, Basel, Switzerland. This article is an open access article distributed under the terms and conditions of the Creative Commons Attribution (CC BY) license (https://creativecommons.org/licenses/by/4.0/).
Share and Cite
Xie, Y.; Bagan, H.; Tan, L.; Te, T.; Damdinsuren, A.; Wang, Q. Time-Series Analysis of Mining-Induced Subsidence in the Arid Region of Mongolia Based on SBAS-InSAR. Remote Sens. 2024, 16, 2166. https://doi.org/10.3390/rs16122166
Xie Y, Bagan H, Tan L, Te T, Damdinsuren A, Wang Q. Time-Series Analysis of Mining-Induced Subsidence in the Arid Region of Mongolia Based on SBAS-InSAR. Remote Sensing. 2024; 16(12):2166. https://doi.org/10.3390/rs16122166
Chicago/Turabian StyleXie, Yuxin, Hasi Bagan, Luwen Tan, Terigelehu Te, Amarsaikhan Damdinsuren, and Qinxue Wang. 2024. "Time-Series Analysis of Mining-Induced Subsidence in the Arid Region of Mongolia Based on SBAS-InSAR" Remote Sensing 16, no. 12: 2166. https://doi.org/10.3390/rs16122166
APA StyleXie, Y., Bagan, H., Tan, L., Te, T., Damdinsuren, A., & Wang, Q. (2024). Time-Series Analysis of Mining-Induced Subsidence in the Arid Region of Mongolia Based on SBAS-InSAR. Remote Sensing, 16(12), 2166. https://doi.org/10.3390/rs16122166