1. Introduction
Digital Elevation Models (DEMs) greatly impact the confidence in modelling many large-scale environmental processes. In this respect, airborne lidar has had a large impact, and for larger areas, space technology has also been playing an important role. Yang et al. [
1] give a detailed overview of the advances that DEMs from space can offer for applications in various fields, such as the detection of geological structures [
2], the analysis of tectonic evolution [
3], the understanding of volcanic processes [
4], and the assessment of flood vulnerability [
5,
6]. However, as pointed out by Schumann and Bates [
6], current global DEMs are often less suitable as inputs for those tasks than DTMs acquired with airborne lidar. Compared to airborne lidar DTMs [
7], (1) they have larger vertical errors, (2) their resolution is lower, and (3) they often represent the Digital Surface Model (DSM) (vegetation and human-made structures are present) of an area instead of the terrain. These inherent issues stem from the primary measurement methods used in constructing global DEMs—either interferometry using C-band and X-band radar (SRTM, Tandem-X) or stereoscopy using passive optical imagery (ASTER, ALOS)—to measure elevation [
8]; in contrast, lidar can penetrate the canopy.
In this study, we aim to investigate the application of spaceborne lidar altimetry data as an alternative to interferometry/stereoscopy to model global DEMs. Specifically, we investigate data from two missions: (1) ICESat-2, which is in a polar orbit to investigate ice sheets [
9,
10] as its primary objective, but it also measures canopy height [
10] among other parameters, and (2) the Global Ecosystem Dynamics Investigation (GEDI), which is attached to the International Space Station (ISS) and whose primary goal is to investigate global ecosystems [
11,
12]. While these two missions have primary objectives other than terrain modelling, it is possible to also use and combine them for modelling terrains.
For instance, for ICESat-2, Neuenschwander et al. [
13] reported a vertical accuracy of 0.53 m Mean Absolute Error (MAE) and 0.73 m Root Mean Square Error (RMSE) when carefully validating 193 ICESat-2 satellite overpasses in Finland, Malambo and Popescu [
14] reported an MAE of 1.20 m for different biomes in the USA, and Wang et al. [
15] reported an RMSE of 1.96 m for terrain heights from the unclassified ICESat-2 ATL03 product by applying the noise filter proposed by [
16]. As for GEDI, it has been used less for terrain applications. A validation study with reference areas in Germany by Adam et al. [
17] using the GEDI L2A product (version 1) showed a Median Absolute Deviation (MAD) of 3.42 m for the vertical accuracy, but it should be noted that 2 out of 19 orbits included showed a significant increase in error metrics that they could not account for. Quiros et al. [
18] found a 6.05 m RMSE for terrain heights of the GEDI (L2A, version 1) product in southwest Spain. They also found that by—accounting for the geolocation error—moving the footprints 10 m to the west, the results were improved. Zhao et al. [
19] reported a horizontal geolocation error of 1.7 m for ICESat-2. Liu et al. [
20] were the first to combine both GEDI (L2A, version 2) and ICESat-2 (ATL08, version 4) in a validation study of 7000 km
2, finding RMSEs of 4.03 m and 2.24 m, respectively. More recently, Urbazaev et al. [
21] also combined GEDI (L2A, version 2) and ICESat-2 (ATL08, version 5) in a large validation study, finding a bias of less than a metre for both datasets. Lastly, Zhu et al. [
22] determined terrain height accuracy underneath short-stature vegetation for several study sites in the USA, finding a bias of −0.05 m for ICESat-2 and a bias of 0.39 m for GEDI. Because of their good vertical accuracy, GEDI and ICESat-2 can be used to correct global DEMs; see, for instance, [
23,
24,
25,
26].
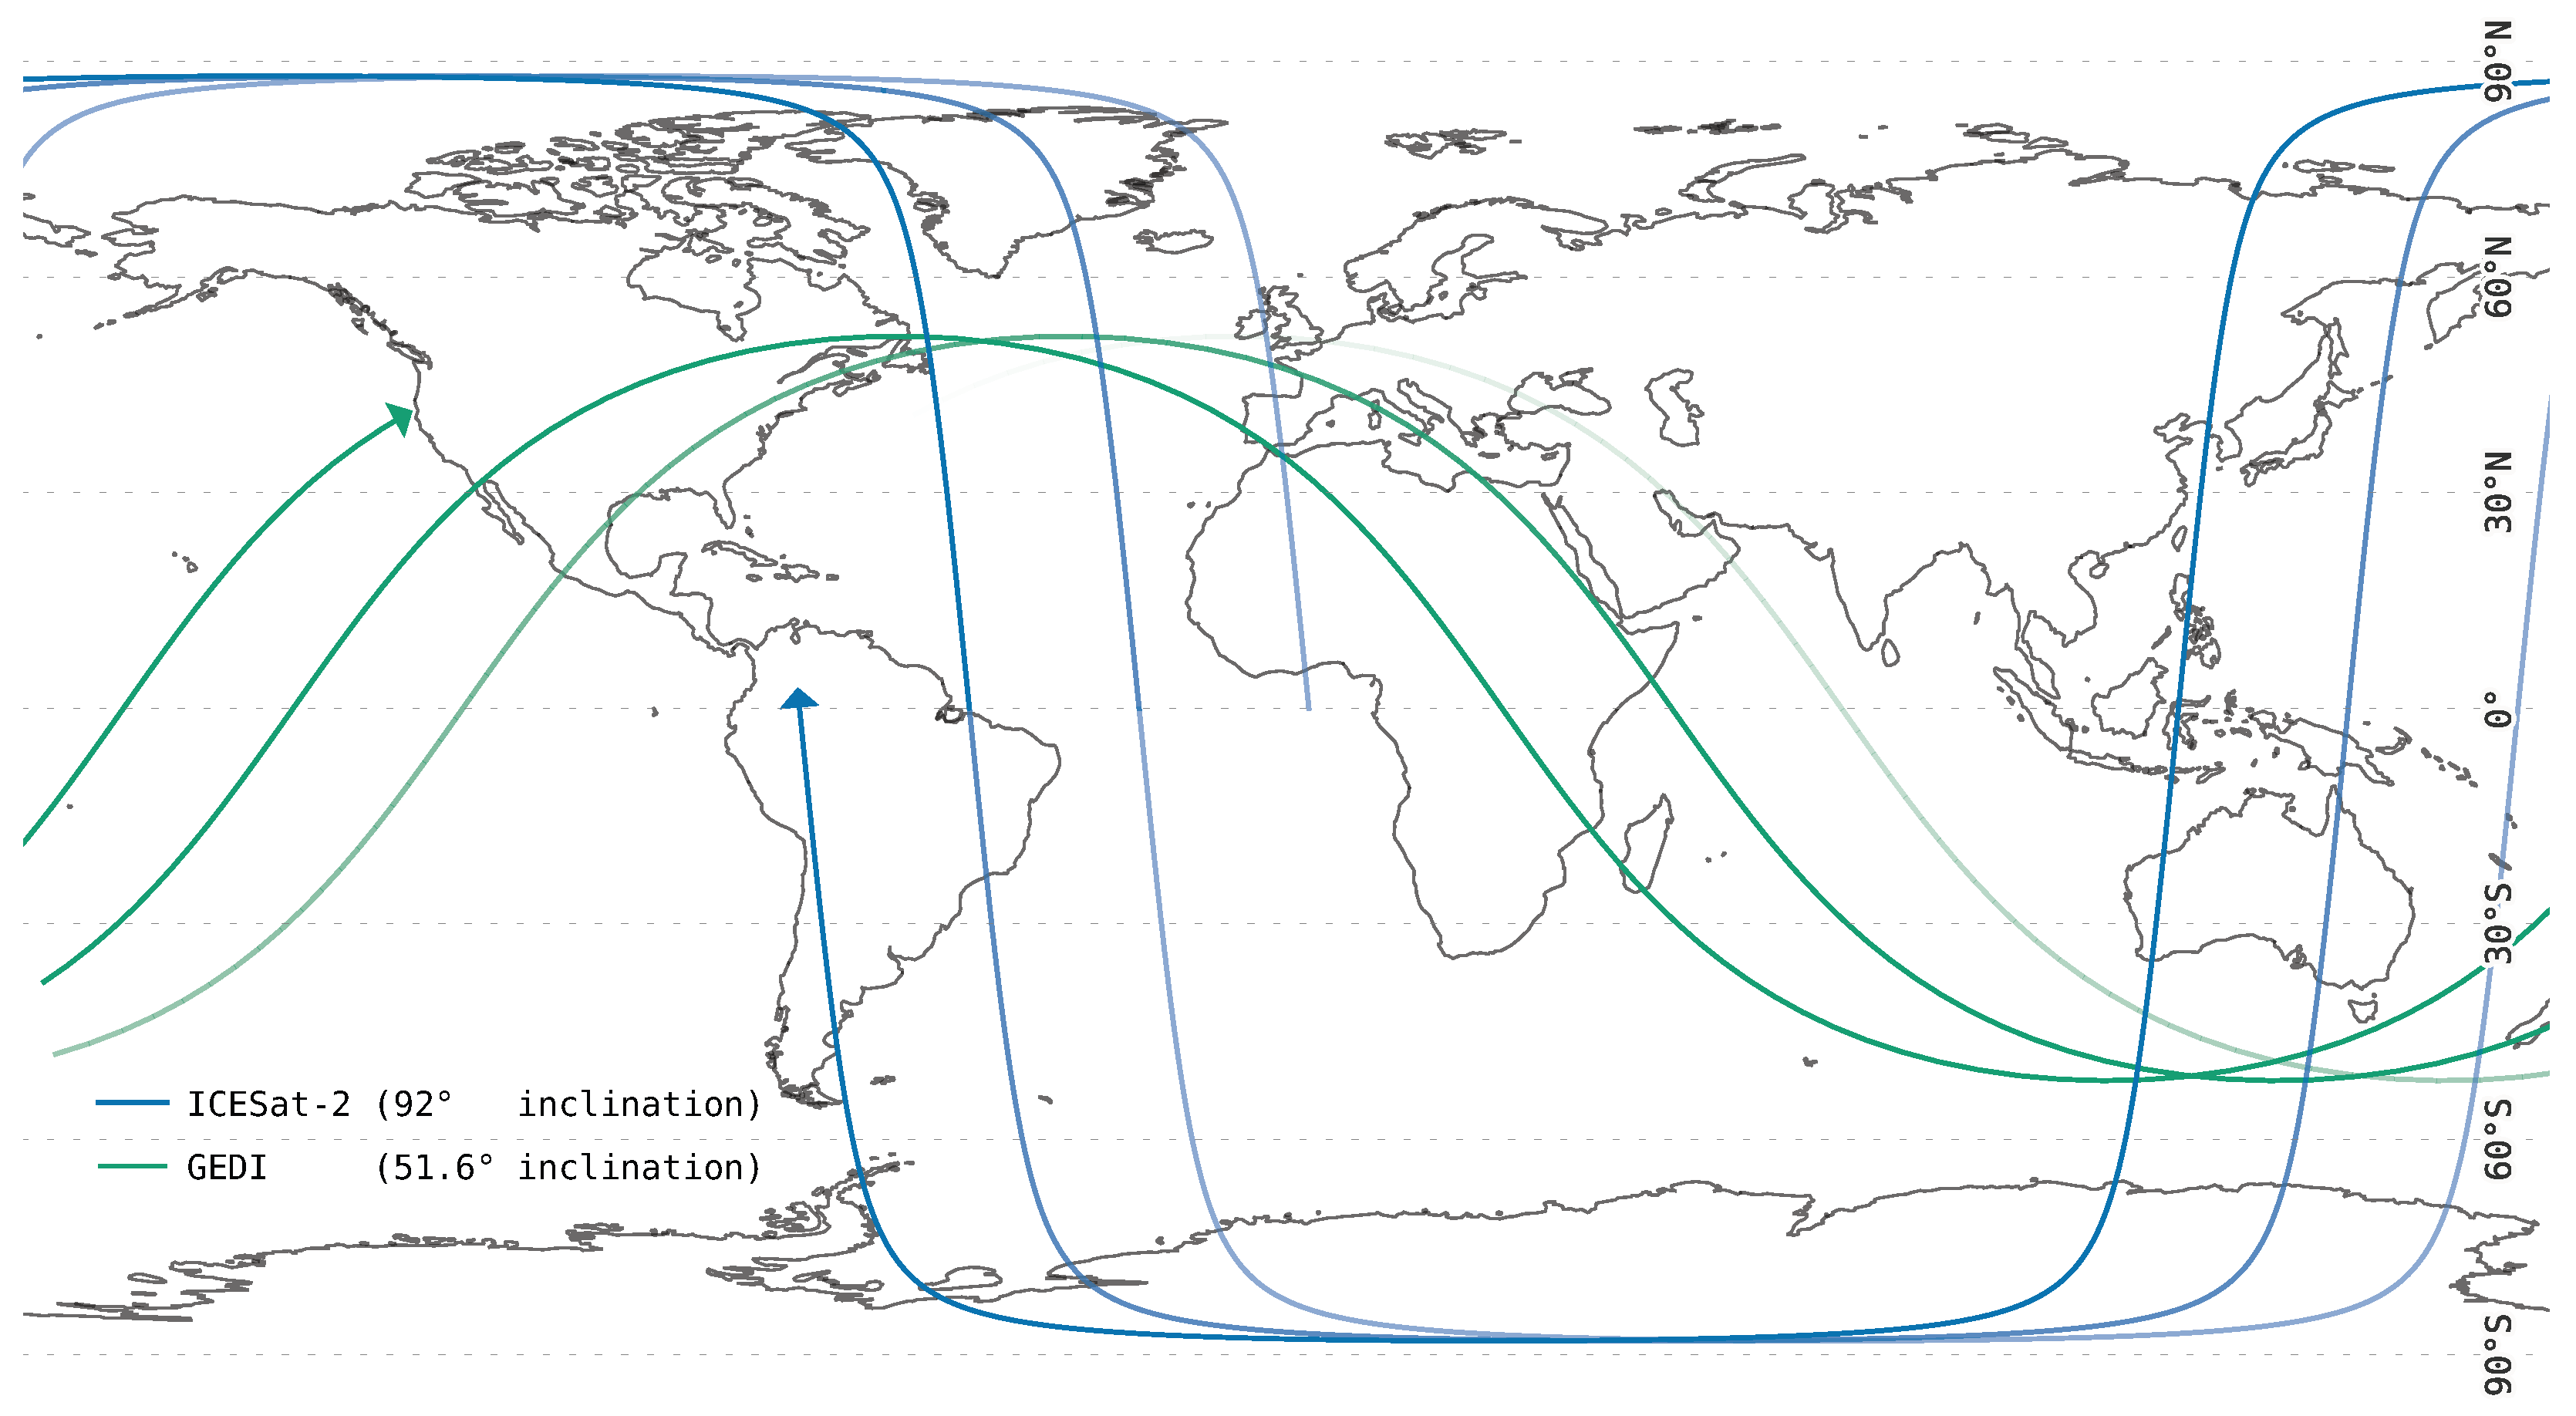
To reconstruct a terrain from altimetry observations, more than a good vertical accuracy is required: an adequate density of observations on the surface of the Earth is also necessary to obtain good results from spatial interpolation, and this aspect has received less attention. As can be seen in
Figure 1, both satellites reach their highest density of ground tracks at their inclination angle and are least dense on the equator. ICESat-2—planned to have a 2 km maximum track separation [
9]—has been used to generate coarse resolution terrain models, one for Antarctica [
27] covering 72% of the 1 km grid and a global lowland terrain model at ∼1 km [
28]. GEDI has not yet been used for the generation of global DEMs, neither on its own nor in combination with ICESat-2. Both the ICESat-2 and GEDI teams plan to produce 1 km, or coarser, raster products. For example, the GEDI team has already published the 1 km resolution L3 Gridded Land Surface Metrics product [
29], but not all cells are filled. Notably, these resolutions are an order of magnitude lower than the along-track resolution of ICESat-2 or GEDI. The
possible resolution of a global DEM based on ICESat-2 and/or GEDI data has not yet been studied.
In this study, we assess whether and to what extent the measurements from ICESat-2 and GEDI—based on their vertical accuracy and spatial coverage—can be used as a basis to reconstruct global DEMs. We validate the altimetric measurements of both missions by comparing them against the airborne lidar measurements of three locations representing different terrain types (the Netherlands, Switzerland, and New Zealand). To our knowledge, by using all ICESat-2 and GEDI data in their latest versions—and reference data from several countries—we present the most representative and extensive validation study (using over 225 million samples) for these datasets thus far. Unlike previous studies, we use the lowest possible level of the products (we do not use aggregates or gridded samples). Furthermore, also unlike previous studies, we assess the density of samples in the planimetric direction for large areas ranging from the equator to the poles, which allows us to identify which resolutions of a (global) DEM could be achieved. In our validation, we consider and study other factors that can influence the quality of the altimetric measurements—and thus serve as possible filters: strong/weak beams, day/nighttime, terrain slope, seasonal effects, outlier tracks, and the presence of water. Our final results should then allow practitioners used to airborne lidar to make informed decisions, such as choosing to filter certain ground tracks that contain mostly outliers.
2. Datasets and Methods
2.1. ICESat-2 and GEDI
The ICESat-2 satellite, with an orbit inclination of 92°, covers the Earth between −88° and 88° latitude. The laser of its instrument (ATLAS) splits into six beams, divided into three pairs, with the beams in each pair 90 m apart and the pairs 3.3 km apart, for a total swath width of 6.6 km. Each pair contains a strong beam (pulse energy of 120
J) and a weak beam (pulse energy of 30
J), with a power ratio of 4:1 [
9,
30]. Along-track, it can measure every 0.7 m, and with a beam footprint of ∼11 m, consecutive footprints overlap one another.
The orbit of GEDI, itself attached to the Japanese Experiment Module at the International Space Station (ISS), is between 51.6° N and 51.6° S. Its three lasers split into eight beams, each 600 m apart, for a total swath width of 4.2 km. Of the eight beams, four are strong (pulse energy of 15,000
J), while the other four are weak beams (pulse energy of 4500
J), with a power ratio of 3.3:1 [
12,
31]. GEDI measures a point every 70 m along-track, with a beam footprint of 23 m. The ground track patterns for both missions are given in
Figure 2.
Both missions have multiple laser beams and a division in beam energy, resulting in weak and strong beams. Weak beams (or coverage beams) are a way to improve coverage while still maintaining the mission requirement(s) for a specific power level with the strong beams. Coverage is further increased for both missions by the ability to angle the instruments away from their reference ground tracks [
10,
12], preventing repetitions of the same ground track. The characteristics of both missions are summarised in
Table 1.
Note that airborne lidar datasets differ considerably from spaceborne lidar, most notably so in their platform, resulting in differences in beam footprint and ground coverage (see
Table 1). The altitude increase results in a wider beam footprint, from ∼0.5 m (at 500 m [
32]) for airborne platforms to ∼20 m for space platforms. Although much wider, it is a small increase compared to the increase in sensing altitude, going from 0.5 km to 480 km. Airborne lidar often focuses on maximising the coverage (
of smaller areas, whereas the coverage for space lasers is the ground track of the satellite. While both ICESat-2 and GEDI employ instruments with multiple (split) laser beams, including the ability to point the laser away from the ground track—all to maximise coverage—this still results in very sparse and uneven coverage, as shown in
Figure 2.
The data from the ICESat-2 and GEDI missions are made publicly available in several data products, categorised into subsequent Levels 1, 2, and 3 data products. Level 1 products contain the raw telemetry, whereas Level 2 products contain directly usable geolocated data, to which several corrections—such as accounting for atmospheric effects—are applied. Data for Level 3 are aggregated versions of Level 2 products, which are smaller in file size and easier to process. ICESat-2 differentiates between Level 3A, which aggregates consecutive samples along the ground track of Level 2 data products, and Level 3B, which are gridded versions of the aggregated Level 3A data products. GEDI’s Level 3 data products are gridded versions of Level 2 data products, like ICESat-2’s Level 3B.
Both missions make their data available online in
granules, which are subsections of a single orbit. GEDI divides one orbit into 4 granules (but only since version 2), while ICESat-2 has 15 granules per orbit. The Land Processes (LP) Distributed Active Archive Center (DAAC) (
https://lpdaac.usgs.gov/) distributes the GEDI L2A data, while the National Snow and Ice Data Center (NSIDC) DAAC (
https://nsidc.org/) distributes ICESat-2 data.
We used the ICESat-2 Level 2 ATL03 product [
33], currently at version 6, with dates ranging from 13-10-2018 to 26-10-2023. This dataset is not classified, so we used the classification
signal_photons/classed_pc_flag, which is a flag from the higher Level 3 ATL08 product [
34], to classify each photon. These classifications include “noise”, “ground”, “canopy”, and “top of canopy”, of which we only used “ground”. For elevation, we used the
heights/h_ph (height photon) containing the elevation above the WGS84 ellipsoid and related latitude
heights/lat_ph and longitude
heights/lon_ph for each track group in the HDF5 file. We did not apply further filtering but noted that classified points have a confidence level of 3 (medium) or 4 (high) by design, thereby filtering out lower confidence values.
To investigate the performance of GEDI, we used the GEDI L2A data product [
12,
35] at version 2. As of this writing, this covers dates from 18-04-2019 to 16-07-2023. For elevation, we used the
elev_lowestmode field and related latitude
lat_lowestmode and longitude
lon_lowestmode fields for each track group in the HDF5 file. We filtered the data based on the settings that are used to produce the higher level L3A (version 2) product [
29], which uses points from the L2A product in a sparse 1 km resolution raster product. These settings only include data with the flags
rx_assess_quality_flag set to non-zero,
surface_flag set to non-zero, and
degrade_flag set to zero, with all flags specified in
Appendix A.
2.2. Reference Datasets: Airborne Lidar and Land Cover
We compared ground elevation points from both missions with terrain reference datasets based on airborne lidar. The areas included are the Netherlands, Switzerland, and New Zealand, for a total of 25,663 km2. These datasets cover flat to steep terrain and several forest types in different climate zones of the world. Note that GEDI does not cover the full area of the Netherlands, as its orbit terminates at 51.6° latitude.
In order to differentiate the results from the comparison with the reference datasets, we also sampled the land-cover class from the ESA WorldCover 2020 dataset [
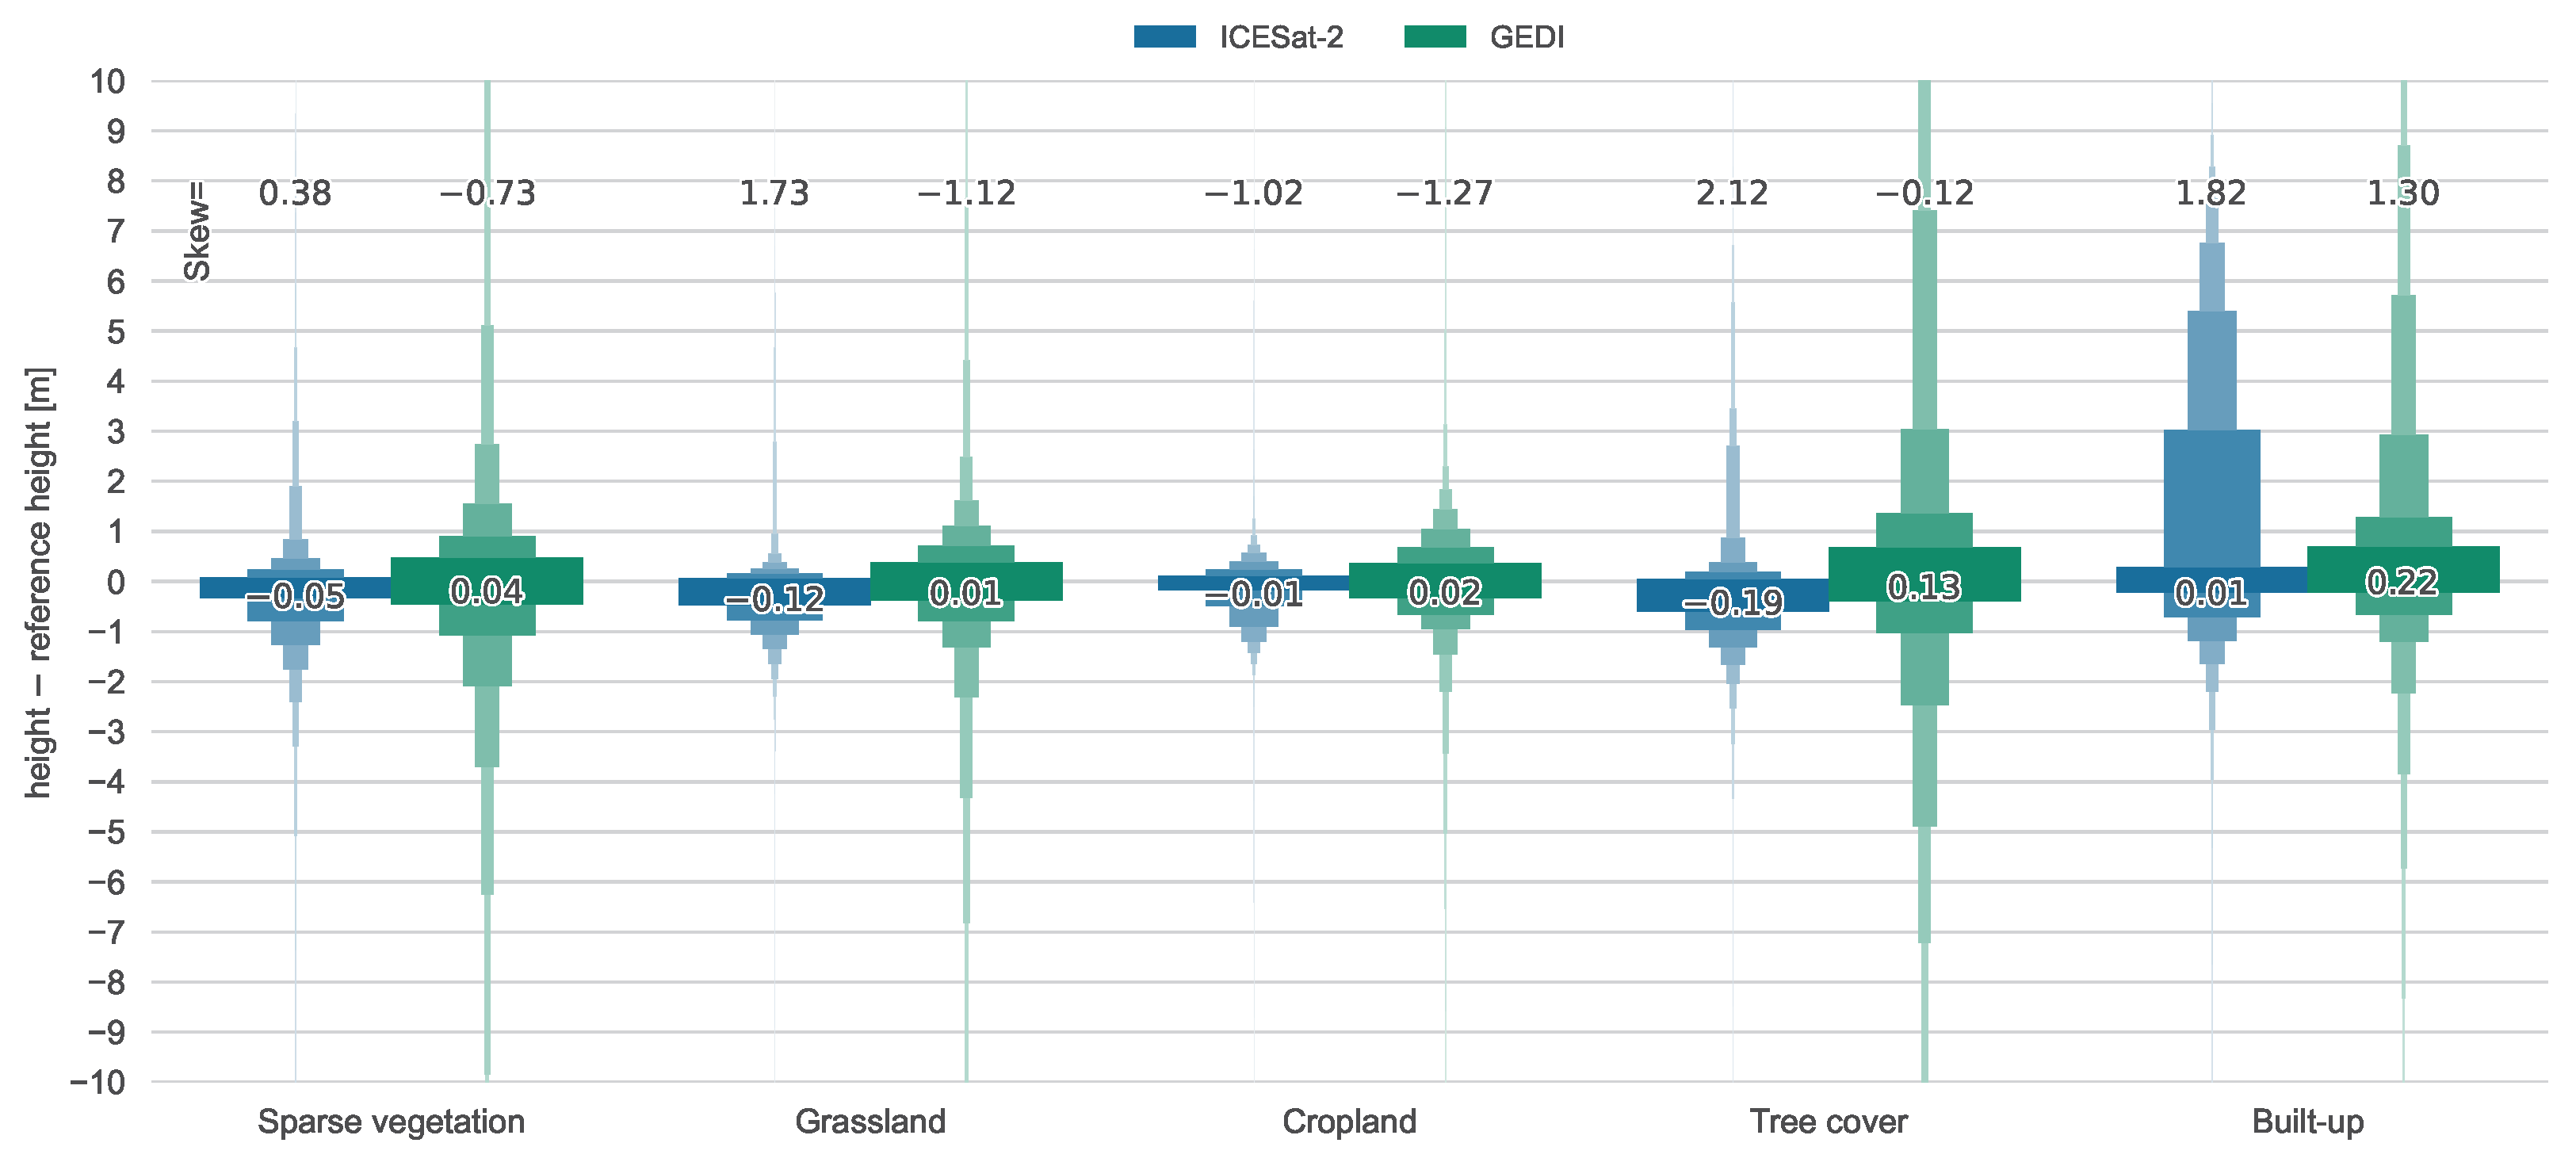
36]. WorldCover recognises several land-cover classes, such as “Grassland”, “Cropland”, “Tree cover”, and “Built-up”, which we used to differentiate the error metrics.
An overview of these datasets for the area of New Zealand is given in
Figure 3. The overviews for the two other reference areas can be found in
Appendix B.
2.3. Methods
This study investigates the vertical accuracy of both ICESat-2 ATL03 and GEDI L2A data by comparing them with DTMs based on airborne lidar in different countries and terrain types. Furthermore, we assess the density of samples in the planimetric direction to identify which resolutions of a (global) DEM based on ICESat-2 and/or GEDI could be achieved. The ATL03 and L2A products, both Level 2 products, are the lowest-level or highest-resolution data products available for both missions that are geolocated and corrected for geophysical effects, thus containing directly applicable elevation values. We differ from most studies in using the Level 2 ATL03 data product for ICESat-2 and not its Level 3 ATL08 product, which is a 100 m aggregated version of ATL03.
All granules intersecting with the reference areas were searched using NASA Earthdata Search (
https://search.earthdata.nasa.gov/) and downloaded from their archive centres. This download resulted in 3466 granules with a total size of ∼5.9 TB, as detailed in
Table 2. After data filtering—for both quality and geographic area—data from a remaining 1941 granules (56%) were used.
For each ICESat-2 or GEDI measurement
z, we retrieved the corresponding cell values from the reference raster datasets. Given a 5 m resolution reference raster, ICESat-2—with a 11 m footprint—covers roughly 2 × 2 cells. GEDI, with its slightly larger footprint, would cover 5 × 5 cells. Our experiments showed that there is no discernable difference between sampling the centre cell or the mean or median of all cells. We take the centre cell—the midpoint of the beam—to obtain a single value
c, which we use in the following metrics:
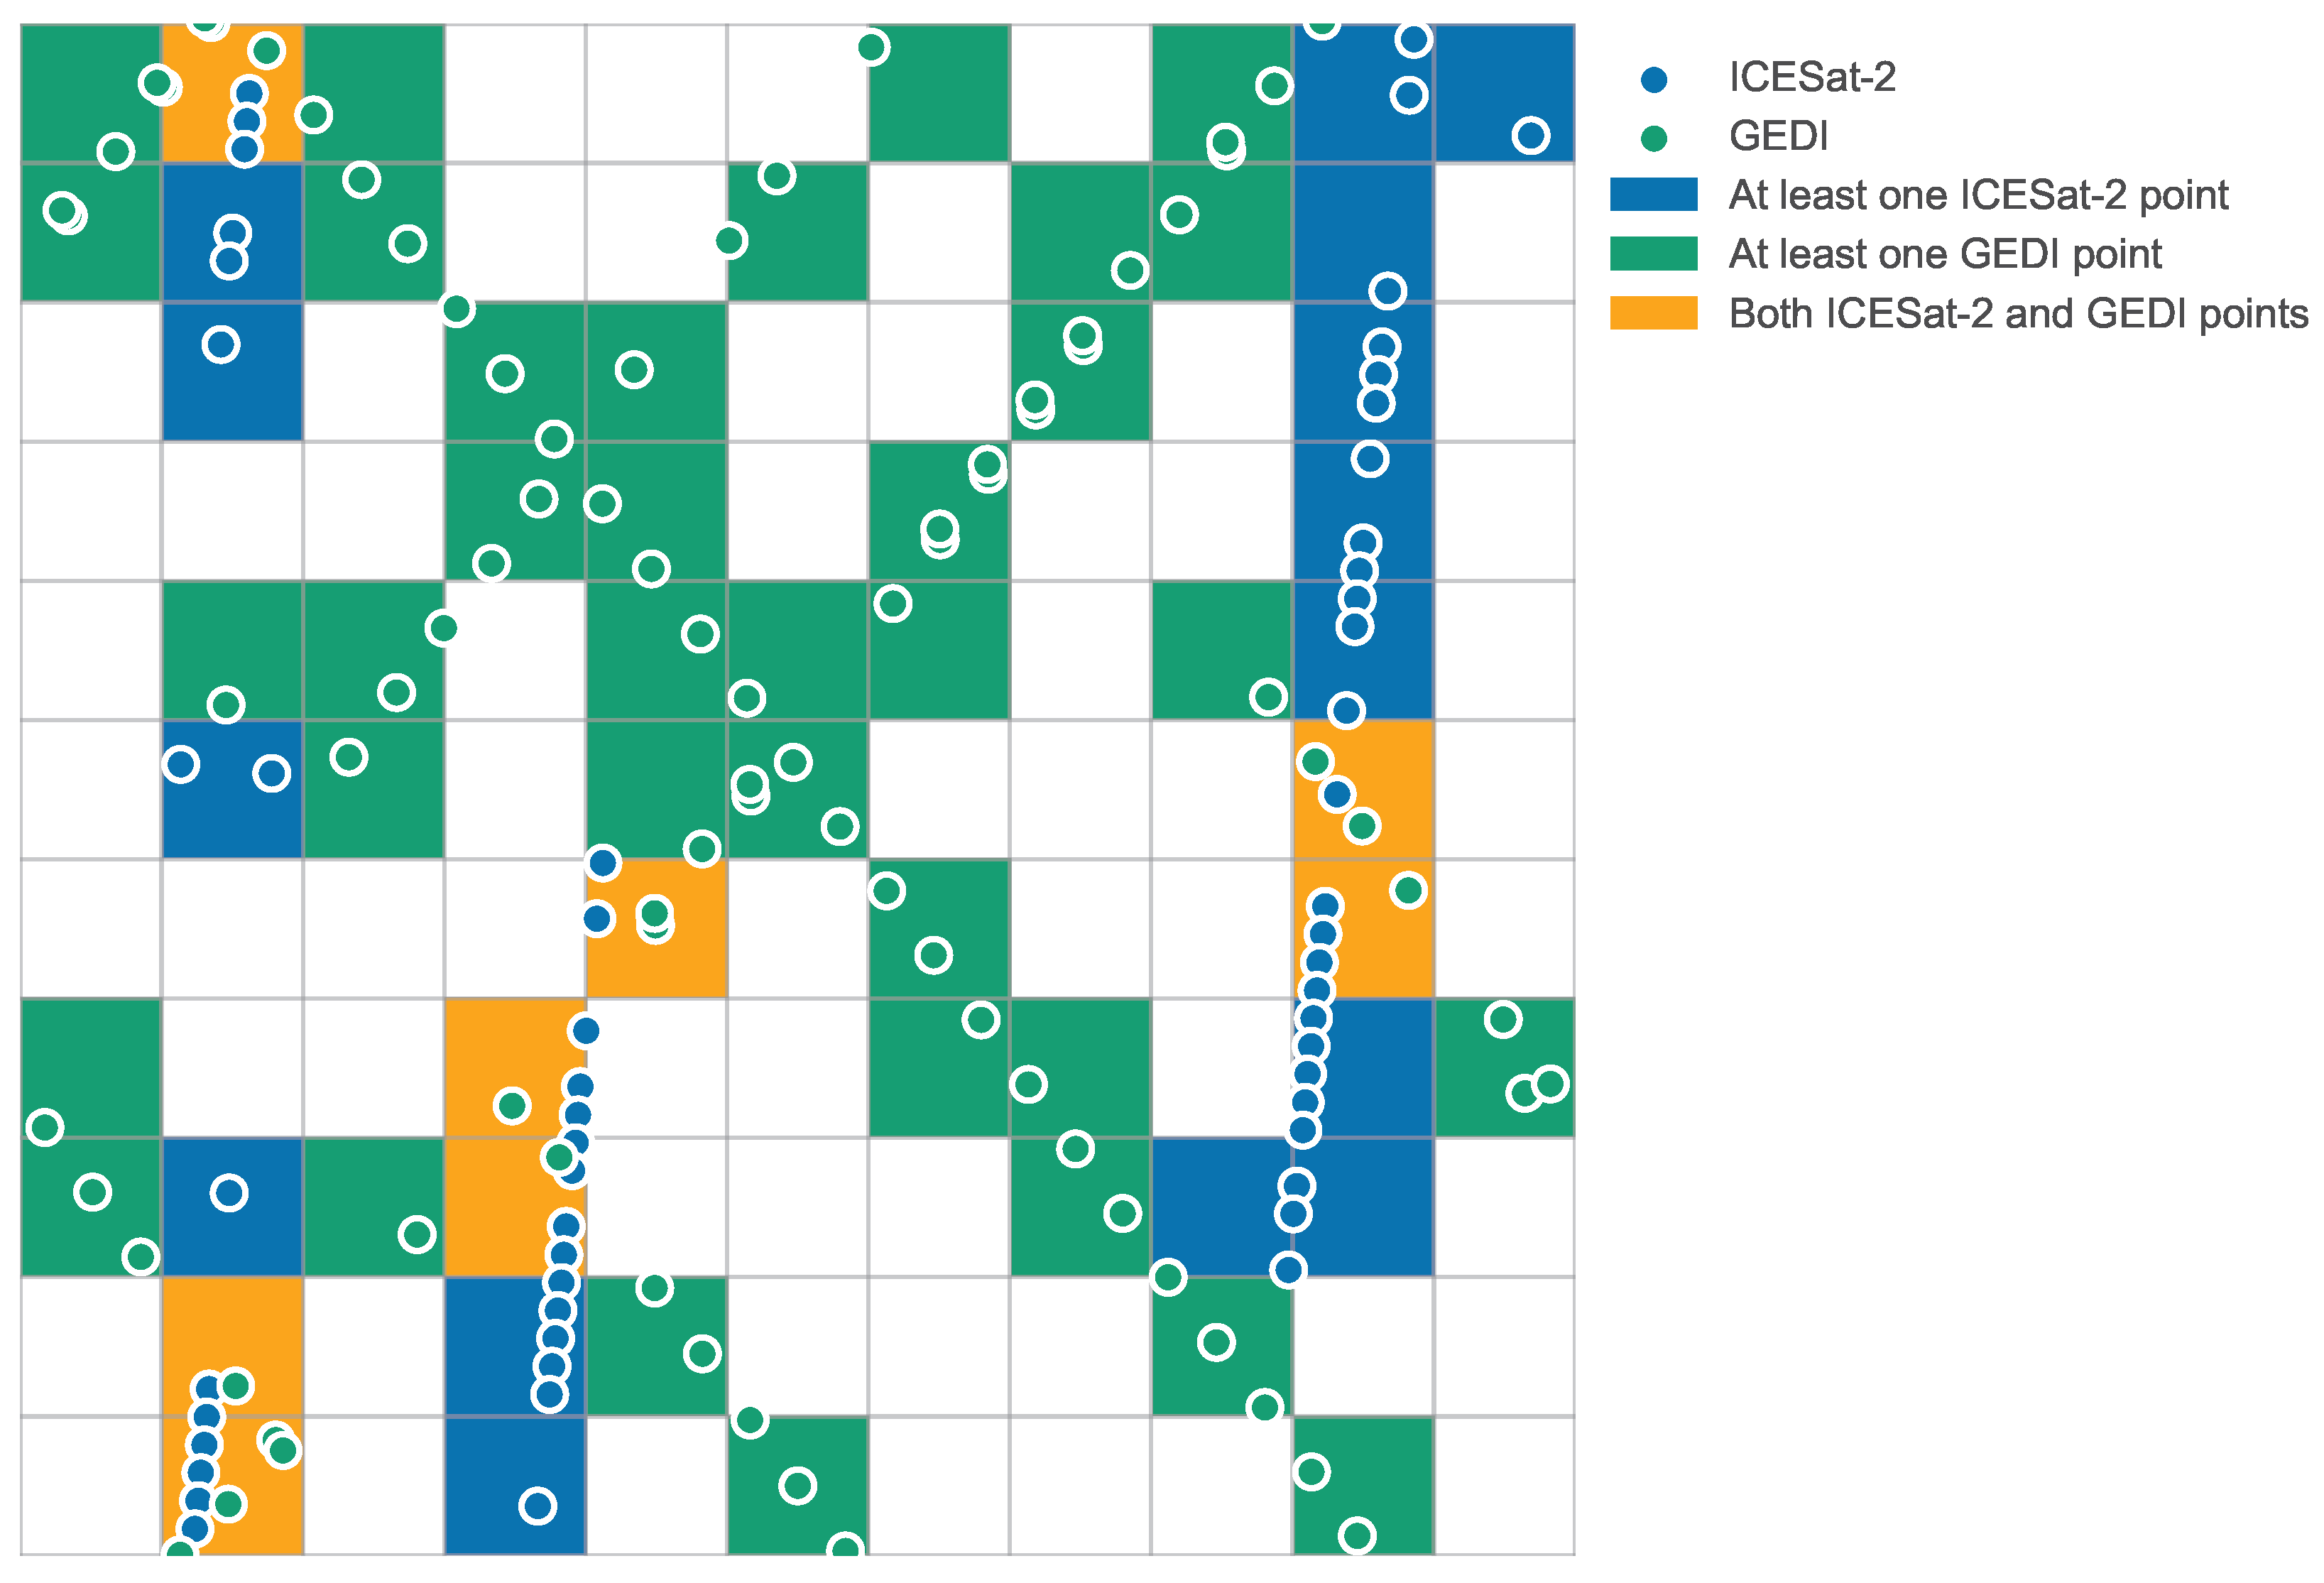
In order to assess the coverage of ICESat-2 and GEDI—and thus the possible resolution of a (global) DEM based on ICESat-2 and GEDI lidar—we rasterised ICESat-2 and GEDI data into 5 km × 50 km rasters at several resolutions for a full range of latitudes. We did so along the 99th meridian east, as it is one of the few areas that has an almost continuous landmass from 0° latitude northward. Similar to the procedure followed in assessing the vertical accuracy, all granules intersecting with a meta-bounding box around the 99th meridian east were downloaded and processed. This download resulted in 2715 ICESat-2 granules and 8760 granules for GEDI, over 20 TB of data.
The raster values were obtained by counting the samples (footprints) falling inside each raster cell. Rasterising at a high resolution will thus leave many cells empty (set to 0), while rasterising at a low resolution will fill up the entire grid with values equal to or larger than one. We denote the ratio of non-zero cells over all raster cells in a 5 km × 50 km box as the
spatial coverage (%). At 100%, it gives a lower bound to the density: at least 1 point per cell at a given resolution. An example for a grid with a 100 m resolution is given in
Figure 4. Given the possible presence of water bodies—and thus gaps in the coverage—a 100% spatial coverage is unrealistic. Here, we qualify spatial coverages of 80% and up as fit for DEM creation purposes.
5. Conclusions
In this study, we validated the terrain measurements of ICESat-2 and GEDI lidar satellites against airborne lidar datasets over three areas in the Netherlands, Switzerland, and New Zealand. We used five years of ICESat-2 ATL03 data (13-10-2018 to 26-10-2023) and more than four years of GEDI L2A data (18-04-2019 to 16-07-2023) for a total of 252 million measurements.
For all areas and land-cover classes combined, ICESat-2 achieved a bias of −0.11 m, an MAE of 0.43 m, and an RMSE of 0.93 m (N = 236,932,686). We found that GEDI is less accurate, with a bias of 0.09 m, an MAE of 0.98 m, and an RMSE of 2.96 m (N = 15,544,899). The difference in the number of samples stems from the higher sampling rate of ICESat-2 compared to GEDI. Measurements in open land-cover classes, such as “Cropland” and “Grassland”, result in the best accuracy for both missions. Accuracy decreases in “Sparse vegetation” areas and is worst in “Tree cover” areas for GEDI and in “Built-up” areas for ICESat-2. Both missions have a strong positive bias of 0.5 m in urban areas, as they mistake buildings for ground.
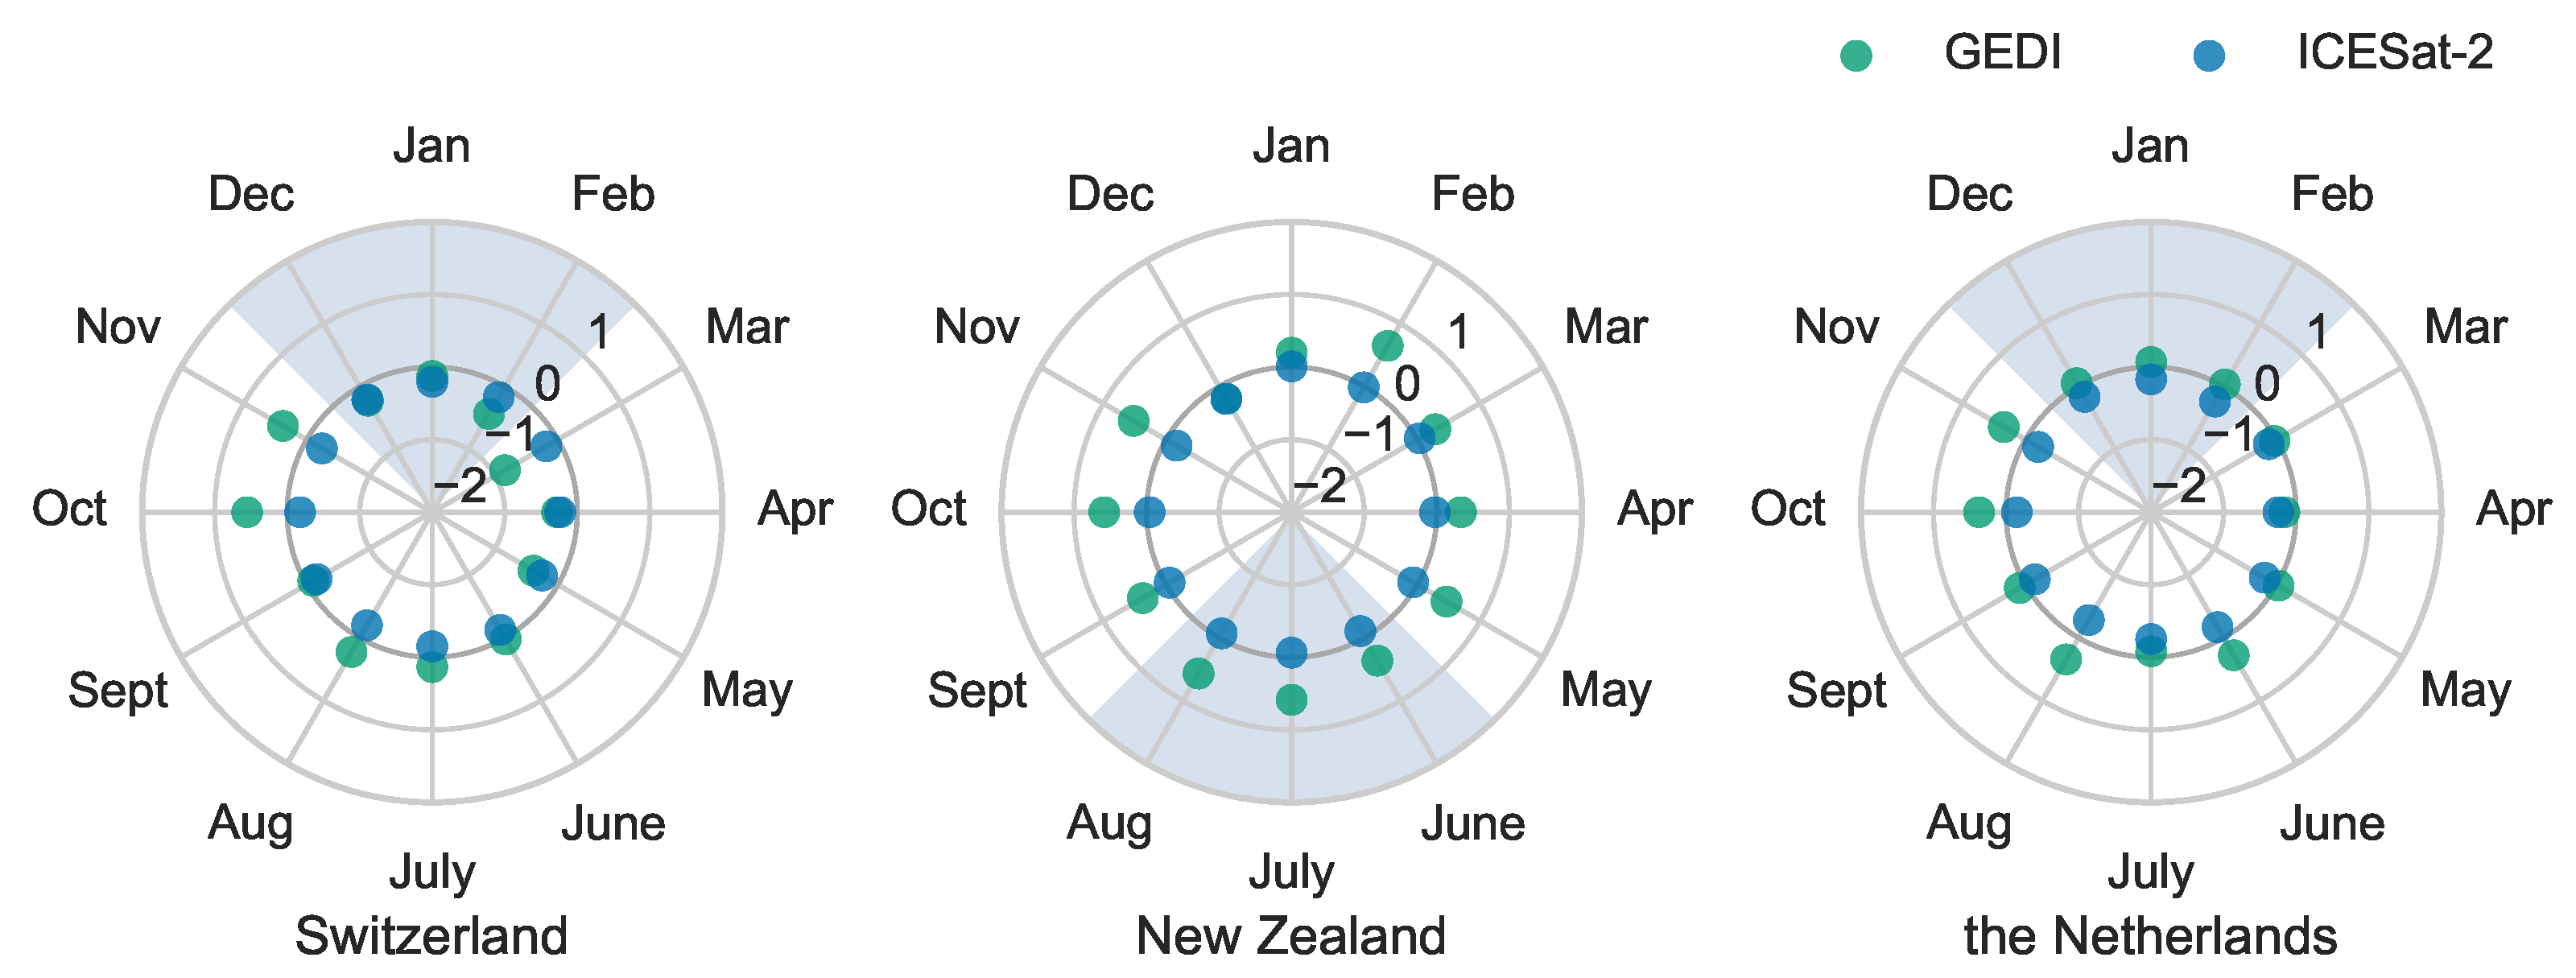
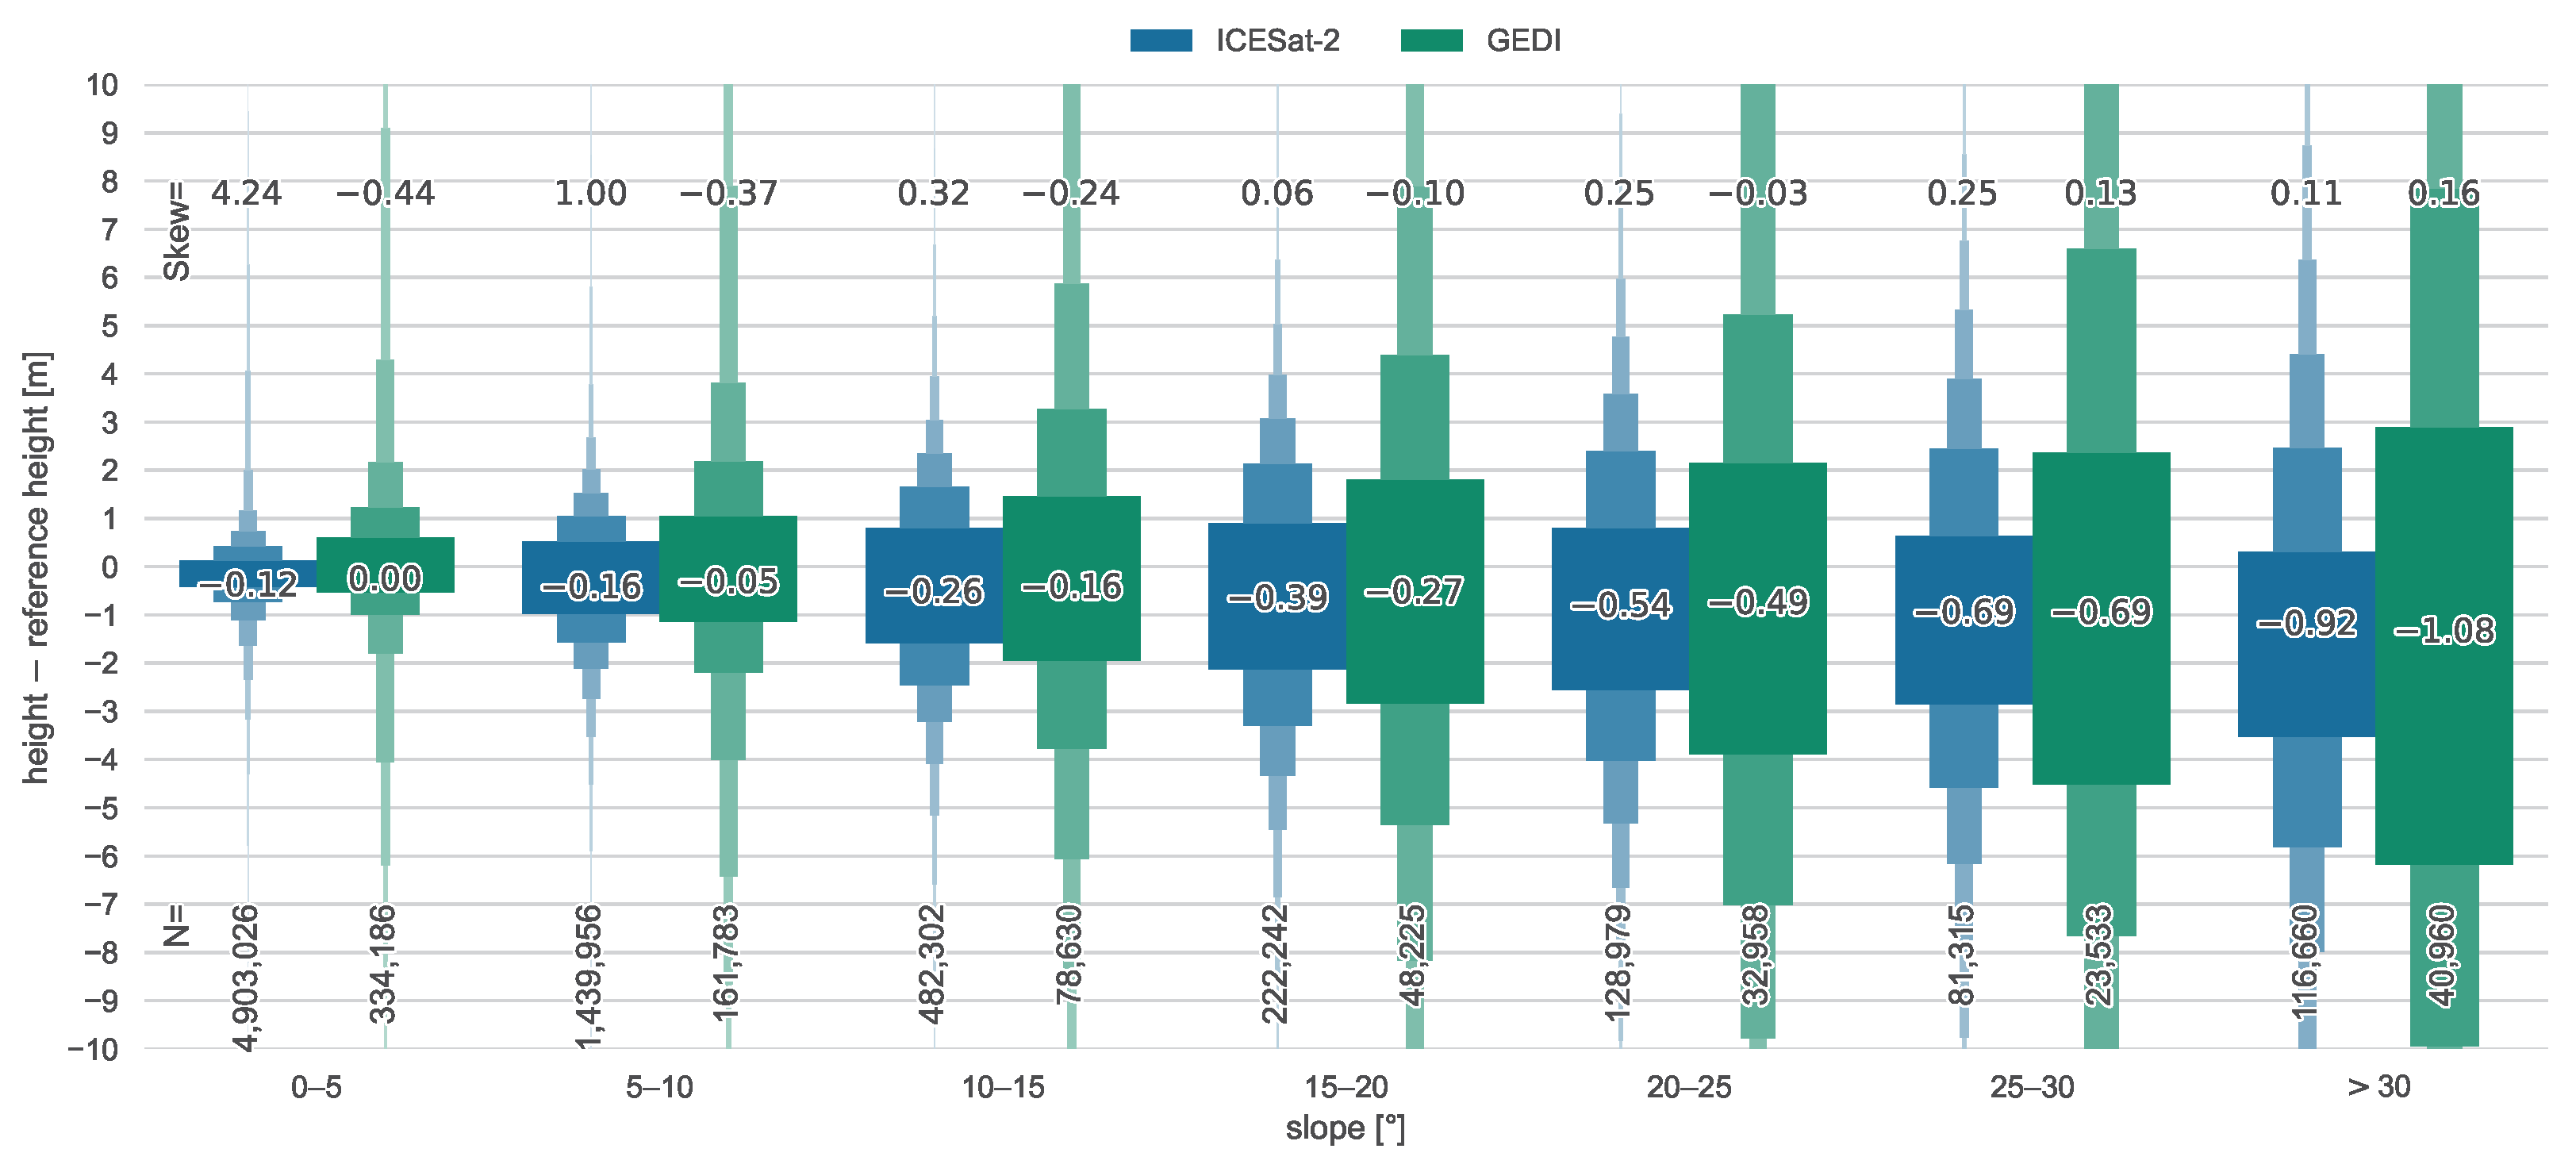
We found that the slope of the measured terrain has a major influence on accuracy, more so for GEDI than ICESat-2. Overall, little effect of either the beam power or time of measurements was found, nor did we find significant seasonal effects on accuracy. We concluded that the applied filtering is sufficient to remove most outliers for both products. Our results are comparable to or better than those of previous studies, which we attribute to using newer versions of the data products.
Furthermore, we investigated the current spatial coverage of ICESat-2 and GEDI by deriving a DEM at different resolutions and latitudes. GEDI has higher spatial coverage than ICESat-2 at lower latitudes due to its beam pattern and lower inclination angle and can achieve a resolution of 700 m. ICESat-2 only reaches a resolution of 1000 m at the equator, but it increases to 200 m at higher latitudes. Finally, we were the first to show that a DEM of 500 m resolution could be achieved globally when ICESat-2 and GEDI are combined.
We provided recommendations on processing both ICESat-2 and GEDI data for DEM creation, especially in terms of filtering outlier tracks. With these filters applied, both ICESat-2 and GEDI enable accurate terrain measurements anywhere in the world. In data-poor areas with ubiquitous forest cover—such as the tropics—these spaceborne lidar instruments enable accurate remote-sensed terrain measurements for the first time. This has considerable potential for new applications and insights, such as the estimation of flood risk.


