Article

Medium-Scale Soil Moisture Retrievals Using an ELBARA L-Band Radiometer Using Time-Dependent Parameters for Wetland-Meadow-Cropland Site

Institute of Agrophysics of Polish Academy of Science, Doświadczalna Str. 4, 29-290 Lublin, Poland
*
Author to whom correspondence should be addressed.
Remote Sens. 2024, 16(12), 2200; https://doi.org/10.3390/rs16122200
Submission received: 18 April 2024 / Revised: 3 June 2024 / Accepted: 12 June 2024 / Published: 17 June 2024
(This article belongs to the Special Issue Advances in Remote Sensing for Regional Soil Moisture Monitoring)

Abstract

:
The soil moisture at the medium spatial scale is strongly desired in the context of satellite remote sensing data validation. The use of a ground-installed passive L-band radiometer ELBARA at the Bubnów-Sęków test site in the east of Poland gave a possibility to provide reference soil moisture data from the area with a radius of 100 m. In addition, the test site comprised three different land cover types that could be investigated continuously with one day resolution. The studies were focused on the evaluation of the ω-τ model coefficients for three types of land cover, including meadow, wetland, and cropland, to allow for the assessment of the soil moisture retrievals at a medium scale. Consequently, a set of reference time-dependent coefficients of effective scattering albedo, optical depth, and constant-in-time roughness parameters were estimated. The mean annual values of the effective scattering albedo including two polarisations were 0.45, 0.26, 0.14, and 0.54 for the meadow with lower organic matter, the meadow with higher organic matter, the wetland, and the cropland, respectively. The values of optical depth were in the range from 0.30 to 0.80 for the cropland, from 0.40 to 0.52 for the meadows (including the two investigated meadows), and from 0.60 to 0.70 for the wetland. Time-constant values of roughness parameters at the level of 0.45 were obtained.

1. Introduction

Soil moisture (SM) monitoring plays a crucial role in the context of many branches, with the main impact on agriculture around the world [1,2,3], as a deficit of water available for plants is the main factor governing the agricultural drought assessment [4]. On the other hand, soil moisture monitoring is a still widely explored issue in the research world [5,6,7,8]. For the tens of years of space exploration, soil monitoring techniques have been expanded to include an additional research area focusing on the harmonisation and fusion of soil moisture data obtained at different spatial and temporal scales [9,10,11]. The earliest measurements of soil moisture mainly involved point measurements using hand-held instruments or instruments fixed for a specific location. The gravimetric method was recognised as a reference technique [12]. The method for point in situ measurements is currently mainly based on TDR [13] or FDR [14] probes. The main disadvantage of point measurements is related to the high variety of soil moisture in the environment caused by the high relationship of SM values with soil physical parameters [15,16]. In an environment with highly diversified physical properties of the soil, point soil moisture measurements provide data differing by tens of percents in unchanged metrological conditions [17,18]. In practice, for more precise soil moisture assessment using point measurements, a set of estimations need to be made to allow for the application of statistical evaluation [19]. This condition is an important limitation in the monitoring of areas larger that tens of square meters. As an alternative to, or rather a supplement for, point scale measurements, the remote sensing techniques were investigated, especially those using satellite-based instruments. Since 2009, when the SMOS [20] satellite was launched, the satellite has become a very important source of soil moisture data on a global scale. At the beginning, the spatial resolution of satellite remote sensing data was estimated at 40 km; currently, this value has been strongly reduced to 1 km [21], and even lower [22], mainly through the use of Sentinel-1 constellation [23]. Unfortunately, satellite-based data are very strongly dependent on many factors, e.g., soil cover or soil roughness and temperature [24,25,26]. Because of this dependence and the necessity for a constant improvement in the resolution of satellite soil moisture data, their applicability at the field scale is still limited. For better use of wide spatial scale soil moisture data from satellite-based instruments, medium spatial scale monitoring techniques are strongly desired. For validation of SMOS soil moisture data, the L-band passive radiometer ELBARA was developed [27]. One of these instruments was installed in Poland in an area with wetland-meadow-cropland land cover. Previous research performed to characterise the soil moisture retrievals from the ELBARA instrument using the L-MEB algorithm [24,28] shows the high discrepancy in point measurements of reference for soil moisture [29]. The comparisons of the previous analysis were made for reference measurements realised at one position at the test site. The L-MEB algorithm was based on the ω-τ model [30] for modelling brightness temperature, accounting for soil physical properties and land cover parameters. Research focused on global values of ω and τ coefficients is still in progress [31]; but, as pointed by [32], investigations of the dynamics of these parameters at the local scale should be conducted.
The aims of the present study were to:
  • Perform a calibration procedure for ELBARA brightness temperature (Tb) retrievals for a wetland-meadow-cropland test site using the results of five in situ measuring campaigns realized in 2018 to estimate the time-dependent dynamics of ω-τ model parameters, focusing on three specific types of land cover present at the Bubnów-Sęków test site.
  • Afterwards, based on the calibration results in the form of time-dependent ω-τ model coefficients the medium-scale soil moisture values using brightness temperature levels recorded using ELBARA in 2019 were evaluated and compared with in situ point measurements also performed in 2019.
This study is the first part of a series of wider investigations focused on establishment of the Bubnów-Sęków test site as a reference site for soil moisture retrievals with the Sentinel-1 instrument.

2. Materials and Methods

2.1. Bubnów-Sęków Test Site with an Agrometeorological Station and an ELBARA Instrument

The present research was performed at the Bubnów-Sęków test site operated by the Institute of Agrophysics of the Polish Academy of Science. The station was located on the boundary of a wetland, a meadow, and a cultivated field, as shown in Figure 1. The soil in the area of 100 m × 100 m around the station was composed of sand, silt, clay, and organic matter [29]. The sand content in the area varied from 86% to 95% and, depending on the sand content, the content of silt and clay fractions ranged from 2% to 9% and from <1% to 7%, respectively. There was also a high variation of organic matter content, which ranged from 2% to 30%.
The experimental infrastructure consisted of a meteorology station combined with the ELBARA instrument. The agrometeorological station was equipped with sensors for point monitoring basic variables, i.e., soil moisture at the depth of 1 m, air humidity, air temperature, soil temperature, wind speed and direction, and solar radiation with 10 min time resolution. Data have been collected since 2011. A detailed description of the measuring capabilities of the Bubnów-Sęków agrometeorological station was presented by Gluba et al. [29].

2.2. ELBARA L-Band Passive Radiometer

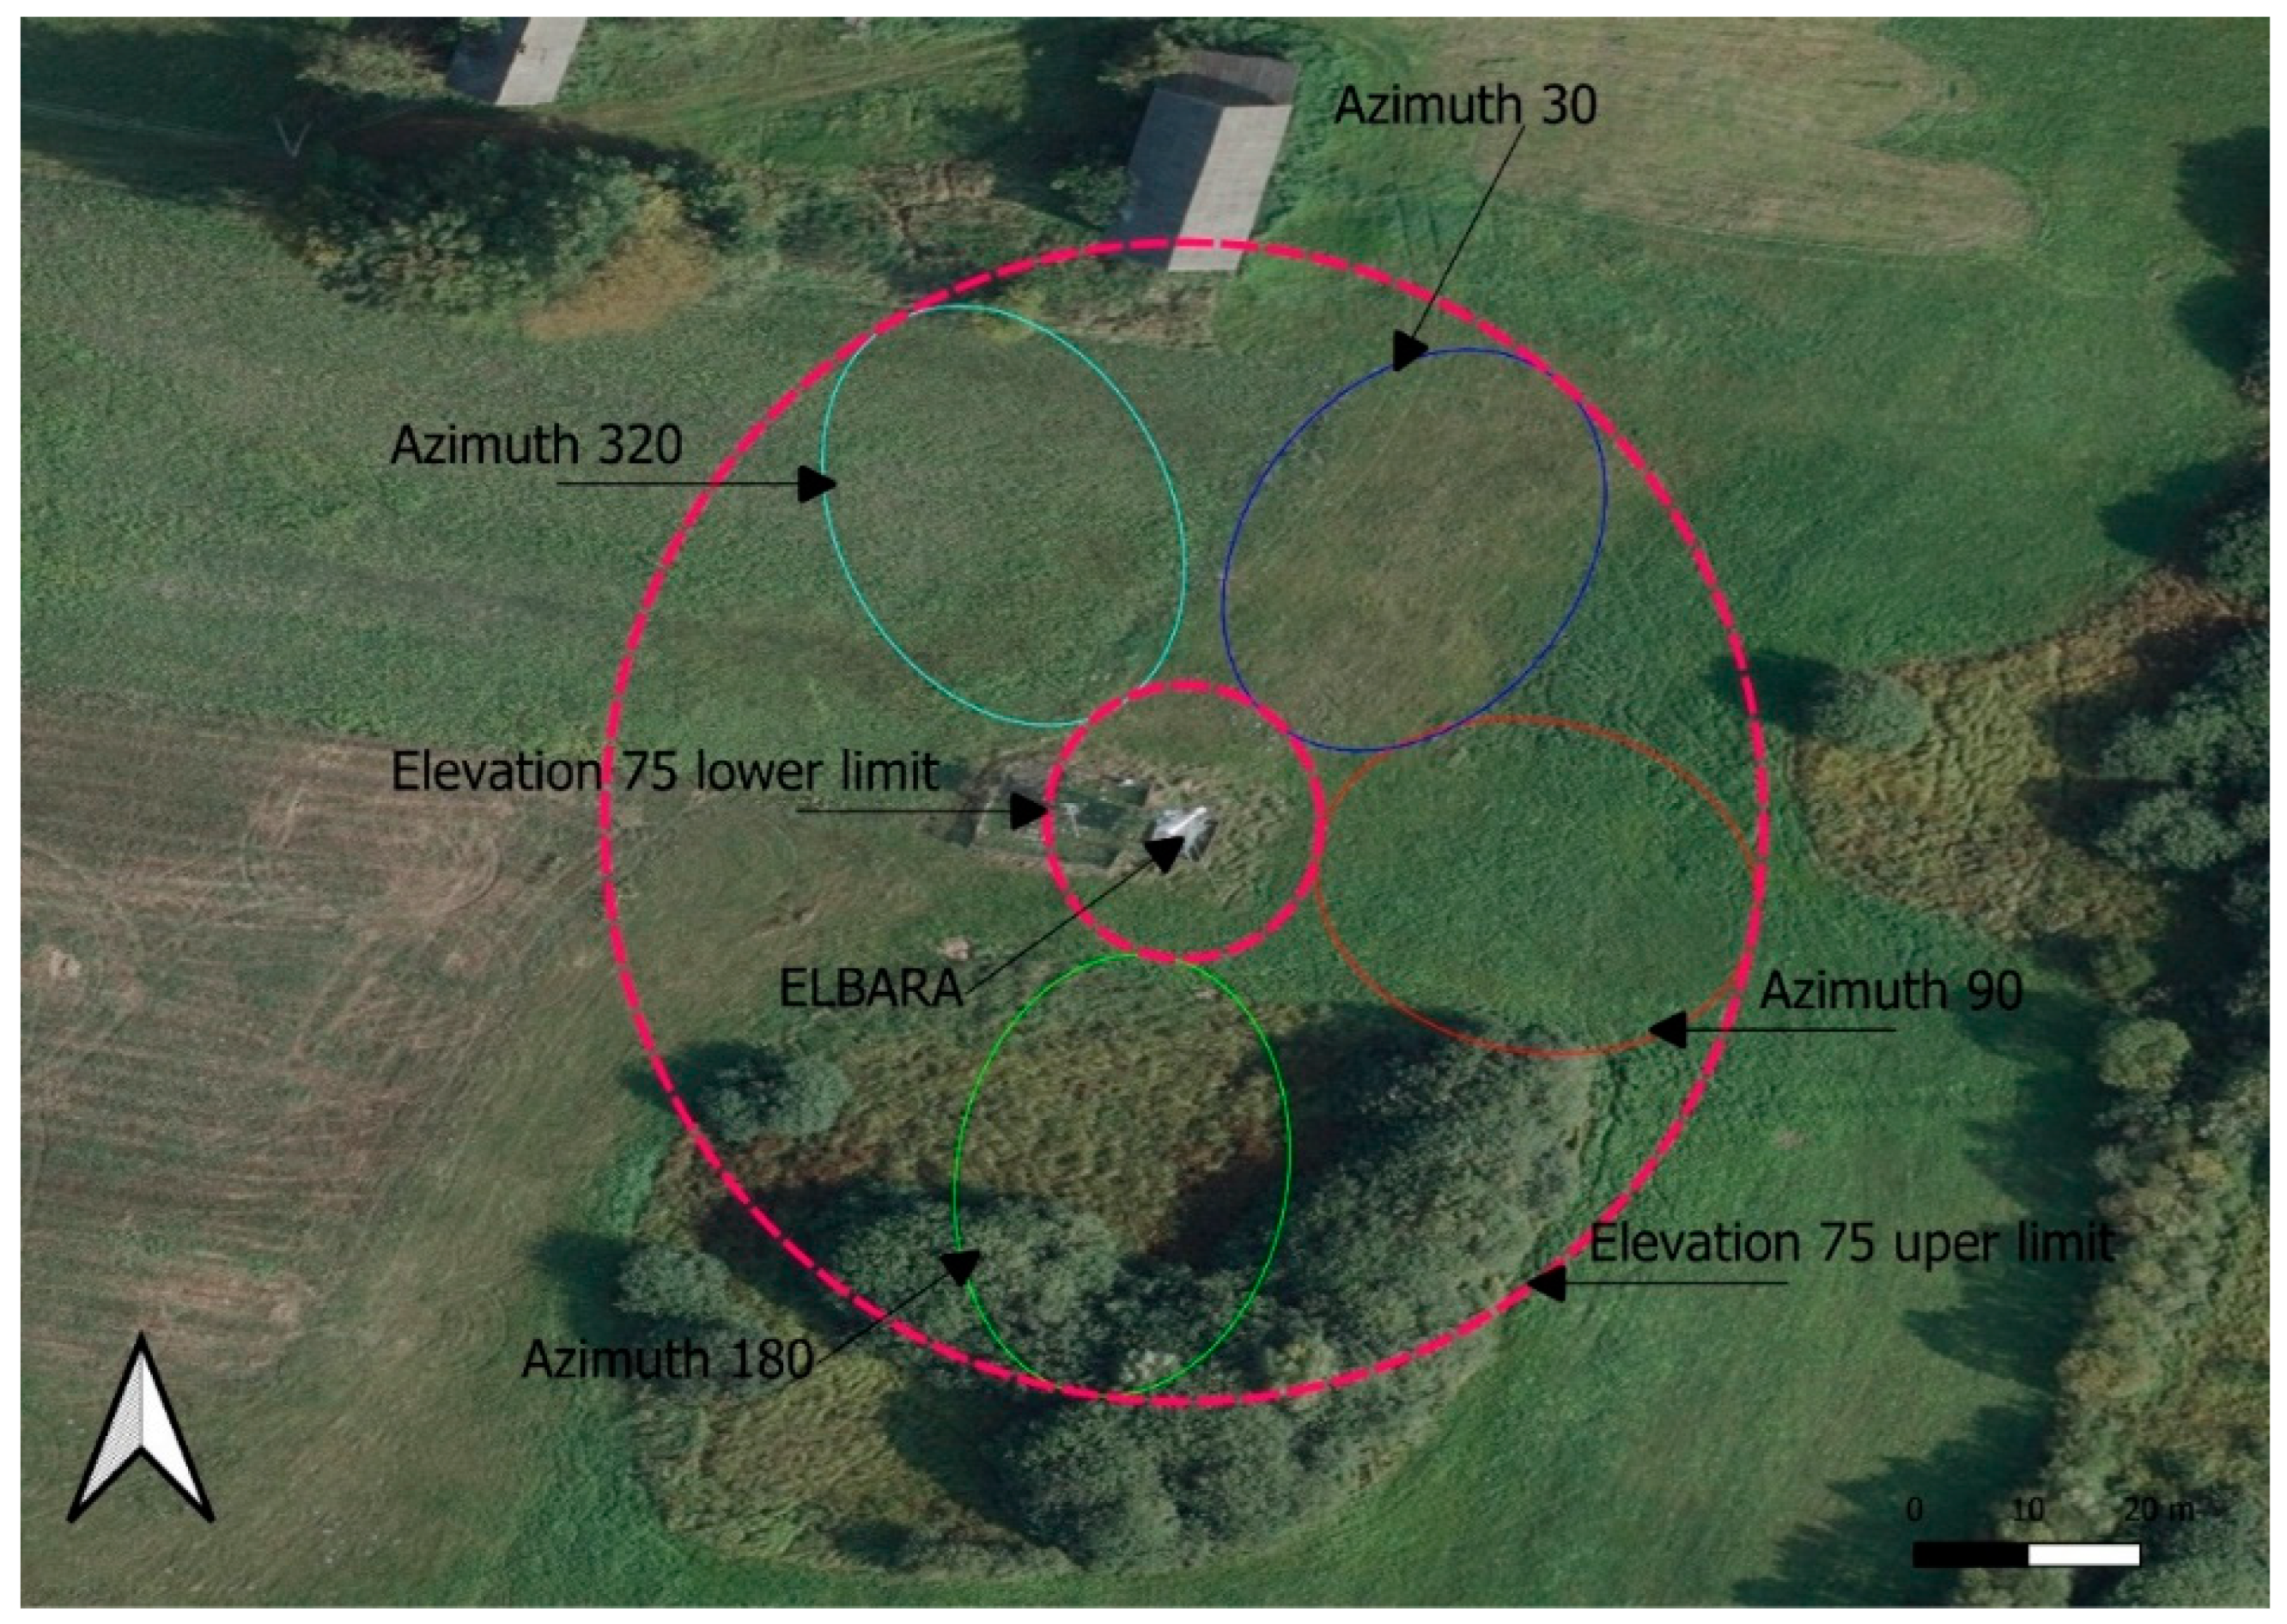
The third generation ELBARA (ESA L-band Radiometer) instrument was installed at the Bubnów-Sęków test site in 2016. Originally, the unit was designed for the purpose of validating the data received from the SMOS satellite. ELBARA is a passive radiometer working at the 1.4 GHz frequency, and is designed to perform measurements of brightness temperature at two polarisations described as horizontal (TbH) and vertical (TbV). The instrument was installed at a 6.5 m tower with the ability to move at two axes—the rotation (azimuth) in the range from 0 to 360 degrees (with a step of 10°), and the elevation angle (elevation) in the range from 30 to 80 degrees (with a step of 5°)—and at 155 degrees for sky calibration, as shown at Figure 1. Each day, ELBARA performed four series of 396 automatic measurements for different azimuth-elevation configurations plus one sky calibrating readout. It is assumed that the measurement for elevations from 35° to 75° covered an ellipsoid-shaped area with the length of the longer axis from 3.23 m to 49 m, respectively. The third-generation ELBARA is equipped with an improved system for radio frequency interference (RFI) identification. Previous research has shown that the measurements at the azimuths from 270° to 300° are strongly interrupted by RFI coming from the electrical elements of the agrometeorological station [29]. An example of a visual representation of ELBARA footprints for an elevation angle of 75° and azimuths 30°, 90°, 180°, and 320° is presented in Figure 2.
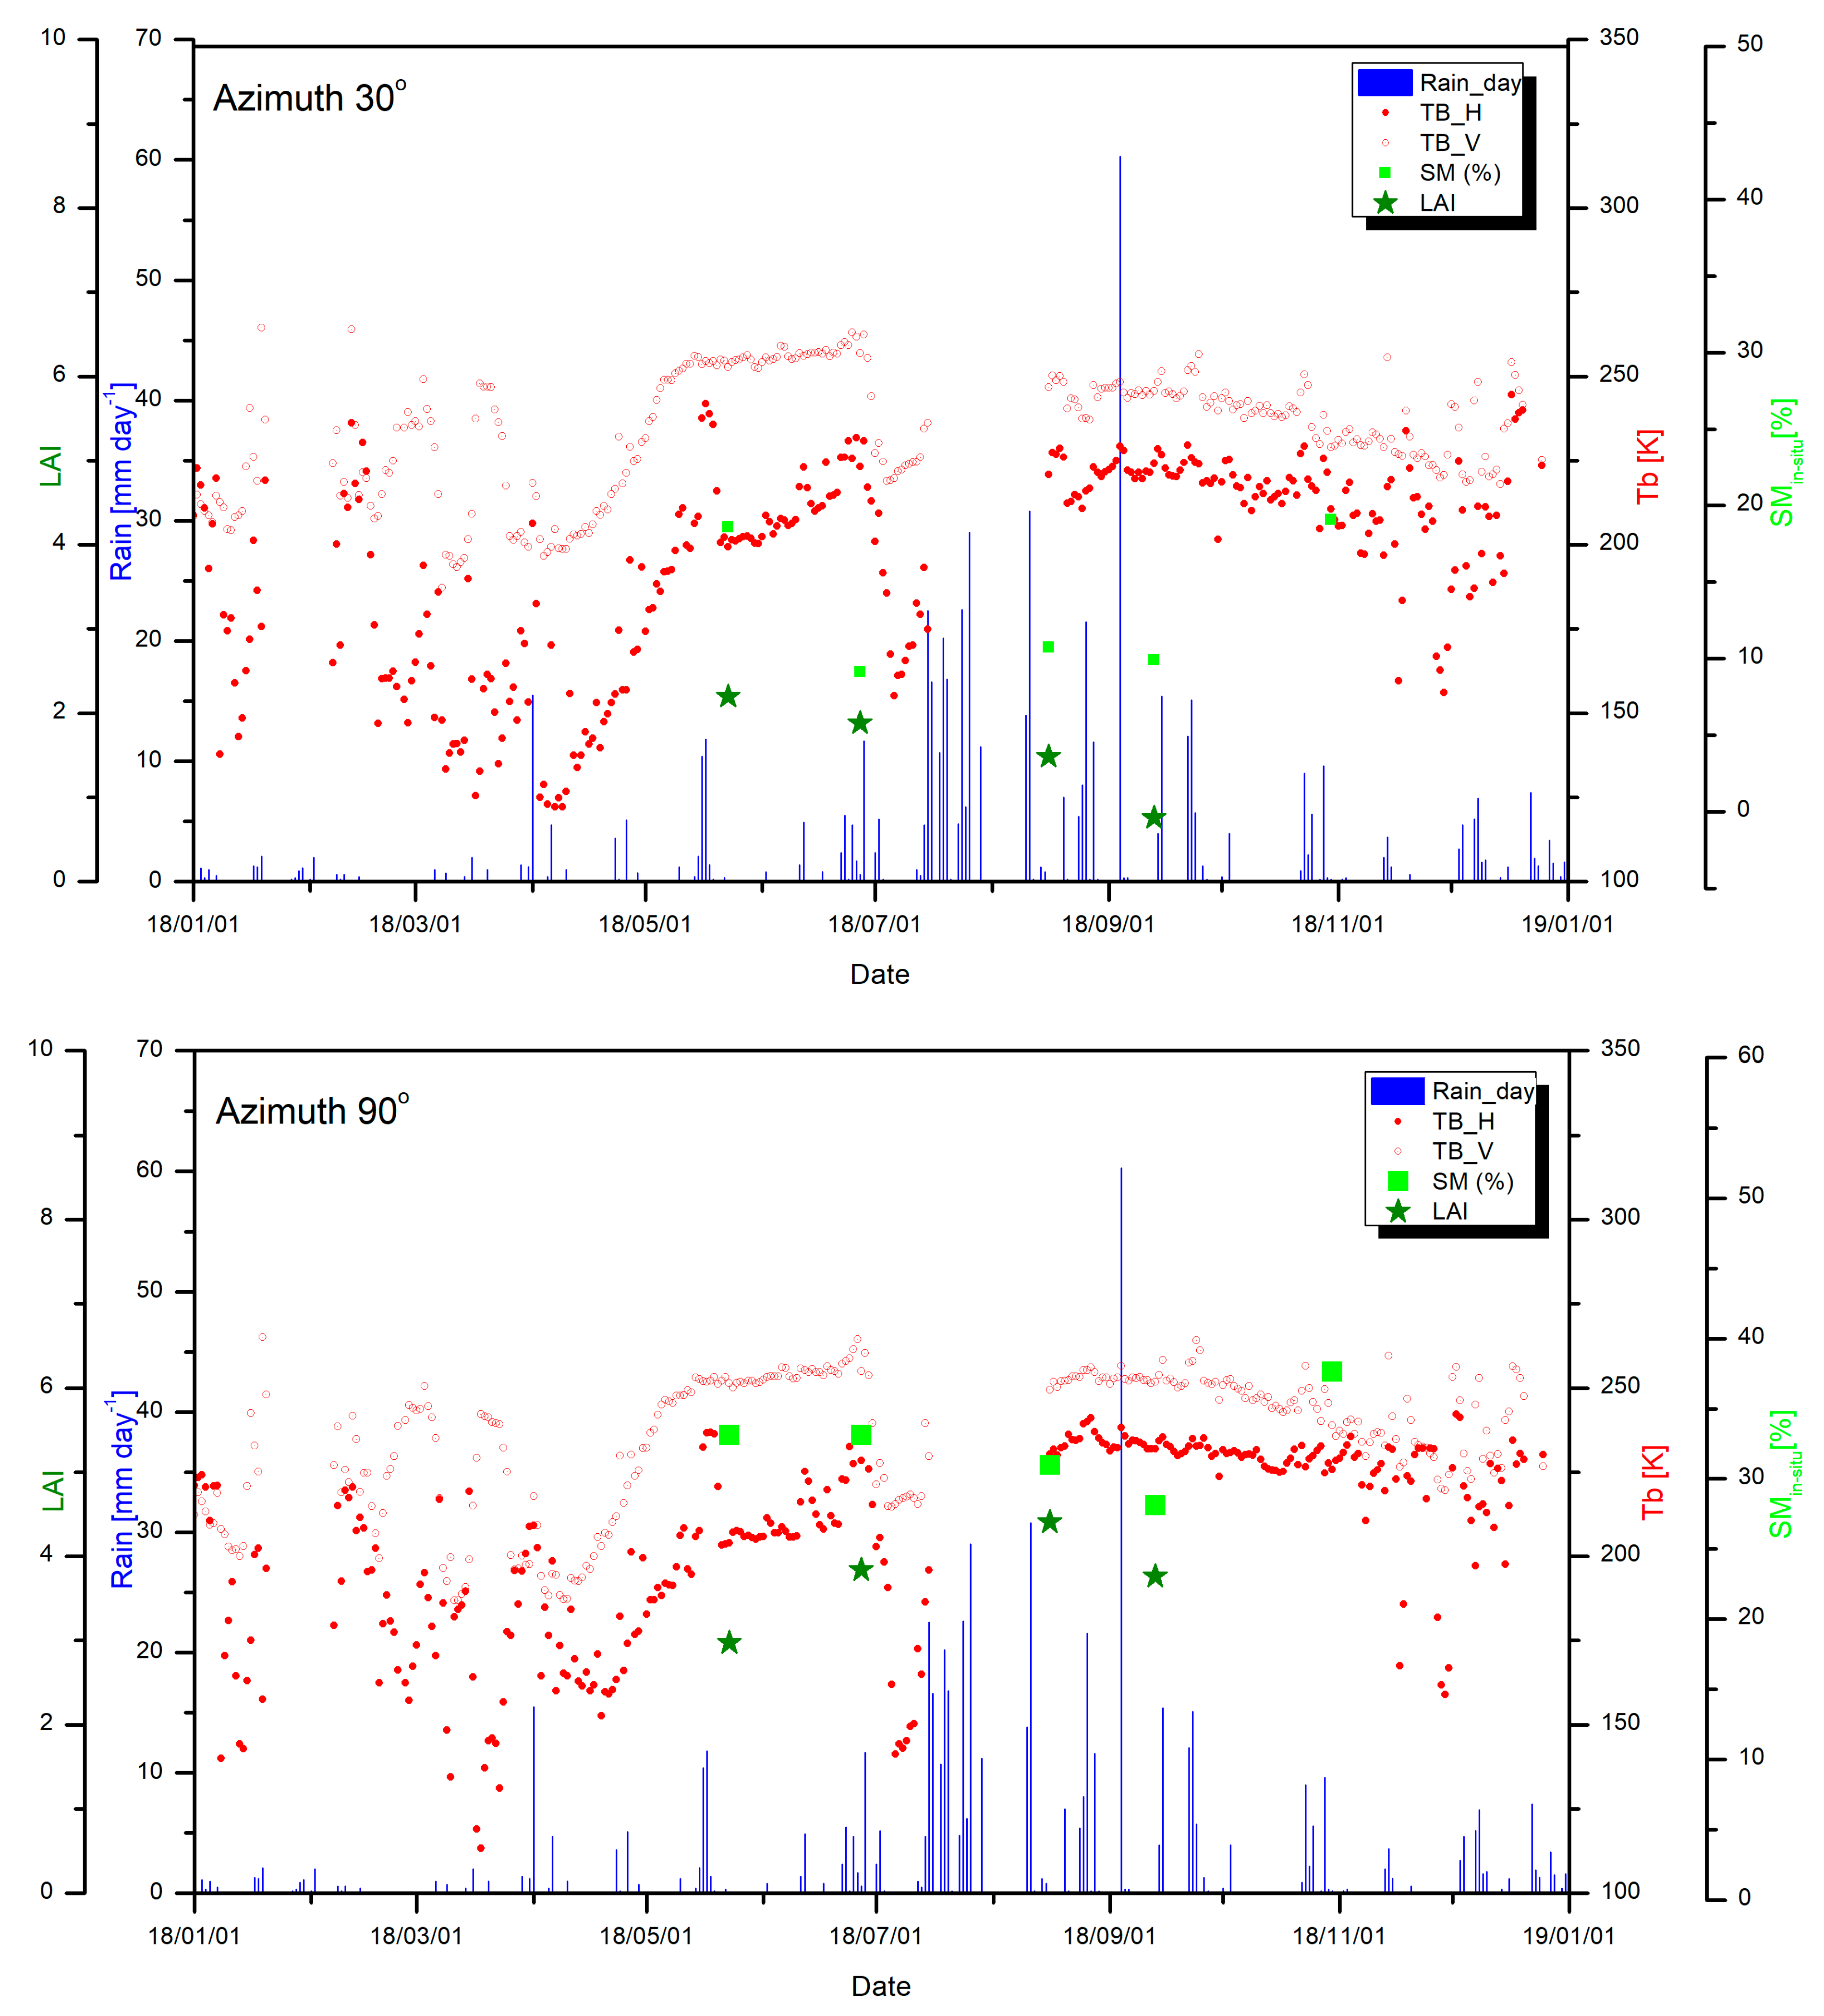
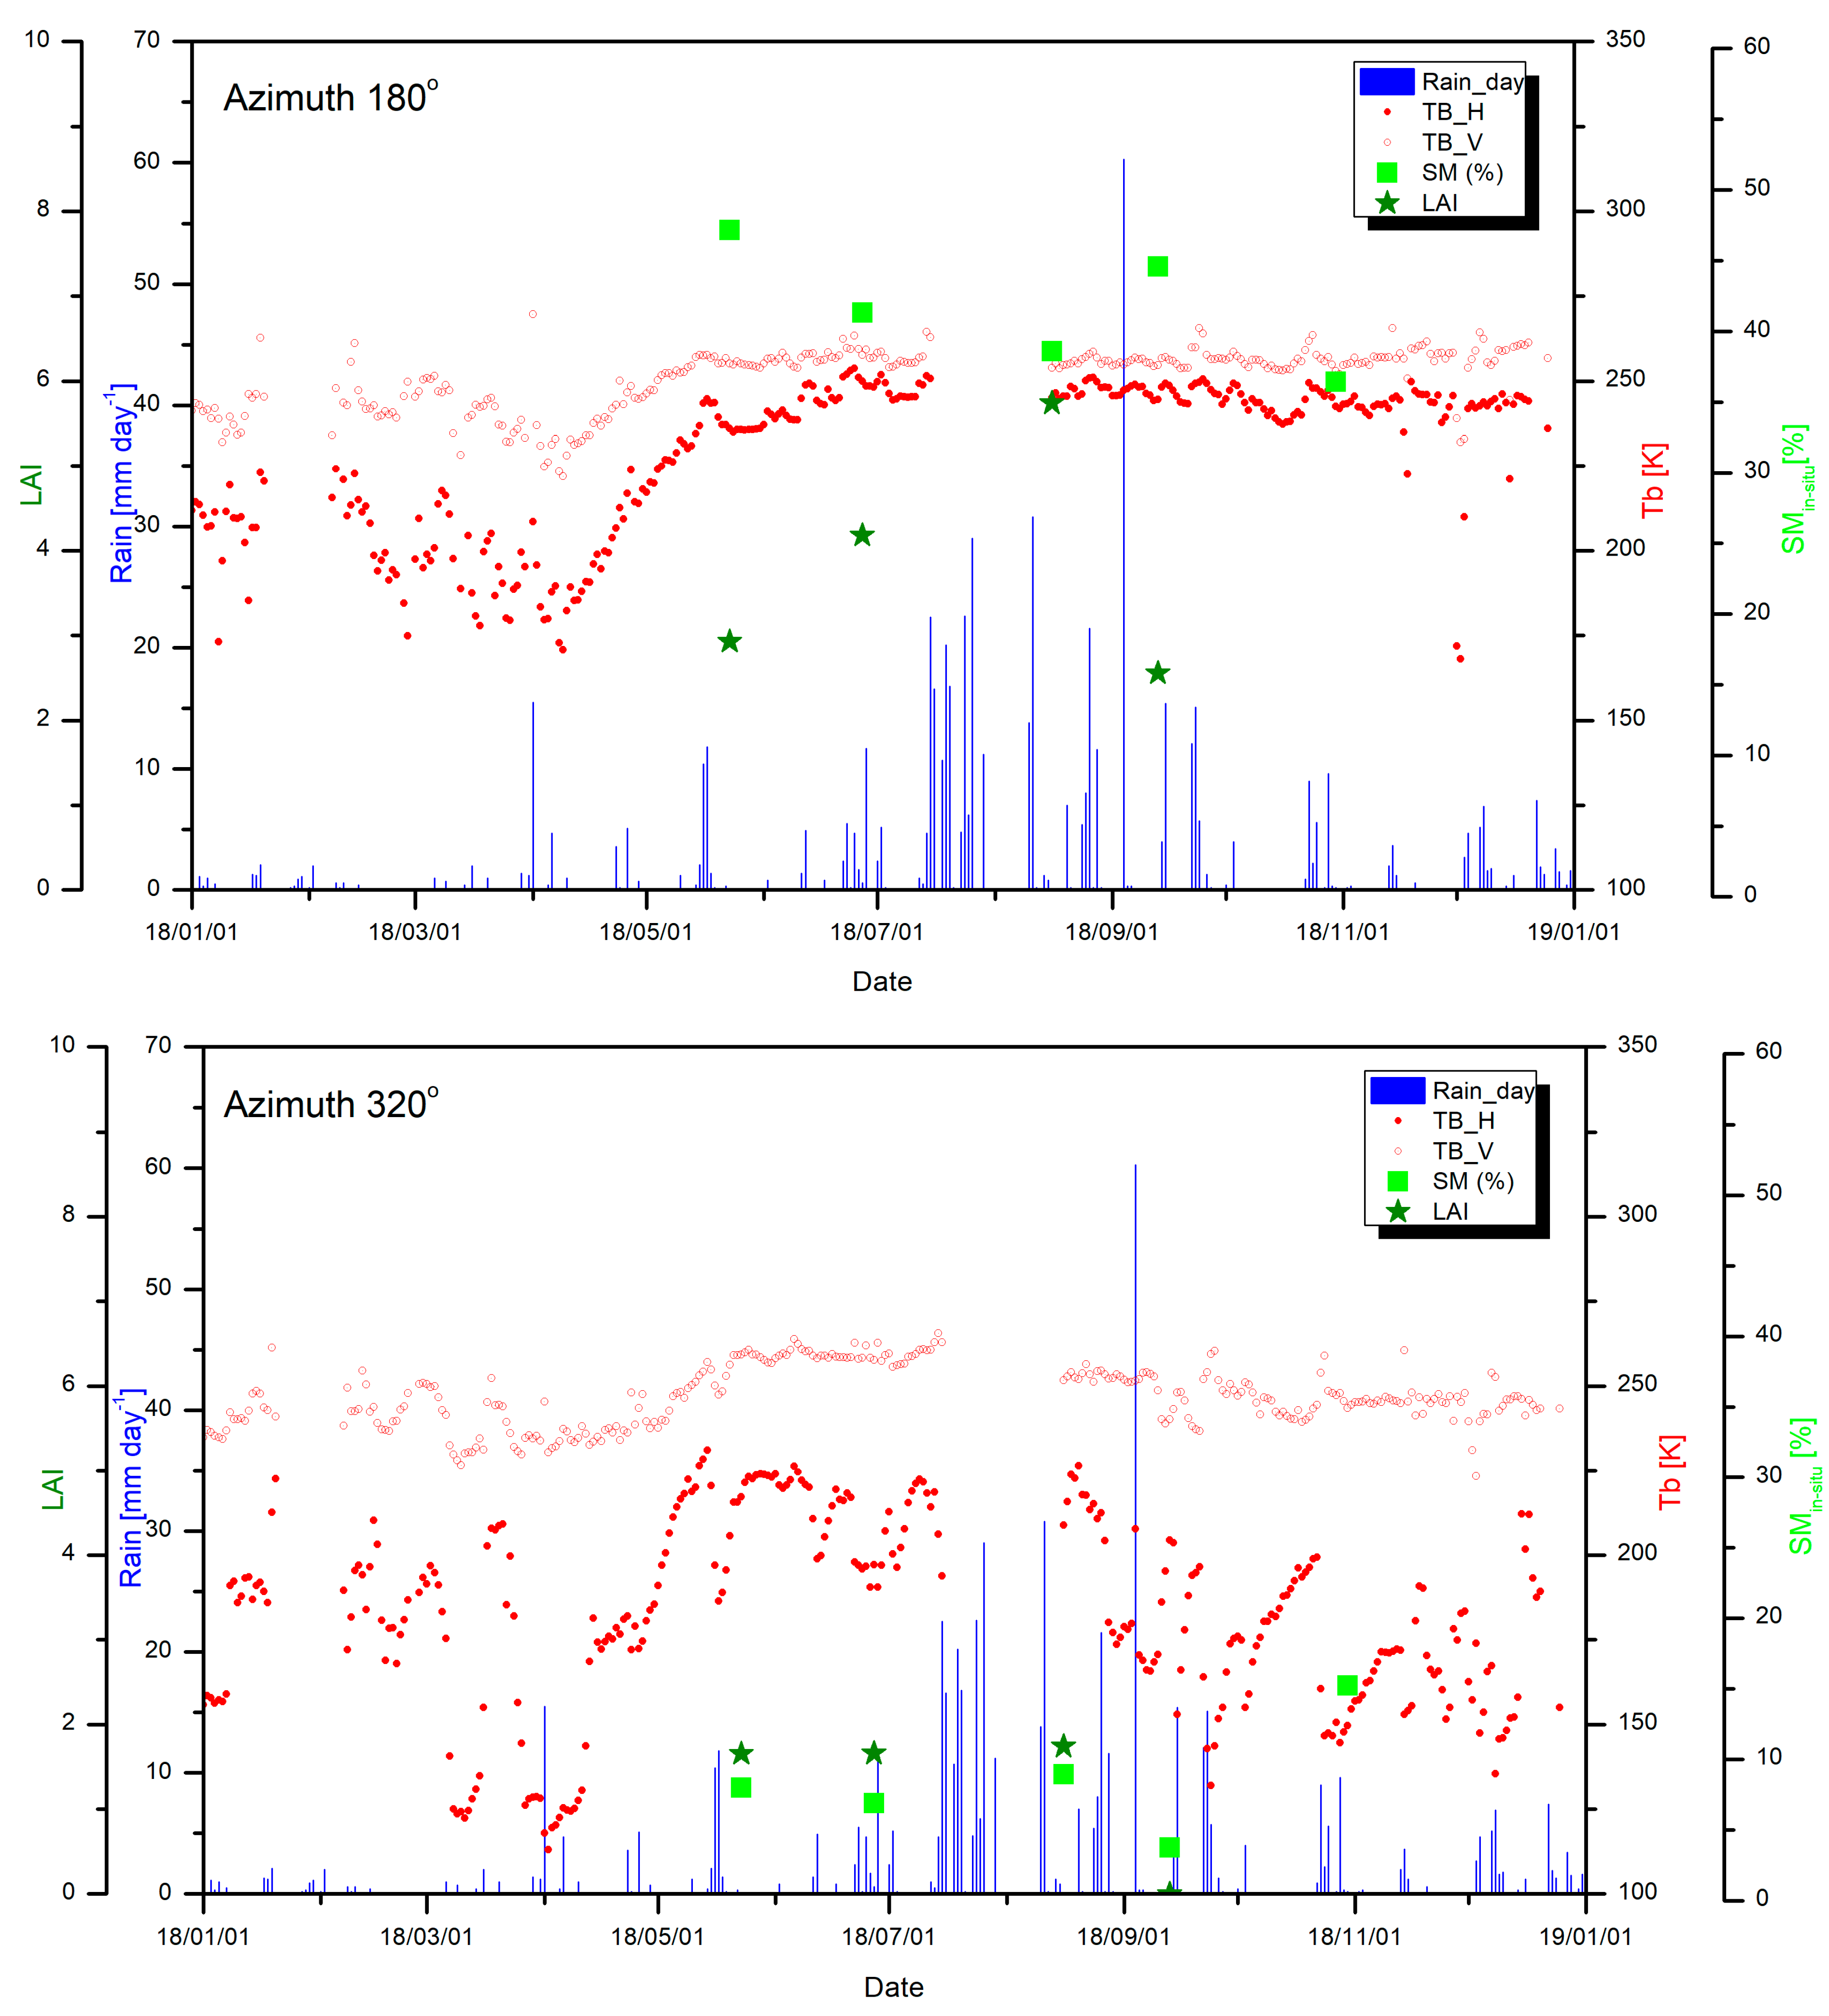
The brightness temperatures registered using ELBARA in 2018 included 6992, 6232, 6956, and 6204 total measurements for the specific azimuths 30°, 90°, 180°, and 320°, respectively. Since four measurements were realised per day for each azimuth, for the further data evaluation, the data were arranged in a daily manner using mean values as the results. ELBARA retrievals for two polarisations, and for four analysed azimuths together with daily precipitation, and soil moisture together with Leaf Area Index (LAI) assessed during the measuring campaigns are shown in Figure 3. In 2018, there were two significant data gaps in the periods 21 January 2018–6 February 2018 and 16 July 2018–15 August 2018, both as a result of maintaining works.

2.3. In Situ Measurements at the Bubnów-Sęków Test Site

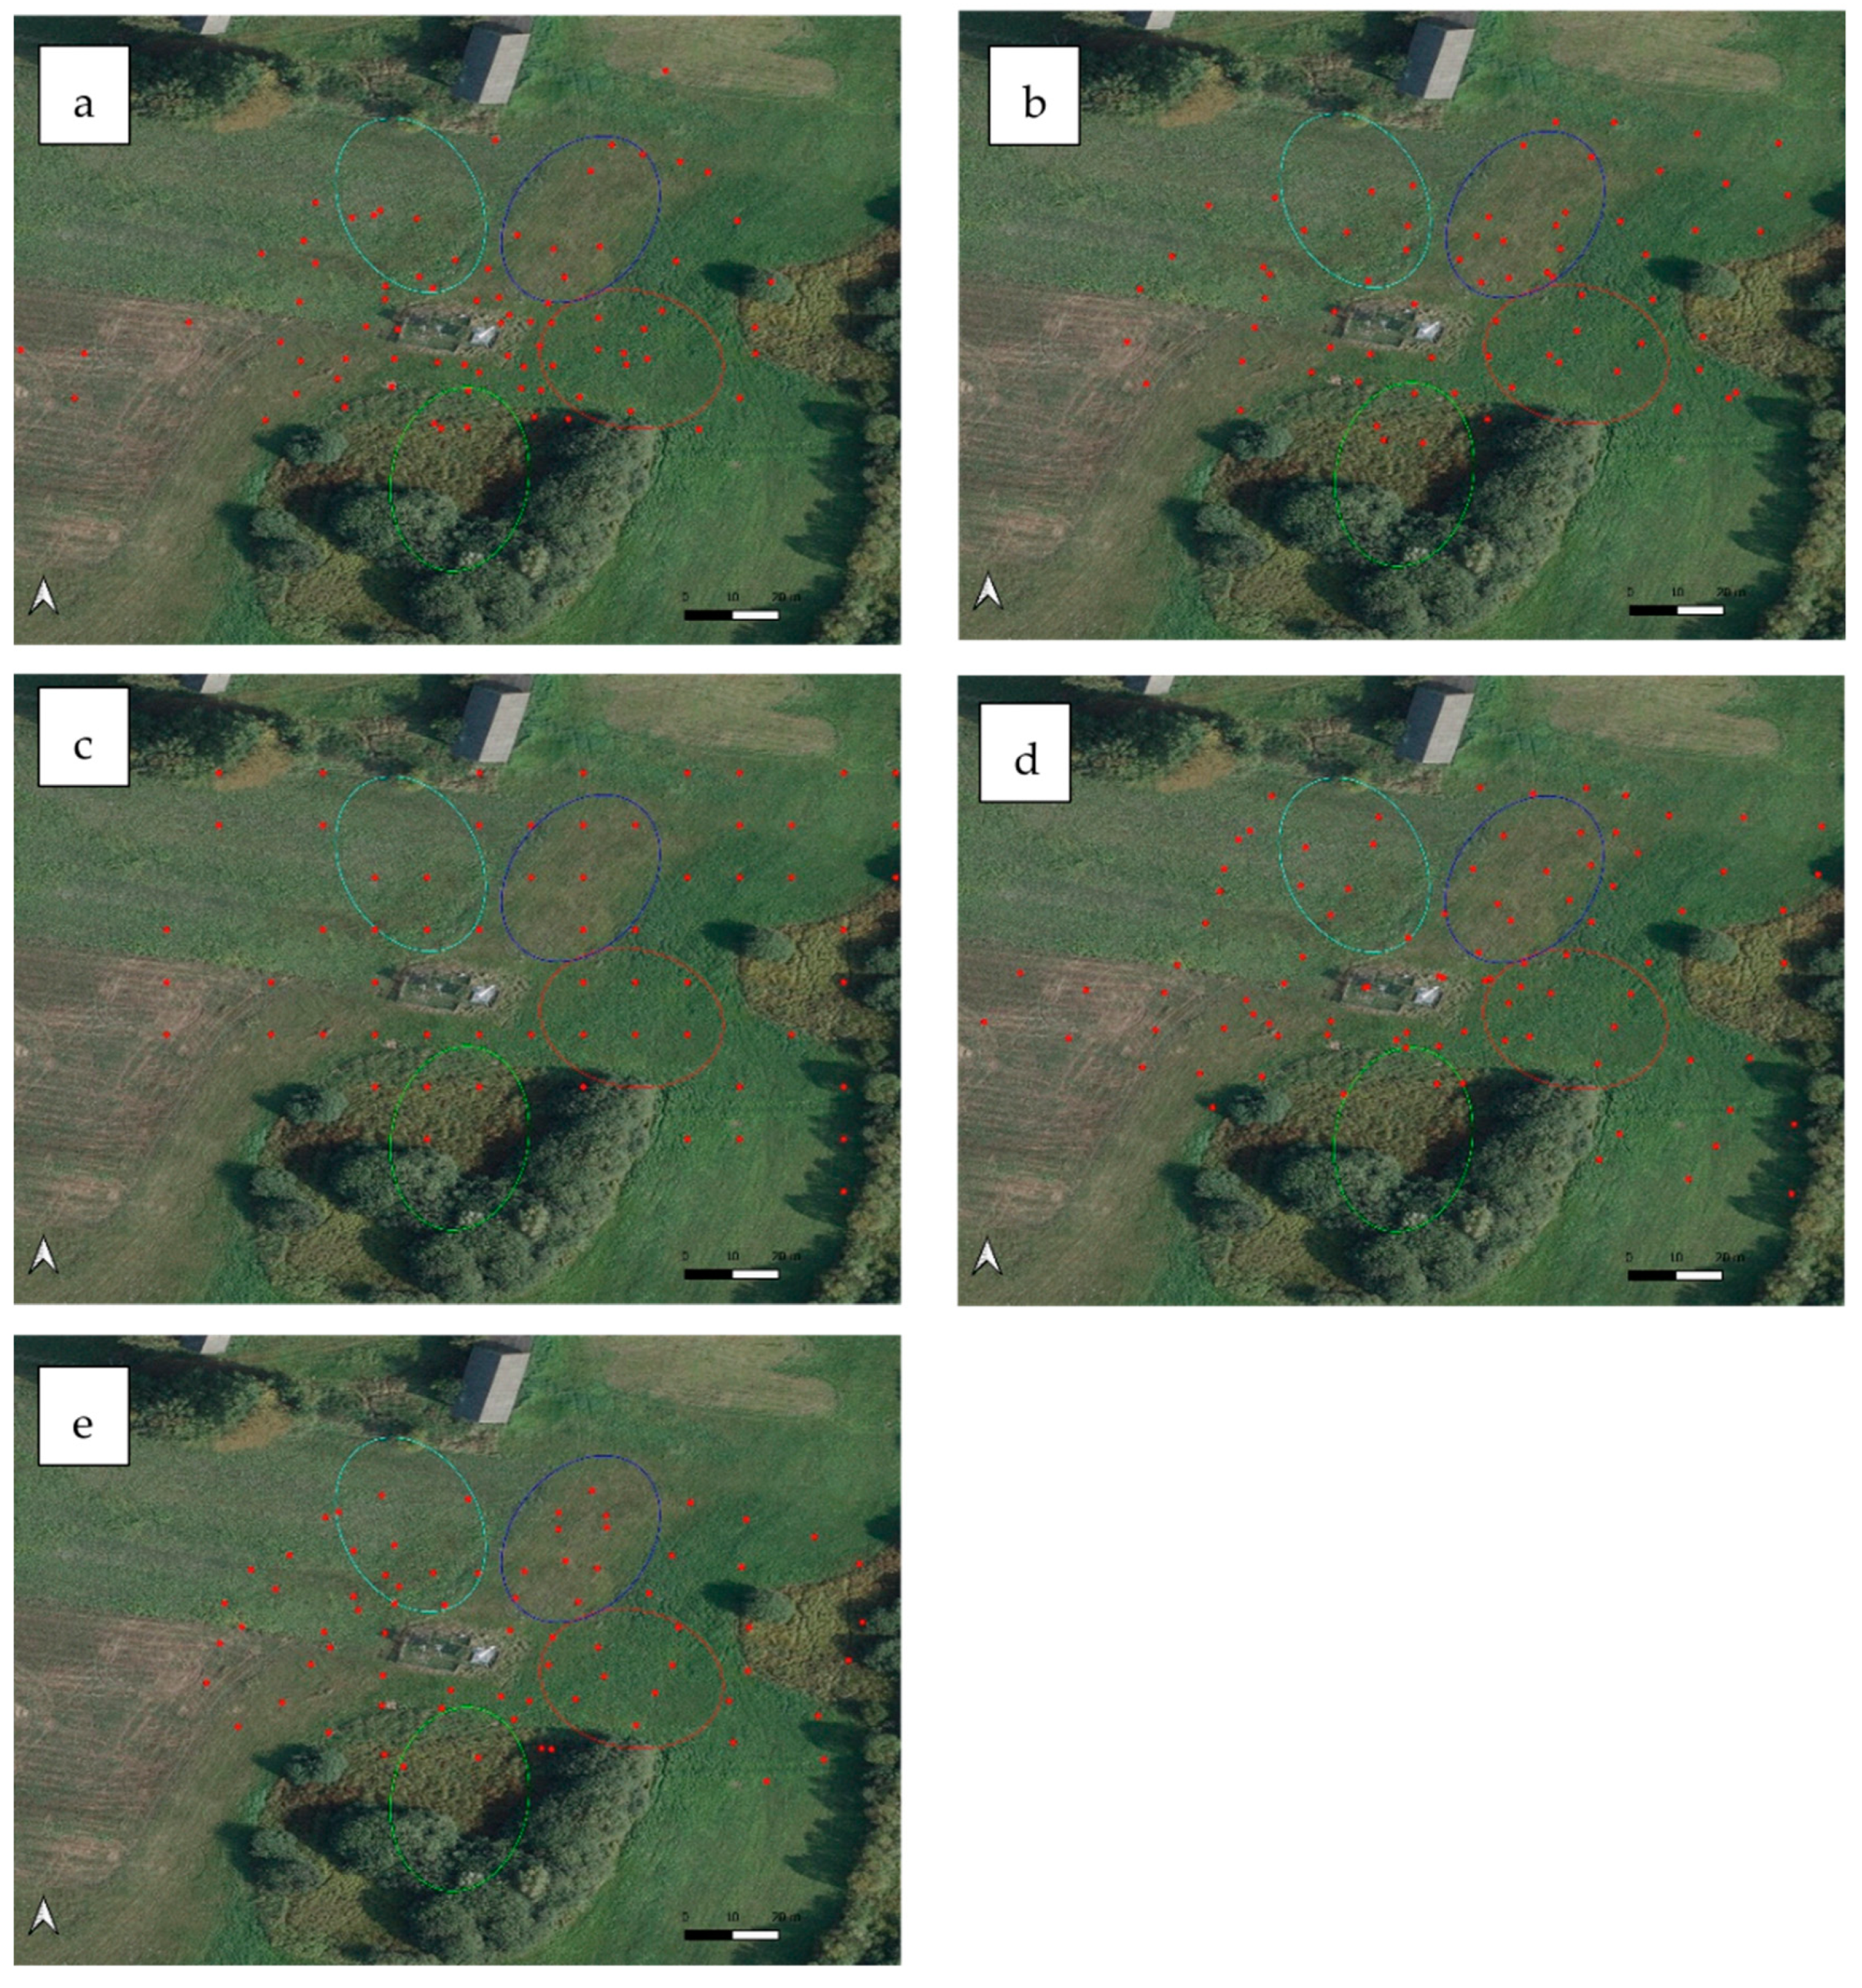
For the purpose of ELBARA calibration, five in situ measurement campaigns in the area around the ELBARA instrument were realised in 2018. Moreover, 4, 2, and 1 campaigns were realised in 2019, 2020, and 2021, respectively. During the in situ measurements, the soil moisture at three depths of 5, 10, and 17 cm was registered using TDR probes. Also, the soil surface temperature was assessed using a probe installed on the FOM/mts instrument, and Leaf Area Index (LAI) was assessed using a LI-COR manufactured instrument. The arrangement of the point measurements in the five measurement campaigns in 2018 is presented in Figure 4. Soil moisture, soil surface temperature, and LAI for the specific footprint and date were extracted from the point measurements registered during the in situ campaigns. The extraction was carried out by averaging the point measurements covered by the polygons, representing a specific ELBARA footprint presented in Figure 2.

2.4. τ-ω Model for ELBARA Tb Parametrisation

The ELBARA brightness temperature retrievals for a specific polarisation (p = H or V) mostly depend on the soil roughness and canopy cover. According to L-MEB, the microwave emission of the soil surface expressed as a brightness temperature (Tb) can be evaluated using the τ-ω model [30] using the following equation:
T b p s i m = 1 ω p 1 γ p ( θ ) 1 + γ p ( θ ) · r p ( θ ) · t c + ( 1 r p ( θ ) ) · γ p ( θ ) · t s
where ω is the effective scattering albedo for polarisation p (p = H, V), γp represents the vegetation attenuation depending on the specific measuring angle θ, rp(θ) is the soil surface reflectivity depending on the measuring angle θ and for specific polarisation p (p = H, V), and tc and ts are canopy and soil surface temperature, respectively.
The rp reflectivity depends on two roughness parameters Hr and Nr according to the equation:
r p ( θ ) = r p * ( θ ) · e H r · c o s N r ( θ )
where r p * ( θ ) for specific polarisation (p = H, V) is assessed with the following Fresnel equations:
r H * = c o s θ ε s i n 2 ( θ ) c o s θ + ε s i n 2 ( θ ) 2
r V * = ε · c o s θ ε s i n 2 ( θ ) ε · c o s θ + ε s i n 2 ( θ ) 2
where ε represents a real component of the dielectric constant for a specific frequency calculated using the dielectric mixing model proposed by Mironov [33]. For ε calculations, reference measurements including soil moisture (SMref), soil temperature (ts,ref), and clay content (CC) are needed. In the present study, the reference values were obtained from the in situ measurements carried out during the 2018 campaigns.
The vegetation attenuation coefficient γp(θ) according to the Beer’s law could be expressed as a function of vegetation optical depth τ as follows:
γ p θ = e τ p c o s ( θ )
The evaluation was performed for the elevation angle of 75°, and four characteristic azimuths (presented in Figure 2), 30°, 90°, 180°, and 320°, represent the four different soil properties and land coverage, as described in Table 1.
Using the reference values of soil moisture (SMref) and soil temperature (ts,ref) measured during the measuring campaigns in 2018, as well as the clay content assessed for the test site [29], Equation (1) was evaluated for four specific azimuths relating to two polarisations. The evaluation included the first step iteration of four coefficients, ω, τ, Hr, and Nr, in the following ranges and steps: ω (range: 0.05–0.8, step: 0.05), τ (range: 0.1–1, step: 0.01), Hr (range: 0.1–0.8, step: 0.1), and Nr (range: 0.1–0.8, step: 0.1). The aim of the calculation was to find the set of coefficients (ωp,i,fp, τp,i,fp, Hrp,i,fp, and Nrp,i,fp) resulting in the most compatible values of T b p , i , f p s i m and T b p , i , f p m e a s for a specific date, i, meeting the condition min ω , τ , Hr , Nr T b p , i , f p s i m T b p , i , f p m e a s . Taking into account that the land use does not change in time at the analysed test site, the second step of the study was focused on the characterisation of the effective scattering albedo, ω, and vegetation optical depth, τ. For that purpose, coefficients Hr and Nr were fixed (based on the results from the first evaluation), and the second evaluation of T b p s i m was realised with iteration of ω and τ only (using unchanged ranges and steps). At this time, the condition min ω , τ T b p , i , f p s i m T b p , i , f p m e a s was applied as well. Based on the obtained results, the time-dependent reference coefficient— ω p , i , f p r e f , τ p , i , f p r e f —and constant-in-time coefficients Hrref and Nrref were established for two polarisations (p = H,V), and the particular analysed ELBARA footprint (fp = 30°, 90°, 180°, and 320°) represented specific land cover conditions.

2.5. Soil Moisture Retrievals Using an ELBARA Tb

The set of the reference coefficients ( ω p , i , f p r e f , τ p , i , f p r e f , Hrref, and Nrref) was used for the assessment of soil moisture retrievals for dates, i, using ELBARA brightness temperature measurements collected in 2018 and 2019. The SM values were calculated using an inversion of the Mironov model [34] by an estimation of the real part of the soil dielectric constant for a particular date, i, specific polarisation, p, and footprint, fp, meeting the condition min ε T b p , i , f p s i m ω p , i , f p r e f , τ p , i , f p r e f , H r p , f p r e f , N r p , f p r e f T b p , i , f p m e a s . The minimisation was realised for epsilon in the range from 3 to 70, corresponding approximately to soil moisture values in the range of 0.01–0.86 m3m−3.

3. Results and Discussion

Using Equation (1), simulated values of brightness temperatures Tbsim were evaluated. During the calculation, the coefficients ω, τ, Hr, and Nr were sampled in fixed ranges, and values that met the minimisation condition were selected. For each set of the coefficients, the mean values in time were also calculated. Based on the mean values for Hr and Nr, and taking into account that the land use in the considered area is stable, the constant values for H r r e f and N r r e f were fixed to 0.45 for all azimuths.
In this study, the assumption that the land use of the investigated area is stable during the consecutive years was made, which is a good approximation, based on the knowledge gained during the over-ten-year-long experiment at the test site. The mean values of the Hr and Nr parameters for all the periods, two polarisations, and all the investigated azimuths were 0.47 and 0.44, respectively. Fernandez-Moran [31] presented the global values of Hr at the level of 0.4 for cropland and 0.5 for grassland, and these values are in good agreement with the presented results.
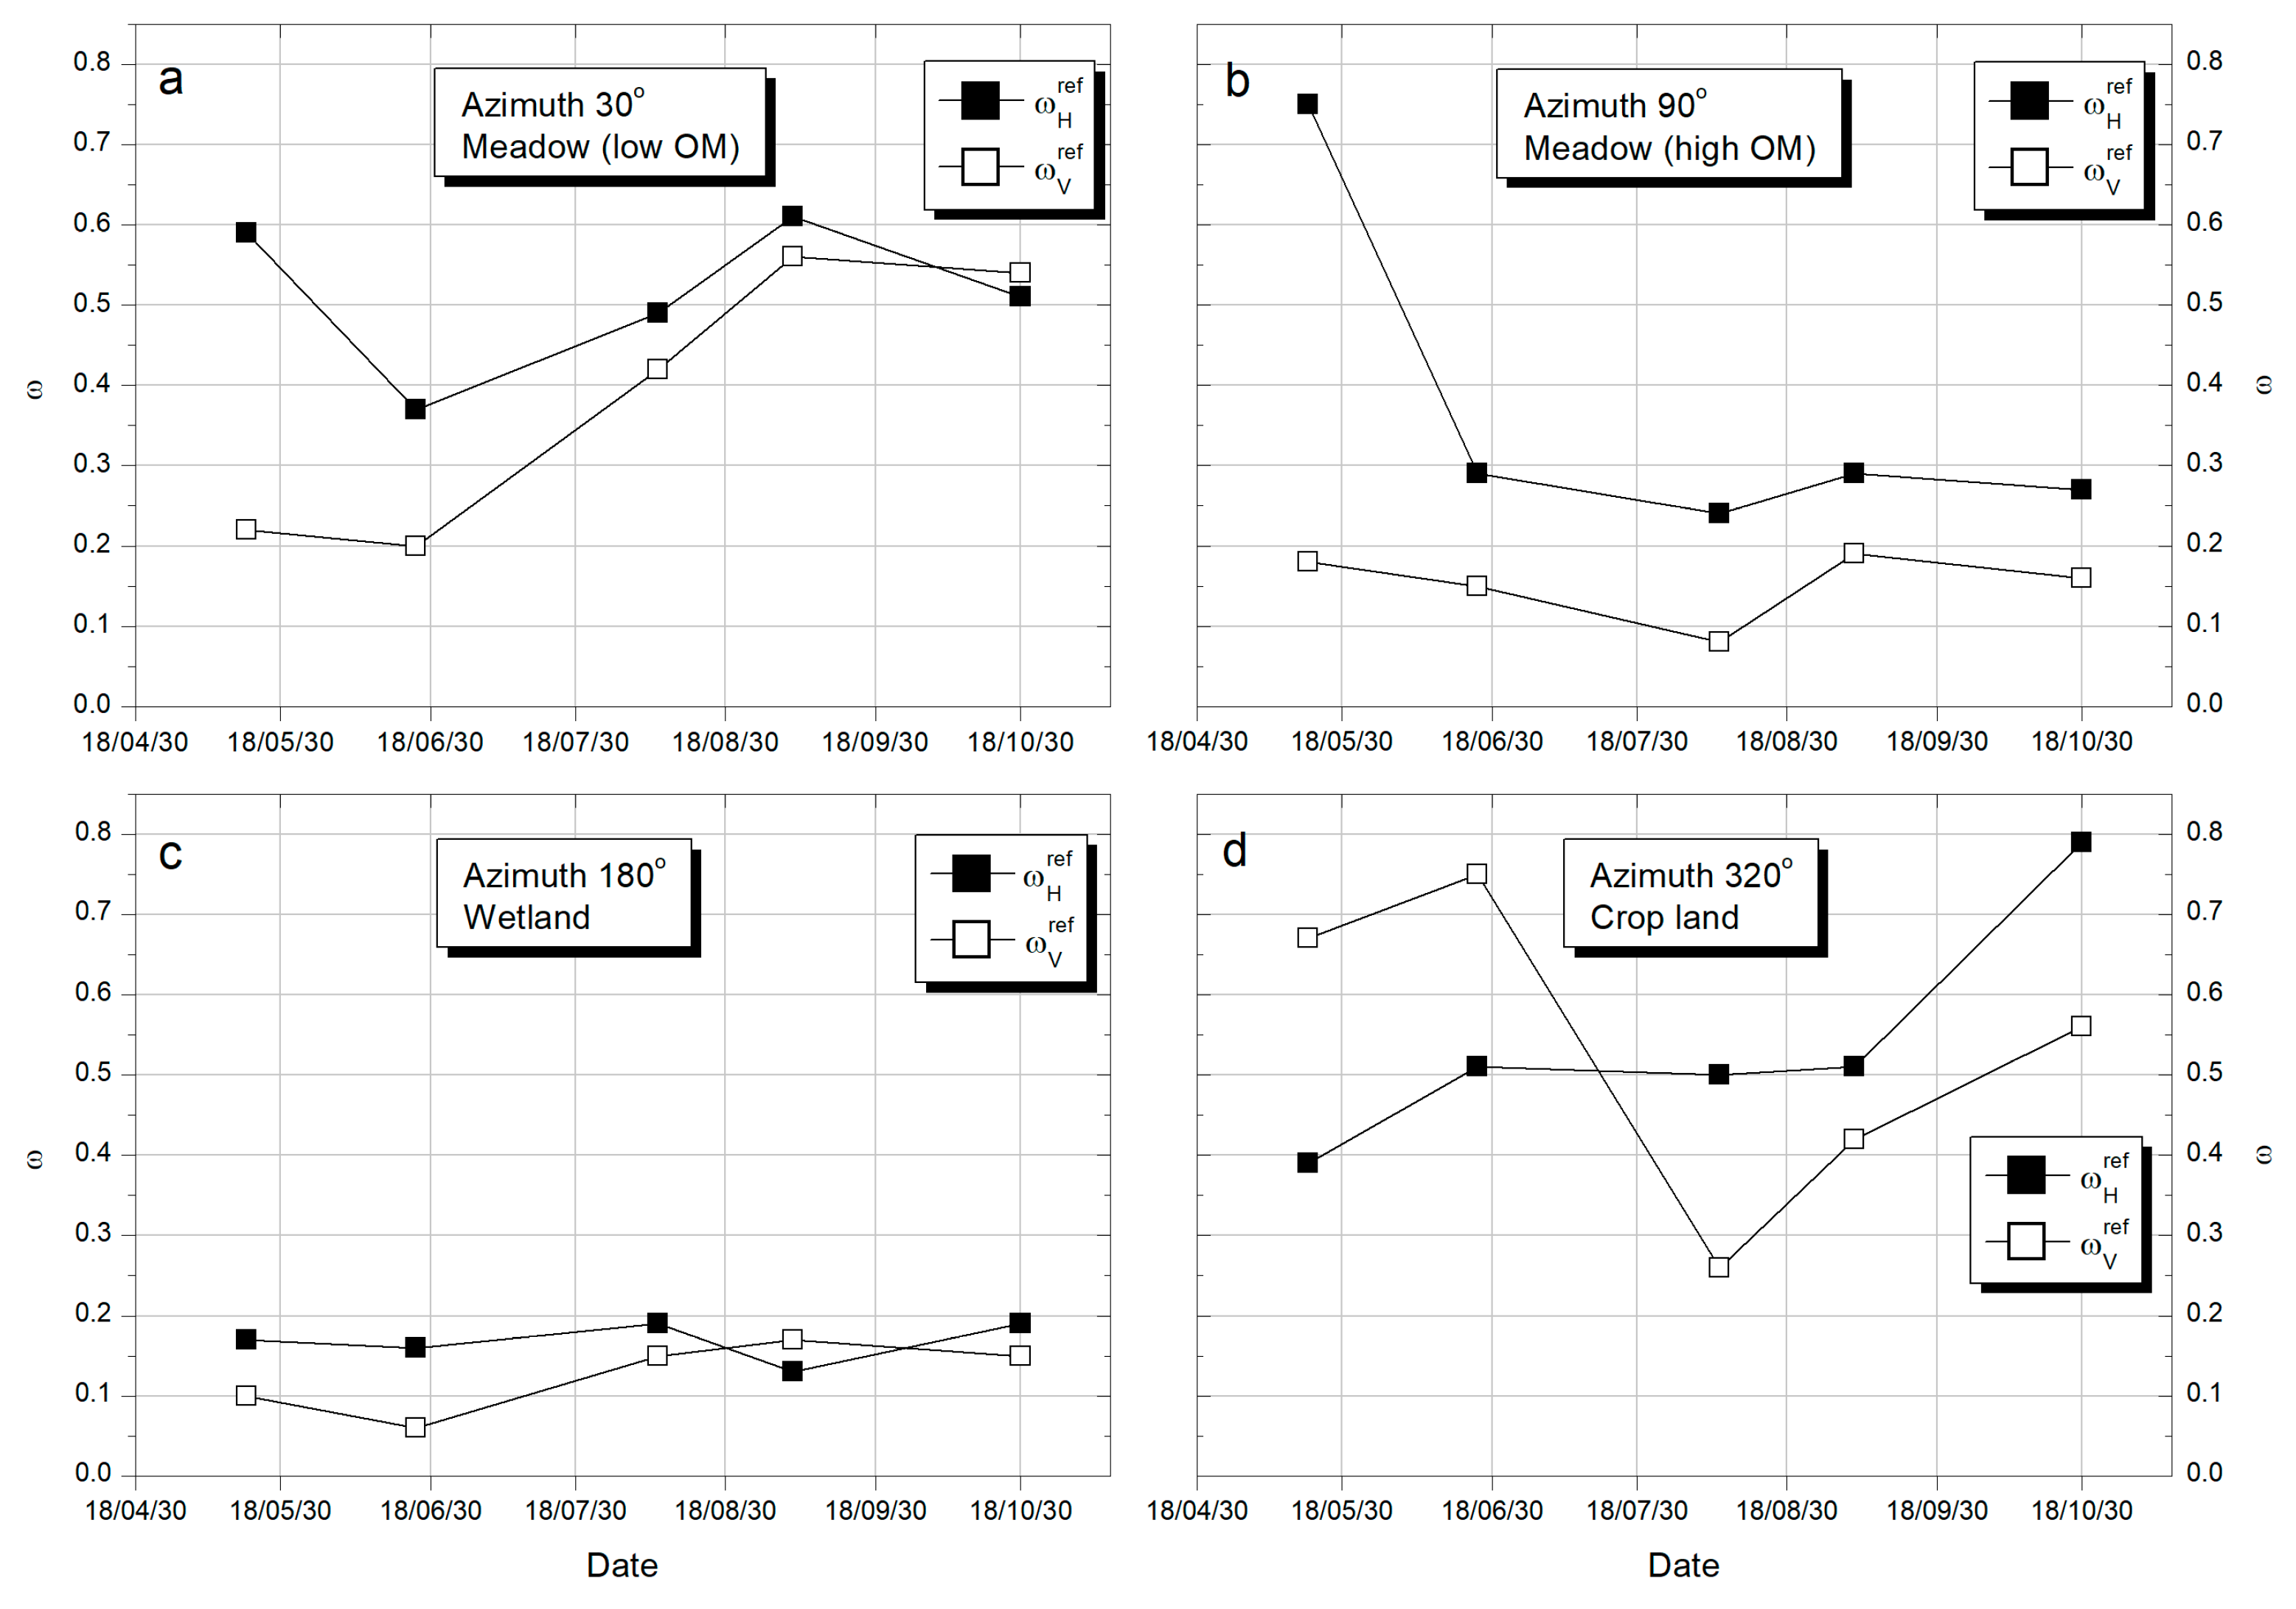
Consequently, as a result of the second evaluation of Equation (1) with fixed H r r e f and N r r e f , the coefficient matrix with the time-dependent ω p , i , f p r e f and τ p , i , f p r e f coefficients was obtained, as presented in Figure 5 and Figure 6, respectively, separately for each azimuth. The correlation coefficient for the simulated and measured brightness temperatures for all cases was not less than 0.998. The most stable ω p r e f values for both polarisations were obtained for azimuth 180°, where the wetland was presented as a land cover type. For that azimuth, the standard deviation of ω p r e f was equal to 0.01 for both polarisations. Simultaneously, the highest standard deviation equal to 0.18 was found for ω p r e f estimated for H-polarisation Tb registered at azimuth 90°, where the meadow with high organic matter was present.
The reference coefficients were assessed for five dates in 2018 when the in situ measurements were made. For the purpose of soil moisture evaluation, the year was divided into six periods based on these dates, for which specific reference coefficients were applied for the future validation assessment in 2019, as shown in Table 2.
Based on the assumption that the roughness parameters Hr and Nr were stable during the year, which was also taken into account in the literature [24,35,36], the present study was focused on finding the time dependence of the effective scattering albedo (ω) and optical depth (τ) coefficients for each specific investigated azimuth around the ELBARA instrument, representing different land cover types. The values of omega and tau presented in the literature are mostly investigated in the global context [32], and are assumed to be constant in time [37] for each specific land unit. In our research, we found that assuming constant roughness of the soil, with the timely fluctuation of ω and τ depending on the land cover, is the most reasonable approach. This fluctuation for specific polarisations depends on both the land cover and the soil properties. The mean annual values of ω, including two polarisations, were 0.45, 0.26, 0.14, and 0.54 for the meadow with lower organic matter, the meadow with higher organic matter, the wetland, and the cropland, respectively. The highest fluctuation of ω was noted for the meadow at azimuth 90° and for the H-polarisation. The meadow at that direction was characterised by soil with a high variation in the organic matter content at the mean level of 25%. The organic matter content in the soil in Bubnów-Sęków was previously indicated to be an important factor of the fluctuation in soil moisture estimation based on L-band surface emission [29]. On the other hand, the most stable values of the ω coefficient during the year were observed for the wetland at the azimuth 180°.
The values of τ reported in the literature vary generally in the range 0–0.6 for cropland and grassland [38,39], reaching values of 0.9 for forest [40]. In the present study, the maximum variation of optical depth depending on the period of the year was obtained for the meadows, where the difference between the maximum and minimum values reached 0.9 (azimuth 90°, H polarisation). The mean annual values of τ were in the range from 0.30 to 0.80 for the cropland, from 0.40 to 0.52 for the meadows (including the two investigated meadows), and from 0.60 to 0.70 for the wetland. Taking into account that the results include two polarisations, the obtained values are in good agreement with the global scale results.
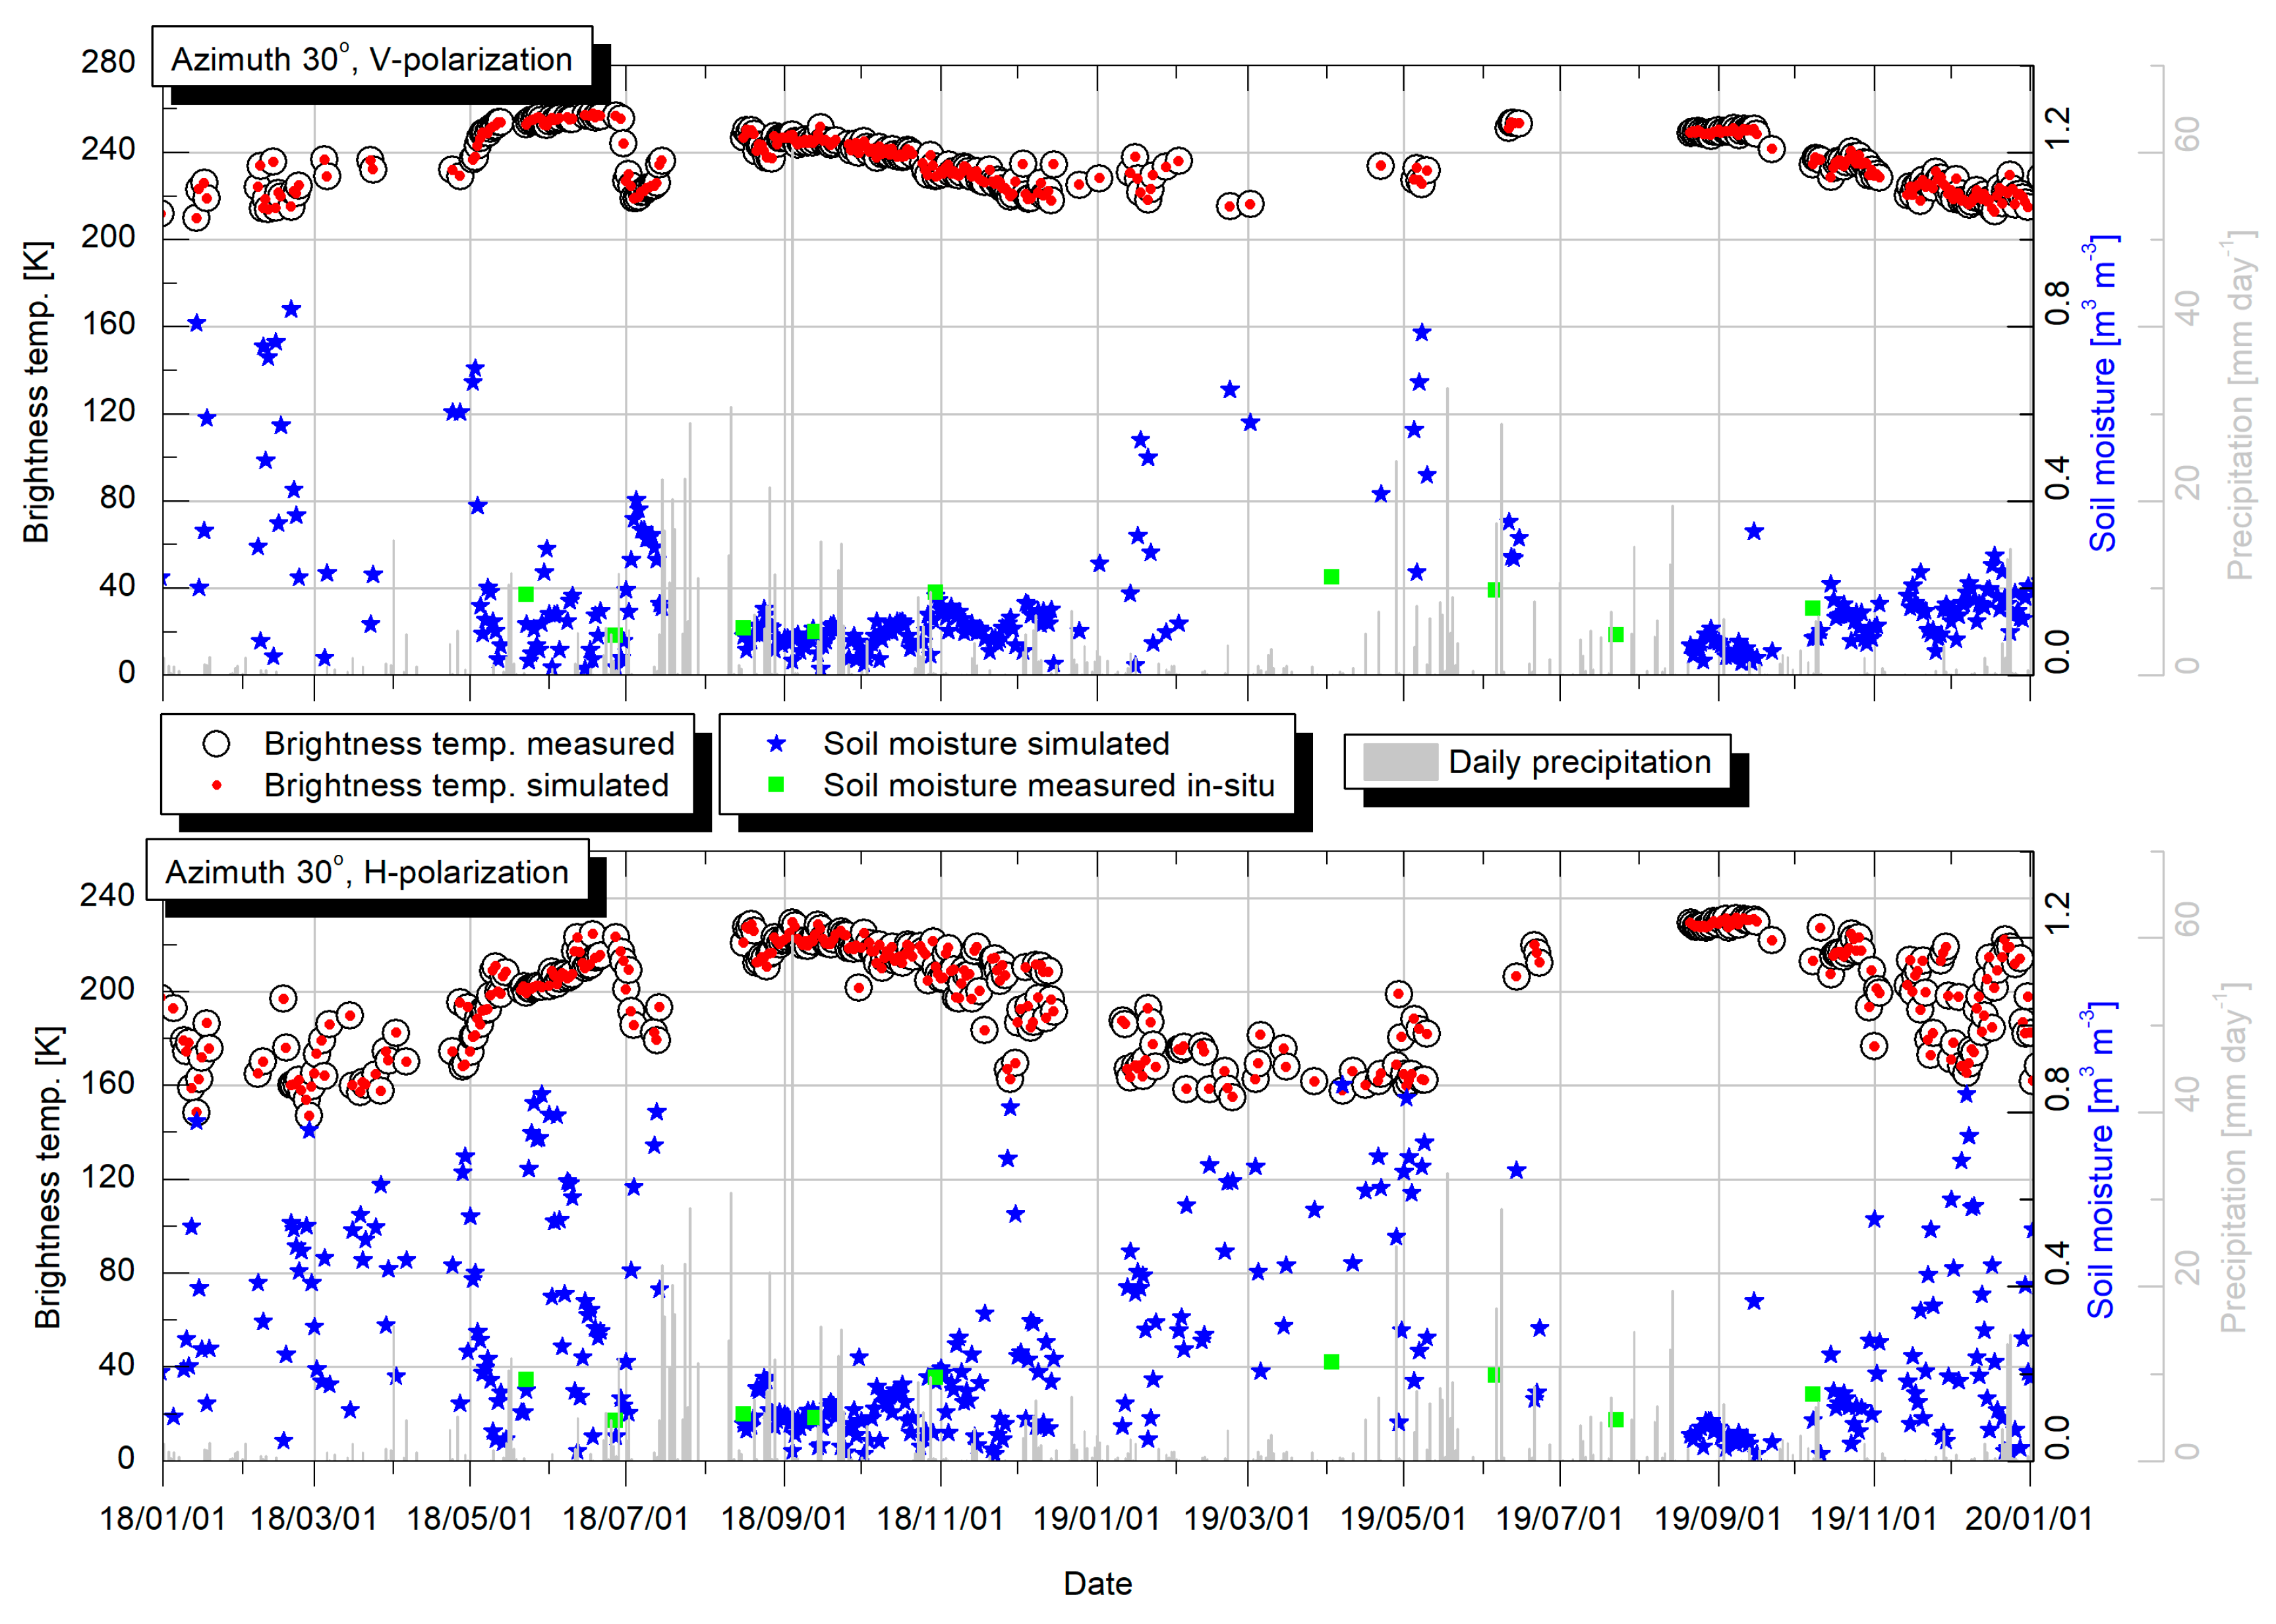
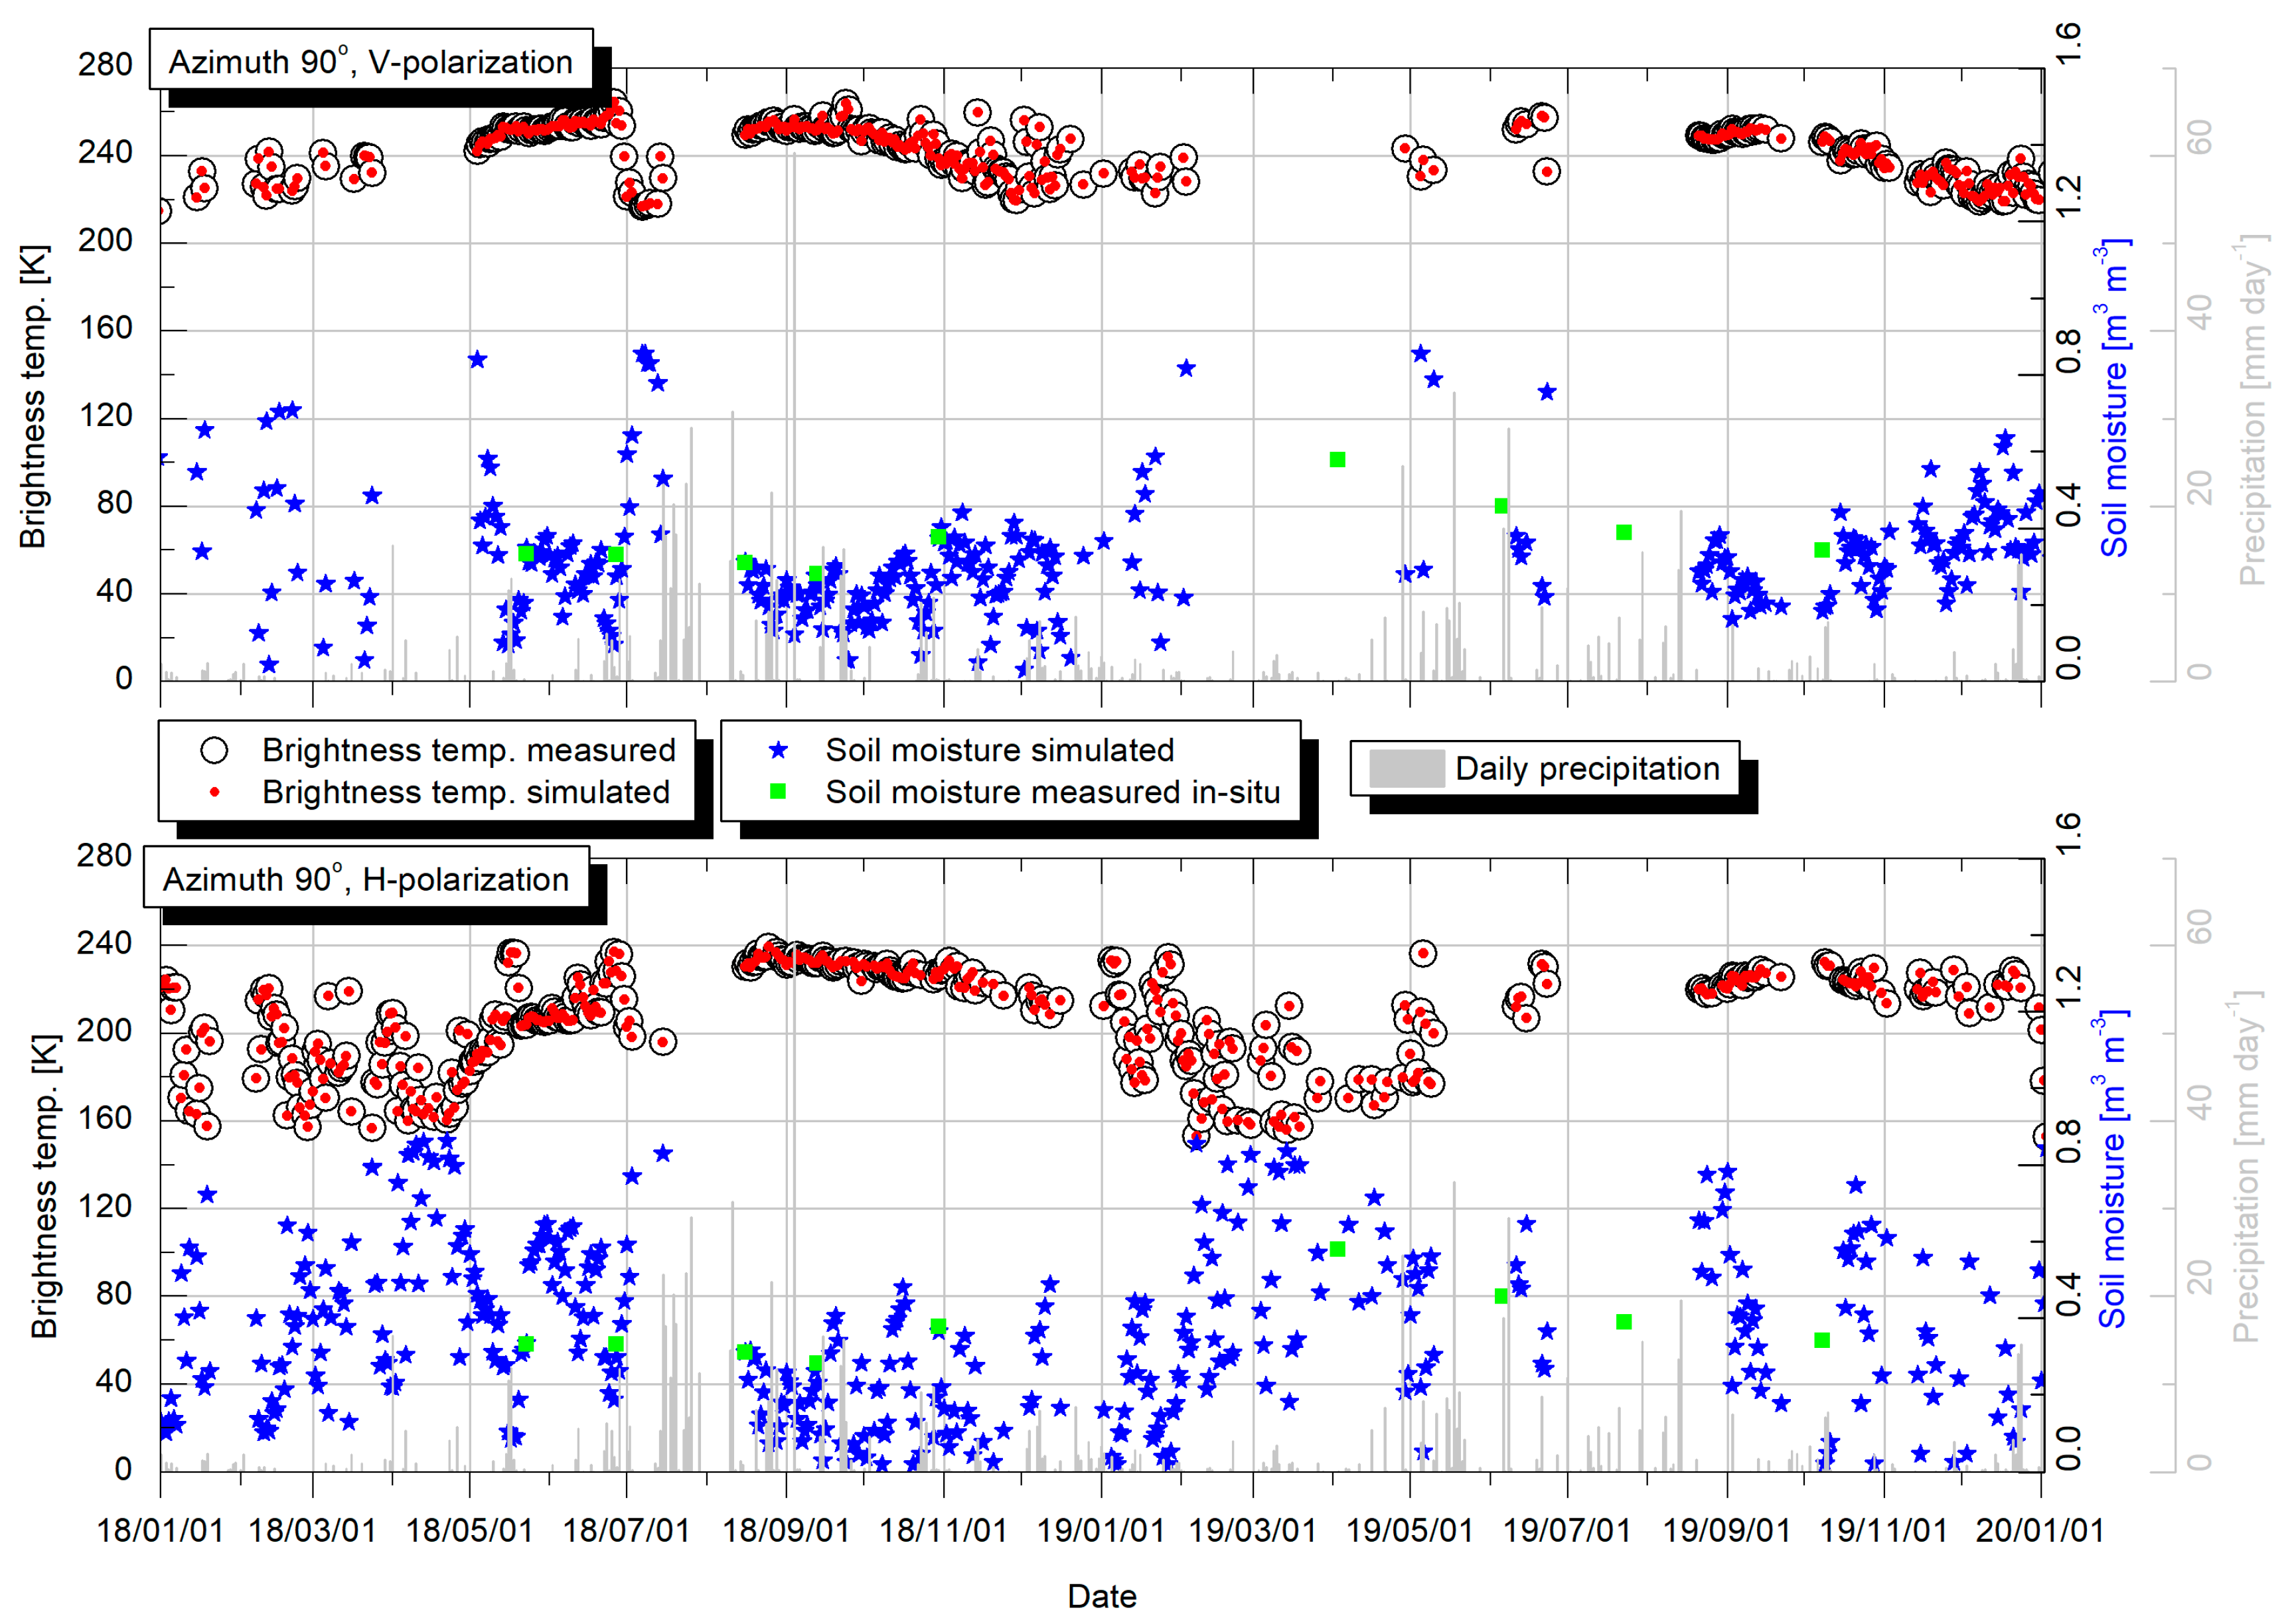
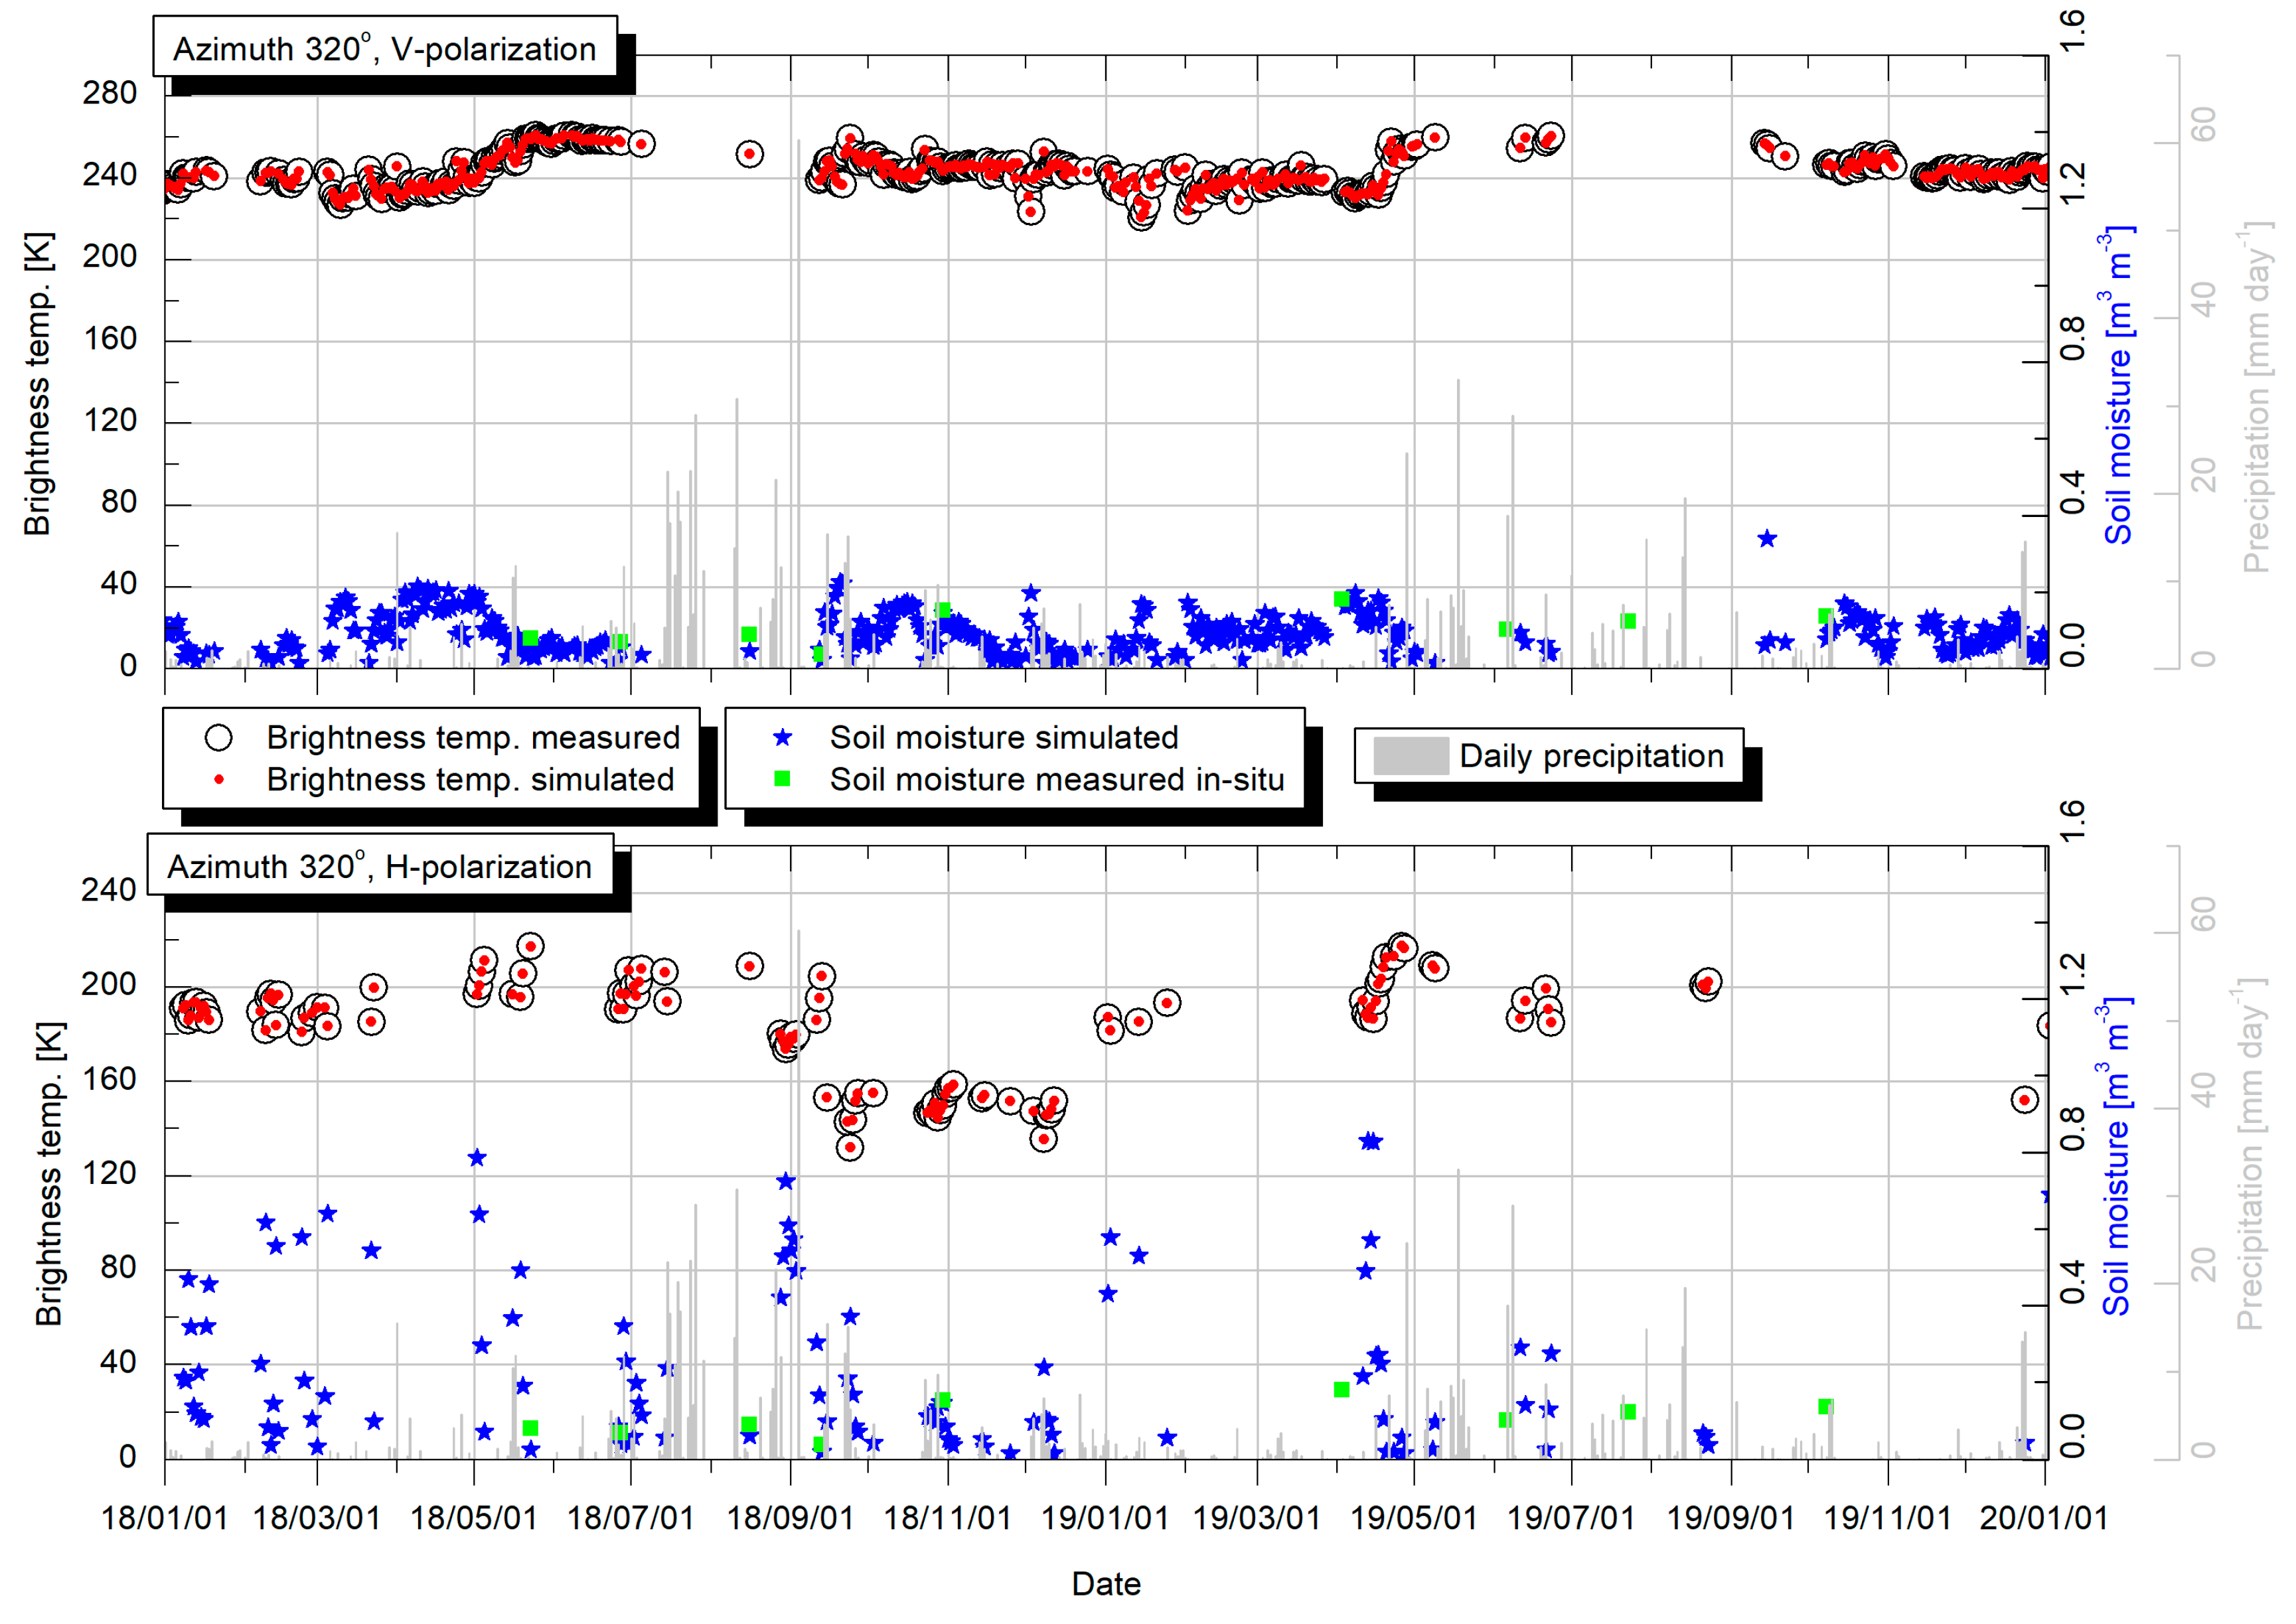
By incorporation of the set of reference coefficients, soil moisture values for each specific azimuth in 2018–2019 were calculated based on ELBARA retrievals for two polarisations, and are presented in Figure 7, Figure 8, Figure 9 and Figure 10. The SM values were combined with the in situ measurements results, precipitation, and values of Tb at two polarisations registered using the ELBARA radiometer. For each azimuth, periods with missing data were observed. Two sources of missing data were identified. The first was related to the lack of recording of brightness temperatures using the ELBARA instrument for a specific date and azimuth due to the incorrect operation of the instrument. The second source was associated with the minimisation process, and corresponded to the instance when the estimated epsilon reached the lower or higher limit (3 and 70), i.e., there was no correlation between the simulated and measured Tb values. The largest numbers of uncorrelated instances were registered for data assessed for azimuth 320° at the H polarisation. As observed in Figure 7, Figure 8, Figure 9 and Figure 10, less variation was observed for Tb retrievals at V polarization. At azimuth 180°, where the permanent wetland is present, the most Tb data for H polarization were excluded in results of uncorrelation effect in result of present of dense plant cover on that azimuth during the year. At the same time, much less data were rejected for V polarization. However, the most Tb measurement data were lost for the H polarization in the 320°direction. This area included an arable field where agrotechnical treatments were carried out and grain was grown in the investigated period. Although it is necessary to carry out additional statistical tests, Figure 7, Figure 8, Figure 9 and Figure 10 clearly show that the convergence of soil moisture values determined from brightness temperature data with in situ measurement data is strongly dependent on the direction of observation and, consequently, on the land cover that exists in a given area. This is particularly visible when comparing the results of simulated soil moisture for the cultivated area (azimuth 320°) with the other directions. It is clearly visible that the results for the area under cultivation are much more stable and have a lower dispersion throughout the year.

4. Conclusions

Most of the recent studies in the literature focused on investigations of land parameters of the radiative transfer model in the global context, and the parametrisation of specific areas at the field (medium) spatial scale is still under research. Investigations on the medium spatial scale give a possibility to perform research in a better monitored environment and, in particular, bridge the gap between point and satellite measurements. The present study was aimed to provide data and new knowledge on the ω-τ model parametrisation for three specific land cover types, i.e., meadow, wetland, and cropland. The results show that, in the case of medium-scale assessment of soil moisture, the time-dependent coefficient of effective scattering albedo and vegetation optical depth are desired, as this dependence plays a significant role in the final results. Because of the lack of the input data on the in situ measurements of soil moisture in the consecutive years, only four measuring campaigns in 2019 and the measuring gaps in Tb retrievals, the simulated results of soil moisture could not be quantifiably compared with in situ values, and this issue should be addressed in future research. The possibility to investigate the time dependence is provided by the use of the L-band passive radiometer ELBARA instrument installed at the Bubnów-Sęków test site in the east of Poland. At the present stage of research, the instrumentation and methodology for future work have been established. In the next step, additional in situ measurements will be carried out to fulfil the gap in the in situ soil moisture data, and the results with extended statistical examination of the data will be presented. The first comparisons with soil moisture data from remote sensing provided by the Sentinel-1 platform are currently being prepared and will be presented separately.

Author Contributions

K.S. prepared the research concept, made a main analysis, carried out the overall design of the article, wrote the main text, and prepared figures; M.Ł. collected and analysed part of the data and made manuscript revisions. All authors have read and agreed to the published version of the manuscript.

Funding

This research was partially funded in the framework of the 21GRD08 SoMMet project (2022–2025). The project 21GRD08 SoMMet has received funding from the European Partnership on Metrology, co-financed by the European Union’s Horizon Europe Research and Innovation Programme and by the Participating States.

Data Availability Statement

The datasets used and/or analysed during the current study are available from the corresponding author on reasonable request.

Conflicts of Interest

The authors declare no conflict of interest.

References

  1. Jiang, J.; Zhou, T. Agricultural drought over water-scarce Central Asia aggravated by internal climate variability. Nat. Geosci. 2023, 16, 154–161. [Google Scholar] [CrossRef]
  2. Boken, V. Agricultural Drought and Its Monitoring and Prediction: Some Concepts. In Monitoring and Predicting Agricultural Drought: A Global Study; Oxford Academic: New York, NY, USA, 2005. [Google Scholar] [CrossRef]
  3. Rojas, O. Agricultural extreme drought assessment at global level using the FAO-Agricultural Stress Index System (ASIS). Weather Clim. Extrem. 2020, 27, 100184. [Google Scholar] [CrossRef]
  4. de Oliveira, A.C.; Marini, N.; Farias, D.R. Climate Change: New Breeding Pressures and Goals. In Encyclopedia of Agriculture and Food Systems; Van Alfen, N.K., Ed.; Academic Press: Cambridge, MA, USA, 2014; pp. 284–293. ISBN 9780080931395. [Google Scholar] [CrossRef]
  5. Celik, M.F.; Isik, M.S.; Yuzugullu, O.; Fajraoui, N.; Erten, E. Soil Moisture Prediction from Remote Sensing Images Coupled with Climate, Soil Texture and Topography via Deep Learning. Remote Sens. 2022, 14, 5584. [Google Scholar] [CrossRef]
  6. Vergopolan, N.; Chaney, N.W.; Pan, M.; Sheffield, J.; Beck, H.E.; Ferguson, C.R.; Torres-Rojas, L.; Sadri, S.; Wood, E.F. SMAP-HydroBlocks, a 30-m satellite-based soil moisture dataset for the conterminous US. Sci. Data 2021, 8, 264. [Google Scholar] [CrossRef] [PubMed]
  7. Skulovich, O.; Gentine, P. A Long-term Consistent Artificial Intelligence and Remote Sensing-based Soil Moisture Dataset. Sci. Data 2023, 10, 154. [Google Scholar] [CrossRef] [PubMed]
  8. Wigneron, J.-P.; Li, X.; Frappart, F.; Fan, L.; Al-Yaari, A.; De Lannoy, G.; Liu, X.; Wang, M.; Le Masson, E.; Moisy, C. SMOS-IC data record of soil moisture and L-VOD: Historical development, applications and perspectives. Remote Sens. Environ. 2021, 254, 112238. [Google Scholar] [CrossRef]
  9. Abowarda, A.S.; Bai, L.; Zhang, C.; Long, D.; Li, X.; Huang, Q.; Sun, Z. Generating surface soil moisture at 30 m spatial resolution using both data fusion and machine learning toward better water resources management at the field scale. Remote Sens. Environ. 2021, 255, 112301. [Google Scholar] [CrossRef]
  10. Babaeian, E.; Paheding, S.; Siddique, N.; Devabhaktuni, V.K.; Tuller, M. Estimation of root zone soil moisture from ground and remotely sensed soil information with multisensor data fusion and automated machine learning. Remote Sens. Environ. 2021, 260, 112434. [Google Scholar] [CrossRef]
  11. Huang, S.; Zhang, X.; Chen, N.; Ma, H.; Fu, P.; Dong, J.; Gu, X.; Nam, W.-H.; Xu, L.; Rab, G.; et al. A novel fusion method for generating surface soil moisture data with high accuracy, high spatial resolution, and high spatio-temporal continuity. Water Resour. Res. 2022, 58, e2021WR030827. [Google Scholar] [CrossRef]
  12. Reynolds, S.G. The gravimetric method of soil moisture determination Part I A study of equipment, and methodological problems. J. Hydrol. 1970, 11, 258–273. [Google Scholar] [CrossRef]
  13. He, H.; Aogu, K.; Li, M.; Xu, J.; Sheng, W.; Jones, S.B.; González-Teruel, J.D.; Robinson, D.A.; Horton, R.; Bristow, K.; et al. Chapter Three—A Review of Time Domain Reflectometry (TDR) Applications in Porous Media; Sparks, D.L., Ed.; Advances in Agronomy; Academic Press: Cambridge, MA, USA, 2021; Volume 168, pp. 83–155. ISBN 9780128245897. ISSN 0065-2113. [Google Scholar] [CrossRef]
  14. Skierucha, W.; Wilczek, A. A FDR Sensor for Measuring Complex Soil Dielectric Permittivity in the 10–500 MHz Frequency Range. Sensors 2010, 10, 3314–3329. [Google Scholar] [CrossRef]
  15. Loosvelt, L.; Pauwels, V.R.N.; Cornelis, W.M.; De Lannoy, G.J.M.; Verhoest, N.E.C. Impact of soil hydraulicparameter uncertainty on soil moisture modeling. Water Resour. Res. 2011, 47, W03505. [Google Scholar] [CrossRef]
  16. Di Fusco, E.; Lauriola, I.; Verdone, R.; Di Federico, V.; Ciriello, V. Impact of uncertainty in soil texture parameters on estimation of soil moisture through radio waves transmission. Adv. Water Resour. 2018, 122, 131–138. [Google Scholar] [CrossRef]
  17. Zhu, P.; Zhang, G.; Wang, H.; Zhang, B.; Liu, Y. Soil moisture variations in response to precipitation properties and plant communities on steep gully slope on the Loess Plateau. Agric. Water Manag. 2021, 256, 107086. [Google Scholar] [CrossRef]
  18. Cheng, F.Y.; Chen, Y. Variations in soil moisture and their impact on land–air interactions during a 6-month drought period in Taiwan. Geosci. Lett. 2018, 5, 26. [Google Scholar] [CrossRef]
  19. Western, A.W.; Blöschl, G.; Grayson, R.B. Geostatistical characterisation of soil moisture patterns in the Tarrawarra catchment. J. Hydrol. 1998, 205, 20–37. [Google Scholar] [CrossRef]
  20. Kerr, Y.H.; Wigneron, J.-P.; Al Bitar, A.; Mialon, A.; Srivastava, P.K. Chapter 1—Soil Moisture from Space: Techniques and Limitations; Srivastava, P.K., Petropoulos, G.P., Kerr, Y.H., Eds.; Satellite Soil Moisture Retrieval; Elsevier: Amsterdam, The Netherlands, 2016; pp. 3–27. ISBN 9780128033883. [Google Scholar] [CrossRef]
  21. Balenzano, A.; Mattia, F.; Satalino, G.; Lovergine, F.P.; Palmisano, D.; Peng, J.; Marzahn, P.; Wegmüller, U.; Cartus, O.; Dąbrowska-Zielińska, K.; et al. Sentinel-1 soil moisture at 1 km resolution: A validation study. Remote Sens. Environ. 2021, 263, 112554. [Google Scholar] [CrossRef]
  22. Gao, Q.; Zribi, M.; Escorihuela, M.J.; Baghdadi, N. Synergetic Use of Sentinel-1 and Sentinel-2 Data for Soil Moisture Mapping at 100 m Resolution. Sensors 2017, 17, 1966. [Google Scholar] [CrossRef] [PubMed]
  23. Attema, E.; Cafforio, C.; Gottwald, M.; Guccione, P.; Guarnieri, A.M.; Rocca, F.; Snoeij, P. Flexible dynamic block adaptive quantization for Sentinel-1 SAR missions. IEEE Geosci. Remote Sens. Lett. 2010, 7, 766–770. [Google Scholar] [CrossRef]
  24. Wigneron, J.-P.; Jackson, T.J.; O’Neill, P.; De Lannoy, G.; de Rosnay, P.; Walker, J.P.; Ferrazzoli, P.; Mironov, V.; Bircher, S.; Grant, J.P.; et al. Modelling the passive microwave signature from land surfaces: A review of recent results and application to the L-band SMOS & SMAP soil moisture retrieval algorithms. Remote Sens. Environ. 2017, 192, 238–262. [Google Scholar] [CrossRef]
  25. Zhang, B.; Wdowinski, S.; Gann, D.; Hong, S.-H.; Sah, J. Spatiotemporal variations of wetland backscatter: The role of water depth and vegetation characteristics in Sentinel-1 dual-polarization SAR observations. Remote Sens. Environ. 2022, 270, 112864. [Google Scholar] [CrossRef]
  26. Zheng, X.; Feng, Z.; Li, L.; Li, B.; Jiang, T.; Li, X.; Li, X.; Chen, S. Simultaneously estimating surface soil moisture and roughness of bare soils by combining optical and radar data. Int. J. Appl. Earth Obs. Geoinf. 2021, 100, 102345. [Google Scholar] [CrossRef]
  27. Matzler, C. ELBARA, the ETH L-band radiometer for soil-moisture research. In Proceedings of the 2003 IEEE International Geoscience and Remote Sensing Symposium, Proceedings (IEEE Cat. No.03CH37477), Toulouse, France, 21–25 July 2003; Volume 5, pp. 3058–3060. [Google Scholar] [CrossRef]
  28. Panciera, R.; Walker, J.P.; Kalma, J.D.; Kim, E.J.; Saleh, K.; Wigneron, J.-P. Evaluation of the SMOS L-MEB passive microwave soil moisture retrieval algorithm. Remote Sens. Environ. 2009, 113, 435–444. [Google Scholar] [CrossRef]
  29. Gluba, Ł.; Łukowski, M.; Szlązak, R.; Sagan, J.; Szewczak, K.; Łoś, H.; Rafalska-Przysucha, A.; Usowicz, B. Spatio-Temporal Mapping of L-Band Microwave Emission on a Heterogeneous Area with ELBARA III Passive Radiometer. Sensors 2019, 19, 3447. [Google Scholar] [CrossRef] [PubMed]
  30. Mo, T.; Choudhury, B.; Schmugge, T.; Wang, J.; Jackson, T. A model for microwave emission from vegetation-covered fields. J. Geophys. Res. 1982, 87, 11229–11237. [Google Scholar] [CrossRef]
  31. Fernandez-Moran, R.; Wigneron, J.-P.; De Lannoy, G.; Lopez-Baeza, E.; Parrens, M.; Mialon, A.; Mahmoodi, A.; Al-Yaari, A.; Bircher, S.; Al Bitar, A.; et al. A new calibration of the effective scattering albedo and soil roughness parameters in the SMOS SM retrieval algorithm. Int. J. Appl. Earth Obs. Geoinf. 2017, 62, 27–38. [Google Scholar] [CrossRef]
  32. Konings, A.G.; Piles, M.; Das, N.; Entekhabi, D. L-band vegetation optical depth and effective scattering albedo estimation from SMAP. Remote Sens. Environ. 2017, 198, 460–470. [Google Scholar] [CrossRef]
  33. Mironov, V.; Kerr, Y.; Wigneron, J.-P.; Kosolapova, L.; Demontoux, F. Temperature- and Texture-Dependent Dielectric Model for Moist Soils at 1.4 GHz. IEEE Geosci. Remote Sens. Lett. 2013, 10, 419–423. [Google Scholar] [CrossRef]
  34. Mironov, V.L.; Dobson, M.C.; Kaupp, V.H.; Komarov, S.A.; Kleshchenko, V.N. Generalized refractive mixing dielectric model for moist soils. IEEE Trans. Geosci. Remote Sens. 2004, 42, 773–785. [Google Scholar] [CrossRef]
  35. Wigneron, J.-P.; Calvet, J.-C.; Pellarin, T.; Van de Griend, A.A.; Berger, M.; Ferrazzoli, P. Retrieving near-surface soil moisture from microwave radiometric observations: Current status and future plans. Remote Sens. Environ. 2003, 85, 489–506. [Google Scholar] [CrossRef]
  36. Parrens, M.; Wigneron, J.-P.; Richaume, P.; Mialon, A.; Al Bitar, A.; Fernandez-Moran, R.; Al-Yaari, A.; Kerr, Y.H. Global-scale surface roughness effects at L-band as estimated from SMOS observations. Remote Sens. Environ. 2016, 181, 122–136. [Google Scholar] [CrossRef]
  37. Barrée, M.; Mialon, A.; Pellarin, T.; Parrens, M.; Biron, R.; Lemaître, F.; Gascoin, S.; Kerr, Y.H. Soil moisture and vegetation optical depth retrievals over heterogeneous scenes using LEWIS L-band radiometer. Int. J. Appl. Earth Obs. Geoinf. 2021, 102, 102424. [Google Scholar] [CrossRef]
  38. Saleh, K.; Wigneron, J.P.; De Rosnay, P.; Calvet, J.C.; Kerr, Y. Semi-empirical regressions at L-band applied to surface soil moisture retrievals over grass. Remote Sens. Environ. 2006, 101, 415–426. [Google Scholar] [CrossRef]
  39. Wigneron, J.P.; Kerr, Y.; Waldteufel, P.; Saleh, K.; Escorihuela, M.J.; Richaume, P.; Ferrazzoli, P.; de Rosnay, P.; Gurney, R.; Calvet, J.C.; et al. L-band microwave emission of the biosphere (L-MEB) model: Description and calibration against experimental data sets over crop fields. Remote Sens. Environ. 2007, 107, 639–655. [Google Scholar] [CrossRef]
  40. Ferrazzoli, P.; Guerriero, L.; Wigneron, J.-P. Simulating L-band emission of forests in view of future satellite applications. IEEE Trans. Geosci. Remote Sens. 2002, 40, 2700–2708. [Google Scholar] [CrossRef]
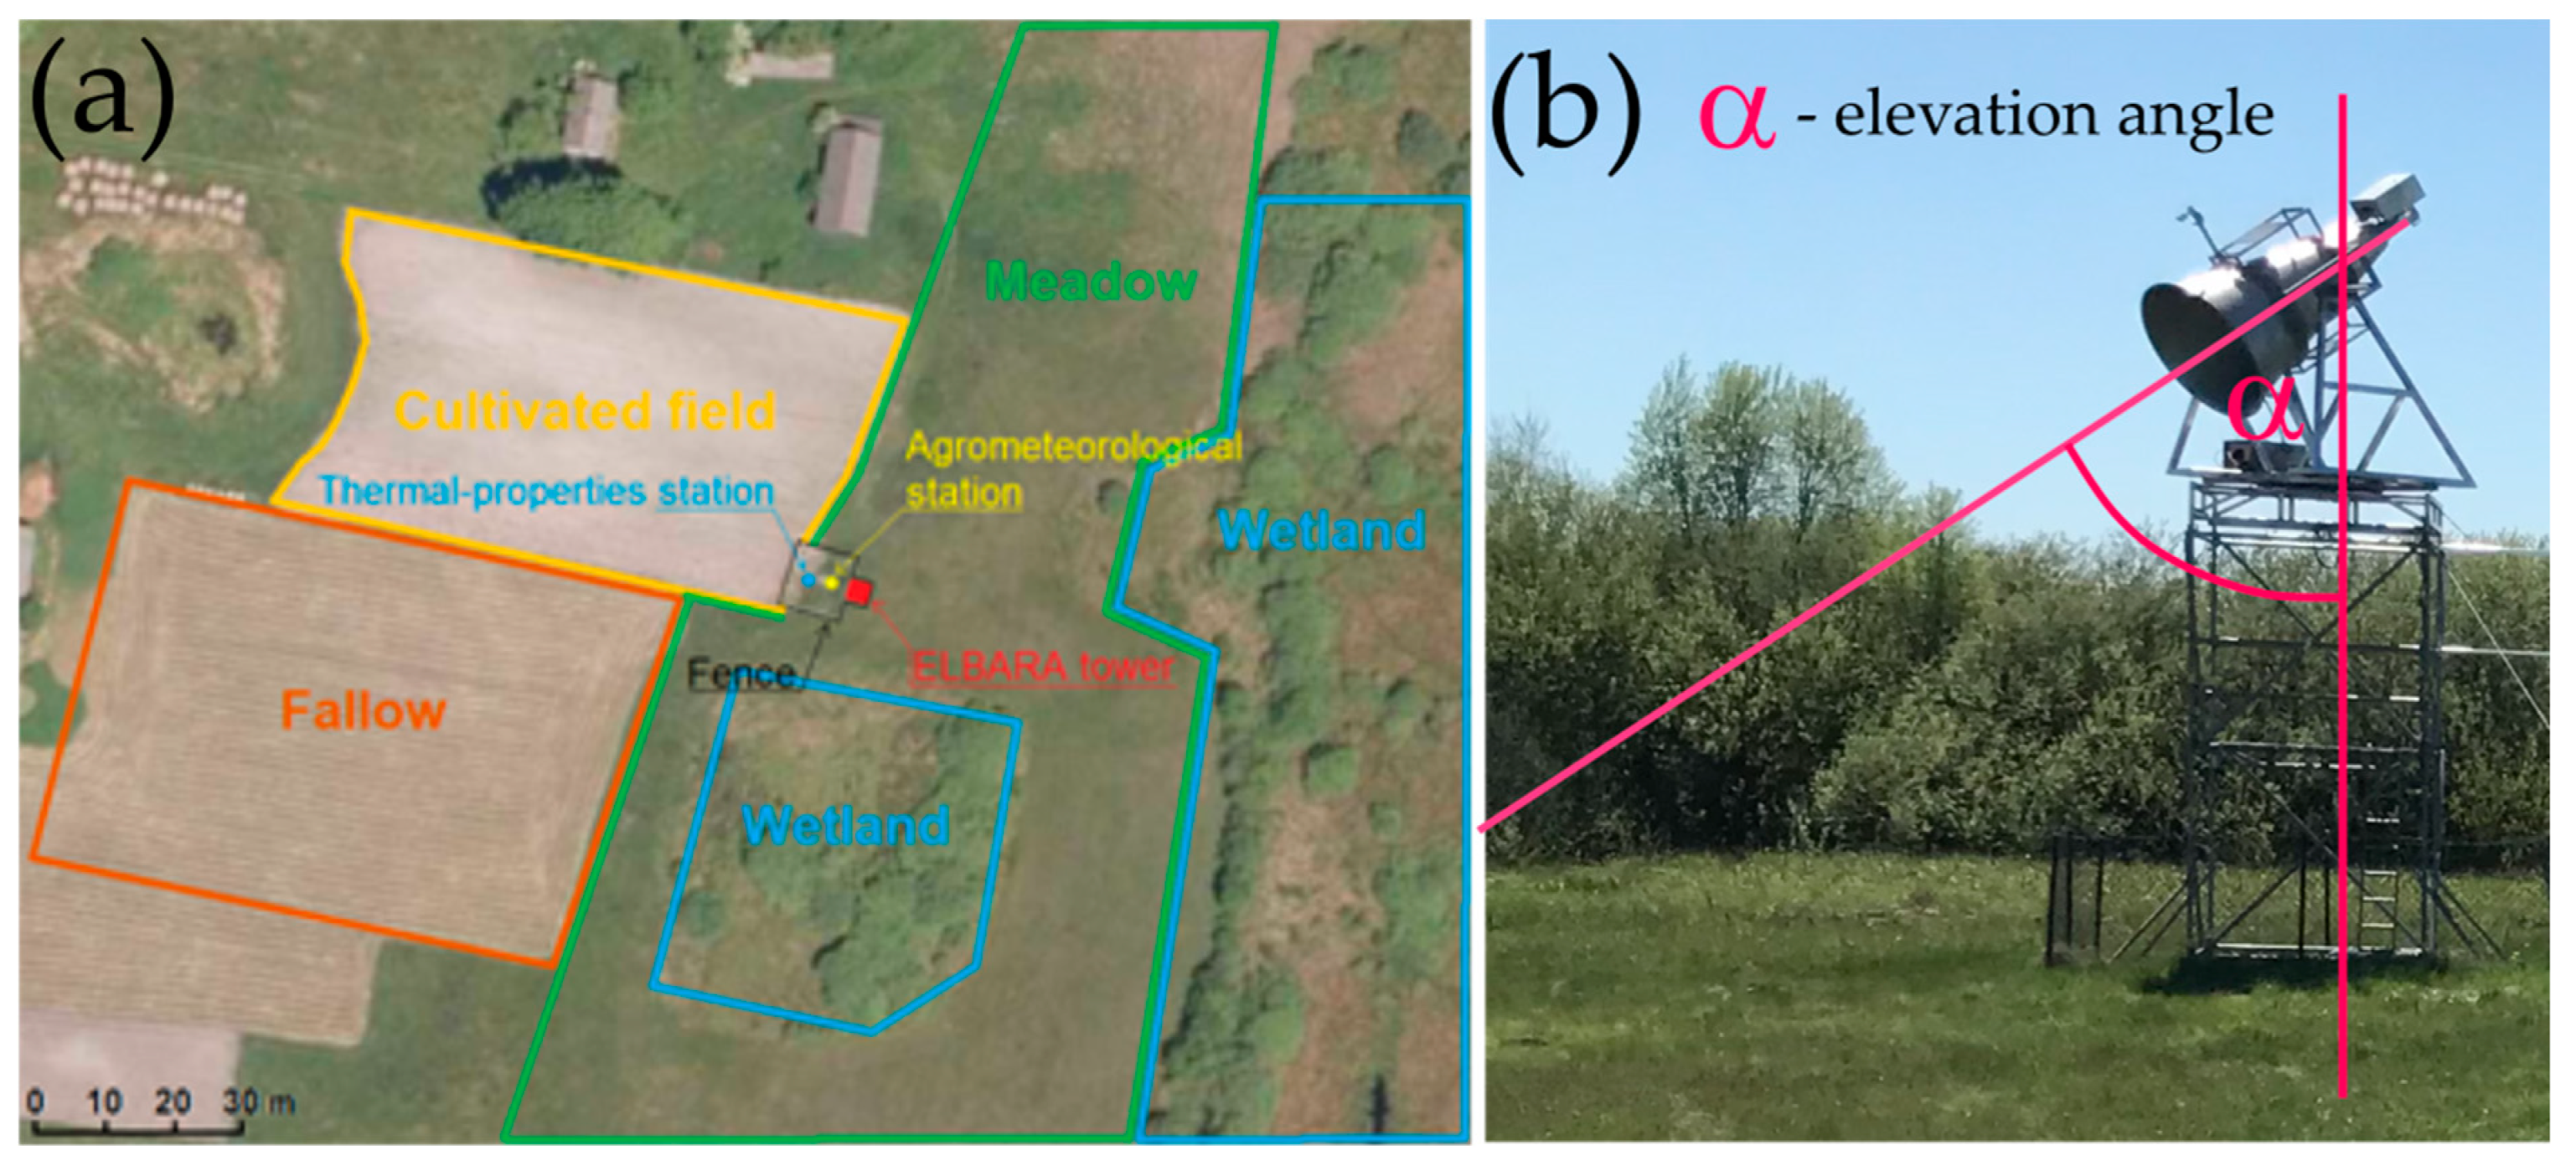
Figure 1. Localisation of the agrometeorological station with the ELBARA instrument at the Bubnów-Sęków test site (a), and the elevation angle definition of ELBARA instrument (b).
Remotesensing 16 02200 g001
Figure 2. Graphical representation of ELBARA footprints for an elevation angle of 75° and azimuths 30°, 90°, 180°, and 320°. The pink dashed circles represent the upper and lower boundaries of the footprints.
Remotesensing 16 02200 g002
Figure 3. Brightness temperatures registered using ELBARA at an elevation angle of 75°, and azimuths 30°, 90°, 180°, and 320° for two polarisations V (red circles) and H (red dots) in 2018. Green squares denote soil moisture values from the in situ measurement averaged in ELBARA footprints, and blue lines show daily precipitation registered at the agrometeorological station.
Remotesensing 16 02200 g003aRemotesensing 16 02200 g003b
Figure 4. Arrangement of point measurements (red dots) around the ELBARA instrument during the measuring campaigns in (a) 23 May 2018, (b) 27 June 2018, (c) 16 August 2018, (d) 13 September 2018, and (e) 30 October 2018. The four ellipsoids represent the polygons for the four ELBARA footprints analysed in the present work.
Remotesensing 16 02200 g004
Figure 5. Fluctuation of the ω coefficient as a function of time for azimuths (a) 30°, (b) 90°, (c) 180° and (d) 320°. The Figure presents the values calculated after the second iteration when H r r e f and N r r e f were constant. The lines are presented for better visualisation.
Remotesensing 16 02200 g005
Figure 6. Fluctuation of the τ coefficient as a function of time for azimuths (a) 30°, (b) 90°, (c) 180° and (d) 320°. The Figure presents values calculated after the second iteration (black squares and solid lines) when H r r e f and N r r e f were constant. The lines are presented for better visualisation.
Remotesensing 16 02200 g006
Figure 7. Soil moisture calculated (blue stars) from retrievals registered using ELBARA (black circles) at azimuth 30° at polarisation H (lower graph) and V (upper graphs) in 2018–2019 combined with simulated values of brightness temperatures (red dots) calculated using reference coefficients and values of the soil moisture measured in situ (green squares). The precipitation registered by the agrometeorological station is shown (grey bars).
Remotesensing 16 02200 g007
Figure 8. Soil moisture calculated (blue stars) from retrievals registered using ELBARA (black circles) at azimuth 90° at polarisation H (lower graph) and V (upper graphs) in 2018–2019 combined with simulated values of brightness temperatures (red dots) calculated using reference coefficients and values of the soil moisture measured in situ (green squares). The precipitation registered by the agrometeorological station is shown (grey bars).
Remotesensing 16 02200 g008
Figure 9. Soil moisture calculated (blue stars) from retrievals registered using ELBARA (black circles) at azimuth 180° at polarisation H (lower graph) and V (upper graphs) in 2018–2019 combined with simulated values of brightness temperatures (red dots) calculated using reference coefficients and values of the soil moisture measured in situ (green squares). The precipitation registered by the agrometeorological station is shown (grey bars).
Remotesensing 16 02200 g009
Figure 10. Soil moisture calculated (blue stars) from retrievals registered using ELBARA (black circles) at azimuth 320° at polarisation H (lower graph) and V (upper graphs) in 2018–2019 combined with simulated values of brightness temperatures (red dots) calculated using reference coefficients and values of the soil moisture measured in situ (green squares). The precipitation registered by the agrometeorological station is shown (grey bars).
Remotesensing 16 02200 g010
Table 1. Characterisation of soil present in the four footprints of the ELBARA instrument.
Azimuth (Description)Soil PropertiesCoverage
30° (meadow with lower OM content)Sand = 89%, silt = 8%, clay = 3%, OM = 7% Grass with a height from 5 cm to 50 cm, max LAI: 2
90° (meadow with high OM content) Sand = 93%, silt = 4%, clay = 3%, OM = 25%Grass with a height from 5 cm to 50 cm, max LAI: 4
180° (wetland)Sand = 94%, silt = 3%, clay = 3%, OM = 16%Permanent grass with a height of 50 cm, bushes with a height up to 3 m, max LAI: 6
320° (cultivated field)Sand = 90%, silt = 7% clay = 3%, OM = 6%Bare soil, wheat, max LAI: 2
Table 2. Values of time-dependent reference coefficients ω and τ, with assumed periods of their applicability for specific analysed azimuths and two polarisations.
Period of Application ω H r e f
ω V r e f
τ H r e f
τ V r e f
ω H r e f
ω V r e f
τ H r e f
τ V r e f
ω H r e f
ω V r e f
τ H r e f
τ V r e f
ω H r e f
ω V r e f
τ H r e f
τ V r e f
Azimuth 30°Azimuth 90°Azimuth 180°Azimuth 320°
1 January–30 March0.51
0.54
0.4
0.2
0.27
0.16
1.0
0.3
0.19
0.15
0.9
0.9
0.79
0.56
0.7
0.1
1 April –15 June0.59
0.22
0.5
0.8
0.75
0.18
0.1
0.8
0.17
0.10
0.4
0.5
0.39
0.67
1.0
0.1
16 June–30 July0.37
0.20
0.9
1.0
0.29
0.15
0.2
0.4
0.16
0.06
0.7
0.4
0.51
0.75
0.9
0.1
1 August–30 August0.49
0.42
0.5
0.3
0.24
0.08
0.2
0.2
0.19
0.15
1.0
0.8
0.50
0.26
0.7
0.7
1 September–30 September0.61
0.56
0.3
0.2
0.29
0.19
0.8
0.4
0.13
0.17
0.4
0.9
0.51
0.42
0.8
0.5
1 October–31 December0.51
0.54
0.4
0.2
0.27
0.16
1.0
0.3
0.19
0.15
0.9
0.9
0.79
0.56
0.7
0.1
Disclaimer/Publisher’s Note: The statements, opinions and data contained in all publications are solely those of the individual author(s) and contributor(s) and not of MDPI and/or the editor(s). MDPI and/or the editor(s) disclaim responsibility for any injury to people or property resulting from any ideas, methods, instructions or products referred to in the content.