Abstract
In general, remote sensing images depict intricate scenes. In cross-modal retrieval tasks involving remote sensing images, the accompanying text includes numerus information with an emphasis on mainly large objects due to higher attention, and the features from small targets are often omitted naturally. While the conventional vision transformer (ViT) method adeptly captures information regarding large global targets, its capability to extract features of small targets is limited. This limitation stems from the constrained receptive field in ViT’s self-attention layer, which hinders the extraction of information pertaining to small targets due to interference from large targets. To address this concern, this study introduces a patch classification framework based on feature similarity, which establishes distinct receptive fields in the feature space to mitigate interference from large targets on small ones, thereby enhancing the ability of traditional ViT to extract features from small targets. We conducted evaluation experiments on two popular datasets—the Remote Sensing Image–Text Match Dataset (RSITMD) and the Remote Sensing Image Captioning Dataset (RSICD)—resulting in mR indices of 35.6% and 19.47%, respectively. The proposed approach contributes to improving the detection accuracy of small targets and can be applied to more complex image–text retrieval tasks involving multi-scale ground objects.
1. Introduction
Remote sensing images play an important role in meteorology, hydrology research, traffic management, disaster prediction, and so on. In the big data era, the number of remote sensing images has increased significantly. Therefore, the efficient utilization of large volumes of remote sensing data has become the focus of attention. Generally, single-modal data retrieval methods are less versatile compared to multi-modal approaches. Multi-modal methods not only enhance data utilization flexibility but also facilitate cross-modal information integration, thereby improving information reliability and richness. Consequently, cross-modal retrieval in remote sensing has garnered considerable scholarly attention in recent years.
In order to realize the mutual retrieval of different modal data, the existing method for cross-modal image–text retrieval of remote sensing images involves two primary steps: feature extraction in single-modal data and interaction between multi-modal features [1]. Extracting image and text features represents the initial crucial phase in cross-modal retrieval, with image feature extraction posing greater challenges. In terms of image feature extraction, prevailing cross-modal image–text retrieval models for remote sensing images primarily employ the convolutional neural network (CNN) and vision transformer (ViT) [2]. CNN stands as the predominant method for image feature extraction in cross-modal retrieval of remote sensing images, as indicated by References [3,4,5,6,7,8,9,10,11]. With the recent surge in ViT’s popularity, many researchers have also utilized ViT to directly extract visual features [2,12,13]. Some alternative methods have also served as visual feature encoders. For instance, References [14,15] employed hypergraph neural networks to construct visual encoders. Reference [16] applied the concept of image neural networks and built text and remote sensing image modules, achieving an interactive fusion of image and text features. Certain studies have employed multiple methods to extract features from images [17,18]. Generally, the mainstream CNN architecture usually requires a lot of parameters and computing resources. In addition, due to being limited by the size of the convolution kernel, the CNN model’s ability to perceive global information is poor. In contrast, ViT models commonly used in computer vision in recent years do not rely on convolutional operations but rather adopt a global self-attention calculation method that can effectively perceive global features. Moreover, the ViT model also has certain advantages in terms of the number of parameters and computational complexity. However, this approach may overly focus on large targets, impeding the extraction of small targets. The distinction between large and small targets in this paper is relative. In a remote sensing image, a target with a relatively high pixel proportion is classified as a large target, while a target with a relatively low proportion is deemed small. In cross-modal image–text retrieval of remote sensing images, text includes information on both large and small targets. When distinguishing between similar images at a fine-grained level, small target information often holds greater significance. Thus, enhancing the extraction of small target information while ensuring the extraction of large target information remains a pivotal concern in cross-modal image–text retrieval tasks for remote sensing images.
To address the challenge of extracting small targets from remote sensing images, certain researchers have endeavored to enhance the ViT model. For instance, Reference [19] devised a layered ViT to extract both shallow and deep semantic information from images. Through downsampling, they achieved multi-scale feature fusion, partially retaining small target information in the image. However, despite these efforts, the utilization of the global self-attention calculation method during the extraction of shallow semantic information failed to fundamentally resolve the issue of large target interference with small target information. Reference [20] augmented ViT with dense blocks to preserve semantic features within each transformer block layer. These features were then concatenated with global features and passed on to the subsequent transformer block layer, aiding in the preservation of semantic features related to small targets and mitigating vanishing issues during forward propagation. Furthermore, Reference [21] employed a combination of CNN and ViT to extract local and global visual features, respectively, thereby enhancing the extraction of small target information in images. Nonetheless, this approach entailed a complex structure. The primary limitation impeding ViT’s efficacy in extracting small targets stems from the receptive field problem in its self-attention layer [22]. For small target features, an excessive number of patches can introduce noise (in the form of large target features) during the feature update process, thereby suppressing the expression of small target features. Consequently, the direct incorporation of ViT in cross-modal retrieval of remote sensing images may lead to large target features interfering with small target feature extraction, thereby impacting retrieval effectiveness.
Under the global attention mechanism, large target features will interfere with the extraction of small target features, which will affect the fine-grained semantic alignment of images in the cross-modal retrieval process of remote sensing images, resulting in a reduction in retrieval accuracy. To mitigate noise interference within the global receptive field, this study proposes the construction of distinct receptive fields within the self-attention layer to diminish the impact of large targets on small target feature extraction. Furthermore, given the dispersed nature of small targets in remote sensing images, we establish diverse receptive fields targeting the saliency and similarity of regional image features. Specifically, we utilize feature similarity between patches to discern whether a patch corresponds to a large target feature. Additionally, distinct receptive fields are crafted based on this similarity to enable separate representations of large and small target features. This strategy reduces noise interference from large target features on small target features, thereby facilitating the expression of small target features. In summary, the main contributions of this work can be categorized into the following two aspects:
1. Given the multi-scene attributes of remote sensing images, we introduce a classification method relying on cosine similarity between patches. The total sum of similarities serves as the metric for feature saliency, with cosine similarity forming the foundation for classification.
2. Building upon the ViT image feature extraction approach, we devised a tailored structure for the enhanced vision transformer (EViT) model aimed at improving small target features. In comparison to conventional ViT models, EViT incorporates multiple sets of twin networks featuring different receptive fields for parallel parameter operations within certain block layers. Additionally, we developed an enhanced feature extraction framework (AEFEF) for cross-modal image–text retrieval in remote sensing images utilizing EViT. Verification experiments conducted on the RSITMD and RSICD yielded promising results. The proposed method enhances retrieval accuracy.
The chapter arrangement of this paper is as follows. Section 2 gives a comprehensive introduction to the proposed method. Section 3 introduces the experimental details and results and provides a simple analysis. In Section 4, the experimental results are discussed in depth, and the advantages and disadvantages of the proposed method are expounded. Finally, Section 5 gives a brief summary of the research.
2. Methodology
This section provides a comprehensive introduction to the AEFEF. Section 2.1 offers a succinct overview of its overarching framework, while Section 2.2 and Section 2.3 elaborate on the image feature extraction method EViT and the multi-modal feature interaction module, respectively.
2.1. Overall Framework
The overall structure of AEFEF is illustrated in Figure 1. The images and texts utilized are sourced from the RSITMD and RSICD datasets to train and evaluate the model. Initially, the model utilizes single-modal encoders for images and texts to derive feature representations. Specifically, the text encoder employs the pre-trained Bert method, while the image encoder adopts the EViT method with enhanced small target feature extraction. Subsequently, the acquired regional image features and word features of the text are fed into the feature interaction network for cross-attention computation, enabling fine-grained semantic interaction. Finally, the model undergoes training using triplet loss.
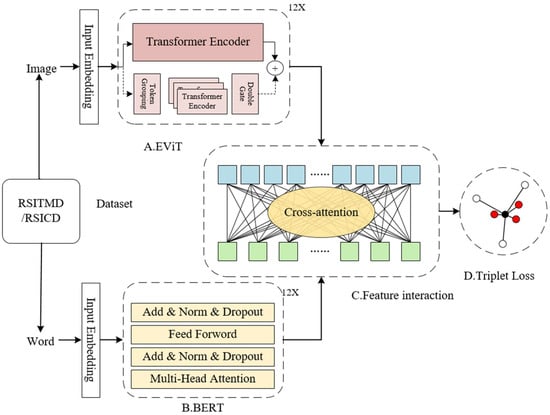
Figure 1.
Overall structural diagram of AEFEF. Module A and Module B represent the image encoder and the text encoder of AEFEF, Module C signifies the image–text feature interaction network capable of generating the similarity matrix, and Module D depicts the triplet loss utilized to steer the final network training.
2.2. EViT
ViT, introduced by the Google team in 2020, applies the transformer architecture to image classification. As depicted in Figure 2, the devised EViT method enhances ViT’s functionality. While the original ViT employs a global self-attention calculation method effective in capturing prominent features and establishing long-range dependencies, it also entails attention calculations for all tokens, potentially introducing noise between irrelevant tokens. This noise may overshadow features associated with small targets. To address this issue, a token grouping block is devised to categorize tokens based on feature similarity, thereby constructing distinct receptive fields to amplify the expression of features related to small targets. Within the token grouping block, the input feature vector is segregated into three complementary groups based on the saliency and similarity of regional image features.
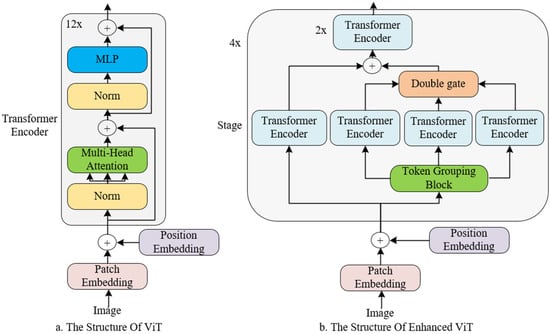
Figure 2.
Structures of ViT and EViT. ViT contains 12 transformer blocks with the same structure. EViT divides these 12 blocks into four stages. Each stage consists of three stages, where the first transformer block is changed to a twin transformer block.
Our objective is to enhance the feature extraction capability for small targets while preserving the global receptive field of ViT, thus prompting the design of a twin network structure. As depicted in Figure 2a, within the conventional ViT model, the encoder repetitively stacks the transformer block 12 times. In the EViT model, these 12 concatenated transformer blocks are segmented into 4 stages, with a local attention calculation branch, predicated on feature similarity, appended to the first block of each stage. The changed transformer block is named a twinned transformer block, which uses a twin network structure and is based on the transformer block.
As illustrated in the figure, the twinned transformer block initially utilizes the token grouping block to categorize tokens, forwarding each group to a transformer block branch for parallel computation. Subsequently, the results from these branches are weighted via a gate mechanism. Throughout the experiment, identical parameters are configured for both the branch and backbone transformer blocks to minimize learning parameters and enhance efficiency. As depicted in the figure, the brief calculation process of this part can be delineated into the following steps:
Here, refers to classifying by cosine similarity using the token grouping block, and the output results are the , , and groups. After the grouping process, each group and are individually forwarded to the transformer block for parallel computation.
Here, signifies the computation outcome after input image features are passed through the transformer block, and denotes the dynamic weighting of the results from the three branches via the DoubleGate structure. Ultimately, the results from both the branch and the backbone are aggregated to derive the final outcome.
That is the brief process of EViT. EViT is used as a visual encoder in AEFEF, which is also the main innovation point of this paper. The following sections provide a detailed look at its two main improvements. Section 2.2.1 introduces the detailed processes of the token grouping block, and Section 2.2.2 introduces DoubleGate algorithms.
2.2.1. Token Grouping Block
Cosine similarity serves as a metric for token correlation, with the sum of cosine similarities between a token and all tokens employed as a measure of token saliency (a higher sum indicating greater saliency of the image region corresponding to the token). Within the token grouping block module, cosine similarity assesses the saliency of tokens, segregating tokens with similar features into a group. The detailed calculation process is delineated in Figure 3.
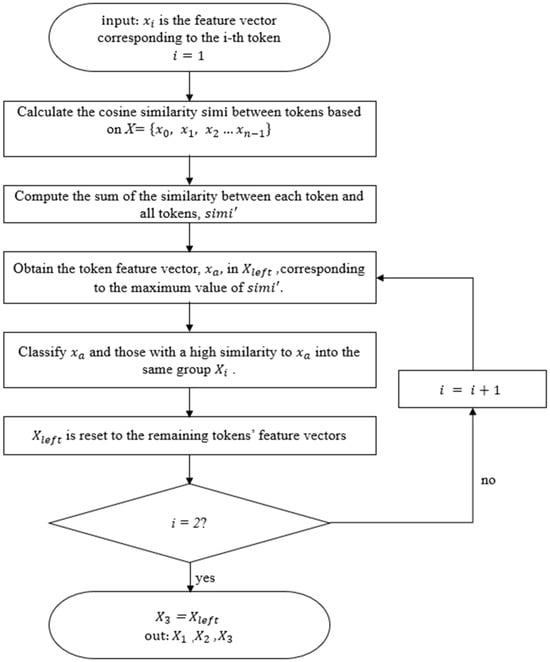
Figure 3.
The detailed calculation process of token grouping.
First, calculate the cosine similarity between tokens, assuming that is formed after patch embedding of the image, where is the feature vector corresponding to the i-th token and n is the number of tokens. The similarity matrix between tokens is calculated using :
is defined as the salience vector of tokens, where its value represents the sum of cosine similarities between the token and all other tokens. Then, based on and the ungrouped vector set , the feature vector of the most salient token can be obtained.
The function max_x in Equation (9) is used to obtain the corresponding feature vector in , which maximizes the value of . Note that when sorting the first group, is simply X. After obtaining , grouping can be performed based on the threshold set by the similarity between and in . During the experiment, the average of similarity between and is used as the threshold.
In this experiment, we have divided all feature vectors of tokens into 3 groups based on similarity, where corresponds to the most obvious target area in the image, accounting for the majority of the entire image, and account for a fraction of the entire image. From the comparison of the proportion of image areas, represents the feature vectors of the large target image area, represents the feature vectors of the middle target image area, and represents the feature vectors of the small target image area. Through the above grouping process based on feature similarity, big targets and small targets are distinguished. This can reduce the interference of large targets with small targets in the subsequent feature updating process and is more conducive to the feature extraction of small targets.
2.2.2. DoubleGate
To effectively utilize information, a DoubleGate mechanism is employed to integrate the information from the three branches. The specific calculation process is illustrated in Figure 4.
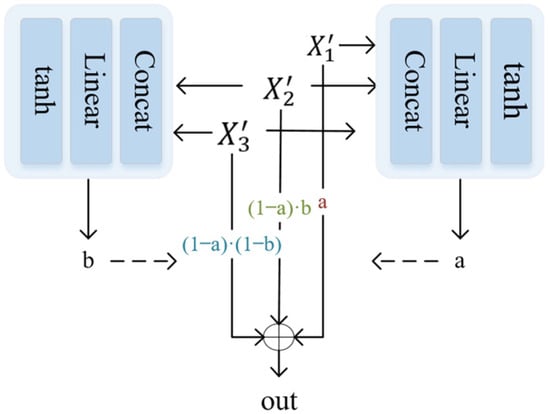
Figure 4.
Structure of DoubleGate.
The gate mechanism concatenates the input vectors and passes them through the linear layer, where coefficients are derived using simple tangent operations. In this algorithm, the input consists of three vectors, necessitating the use of the DoubleGate mechanism. Specifically, in each gate mechanism, the input m vectors (dimension d) are first concatenated to obtain a joint feature representation (dimension m*d). The coefficient matrix (dimension d) is then output through a linear layer. A tangent operation is applied to the coefficient matrix to obtain the final coefficient. The DoubleGate mechanism calculates two coefficients through two iterations of the gate mechanism and dynamically adjusts the weighting of the updated results from the three sets of features. This process effectively integrates both large and small target features, thereby enhancing the representation of smaller target features.
2.3. Feature Interaction and Target Function
2.3.1. Cross-Attention Layer
This layer implements the cross-attention approach introduced in Reference [10], using text features to consolidate attention for regional image features. Initially, the relevant weights between each region and the text are established; subsequently, the weighted sum of these weights is computed to derive the overall feature of the image. Next, the image–text similarity matrix is computed as the output. The detailed architecture is depicted in Figure 5.
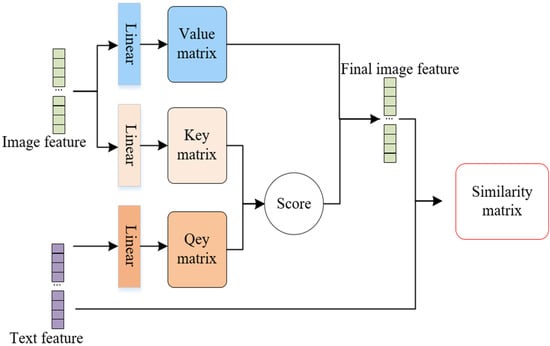
Figure 5.
Detailed architecture of the cross-attention layer.
Below is an outline of the specific calculation process.
First, we map regional image features and word features through three linear layers. Here, refers to the regional image features, refers to the word features, and represents passing the initial features through a linear layer.
Second, we compute the word-guided attention of an image region as follows. Here, represents the cosine similarity between the word in the text and image region, and represents the normalized weight for regional image features. is calculated from by L2 norm normalization.
Third, we obtain the word-guided image feature according to . is the sum of each regional image feature, which is generated by the k-th word information guidance. The calculation formula is as shown in Equation (20):
Finally, we calculate the similarity score between text and image, which is the average of similarities between words and the corresponding word-guided image features, as shown in Equation (21).
2.3.2. Objective Function
This model incorporates the bidirectional triplet loss function, which is introduced in Reference [23] as an objective function. The calculation formula is as follows:
Here, the margin is the preset value to distinguish between positive and negative examples. In training, a small batch training strategy is utilized to stably update network parameters. Therefore, and denotes negative image samples and negative text samples, respectively. In addition, b denotes the size of the small batch.
Under the constraints of this function, the model can promote the proximity between positive examples (the matched image and text) while ensuring the separation between negative examples (the mismatched images and text). Thus, model parameters are optimized.
3. Experimental
This section mainly describes the details of the experiment and the retrieval effect. Specifically, this section describes the datasets, model parameters, performance indicators, comparative experimental design, and experimental results.
3.1. Experiment Details
In order to test the performance of the proposed method, we selected two public cross-modal datasets (RSITMD and RSICD) and performed a series of experiments on them. First, a brief introduction and comparison of the two data task sets we used are as follows.
RSITMD: Remote Sensing Image–Text Match Dataset [24] comprises a fine-grained image–text dataset comprising 4743 remote sensing images. Each image size is 256 × 256, with five matching sentences as descriptions. These five sentences are basically different, but there are still some repeated sentences.
RSICD: Remote Sensing Image Captioning Dataset (RSICD) [25] stands as a vast remote sensing image caption dataset housing 10,921 images. Each image size is 224 × 224, and each is associated similarly with five descriptions. Unlike the RSITMD dataset, RSICD offers descriptions that are less detailed yet demonstrate higher coherence among sentences. More similar sentences are used in the RSICD dataset.
In the experiment, we migrated the visually pre-trained parameters to ImageNet. The patch size was set to 16 × 16, and the resulting image feature dimension was L/256, where L represents the image size. Among the pre-training parameters used, the number of patches was 196, which is suitable for the RSICD dataset. For the RSITMD dataset, we extended the 196 parameters linearly to 256. The batch size for each training and testing session was fixed at 32.
3.2. Experimental Design and Results
3.2.1. Comparisons with Other Approaches
In order to analyze the performance of the proposed methods from various angles, we compared them from the following two aspects.
The first was the retrieval accuracy of the model. In the experiment, two metrics were employed as evaluation indexes to assess the model: recall at K (R@K, where K = 1, 5, and 10) and mR. These two evaluation metrics are frequently utilized in image retrieval. The first indicator, R@K, indicates the percentage of positive examples present in the first K retrieval results. The second indicator, mR, was first introduced in Reference [26]. It represents the average of six R@K, including R@1, R@5, and R@10 in text retrieval and R@1, R@5, and R@10 in image retrieval.
We compared the proposed cross-modal retrieval framework with some existing models. For example, we used AMFMN from Reference [24], CMFM-Net from Reference [16], and GaLR from Reference [18]. In addition, AEFEF (ViT) was used as an important comparison object.
Table 1 and Table 2 provide a performance comparison between different models based on the two metrics in RSITMD and RSICD, respectively. Here, “text retrieval” denotes the task of matching text descriptions to images, while “image retrieval” refers to matching remote sensing images to text descriptions.

Table 1.
Experimental comparison results of all models on the RSITMD dataset. The best results for each indicator are shown in bold.

Table 2.
Experimental comparison results of all models on the RSICD dataset. The best results for each indicator are shown in bold.
Table 1 presents the performance of our model on the RSITMD dataset. Compared to other models, the proposed model demonstrated superior performance, achieving higher values across most R@K and mR metrics. Although the method did not achieve the best results in terms of text retrieval index R@1 and image retrieval index R@1, the other indicators achieved the best results. Compared with using ViT, our proposed method showed obvious advantages. It was only 0.44% behind in image retrieval R@1, and the absolute accuracy gain increased by 2.08% in mR.
Table 2 displays the performance of our model on the RSICD dataset. Our model outperformed the baseline models in terms of text retrieval index R@1 and all image retrieval indexes, although it lagged behind the best-performing baseline model in text retrieval R@5 and R@10. Compared with using ViT, our proposed method increased the absolute accuracy gain by 0.52% in mR. Obviously, although our approach is slightly better than ViT on the RSICD dataset, the overall improvement is not as good as it is on the RSITMD dataset. On the one hand, this may be due to the fact that the network structure and some key parameters of the model are trained on the RSITMD dataset, so the improvement of the retrieval effect of the RSICD dataset is limited. On the other hand, it may be due to differences between the two datasets. The text description in the RSICD dataset is coarser.
In summary, the proposed model demonstrated better performance compared to other models. It exhibited enhanced performance indexes compared to the conventional ViT. Notably, the proposed model performed better on the RSITMD dataset than the RSICD dataset. This discrepancy can be attributed to the richer text semantics and lower text repeatability in the RSITMD dataset, which necessitates a more pronounced demand for extracting small target features from images. This also means that our model is more suitable for the retrieval of fine-grained images and text pairs.
The second aspect is the computational complexity of the model, which mainly includes three performance indexes: the number of model parameters, floating point operations per second (FLOPS), and the training time required per epoch. We conducted a singular variable contrast experiment for this model using ViT as the visual encoder (denoted as AEFEF (ViT) in the experiment summary table).
As shown in Table 3, it can be seen that, compared with the AEFEF (ViT) model, the number of parameters in the AEFEF model only increased by 1.41%, and the training time required for each epoch only increased by 16%.

Table 3.
Comparison of computational complexity between AEFEF (ViT) and AEFEF.
As described in Section 2 of this article, the number of parameters in the model only increased in the linear layer of DoubleGate. The dimension of each image feature was 768. The first linear layer in the module of DoubleGate compressed three feature dimensions into one feature dimension, and the second linear layer compressed two feature dimensions into one feature dimension. Therefore, only about 2.951 M parameters were added to the entire model. The experimental results agreed with the theoretical values. Compared with the small increase in the number of model parameters, the training time increased significantly by 16%. In the feature extraction of each image, the EViT method had 16.394 G more floating point arithmetic than the ViT method. This was because the structure of the twin network was used in the design of the network structure. Four parallel branches were designed without greatly increasing the number of parameters. Therefore, the amount of computation greatly increased, and the training time also greatly increased.
In general, because of the twin network, the computational complexity increased significantly. However, compared to the improvement in accuracy, we think it is acceptable.
3.2.2. Ablation Studies
To further investigate the improvements of EViT over ViT, we designed the following three sets of contrast experiments to analyze and prove the performance of EViT.
(1) Examining the effect of the twinned transformer block position on model retrieval accuracy.
(2) Assessing the impact of patch size during image embedding on model retrieval accuracy.
Contrast experiment 1: To explore the influence of twinned transformer block position on the accuracy of EViT in each stage, we selected EViT(3) and EViT(4) for contrast experiments. EViT(a)i denotes the EViT method with a transformer block located at the i-th position in each stage. In this experiment, mR was chosen as the sole index for evaluating the positional impact.
Conclusion: Table 4 reveals that EViT(3) attained the highest accuracy when positioned at the second position, whereas EViT(4) achieved optimal accuracy when positioned at the first position. In general, EViT performed better when the twinned transformer block was placed at the beginning of each stage. This may be due to the fact that features lose some small target information each time they pass through the transformer block. In the earlier section, the transformer block was set to a twinned transformer block, which is more beneficial to retain small target information. At the same time, setting up such a phased structure prevents excessive emphasis on small target information, affecting the retention of large target information.

Table 4.
Retrieval accuracy on the RSITMD dataset when the twinned transformer block position varied.
Contrast experiment 2: To explore the influence of patch size on the accuracy of EViT, we conducted contrast experiments on the RSITMD dataset by dividing the images into patches of sizes 16 × 16 and 32 × 32.
Conclusion: Figure 6 demonstrates that when the patch size was 16 × 16, the retrieval accuracy was notably higher compared to 32 × 32, and the improvement over ViT was more significant. When the patch size was 16 × 16, the absolute return of EViT increased by 2.08% and the relative return increased by 6.2% compared with ViT. When the patch size was 32 × 32, the absolute return of EViT increased by 0.64% and the relative return increased by 2% compared with ViT. This outcome can be attributed to two primary reasons. Firstly, a smaller patch size results in more patches and finer image segmentation, thereby retaining more image features. Secondly, with an increased number of patches, irrelevant patches have a greater impact. The classified local self-attention calculation method is conducive to eliminating the impact of unrelated patches.
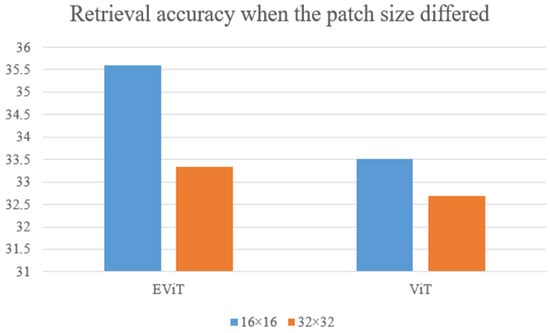
Figure 6.
Retrieval accuracy on the RSITMD dataset when the patch size differed.
3.2.3. Visualization Results
To better explain the method, we designed the following two visualization experiments.
Effect Graph of the Token Grouping Block
In order to visualize the ideas and effects of the design, we designed a result display diagram of the token grouping block. The experimental results are shown in Figure 7.
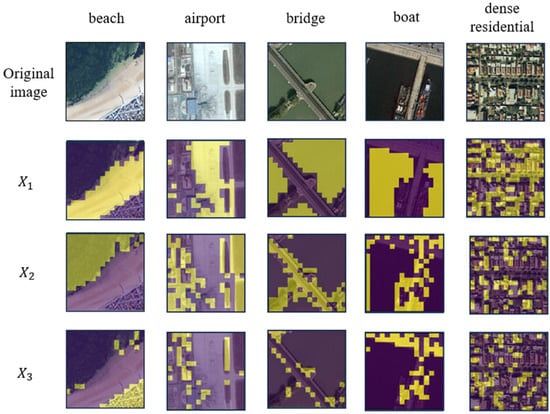
Figure 7.
Classification result graph of remote sensing images with five different themes: beach, airport, bridge, boat, and dense residential. Each group of pictures includes the original picture, and the patches display correspond to , , and (highlighted in yellow).
We randomly selected five remote sensing images with different themes to show their effects after passing through the token grouping block. It can be clearly seen from Figure 7 that this grouping method can classify patches into three categories based on their features. Among them, the area corresponding to is the big target in the graph, the area corresponding to is slightly smaller than , and the area corresponding to is the small target set in the graph. This is most evident in the remote sensing images with the beach as the theme. The beach and the sea, as the big targets in the figure, are divided into the first and second groups. The buildings in the lower right corner of the image occupy only a small part of the image area and are divided into the third group. This classification method constructs a feature-based receptive field, which can reduce the interference of large targets with small targets in the process of feature extraction to a certain extent. This point can also be confirmed in subsequent attention heat maps, where features of small target buildings in remote sensing images with the beach as the theme are intensively extracted.
The effect is also reflected in the images of other themes. For example, in the airport-themed renderings, the flat pavement and bare land are divided into and as big targets. The buildings scattered around are divided into as small targets. In the bridge-themed renderings, the river surface and the bridge are divided into and as big targets. Scattered white street lights along bridges and other small features are assigned to as small targets. In the boat-themed renderings, the water and the boat are divided into and as big targets. Banks and small objects on ships and shores are grouped into as small targets. In the dense residential-themed renderings, the grouping effect is not obvious. Regular buildings are grouped into as the big target, and other irregular buildings and pavings are grouped into and . By analyzing the texture features of these graphs, it can be found that the grouping effect is better when the texture features of the remote sensing map are relatively simple. The grouping effect is not satisfactory when the texture features are relatively complex, such as in the dense residential scene where the classification effect is not good. The key problem here is that, in the feature extraction process, the model confuses the road with the residential building.
In short, the token grouping block basically realizes the expected function. It can realize the classification based on feature space and build different receptive fields for large and small goals, which is conducive to the maintenance of the characteristics of subsequent small goals.
Attention Heat Maps
The text descriptions in the two datasets used in the above experiment do not distinguish the size of the target. Therefore, the above experiments can only prove that the retrieval accuracy of the model is improved without distinguishing between large and small targets; they cannot explain whether the small target retrieval is optimized. Therefore, in order to prove the contribution of the EViT method to small target feature extraction, we designed a visualization experiment. In this experiment, we extracted the gradient information of the changed attention value of each image region from the attention layer of the 11th transformer block of the vision encoder. Then, we used these values to draw a visual heat map to illustrate the correlation of the word patch.
The attention heat maps of the remote sensing image of the beach are depicted in Figure 8(1), showcasing the different concerns when the visual encoder uses the ViT or EViT method. The original image is shown on the top row and accompanied by a corresponding textual description: “The sea is close to beaches and many buildings“. The beach and sea constitute the predominant elements of the image, while the buildings merely occupy a minor portion in the upper right corner.
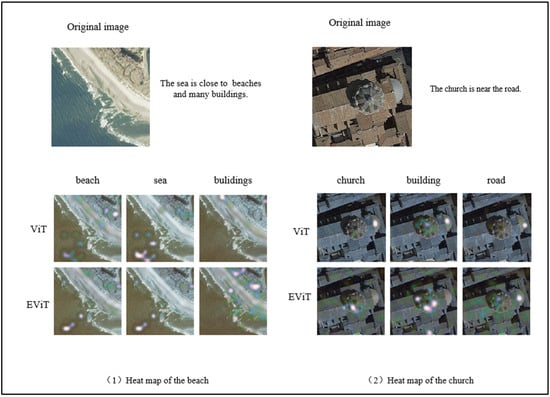
Figure 8.
Attention heat maps of keywords on the image area. (1) Heat maps of a remote sensing image of the beach. (2) Heat maps of a remote sensing image of the church. The middle row shows the heat maps obtained using ViT as the visual encoder, and the bottom row shows the heat maps obtained using EViT. The brighter the colors, the higher the correlation between the word and the image area.
In our experiment, attention heat maps were generated for three keywords: beach, sea, and buildings. As can be observed in the heat maps, when beach and sea are used as keywords, both ViT and EViT methods focus attention on regions within the image that correspond to the sea. The ViT approach is slightly better than EViT when it comes to the beach as a keyword, directing some attention to the beach area while still focusing mainly on the sea area. This discrepancy may be attributed to insufficient training samples specifically addressing this scenario. Notably, within the dataset, images typically contain both beach and sea elements at the same time, without separate training instances for each individual component. Conversely, when buildings are specified as a keyword, the EViT method significantly surpasses the ViT method by predominantly focusing its attention on the upper right corner area, where most of these buildings are located. This experimental phenomenon also proves the optimization of the EViT method for small target feature extraction. In general, using EViT enhances retrieval performance for smaller targets while also influencing feature extraction for larger targets.
In addition, there are some less-than-ideal examples. For example, the recognition effect of remote sensing images of the church type is shown in Figure 8(2). It is obvious from the heat map that the church and the road are not well distinguished by the two methods. Among them, when the ViT method is used to extract image features, the focus of three kinds of ground objects (church, building, and road) is basically in the same place. By carefully checking the text description of this image in the RSITMD dataset, we can find that the building (gray building, also used in other captions for this image) here refers to the church, and the focus on these two features is basically correct. However, the focus on the road is all wrong. When using the EViT method to extract image features, it can be seen that the attention of the model is relatively scattered. The attention of the church and building is basically in the same place, while the attention of the road is different. However, as with the ViT approach, the focus on the road is wrong.
The above results may have been caused by the fact that the church and the road usually appear at the same time in remote sensing images of the church type in the dataset, so the recognition effect of the model for the road is relatively poor. Figure 9 shows heat maps of some random images of the church in the RSITMD dataset. It can be seen that there are roads beside the church in all the images displayed. In these images, the model basically does not recognize the road. Therefore, “The church is near the road” is not a good description to distinguish church-type images. In other words, this sentence is not fine enough to support the model’s distinction between such features. This also limits further improvement of the model’s accuracy. In addition, both methods focus on the semi-circular gray area when the keyword is road. This part of the area is relatively flat and has characteristics similar to those of the road. It may have caused a miscalculation.
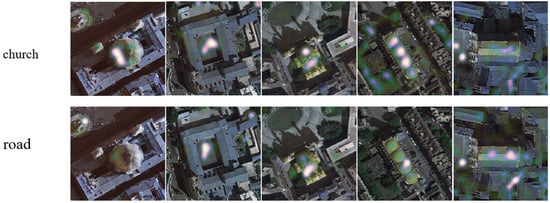
Figure 9.
The heat maps of several random remote sensing images with the theme of church. The heat maps on the top row use church as the keyword, and the heat maps on the bottom row use road as the keyword.
From the visual experimental results, our model achieves the expected goal. The attention of the model for remote sensing images is no longer limited to the global significant target but also pays attention to some important small target information. Compared with the traditional ViT model, our improved method is more distracting and meets the requirement of feature extraction for both large and small targets in cross-modal retrieval tasks.
4. Discussion
During the experiments, EViT exhibited significantly better performance on the RSITMD dataset compared to the RSICD dataset, indicating a higher improvement in retrieval accuracy over the ViT method on the former dataset. This disparity can be attributed to the richer text semantics and lower text repeatability in the RSITMD dataset. Additionally, the RSITMD dataset contained a larger proportion of small targets in the text, emphasizing the need for extracting features of small targets from the image. Furthermore, increasing the number of patches corresponded to higher retrieval accuracy and a stronger improvement over ViT. This improvement, based on the local receptive field in the feature space, shielded the interference of irrelevant image regions in the self-attention calculation. When there were fewer patches, this interference was relatively small and did not require shielding. However, as the number of patches increased, the softmax computation mechanism could not effectively address the interference caused by irrelevant regions.
The effectiveness of the proposed method has been proven by the experimental results in the previous section. We grouped tokens by feature similarity and set up twin networks to improve the retrieval efficiency of the model for small targets. However, in remote sensing image cross-modal retrieval, the big target is also an important part of the text description. Another problem to be considered in the experiment is that there is interference between small target and large target feature extraction when using the EViT method to enhance small target feature extraction.
We think the number of twinned transformer blocks represents how much emphasis the model places on small targets. Therefore, we designed experiments to explore the effect of changing the number of transformer blocks on retrieval accuracy. Table 5 shows the retrieval accuracy when the EViT method was used for image feature extraction when different numbers of twinned transformer blocks were set. Due to GPU performance constraints, the value of (a) was limited to the range of [1, 2, 3, 4]. In order to facilitate the observation of the changing trend of retrieval accuracy with the number of twinned transformer blocks, mR was used as the only comparison index.

Table 5.
The retrieval accuracy corresponds to the number of twinned transformer blocks when the batch size was 32. EViT(a) indicates that (a) transformer blocks out of 12 were modified in the EViT method.
Table 5 illustrates that increasing the number of twinned transformer blocks led to higher retrieval accuracy and enhanced scene-distinguishing capability when the number of twinned transformer blocks was less than four. The reason for this phenomenon may be that, with the increase in the number of twinned transformer blocks, the feature extraction ability of the model for small targets in remote sensing images will increase, and it will be more in line with the fine-grained text description. This is conducive to the improvement of retrieval accuracy. However, no further experiments were conducted under the same variable due to resource constraints.
To explore the effects of a more twinned transformer block, we performed a simple extension experiment and set the batch size to 16. At the same time, in order to achieve the same training effect as much as possible, when the batch size was 16, we designed the accumulation of gradients for every two training batches. In order to ensure the regularity of the network structure, we compared the retrieval accuracy when adding three, four, six, and eight twinned transformer blocks. When the number of twinned transformer blocks was between three and four, the position of the twinned transformer blocks selected by us was the same as the corresponding position in Table 5. When the number of twinned transformer blocks was six, we changed an odd number of the 12 blocks to twinned transformer blocks. When the number of twinned transformer blocks was eight, we changed the first three of every four blocks to twinned transformer blocks. Because of the different batch sizes used, the results are not displayed in the same table.
The results in the Table 6 show that model retrieval was best when the number of twinned transformer blocks was four. When the number exceeded four, the retrieval accuracy tended to decline.

Table 6.
The retrieval accuracy corresponds to the number of twinned transformer blocks when the batch size was 16.
Through analysis, we found that the reason for the above experimental phenomenon is that there is interference between small target and large target feature extraction when the EViT method is used to enhance small target feature extraction. By exploring the impact of changing the number of transformer blocks on retrieval accuracy, it was observed that the model achieved optimal performance on the RSITMD dataset when four blocks were modified. However, when the number of modified blocks was less than four, the retrieval accuracy gradually improved with an increasing number of changed blocks, but it gradually decreased and even fell below that of the ViT method when the number exceeded four. This preliminary finding suggests that enhancing the feature extraction ability of small targets can improve retrieval effectiveness to a certain extent, but it may also hinder the retrieval of features for large targets. Hence, a balanced consideration of both aspects is essential, depending on the retrieval requirements.
The existing model structure remains somewhat rigid, and the number and position of the twinned transformer block in the visual encoder are still experimental conclusions. In future work, adjustments to the structure will be necessary when the method is applied to different datasets. For images with varying proportions of small targets, the network structure may need flexible adjustments to different blocks. When the proportion of small targets is large, the number of twinned transformer blocks should also be appropriately increased, and vice versa. Further, a network architecture that dynamically adjusts the number and position of twinned transformer blocks is needed. In addition, some details also require further optimization, such as the selection of the classification threshold in the token grouping block, γ, in Equation (9). Finally, it should be noted that the method is not only for small target feature extraction. It is proposed on the premise that both large and small targets need to be preserved, so the result may not be superior if this method is applied solely to the feature extraction of small targets.
5. Conclusions
In this paper, we propose an enhanced ViT method to tackle the challenge of extracting small target features in cross-modal image–text retrieval of remote sensing images. Addressing the interference problem of large targets on small targets within the global receptive field of conventional ViT methods, our approach constructs different receptive fields based on the saliency and similarity of image regions to enhance the ability to extract small target features. Unlike the conventional method of designing local receptive fields in the spatial dimension, our method groups image regions in the feature dimension to construct different receptive fields. Additionally, to optimize the network structure and reduce the number of parameters, we introduced a twin network structure, which improved model retrieval accuracy while only marginally increasing computational complexity. The experimental evaluation of public datasets demonstrates the effectiveness of the proposed method in improving accuracy. Compared with ViT, the mR indices of this method on the Remote Sensing Image–Text Match Dataset improved by 2.08%, with an increase of only 1.41% in model parameters.
The limitation of this study is that the retrieval effects of large and small targets were not evaluated in the experiment. In remote sensing images, the object scale is different, and there is demand for both large and small object retrieval. In order to better analyze the performance of the model when retrieving objects at different scales, it is necessary to design better evaluation indexes. This makes it difficult for our proposed method to enhance the expression of small targets to be effectively verified quantitatively using existing indicators. In future research, we will focus on enhancing the existing network structure to dynamically adapt to scenarios where both large and small target feature extraction requirements exist and improving the accuracy and generalization ability of the model.
Author Contributions
Conceptualization, J.Z., L.W. and F.Z.; methodology, J.Z.; software, F.Z.; validation, F.Z. and J.Z.; formal analysis, L.W.; investigation, X.W.; resources, H.Z.; data curation, J.Z.; writing—original draft preparation, J.Z.; writing—review and editing, J.Z., L.W. and F.Z.; visualization, J.Z.; supervision, X.W.; project administration, H.Z.; funding acquisition, H.Z. All authors have read and agreed to the published version of the manuscript.
Funding
The research was supported by the National Natural Science Foundation of China (NSFC) (Grant No. 62102423).
Data Availability Statement
The original contributions presented in the study are included in the article, further inquiries can be directed to the authors.
Conflicts of Interest
The authors declare no conflicts of interest.
References
- Zhang, X.; Li, W.; Wang, X.; Wang, L.; Zheng, F.; Wang, L.; Zhang, H. A Fusion Encoder with Multi-Task Guidance for Cross-Modal Text–Image Retrieval in Remote Sensing. Remote Sens. 2023, 15, 4637. [Google Scholar] [CrossRef]
- Dosovitskiy, A.; Beyer, L.; Kolesnikov, A.; Weissenborn, D.; Zhai, X.; Unterthiner, T.; Dehghani, M.; Minderer, M.; Heigold, G.; Gelly, S. An image is worth 16x16 words: Transformers for image recognition at scale. arXiv 2020, preprint. arXiv:2010.11929. [Google Scholar] [CrossRef]
- Zheng, F.; Wang, X.; Wang, L.; Zhang, X.; Zhu, H.; Wang, L.; Zhang, H. A Fine-Grained Semantic Alignment Method Specific to Aggregate Multi-Scale Information for Cross-Modal Remote Sensing Image Retrieval. Sensors 2023, 23, 8437. [Google Scholar] [CrossRef] [PubMed]
- Yang, L.; Feng, Y.; Zhou, M.; Xiong, X.; Wang, Y.; Qiang, B. A Jointly Guided Deep Network for Fine-Grained Cross-Modal Remote Sensing Text–Image Retrieval. J. Circuits Syst. Comput. 2023, 32, 2350221. [Google Scholar] [CrossRef]
- Cheng, Q.; Zhou, Y.; Fu, P.; Xu, Y.; Zhang, L. A deep semantic alignment network for the cross-modal image-text retrieval in remote sensing. IEEE J. Sel. Top. Appl. Earth Obs. Remote Sens. 2021, 14, 4284–4297. [Google Scholar] [CrossRef]
- Ding, Q.; Zhang, H.; Wang, X.; Li, W. Cross-modal retrieval of remote sensing images and text based on self-attention unsupervised deep common feature space. Int. Remote Sens. 2023, 44, 3892–3909. [Google Scholar] [CrossRef]
- Rahhal, M.M.A.; Bazi, Y.; Abdullah, T.; Mekhalfi, M.L.; Zuair, M. Deep unsupervised embedding for remote sensing image retrieval using textual cues. Appl. Sci. 2020, 10, 8931. [Google Scholar] [CrossRef]
- Lv, Y.; Xiong, W.; Zhang, X.; Cui, Y. Fusion-based correlation learning model for cross-modal remote sensing image retrieval. IEEE Geosci. Remote Sens. Lett. 2021, 19, 1–5. [Google Scholar] [CrossRef]
- Abdullah, T.; Bazi, Y.; Al Rahhal, M.M.; Mekhalfi, M.L.; Rangarajan, L.; Zuair, M. TextRS: Deep bidirectional triplet network for matching text to remote sensing images. Remote Sens. 2020, 12, 405. [Google Scholar] [CrossRef]
- Zheng, F.; Li, W.; Wang, X.; Wang, L.; Zhang, X.; Zhang, H. A cross-attention mechanism based on regional-level semantic features of images for cross-modal text-image retrieval in remote sensing. Appl. Sci. 2022, 12, 12221. [Google Scholar] [CrossRef]
- Yuan, Z.; Zhang, W.; Rong, X.; Li, X.; Chen, J.; Wang, H.; Fu, K.; Sun, X. A lightweight multi-scale crossmodal text-image retrieval method in remote sensing. IEEE Trans. Geosci. Remote Sens. 2021, 60, 1–19. [Google Scholar] [CrossRef]
- Li, H.; Xiong, W.; Cui, Y.; Xiong, Z. A fusion-based contrastive learning model for cross-modal remote sensing retrieval. Int. J. Remote Sens. 2022, 43, 3359–3386. [Google Scholar] [CrossRef]
- Alsharif, N.A.; Bazi, Y.; Al Rahhal, M.M. Learning to align Arabic and English text to remote sensing images using transformers. In Proceedings of the 2022 IEEE Mediterranean and Middle-East Geoscience and Remote Sensing Symposium (M2GARSS), Istanbul, Turkey, 7–9 March 2022; pp. 9–12. [Google Scholar]
- Yu, H.; Deng, C.; Zhao, L.; Hao, L.; Liu, X.; Lu, W.; You, H. A Light-Weighted Hypergraph Neural Network for Multimodal Remote Sensing Image Retrieval. IEEE J. Sel. Top. Appl. Earth Obs. Remote Sens. 2023, 16, 2690–2702. [Google Scholar] [CrossRef]
- Yao, F.; Sun, X.; Liu, N.; Tian, C.; Xu, L.; Hu, L.; Ding, C. Hypergraph-enhanced textual-visual matching network for cross-modal remote sensing image retrieval via dynamic hypergraph learning. IEEE J. Sel. Top. Appl. Earth Obs. Remote Sens. 2022, 16, 688–701. [Google Scholar] [CrossRef]
- Yu, H.; Yao, F.; Lu, W.; Liu, N.; Li, P.; You, H.; Sun, X. Text-image matching for cross-modal remote sensing image retrieval via graph neural network. IEEE J. Sel. Top. Appl. Earth Obs. Remote Sens. 2022, 16, 812–824. [Google Scholar] [CrossRef]
- He, L.; Liu, S.; An, R.; Zhuo, Y.; Tao, J. An end-to-end framework based on vision-language fusion for remote sensing cross-modal text-image retrieval. Mathematics 2023, 11, 2279. [Google Scholar] [CrossRef]
- Yuan, Z.; Zhang, W.; Tian, C.; Rong, X.; Zhang, Z.; Wang, H.; Fu, K.; Sun, X. Remote sensing cross-modal text-image retrieval based on global and local information. IEEE Trans. Geosci. Remote Sens. 2022, 60, 1–16. [Google Scholar] [CrossRef]
- Chen, G.; Wang, W.; Tan, S. Irstformer: A hierarchical vision transformer for infrared small target detection. Remote Sens. 2022, 14, 3258. [Google Scholar] [CrossRef]
- Peng, J.; Zhao, H.; Zhao, K.; Wang, Z.; Yao, L. CourtNet: Dynamically balance the precision and recall rates in infrared small target detection. Expert Syst. Appl. 2023, 233, 120996. [Google Scholar] [CrossRef]
- Li, C.; Huang, Z.; Xie, X.; Li, W. IST-TransNet: Infrared small target detection based on transformer network. Infrared Phys. Technol. 2023, 132, 104723. [Google Scholar] [CrossRef]
- Ren, S.; Zhou, D.; He, S.; Feng, J.; Wang, X. Shunted self-attention via multi-scale token aggregation. In Proceedings of the IEEE/CVF Conference on Computer Vision and Pattern Recognition, New Orleans, LA, USA, 18–24 June 2022; pp. 10853–10862. [Google Scholar]
- Faghri, F.; Fleet, D.J.; Kiros, J.R.; Fidler, S.V. Improving visual-semantic embeddings with hard negatives. arXiv 2017, arXiv:1707.05612. [Google Scholar]
- Yuan, Z.; Zhang, W.; Fu, K.; Li, X.; Deng, C.; Wang, H.; Sun, X. Exploring a Fine-Grained Multiscale Method for Cross-Modal Remote Sensing Image Retrieval. IEEE Trans. Geosci. Remote Sens. 2022, 60, 3078451. [Google Scholar] [CrossRef]
- Lu, X.; Wang, B.; Zheng, X.; Li, X. Exploring models and data for remote sensing image caption generation. IEEE Trans. Geosci. Remote Sens. 2017, 56, 2183–2195. [Google Scholar] [CrossRef]
- Huang, Y.; Wu, Q.; Song, C.; Wang, L. Learning semantic concepts and order for image and sentence matching. In Proceedings of the IEEE Conference on Computer Vision and Pattern Recognition, Salt Lake City, UT, USA, 18–23 June 2018; pp. 6163–6171. [Google Scholar]
Disclaimer/Publisher’s Note: The statements, opinions and data contained in all publications are solely those of the individual author(s) and contributor(s) and not of MDPI and/or the editor(s). MDPI and/or the editor(s) disclaim responsibility for any injury to people or property resulting from any ideas, methods, instructions or products referred to in the content. |
© 2024 by the authors. Licensee MDPI, Basel, Switzerland. This article is an open access article distributed under the terms and conditions of the Creative Commons Attribution (CC BY) license (https://creativecommons.org/licenses/by/4.0/).