1. Introduction
With the rapid development of radar systems and computer technology, the simulation of wideband radar target echo signals plays a critical role in radar system development and data processing. This is not only a significant topic in the field of radar recognition, but also a key factor in advancing radar target detection and recognition technologies [
1,
2,
3]. Therefore, in-depth research into the simulation techniques used for complex radar target echoes, achieving the high-precision and fast modeling of target echoes in the time frequency domain, and fully leveraging their inherent physical attribute features have become primary tasks in current research.
Over the years, the electromagnetic (EM) modeling technology for radar target characteristics has developed rapidly. In the field of target characteristics, the ability to simulate and obtain target EM scattering data has significantly advanced. Cui et al. [
4] introduced a beam tracing (BT) technique as an alternative to ray tracing (RT) in traditional time-domain shooting and bouncing ray (TD-SBR) methods. This approach computes the transient scattering response of electrically large conductive targets under pulsed plane wave illumination. Zhang et al. [
5] proposed a hybrid algorithm by combining the time-domain finite element method (TD-FEM) with the generalized scattering matrix technique to simulate and analyze wideband monostatic radar cross-section (RCS) and inverse synthetic aperture radar (ISAR) images of large and deep cavities. Leveraging the high range resolution of wideband radar, a more practically significant unified wideband radar distributed target model was developed [
6]. Aktepe [
7] simplified the physical optics (PO) integral on high-order triangular surfaces to line integrals and utilized the Gauss Legendre quadrature rule (GLQR) for accurate computation, simulating the transient scattering of unit spheres and high-order triangles. Moreover, inverse imaging algorithms for SAR based on time-domain stepped-frequency radar methods were introduced [
8,
9,
10,
11]; these involved replacing linear frequency-modulated pulse excitation with Gaussian pulses, demodulating scattering echo data, compressing pulses, and performing the azimuth inverse fast Fourier transform (IFFT) to obtain radar wideband echo signals. Additionally, a range of efficient EM scattering domain PO modeling methods were proposed for single/multi-layer anisotropic medium-coated metal conductor targets [
12,
13,
14,
15,
16,
17].
However, in practical applications, the rapidly increasing ability to simulate radar target characteristics has not fully translated into improved target detection and recognition. The support provided by target characteristics for target recognition research has primarily been limited to offering measurement and simulation data on the target’s EM scattering properties. Traditional simulations of target characteristics produce data by aggregating the scattering contributions from various parts of the target (such as components), resulting in the overall scattering field or total scattering field of the target. However, recognition and interpretation are more interested in the scattering data from individual parts of the target before aggregation and the “information” hidden behind them. Unfortunately, this information is lost during coherent synthesis, making it challenging to provide scattering center (SC) characteristic models that incorporate target knowledge information. This significantly limits the effective application of target characteristic modeling technology in target recognition.
Furthermore, the effective simulation of echo signals typically requires integrating information from both radar-transmitted signals (RTSs) and the EM scattering characteristics of radar targets. Despite extensive research in the field of radar target echo simulation, several issues, as illustrated in
Figure 1a, persist:
Firstly, the form of radiation sources in practical application environments is complex and diverse. Once the radiation excitation changes, traditional simulation methods require modifications to the algorithm systems and underlying operational code, necessitating recalculation point by point [
8]. Consequently, challenges such as excessive sampling points, lengthy computation times, and large data storage volumes arise, making it difficult to meet the real-time design requirements of radar recognition systems.
Secondly, although there have been advancements in target EM scattering simulation algorithms, they are limited to providing simulation data and do not meet the demand for various parts of scattering data and the underlying “information” required for target recognition [
4,
5,
6,
7,
8,
9,
10,
11,
12,
13,
14,
15,
16,
17]. Unfortunately, these critical pieces of information are often lost during the synthesis process, making it extremely challenging to extract target scattering characteristic information, particularly when dealing with the complex requirements of precise radar target recognition systems.
Overall, the development of simulation algorithms and target feature extraction techniques is not entirely aligned, resulting in a significant amount of valuable data remaining unrealized in terms of practical target identification and intelligence gathering capabilities. Therefore, further research into the extraction of wideband radar target scattering characteristics is an urgent issue in the current research field [
18].
At high frequencies, the scattering phenomenon of electrically large radar targets can be approximated by the composite response of various SCs [
19]. The SC model effectively describes the EM scattering characteristics of targets and finds extensive application in SAR Automatic Target Recognition (ATR) systems. Originating from fundamental physical principles, SCs represent essential aspects of EM scattering, encapsulating valuable information about target structures [
20,
21,
22,
23,
24,
25,
26,
27]. In target recognition based on EM scattering characteristics, the problem of feature extraction fundamentally translates into the extraction and description of the target’s SCs. The construction of SC models is a crucial and foundational aspect of target recognition applications. High-confidence target recognition results are achieved through correct decisions and sufficient criteria, with target “information” being vital to forming these criteria. The approach to constructing target SC feature models and the quality of these models directly impacts the capacity and effectiveness of target recognition. Designing and building EM scattering feature models that encapsulate rich physical knowledge about the target, and using this knowledge to assist in target interpretation and recognition, is an effective strategy for overcoming challenges in target recognition under extended operational conditions.
Researchers from the Electromagnetic Engineering Laboratory (EEL) at Wuhan University, including He et al. [
21,
22,
23], introduced a parametric forward-modeling approach for complex target component-level SCs based on geometric models. This method, rooted in high-frequency theory, separates the forward scattering of SCs and quantitatively computes their contributions, deriving model parameters from EM mechanisms and target geometry. By imposing physical constraints to eliminate multiple scattering sources, the model’s determinacy is enhanced. Zhang et al. [
24] integrated this forward-modeling method of SCs into SAR target recognition, proposing a rapid indexing technique for SAR targets based on geometric model contour area features and designing a hierarchical SAR ATR system based on SC forward modeling. Chen et al. [
25,
26] conducted a thorough analysis of compound scattering modeling for stationary and time-varying ship targets using the SC forward-modeling approach. In rough surface environments, Hua et al. [
27] provided a detailed calculation process for the comprehensive framework of the forward modeling of coated target SCs and SC parameter assignment.
Previous research has demonstrated the feasibility and efficacy of the forward-modeling approach for SCs in rapidly reconstructing the EM characteristics of complex targets and describing their physical properties. However, this research has primarily focused on the frequency-domain scattering characteristics of targets and has not provided a comprehensive solution for wideband echo responses, thus limiting its value for high-precision radar target recognition systems. Earlier studies have explored target time-domain echo reconstruction based on SC models, but they have often overlooked the physical properties of SCs, and their models have primarily been used for echo signal generation, offering limited applicability [
28].
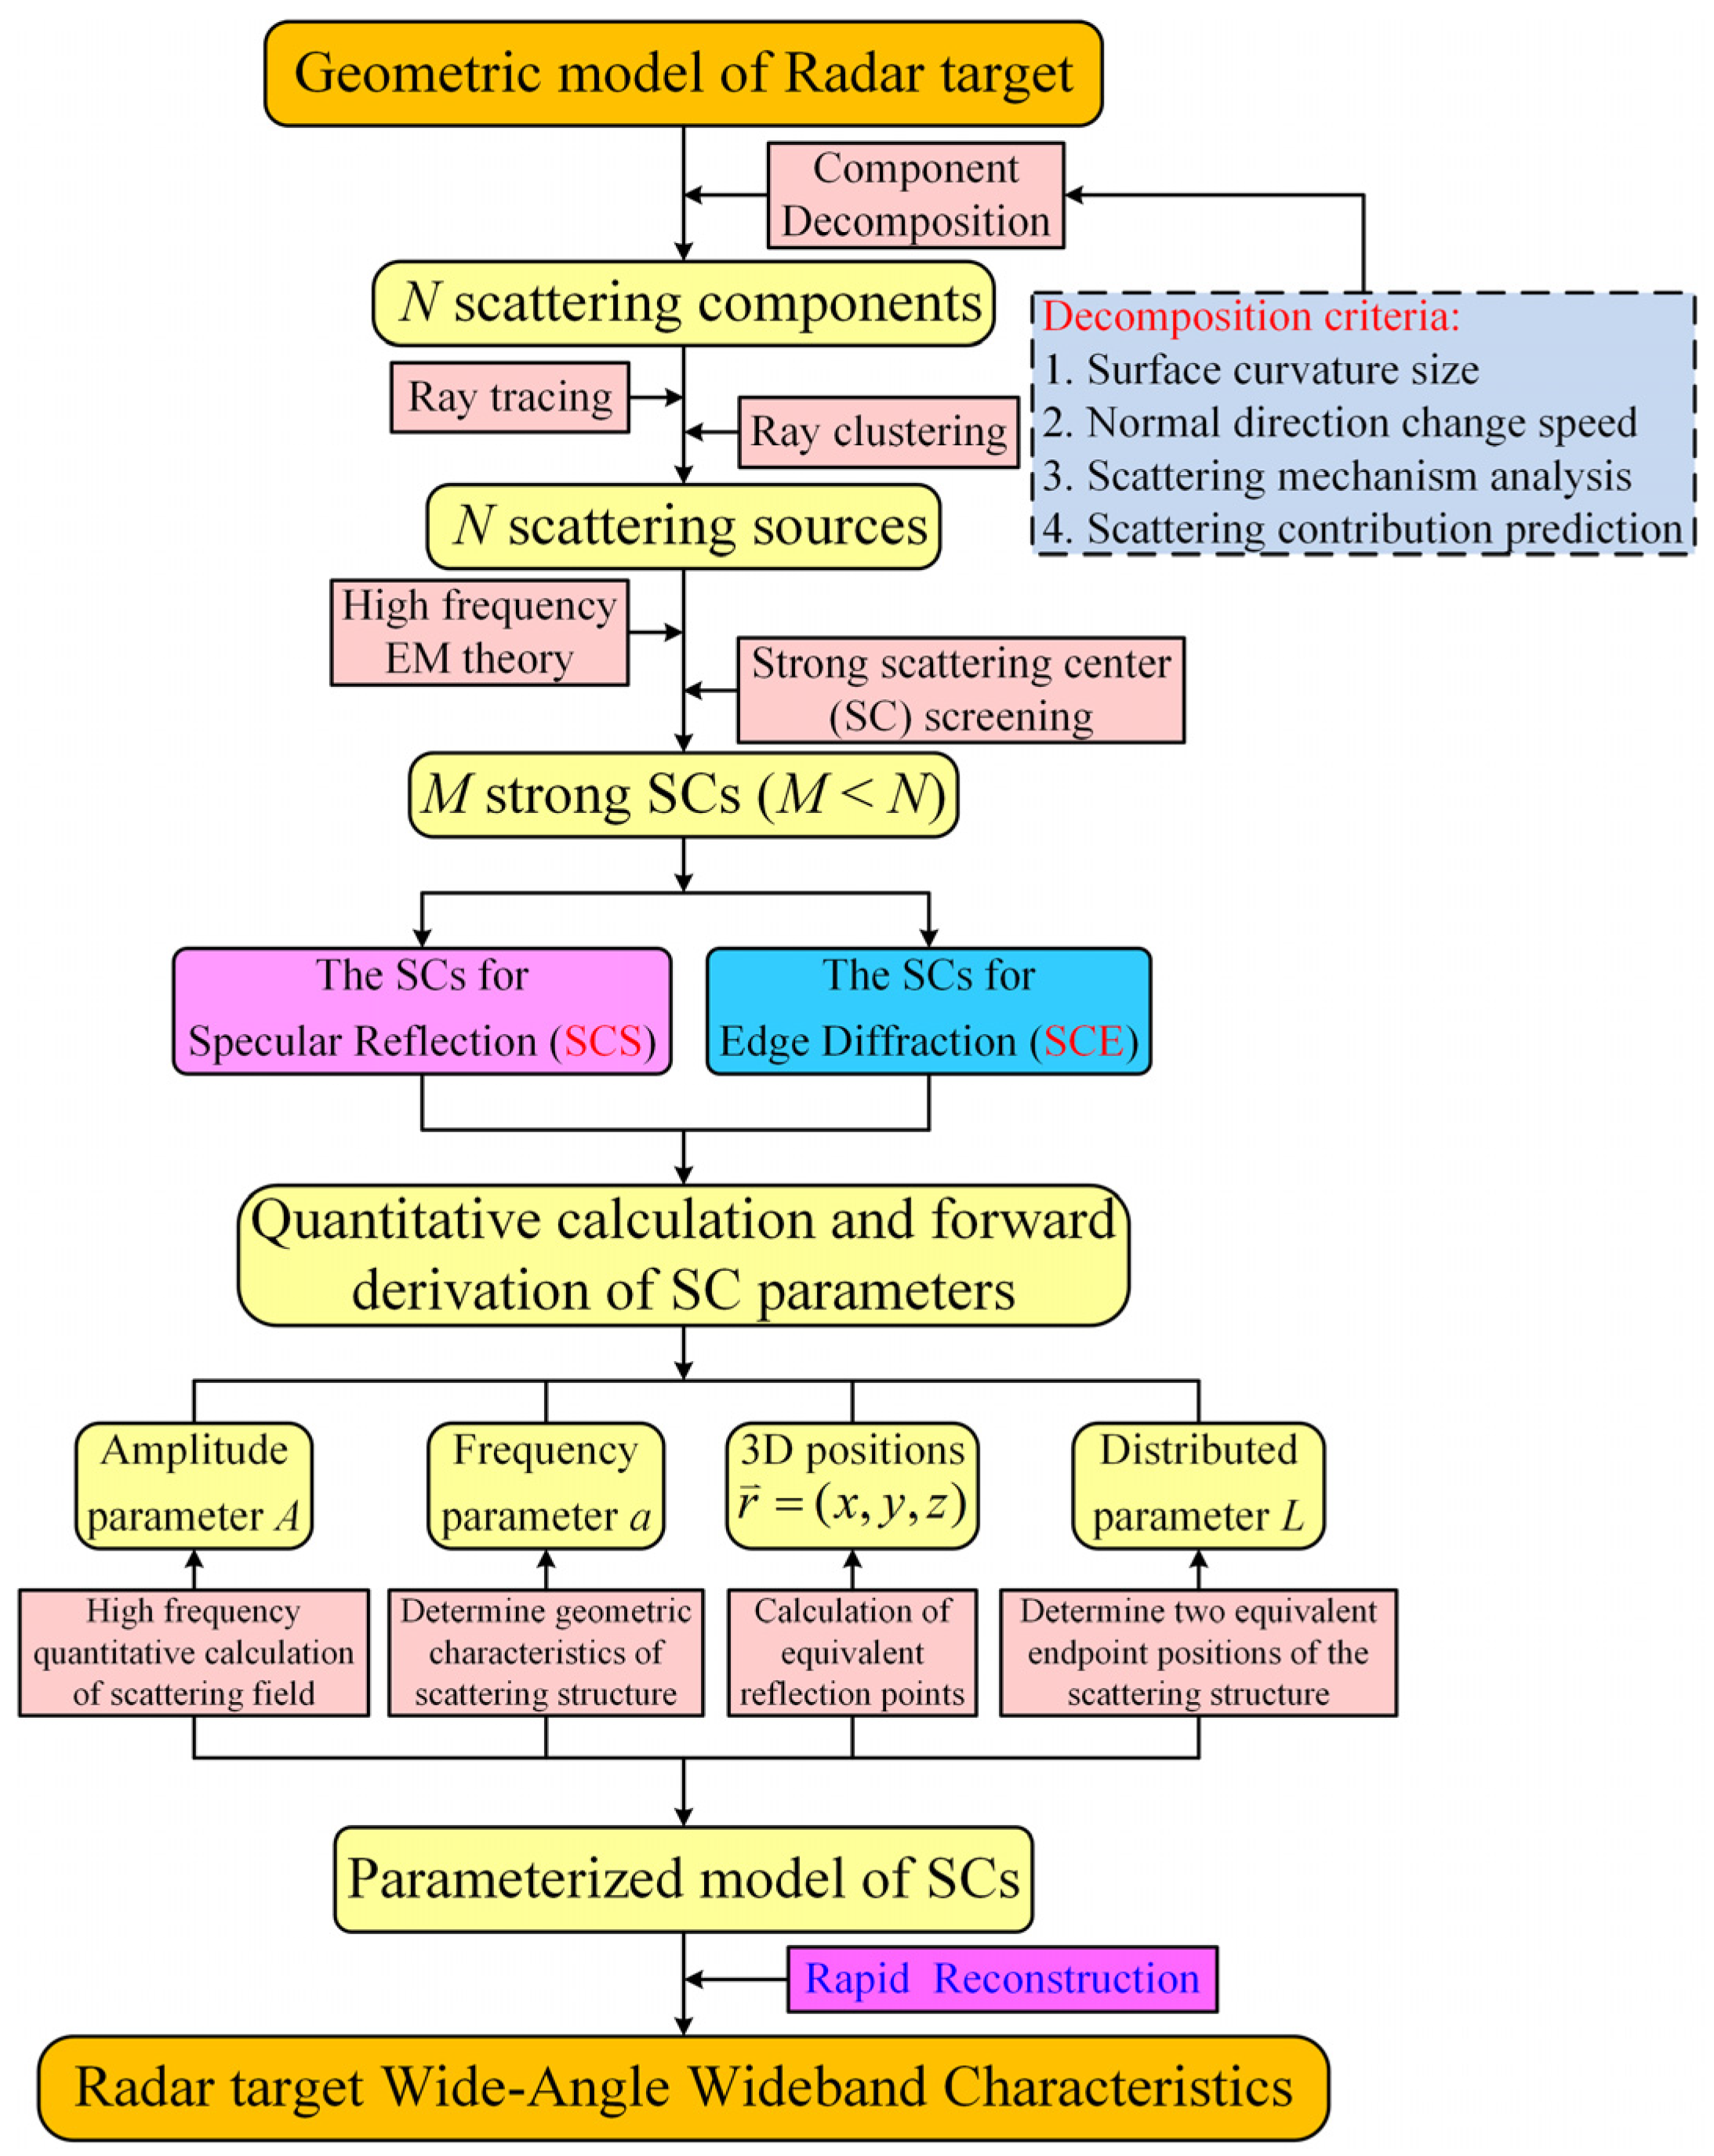
To address this gap, as shown in
Figure 1b, this paper presents research based on a three-dimensional forward SC model, aiming to efficiently model complex target radar echo responses under arbitrary wideband excitation. Initially, leveraging the target’s geometric model and EM scattering mechanism, spatial ray tracing technology, in conjunction with high-frequency EM theory, is employed to quantitatively characterize and forward calculate the parameters of target SC models, establishing a precise correspondence between the scattering structure on the target and the strong SCs. Subsequently, utilizing the high-precision three-dimensional SC model at a single frequency point, the wideband frequency-domain response of each strong SC is swiftly reconstructed, and the target echo impulse response model under unit impulse signal excitation is constructed through IFFT, enabling the decomposition of the target echo into the superposition of impulse signals with varying delays (temporal distance images of strong SCs). This response model serves as a physical representation of the target’s inherent properties, remaining unaffected by changes in radiation sources. Finally, by convolving the unit impulse response of each SC with any wideband incident signal and aggregating them, the wideband echo signal of the target can be obtained.
The proposed method introduces several innovations:
- (1)
High computational efficiency: Unlike traditional simulation methods that require algorithm redesign and recalculations from scratch when the radiation source changes, the proposed method simply convolves the constructed target impulse response model with any wideband incident signal and aggregates the contributions of each SC to obtain the target’s echo signal. This approach maintains computational efficiency even when the radiation source changes.
- (2)
Significant data compression effect: Utilizing the three-dimensional SC’s advantage of “point frequency calculation, wideband generation,” the proposed echo model only needs to compute model parameters under a fixed observation posture and central frequency point to reconstruct the target’s wideband echo data. This results in reduced computational and time complexity while ensuring the accuracy of the results. Moreover, the model’s concise form minimizes memory usage during computation, facilitating effective data compression and supporting the establishment of target feature databases.
- (3)
Clear and comprehensive physical properties of the model: Adopting a forward-modeling approach of “cause-to-effect,” the proposed echo model effectively describes the correspondence between the impulse response at different delays in the echo signal and the target’s local structure. It simultaneously provides the overall scattering data of the target, scattering data for each target part, and information about the target’s various components and structures. The model parameters serve as characterizations of this information at the EM scattering level, offering theoretical support for addressing the physical interpretability issues associated with radar target identification in the optical region.
This paper utilizes the MSTAR SLICY, Simplified Tank, and Complex Tank models to illustrate the escalating complexity of target geometric models. Initially, with a fixed radar observation angle, a three-dimensional SC model of the target is constructed at the central frequency point, which is derived from the target’s geometric model. The model parameters are accurately mapped to the target’s scattering structures. Within the required wideband range, this paper reconstructs the target’s wideband frequency domain response using the single-frequency SC model. The reconstruction results of the three experimental targets maintain a root mean square error (RMSE) of less than 3 dB compared to the simulation results. Subsequently, an inverse Fourier transform is performed on the wideband frequency domain response to obtain the impulse response model of each SC under unit impulse signal excitation. Finally, the model is convolved with radar incident signals (stepped frequency signal, ultra-wideband electromagnetic pulse (UWB EMP), and linear frequency-modulated (LFM) signal), and the contributions of each strong SC are superimposed to obtain the target’s real echo signal under various radiation source excitations.
The experimental results demonstrate that the high-resolution range profiles (HRRPs) reconstructed by the model match the simulation results, and the relative physical distances between peak points in the echo signal correspond to the actual geometric dimensions of the target. The correctness and effectiveness of the proposed radar target wideband echo response forward-modeling method are verified in both the time and frequency domains. Additionally, this paper provides a comparison of the computational time and memory usage of the proposed method with traditional simulation algorithms, showing significant computational acceleration and memory compression effects.
The remainder of the article is structured as follows:
Section 2 introduces the forward-modeling method of the radar target wideband echo based on the scattering center model, detailing the overall framework and calculation procedures.
Section 3 presents a case analysis, starting with the ability of the MSTAR SLICY target to perform forward modeling of the scattering centers and reconstructing wideband time-frequency domain echo signals under various radiation sources. This is followed by examples of a Simplified Tank and a Complex Tank, increasing in geometric complexity to explore and validate the applicability and accuracy of the proposed echo model.
Section 4 concludes with a further discussion and summary of the findings.
2. Forward Modeling of Radar Target Wideband Echo Based on Scattering Center Model
The purpose of studying radar echo signals extends beyond merely simulating echoes in real-world scenarios; it is to uncover the underlying physical properties they reveal. This research adopts a forward-modeling approach using SC models to comprehensively characterize the EM scattering properties of the target. The radar target is treated as an independent system function, with the radar echo signal representing the output of the radar transmission signal (RTS) passing through this radar target system [
29].
Due to the wide frequency band of wideband radar transmissions, wideband radar possesses a significantly enhanced resolution capability. Meanwhile, operating in the high-frequency domain, radar targets typically exceed the wavelength in size, and are thus classified as wideband radar targets. In this regime, the target’s overall backscattering field results from the accumulation of scattering fields from multiple independent SCs distributed across the target. Each SC’s scattering field is primarily influenced by the incident field on that particular center and nearby geometric features. Therefore, for complex targets under illumination from high-frequency wide radar beams, their EM scattering behavior can be effectively approximated by characterizing a set of isolated SCs. The forward-modeling process for EM SCs is depicted in
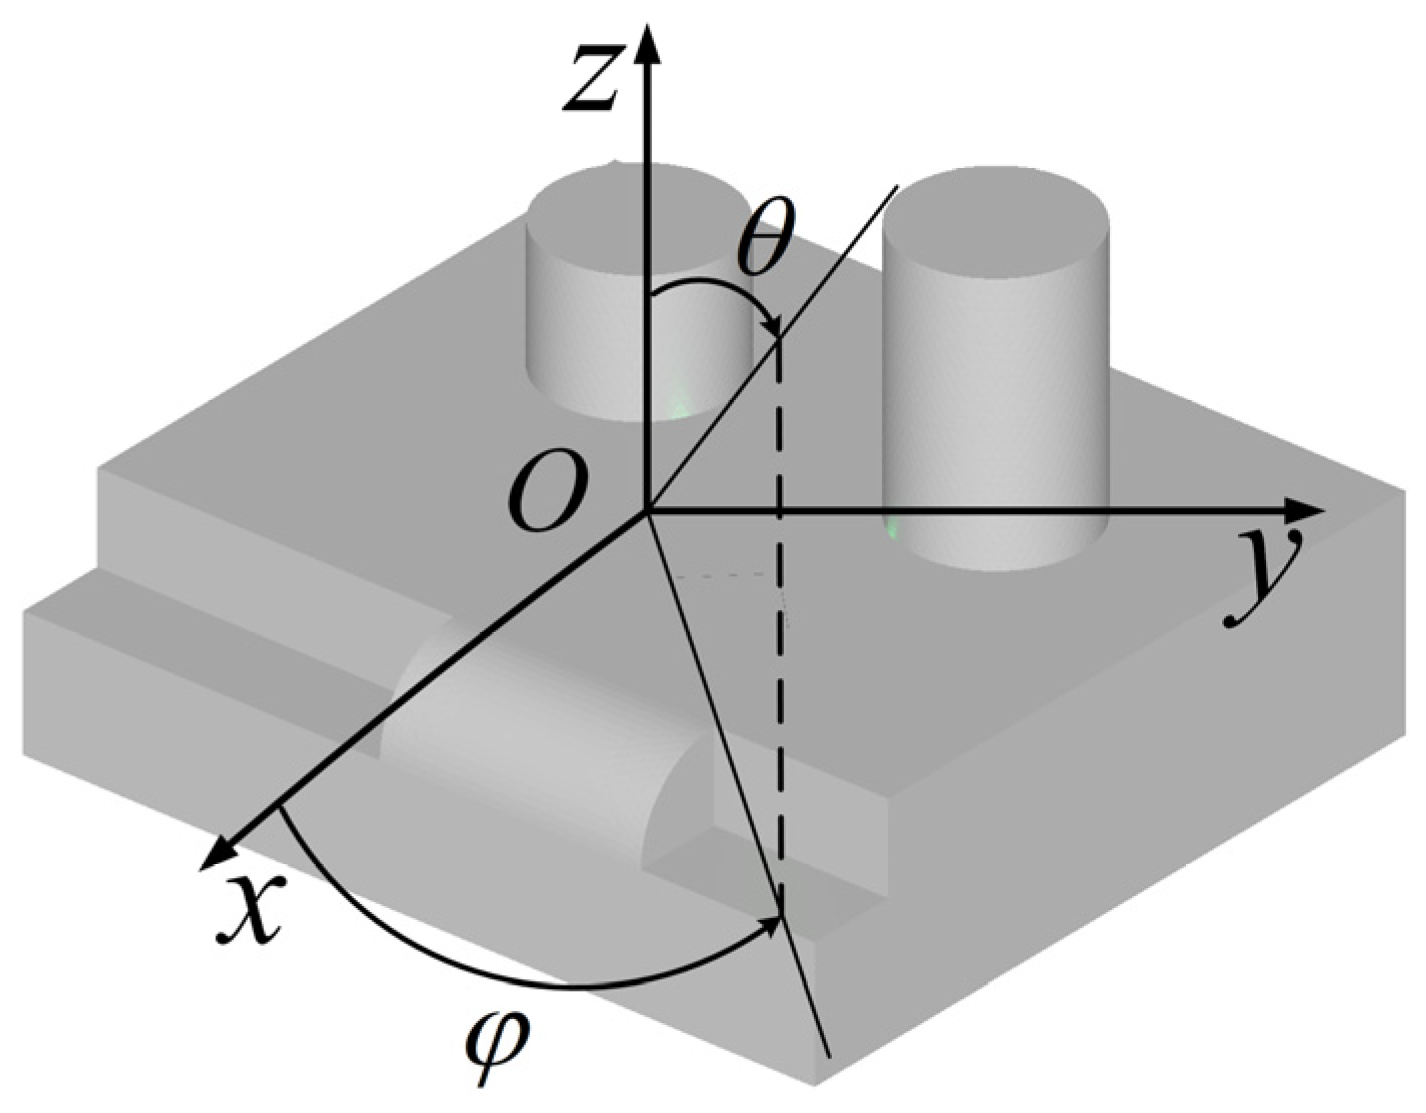
Figure 2, where computer-aided design (CAD) models, comprising small triangular surfaces termed surface elements, represent the target. The target’s SC model is composed of both SCs of surface (SCS) and SCs of edge (SCE).
Currently, the main models describing SCs include the ideal point scatterer model [
30], the Damped Exponent (DE) model [
31], and the attributed SC model based on the Geometric Theory of Diffraction (GTD) [
32,
33,
34]. The first two models cannot accurately characterize the EM properties of targets. In 1995, L.C. Potter developed the GTD model, which, based on geometric diffraction and PO theory, describes the frequency dependence of SC responses using a power function [
32]. The GTD model introduces type parameters that not only characterize the frequency characteristics of complex scattering mechanisms, but also reflect the geometric features of the corresponding structures, thereby revealing the true scattering mechanisms of the target more precisely.
In 1997, L.C. Potter introduced the attributed SC model, which retained the GTD model’s frequency description and employed an exponential function to model the azimuth [
33]. In 1999, Potter et al. proposed an improved version of the attributed SC model, which more comprehensively accounted for the azimuthal description of scattering. This model categorized attributed SCs into local and distributed types [
34]. Additionally, the model was extended to three dimensions [
23]. These enhancements significantly improved the model’s accuracy and broadened its range of applications.
The parametric model of target SCs provides a refined and accurate representation of the target’s detailed information, reflecting the physical significance of its EM characteristics. Utilizing this parametric model for radar target recognition aligns more closely with the EM scattering mechanisms of the echo signals. This model not only supports feature matching in recognition systems but also serves as a crucial source of information for target identification. Therefore, establishing a reasonable parametric model of SCs that accurately reflects the target’s high-frequency scattering characteristics in a concise form is essential for analysis based on EM scattering mechanisms.
In conclusion, considering the scattering mechanisms and characteristics of complex targets, this paper adopts the currently mainstream and increasingly mature three-dimensional attributed SC model to represent the broadband radar target’s SCs, as detailed below:
where
θ and
φ represent the angle for extracting target scattering features.
Ai denotes the amplitude parameter of the
i-th SC,
f is the frequency of the incident wave,
fc is the frequency of the SC,
c is the speed of light,
Li represents the length parameter of the SC,
αi is the frequency-dependent factor,
is the three-dimensional position vector of the SC, and
is the azimuth angle of the distributed SC. If the SC is of the local type (LSC), then
; if it is of the distributed type (DSC), then
. For LSCs, their azimuthal dependence is approximately described using a decaying exponential function, where the decay parameter
γ characterizes the mild azimuthal dependence of the amplitude. In contrast, the azimuthal dependence of the scattering intensity and beamwidth for DSC is described using a sinc(
x) function.
The parameters of the attributed SC model, as represented by Equation (1), comprehensively describe the physical attributes of corresponding structures, such as position, shape, and size. These parameters have clear physical significance, providing a more accurate approximation of real targets. By using a limited number of SC parameters, the model can accurately depict the scattering characteristics of high-frequency targets, significantly reducing the dimensionality of the feature space, enhancing the recognition efficiency, and decreasing the storage requirements. SC features, being local in nature, are particularly well suited to capturing the dynamic changes in target characteristics within complex imaging environments, such as varying structural configurations, connections, and occlusions.
The forward modeling of SCs requires the SC parameters for a target to be calculated from a single observation angle. By then varying the azimuth angle and frequency range according to specified increments and substituting these into Equation (1), one can reconstruct the target’s echo data over a range of angles and frequency bands. This method ensures accuracy while requiring significantly less data and computation time compared to direct measurement or simulation, enabling the rapid simulation of wideband radar echoes and real-time complex scattering.
Compared to directly storing wideband radar target characteristics, representing a target’s EM scattering properties with a three-dimensional SC model offers notable advantages, including reduced storage requirements, excellent extrapolation performance, fast reconstruction, and clear physical interpretation. The three-dimensional SC model is a parameterized super-resolution model that can swiftly and accurately reconstruct the wideband EM scattering characteristics of targets under different orientations and resolutions. It possesses superior frequency and angle extrapolation capabilities, avoiding the need for extensive raw data storage and greatly reducing storage demands, thereby supporting real-time computation needs.
This research begins by analyzing the time-frequency characteristics of common RTSs, such as stepped-frequency signals, UWB EMP, and LFM signals. Based on the target’s geometric model and EM scattering mechanisms, we employ well-established forward-modeling techniques for SCs to parameterize the EM scattering characteristics of complex targets. This results in a three-dimensional SC model that is both physically meaningful and highly realistic, enabling the rapid reconstruction of the target’s wideband EM scattering characteristics in the frequency domain. Finally, by performing an inverse Fourier transform on the target’s EM scattering frequency domain characteristics, we obtain the target’s time-domain impulse response. This response is then convolved with actual radar wideband transmission signals, and the time-domain echoes from each SC are summed. This process establishes a model for wideband radar target time-domain echo signals based on the component-level forward modeling of SCs.
2.1. Analysis of Time-Frequency Characteristics from Common Radar Incidence Signals
2.1.1. Stepped Frequency Signal
Stepped frequency signals are radar transmission signals generated by stepped radar systems. These signals consist of a series of rectangular pulses, each with a single frequency value. The frequencies within the entire signal are not continuous; instead, each pulse differs in frequency by Δ
f from the preceding one. This sequential increment completes a frequency sweep over a certain bandwidth. Assuming that the pulse period is
T2, the pulse width is
T1, and the carrier frequency of the nth pulse is
fn, where
n takes values
n = 0, 1, …,
L,
N − 1, the signal form of the nth pulse within a sweep period is given by the following:
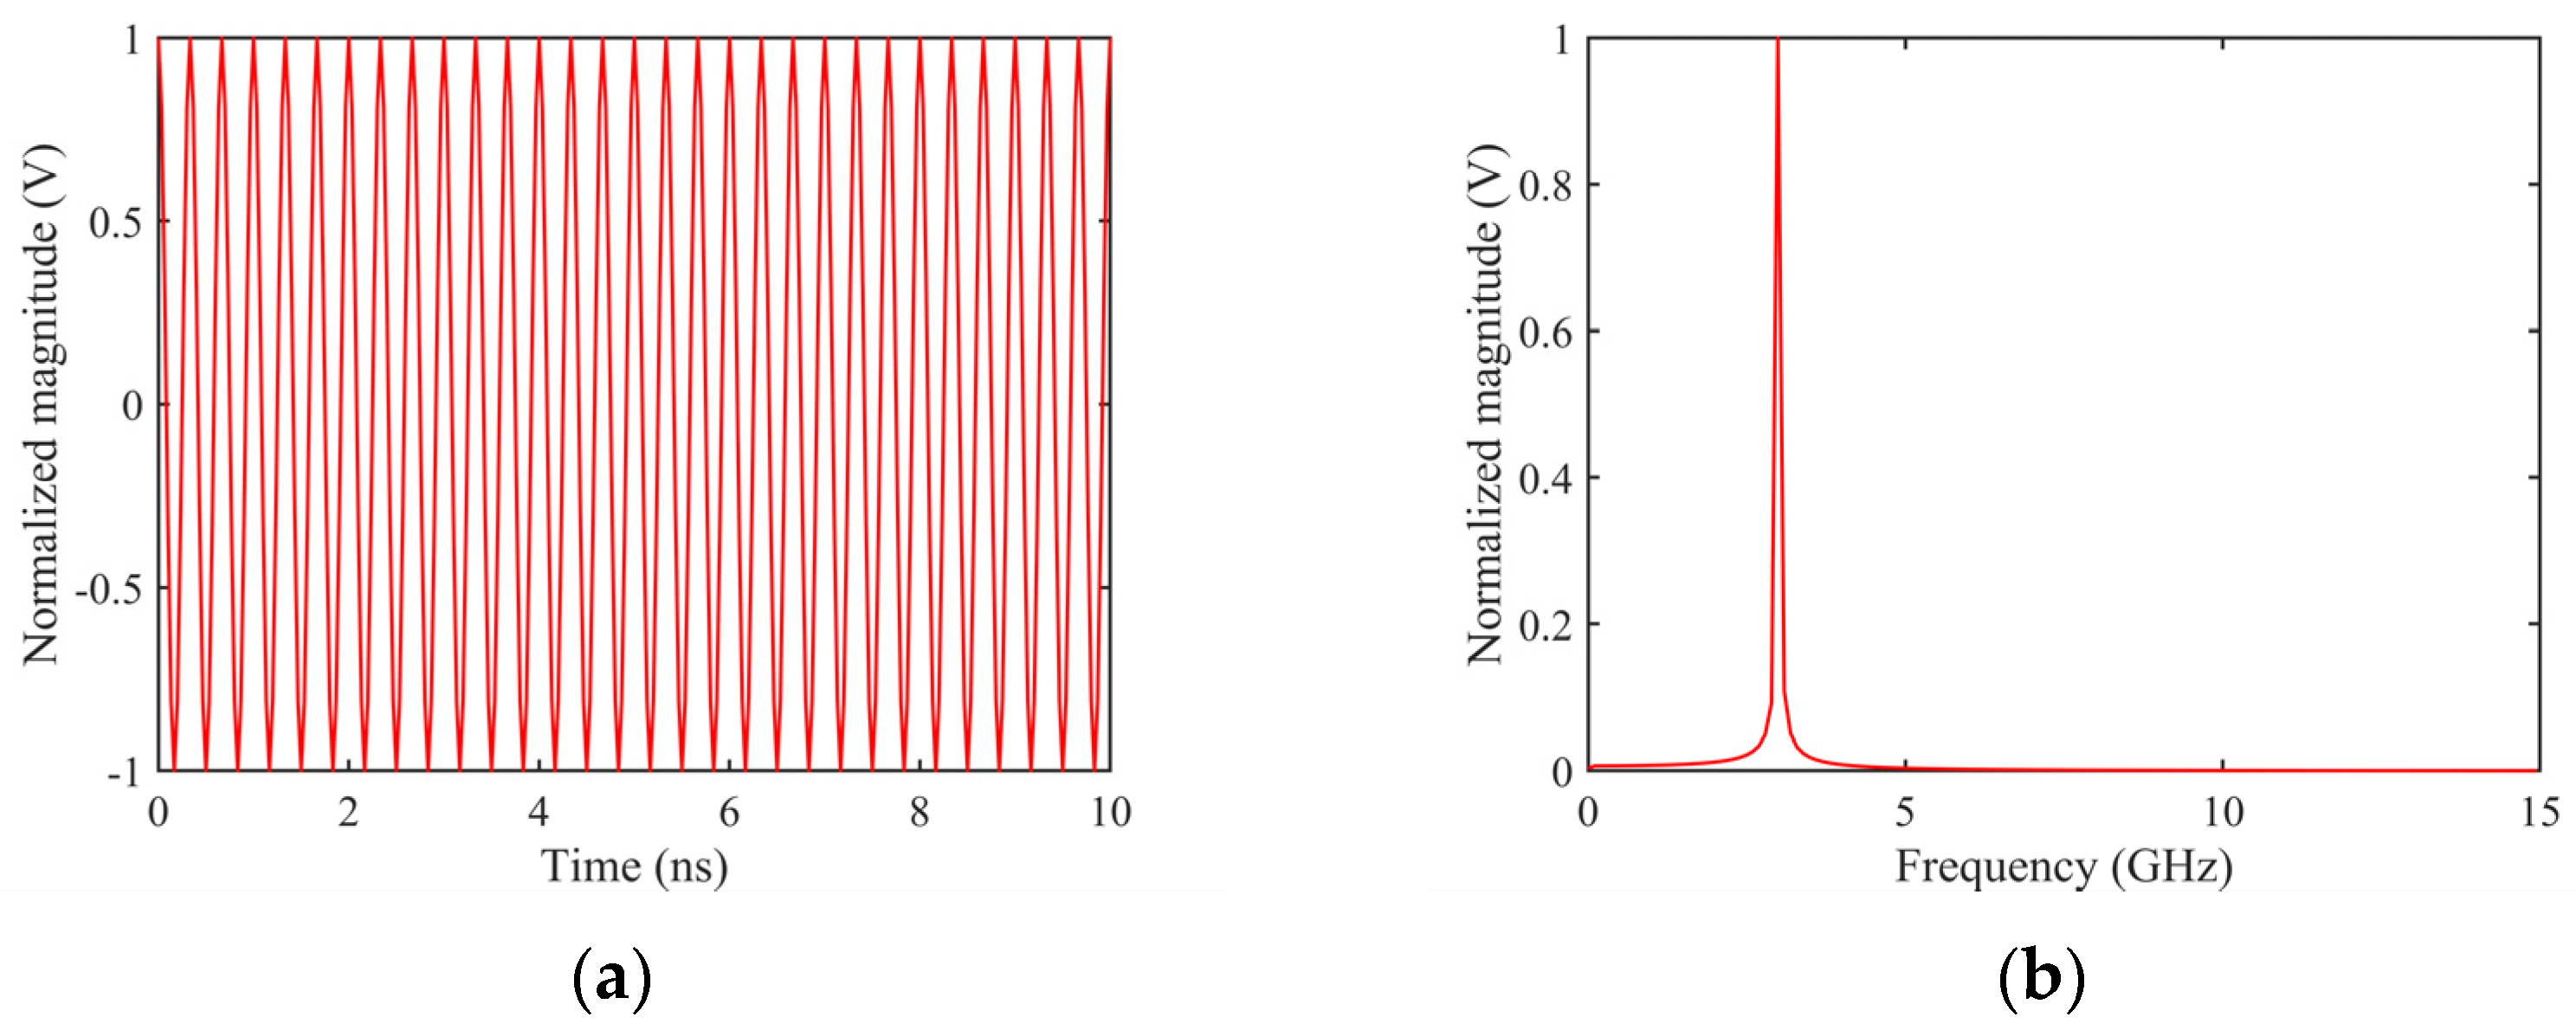
The time-frequency distribution of the nth pulse signal is shown in
Figure 3.
2.1.2. Ultra-Wideband Electromagnetic Pulse Signal
EMPs are a common source of EM interference. Compared to single-frequency continuous waves, EMPs have a high signal power and broad spectral bandwidth, making microelectronic devices more sensitive and prone to damage. Consequently, global research efforts on EMP effects have intensified in recent years.
Considering the spectrum restrictions imposed by the Federal Communications Commission (FCC), Gaussian pulse signals with a relatively narrow absolute bandwidth can achieve radio frequency modulation through mixing with high-frequency sinusoidal waves, thereby exhibiting ultra-wideband characteristics. The time-domain modulation process of such signals is shown in Equation (3).
The term
represents the fundamental frequency expression, where
fm is the carrier frequency. The exponential part describes the time-domain expression of the basic Gaussian pulse, where
t0 is the time delay, the pulse peak occurs at
t =
t0, and
τ is the width constant of the Gaussian pulse. By applying the Fourier transform, the frequency-domain form of the signal, or its spectral representation, can be obtained as shown in Equation (4):
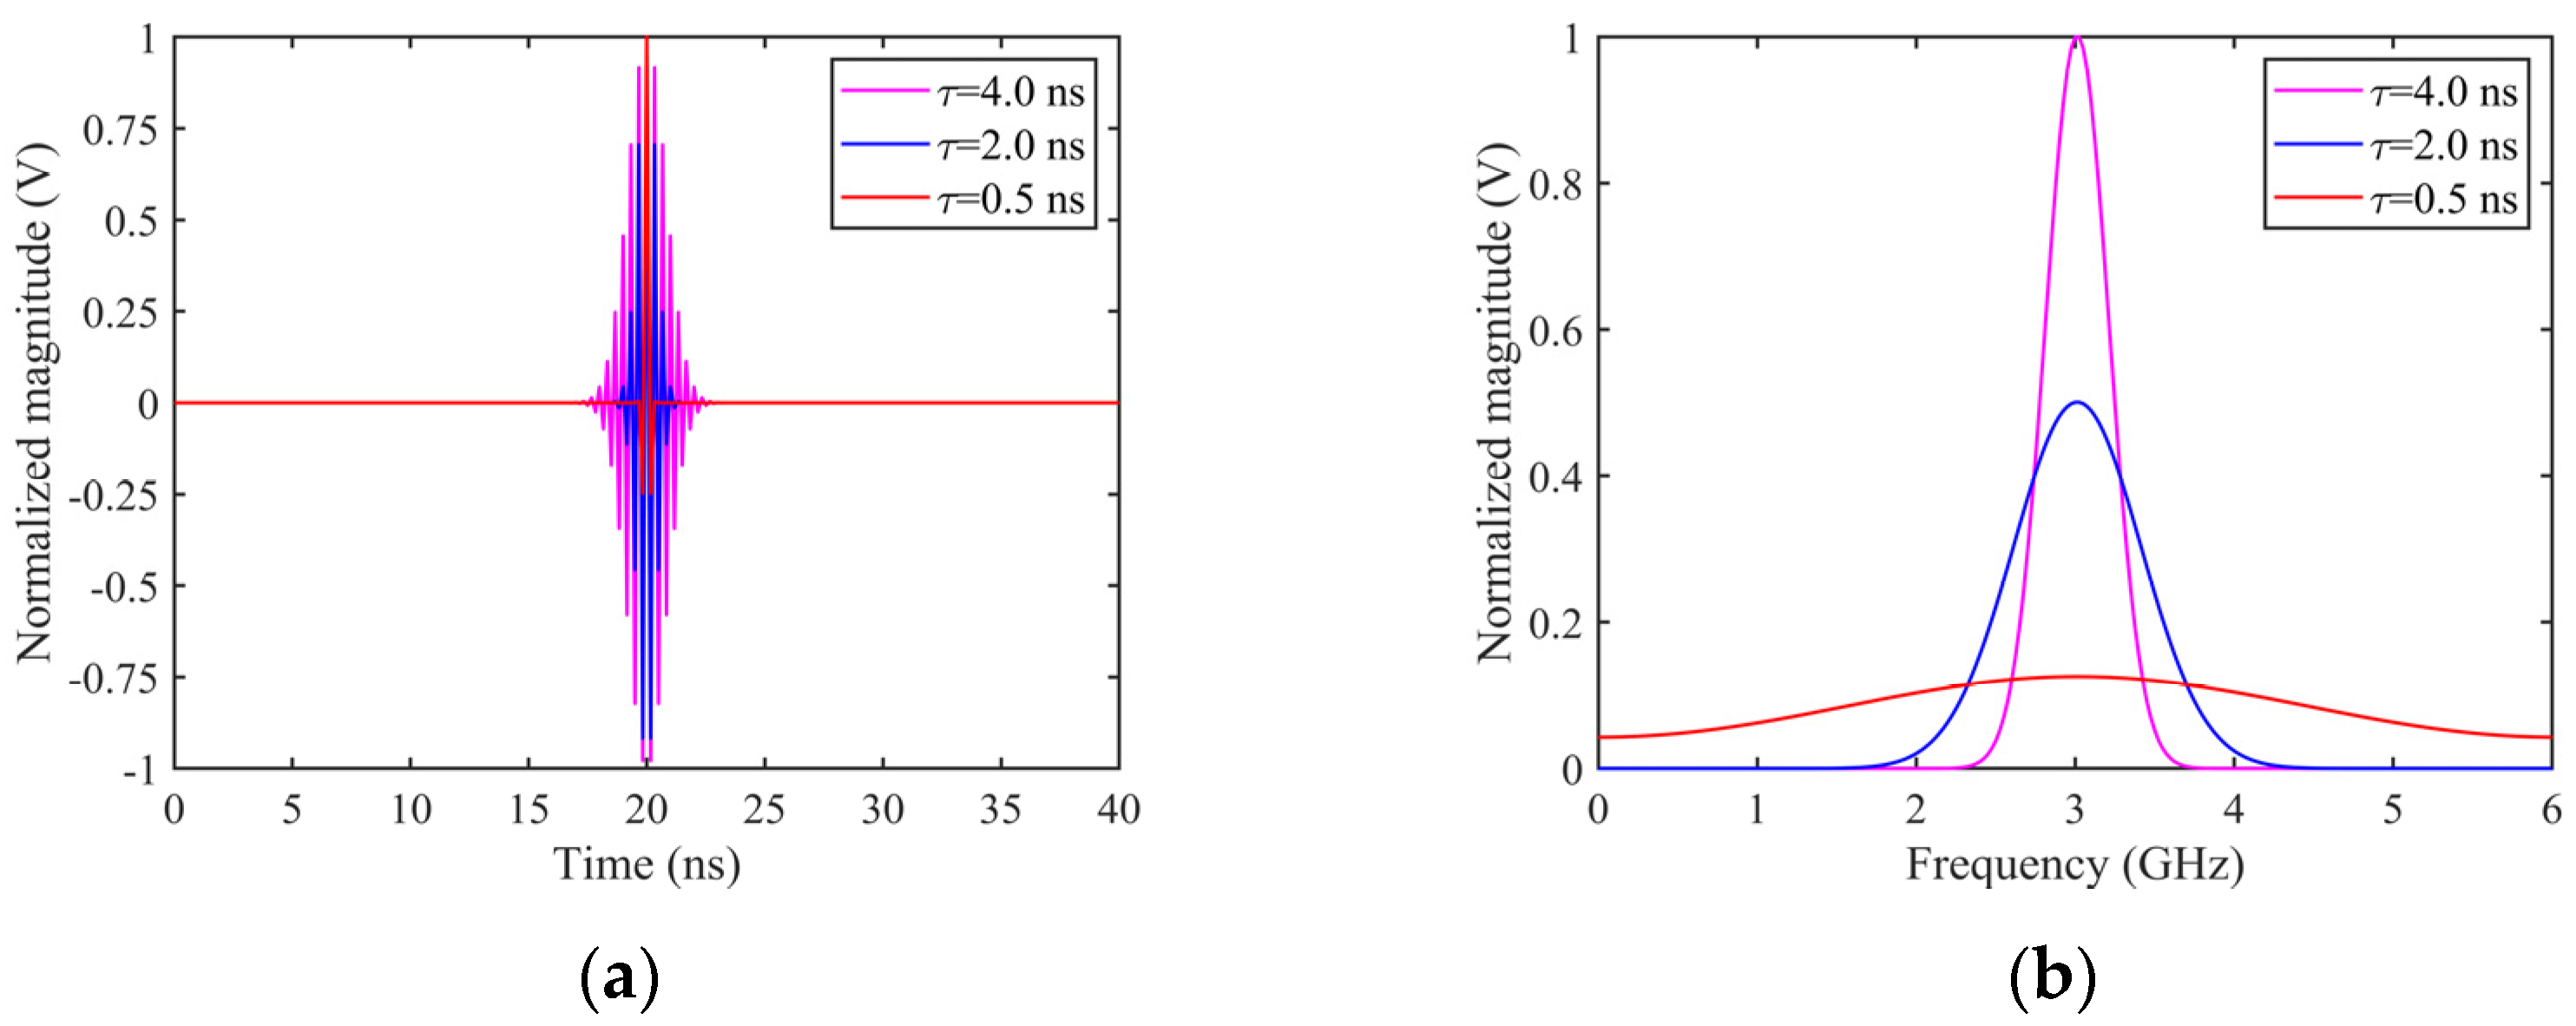
We select three forms of UWB EMPs. For all three signals, the center frequency
fm is set to 3 GHz, with width constants tau of 0.5 ns, 2 ns, and 4 ns, respectively, and a time delay
t0 of 20 ns. These modulated Gaussian pulse signals, under the specified parameters, are used as radiation sources for time-frequency domain analysis. The resulting radar transmission signal waveforms and their spectra are shown in
Figure 4.
2.1.3. Linear Frequency-Modulated Signal
Radar technology finds wide applications in electronic warfare, demanding higher resolutions, operating ranges, and measurement accuracies. To enhance resolution, RTSs require large bandwidths, while long pulses are needed for distant detection. However, demanding both a large bandwidth and long pulse durations simultaneously is impractical. To address this contradiction, phase or frequency modulation is employed to maintain short pulses for high-range resolution while achieving long pulses for a high average transmission power. LFM signals, as a mature and commonly used wideband RTS, exhibit linear variation in instantaneous frequency over time, achieved through the linear modulation of the carrier frequency, thereby achieving a large time bandwidth product.
The general expression for the time-domain representation of a linear frequency-modulated signal is as follows:
where
A represents the signal amplitude,
denotes a rectangular pulse with width
T,
f0 stands for the carrier center frequency,
K is the frequency modulation slope, and
B denotes the signal bandwidth.
The signal bandwidth
B can be obtained from the frequency modulation slope and the signal width, which are given by the following formula:
Simultaneously, the relationship between the phase and frequency yields the instantaneous phase and instantaneous frequency of the LFM signal:
The plus sign in the formula indicates an up-chirp waveform for the LFM signal, while the minus sign indicates a down-chirp signal. By Fourier transforming the time-domain expression of Equation (5), we obtain the spectrum of the LFM signal:
When the time-bandwidth product of the signal is large, Equation (8) can be effectively approximated by the form shown in Equation (9), and the accuracy of this spectrum approximation improves when the time-bandwidth product is increased.
In radar signal processing, to extract target information from the echo signal of a LFM waveform, it is necessary to apply pulse compression processing to the received signal using a matched filter. The purpose of this is to correct the phase of the signal, maximizing the signal-to-noise ratio after passing through the matched filter. Assuming the transmitted signal is
, the time-domain transfer function of the matched filter can be expressed as
:
The working process of the matched filter is represented by the convolution multiplication of the signal. Equation (11) provides the output signal form of the LFM waveform after passing through the matched filter as
. It can be observed from the equation that the output signal
is the result of the time-delayed autocorrelation function of the input signal
by
t0.
Following the principles outlined above for the pulse compression of LFM signals [
35], Equation (12) provides an approximation of the frequency characteristics of the LFM signal after matched filtering.
Figure 5 illustrates the spectrum of the LFM signal (a), the linearly frequency-modulated signal in the time domain (b), and the result after matched filtering (c).
It can be observed that after the LFM signal undergoes matched filtering, its form changes from a wide pulse with a large time-bandwidth product to a narrow pulse. Additionally, the compression ratio
r of LFM is equal to the product of the signal’s time-bandwidth product, as shown in Equation (13).
2.2. Decomposition of CAD Model Components and Selection of Scattering Sources
The forward-modeling method for SCs starts from the geometric model of composite targets, decomposing the target and its surface into multiple solid components and utilizing a two-tier partitioning approach to ensure the uniqueness of scattering sources and meet the needs of radar target feature recognition. Each component or structure’s surface is labeled with a secondary partitioning to distinguish them.
The decomposition of solid target components and surface partitions forms the basis of quantitatively characterizing strong scattering sources. This decomposition effectively partitions the EM current on the complex target surface, thereby clarifying the mechanism of SCs and establishing a clear association between SCs and target geometric structures, meeting the requirement for a controllable and effective number of SCs. The specific decomposition criteria include the following: based on the target surface curvature radius and abrupt changes in the outward normal, the electrical size of decomposed components should meet the condition of being electrically large, and special treatment should be given to special scattering mechanisms.
The decomposition process follows a technical route: it starts with a bottom-up modeling approach for geometric modeling, then combines EM scattering characteristics for top-down reverse modeling, and obtains the complex target geometry model through the combination of solid components. Finally, it is compared with the bottom-up model to ensure accuracy. The addition of fine structures follows an iterative selection process, and finally, an output of numbered solid component combinations is generated.
The accuracy of component decomposition directly affects the calculation precision of subsequent SC models. Therefore, strictly adhering to the aforementioned decomposition standards can yield an ideal model for calculation. As complex targets are mostly composed of typical body structures, the process of component and surface decomposition is relatively short, serving as preliminary preparation for model calculations without consuming excessive experimental time or load.
Based on the decomposed components with assigned numbers, the target surface undergoes spatial ray tracing to compute the total radar echo ray set [
36]. The propagation process of rays is described using transfer matrices, with PO employed to determine the energy on each ray and aggregate the energy of similar rays to obtain the scattering contribution of potential SCs. The GO-PO method is utilized to calculate the surface scattering contribution of the target, along with Incremental Length Diffraction Coefficients (ILDCs) for computing the edge diffraction contribution. Through the spatial ray field clustering technique, the sources of surface scattering and edge diffraction are determined, including independent scattering sources and coupled scattering sources within target components.
All scattering sources are numbered, and their RCS is estimated and sorted according to the contribution magnitude. By setting an amplitude threshold (typically −30 dB, adjustable for stealth targets), scattering sources with intensities above the threshold are identified as strong SCs. The initially selected strong scattering sources form the SC collection for the target at that azimuth angle. The further screening of strong scattering sources involves discarding weaker contributors to retain dominant scattering sources. Initially, the scattering field of the entire target is computed as a reference benchmark. Subsequently, candidate scattering sources are sorted based on their contribution magnitude, and the most significant strong scattering sources are initially selected. These strong scattering sources’ scattering fields are compared with the reference benchmark, and if the error between them meets the precision requirements, these scattering sources are deemed accurate reflections of the target’s EM scattering characteristics; otherwise, additional scattering sources are added until the precision requirements are met. Generally, the higher the modeling accuracy, the fewer “weak” scattering sources need to be considered.
Differing from the SBR method used in [
37], our ray-tracing approach is based on the PO method, which necessitates partitioning the target surface into numerous small facets typically smaller than 10/
λ in size.
This paper integrates the ray-tracing algorithm with PO and ILDC. GO is employed to compute the ray propagation paths, while PO and ILDC are used to calculate the surface scattering and edge diffraction contributions. Combining this method with the previously described component decomposition technique allows for the precise delineation of independent scattering from each local scattering component on the target and the coupling scattering between components, facilitating subsequent parametric modeling.
2.3. Forward Calculation of Scattering Center Model Parameters
The total backscattering electric field of the target is the sum of contributions from
P0 independent SCs.
The three-dimensional attribute SC is described by a set of attribute parameter sets. The parameter set
sn of the three-dimensional attribute SC includes the amplitude parameter
An representing the amplitude of the scattering echo of the scattering structure, the frequency-dependent factor
αn reflecting the scattering mechanism of the scattering structure, the position parameters
representing the three-dimensional spatial position or equivalent position of the scattering structure in the coordinate system, and the length parameter
Ln representing the length of the scattering structure; as coefficients, the attitude parameters,
and
, can be summarized as follows:
In the above equation, N = p + q, where p represents the number of scattering sources originating from the component itself, and q represents the number formed by the coupling between components.
For a single ray, the position parameters only need to compute the effective reflection point on the surface element. For ray subsets acting on coupled components, these rays need to be weighted averaged to obtain the position of a coupled SC. Regarding the amplitude parameters, the echo of the surface element where each ray subset finally acts needs to be calculated using the PO algorithm. Then, all scattering field vectors of the ray subset are superimposed, and the amplitude of the scattering field is taken, which represents the amplitude parameter A of the coupled SC.
Under far-field conditions, the approximated scattering field using the PO-ILDC theory can be expressed as follows:
In this equation,
T1 represents the number of illuminated triangular facets, and
T2 stands for the number of illuminated edges. The electric field
is calculated based on the Stratton–Chu integral equation, and the diffraction contribution
from each edge can be determined using the ILDC theory [
38].
To determine the frequency-dependent parameter
a, it is essential to first ascertain the geometric characteristics of each scattering structure. These characteristics are derived from the curvature radii of different parts of the target [
39]. Once the geometric features are established, the frequency-dependent parameters for each component’s surface can be determined from tables, and the minimum value of these parameters is selected for the coupled parts.
The length parameter
L primarily characterizes the scattering properties of distributed SCs with “in-phase” scattering features. This manifests as a distinct “length” characteristic in the azimuth direction on radar SAR images [
21]. Therefore, by identifying the two equivalent endpoints of the “bright line” within the set of rays of a distributed SC, and projecting and subtracting these endpoints, the length parameter of the SC can be determined.
2.4. Forward Construction of Target Wideband Echo Model
To describe the EM scattering characteristics of the target, we choose to consider the target as a combination of several SCs and investigate the scattering echo properties of the target by separating and then recombining them. The specific forward-modeling process of the radar time-domain echo model is as follows: Firstly, the forward-modeling method is used to determine the model parameters, and the obtained SC model is used to characterize and rapidly reconstruct the corresponding SC’s frequency-domain EM scattering characteristics. The IFFT obtains the impulse response function of the target under a unit impulse signal. Then, the time-domain data sequence of the EM characteristics of a single SC is convolved with the selected radar-transmitted EM pulse signal to obtain the simulated echo of a single SC. Finally, the obtained echoes of multiple SCs are superimposed to simulate the echo of the entire radar target.
The target echo model proposed in this paper, based on the forward modeling of SCs, can be regarded as an impulse response model under unit impulse signal excitation. This model reflects the inherent physical attributes of the target and is not affected by variations in the radiation source. Traditional simulation algorithms require specific implementation steps based on the radar’s incident signal, and changes in the radiation source necessitate adjustments to the algorithm framework. In contrast, the proposed model only requires the convolution and summation of each SC with the radiation source excitation to quickly obtain the target’s wideband time-frequency domain scattering characteristics. Furthermore, the correspondence between model parameters and the physical properties of the target scattering components facilitates crucial support for target identification systems, avoiding the limitations of traditional simulation algorithms, which solely focus on obtaining the overall EM properties of targets while neglecting the application of target component-level physical properties.
Let
M denote the total number of strong SCs of the radar target, and
represent the time-domain scattering impulse response function of the
m-th SC.
where
represents the amplitude and
represents the time delay. When
n in
is positive, it denotes taking the
n-th derivative of the impulse function
; when it is zero, it represents the original impulse function
; when negative, it signifies the integration of the impulse function. The reflection coefficient function
obtained by superimposing the time-domain EM scattering characteristics of
m SCs is equivalent to the impulse response of the target as a system. Transforming
through Fourier transformation yields the frequency-domain scattering of the SC:
where
represents the frequency-domain EM scattering characteristics of the
m-th SC. Meanwhile, describing the target’s frequency-domain characteristics using the SC model can be expressed as follows:
The echo signal of a wideband radar target can be viewed as the impulse response of the radar target scattering characteristics of the radar signal. Assuming the radar transmission signal is
, if the target echo signal is calculated in the frequency domain, then the radar echo spectrum of the
m-th SC is as follows:
Taking the LFM signal as an example,
can be approximately represented as the following:
where
B represents the bandwidth.
Subsequently, the IFFT of Equation (9) is performed to obtain the time-domain echo signal of the
m-th SC, represented as follows:
∗ denotes the convolution operation.
Since wideband radar targets typically consist of multiple SCs, after obtaining the echo signal from each individual SC, the echo signals from all SCs are summed to obtain the overall target echo signal. This allows the construction of a time-domain echo model for complex wideband radar targets:
When different types of transmission signals are used, the corresponding echo signals also vary. When analyzing the time-domain echo signal model of wideband radar, several aspects need to be considered:
(1) The EM scattering characteristics of the target are influenced by various factors such as the frequency of the radar transmission signal, the shape of the target, and its orientation and position relative to the radar. Therefore, before obtaining the SC model, it is necessary to determine the orientation angles of the target relative to the radar and analyze the echo signal model under specific orientations.
(2) Due to the complexity of the target structure, it may contain multiple SCs. Hence, it is necessary to sum the echoes from all SCs to obtain the time-domain echo of the entire target.
The complexity of our proposed method is primarily reflected in two aspects:
Spatial Ray Tracing and Diversity Based on GO-PO/ILDC: This process enables the effective division of different scattering centers.
Forward Calculation of Scattering Center Parameters: This involves using scattering mechanisms to derive the attributes of each scattering center.
The algorithm’s complexity mainly depends on factors such as the geometric model size of the target and the number of mesh facets. Since our proposed algorithm is a fully forward scattering center modeling method, it does not require the complex optimization and iterative processes found in inverse algorithms, resulting in relatively low complexity. The model features clear physical parameter meanings, concise expressions, and high efficiency.
Unlike simulation methods that require calculations across continuous angular and frequency domains, our method uses a set of scattering center model parameters to represent the target’s scattering field. This approach requires the scattering center parameters for a single observation stance to be calculated. By applying Equation (23) over small angular and frequency increments, the electromagnetic scattering characteristics (e.g., radar cross-section, radar images) can be accurately reconstructed. This ensures precision while significantly reducing the data volume and computation time compared to traditional measurement or simulation methods, enabling the rapid simulation of wideband radar echoes and real-time complex scattering simulations.
Using the 3D scattering center model to represent the electromagnetic scattering characteristics of a target offers significant advantages over directly storing wideband radar target data. These advantages include reduced storage requirements, excellent extrapolation performance, fast reconstruction, and clear physical meanings. The 3D scattering center model is a parameterized super-resolution model capable of quickly and accurately reconstructing the wideband electromagnetic scattering characteristics of targets under various stances and resolutions. The model’s superior frequency and angle extrapolation capabilities eliminate the need for the extensive storage of raw data, substantially reducing storage requirements and meeting real-time computation needs.
3. Example Analysis
This research utilized MSTAR SLICY, Simplified Tank, and Complex Tank models to demonstrate increasing geometric complexity. Initially, under fixed observation angles and central frequency points, a three-dimensional SC model of the targets was established with clear physical significance and high fidelity. This model facilitated the rapid reconstruction of the EM scattering frequency-domain characteristics of each SC within a wide frequency range. Subsequently, IFFT was applied to obtain the time-domain impulse response, which was then convolved and summed with the actual transmitted waveform to obtain the complete time-domain echo signal model of the target. The experimental results demonstrated perfect correspondence between the established three-dimensional strong SC positions and the peak positions in the simulated HRRPs, validating the correctness and effectiveness of the proposed wideband radar target time-frequency domain scattering forward-modeling method. The model proposed in this research enables the rapid and accurate reconstruction of the wideband echo signals of targets, with significantly improved computational efficiency compared to simulation algorithms, meeting the real-time requirements of radar target identification systems and the need for the efficient compression of databases. Furthermore, the proposed model establishes an accurate one-to-one correspondence between target SCs and local geometric structures, effectively addressing challenges such as the complexity of echo signals from complex radar targets and the difficulty of determining the scattering contributions caused by overlapping contributions from multiple scattering sources.
To enhance the completeness of the research and validate the accuracy of the proposed SC forward-modeling algorithm, this research employed the Ray Launching Geometrical Optics (RLGO) algorithm as a reference. The RL-GO method is designed for modeling electrically large dielectric and perfectly conducting structures, and is commonly used in applications such as lens antennas and RCS analysis. It is particularly effective for structures larger than 20
λ. RL-GO excels in solving large scattering problems, such as RCS analysis, due to its efficient “shooting and bouncing rays” approach, which handles multiple reflections with ease [
40,
41,
42]. The RMSE was adopted as an evaluation criterion to quantify the difference between the research method and the reference data. RMSE is defined as follows:
where
f represents the frequency of the incident wave, and
and
denote the reconstructed results from the proposed forward model and the simulated results from RL-GO, respectively. The computational platform utilized an Intel Core i7 - 12700 chipset with a clock speed of 2.10 GHz and a total memory of 64 GB.
3.1. Forward Construction of MSTAR SLICY Wideband Echo Model
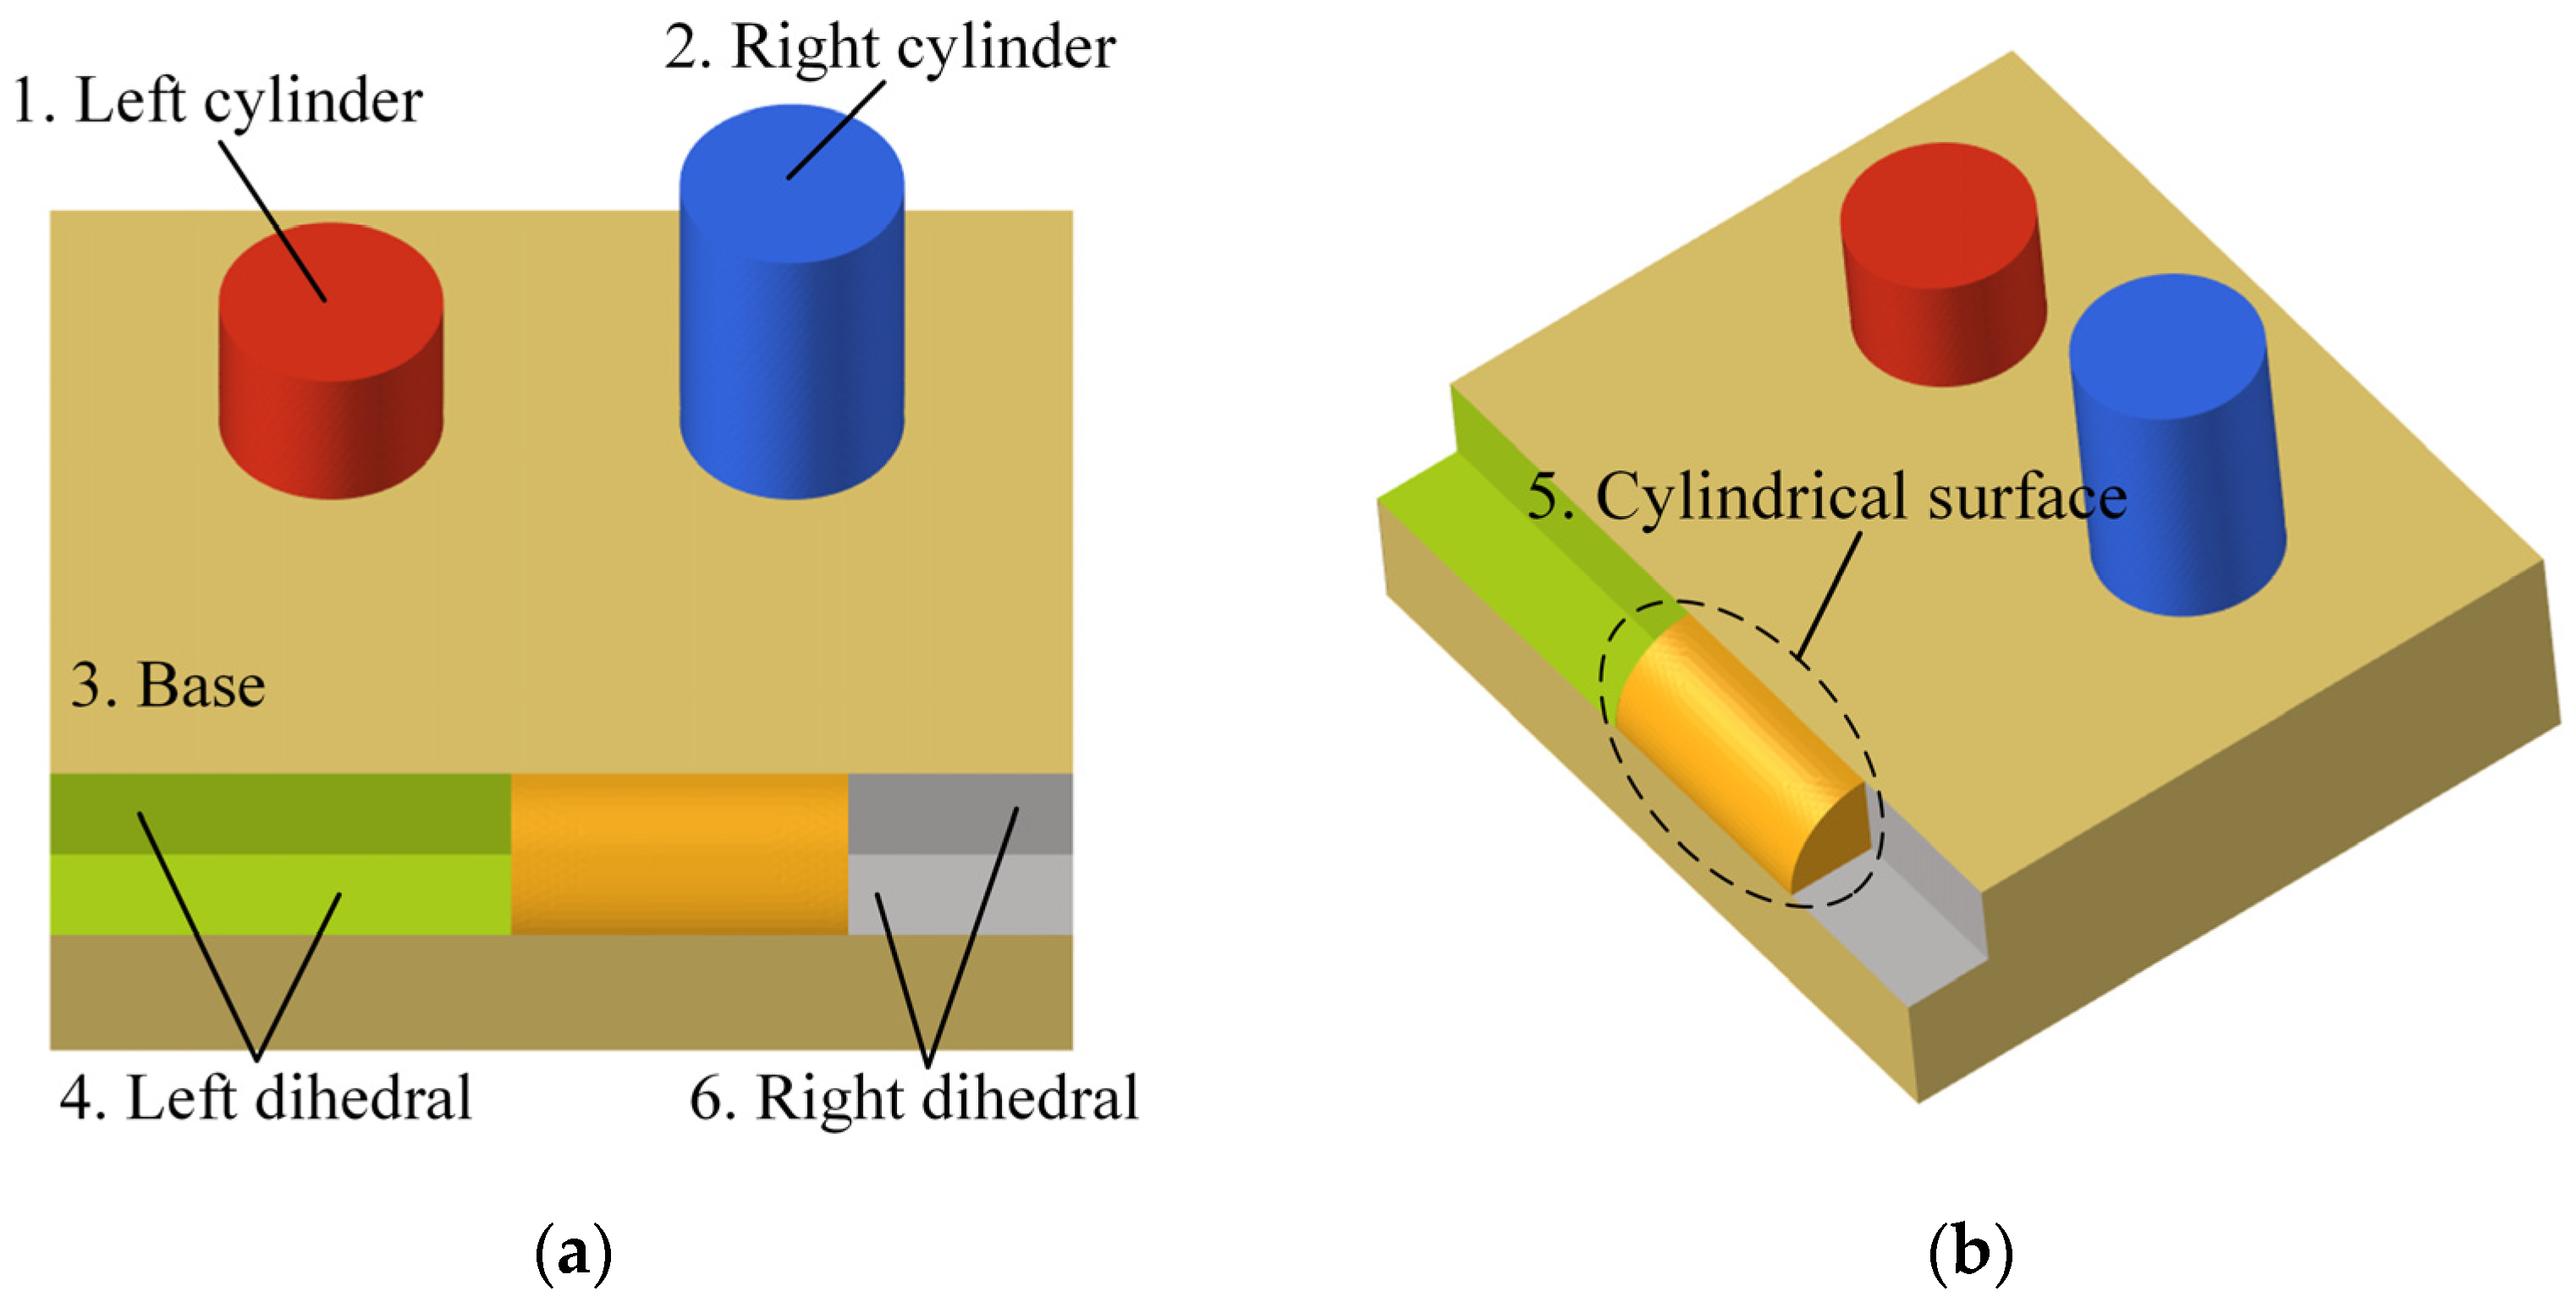
First, the MSTAR SLICY, with dimensions of 2.45 m × 2.75 m × 1.65 m and composed of ideal conductor material, was selected as the experimental target. Prior to the forward modeling of attributed SCs, a meticulous decomposition of the target’s physical components was necessary to achieve the effective segmentation of its complex surface. This process yielded numbered physical components along with their segmented combinations, laying the groundwork for the subsequent determination of strong scattering sources and the analysis of EM scattering mechanisms. Diagrams illustrating the three-dimensional model of SLICY and the decomposition of its components are shown in
Figure 6 and
Figure 7, respectively. The target model was decomposed into six surface regions, comprising approximately 60,000 surface elements.
The scattering characteristics of SLICY at a fixed attitude and central frequency were parametrically modeled for the forward modeling of SCs. Observation angles of
θ = 45° and
φ = 0° were selected, with a central frequency set at 3 GHz and incident EM waves in HH polarization. The physical attributes and three-dimensional positional parameters of the first eight strong SCs of the target are presented in
Table 1.
Taking the scattering source 2–3 in the third row of the table as an example, it indicates that this SC (Top-hat a) is formed by the coupling of component 2 (Right cylinder) and component 3 (Base). The table also provides different scattering sources, such as strong coupling interactions within the dihedral structure (4-4, 6-6), single scattering from the outer surface of the quarter cylinder (5), and single scattering from the plane (3). The frequency-dependent parameters α, amplitude parameters A, and three-dimensional position parameters (x, y, z) of each SC were obtained through the forward-modeling process proposed in this paper, and they are presented in the table.
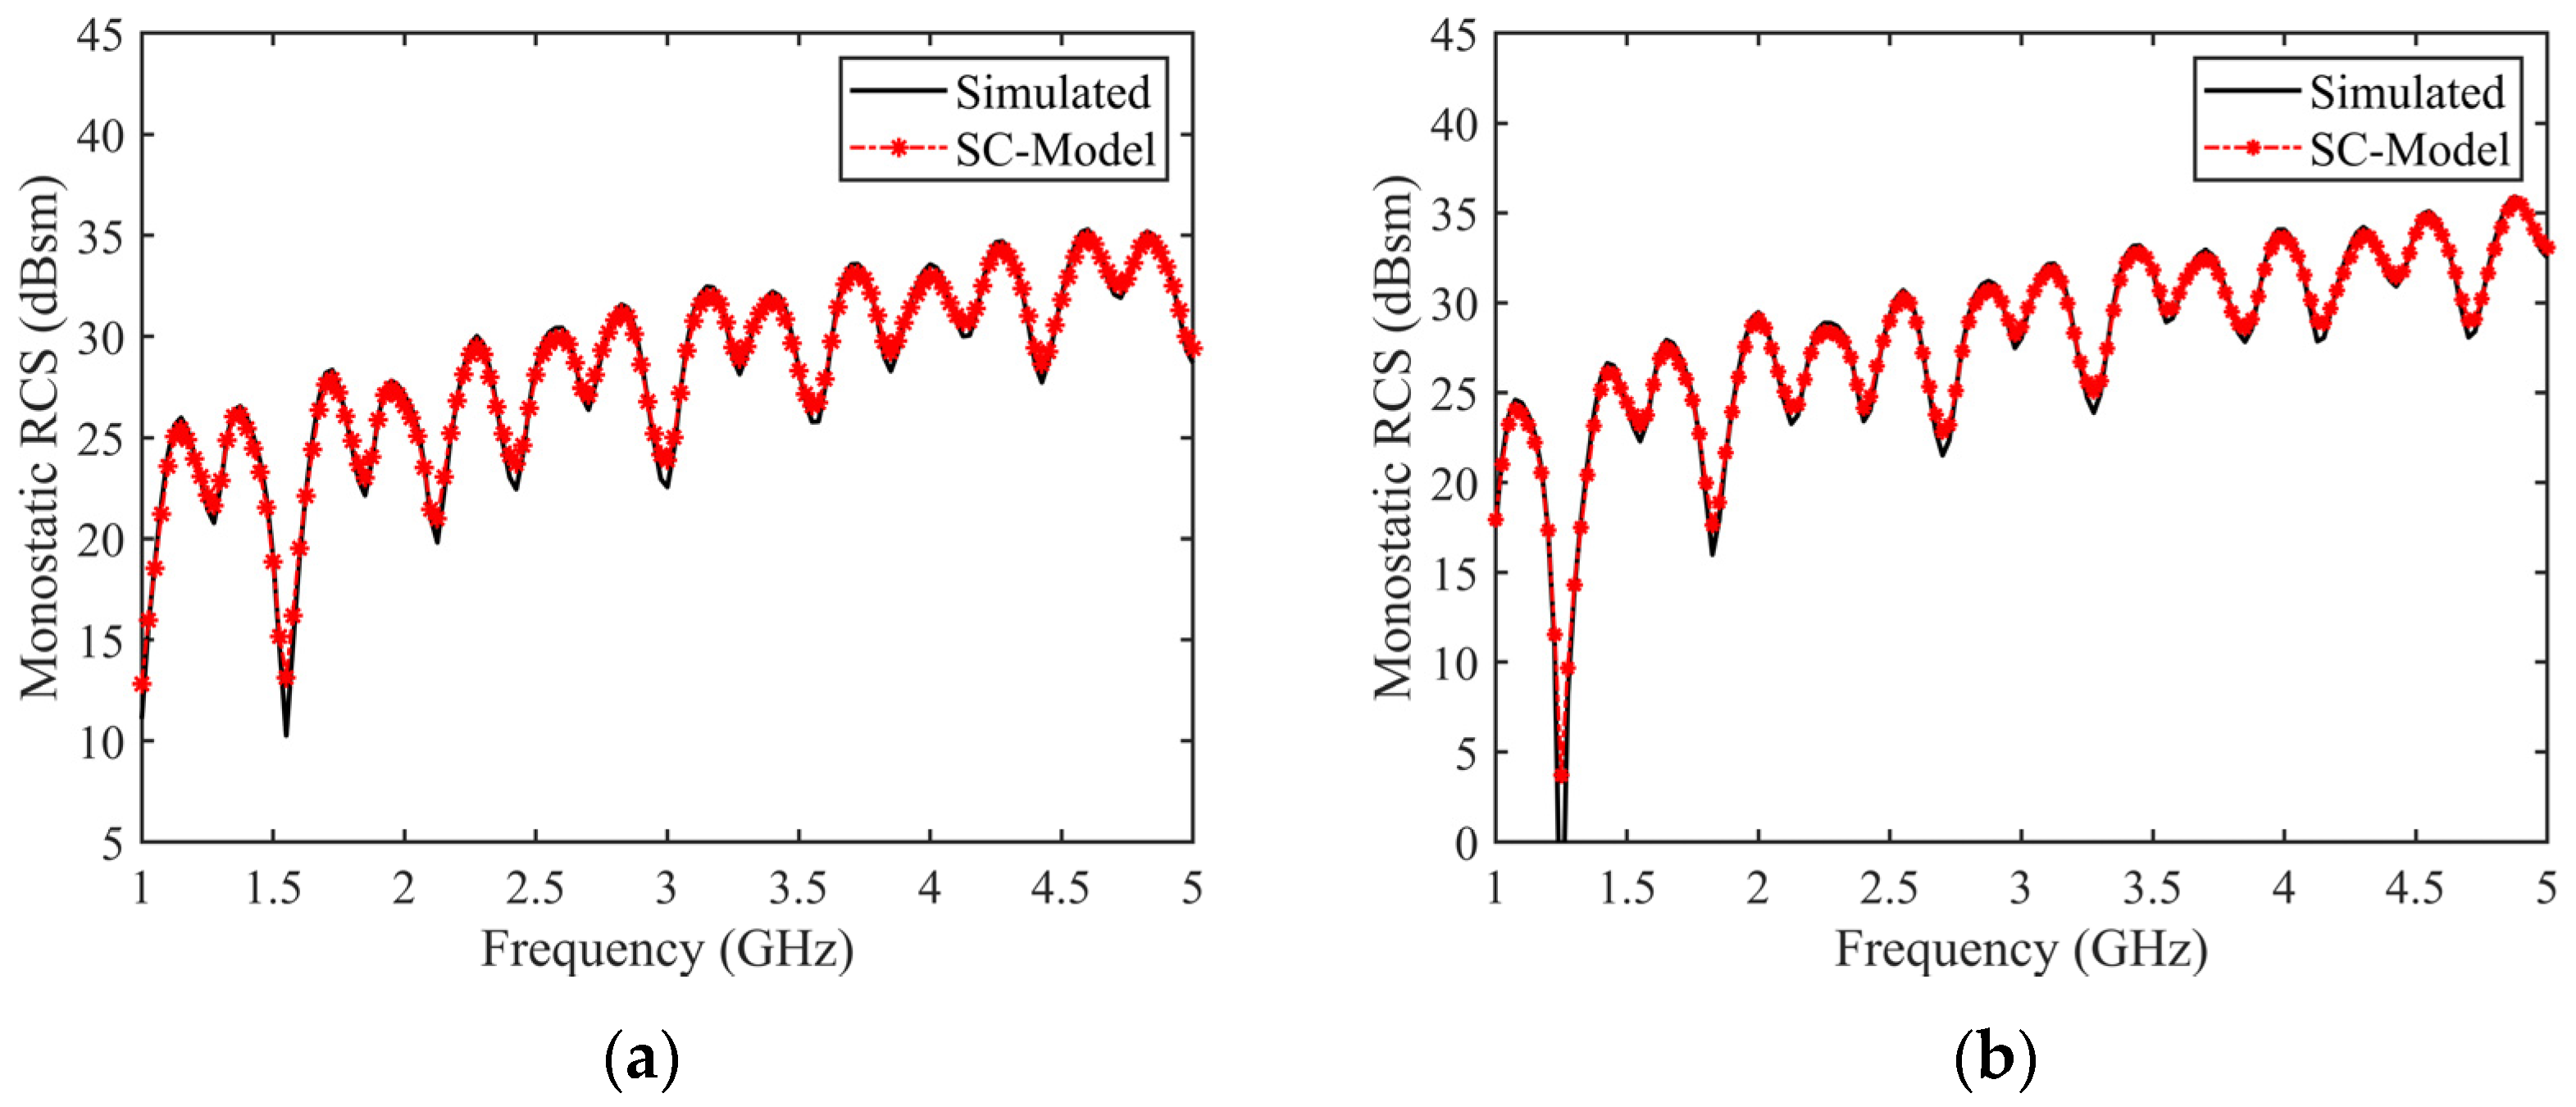
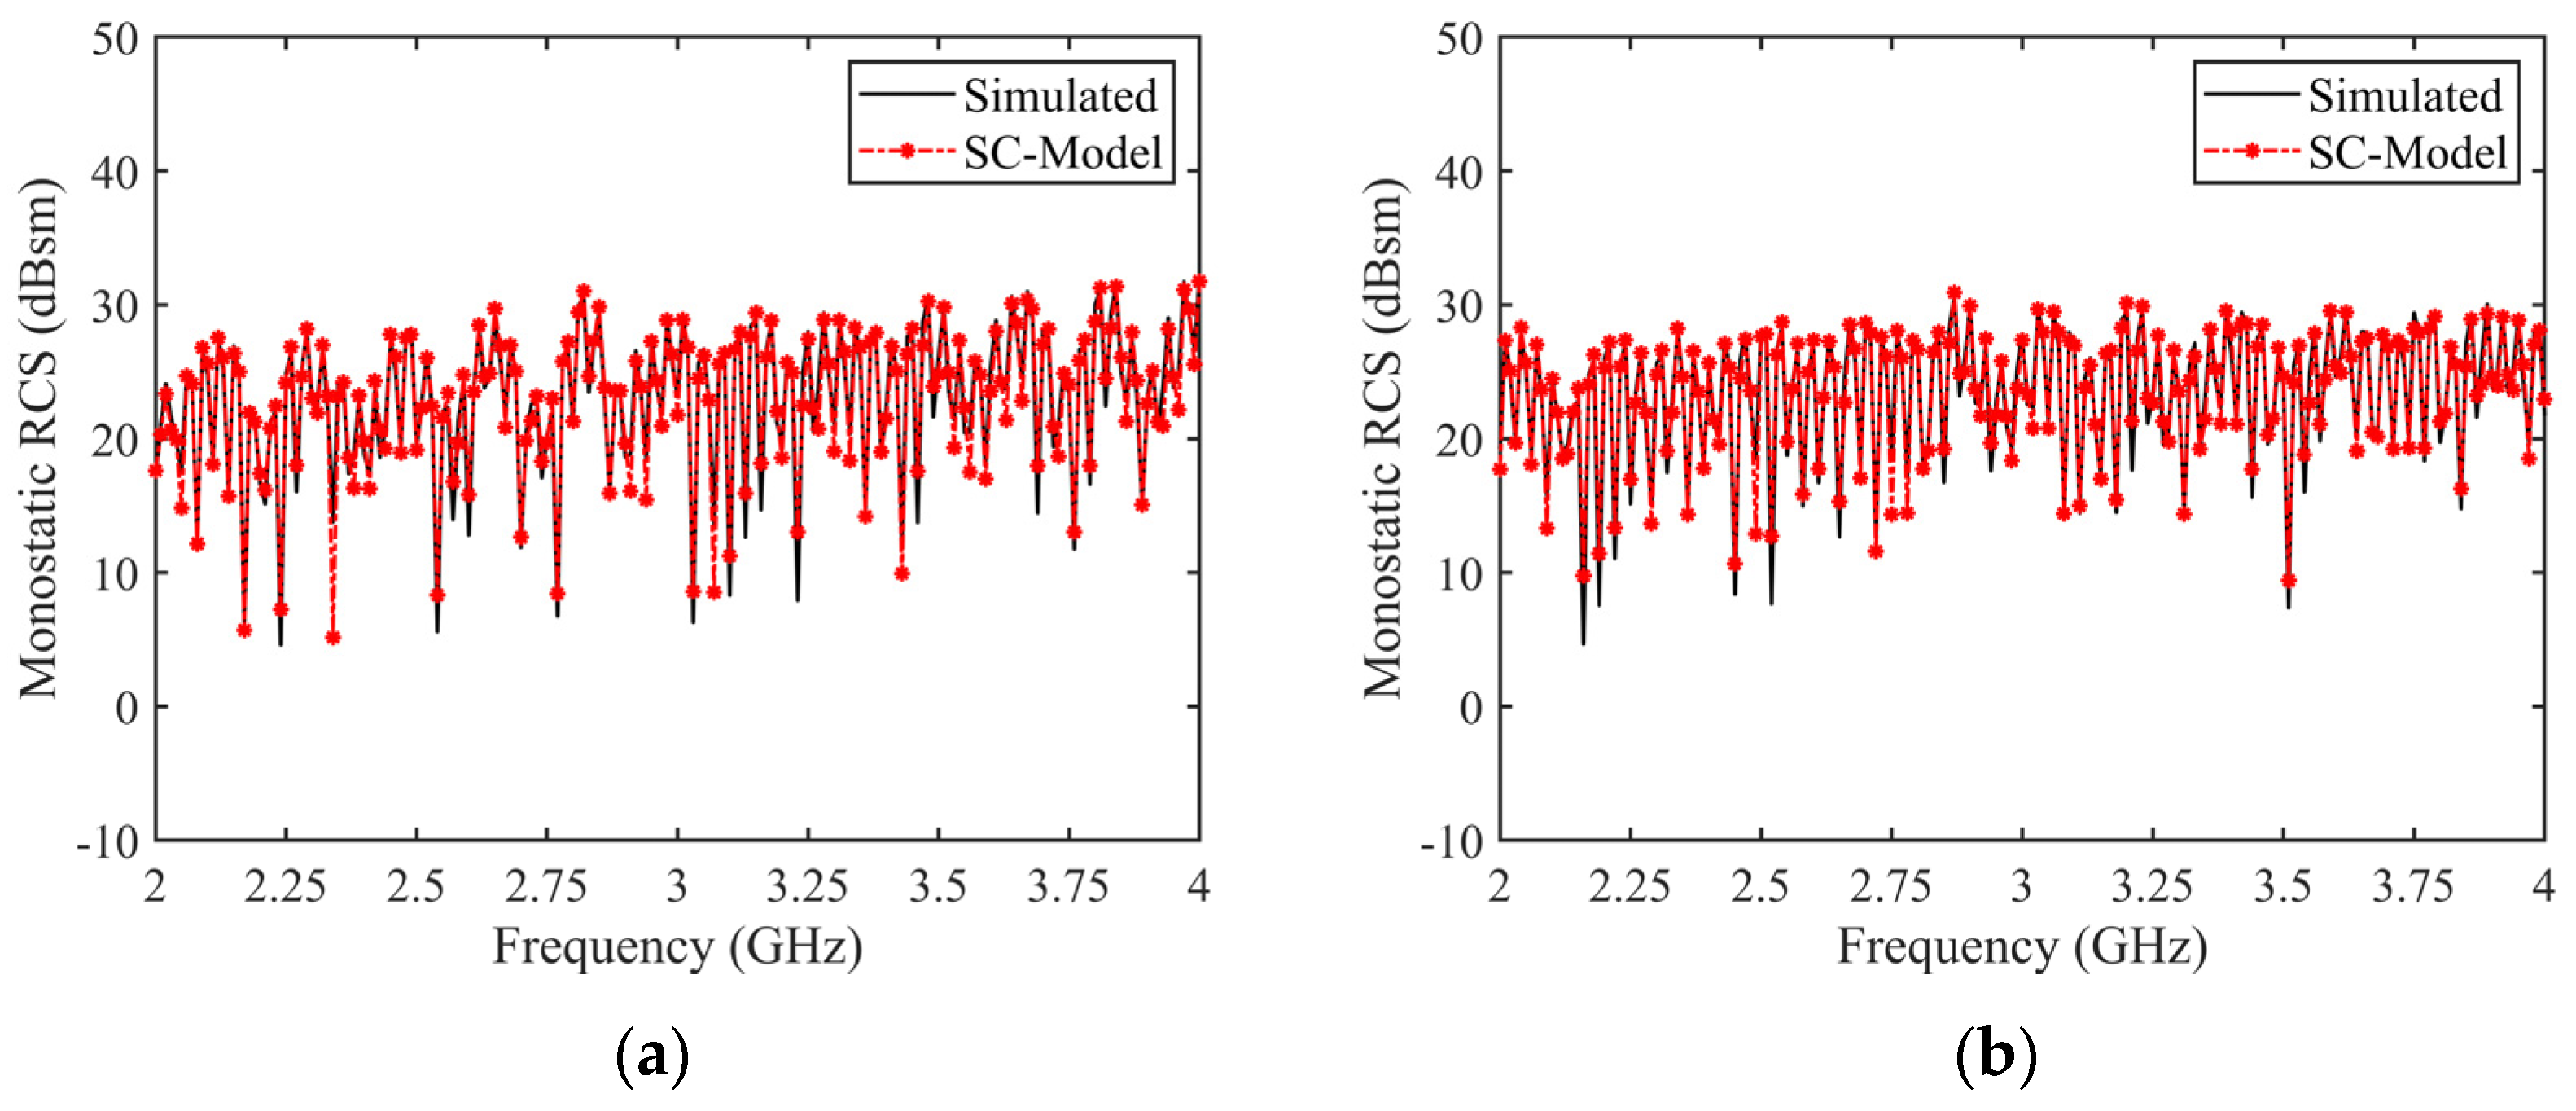
Using the SC model described above, the RCS characteristics of the target were reconstructed over a wide frequency range and compared with the simulation results from the RL-GO algorithm, as shown in
Figure 8. The comparison results are in good agreement, with errors within 3 dB, meeting the practical application requirements of engineering. This demonstrates the correctness and effectiveness of the proposed model in reconstructing target characteristics across a wide bandwidth. Moreover, the forward-modeling method proposed in this paper directly derives SC models from the target CAD model using spatial ray-tracing and clustering techniques, enabling the forward calculation and quantitative characterization of attributes such as the real three-dimensional coordinates of SC models. This approach represents a typical “cause-to-effect” forward approach. The separated SCs correspond explicitly to the local structures of the target, providing a clear physical interpretation and avoiding complex iterative optimization processes. Leveraging the advantages of the forward model in providing a clear physical deconstruction of target EM scattering, it facilitates in-depth exploration of target feature matching information and provides technical support for dual-track applications such as radar target remote sensing identification.
The rapid simulation process of the target’s time-domain echoes is as follows: Firstly, using the forward-modeling method, the model parameters are determined to establish a three-dimensional SC model of the target with clear physical significance and high fidelity, describing the EM characteristics of each SC. Within the specified bandwidth, the EM scattering frequency-domain characteristics of the SCs are rapidly reconstructed, followed by an IFFT to obtain the corresponding time-domain impulse response. Subsequently, the time-domain data sequence of individual SCs’ target characteristics is convolved and superimposed with the radar-transmitted pulse signal to obtain the wideband radar target’s time-domain echo signal model based on component-level SC forward modeling.
At a radar observation angle of
θ = 45°,
φ = 0°,
Figure 9 shows the reconstructed time-domain echoes based on the SC forward model under various radiation sources, such as stepped frequency signal, UWB EMP signal, and LFM signal, along with the time-frequency diagram under stepped frequency signal excitation. The moments of action of multiple strong scattering points are marked in the figures. Although the waveform details of the echo signals differ under the three types of excitation, the SC information obtained through forward modeling indicates that the peaks of the curves correspond to the distribution of SCs along the time axis. The advantage of this method lies in its ability to provide wideband time-frequency domain echo signals of targets quickly and accurately under any radiation source excitation. Furthermore, the model possesses realistic attributes, offering dual technical support for target recognition systems through both simulation data and physical interpretation.
Comparative analysis reveals that the time-domain reconstructed echoes of the target are influenced by the excitation sources, resulting in some broadening in time, yet effectively representing the EM scattering characteristics of the target, thereby reflecting the relative positional relationships of the radar target’s strong scattering sources.
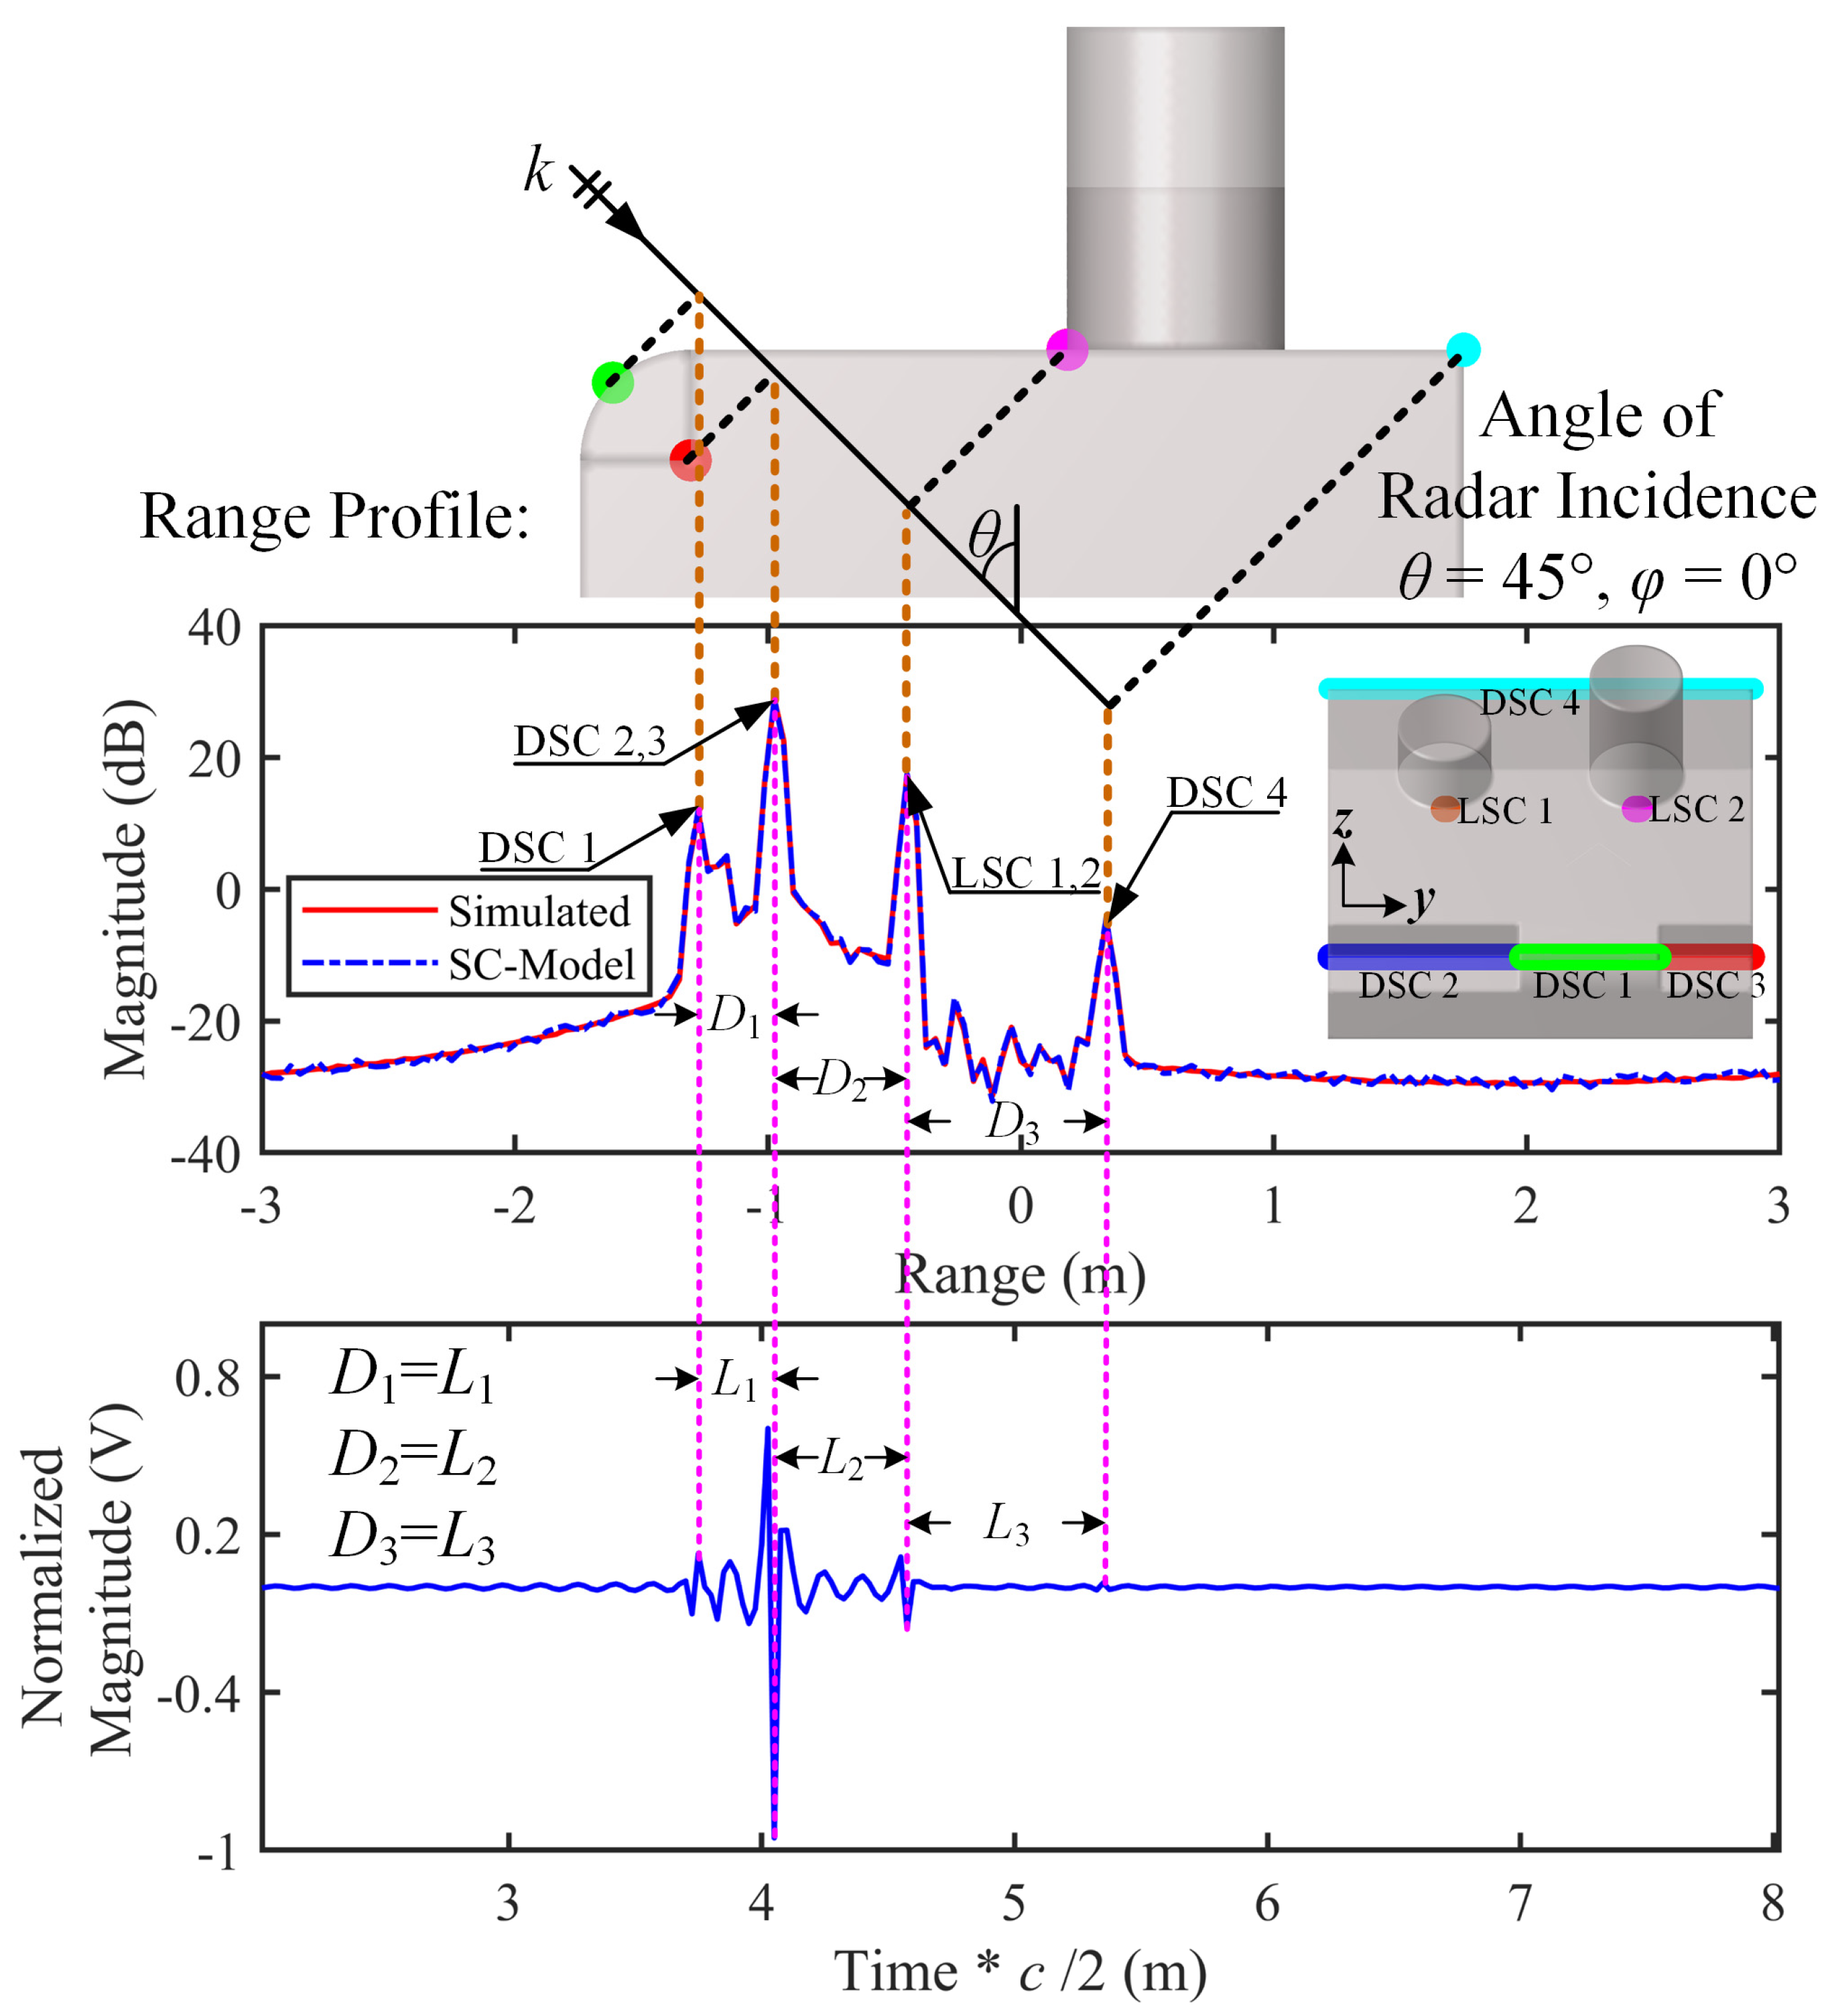
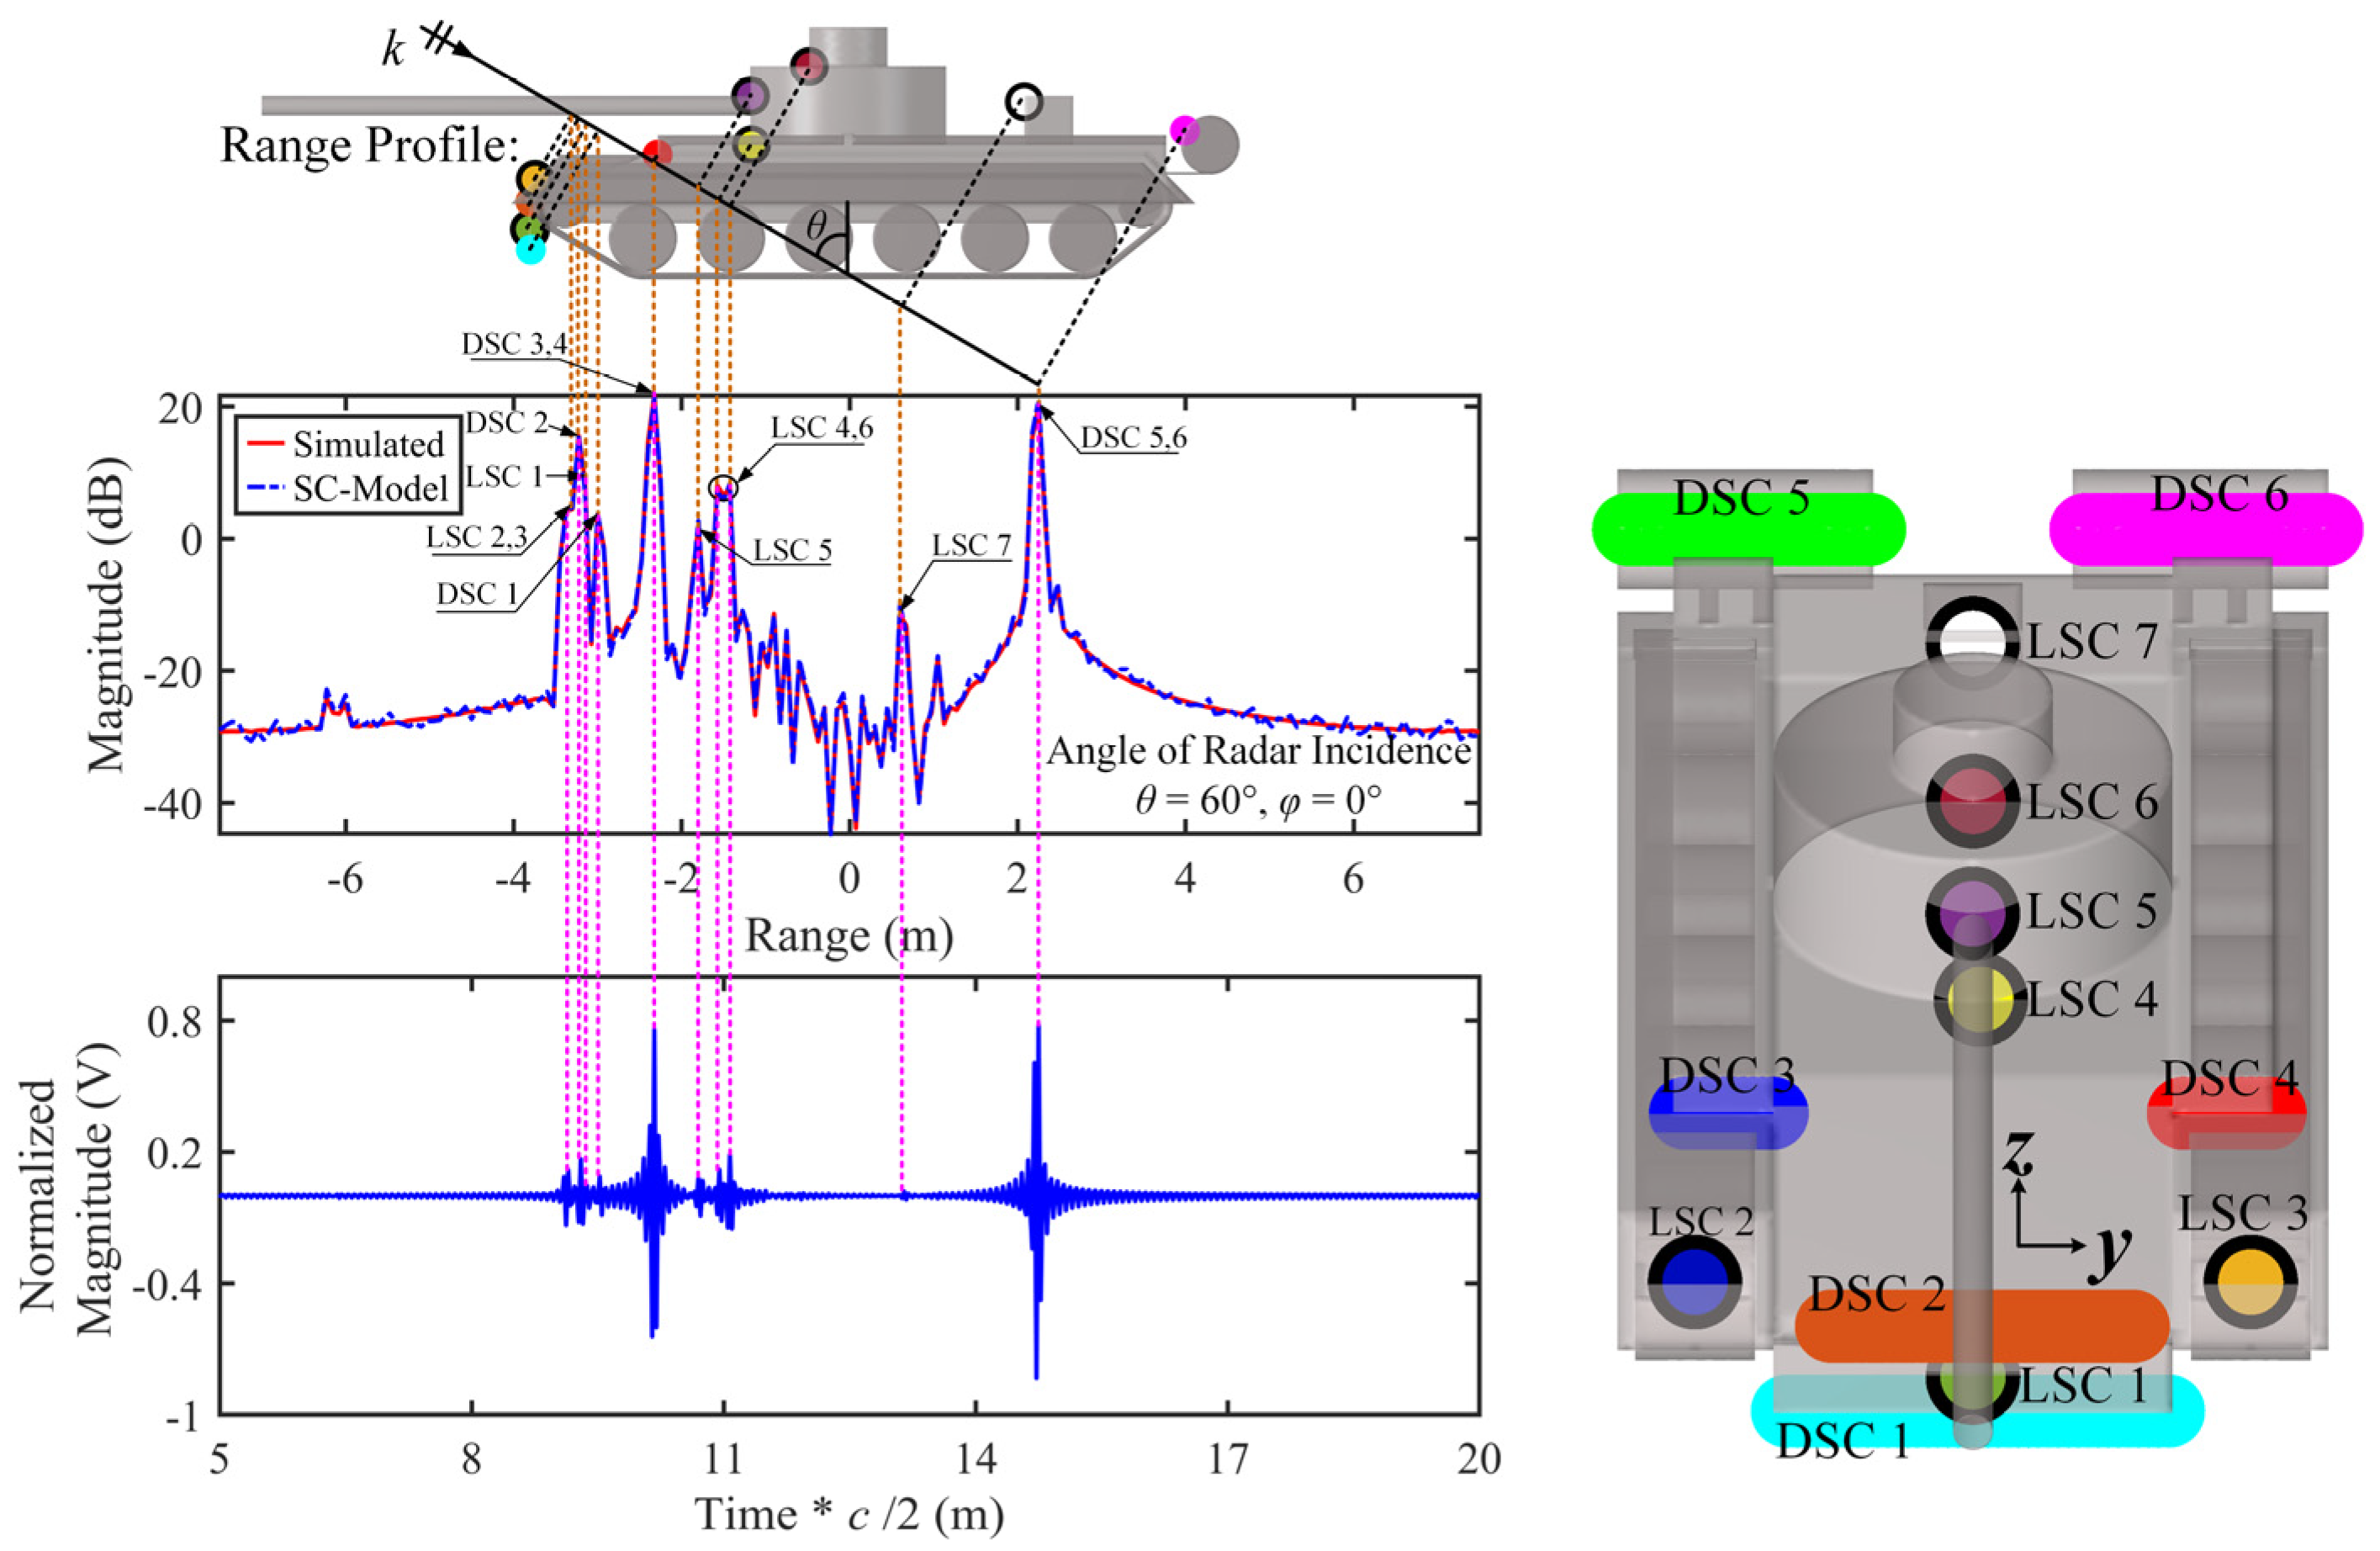
The correspondence between the obtained three-dimensional strong SCs and the target geometry, as well as the projection of SCs along the radar wave incident direction and the HRRP obtained via simulation methods, is shown in
Figure 10. It should be noted that the peaks on the HRRP correspond to the projections of strong scattering sources along the radar wave incident direction. The physical distance between the peaks of the radar echoes represents the path difference between the SCs. Theoretically, this path difference should be twice the relative distance of the SCs on the isophase surface. It is important to note that the original horizontal axis of the reconstructed time-domain echo is the time axis, which has been converted to a distance axis by multiplying the time axis by the speed of light and dividing by two, thereby representing the actual physical separation between the scattering sources.
As shown in the figure, there is a clear one-to-one relationship between the three-dimensional SCs and the local structures of the target. The projection of the SCs perfectly matches the peak points on the HRRP. The relative physical distance between the echo signal peaks corresponds to twice the peak distance on the HRRP.
The modeling results indicate that, from this observation angle, the dihedral structures formed by two sets of right-angle surfaces on the SLICY model, the axis of the front cylindrical surface, and the rear edge constitute distributed SCs (DSC 1-4). The coupled scattering of the upper and lower cylinders with the platform forms local SCs (LSC 1-2).
Table 2 presents the distances of strong SC projections from the radar direction to the coordinate origin, the distances between adjacent SCs, and the relative physical distances between the peak points of the HRRP and the reconstructed echoes under different radiation source excitations. As shown in the table, the calculated results are consistent. In summary, the correctness and effectiveness of the proposed forward-modeling method for radar target time-frequency domain scattering based on the SC model have been verified from the both time and frequency domain perspectives.
3.2. Forward Construction of Simplified Tank Wideband Echo Model
This section systematically analyzes the time-frequency domain scattering of a simplified tank using the proposed method. The simplified tank comprises typical scattering structures such as cylinders, plates, cubes, and dihedrals, with geometric dimensions of 10 m × 3.56 m × 2.57 m. The target model is decomposed into 61 surface regions, totaling approximately 168,000 facets. Refer to
Figure 11 and
Figure 12 for the schematic diagram and decomposition effect of the simplified tank model.
At an observation angle of
θ = 60°,
φ = 0°, the simplified tank is modeled using forward SC modeling. The center frequency is set to 3 GHz, with incident EM waves polarized in HH. The physical attributes, including the scattering sources and three-dimensional positional parameters, of the first eight strong SCs of the target are presented in
Table 3.
It is important to note that for complex targets, the diversity and complexity of surface scattering structures significantly increase the number of strong SCs. For typical targets like Slicy, the first eight SCs generally cover all strong SCs. However, for simplified and complex tank targets, forward modeling generates dozens of SCs. Due to space constraints, our manuscript only presents the results for the first 15 strong SCs. The reconstruction of the wideband echo signals is based on the dozens of SCs derived from the forward modeling.
The “Scattering Structures” column in the table provides the corresponding scattering structures for each SC. Leveraging the forward-modeling technique proposed in this research, a precise “one-to-one” correspondence is established between the SCs and the components on the target, with the model encompassing physical parameters such as amplitude, the frequency-dependent factor, and length parameters. Using the established SC model, the RCS characteristics of the target within a wide frequency range are reconstructed and compared with the simulation results obtained using the RL-GO algorithm, as illustrated in
Figure 13. The reconstructed RCS closely aligns with the simulation results, further affirming the efficacy of the proposed approach.
Figure 14 depicts the reconstructed time-domain echo of the radar target under various radar incident wave signals, with a radar observation angle of
θ = 60° and
φ = 0°.
Similar to the SLICY model,
Figure 15 illustrates the relationships between the forward-constructed strong SCs and the target’s local scattering structures, the projection points of the SCs on the imaging plane, the positions of the HRRP peak points, and the peak points of the reconstructed time-domain echoes. As shown in the figure, from this observation angle, the surface of the Simplified Tank contains multiple local and distributed SCs. The projection points of each SC on the imaging plane correspond precisely with the HRRP peaks and the reconstructed time-domain echo peaks.
The modeling results indicate that, from this observation angle, the individual scattering from the front fenders of the tank, the coupled scattering from the tracks and upper armor on both sides, and the individual scattering from the rear oil tanks form distinct distributed SCs (DSC 1-6). The coupled interactions between the front sloped armor, the turret, and the upper and lower structures, as well as the cubic structures on the rear deck, form multiple local SCs (LSC 1-7). The combined contributions of these strong SCs characterize the overall EM scattering properties of the target from this observation angle. Notably, traditional simulation algorithms can only obtain the target’s overall EM scattering, making it difficult to intuitively determine the scattering sources of multiple peaks in the HRRP. In contrast, the forward-modeling method proposed in this paper not only offers the advantage of “point frequency calculation, wideband generation”, but also provides rich physical insights with the SC model, allowing for the precise localization of scattering sources and the determination of scattering structures and geometric features. This offers robust technical support for radar target recognition systems based on scattering features.
Table 4 presents the corresponding target scattering structures for strong SCs (column 2), the distances of strong SC projections from the radar direction to the coordinate origin (column 3), the distances between adjacent SCs (column 4), and the relative physical distances between HRRP and reconstructed echo peak points under different radiation source excitations (columns 5–9).
Comparative analysis reveals that different radar transmission waves have varying impacts on the target’s time-domain echo signals. Compared to simpler targets like SLICY, the reconstruction of time-domain echoes for this target shows some discrepancies, but the error does not exceed 5 cm, which is within an acceptable range. This demonstrates the applicability and accuracy of the proposed model for tank-like targets.
3.3. Forward Construction of Complex Tank Wideband Echo Model
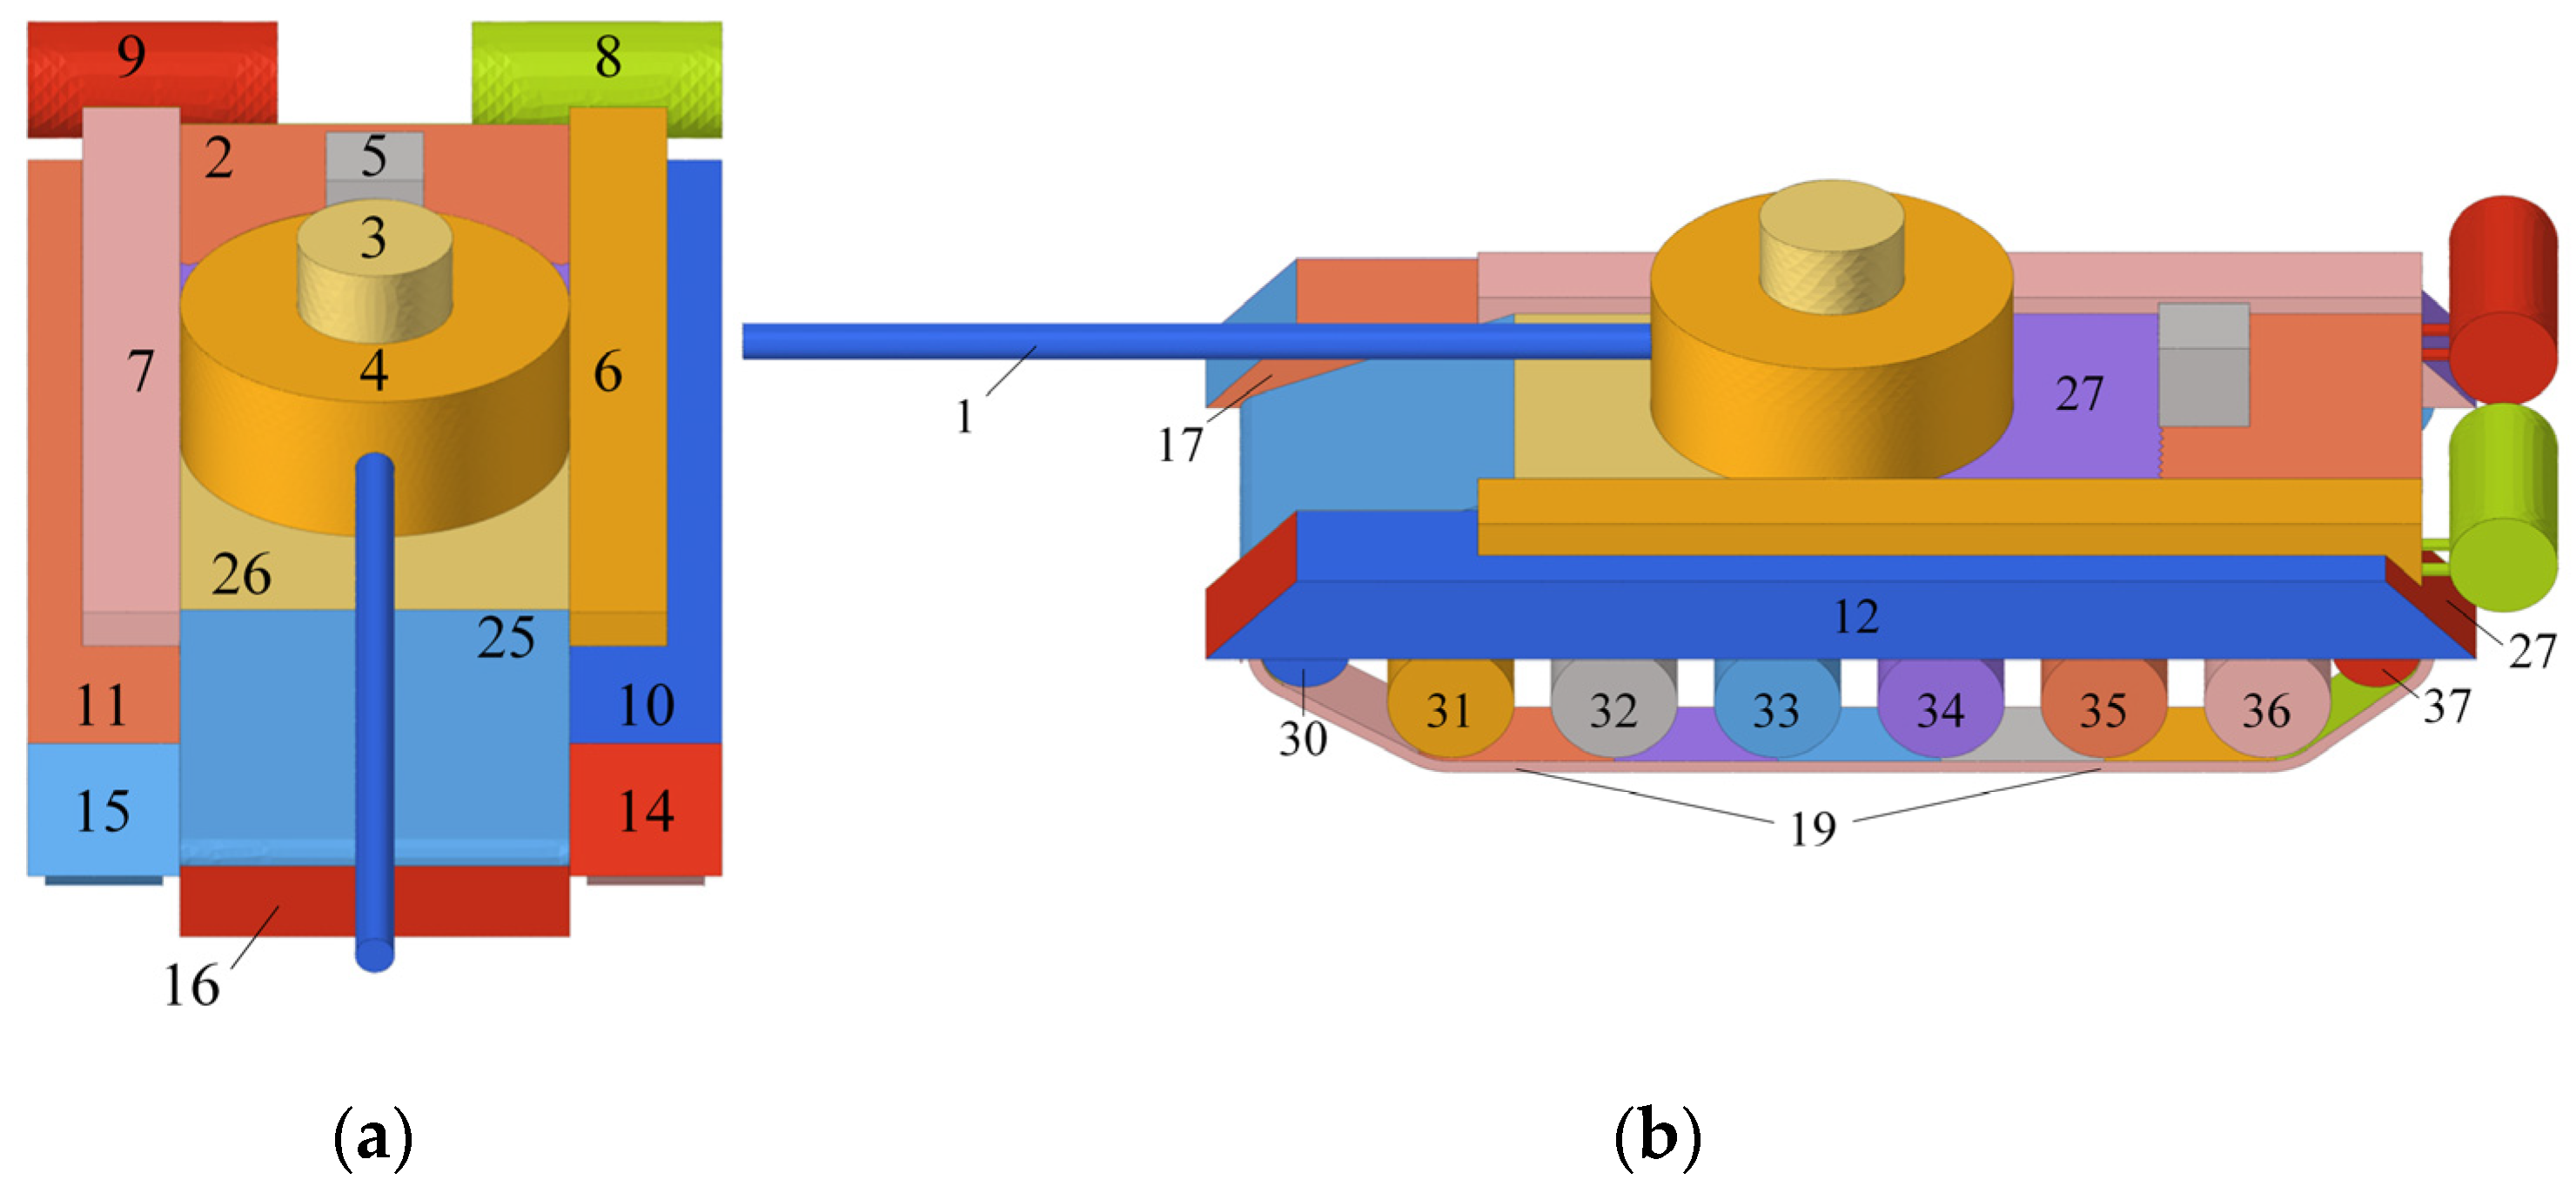
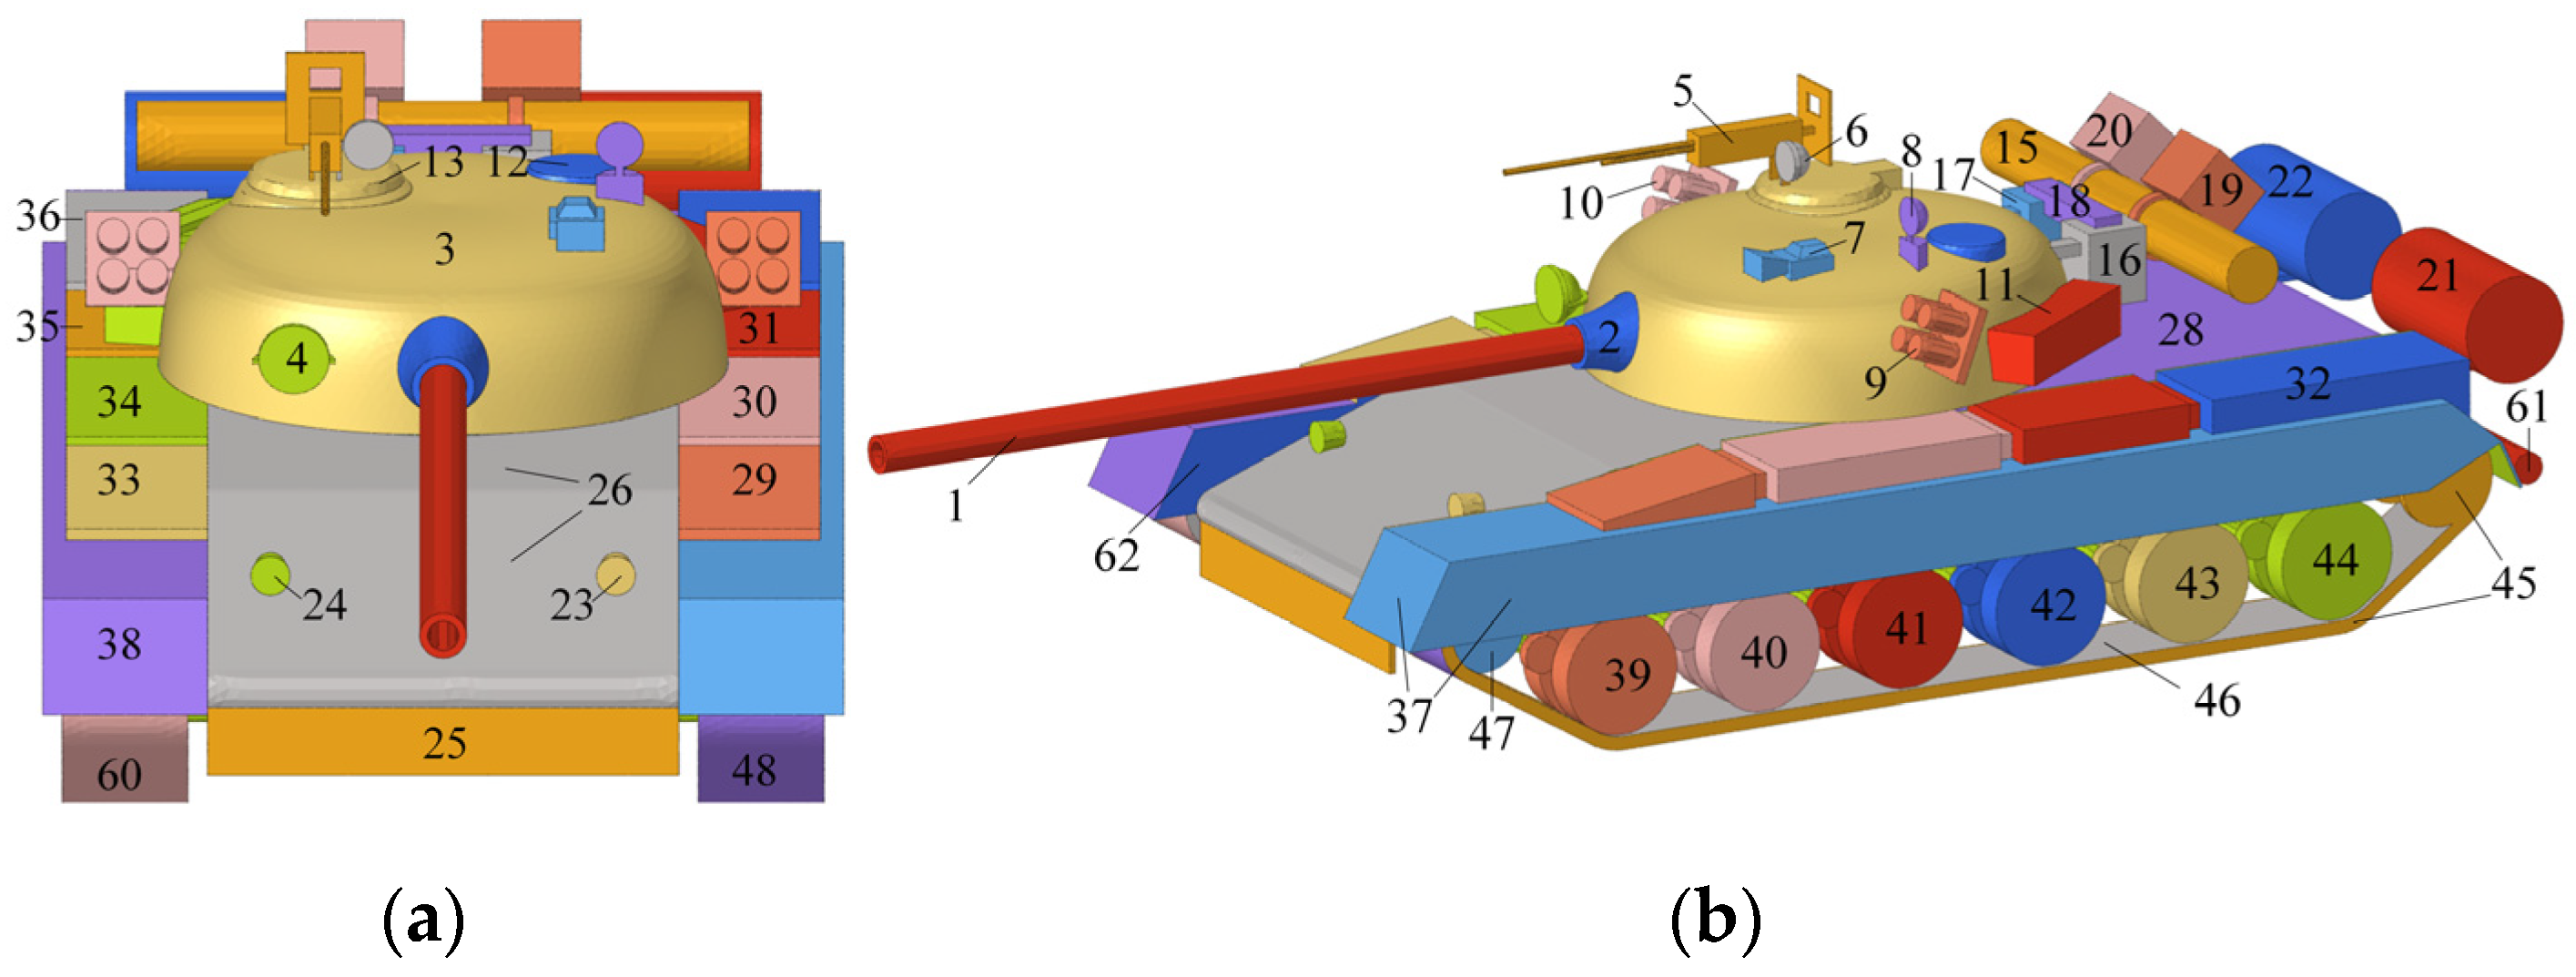
To further demonstrate the applicability and comprehensiveness of the proposed method, this section focuses on the research and analysis of the forward modeling of time-frequency domain scattering echoes for a complex tank target. Compared with simplified tanks, the surface structures of a complex tank are mostly non-typical scattering structures, and the amplitudes of the scattering sources are significantly reduced. To improve the accuracy of the SC model, the target’s CAD model is decomposed into 61 regions, comprising approximately 168,000 facets. The three-dimensional model schematic and the decomposition effect of the model components for the complex tank are shown in
Figure 16 and
Figure 17, respectively.
For the complex tank, forward modeling of the SCs was performed, with the observation angles set at
θ = 73° and
φ = 0°, and a center frequency of 3 GHz. The incident EM wave was HH polarized.
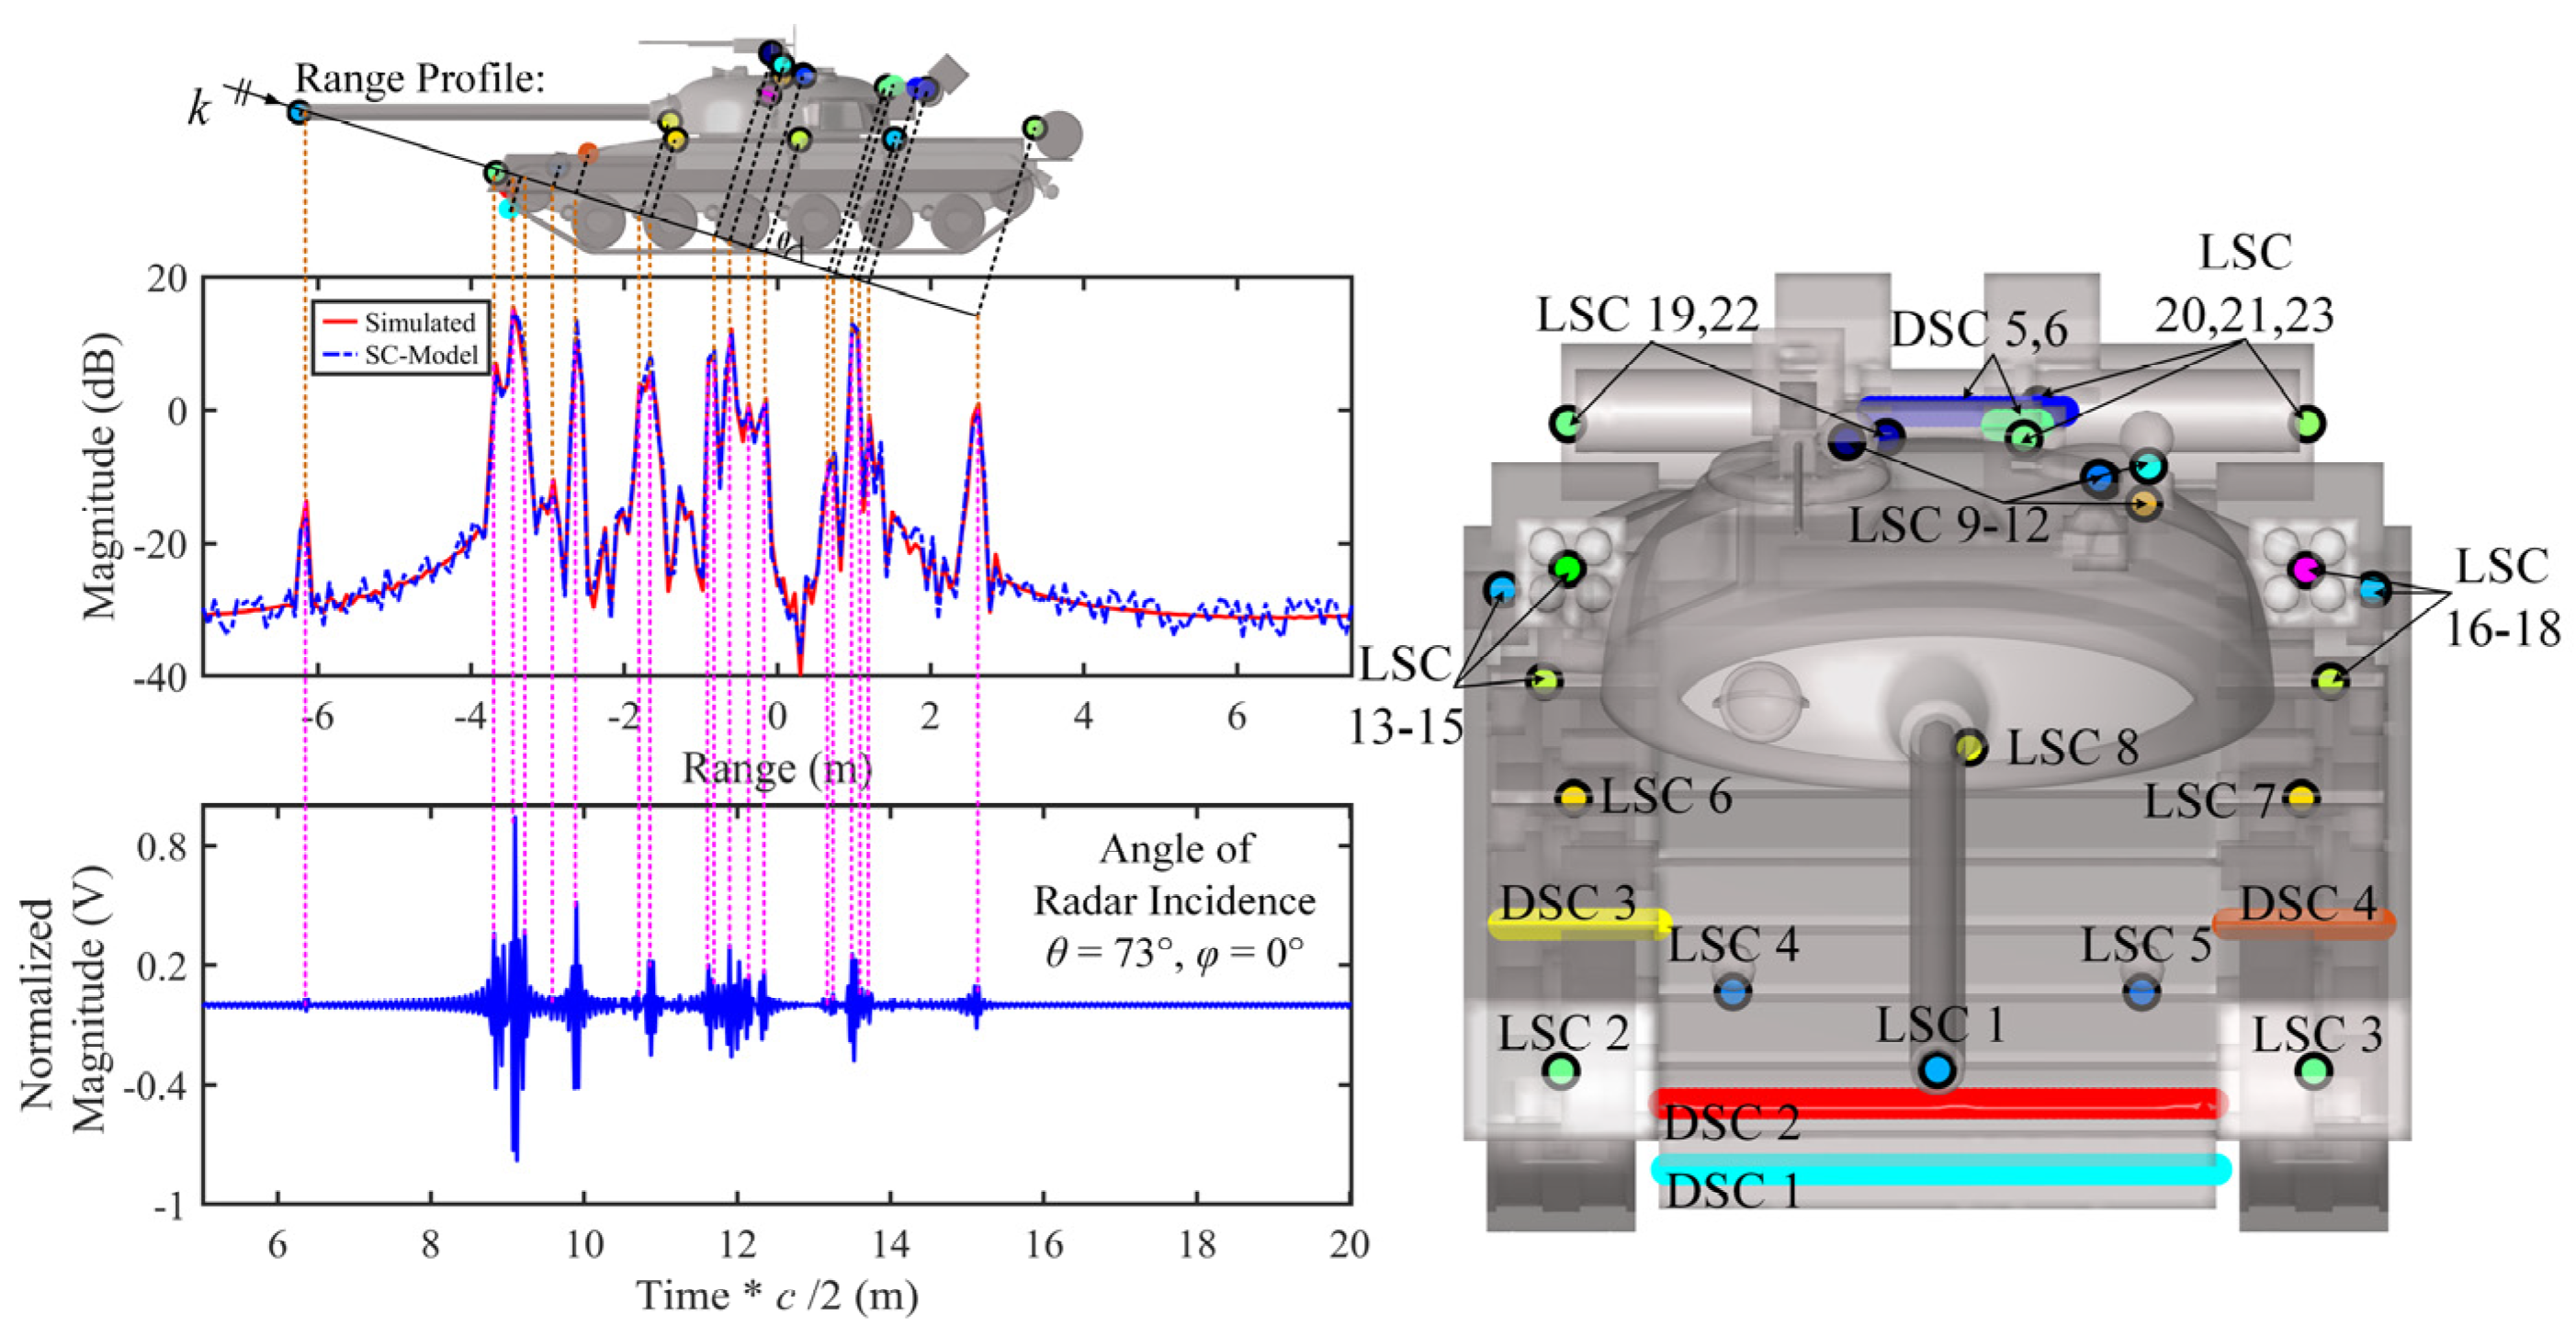
Table 5 lists the scattering sources and the three-dimensional positional parameters of the first eight strong SCs, along with other physical attributes. It is important to note that the complex tank target has a surface structure significantly more intricate than the previous two targets. As a result, the overall scattering from the target requires the coherent summation of contributions from dozens of scattering sources on the target’s surface. Consequently, the number of strong SCs identified is much greater than for the previous two targets. Due to space constraints, this paper presents the forward modeling results for only the first 20 strong SCs.
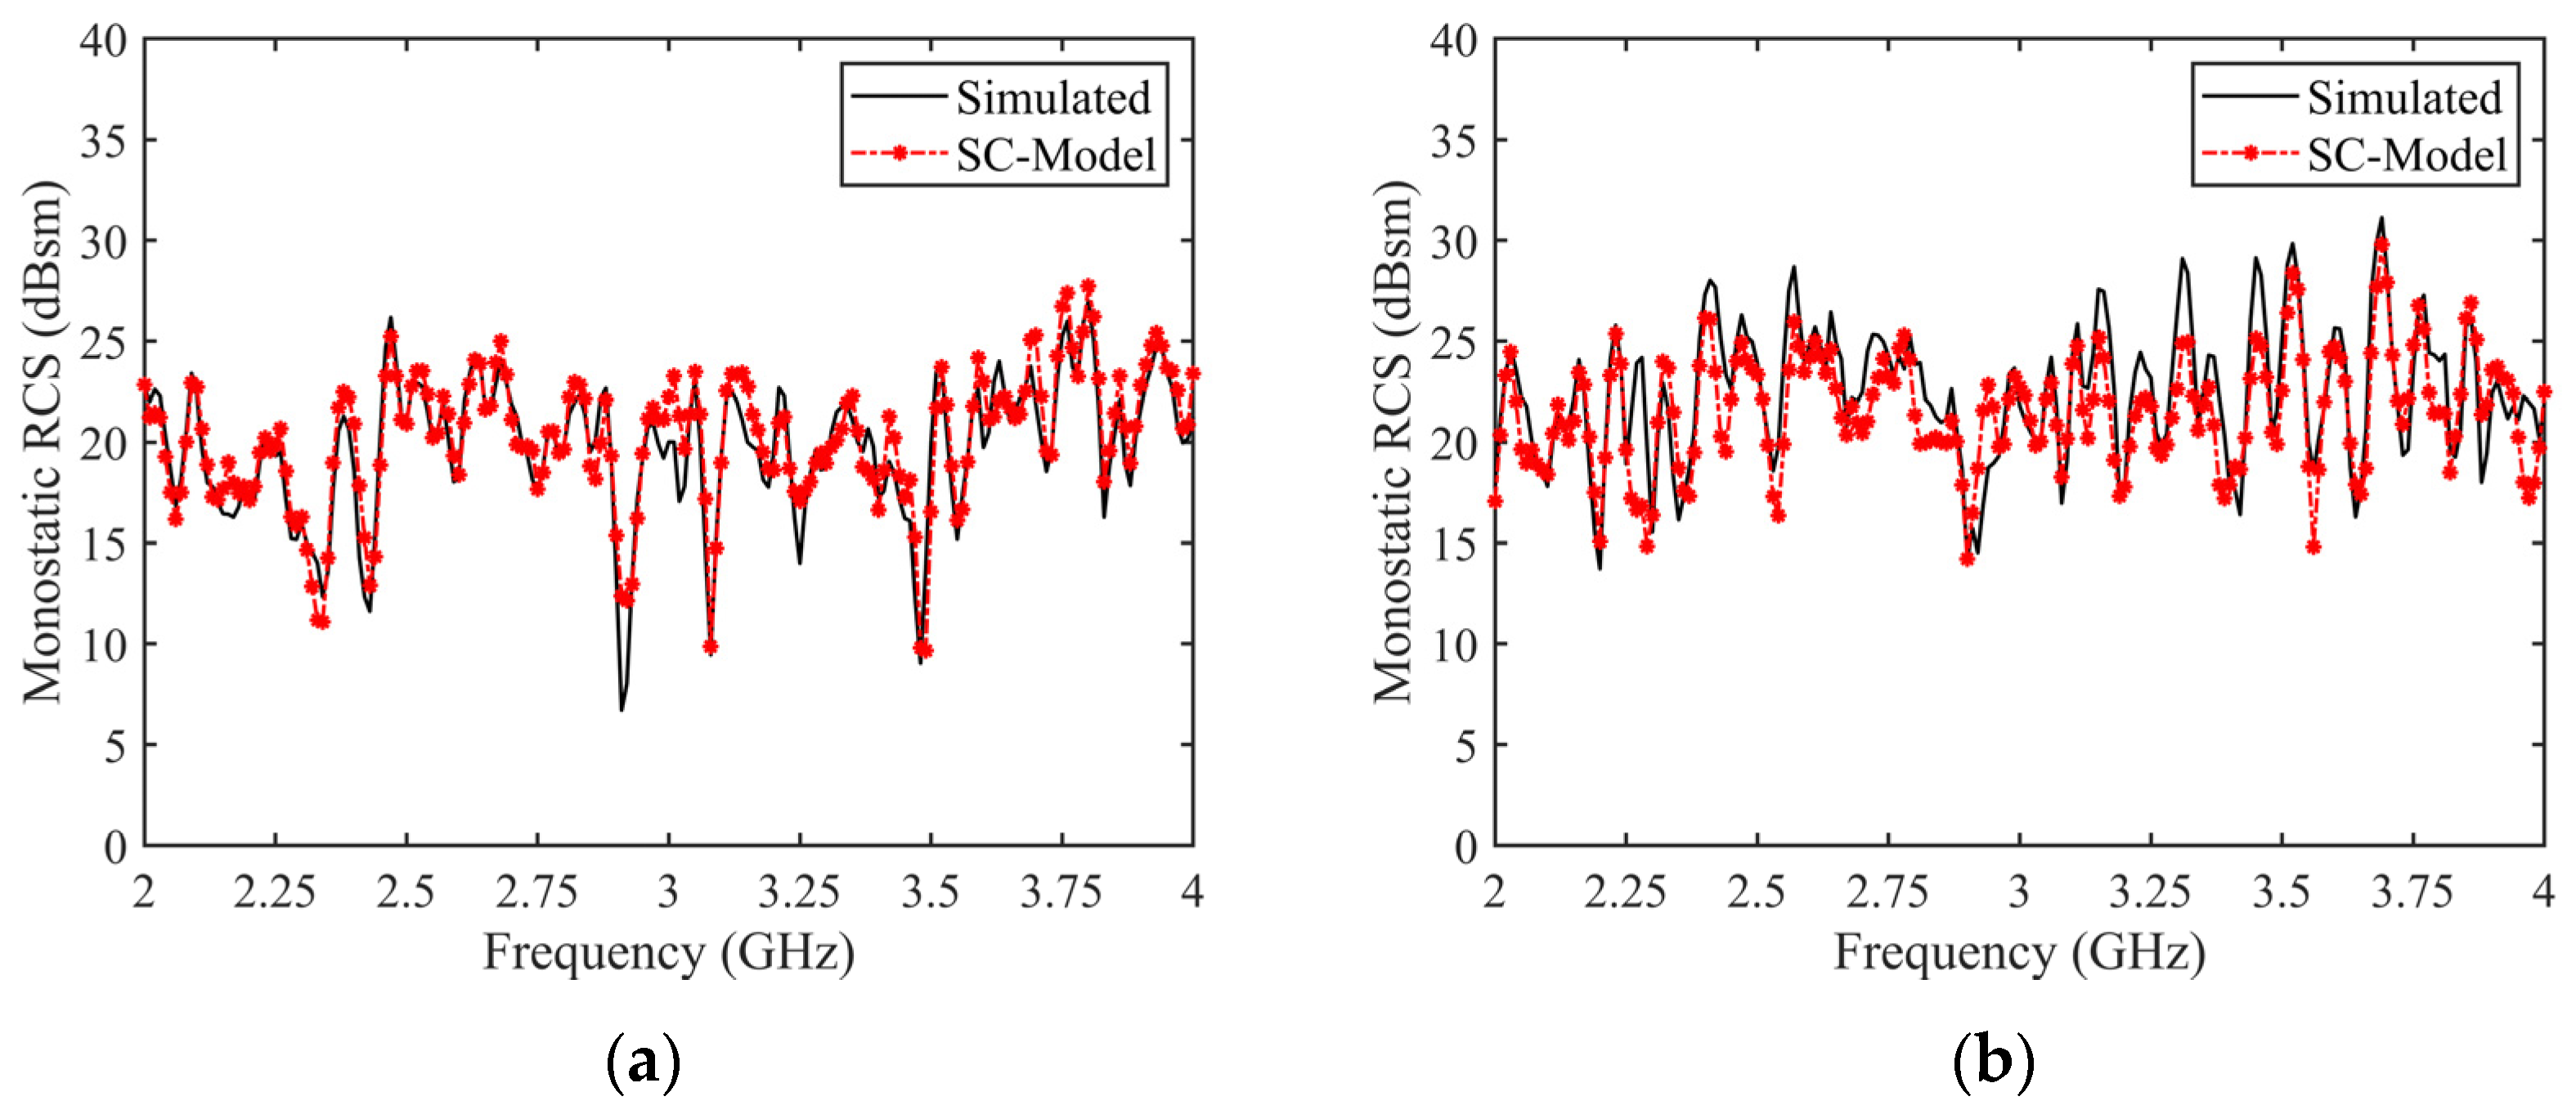
The table presents the scattering structures corresponding to the forward-modeled SCs along with their associated attributes. Through the forward-modeling technique proposed in this paper, a precise “one-to-one” correspondence is established between the SCs and the components on the target. Utilizing this SC model, the RCS characteristics of the target are reconstructed over a wide frequency range and compared with the simulation results obtained from the RL-GO algorithm, as shown in
Figure 18. Although there is a slight increase in error compared to simple structures, it remains within 3 dB, demonstrating the effectiveness of the proposed method for complex structure targets.
Figure 19 shows the time-domain echo reconstruction results for the SC model under various radiation sources at the radar observation angle of
θ = 73° and
φ = 0°. It is evident that the envelope of the time-domain echoes for the complex target significantly increases, with strong SCs forming clusters around specific points.
Figure 20 presents the distribution of strong SCs on the target, along with their projection points in the radar direction, HRRP, and the reconstructed time-domain echoes. As is clear, due to the complex tank’s predominantly atypical scattering structures, the distribution of strong scattering points becomes less distinct as the complexity of the target’s geometry increases. The HRRP peaks are often formed by the combined contributions of multiple scattering sources with comparable amplitudes. Using simulation algorithms, HRRP can only provide a general distribution of peak points, failing to correlate the scattering sources with the target’s structural features, thus offering limited support for target characteristic optimization.
However, the forward-modeling method proposed in this paper perfectly addresses this challenge. The constructed SC model clearly and unambiguously maps each scattering source to the corresponding geometric structure of the target.
Table 6 lists the corresponding scattering structures of strong SCs, the distance of each center’s projection from the coordinate origin in the radar direction, the proximity between SCs, and the relative physical distances between HRRP peaks and reconstructed echo peaks under different radiation sources. Comparative analysis reveals that different radar emissions affect the time-domain echo signals differently. While the error increases slightly compared to simpler models, the maximum error remains within 5 cm, demonstrating the proposed model’s applicability and effectiveness for complex tank targets.
From a complexity perspective, traditional simulation algorithms require the scattering data for every point within the bandwidth range to be calculated to obtain the wideband data of the target. In contrast, the SC forward model proposed in this paper demonstrates strong wideband reconstruction capabilities (data compression), characterized by “single-frequency computation, wideband generation”. It only necessitates the computation of model data for the center frequency point, and a rapid expansion within the specified bandwidth to obtain complete wideband echo data. This results in a reduction in the computation time from minutes to seconds, while maintaining real-time performance and high precision, making it suitable for the rapid/real-time generation of characteristic data.
Table 7 provides a comparison of the computation time and memory usage for the calculation of echo data in different scenarios (
Figure 8,
Figure 13 and
Figure 18).
In summary, while the time-domain echo waveforms of simple structures can be roughly correlated with the target’s geometric model to identify the scattering structures corresponding to the peak points, the complexity of echo waveforms for complex targets increases sharply. Multiple SCs often contribute to the same envelope, making it difficult for simulation algorithms alone to disentangle the impact of component-level scattering contributions on the overall scattering and their variation patterns. This limitation results in inadequate support for the optimization of radar target characteristics.
In contrast, the echo model derived using the forward-modeling method proposed in this paper offers significant advantages. Firstly, it features the “point-frequency calculation, wideband extension” capability, allowing for the rapid and accurate acquisition of the wideband echo signals of the target. This enhances the data compression efficiency and real-time performance. Secondly, the SCs in the model are mathematical representations of the physical scattering characteristics of the target’s local geometric structures. This allows the echo model to provide straightforward physical interpretations of various peak points, identifying which scattering structures primarily contribute to the scattering in specific regions. This capability offers critical technical support for the design and improvement of radar target characteristics.

