Article

Agricultural Drought Monitoring Using an Enhanced Soil Water Deficit Index Derived from Remote Sensing and Model Data Merging

1
Shanghai Investigation Design Research Institute, Shanghai 200335, China
2
College of Hydrology and Water Resources, Hohai University, Nanjing 210098, China
3
State Key Laboratory of Hydraulics and Mountain River Engineering, Sichuan University, Chengdu 610207, China
*
Author to whom correspondence should be addressed.
Remote Sens. 2024, 16(12), 2156; https://doi.org/10.3390/rs16122156
Submission received: 22 April 2024 / Revised: 31 May 2024 / Accepted: 10 June 2024 / Published: 14 June 2024

Abstract

:
Droughts present substantial challenges to agriculture, food security, and water resources. Employing a drought index based on soil moisture dynamics is a common and effective approach for agricultural drought monitoring. However, the precision of a drought index heavily relies on accurate soil moisture and soil hydraulic parameters. This study leverages remote sensing soil moisture data from the Climate Change Initiative (CCI) series products and model-generated soil moisture data from the Variable Infiltration Capacity (VIC) model. The extended triple collocation (ETC) method was applied to merge these datasets from 1992 to 2018, resulting in enhanced accuracy by 28% and 15% compared to the CCI and VIC soil moisture, respectively. Furthermore, this research establishes field capacity and a wilting point map using multiple soil datasets and pedotransfer functions, facilitating the development of an enhanced Soil Water Deficit Index (SWDI) based on merged soil moisture, field capacity, and wilting points. The findings reveal that the proposed enhanced SWDI achieves a higher accuracy in detecting agricultural drought events (probability of detection = 0.98) and quantifying their severity (matching index = 0.33) compared to an SWDI based on other soil moisture products. Moreover, the enhanced SWDI exhibits superior performance in representing drought-affected crop areas (correlation coefficient = 0.88), outperforming traditional drought indexes such as the Standardized Precipitation Index (correlation coefficient = 0.51), the Soil Moisture Anomaly Percent Index (correlation coefficient = 0.81), and the Soil Moisture Index (correlation coefficient = 0.83). The enhanced SWDI effectively captures the spatiotemporal dynamics of a drought, supporting more accurate agricultural drought monitoring and management strategies.

1. Introduction

Under the background of intensifying global climate change and increasing human activities, drought has escalated into one of the most severe natural disasters globally in recent years [1,2]. According to data from the Food and Agriculture Organization of the United Nations, the decade spanning from 2005 to 2015 witnessed global drought disasters that caused economic damages exceeding $35 billion, representing more than 36% of the total losses attributed to natural calamities [3]. Droughts are typically categorized into three types depending on the area of impact: meteorological (related to weather patterns), agricultural (impacting soil moisture and crop growth), and hydrological (affecting water sources like rivers and lakes) [4,5,6]. Notably, agricultural drought, which is characterized by prolonged periods of inadequate soil moisture that fails to support healthy crop growth, was responsible for 83% of the total economic damages caused by droughts [3]. Consequently, improving the monitoring of agricultural droughts is crucial for effectively reducing the associated risks, diminishing the economic impacts, and preventing potential food security crises [7]. This underlines the urgent need for advanced tools and methodologies to enhance the accuracy and efficiency of drought monitoring [8].
Soil moisture-related indexes stand out as the predominant tools for monitoring agricultural droughts [9,10]. A plethora of scholars have delved into drought research grounded in soil moisture dynamics. For instance, Mao et al. [11] harnessed the Soil Moisture Anomaly Percentage Index (SMAPI) to effectively simulate historical droughts in the Jiangsu Province, highlighting the significant potential of this index for drought assessment. Meanwhile, Hou et al. [12] computed the Standardized Precipitation Evapotranspiration Index (SPEI) and Soil Moisture Deficit Index (SMDI) across eight stations at varying scales, elucidating that an SMDI offered superior insights into spring wheat yields. Moreover, some researchers have advocated for drought indexes that concurrently consider soil moisture and soil hydraulic parameters, exemplified by the SWDI [13]. Pablos et al. [14] conducted a comparative analysis of four widely used agricultural drought indexes in Spain, revealing the SWDI as the most adept index for detecting and characterizing drought events. The crux of drought monitoring utilizing these indexes hinges on obtaining precise estimates of soil moisture [15]. Presently, methods for acquiring such data encompass in situ site-based measurements, model-based simulations, and remote sensing-based retrievals [16]. Although in situ measurements offer the highest accuracy for soil moisture, their large-scale application is limited by high economic costs and intensive labor requirements [17]. Additionally, the accuracy of soil moisture simulations based on hydrological models is heavily contingent on model structures and parameters, thereby introducing substantial uncertainties in ungauged regions [18]. Nevertheless, with advancements in sensor technology and the refinement of retrieval algorithms, the precision of surface soil moisture retrieval via remote sensing has been steadily on the rise [19,20]. A multitude of scholars have embarked on drought monitoring endeavors leveraging remote sensing soil moisture data. For instance, Mishra et al. [21] utilized the SMAP-driven SWDI to simulate agricultural droughts in the United States, demonstrating the SWDI’s consistent monitoring prowess compared to traditional agricultural drought indexes like Crop Moisture Index (CMI). It provides continuous spatiotemporal distribution of agricultural droughts, overcoming some limitations associated with the extensive time series datasets required for other drought indexes. However, research by Wu et al. [22] indicated that the accuracy of remote sensing soil moisture in China lagged behind that of other regions as a result of radio frequency interference, which may lead to significant uncertainties in its application to drought monitoring.
In recent years, ETC-based data merging has been applied to estimate surface critical climate variables [23]. The ETC method leverages the statistical strengths of triple collocation analysis, allowing it to effectively integrate multiple data sources and robustly quantify the error characteristics of each data source involved, enabling a more accurate and reliable merging of data [24]. One of the primary advantages of the ETC method is its ability to provide an unbiased error estimate of soil moisture without requiring a priori knowledge of the true state, which is often a limitation in data assimilation and machine learning approaches [25]. Data assimilation typically necessitates a dynamic model and initial conditions, which can introduce model-specific biases and dependency on the quality of initial data inputs. Similarly, machine learning methods require large datasets for training and are often constrained by the representativeness of the training data, potentially leading to overfitting or biases in data-scarce regions. Since ETC methodologically computes error statistics from the input datasets, the presence of substantial biases or anomalies in any of the data sources can propagate through the analysis, leading to compromised estimates [26]. Therefore, it is crucial to select data sources that have been extensively validated and are widely recognized for their reliability in representing soil moisture accurately.
The accurate estimation of soil hydraulic parameters, alongside soil moisture, is pivotal to enhancing the efficacy of a drought index that integrates both soil moisture and soil hydraulic properties [27]. Typically, for large-scale studies, these parameters are deduced through pedotransfer functions (PTFs) [28,29]; however, research by Wu et al. [30] highlighted a significant shortfall in the reliability of these PTFs for estimating soil hydraulic parameters within China. This discrepancy stems from the fact that the calibration of PTFs primarily relies on soil profiles collected outside the country, thus raising concerns about their applicability and precision in local contexts. Furthermore, auxiliary drought indexes, such as the Atmospheric Water Deficit (AWD), are frequently employed to bolster the verification process of drought monitoring on a large scale [14,21]. These indexes, however, may not fully capture the on-the-ground impact of agricultural droughts. An innovative approach to validating the accuracy of drought indexes could involve the analysis of data pertaining to areas affected by drought-related crop failures [31]. This method promises to provide a more direct and reliable measure of a drought index’s effectiveness in reflecting the true impact of agricultural droughts on crop yields [32]. Nonetheless, the implementation of this approach faces significant challenges, primarily due to the scarcity of large-scale, detailed statistical data on crop performance in drought-affected regions. Despite its potential to offer insightful validations, this avenue remains underexplored in current research, underscoring a critical gap in our understanding and assessment of agricultural-drought-monitoring methods.
The central objective of this research is to introduce an enhanced SWDI derived from remote sensing and model data merging to improve the precision of agricultural drought monitoring in China. To achieve this objective, the study focuses on the following tasks: (1) merging remote sensing and model soil moisture data using the ETC method, assessing the merged soil moisture with in situ measurements. (2) Generating the SWDI by utilizing the merged soil moisture along with the field capacity and wilting point, comparing the SWDI’s performance across different soil moisture products at different regions. (3) Validating the SWDI for drought monitoring through the AWD over the grid of China. (4) Analyzing the spatiotemporal characteristics of a drought using the SWDI and drought-affected crop areas, comparing the performance of four drought indexes based on the drought-affected crop areas. This study aspires to bridge the gap between theoretical drought indexes and their practical application in agricultural drought monitoring, offering significant improvements in regard to accuracy, reliability, and operational utility.

2. Data and Study Area

2.1. ESA CCI Soil Moisture

The ESA CCI Soil Moisture product was developed within the framework of the European Space Agency’s Climate Change Initiative to address the global demand for soil moisture monitoring (https://climate.esa.int/en/projects/soil-moisture/, accessed on 12 June 2024). In accordance with the requirements of long-term climate research, this CCI product amalgamates soil moisture data from a variety of passive and active microwave instruments, offering a spatial resolution of 0.25° (approximately 25 km) and a temporal resolution of 2 to 3 days. The CCI product encompasses three distinct soil moisture products based on the following sensor categories: CCI Active (CCIA), CCI Passive (CCIP), and CCI Combined (CCI). CCIA integrates observations from AMI-WS and ASCAT-A/B/C, whereas CCIP merges data from SMMR, TMI, AMSR-E, WindSat, SMOS, AMSR2, SMAP, and FY [23]. To maintain consistency between climatology and real-time observations, the combined products utilize soil moisture from the GLDAS-Noah land surface model as a climatological reference, employing cumulative density function (CDF) matching during fusion to calibrate the products [24]. Notably, the model products are utilized exclusively for calibration and do not partake in the CCI data fusion process. In contrast, the CCIA and CCIP products are calibrated using active remote sensing data from ASCAT and passive remote sensing data from AMSR-E, respectively. This study employs the most recent version of CCI V8.1 (https://catalogue.ceda.ac.uk/uuid/010243ea38f3473a885d2ccd9cfb77ab, accessed on 12 June 2024), offering 40 years of soil moisture data spanning from November 1978 to December 2022. The CCI V8.1 dataset is accessible from October 2023 to the present.

2.2. VIC Soil Moisture

The VIC model, originally introduced by Liang et al. [33], stands as a large-scale land surface hydrological model that has gained widespread adoption in China due to its notable accuracy compared to other hydrological models. This model operates within a framework that incorporates geographical, vegetation, and hydrological parameters alongside meteorological forcing data. Specifically, the input data for the VIC model includes soil parameters sourced from the SoilGrids dataset and vegetation parameters obtained from the MOD12Q1 dataset [34]. Daily precipitation and temperature data from 756 meteorological stations throughout China, sourced from the China Meteorological Administration Meteorological Data Sharing Service System (http://data.cma.cn/, accessed on 12 June 2024), were employed to drive the model. The model calibration was conducted in 43 small basins across various regions in China based on observed streamflow data. Utilizing calibrated parameters along with selected climate characteristic variables, a parameter regionalization formula was established to extend the model application to basins lacking direct streamflow measurements [35]. The VIC soil moisture used in this study pertained to the upper layer (0–10 cm), expressed in volumetric water content (m3·m−3), with a grid size of 10 km. The dataset spanned from 1951 to 2022, providing a comprehensive nationwide daily soil moisture sequence.

2.3. In Situ Soil Moisture

The soil moisture data utilized in this study were obtained from the Soil Moisture Monitoring Database maintained by the Ministry of Water Resources of China. The data were obtained through a collaborative project between our research group and the Ministry of Water Resources and are not publicly available. Observations of soil moisture were carried out at each monitoring station on the 1st, 6th, 11th, 16th, 21st, and 26th day of every month at 8:00 a.m., with measurements being taken at depths of 0–10 cm, 10–20 cm, and 20–40 cm. A total of 1682 stations nationwide provided observational data, covering the period from 2008 to 2018. Given that the penetration depths of satellite soil moisture products typically reach around 5 cm, this study exclusively focused on soil moisture measurements from the surface layer (0–10 cm). For agricultural regions like the North China Plain, monitoring stations were strategically positioned within fields to accurately capture soil moisture levels. Consequently, the data collected from these stations effectively represent actual irrigation conditions. Figure 1 shows the distribution of in situ soil moisture stations in China. The total number of stations is 1682, including 692 in northern China (N), 768 in southern China (S), 217 in northwestern China (NW), and 5 on the Qinghai−Tibet Plateau (QT).

2.4. Field Capacity

In the realm of large-scale drought monitoring, field capacity, a pivotal hydraulic parameter of soil, finds frequent application in the formulation of drought indices. Traditional acquisition of field capacity data relies on on-site observations, posing challenges in obtaining large-scale, high-precision data essential for comprehensive drought monitoring. Addressing this issue, Wu et al. [30] introduced a field capacity fusion algorithm leveraging multi-source soil data to achieve a finely tuned distribution of field capacity across China. This algorithm integrates fusion factors derived from both multivariate regression analysis, incorporating field capacity data from over 2300 sites and three sets of soil data, as well as existing soil transfer functions. By employing a fusion algorithm grounded in statistical indicators, the researchers determined fusion factors and weights. Following scale alignment, they established a nationwide 250 m gridded distribution of field capacity. Comparative analysis with existing field capacity products indicated a remarkable improvement in accuracy, exceeding 40%, compared to the prevailing field capacity datasets.

2.5. SoilGrids

SoilGrids is a comprehensive global soil information dataset generated from worldwide soil profile and environmental variable data (www.soilgrids.org, accessed on 12 June 2024) developed by the International Soil Reference and Information Centre (ISRIC). The SoilGrids dataset integrates globally distributed soil profile data, correlates them with environmental covariates, and encompasses global soil properties and classification maps established through geostatistics and machine learning algorithms. The initial version, SoilGrids 1.0, was crafted using geostatistics, offering 1 km resolution for soil physical properties (e.g., sand content, clay content, silt content, bulk density, coarse fragment content), soil biochemical properties (including Soil Organic Matter (SOM), soil pH, cation exchange capacity), and soil classification [36]. The subsequent version, SoilGrids 2.0, released in 2016 and employing machine learning, enhanced the resolution to 250 m, thereby refining data precision. The dataset stratifies soil into six layers, spanning depths of 0–5 cm, 5–15 cm, 15–30 cm, 30–60 cm, 60–100 cm, and 100–200 cm [37]. As a global statistical model, SoilGrids furnishes unbiased estimates worldwide.

2.6. Precipitation and Evapotranspiration

ERA5 is a state-of-the-art atmospheric reanalysis dataset produced by the European Centre for Medium-Range Weather Forecasts (ECMWF). Reanalysis involves combining observational data with a numerical weather prediction model to create a consistent and comprehensive representation of the Earth’s atmosphere over time. ERA5 is a fifth-generation reanalysis dataset, providing global atmospheric information at various temporal and spatial resolutions (https://www.ecmwf.int/en/forecasts/dataset/ecmwf-reanalysis-v5, accessed on 12 June 2024). ERA5 provides precipitation data on a regular latitude−longitude grid with a spatial resolution of 0.25 degrees (approximately 31 km at the equator) for the main variables. The temporal resolution of ERA5 precipitation data is hourly, meaning that precipitation values are available for each hour of the day. Additionally, daily and monthly aggregates are often calculated based on the hourly data. The ERA5 dataset spans from January 1950 to April 2024, with updates being processed up to a few days before the current date. ERA5 assimilates a vast amount of observational data from various sources, including satellite observations, ground-based weather stations, radiosondes, and other measurements. The assimilation process helps create a comprehensive and consistent representation of the atmospheric state.
Evapotranspiration (ET) is the combined process of water evaporation from the Earth’s surface and the transpiration of water from plants. The Global Land Data Assimilation System (GLDAS) provides the estimation of ET using data assimilation techniques on a global scale. The GLDAS project is a collaborative effort involving multiple institutions and agencies, including NASA and the National Centers for Environmental Prediction (NCEP). GLDAS aims to provide high-quality, spatially and temporally consistent land surface datasets, including information on evapotranspiration, to support various hydrological and climate studies. The GLDAS ET data is derived from a combination of observational data and land surface models. These models assimilate data from multiple sources, such as satellite observations, meteorological stations, and other remote sensing data, to produce estimates of various land surface variables, including evapotranspiration. The GLDAS provides gridded ET data on a global scale, typically with spatial resolutions ranging from 0.25 to 1.0 degrees and temporal resolutions ranging from hourly to monthly (https://ldas.gsfc.nasa.gov/gldas/model-output, accessed on 12 June 2024).
In this study, we employed precipitation data from ERA5, which provides daily measurements on a 0.25-degree grid, and ET data from the GLDAS, similarly offered on a 0.25-degree grid. Both datasets encompass the entire spatial extent of China and cover the period from 1992 to 2018. As third-party sources, ERA5 and the GLDAS are subject to rigorous quality control and calibration, ensuring the provision of long-term, consistent data. Using independent benchmarks, such as ERA5 for precipitation and the GLDAS for ET, enhances the validation process. This approach confirms the robustness and reliability of the SWDI, generated from model soil moisture (which is driven by meteorological station observations), as a drought indicator. It ensures that the validation does not depend exclusively on data from a single source, thereby improving the objectivity and credibility of the results.

2.7. Drought-Affected Crop Area

The long-term absence of precipitation leads to a reduction in soil moisture, subsequently exerting an adverse impact on crop growth. Given that crops constitute the most directly affected entities in the context of drought, the extent of crop damage serves as a precise and quantifiable indicator of the genuine drought conditions prevailing in a given region. Consequently, a dependable drought index should possess the capability to precisely model data concerning the extent of crop damage caused by a drought. The drought-affected crop area is defined as the area where crop yields have decreased by more than 10% due to drought conditions, serving as an effective indicator of the actual severity of a drought and its impact on crop reduction. The research compiled statistical data on the drought-affected crop area spanning the period from 1992 to 2018. The data were extracted from the China Water and Drought Disasters Bulletin developed by the Ministry of Water Resources of China. Annually, the crop damage area resulting from droughts in each province of China is meticulously computed and reported by the respective water resources and agricultural departments, employing a standardized methodology. The unit for expressing the crop damage area due to drought is measured in ten thousand hectares.

2.8. Auxiliary Data

The SMAP satellite was launched on 31 January 2015 by NASA to obtain global-scale soil moisture and freeze/thaw state measurements [38]. It carries a radiometer at L-band, with a revisit time of 2–3 days, and a sun-synchronous orbit with an altitude of 685 km which consists of ascending (6:00 p.m. at local time) and descending (6:00 a.m. at local time) half-orbits. The SMAP provides four different level products with different application goals, i.e., level 1 instrument data, level 2 half-orbit data, level 3 daily composite data, and level 4 model-derived value-added data. The SMOS mission was launched on 2 November 2009 with the aim of mapping global surface soil moisture with a target accuracy of 0.04 m3·m−3 [39]. The satellite carries an L-band radiometer with multiple incidence angles from 0° to 55° which retrieves soil moisture twice a day at 6:00 a.m. (ascending) and 6:00 p.m. (descending) Local Solar Time (LST). The spatial resolution is around 35–55 km and the revisit period is 3 days. The SMAP level 3 descending and SMOS L3 ascending soil moisture product were used in this study as auxiliary soil moisture products for comparison.

2.9. Study Area

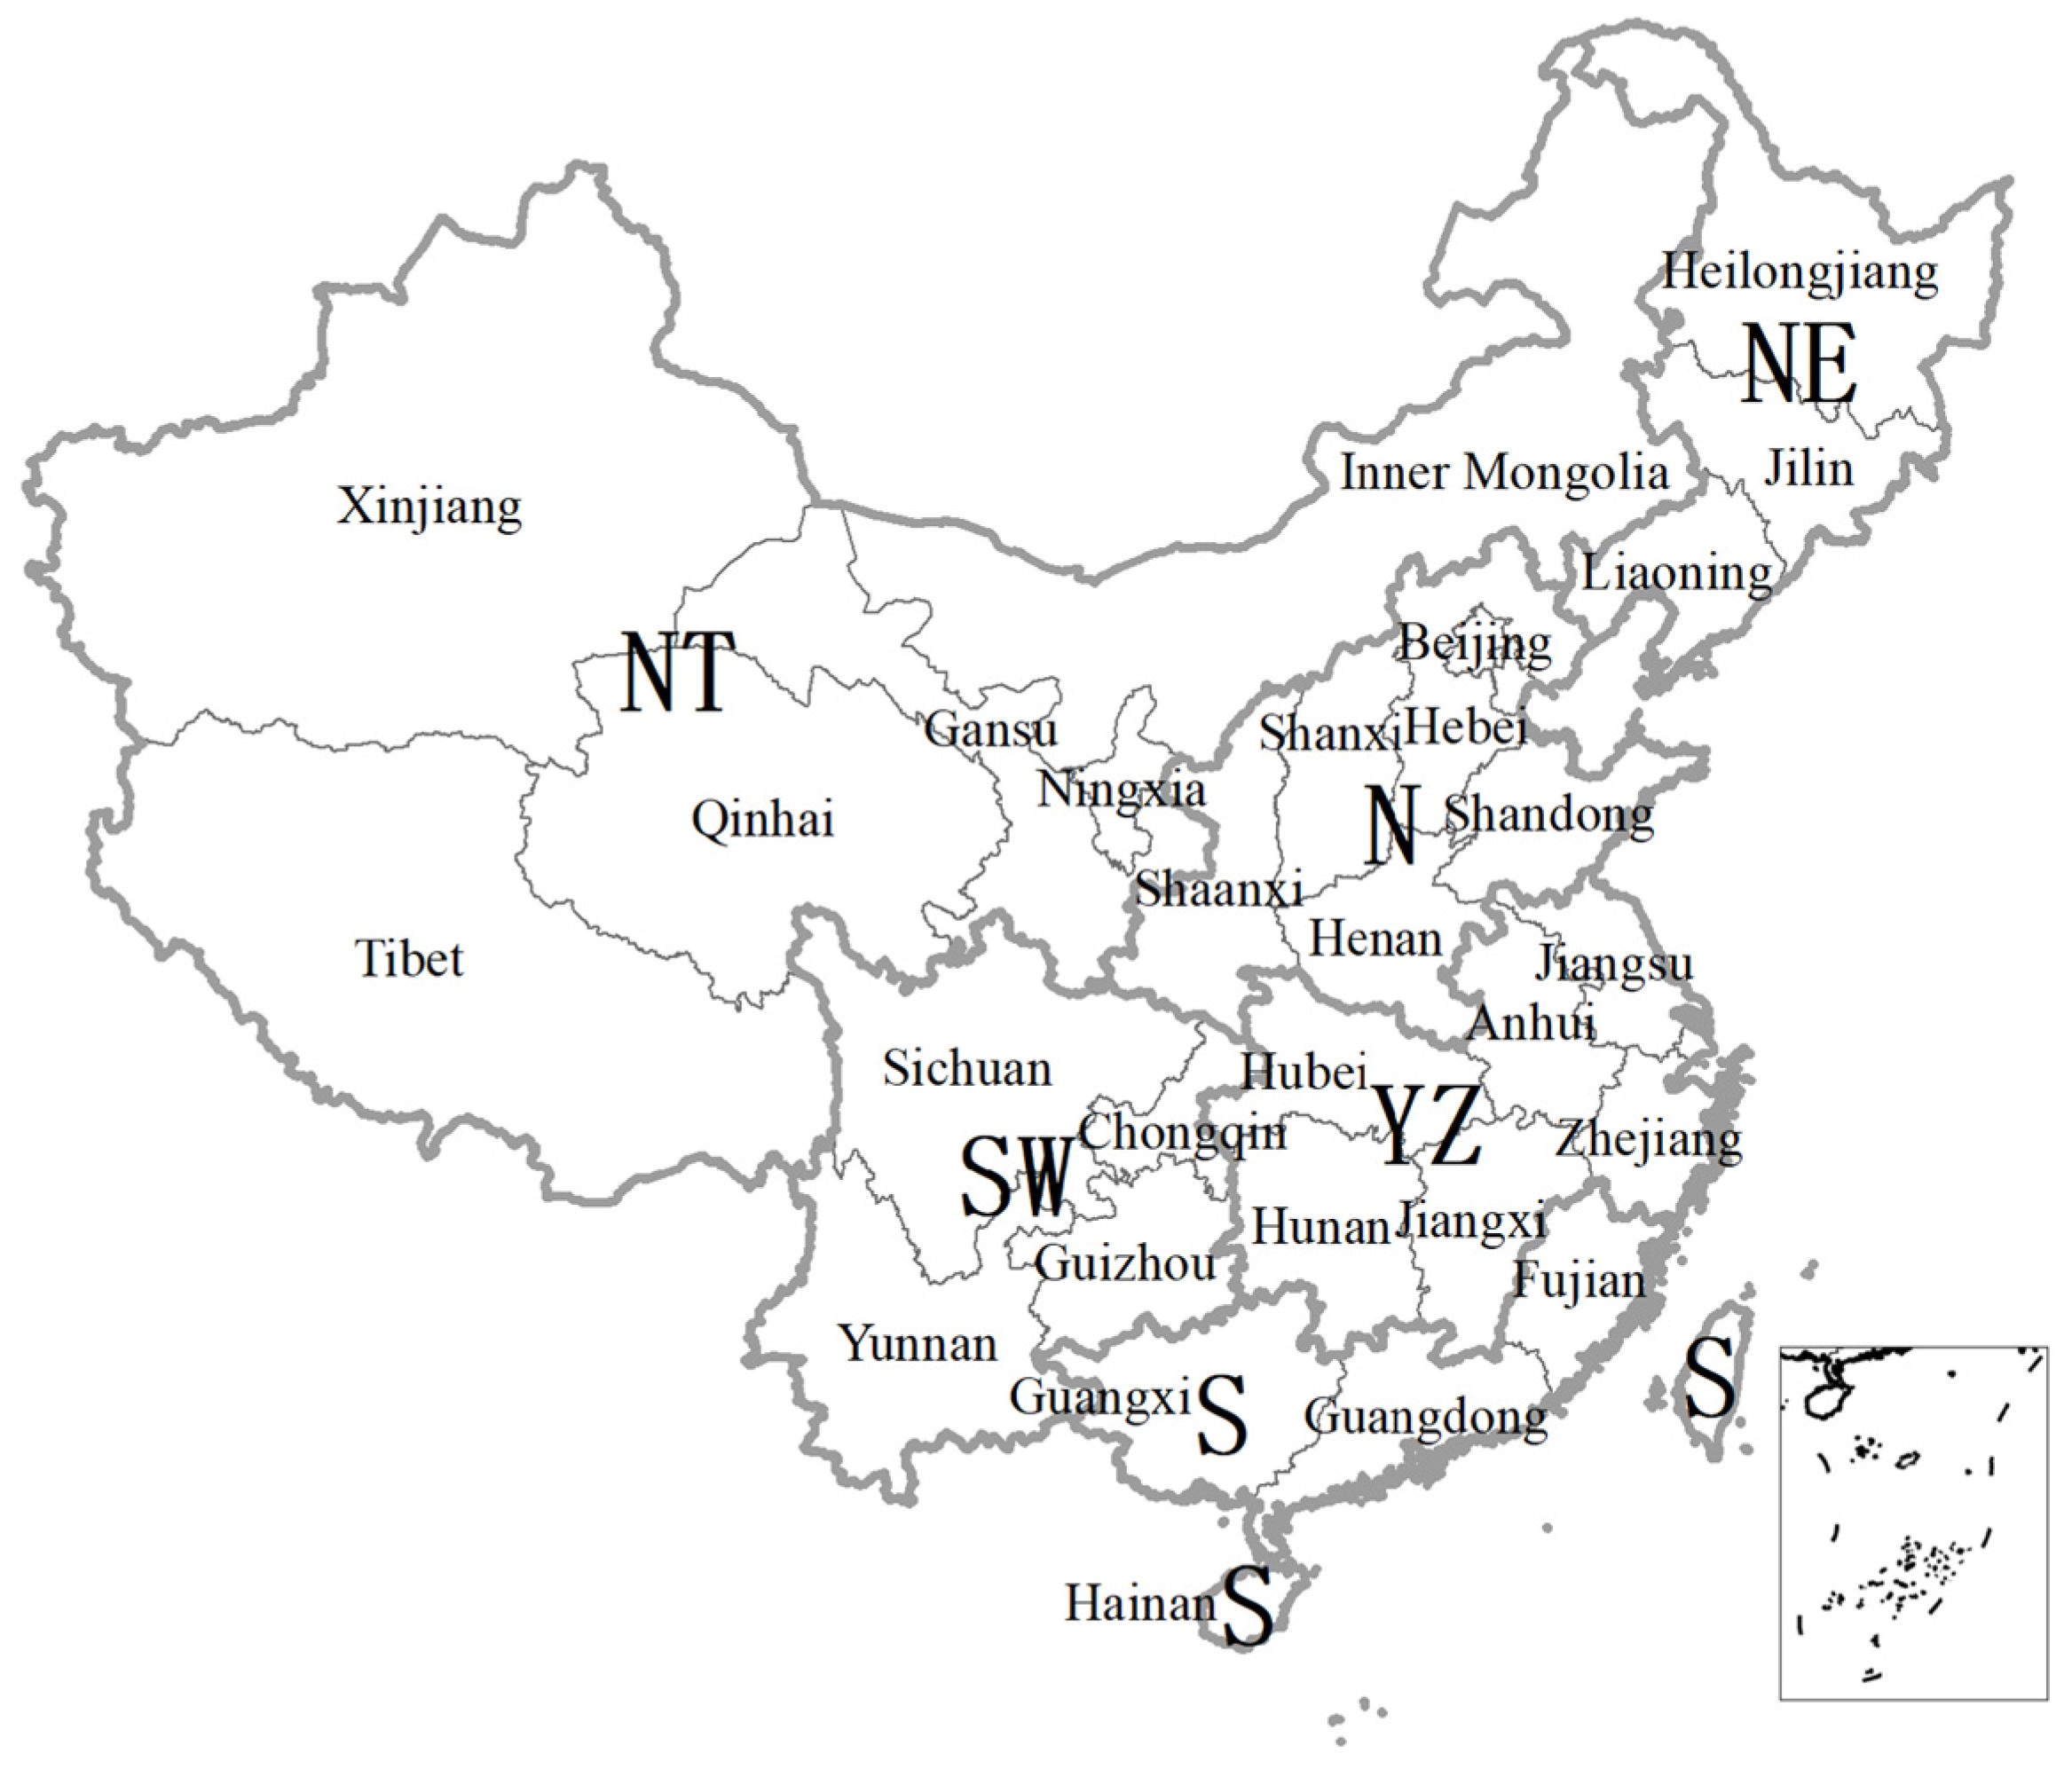
In this study, the research area focused on China. Figure 2 represents the research area map of the study. China’s climate ranges from tropical in the south to subtropical monsoon in the north and subarctic in the far north. The precipitation in China is mainly affected by subtropical monsoons and typhoons, showing significant spatial differences and seasonal trends. The precipitation zone decreases from southeast to northwest, and the precipitation from June to September can account for more than 80% of the annual precipitation. This geographic and climatic diversity significantly affects agricultural practices and the assessment of drought conditions. Specifically, the long-term climatic variability plays a crucial role in the water availability for agriculture, influencing both seasonal and annual water deficits across different regions. According to reports from the Intergovernmental Panel on Climate Change (IPCC), China’s climate has been subject to considerable fluctuations over decades, including variations in precipitation patterns, temperature regimes, and extreme weather events (www.ipcc.ch, accessed on 12 June 2024). Over the past few decades, China has experienced a significant increase in average temperatures, particularly in the northern regions. Precipitation patterns in China have also undergone changes, with significant regional variations, and there has been an increase in precipitation in the southern regions, while the northern regions have seen a decrease. Extreme weather events in China have become more frequent and intense. This includes more frequent heatwaves, severe droughts, and intensified precipitation events. For example, the city of Zhengzhou experienced the strongest precipitation and flooding event in nearly 50 years in 2021, and the Yangtze River basin experienced the severest drought event on historical record in 2022, both emphasizing the importance of flood and drought research in China.
Based on the geographical and climatic characteristics of different regions, we have divided China into six major crop regions, as shown in Figure 2. Compared to the previous zoning map, the new zoning map now categorizes the north region into the northeastern and northern regions, while the south region is divided into the southwestern, Yangtze River basin, and southern regions. Note that, in this study, the Yangtze River basin specifically refers to the middle and lower reaches of the Yangtze River basin. The Qinghai−Tibet Plateau and northwest regions have been merged into the northwest region. This zoning rationale is due to the fact that the food production in the northwest region accounts for only 3% of the national total, thus it will not be analyzed separately in subsequent studies. A more detailed division of the south and north regions is beneficial for analyzing and comparing the differences in drought affection on crops across different areas.

3. Methods

3.1. Extended Triple Collocation

The ETC analysis method represents an extension of the Triple Collocation (TC) technique. Initially introduced by Stoffelen [40], the TC method serves to calibrate microwave scatterometer measurements of ocean winds and to subsequently estimate errors. Presently, it finds widespread application in the realm of error variance estimation for remote sensing products, notably in the domain of remote sensing soil moisture assessments. Moreover, the work of Crow et al. [25] illuminates that the validation of grid-scale remote sensing products against point-scale station measurements, grounded in the TC method, can effectively mitigate spatial representativeness errors arising from disparate scales. This, in turn, facilitates a more precise inference of the data precision and error characteristics inherent in remote sensing products. In the TC method, three sets of research objects necessitate consistent and mutually independent data. In the validation of remote sensing soil moisture, these sets typically encompass station observation data, remote sensing retrieval data, and model simulation data. Additionally, considering the dual nature of microwave remote sensing products (active and passive data), the TC combinations can extend to active remote sensing data, passive remote sensing data, and model simulation data for large-scale grids.
The subsequent discussion briefly delineates the conceptual framework of the TC method. Firstly, it defines the true value of soil moisture at a specific grid and time as θ , with the observed soil moisture at a station, remote sensing retrieval soil moisture, and model simulation soil moisture being denoted as θ 1 , θ 2 and θ 3 respectively. Assuming linear relationships between θ and θ 1 , θ 2 and θ 3 , the ensuing relationships can be derived:
θ 1 = β 1 + α 1 θ + ε 1 θ 2 = β 2 + α 2 θ + ε 2 θ 3 = β 3 + α 3 θ + ε 3
In the presented equation, β 1 , β 2 and β 3 denote error bias terms, while α 1 , α 2 and α 3 represent scale coefficient terms and ε 1 , ε 2 and ε 3 represents signify unbiased random error terms. Simultaneously eliminating in Equation (1) yields the subsequent formula:
σ ε 1 * 2 = θ 1 * θ 2 * θ 1 * θ 3 * σ ε 2 * 2 = θ 2 * θ 1 * θ 2 * θ 3 * σ ε 3 * 2 = θ 3 * θ 1 * θ 3 * θ 2 *
where σ ε i * 2 corresponds to the error variance of data product i, θ i * is the time series value scaled with respect to the reference data, and 〈 〉 signifies the mean calculation.
Within the framework of TC, the estimation of error variance for remote sensing products can be achieved. Expanding upon the TC theoretical framework, McColl [26] introduced the ETC method, which facilitates the determination of correlation coefficients for remote sensing products based on the foundational error variance. Analogous to the TC method, the ETC method necessitates three sets of datasets with consistent and mutually independent observation methods. It assumes a linear relationship between each dataset and the unknown true value (in this study, representing the grid soil moisture content). The correlation coefficient R i between dataset i and the true value is obtained using the following formula:
R i = σ i , j σ i , k σ i 2 σ j , k
Here, i, j, and k denote the three sets of dataset products, representing station-observed soil moisture data, satellite remote sensing soil moisture products, and model-simulated soil moisture data in this study, respectively. σ i , j represents the covariance between dataset i and dataset j, and σ i 2 represents the error variance of dataset i. It is noteworthy that, based on the ETC method, the error variance estimation in Equation (2) can also be obtained, as demonstrated in the subsequent equation:
σ ε i 2 = σ i 2 σ i , j σ i , k σ j , k
Here, σ i , j signifies the covariance between dataset i and dataset j and σ i 2 denotes the error variance of dataset i.

3.2. Pedotransfer Functions

Pedotransfer functions are empirical relationships that are used to estimate various soil properties, including soil moisture characteristics, based on more readily available soil information. The wilting point is a critical parameter in understanding soil water retention characteristics. Using PTFs to estimate the wilting point involves incorporating soil-related input variables into established equations or models. The specific form of the PTF will depend on the soil properties available for estimation. One common approach is to use PTFs that relate soil texture or composition to soil water-retention parameters. Soil texture and soil properties, typically characterized by the percentages of sand, silt, clay, bulk density and soil organic matter, influence how water is held in the soil [28].
Numerous PTFs have been developed to estimate the wilting point by leveraging soil texture information. It is crucial to note that the accuracy of PTFs is contingent upon the dataset from which they were derived and the similarity of soil conditions in the study area to those encapsulated in the dataset. Users should be cautious and consider the limitations and uncertainties associated with PTFs when applying them in different regions. Wu et al. [30] validated several existing PTFs for estimating FC in China based on in situ FC. The results indicate significant differences in accuracy among different PTFs, highlighting the necessity of considering multiple PTFs to reduce the uncertainty associated with using a single PTF. As mentioned in Section 2.4, we have developed a dataset of field capacity based on in situ field capacity observations and soil datasets. However, the same strategy does not apply to WP estimates due to the lack of in situ observation wp data. Consequently, in this study, 7 validated and dependable soil transfer functions are chosen to compute corresponding wilting coefficients based on the SoilGrids dataset for each region. For each grid, the median value of these 13 sets of wilting points is selected as the representative wilting point. Subsequently, the wilting point distribution for the entirety of China is formulated. The 7 PTFs employed in this study are enumerated as follows [41,42,43,44,45,46,47]:
WP = 0.024 × Clay + 0.487 × Silt + 0.006 × Sand + 0.005 × SOM 0.013 × BD 0.012
WP = 0.78 0.0067 × Clay + 0.0041 × Silt
WP = 0.61 0.006 × Clay + 0.012 × Silt 0.010 × SOM
WP = 0.56 0.006 × Clay + 0.01 × Silt + 0.04 × SOM
WP = 0.79 0.006 × Clay + 0.007 × Silt 0.009 × SOM
WP = 0.075 0.142 × Clay + 0.053 × Silt + 0.004 × SOM
WP = 0.03 + 0.066 × Clay + 0.03 × Silt
where Clay, Silt, and Sand are the percentages of clay, silt, and sand in the soil, SOM is the soil organic matter, and BD is the bulk density of the soil.
We adopted for PTFs due to several reasons which we believe enhance the applicability and accuracy of our results. First, PTFs allow for the incorporation of specific soil properties (e.g., texture, soil organic matter content, bulk density) which can vary significantly across different regions. PTFs utilize this information to provide more precise estimations of FC and WP. This adaptability is crucial when working with diverse geographical areas where soil characteristics may not align with the generalized assumptions underlying the percentile method [48]. Second, employing PTFs can be more scalable and less data-intensive in terms of long-term historical moisture records. This is particularly advantageous over the percentile method, which primarily depends on historical soil moisture records that may not adequately reflect current soil conditions. In addition, the availability of reliable soil data sources, such as SoilGrids, further supports our decision to utilize PTFs for calculating FC and WP.

3.3. Soil Water Deficit Index

The SWDI is a metric proposed by Martínez-Fernández et al. [13] to gauge soil moisture deficit levels, crucial for understanding agricultural water management and drought monitoring. The SWDI considers both the soil moisture dynamic and soil water retention characteristics in different regions. The index exhibits noteworthy spatiotemporal continuity and spatial comparability, rendering it well suited for precisely capturing disparities in agricultural droughts. It boasts several advantages, including clear physical significance, straightforward data requirements, and accurate identification and quantification of drought events. The SWDI is explicitly defined as follows:
SWDI = θ 0.8 × θ F C θ F C θ W P × 10
Here, θ represents the soil moisture of the grid based on ETC-based data merging before, θ F C represents the field capacity of the grid based on the Wu et al. [30] study, and θ W P represents the wilting point of the grid based on the median of 7 PTFs. All these values are expressed in volumetric soil moisture content. An area is considered to be undergoing a drought when the soil moisture content falls below 80% of the field capacity. The rationale for adopting 0.8 × FC as the threshold is supported by several studies which have investigated the physiological responses of plants to varying soil moisture levels. For instance, Pan et al. [49] identified that the normal level of SM for sustaining optimal physiological activity in six plant species was above 0.8 × FC. Similarly, Wu et al. [50] demonstrated that the photosynthetic activity of selected tree species achieved optimal levels at soil moisture levels at or above 0.8 × FC. Furthermore, we have conducted some experimental trials across several typical drought events. The findings suggested that using FC as the drought threshold consistently led to an overestimation of drought frequency. By recalibrating the threshold to 0.8 × FC, the index became more aligned with actual conditions that stress plant physiological mechanisms, thereby providing a more accurate and ecologically valid indicator of drought onset.

3.4. Other Drought Indexes

3.4.1. SMI

The Soil Moisture Index (SMI) serves as an indicator of soil drought, directly reflecting the availability of water for crops and, consequently, agricultural drought conditions [51]. The calculation formula for SMI is the percentage value of soil moisture content compared to the field water holding capacity. A higher SMI indicates better soil moisture conditions for crop growth, implying higher relative soil moisture levels. Conversely, a lower SMI suggests poorer soil moisture conditions for crop growth, indicating drier soil conditions. The calculation formula for SMI is as follows:
SMI = θ θ F C × 100 %
Here, θ and θ F C represent the numerical values of soil moisture and the corresponding field capacity of the corresponding grid.

3.4.2. SMAPI

The SMAPI represents the difference between actual soil moisture and the long-term average soil moisture for the same period, expressed as a percentage of the long-term average soil moisture [52]. In this context, the long-term average soil moisture for a specific period in a region is considered to be the climatologically suitable soil moisture value for that period. When the actual moisture content is less than the long-term average, a deficit in soil moisture is identified, indicating the occurrence of a drought. This index reflects the degree to which soil moisture deviates from normal conditions and serves as a relative drought index. The calculation method is as follows:
SMAPI = θ θ ¯ θ ¯
Here, θ represents the current soil moisture content in the grid and θ ¯ represents the long-term average soil moisture content for the corresponding period, i.e., the climatological mean.

3.4.3. AWD

To assess the reliability of the SWDI drought index, the AWD is commonly used for verification [14]. The AWD is defined as the difference between the total precipitation and total evapotranspiration over a 7-day period in a grid. The calculation is as follows:
AWD = P E T
Here, P and E T represent the cumulative precipitation and evapotranspiration with a 7-day window, respectively. Precipitation and evapotranspiration are obtained through ERA5 and GLDAS, respectively.

3.4.4. SPI

The Standardized Precipitation Index (SPI) is a widely used drought index based on precipitation, calculating precipitation deficits at different time scales [53]. It is based on the cumulative probability of precipitation at a specific station or grid and is one of the most commonly used drought indices in meteorological drought assessment. Research suggests that the Gamma distribution effectively fits climatic precipitation time series. Assuming that the total precipitation for a given time scale is x, its probability density function follows the Gamma distribution:
f ( x ) = 1 Γ ( α ) β α x α 1 e x / β
Here, α and β are the shape and scale parameters, respectively. To calculate SPI for a given station, fitting a probability density function of the Gamma distribution is necessary. The parameters α and β of the Gamma distribution function need to be estimated separately for different stations, time scales (e.g., 1, 2, 3…12 months), and each month of the year using maximum likelihood estimations. Since the Gamma function does not include cases where precipitation is zero, the cumulative probability at a given time scale when actual precipitation is zero is calculated as:
H ( x ) = u + ( 1 u ) G ( x )
here, G ( x ) = 0 x g ( x ) d x , u is the probability of no precipitation. After converting H ( x ) to the standard normal distribution function, it is able to yield the SPI calculation formula.

3.4.5. Categories of Each Drought Index

Depending on the severity of the drought, the drought intensity categories can be classified into no drought, light drought, moderate drought, severe drought, and extreme drought. The thresholds of each index according to their categories are shown in Table 1.

3.5. Validation Metrics

3.5.1. Correlation Coefficient

The correlation coefficient is a statistical measure that describes the strength and direction of a relationship between two variables. It quantifies the degree to which changes in one variable are associated with changes in another variable. The correlation coefficient, often denoted by the symbol R, ranges between −1 and 1. A negative correlation coefficient indicates a negative correlation, meaning that, as one variable increases, the other variable decreases in a linear fashion. The closer the absolute value of the correlation coefficient is to 1, the stronger the relationship between the variables. The definition of the correlation coefficient is given as follows:
R ( x , y ) = C o v ( x , y ) V a r [ x ] × V a r [ y ]
Here, R ( x , y ) represents the correlation coefficient between variables x and y, C o v ( x , y ) represents the covariance between variables x and y, and V a r [ x ] and V a r [ y ] represent the variance of variable x and variable y.

3.5.2. Probability of Detection

The probability of detection (POD) is defined as the likelihood of correctly identifying or detecting a target or event of interest within a given system or process [54]. It is commonly used in hydrology, meteorology, and other fields, including assessing the effectiveness or reliability of detecting elements such as precipitation, floods, and droughts. The POD can be expressed as:
POD = A A + B
where A represents instances of actual observed drought with corresponding detections by drought index and B represents cases of actual observed drought without corresponding detections by drought index, it can be noted that the POD is defined within the range of 0 to 1. A higher POD value, approaching 1, indicates a greater accuracy in drought monitoring. Specifically, POD is calculated as the ratio of true positive detections A to the sum of true positives and false negatives B. This metric serves as an indicator of the precision of drought monitoring, with values closer to 1 reflecting a higher level of accuracy.

3.5.3. Matching Index

The Matching Index (MI) is a metric used in this study to assess the accuracy of quantitative identification of different drought intensity categories. The index is defined as follows:
MI = 1 N i = 1 k n ( F i O i )
where N represents the total number of shared forecast and observed droughts, n ( F i O i ) represents the number of shared forecast and observed droughts that are both depicted in intensity category i, and k denotes the number of drought intensity categories. In this specific context, the study considers the following four categories of drought: mild, moderate, severe, and extreme. MI ranges from 0 to 1, with a higher value indicating greater consistency between the identified drought intensity category in monitoring and the actual observed drought. The POD emphasizes the overall accuracy in detecting the presence of a target drought event, while the MI specifically evaluates the accuracy in categorizing the identified drought intensity.

3.6. Data Processing Method

To ensure the consistency and homogeneity of soil moisture data from varied sources, several measures have been implemented in our study. Given the limited depth of soil moisture retrievals from remote sensing, we standardized the soil moisture measurements to the topmost layer of 0–10 cm from both the VIC model and ground observation stations. This adjustment aligns the data by focusing on a comparable soil layer, thereby reducing any variability introduced by depth differences. Additionally, all soil moisture values were converted to volumetric water content to maintain a uniform unit of measurement across different data sets. The period for data merging was set from 1992 to 2018, corresponding to the availability of the CCIA and CCIP soil moisture data. Furthermore, during the merging process of soil moisture data from the CCI and VIC model, we employed CDF to match the range of variations in remote sensing soil moisture to that of the model-derived soil moisture. This step was critical in ensuring that the merged soil moisture dataset maintained a consistent climatic background. By rescaling the remote sensing observations to align within the same statistical distribution as the model data, we enhanced the homogeneity of the datasets. This technique ensures that soil moisture data from different sources are not only aligned in terms of absolute values but also reflect similar variability patterns, thereby reinforcing the reliability of our merged dataset in representing the true soil moisture dynamics across different climatic conditions. To minimize the impact of data noise, we employed rigorous quality control measures. For ground-based observations, any soil moisture readings exceeding the field capacity were excluded as outliers. Similarly, remote sensing soil moisture data flagged in metadata as potentially erroneous due to retrieval anomalies were removed.

3.7. Technical Framework for the Drought Index Development and Results Analysis

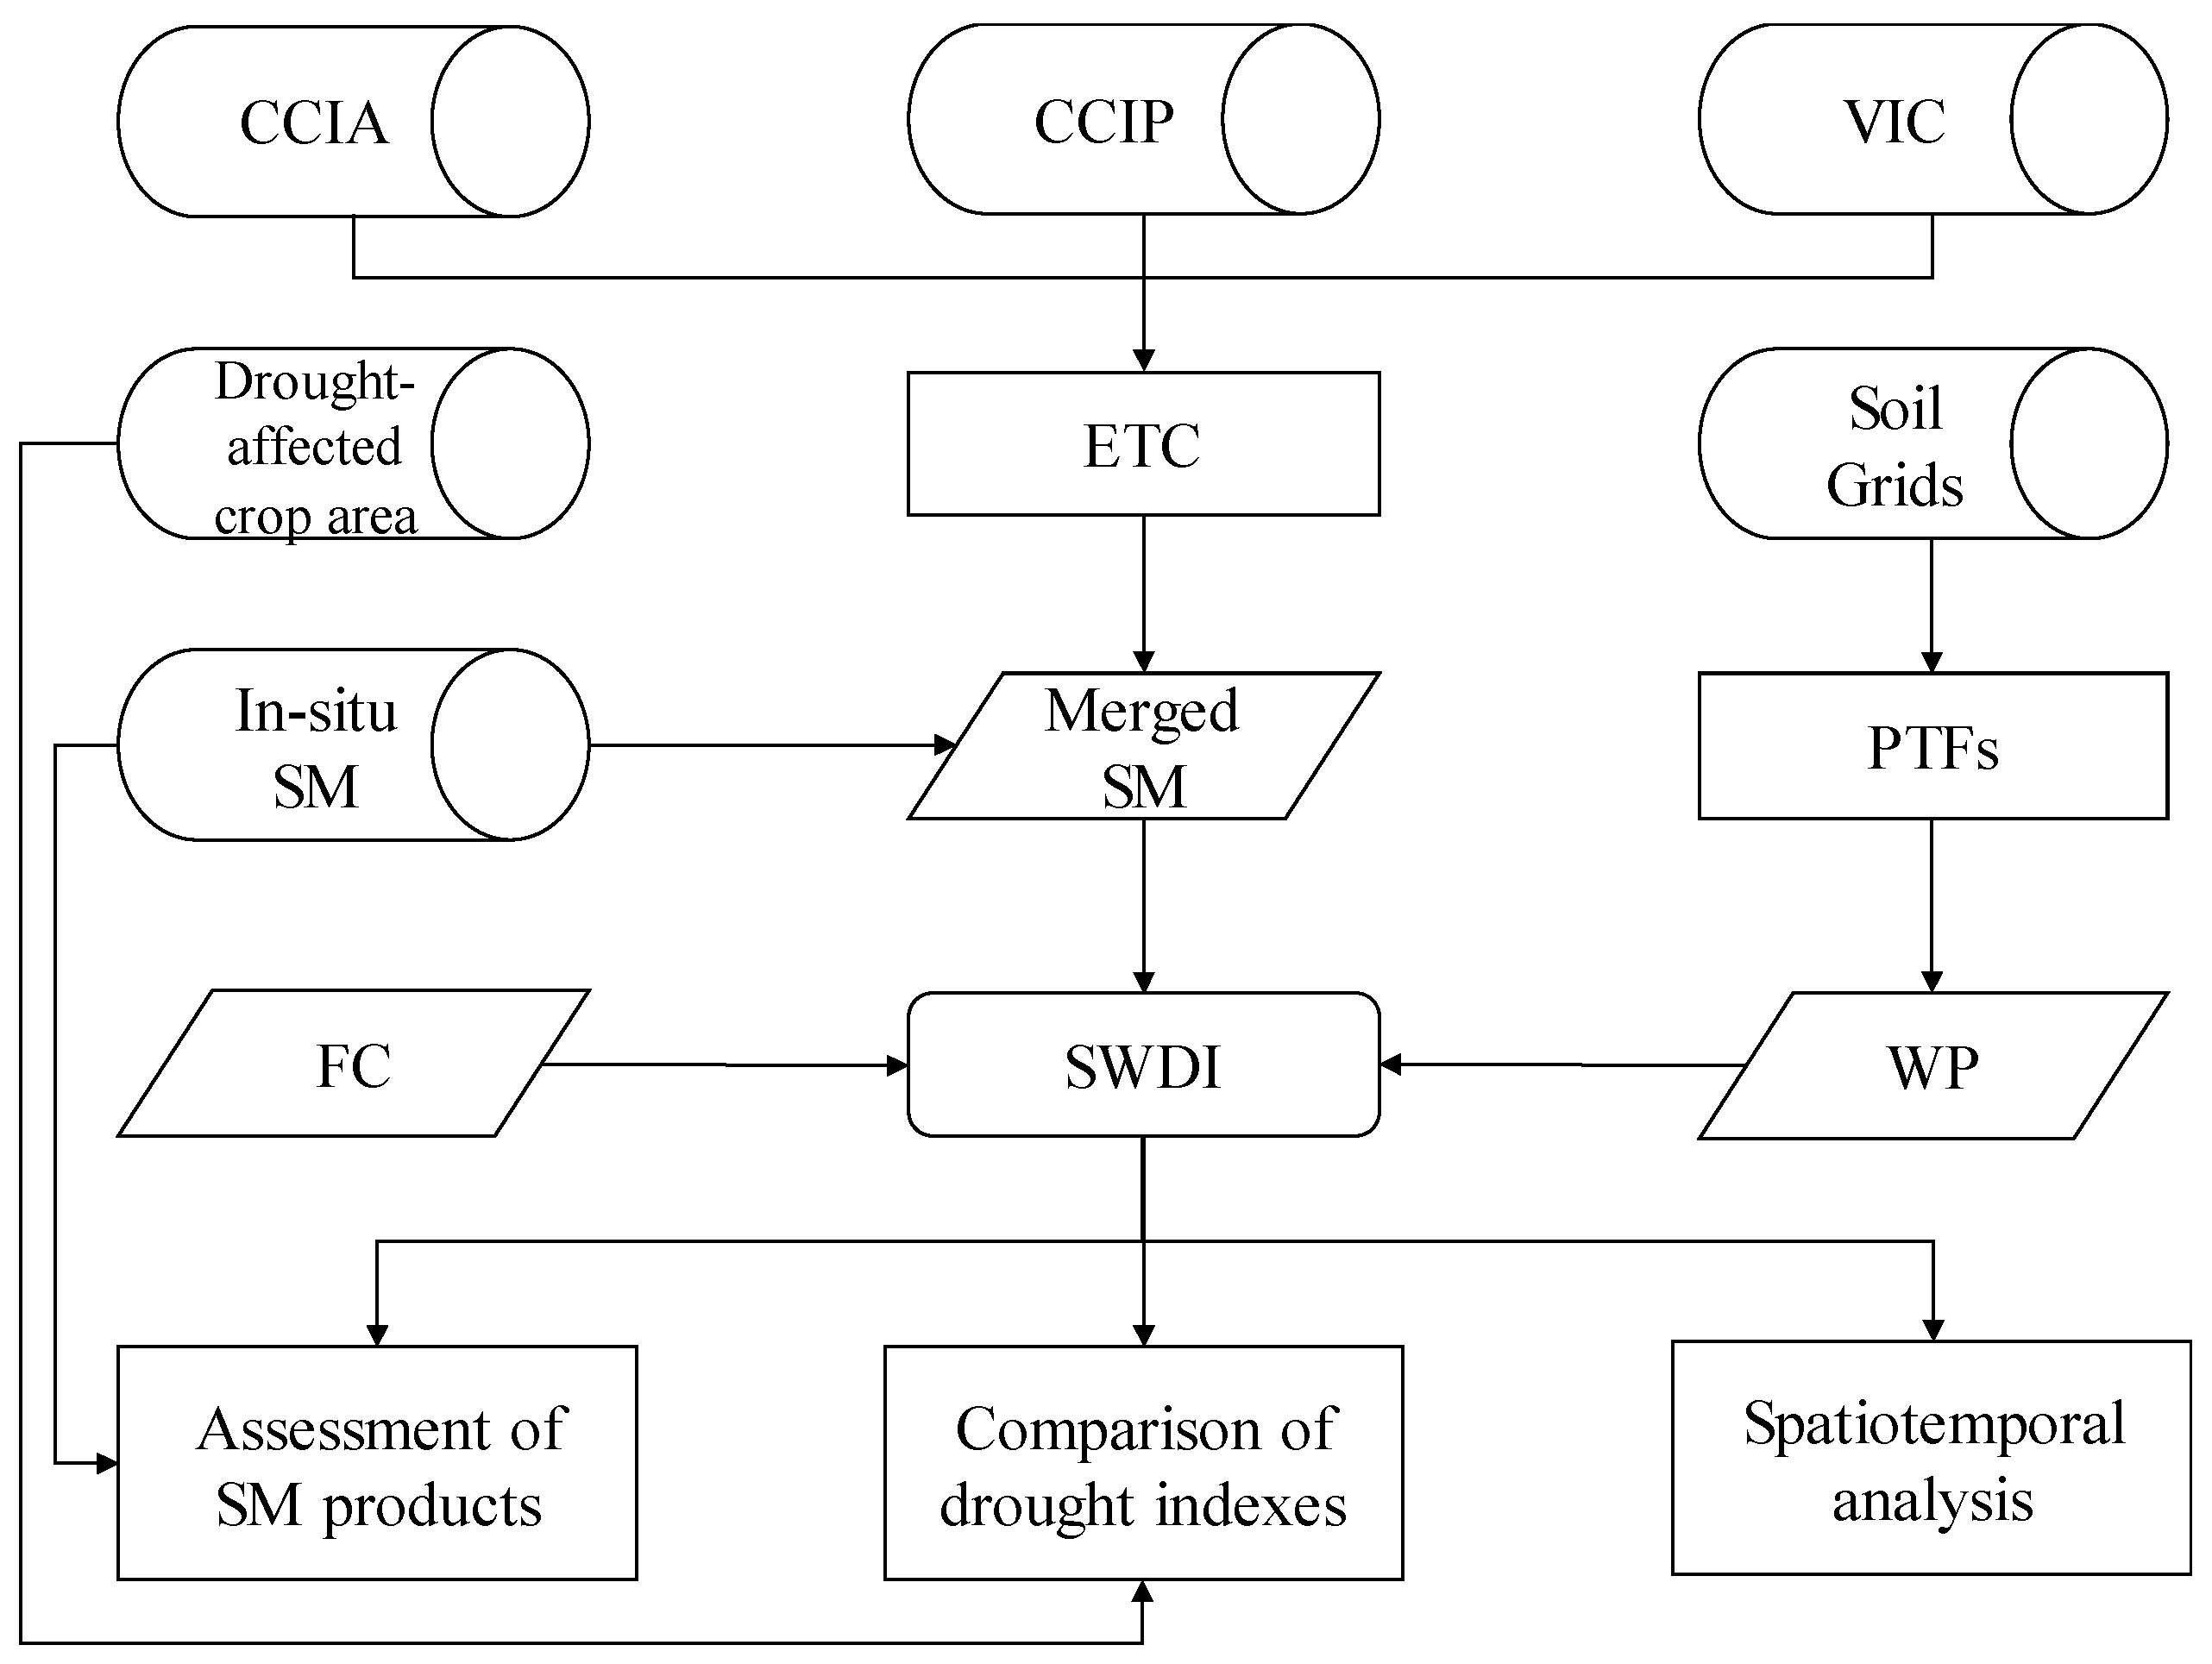
In accordance with the research task, the data, and the methods used in this paper, we designed a technical framework for the study, as shown in Figure 3. In general, the technical framework can be divided into two parts: drought index development and results analysis. The cylindrical representation in the paper encompasses datasets, including CCIA, CCIP, and VIC soil moisture, as well as drought-affected crop areas, in situ measurements, and soil properties. The central methodological approach of the study involves the development of the SWDI through the merged soil moisture, field capacity, and wilting point. Leveraging the constructed SWDI index, the paper proceeds with assessment of the soil moisture product, a drought index comparative analysis, and a spatiotemporal analysis of droughts.

4. Results and Discussion

4.1. ETC-Based Soil Moisture Data Merging and Validation

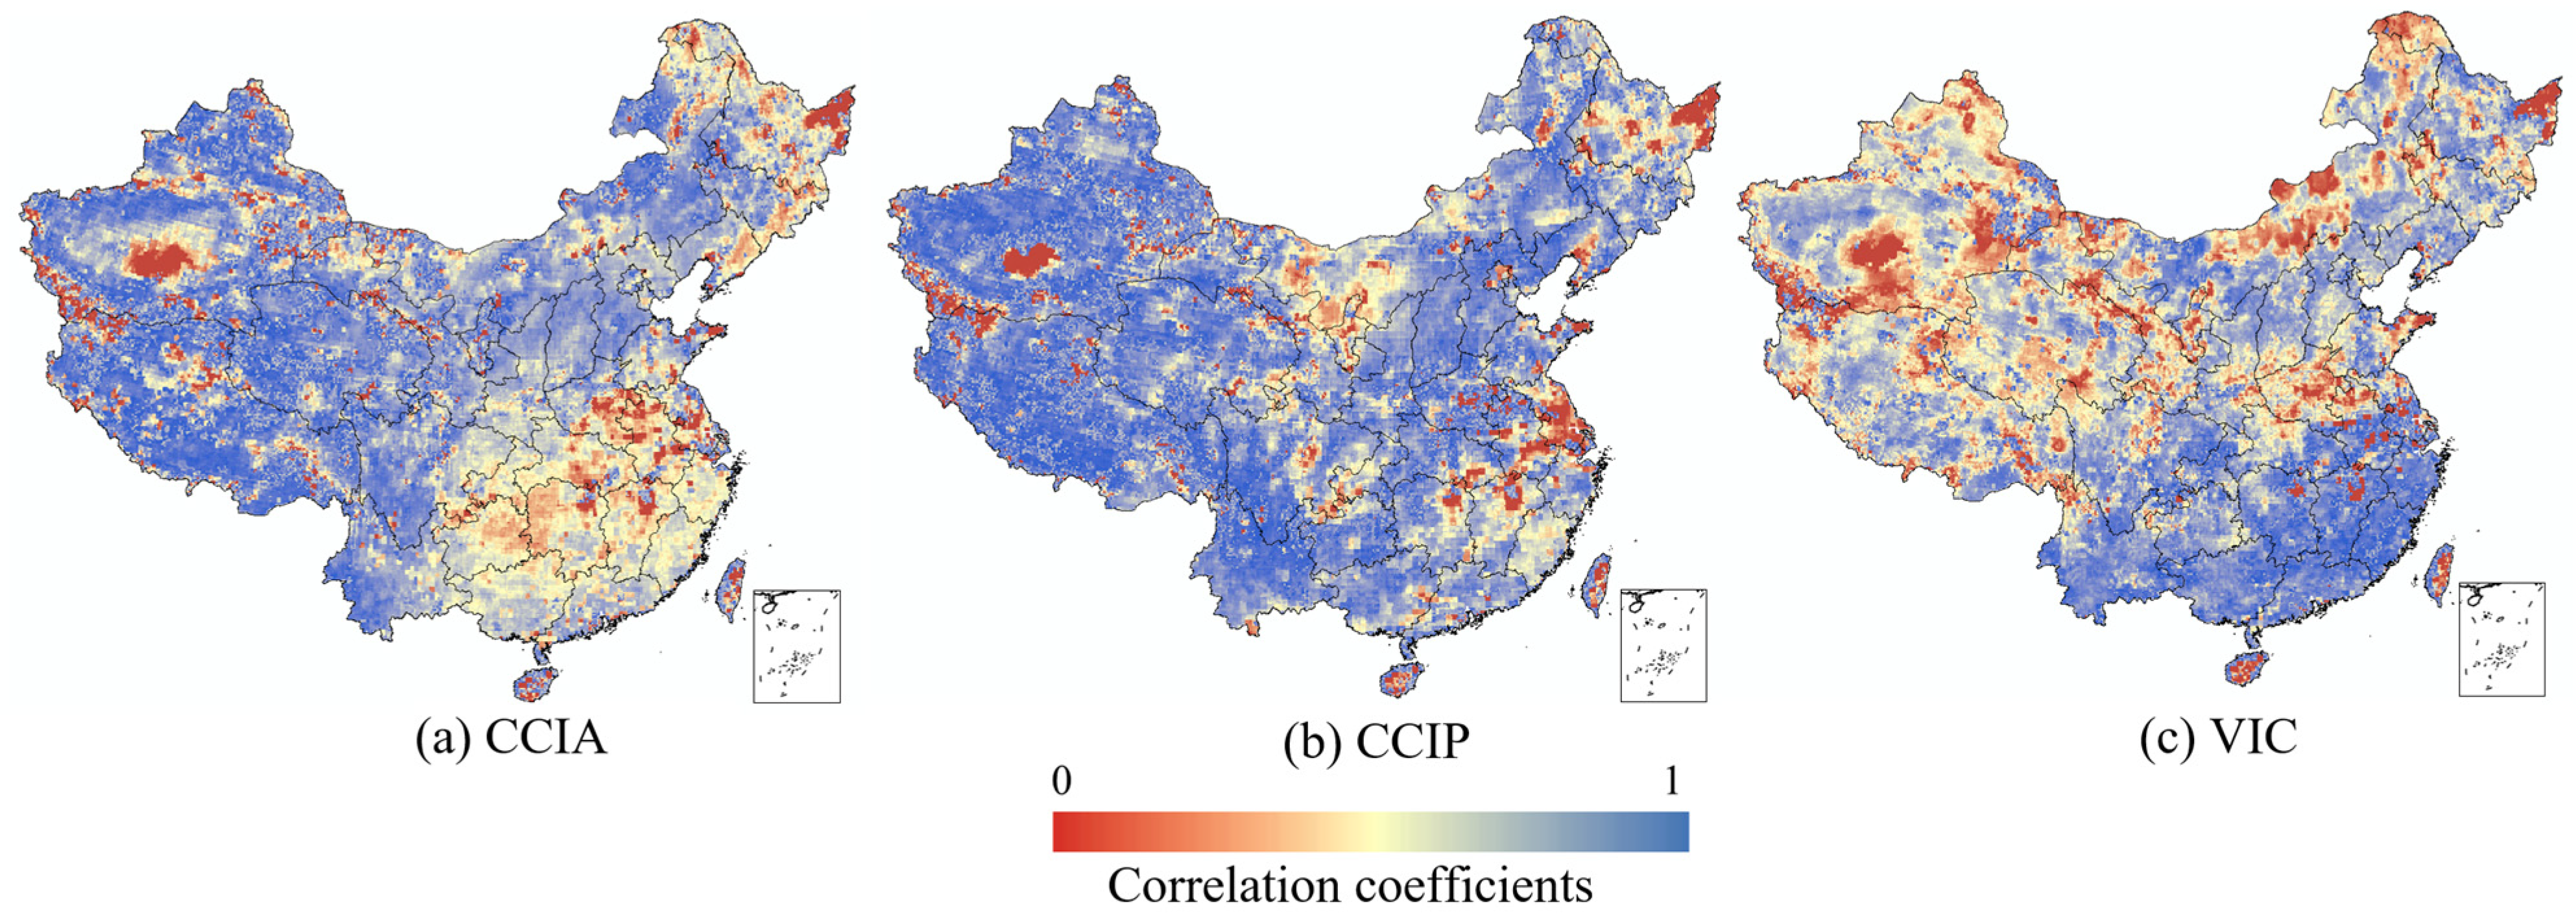
The spatial distribution maps of correlation coefficients for the CCIA, CCIP, and VIC soil moisture products based on ETC are shown in Figure 4. These coefficients reflect the correlation between the soil moisture of a given product and the unknown true soil moisture values at grid locations. The results reveal notable regional variations in the overall distribution of correlation coefficients among the three products. The CCIA product exhibits higher correlation coefficients in the Qinghai−Tibet Plateau and the northwest regions (including Xinjiang, Inner Mongolia, Gansu, Ningxia, etc.), while lower coefficients are observed in the areas south of the Heilongjiang and Yangtze River basin. The CCIP product has the highest overall correlation coefficients among the three, with relatively lower coefficients in provinces such as Ningxia, Heilongjiang, Jiangsu, Anhui, Fujian, Jiangxi, etc. In terms of the VIC product, its accuracy is notably higher in southern regions compared to northern areas. Specifically, in the Qinghai−Tibet Plateau and the northwest regions, the accuracy of the VIC product is lower than that of the CCIA and CCIP. However, in southern regions, the VIC product demonstrates higher accuracy than the CCIA and CCIP.
There are various methods to determine the weight of data merging, such as correlation coefficients, the coefficient of determination, and signal-to-noise ratio (SNR). In this paper, we select the correlation coefficient (R) obtained from ETC as the weight of data merging. The formula for obtaining the weight is illustrated as follows:
w i = R i R i
where R i and w i represents the correlation coefficient and corresponding weight of each soil moisture product in ETC-based merging. The spatial distribution map of merging weight based on the ETC of the CCIA, CCIP, and VIC products is depicted in Figure 5, reflecting the relative accuracy of the three products in different regions. The results indicate that, in southern regions, the VIC has the highest weight, ranging from 0.5 to 0.8, while the CCIA exhibits the lowest weight, with values less than 0.2. In northern regions, the merging weight for the CCIA, CCIP, and VIC products are relatively similar, with values of around 0.33. However, the merging weight for the VIC is notably lower than that for CCIA and CCIP products in the northwest regions and the Qinghai−Tibet Plateau, particularly in certain areas of Xinjiang, which indicates a low robustness for the VIC model in these regions.
To validate the accuracy of the merged soil moisture, we compared the VIC, the CCI, and the merged soil moisture product with in situ measured soil moisture. The correlation coefficients between each three sets of product and in situ measurements were calculated for all sites from 2008 to 2018. The spatial distribution of in situ measurement sites is shown in Figure 1. The correlation coefficients used in this section for validation were directly calculated using different soil moisture products and an in situ measured soil moisture combination. The difference in correlation coefficients between the merged products and the in situ soil moisture compared to the correlation coefficients between (a) the VIC products, (b) CCI products, and in situ soil moisture is shown in Figure 6, where the x-axis represents the improved correlation coefficients and the y-axis represents the number of sites. The results indicate that the merged product showed an average increase in correlation coefficient of 0.18 compared to the CCI product. Specifically, there was a slight decrease in the correlation coefficient with the merged product compared to the CCI product for 15% of the sites. The remaining 85% of sites of merged products had better correlation coefficient performances compared to the CCI product. The majority of the improvement in correlation coefficients with the merged product was concentrated between 0.15 and 0.2, with 15% of the sites showing an increase in the correlation coefficient of 0.30 or higher. Compared to the VIC product, the results indicate that the merged product exhibits an average increase in soil moisture accuracy of 0.09 in the correlation coefficient. For the majority of sites, the increase in correlation coefficient ranges between 0.05 and 0.15. Over 70% of the sites show an improvement in correlation coefficient with the merged product compared to the VIC product, with 10% of the sites showing an increase in correlation coefficient of 0.30 or higher.
The percentage improvement in accuracy by merged products compared to the (a) VIC and (b) CCI using the correlation coefficient as a metric is illustrated in Figure 7. The results indicate that the merged product demonstrates a 28% improvement in accuracy compared to the CCI product on average. For the majority of sites, the merged product exhibits a precision enhancement ranging from 10% to 40% compared to the CCI product. Over 15% of the sites show a precision improvement exceeding 60%, with only a small fraction experiencing a precision decrease of over 10%. Compared with the VIC products, the average accuracy improvement of merged products is 15%. The results indicate that, in over 75% of the sites, the merged product exhibits a precision enhancement compared to the VIC product, with the majority of sites showing a precision enhancement ranging from 10% to 20%. Additionally, over 10% of the sites show a precision enhancement exceeding 60%.
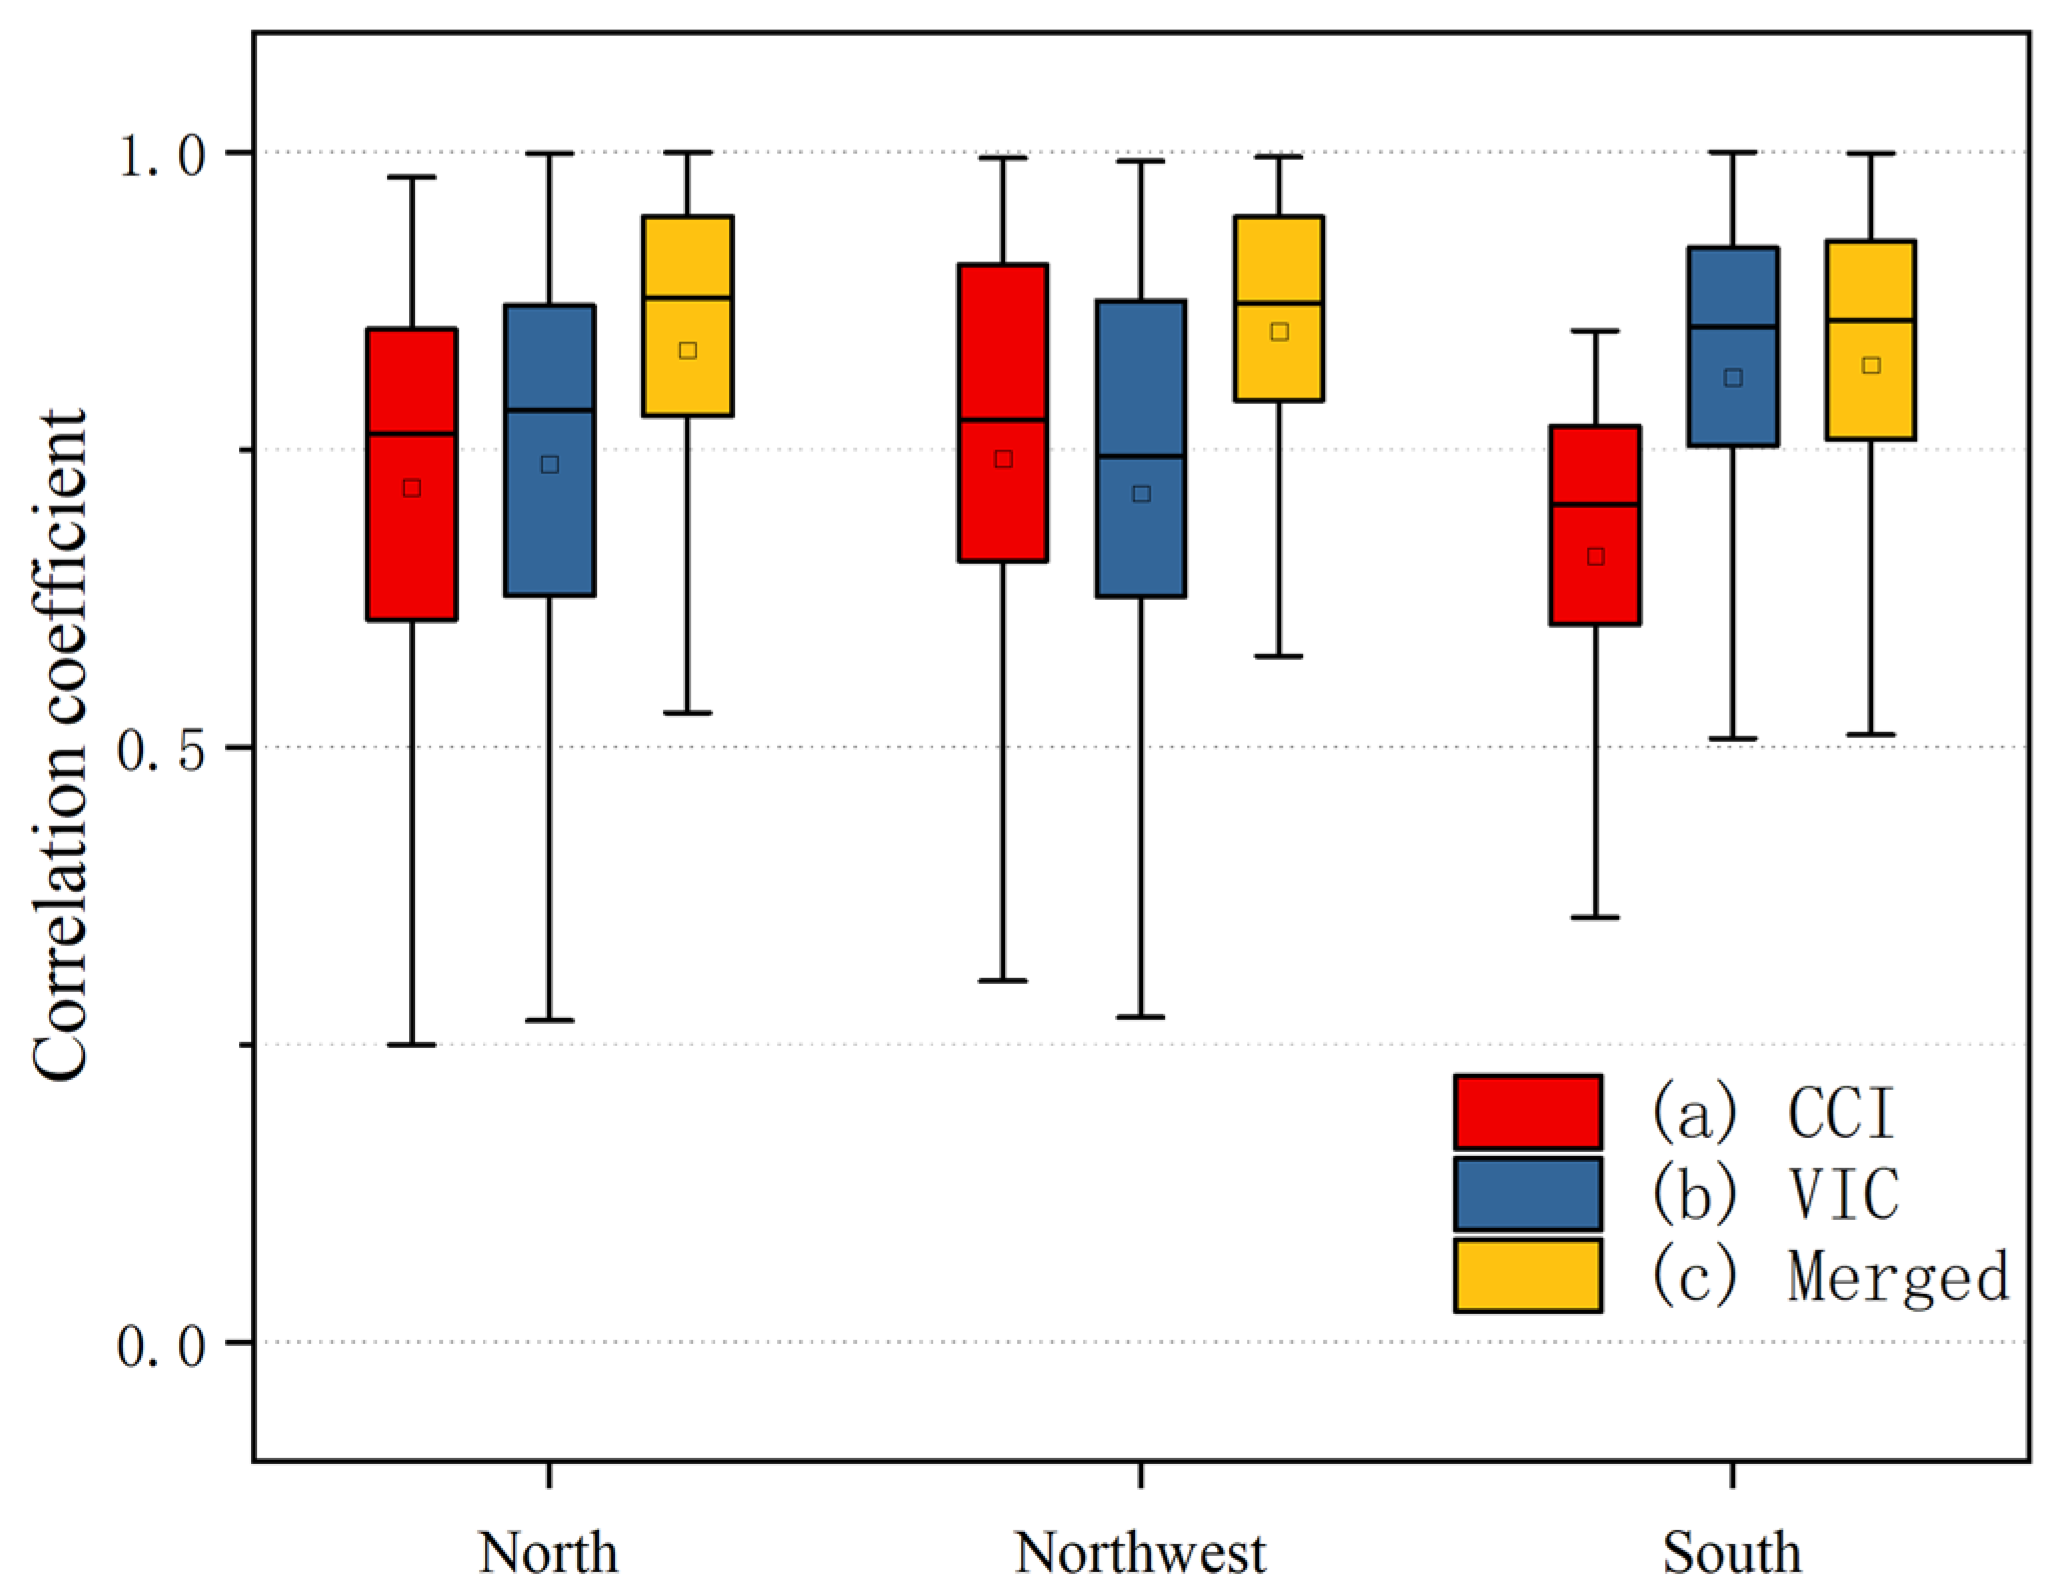
The precision of the merged products is compared to the CCI and VIC products across different regions, and the boxplot of the correlation coefficient between the (a) CCI, (b) VIC, (c) the merged soil moisture, and the in situ soil moisture in the north, northwest and south is shown in Figure 8. It should be notied that the precision comparison in the Qinghai−Tibet Plateau region was not analyzed due to the limited number of observational sites in this area. Overall, the merged product has the highest precision in the northwest, north, and south regions. In the north region, while the precision of the CCI and VIC products is close, the merged product demonstrates a significant improvement. The median correlation coefficients for the CCI, VIC, and merged products are 0.75, 0.78, and 0.88, respectively, indicating a notable enhancement in precision with the merged product in the north region. In the northwest region, the VIC product exhibits the poorest precision, with a median correlation coefficient of only 0.73, followed by the CCI product with a median correlation coefficient of 0.77. Compared to the CCI and VIC products, the merged product shows improvements in correlation coefficients of 0.14 and 0.10, respectively, with a median correlation coefficient reaching 0.87. The precision of the VIC and merged products is similar in the south region, with median correlation coefficients of 0.85 and 0.86, respectively, while the CCI product shows a precision performance at 0.70. Due to the already high precision of the VIC product and its higher merge weight in the south region, along with the insufficient precision and lower merging weight of the CCI product, the precision enhancement of the merged product compared to the CCI product is substantial, but the improvement compared to the VIC product is limited. These results indicate a significant precision enhancement of the merged product compared to the CCI product across all regions. Moreover, compared to the VIC product, the merged product demonstrates substantial precision improvement in the northwest and north regions, where the precision of the VIC product is lower, while maintaining its high-precision characteristics in the south region, where the VIC product performs well.

4.2. Assessment of Various Soil Moisture Products in Drought Monitoring

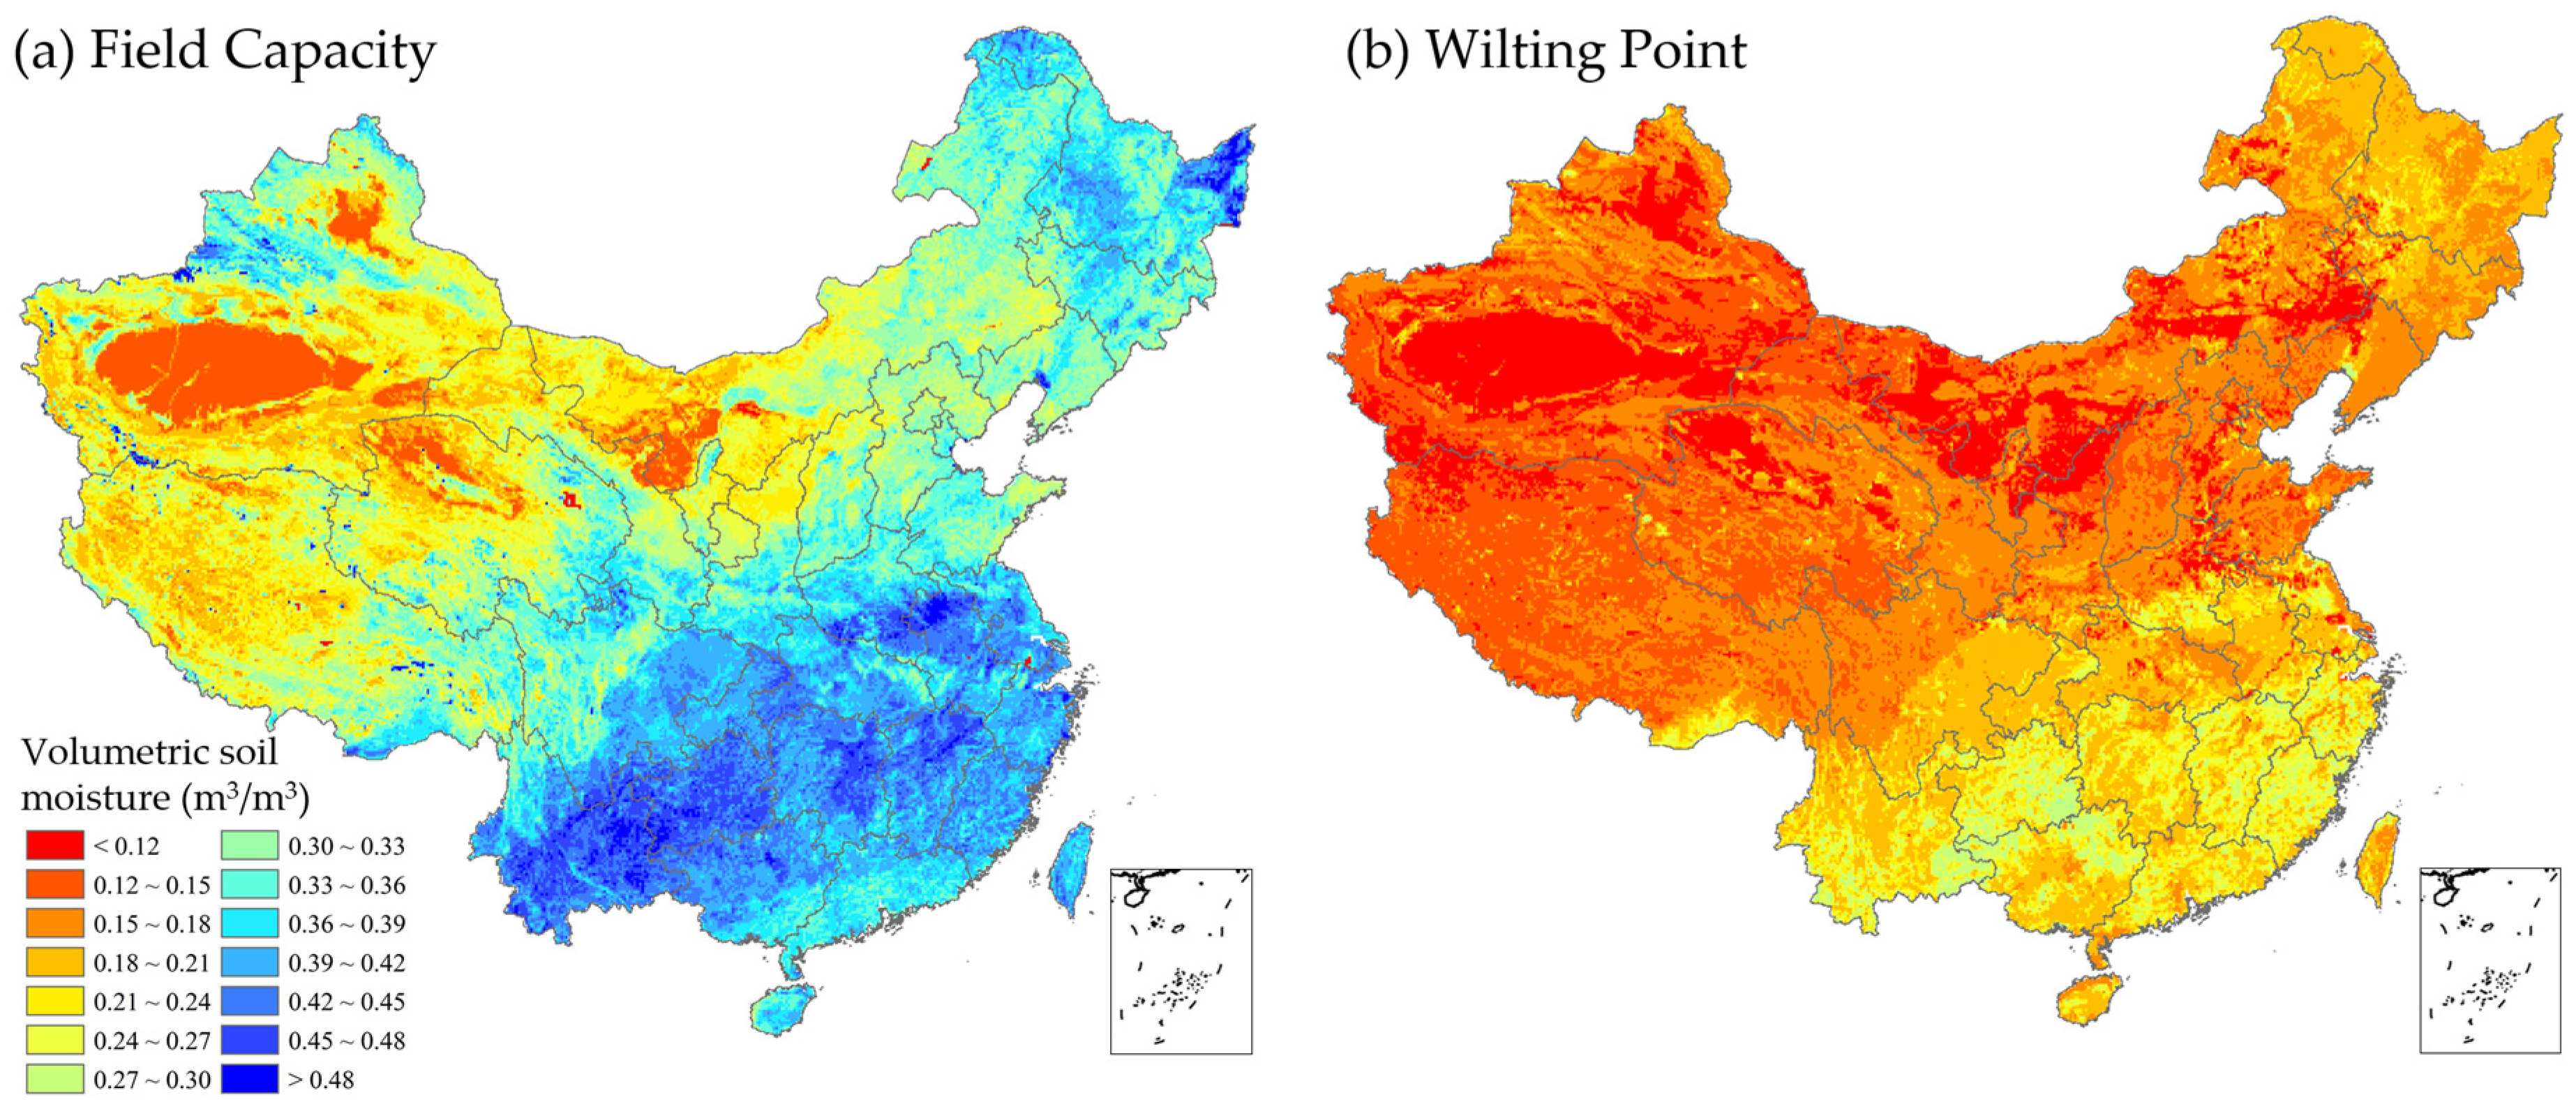
The spatial distribution map of field capacity and wilting points across China is shown in Figure 9a and Figure 9b, respectively. The minimum field capacity in Figure 9a is 0.08 m3·m−3, being predominantly found in the Taklimakan and Alashan deserts. The maximum field capacity is 0.60 m3·m−3, distributed in the southwestern Yangtze River basin and eastern Heilongjiang Province. The average field capacity is 0.31 m3·m−3, with field capacity values in the northern regions being generally lower than in the south, typically below 0.36 m3·m−3. The field capacity gradually increases from northwest to southeast, with most grids in south China exceeding 0.40 m3·m−3. The same colorbar is used for the distribution of wilting points in Figure 9b. The minimum wilting point value is 0.04 m3·m−3, being primarily distributed in provinces such as Xinjiang, Qinghai, Tibet, and Inner Mongolia. The maximum wilting point is 0.36 m3·m−3 and is predominantly found in provinces like Guizhou and Guangxi. Spatially, wilting point values in the northwest are lower compared to the southern and northeastern regions. The wilting point gradually increases from the northwest to the southeast, with wilting soil moisture in south China ranging between 0.27 and 0.36 m3·m−3. In the northeastern region, the wilting point is slightly lower compared to the south, with values ranging between 0.15 and 0.24 m3·m−3.
The boxplot of drought accuracy evaluation using the merged, VIC, SMAP, SMOS, CCI, and soil moisture product-based SWDI considering (a) POD and (b) MI is presented in Figure 10. The examples of actual drought events used for POD analysis included the southwest China Drought from spring 2009 to spring 2010, affecting the Yunnan, Guizhou, Sichuan, and Guangxi provinces; the northeast China Drought in spring 2011, impacting the Liaoning, Jilin, and Heilongjiang provinces; the north and northeast China Drought in summer 2013, which affected the Hebei, Shanxi, Inner Mongolia, and Liaoning provinces; the north China Drought in spring 2014, impacting Hebei, Beijing, and Tianjin; the South China Drought in spring 2015, affecting the Guangdong, Guangxi, and Fujian provinces; and the northeast Spring Drought in spring 2017, impacting the Liaoning, Jilin, and Heilongjiang provinces. For the POD metrics, the results indicate that the POD of the merged soil moisture for drought monitoring is the highest among the five products, with a median value of 0.98. This indicates that, when an actual drought occurs, the merged soil moisture product has a 98% probability of monitoring this drought. In comparison, the POD values for CCI, VIC, and SMAP are 0.95, 0.94, and 0.92, respectively, all lower than the POD value of the merged product. It is evident that the merged soil moisture exhibits higher drought monitoring accuracy than the pre-merged VIC and CCI data. Additionally, the results show that the merged product has a more consistent accuracy performance at different sites, with a POD value between 1 and 0.86. This suggests that its stability in usage across different stations is higher compared to other products.
The POD metric evaluates the ability to distinguish between the presence and absence of droughts, while the MI metric further evaluates the drought index’s capability of identifying different drought severity levels. As depicted in Figure 10b, the merged soil moisture product stands out as the most accurate among the five soil moisture products. The median value of the MI is 0.33, with maximum and 75th percentile values of 0.93 and 0.48, respectively, which accurately discern the observed drought severity levels. In contrast, the MI medians for the SMAP, VIC, CCI, and SMOS are 0.25, 0.21, 0.20, and 0.13, respectively. In summary, the result demonstrates that the merged soil moisture product shows the ability for both drought monitoring and drought severity identification.
To analyze the disparities in the accuracy of an SWDI across different regions, we made statistics regarding the averaged POD of different soil moisture product-based SWDIs over the northwest, north, and south China regions. It is worth noting that, due to the limited number of observational stations in the Qinghai−Tibet Plateau compared to other regions, only the statistical results of the other three regions are compared in this study. The mean values of POD and MI based on different soil moisture products in different regions are shown in Table 2. Overall, merged soil moisture has the highest POD value among the five products for the three regions, reaching 0.95, 0.96, and 0.93 in the northwest, north, and south regions, respectively, demonstrating its reliability and stability in identifying drought occurrences across different regions. Overall, the north region exhibits the highest drought identification accuracy. For the SMAP, SMOS, and CCI remote sensing soil moisture, this result aligns with the distribution pattern of remote sensing soil moisture itself. However, for VIC soil moisture, this distribution pattern differs from the better simulation results of the VIC model in the south. This indicates that the VIC model performs better in simulating soil moisture under relatively wet conditions in the southern region but relatively lacks accuracy under dry conditions.
The averaged MI of different soil moisture product-based SWDIs over the northwest, north, and south China regions is shown in Table 3. The result indicates that, in the northwest region, drought monitoring based on the SMAP has the highest accuracy, with a mean value of 0.36. The MI performance of merged soil moisture is slightly worse than the SMAP at 0.31, which is still much better than the VIC, SMOS and CCI products. In the north and south regions, drought monitoring based on merged soil moisture products has the highest accuracy, with mean values of 0.39 and 0.29, respectively. In the northwest, south, and north regions, the MI values of merged soil moisture are higher than those of the CCI and VIC, indicating that merged soil moisture products have advantages in more accurately quantifying drought severity levels compared to the pre-merged CCI and VIC soil moisture products.

4.3. Spatiotemporal Characteristics Analysis of Drought Monitoring Accuracy

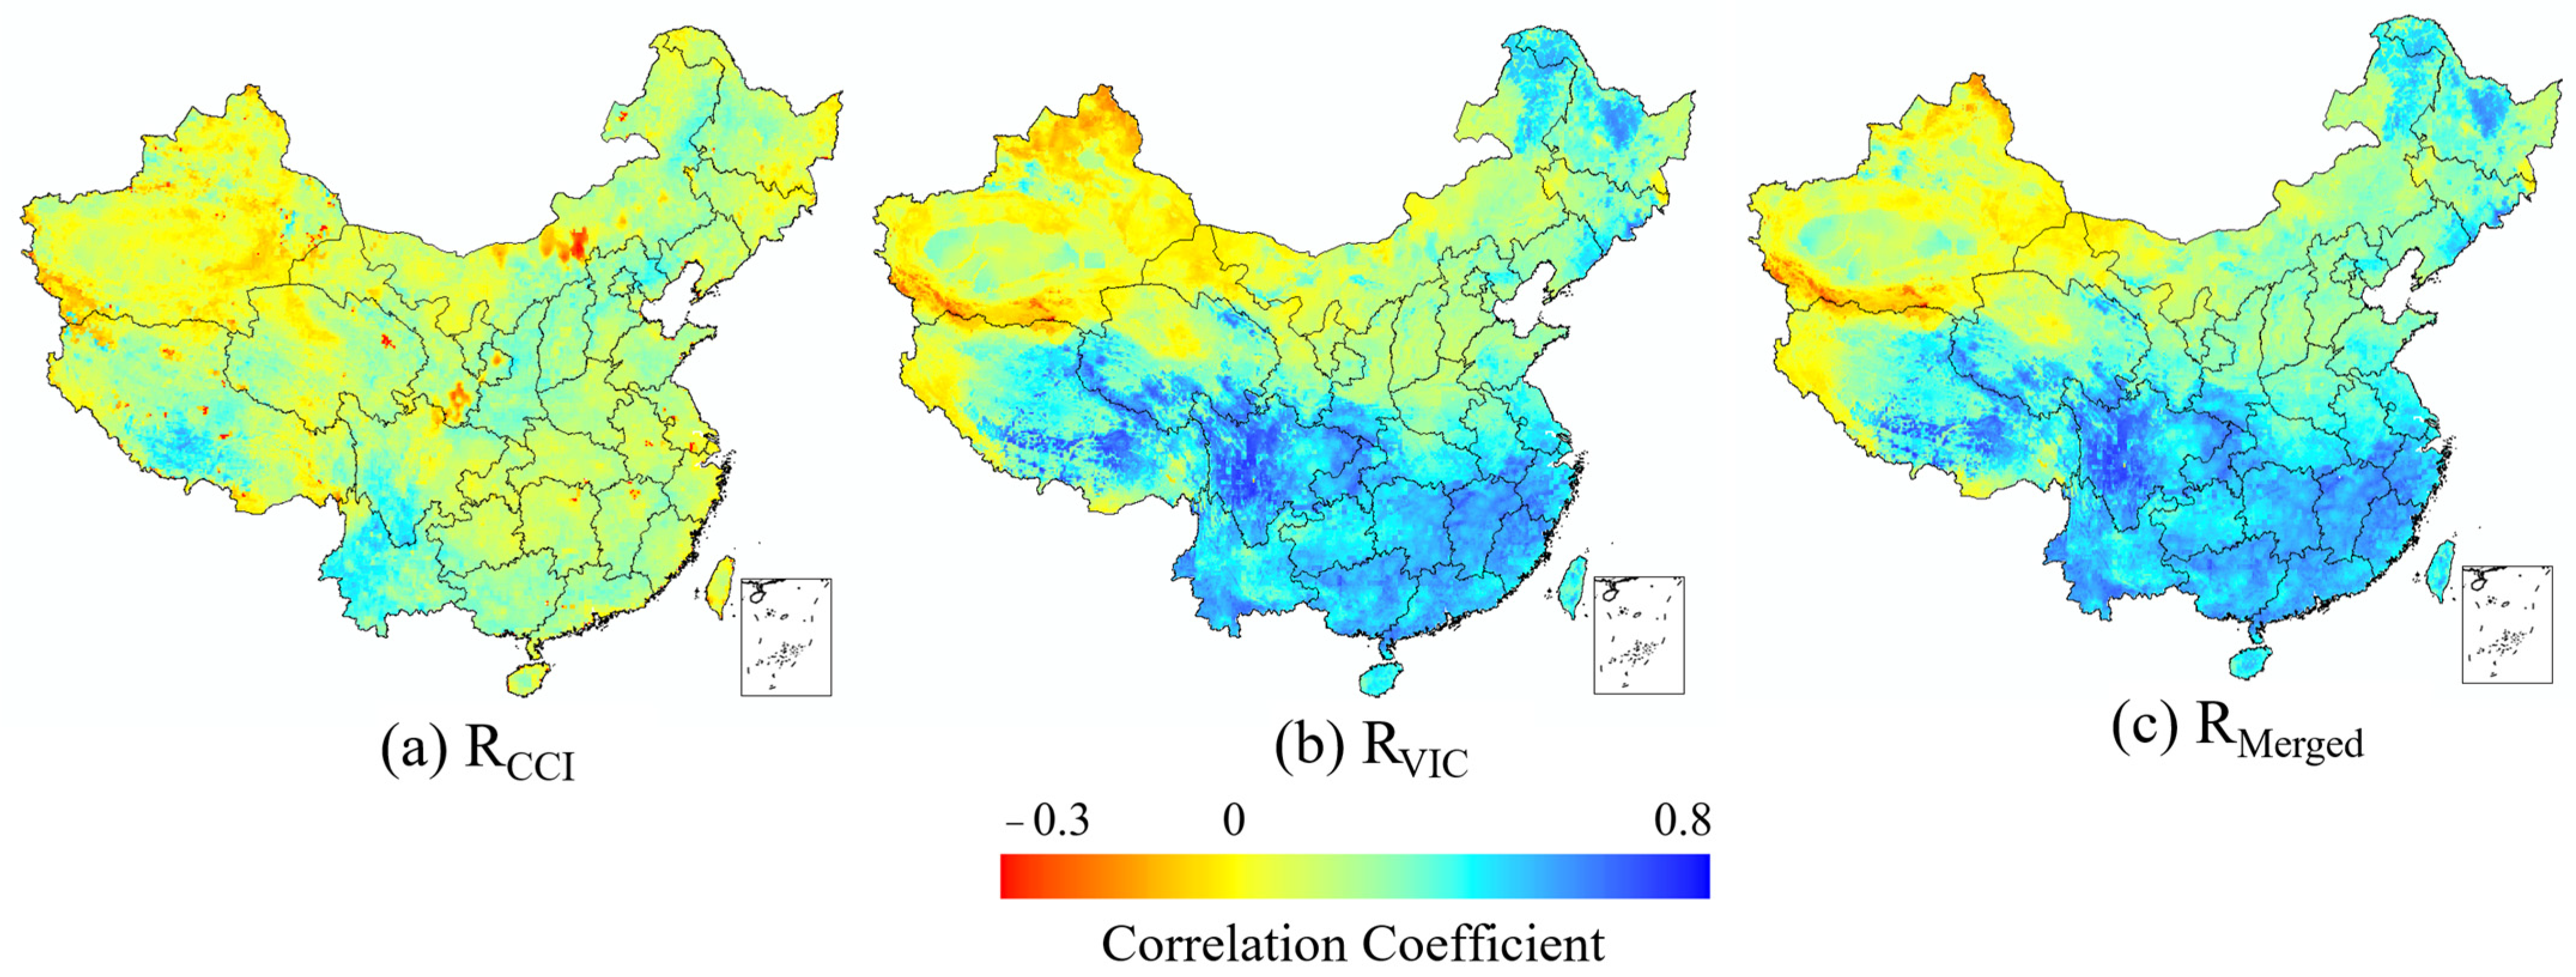
The spatial distribution of the correlation coefficient between the AWD and (a) the CCI, (b) the VIC, (c) and the merged soil moisture-based SWDI is shown in Figure 11. A higher correlation coefficient indicates a higher accuracy of drought monitoring for the respective soil moisture products. It can be observed that the spatial distribution trends of drought monitoring accuracy for the VIC and merged soil moisture products are relatively similar, although there are differences in the quantitative values. Generally, the correlation coefficients exhibit a pattern of being higher in the southern regions and lower in the northern regions. In the northern regions, the correlation coefficient decreases from east to west. The results demonstrate that the correlation coefficients for the merged and VIC products exceeds 0.5 in most grids of the southern region and the central part of the Qinghai−Tibet Plateau. In the majority of grids in the northern region, the correlation coefficients for merged soil moisture products is above 0.4, while the correlation coefficients for the VIC product is around 0.3. Furthermore, the CCI product has the lowest correlation coefficients in this region, with the value being around 0.2. In most grids of the northwestern region, both the correlation coefficients for merged and VIC products are below 0.2, with negative correlation coefficients being found in the northern part of Xinjiang. The correlation coefficients of the CCI are notably lower compared to the other two sets of products, especially in the southern region, where most grids exhibit correlation coefficients of around 0.25. In the southwest region and the central part of Tibet, CCI products have the highest correlation coefficients, reaching above 0.4.
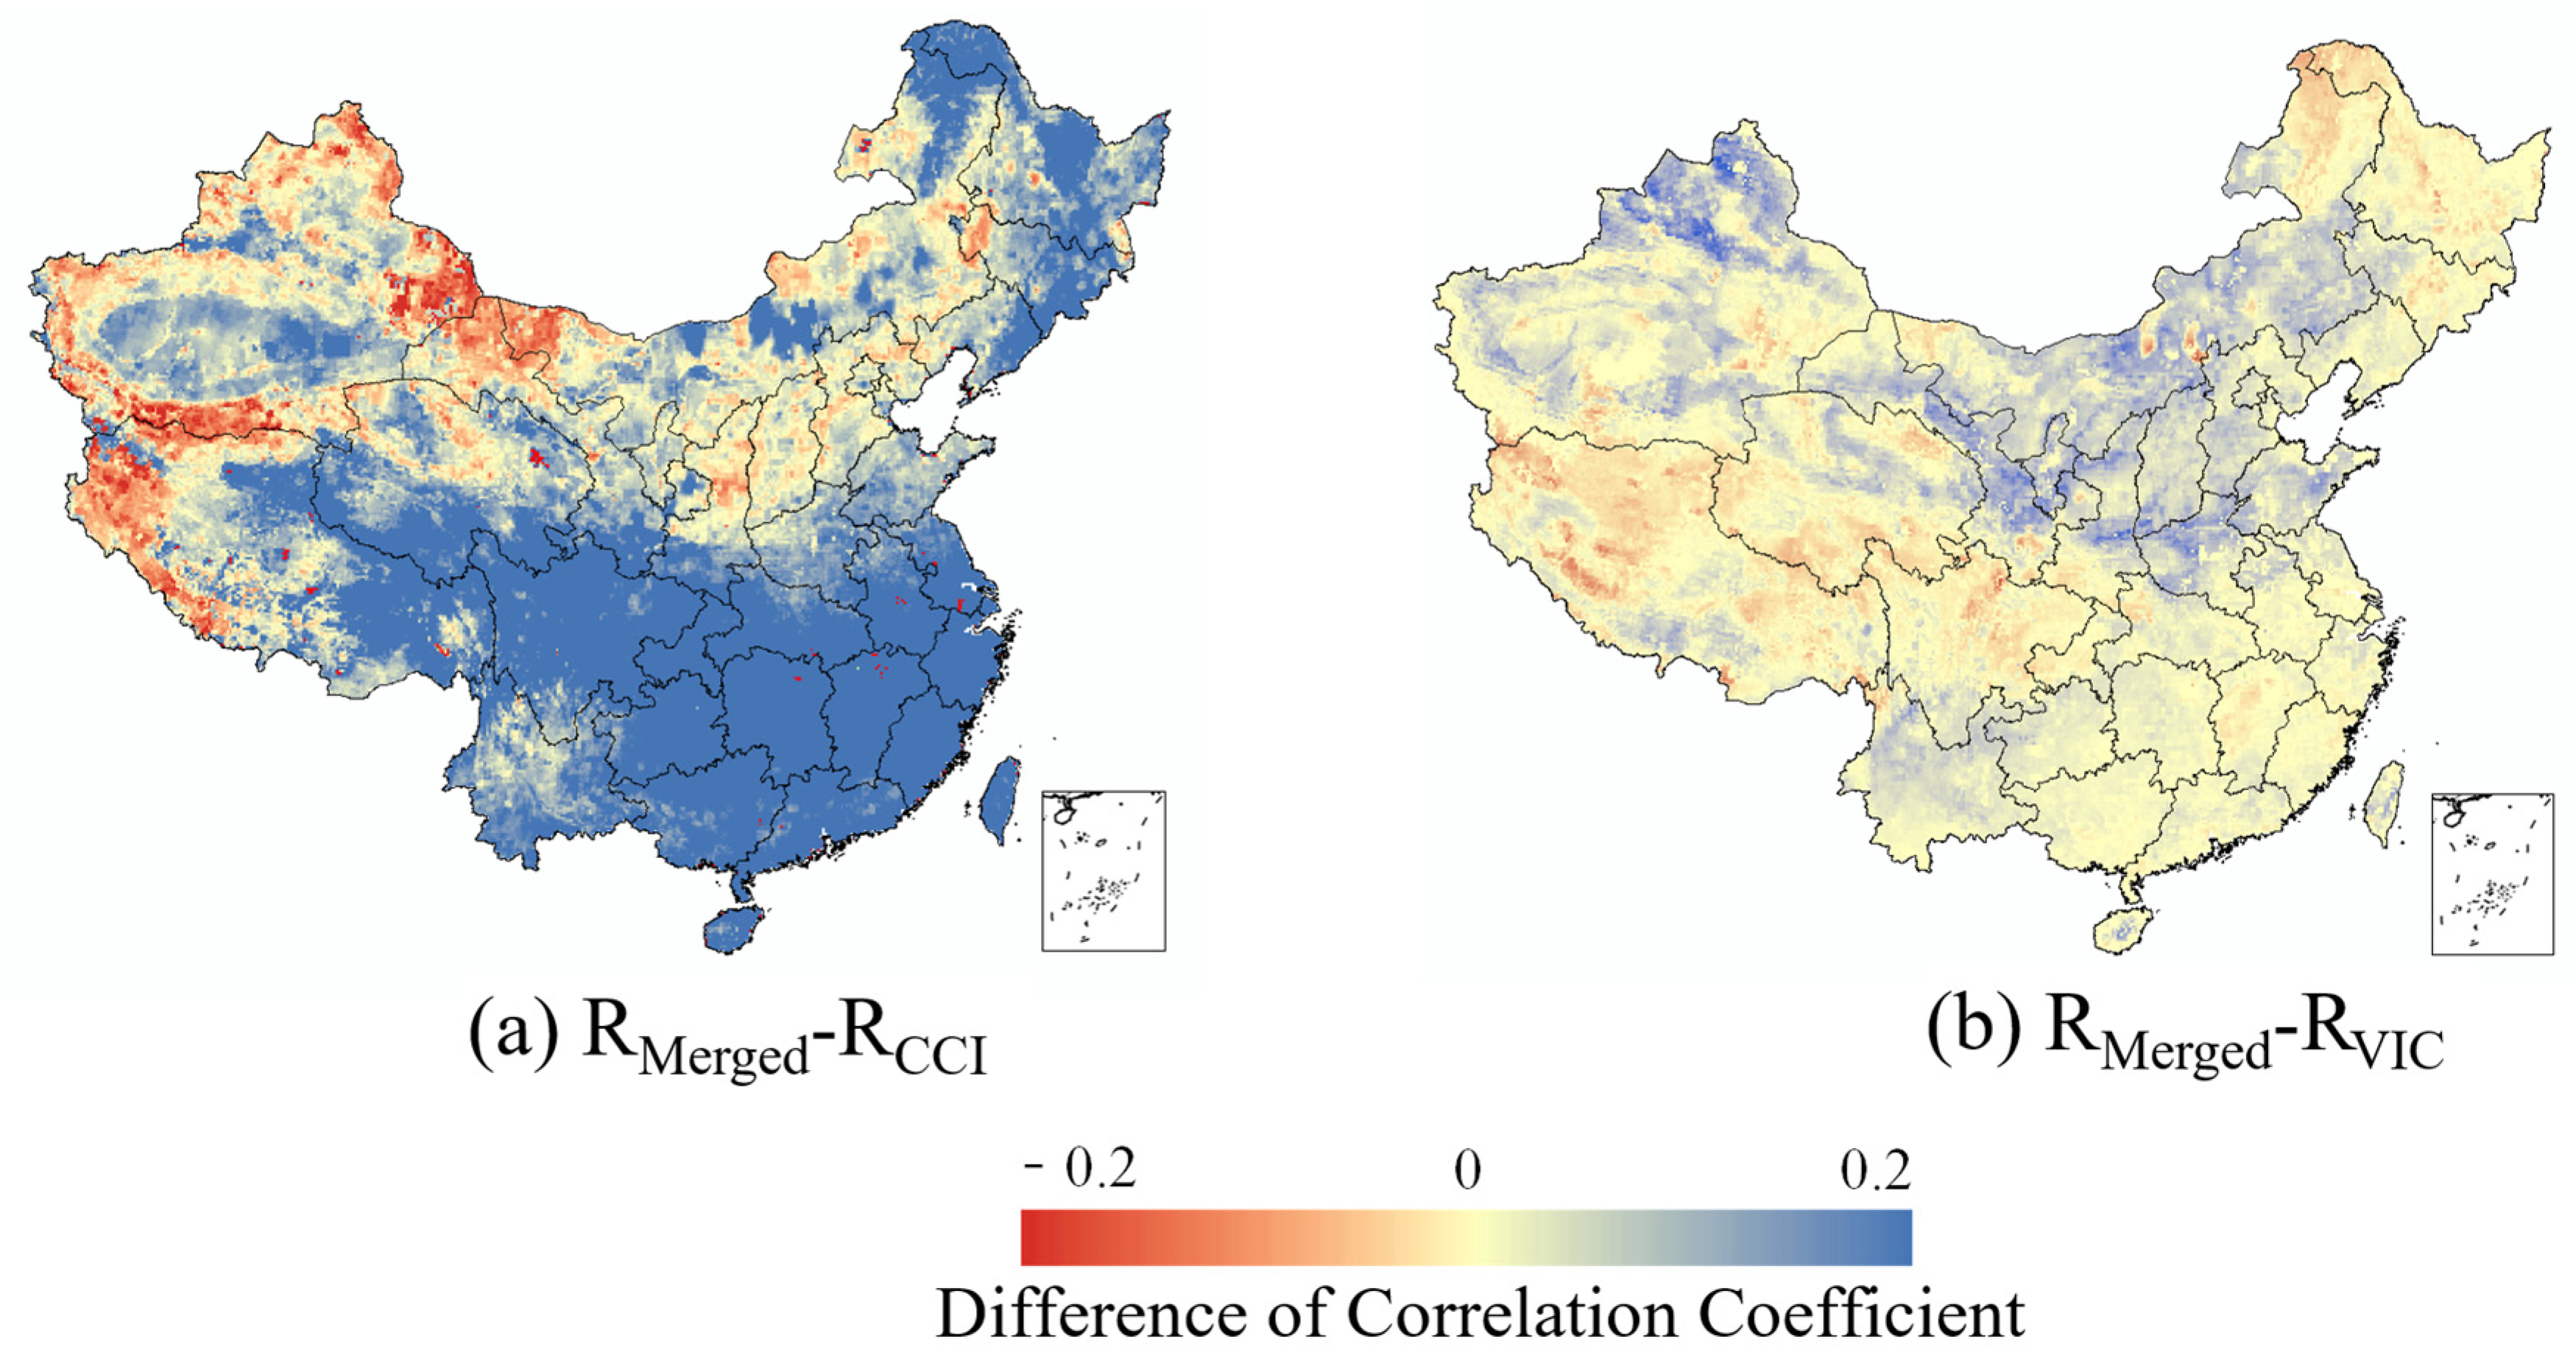
The distribution map for the difference in correlation coefficients between (a) the merged-based SWDI and AWD compared to (a) the CCI-based SWDI and AWD and (b) the VIC-based SWDI and AWD are shown in Figure 12. A larger difference in correlation coefficients indicates that the merged product has a greater improvement in drought monitoring accuracy compared to other products. The results indicate significant improvements in drought monitoring accuracy nationwide with the merged product compared to the CCI, while the enhancement in correlation coefficients compared to the VIC is more concentrated in the northern and northwestern regions. Specifically, concerning CCI products, the merged product exhibits noticeable improvements in the southern and northeastern regions, with correlation coefficient increases exceeding 0.2. Conversely, in the southwestern part of Tibet, southern Xinjiang, and the northern Gansu regions, the merged product shows a reduction in correlation coefficients of around −0.15 compared to the CCI. In the Hebei, Shanxi, and Shaanxi provinces, the merged product maintains a similar level of accuracy to the CCI. Regarding VIC products, the merged product demonstrates correlation coefficient increases of 0.1 to 0.2 in the Huaihai Plain, the northwestern, and the southwestern regions while experiencing a decrease of approximately −0.05 compared to the VIC in certain areas of the Qinghai−Tibet Plateau. In the southern region, the accuracy of the merged results closely aligns with that of the VIC model.
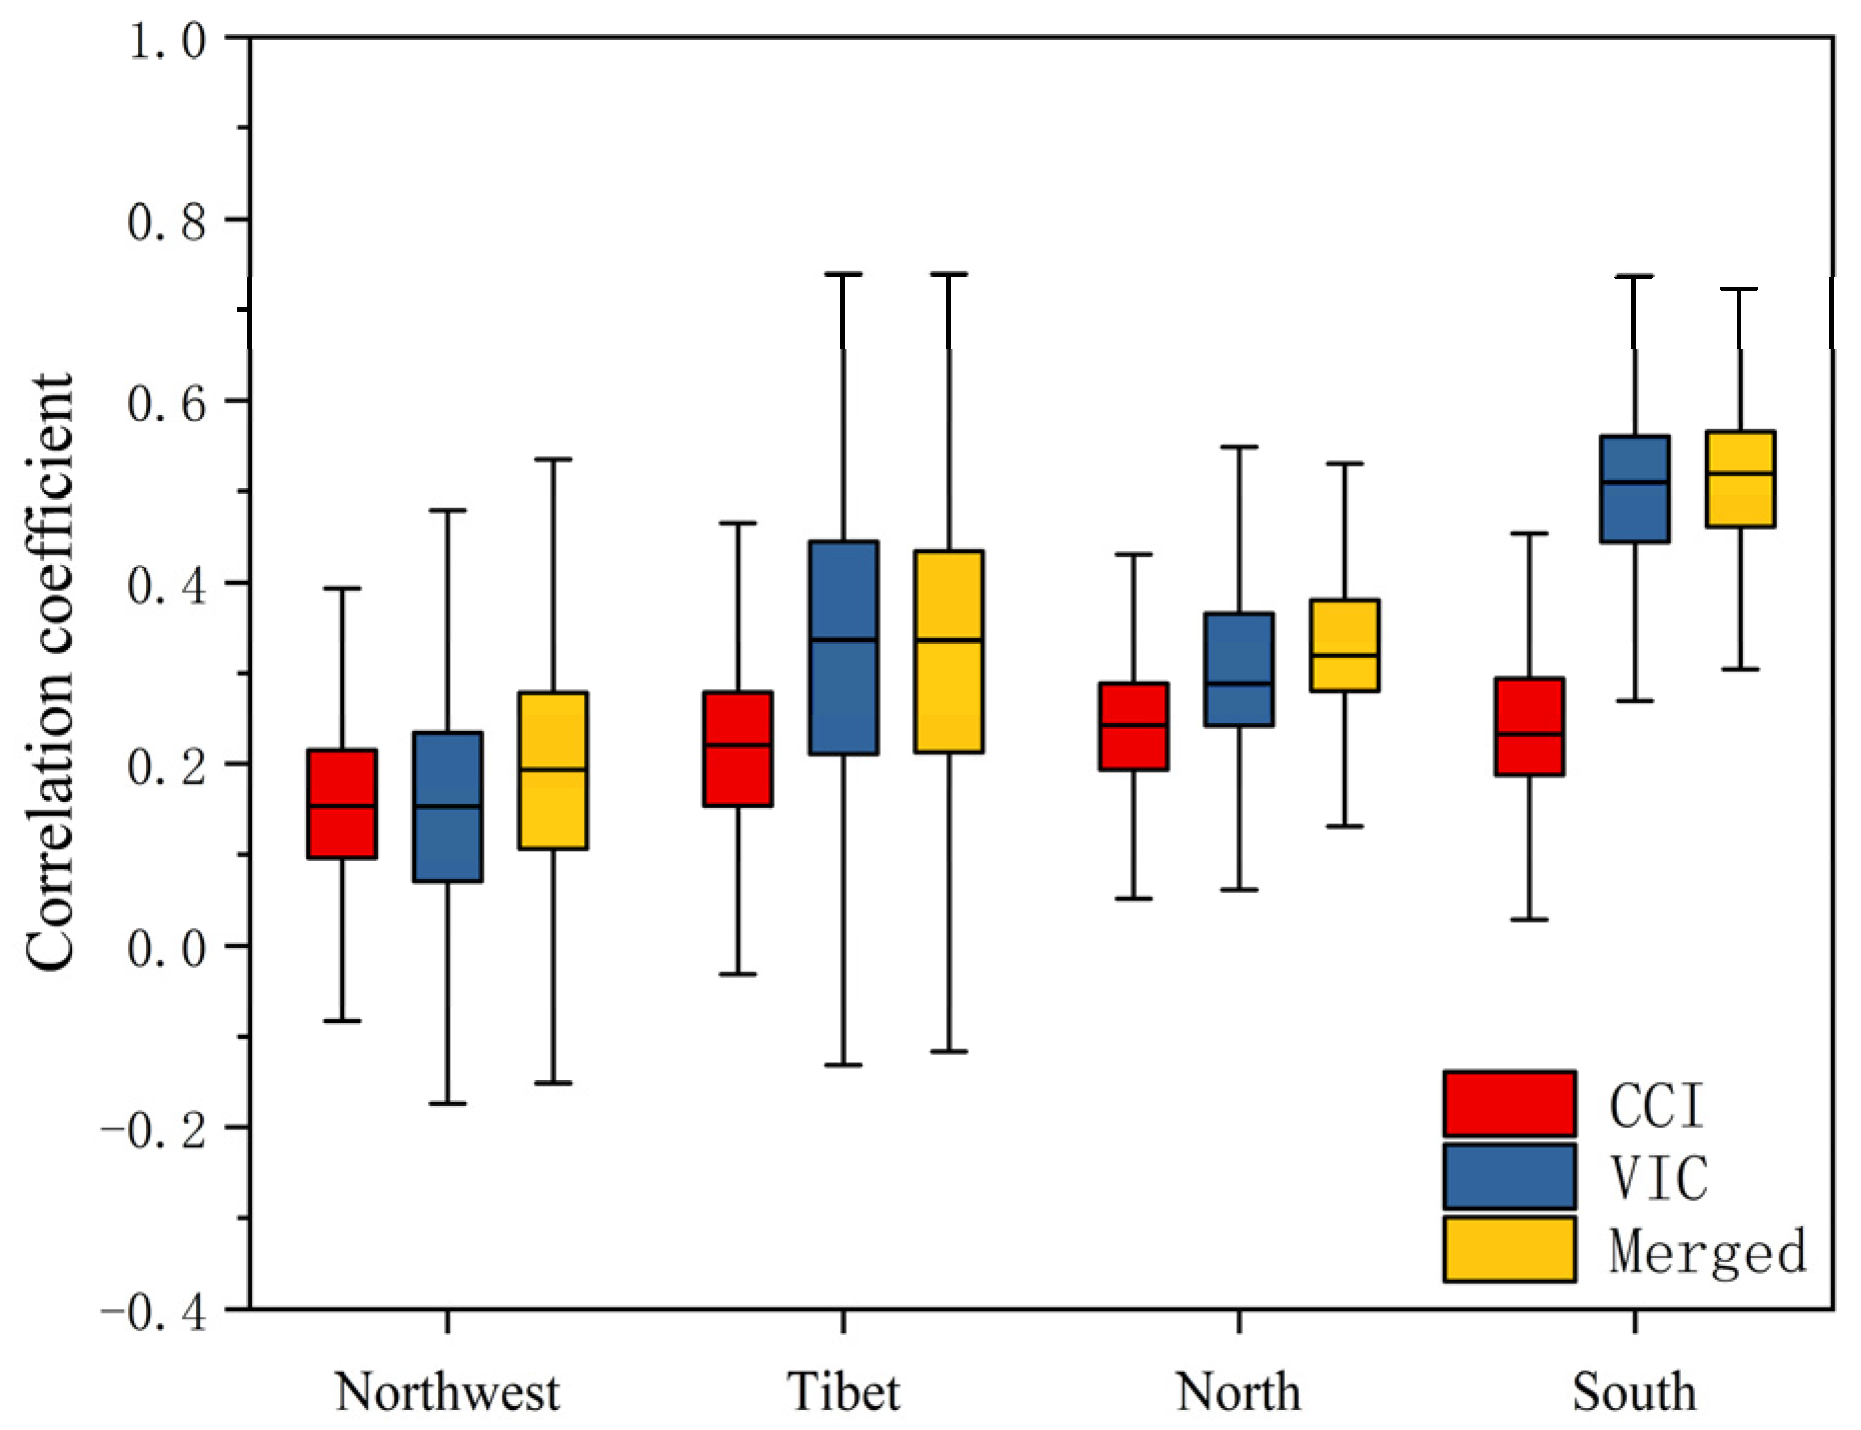
The boxplot of the correlation coefficient between the CCI, VIC, and the merged soil moisture-based SWDI and AWD over the northwest, Tibet, and north and south China are presented in Figure 13, according to geographical division depicted in Figure 1. Generally, all three sets of products exhibit the highest correlation coefficients in the southern region and the lowest in the northwest region. Notably, the merged product consistently demonstrates the highest correlation coefficients in every region. In the northwest region, the average correlation coefficients of CCI and VIC products are close. The VIC product displays a larger range of correlation coefficients compared with other products. Overall, the merged product shows an increase of approximately 0.05 in correlation coefficient compared to CCI and VIC products. In the Qinghai−Tibet region, the accuracy of the merged product is similar to that of the VIC product, with an increase of around 0.15 in the correlation coefficient compared to the CCI product. In the northern region, the merged product exhibits an increase of approximately 0.1 and 0.05 in the correlation coefficient compared to the CCI and VIC products, respectively. In the southern region, the correlation coefficients of the merged product and VIC product are close and notably higher than in other regions, with a median correlation coefficient exceeding 0.5. Compared to the CCI product, the correlation coefficient of the merged product increases by more than 0.3.
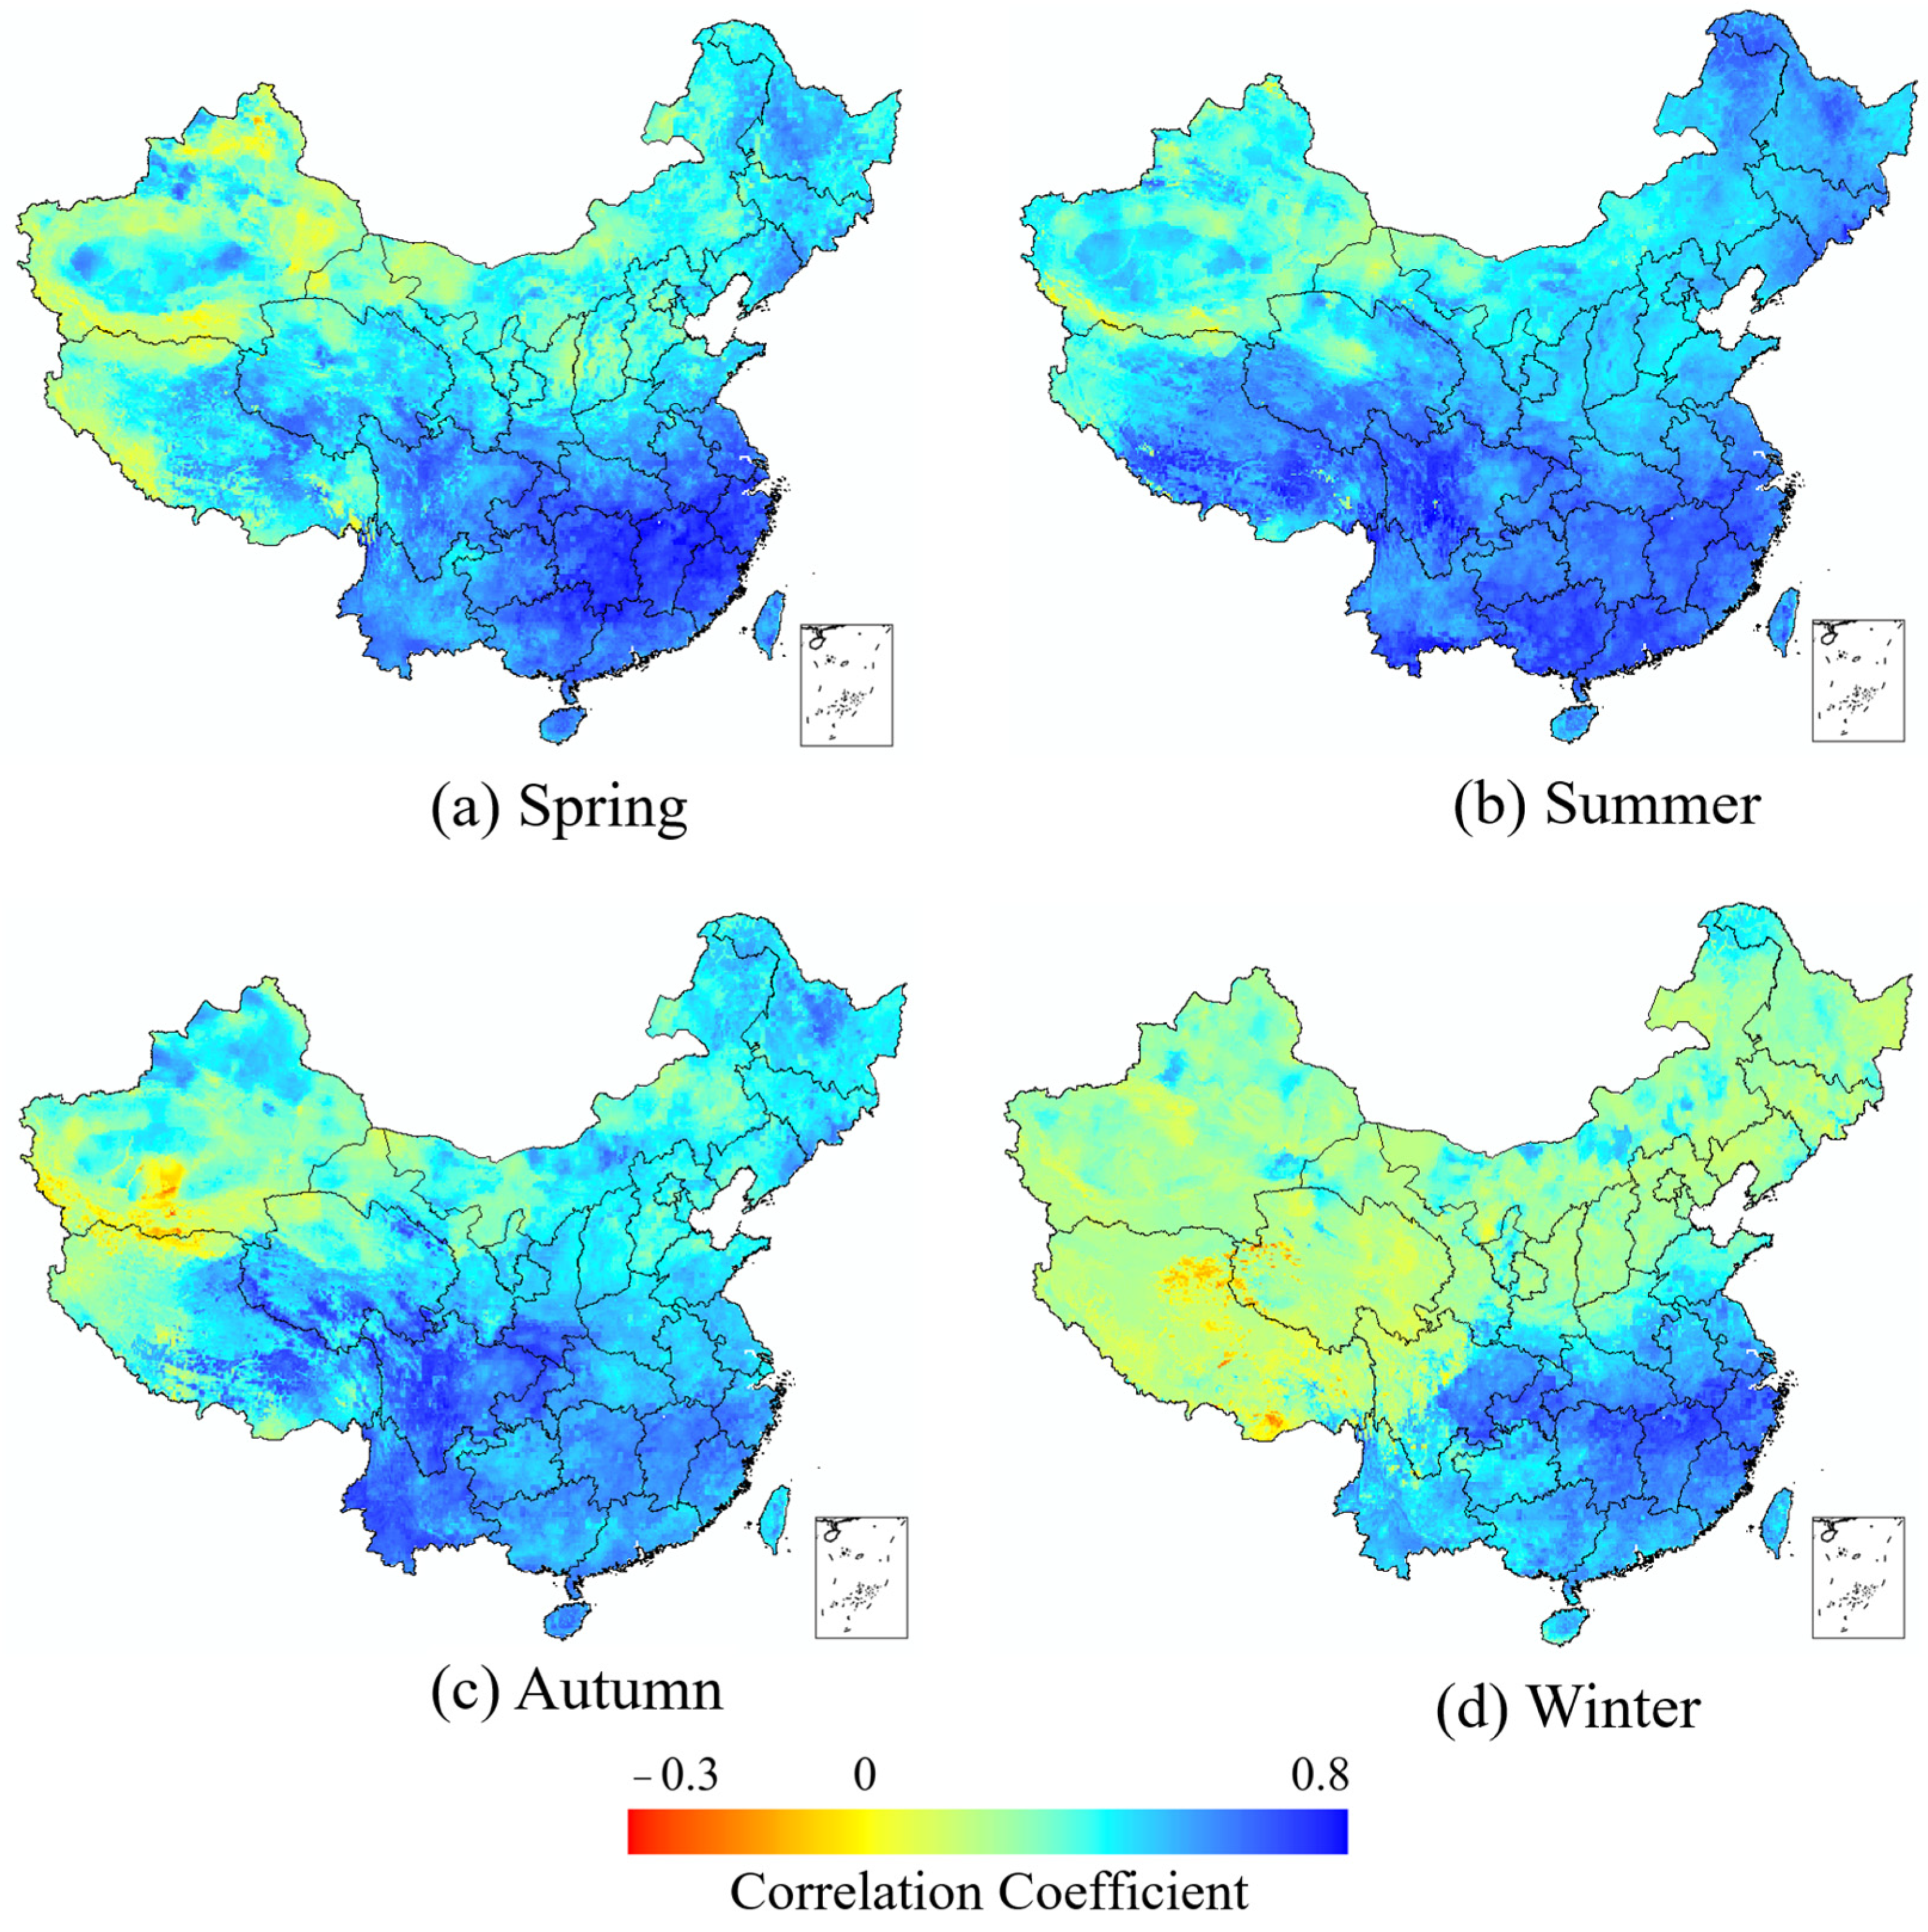
To investigate the impact of different seasons on the drought monitoring based on merged soil moisture, we divide the study period into four seasons building upon the research conducted throughout the entire timeframe. The spatial distribution of correlation coefficient between the merged soil moisture-based SWDI and AWD in (a) spring, (b) summer, (c) autumn, and (d) winter are presented in Figure 14. Overall, the correlation coefficient during summer is the highest nationwide. The correlation coefficient reaches above 0.5 in most regions, except for southern Xinjiang, where the coefficients are slightly lower. In the southern regions, the correlation coefficients generally exceed 0.7. Spring and autumn exhibit relatively consistent correlation coefficients, with slight spatial variations in the southern regions. In spring, the Yangtze River basin shows higher correlation coefficients, with the values surpassing 0.7. In autumn, elevated coefficients are observed in the southwest which exceed 0.7. Comparatively, winter has the lowest correlation coefficients among the four seasons, particularly in the northwest, northern, and Qinghai−Tibet Plateau regions, where coefficients hover around 0.2. Some grids in Tibet exhibit negative correlation coefficients. Nationally, drought monitoring based on merged soil moisture demonstrates relatively high accuracy in all four seasons in the southern regions. In the northern regions, winter drought monitoring accuracy is lower than in the other three seasons.

4.4. Drought Evolution Analysis and Drought Indexes Comparison

Based on the geographical and climatic characteristics of different regions, we have divided China into six major crop regions, as shown in Figure 2. Compared to the previous zoning map, the new zoning map now categorizes the north region into the northeastern and northern regions, while the south region is divided into the southwestern, Yangtze River basin, and southern regions. Note that, in this study, the Yangtze River basin specifically refers to the middle and lower reaches of the Yangtze River basin. The Qinghai−Tibet Plateau and northwest regions have been merged into the northwest region. This zoning rationale is due to the fact that the food production in the northwest region accounts for only 3% of the national total, thus it will not be analyzed separately in subsequent studies. The more detailed division of the south and north regions is beneficial for analyzing and comparing the differences in drought affection on crops across different areas.
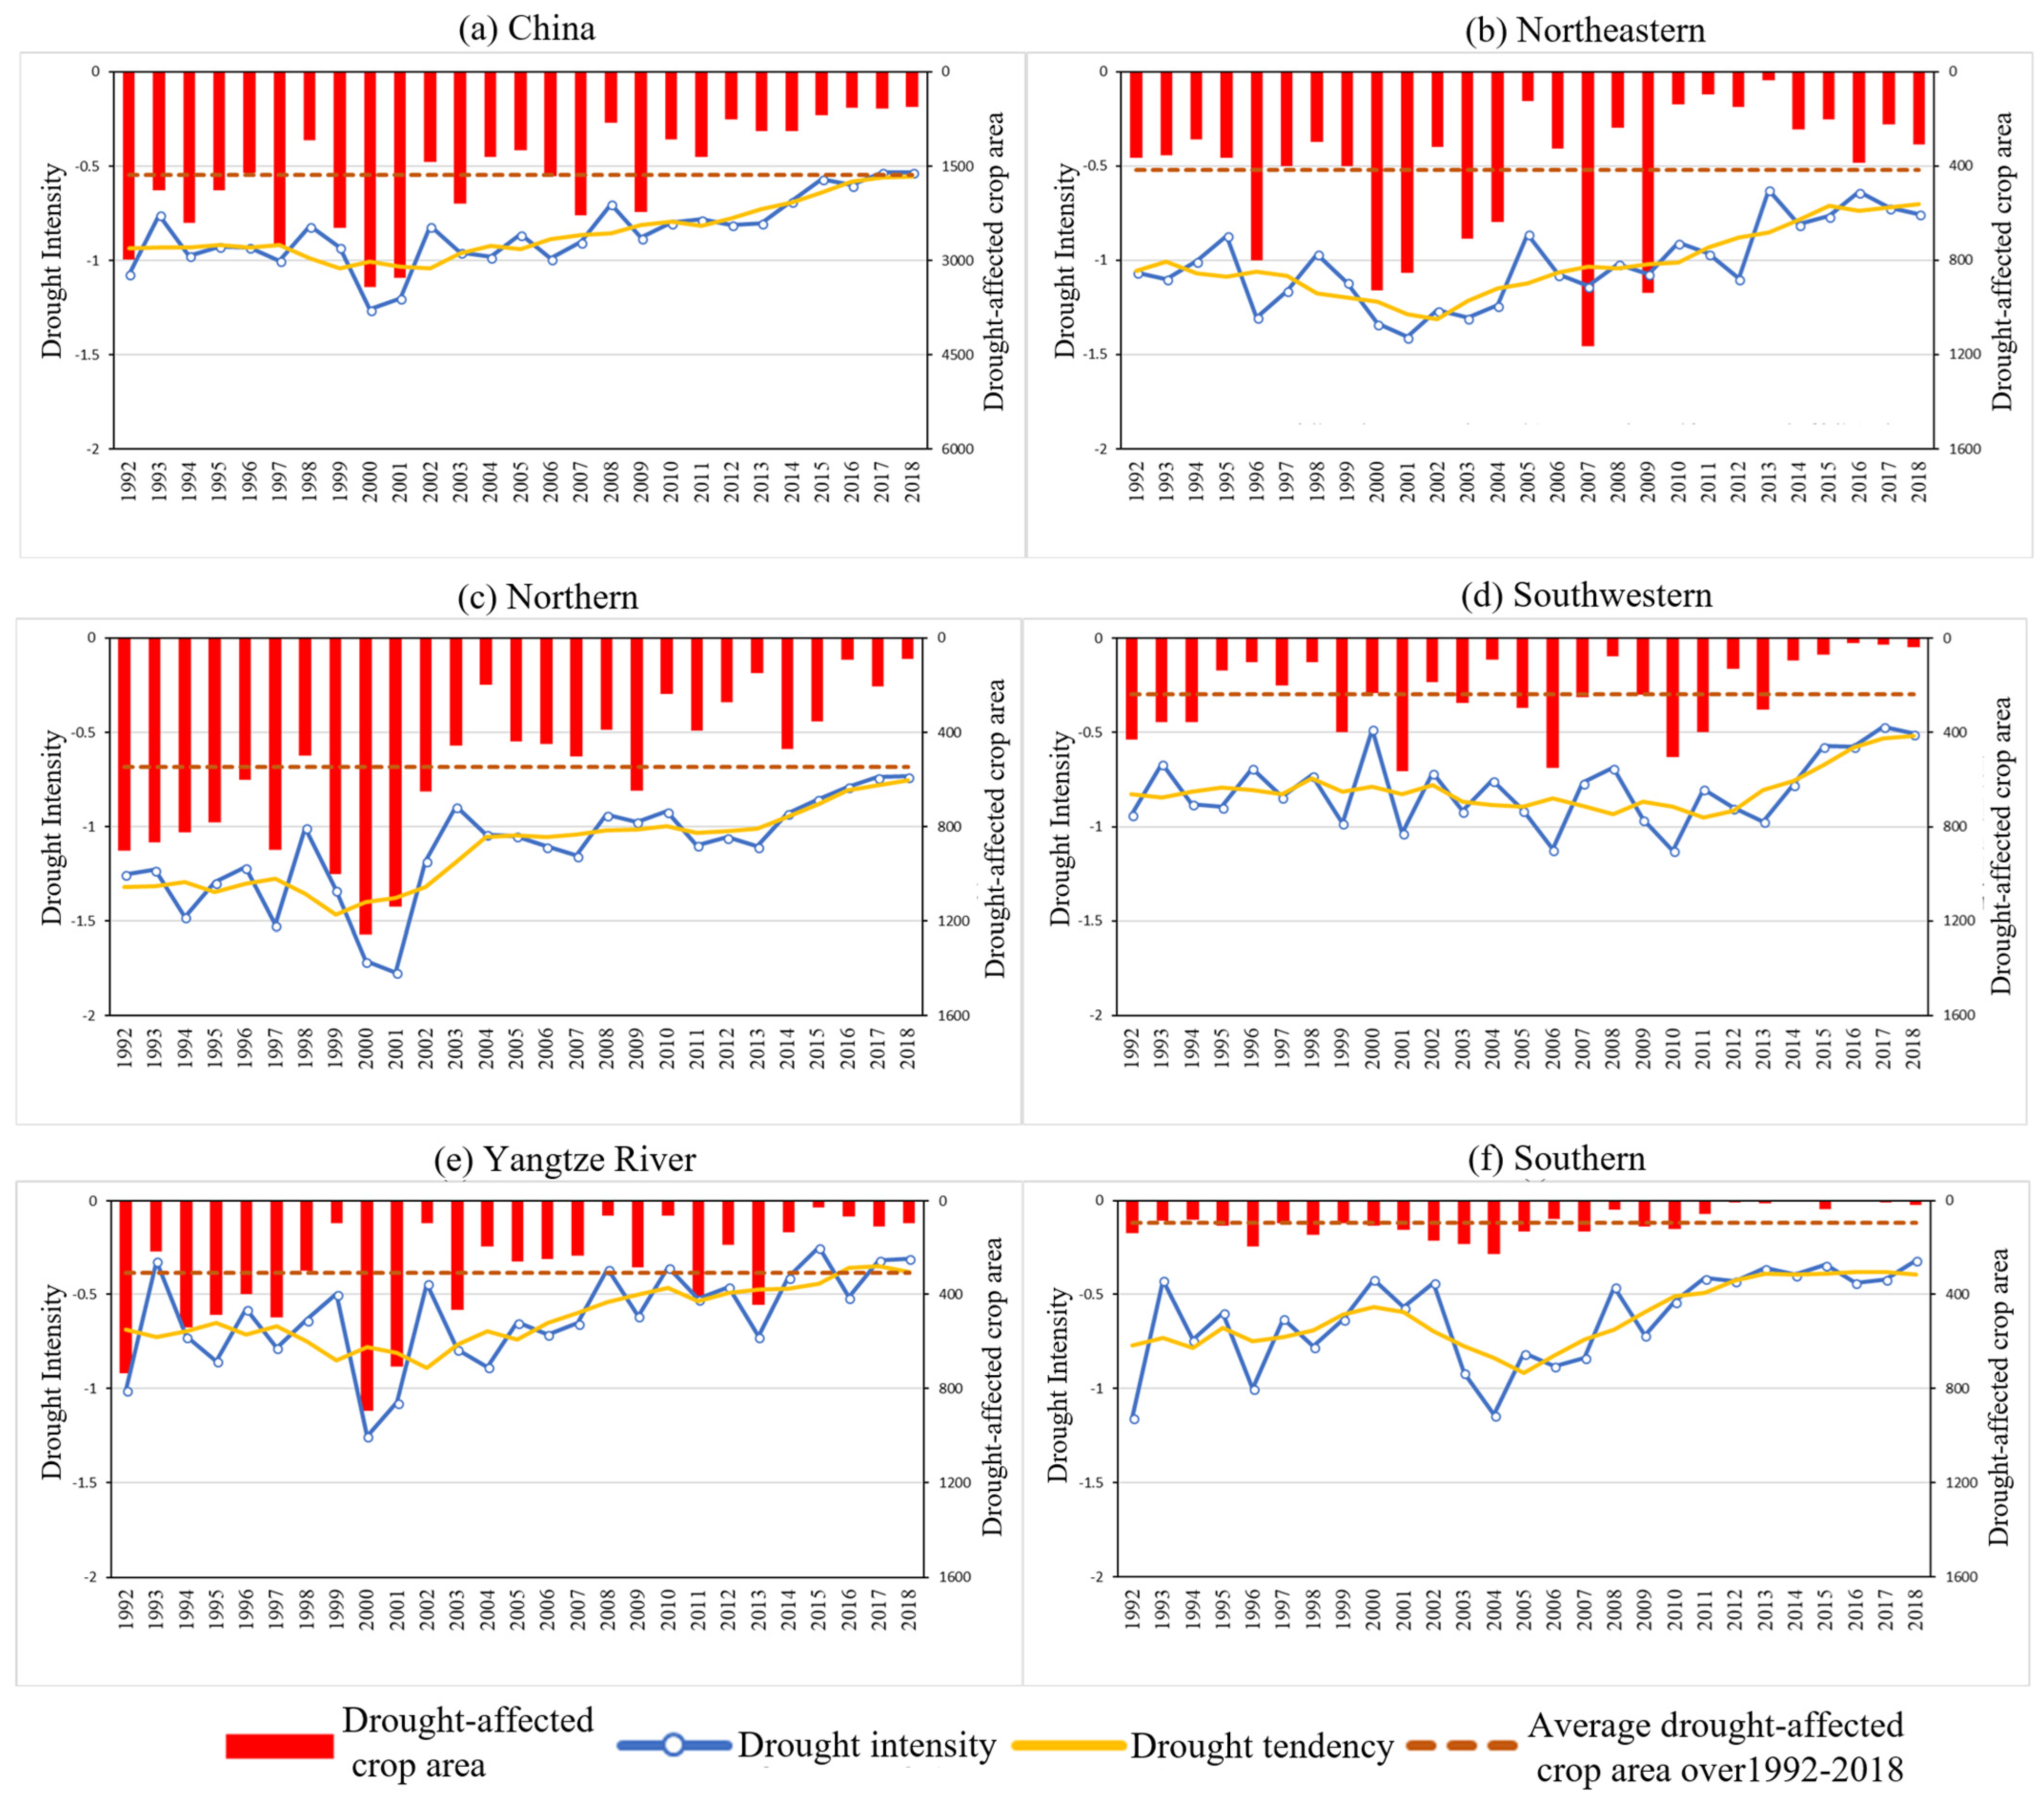
The drought-affected crop area data were collected to analyze the reliability of the SWDI in drought monitoring across different regions. A time series of the drought-affected crop area, SWDI drought intensity, drought tendency in (a) mainland China and (b) the northeastern, (c) northern, (d) southwestern, (e) Yangtze River basin, and (f) southern region of China from 1992 to 2018 is presented in Figure 15. In this figure, the red bars represent the yearly average drought-affected crop areas, the red dashed line signifies the average drought-affected crop areas during 1992–2018, and the blue line depicts the annual drought intensity. A 5-year moving window average was employed to show the drought tendency, indicated by the yellow line segment.
Figure 15a shows that the national average drought-affected crop area was 16.44 million hectares during 1992 to 2018. Among these, the northeastern region had an average drought-affected crop area of 4.18 million hectares, accounting for 25% of the total average drought-affected crop area of China; the northern region had an average drought-affected crop area of 5.47 million hectares, accounting for 33%; the southwestern region had an average drought-affected crop area of 2.38 million hectares, accounting for 14%; the Yangtze River basin had an average drought-affected crop area of 3.08 million hectares, accounting for 19%; and the southern China region had an average drought-affected crop area of 0.96 million hectares, accounting for 6%. At different times, the drought situation varied across the region. From 1992 to 1996, the northern region experienced the most severe drought, followed by the Yangtze River basin region. In 1996, the northeastern region was the most severely drought-affected area nationwide. From 1997 to 2002, the most severely drought-affected regions during the same period were the northern region, the northeastern region, and the Yangtze River basin region. From 2003 to 2009, the northeastern region surpassed the northern region, becoming the most severely drought-affected region nationwide. During 2010 to 2011, the southwestern region experienced the most severe drought nationwide. From 2014 to 2018, the northeastern and northern regions were the most severely drought-affected areas nationwide.
For mainland China (Figure 15a), the drought-affected crop area has shown a gradual increase since 1992. The drought-affected crop area reached its peak in 2000–2001, with an affected area of 34.24 million hectares. During the same period, the drought intensity also reached its maximum value of −1.3. The drought intensity has been gradually decreasing annually from −1 to around −0.5 from 2002, leading to a gradual decline in the affected area to below 6 million hectares. The northeastern region (Figure 15b) exhibited a large interannual variability in regard to drought-affected crop areas. The top three years in terms of drought-affected crop area were 2007, 2009, and 2000, while the lowest drought-affected crop areas were observed in 2013, 2011, and 2010, respectively. Since 2007, both the drought-affected crop area and drought intensity in the northeastern region have shown a declining trend annually. Overall, the trends in drought intensity and drought-affected crop area in the northeastern region were generally consistent. However, the drought intensity failed to reflect the two significant drought events in 2007 and 2009. From 1992 to 2001, the drought-affected crop area for the northern region (Figure 15c) remained above the mean line, except for in 1998. There was a yearly increase in the drought-affected crop area from 1998, with the top value occurrence being at 2000 for over 12 million hectares, accounting for over 40% of the national drought-affected crop area during the same period. The drought intensity in the same year also reached its maximum value in nearly 30 years at −1.7. Beginning in 2002, the affected area notably decreased compared to previous years, except for 2009. After 2014, the drought-affected crop area decreased annually. The results indicate that the drought trend aligned with the affected area trend, remaining stable from 2004 to 2013 and decreasing annually after 2013.
The drought trend in the southwestern region (Figure 15d) differed from that of the northeastern and northern regions. There was a gradual increase in drought intensity from 1992 to 2011. The peaks of drought-affected crop area occurred in 2006 and 2010, which exceeded the historical average affected area by two times. The same peaks of drought intensity were also found in the same years, which indicates the reliability of the SWDI-based drought index. Since 2012, there has been a noticeable decrease in drought intensity, consistent with the simultaneous decrease in drought-affected crop areas. The average drought-affected crop area from 2014 to 2018 was only 380,000 hectares, which is significantly lower than the historical average annual affected area of 2.38 million hectares. The Yangtze River basin region (Figure 15e) encompasses major crop-producing provinces such as Jiangsu and Hunan. As a result, it has exhibited a higher drought-affected crop area compared to the southwestern region despite its lower drought intensity. From 1992 to 1999, the drought-affected crop area showed a decreasing trend annually. The drought-affected crop area surged to 8.94 million hectares in 2000, reaching its highest value in nearly 30 years, accompanied by the highest drought intensity in the same year. The drought intensity decreased annually from 2002, and the drought-affected crop area also showed a downward trend. The southern region (Figure 15f) has a noticeably smaller drought-affected crop area compared to other regions. The drought-affected crop area remained relatively stable around the mean line of 960,000 hectares from 1992 to 2001. However, the drought intensity showed more significant fluctuations in the same period. The drought-affected crop area has increased annually since 2002, peaking at 2.3 million hectares in 2004. The highest drought intensity was found in the same years, with a value of −1.2. Both the drought-affected crop area and drought intensity have shown a consistent downward trend since 2005.
A comparison of the correlation coefficient between drought-affected crop areas and drought intensity of the SWDI, SMI, SMAPI, and SPI in different crop regions is presented in Table 4. The bold number represents the drought index with the highest correlation coefficient in this crop region. The results indicate a notably higher correlation with the drought index directly related to soil moisture, such as the SWDI and SMAPI, compared to the precipitation-related drought index SPI. The absolute values of the correlation coefficients between drought intensity and drought-affected crop area in China for the SWDI, SMI, SMAPI, and SPI are 0.88, 0.83, 0.81, and 0.51, respectively. For each region, the absolute values of the correlation coefficients based on the SWDI are all higher than those based on the SMAPI. This indicates that a soil moisture-related drought index, such as the SWDI, which not only considers soil moisture dynamics but also soil physical properties, can better monitor and reflect agricultural drought compared with other drought indexes. The southwestern region exhibits the closest correlation among the three indices, with absolute correlation coefficient values of 0.75, 0.74, 0.73, and 0.63 for the SWDI, SMI, SMAPI, and SPI, respectively. The Yangtze River basin is the area where the SWDI reflects the drought-affected crop area best, with a correlation coefficient of 0.89, followed by the northern region, with a correlation coefficient of 0.88. The northeastern region has the worst ability in regard to the SWDI reflecting the drought-affected crop area, with a correlation coefficient of 0.69. The correlation coefficient of the SPI is highest in the southwestern region, with an absolute value of 0.63, and worst in the northeastern region, with an absolute value of only 0.13. It is worth noting that, in the northeastern region, the accuracy of all drought indexes is poor, including soil moisture-related indexes and precipitation-related indexes. One possible reason for this is the long-term snow accumulation in the area.
Based on above analysis, the results indicate that the meteorological drought index SPI only represents cumulative precipitation deficits, making it challenging to objectively reflect drought conditions for land surface. As a result, it has the poorest drought monitoring accuracy. The SMAPI considers the soil moisture dynamic as a state variable of land surface. However, it lacks consideration of soil physical properties, thus exhibiting higher accuracy in drought monitoring compared to the SPI but lower than the SMI and SWDI. Both the SWDI and SMI consider soil moisture and field capacity. However, the SWDI considers not only field capacity but also the wilting point. Consequently, the SWDI exhibits the highest monitoring accuracy in agricultural drought monitoring. This underscores the advantages and potential of the enhanced SWDI, which integrates soil moisture data with multiple key soil hydraulic parameters for improving agricultural drought monitoring.
Nevertheless, the enhanced SWDI proposed in this study still exhibits certain limitations. First, the index does not account for variations in crop water requirements. Given that different crops demand differing amounts of water, the SWDI may not accurately reflect the actual drought conditions experienced by specific crops. This limitation could lead to misinterpretations of drought severity in regions with diverse agricultural practices. Secondly, the SWDI operates independently of long-term climatic background data. This feature, although simplifying its application, means that the index may not fully capture the impacts of climate change on hydrological cycles and soil moisture over extended periods. As climate patterns shift, there may be a need to recalibrate drought thresholds to maintain the index’s accuracy and relevance. Lastly, the exclusion of human interventions such as irrigation and water reservoir management in the SWDI’s formulation can lead to uncertainty in regions where such practices significantly influence soil moisture levels. This oversight might result in underestimating or overestimating drought conditions in areas heavily managed through artificial watering systems. Therefore, while the enhanced SWDI provides a straightforward and reliable approach to monitoring drought, the development and practical application of the enhanced SWDI still need to be explored in the future, particularly in regard to the consideration of crop types, human activities, and climate change.

5. Conclusions

Drought poses significant threats to agriculture, food security, and water resources. In this study, we proposed an enhanced SWDI derived from remote sensing and model data merging to enhance the precision of agricultural drought monitoring in China. The enhanced SWDI effectively captures the spatiotemporal dynamics of drought, supporting more effective agricultural drought monitoring and management strategies.
Validation against in situ soil moisture measurements indicated the superior accuracy of the merged soil moisture product, particularly in the north and northwestern regions where it significantly outperformed individual the CCI and VIC products. The merged product exhibited an average increase in correlation coefficient of 0.18 compared to the CCI product, with 85% of sites showing improved performance. Moreover, compared to the VIC product, the merged product showed an average increase in the correlation coefficient of 0.09, with over 70% of sites demonstrating enhanced accuracy.
The drought monitoring accuracy was compared between several soil moisture products based on the SWDI. The results show that the merged soil moisture product surpassed the VIC, SMAP, SMOS, and CCI products in both metrics. The POD median value of the merged product was notably higher at 0.98, and its MI value similarly excelled. Regional analysis across northwest, north, and south China confirmed the superior efficacy of the merged soil moisture, with high POD and MI values. Moreover, compared to the CCI and VIC products, the merged soil moisture-based SWDI demonstrated significant nationwide improvements, especially in the southern and northeastern regions. Despite seasonal variations, drought monitoring based on merged soil moisture maintained relatively high accuracy across the country.
The spatiotemporal characteristics of droughts from 1992 to 2018 were analyzed using the enhanced SWDI and drought-affected crop areas across various regions in China. The results indicate that northeastern and northern China faced the most severe effects, with significant fluctuations in the northeastern region around 2007 and 2009 and a peak then decline in the northern region after 2000. In contrast, the southern and southwestern regions showed more prolonged patterns of change, with the southwestern region experiencing a continuous increase in drought intensity until 2011. The Yangtze River basin saw a sharp increase in drought-affected areas in 2000, which then steadily decreased. The analysis also revealed that the SWDI outperformed the SMAPI, SMI, and SPI in monitoring accuracy, with the highest correlation being in the Yangtze River basin and the lowest being in the northeastern region. Incorporating soil moisture and soil hydraulic properties into the SWDI significantly enhanced its ability to accurately identify drought-affected areas, thereby improving agricultural drought monitoring.

Author Contributions

Conceptualization, X.W.; Methodology, X.W.; Validation, X.W.; Formal analysis, H.X.; Investigation, X.W.; Resources, G.L.; Data curation, Z.W.; Writing—original draft, X.W.; Writing—Review and editing, H.X., H.H. and T.L.; Supervision, H.H. and Z.W.; Project administration, H.H.; Funding acquisition, Z.W. and G.L. All authors have read and agreed to the published version of the manuscript.

Funding

This work is supported by the China postdoctoral science foundation (No. 2023M732317), Postdoctoral Fund Project of SIDRI (No. 2022SL831-001), Research Fund Project of SIDRI (No. 2023YF20-001), National Natural Science Foundation of China (No. U2240225).

Data Availability Statement

The original contributions presented in the study are included in the article, further inquiries can be directed to the corresponding author.

Conflicts of Interest

The authors declare no conflict of interest.

Abbreviation

For easy reading of this research, all the abbreviations were alphabetically summarized in the following table:
AWDAtmospheric Water Deficit
CCIClimate Change Initiative
CCIAClimate Change Initiative Active
CCIPClimate Change Initiative Passive
CDFCumulative Density Function
ETEvapotranspiration
ETCExtended Triple Collocation
FCField Capacity
MIMatching Index
PODProbability of Detection
PTFsPedotransfer Functions
RCorrelation Coefficient
SMSoil Moisture
SMAPSoil Moisture Active Passive
SMAPISoil Moisture Anomaly Percentage Index
SMISoil Moisture Index
SMOSSoil Moisture and Ocean Salinity
SPIStandardized Precipitation Index
TCTriple Collocation
VICVariable Infiltration Capacity
WPWilting Point

References

  1. Ault, T.R. On the essentials of drought in a changing climate. Science 2020, 6488, 256–260. [Google Scholar] [CrossRef] [PubMed]
  2. Trenberth, K.E.; Dai, A.; Schrier, G.V.D.; Jones, P.D.; Barichivich, J.; Briffa, K.R.; Sheffield, J. Global warming and changes in drought. Nat. Clim. Chang. 2014, 4, 17–22. [Google Scholar] [CrossRef]
  3. Food and Agriculture Organization. The Impact of Disasters and Crises on Agriculture and Food Security, 2017; Food and Agriculture Organization of the United Nations: Rome, Italy, 2018. [Google Scholar]
  4. Mishra, A.K.; Singh, V.P. A review of drought concepts. J. Hydrol. 2010, 391, 202–216. [Google Scholar] [CrossRef]
  5. Zeng, J.; Li, J.; Lu, X.; Wei, Z.; Shangguan, W.; Zhang, S.; Dai, Y.; Zhang, S. Assessment of global meteorological, hydrological and agricultural drought under future warming based on CMIP6. Atmos. Ocean. Sci. Lett. 2022, 15, 7. [Google Scholar] [CrossRef]
  6. Wen, W.; Ertsen, M.W.; Svoboda, M.D.; Mohsin, H. Propagation of Drought: From Meteorological Drought to Agricultural and Hydrological Drought. Adv. Meteorol. 2016, 2016, 6547209. [Google Scholar] [CrossRef]
  7. Crocetti, L.; Forkel, M.; Fischer, M.; Jureka, F.; Dorigo, W. Earth Observation for agricultural drought monitoring in the Pannonian Basin (southeastern Europe): Current state and future directions. Reg. Environ. Chang. 2020, 20, 123. [Google Scholar] [CrossRef]
  8. Grayson, M. Agriculture and drought. Nature 2013, 501, S1. [Google Scholar] [CrossRef] [PubMed]
  9. Duan, K.; Mei, Y. Comparison of Meteorological, Hydrological and Agricultural Drought Responses to Climate Change and Uncertainty Assessment. Water Resour. Manag. 2014, 28, 5039–5054. [Google Scholar] [CrossRef]
  10. Javed, T.; Li, Y.; Rashid, S.; Li, F.; Hu, Q.; Feng, H.; Chen, X.; Ahmad, S.; Liu, F.; Pulatov, B. Performance and relationship of four different agricultural drought indices for drought monitoring in China’s mainland using remote sensing data—ScienceDirect. Sci. Total Environ. 2020, 759, 143530. [Google Scholar] [CrossRef]
  11. Mao, Y.; Wu, Z.; He, H.; Lu, G.; Xu, H.; Lin, Q. Spatio-temporal analysis of drought in a typical plain region based on the soil moisture anomaly percentage index. Sci. Total Environ. 2017, 576, 752–765. [Google Scholar] [CrossRef]
  12. Hou, M.; Yao, N.; Li, Y.; Liu, F.; Biswas, A.; Pulatov, A.; Hassan, I. Better Drought Index between SPEI and SMDI and the Key Parameters in Denoting Drought Impacts on Spring Wheat Yields in Qinghai, China. Agronomy 2022, 12, 1552. [Google Scholar] [CrossRef]
  13. Martínez-Fernández, J.; González-Zamora, A.; Sánchez, N.; Gumuzzio, A. A soil water based index as a suitable agricultural drought indicator. J. Hydrol. 2015, 522, 265–273. [Google Scholar] [CrossRef]
  14. Pablos, M.; Gonz Alez-Zamora, A.; Anchez, S.N.; Mart I Nez-Fern Andez, J. Assessment of SMADI and SWDI agricultural drought indices using remotely sensed root zone soil moisture. Proc. Int. Assoc. Hydrol. Sci. 2018, 380, 55–66. [Google Scholar] [CrossRef]
  15. Chatterjee, S.; Desai, A.R.; Zhu, J.; Townsend, P.A.; Huang, J. Soil moisture as an essential component for delineating and forecasting agricultural rather than meteorological drought. Remote Sens. Environ. 2022, 269, 112833. [Google Scholar] [CrossRef]
  16. Beck, H.E.; Pan, M.; Miralles, D.G.; Reichle, R.H.; Dorigo, W.A.; Hahn, S.; Sheffield, J.; Karthikeyan, L.; Balsamo, G.; Parinussa, R.M.; et al. Evaluation of 18 satellite- and model-based soil moisture products using in situ measurements from 826 sensors. Hydrol. Earth Syst. Sci. 2021, 25, 17–40. [Google Scholar] [CrossRef]
  17. Dorigo, W.; Himmelbauer, I.; Aberer, D.; Schremmer, L.; Petrakovic, I.; Zappa, L.; Preimesberger, W.; Xaver, A.; Annor, F.; Ard O, J.; et al. The International Soil Moisture Network: Serving Earth system science for over a decade. Hydrol. Earth Syst. Sci. 2021, 25, 5749–5804. [Google Scholar] [CrossRef]
  18. Liu, H.; Jia, Y.; Niu, C.; Su, H.; Wang, J.; Du, J.; Khaki, M.; Hu, P.; Liu, J. Development and validation of a physically-based, national-scale hydrological model in China. J. Hydrol. 2020, 590, 125431. [Google Scholar] [CrossRef]
  19. Li, Z.; Leng, P.; Zhou, C.; Chen, K.; Zhou, F.; Shang, G. Soil moisture retrieval from remote sensing measurements: Current knowledge and directions for the future. Earth-Sci. Rev. 2021, 218, 103673. [Google Scholar] [CrossRef]
  20. Fang, B.; Lakshmi, V.; Bindlish, R.; Jackson, T.J.; Liu, P. Evaluation and validation of a high spatial resolution satellite soil moisture product over the Continental United States. J. Hydrol. 2020, 588, 125043. [Google Scholar] [CrossRef]
  21. Mishra, A.; Vu, T.; Veettil, A.V.; Entekhabi, D. Drought monitoring with soil moisture active passive (SMAP) measurements. J. Hydrol. 2017, 552, 620–632. [Google Scholar] [CrossRef]
  22. Wu, X.; Lu, G.; Wu, Z.; He, H.; Scanlon, T.; Dorigo, W. Triple Collocation-Based Assessment of Satellite Soil Moisture Products with In Situ Measurements in China: Understanding the Error Sources. Remote Sens. 2020, 12, 2275. [Google Scholar] [CrossRef]
  23. Gruber, A.; Scanlon, T.; van der Schalie, R.; Wagner, W.; Dorigo, W. Evolution of the ESA CCI Soil Moisture climate data records and their underlying merging methodology. Earth Syst. Sci. Data 2019, 11, 717–739. [Google Scholar] [CrossRef]
  24. Dorigo, W.; Wagner, W.; Albergel, C.; Albrecht, F.; Balsamo, G.; Brocca, L.; Chung, D.; Ertl, M.; Forkel, M.; Gruber, A.; et al. ESA CCI Soil Moisture for improved Earth system understanding: State-of-the art and future directions. Remote Sens. Environ. 2017, 203, 185–215. [Google Scholar] [CrossRef]
  25. Crow, W.T.; Berg, A.A.; Cosh, M.H.; Loew, A.; Mohanty, B.P.; Panciera, R.; de Rosnay, P.; Ryu, D.; Walker, J.P. Upscaling sparse ground-based soil moisture observations for the validation of coarse-resolution satellite soil moisture products. Rev. Geophys. 2012, 50, 2. [Google Scholar] [CrossRef]
  26. McColl, K.A.; Vogelzang, J.; Konings, A.G.; Entekhabi, D.; Piles, M.; Stoffelen, A. Extended triple collocation: Estimating errors and correlation coefficients with respect to an unknown target. Geophys. Res. Lett. 2014, 41, 6229–6236. [Google Scholar] [CrossRef]
  27. Wei, S. A China data set of soil properties for land surface modeling. J. Adv. Model. Earth Syst. 2013, 5, 212–224. [Google Scholar] [CrossRef]
  28. Dai, Y.; Shangguan, W.; Duan, Q.; Liu, B.; Fu, S.; Niu, G. Development of a China Dataset of Soil Hydraulic Parameters Using Pedotransfer Functions for Land Surface Modeling. J. Hydrometeorol. 2013, 14, 869–887. [Google Scholar] [CrossRef]
  29. Zhao, C.; Shao, M.A.; Jia, X.; Nasir, M.; Zhang, C. Using pedotransfer functions to estimate soil hydraulic conductivity in the Loess Plateau of China. Catena 2016, 143, 1–6. [Google Scholar] [CrossRef]
  30. Wu, X.; Lu, G.; Wu, Z.; He, H.; Zhou, J.; Liu, Z. An Integration Approach for Mapping Field Capacity of China Based on Multi-Source Soil Datasets. Water 2018, 10, 728. [Google Scholar] [CrossRef]
  31. Ray, R.L.; Fares, A.; Risch, E. Effects of Drought on Crop Production and Cropping Areas in Texas. Agric. Environ. Lett. 2018, 3, 170037. [Google Scholar] [CrossRef]
  32. Dietz, K.J.; Zörb, C.; Geilfus, C.M. Drought and crop yield. Plant Biol. 2021, 23, 881–893. [Google Scholar] [CrossRef] [PubMed]
  33. Liang, X.; Lettenmaier, D.P.; Wood, E.F.; Burges, S.J. A simple hydrologically based model of land surface water and energy fluxes for general circulation models. J. Geophys. Res. Atmos. 1994, 99, 14415–14428. [Google Scholar] [CrossRef]
  34. Wang, G.Q.; Zhang, J.Y.; Jin, J.L.; Pagano, T.C.; Calow, R.; Bao, Z.X.; Liu, C.S.; Liu, Y.L.; Yan, X.L. Assessing water resources in China using PRECIS projections and a VIC model. Hydrol. Earth Syst. Sci. 2012, 16, 231–240. [Google Scholar] [CrossRef]
  35. Wu, Z.; Lu, G.; Zhang, J.; Yang, Y. Simulation of Daily Soil Moisture Using VIC Model. Sci. Geogr. Sin. 2007, 27, 359–364. [Google Scholar]
  36. Hengl, T.; De Jesus, J.M.; MacMillan, R.A.; Batjes, N.H.; Heuvelink, G.B.; Ribeiro, E.; Samuel-Rosa, A.; Kempen, B.; Leenaars, J.G.; Walsh, M.G.; et al. SoilGrids1km—Global Soil Information Based on Automated Mapping. PLoS ONE 2014, 9, e105992. [Google Scholar] [CrossRef]
  37. Hengl, T.; Mendes de Jesus, J.; Heuvelink, G.B.; Ruiperez Gonzalez, M.; Kilibarda, M.; Blagotic, A.; Shangguan, W.; Wright, M.N.; Geng, X.; Bauer-Marschallinger, B.; et al. SoilGrids250m: Global gridded soil information based on machine learning. PLoS ONE 2017, 12, e0169748. [Google Scholar] [CrossRef] [PubMed]
  38. Colliander, A.; Jackson, T.J.; Bindlish, R.; Chan, S.; Das, N.; Kim, S.B.; Cosh, M.H.; Dunbar, R.S.; Dang, L.; Pashaian, L.; et al. Validation of SMAP surface soil moisture products with core validation sites. Remote Sens. Environ. 2017, 191, 215–231. [Google Scholar] [CrossRef]
  39. Kerr, Y.H.; Al-Yaari, A.; Rodriguez-Fernandez, N.; Parrens, M.; Molero, B.; Leroux, D.; Bircher, S.; Mahmoodi, A.; Mialon, A.; Richaume, P.; et al. Overview of SMOS performance in terms of global soil moisture monitoring after six years in operation. Remote Sens. Environ. 2016, 180, 40–63. [Google Scholar] [CrossRef]
  40. Stoffelen, A. Toward the true near-surface wind speed: Error modeling and calibration using triple collocation. J. Geophys. Res. Ocean. 1998, 103, 7755–7766. [Google Scholar] [CrossRef]
  41. Saxton, K.E.; Rawls, W.J. Soil Water Characteristic Estimates by Texture and Organic Matter for Hydrologic Solutions. Soil. Sci. Soc. Am. J. 2006, 70, 1569–1578. [Google Scholar] [CrossRef]
  42. Tomasella, J.; Hodnett, M. Estimating soil water retention characteristics from limited data in Brazilian Amazonia. Soil. Sci. 1998, 163, 190–202. [Google Scholar] [CrossRef]
  43. Rawls, W.J.; Pachepsky, Y.A.; Ritchie, J.C.; Sobecki, T.M.; Bloodworth, H. Effect of soil organic carbon on soil water retention. Geoderma 2003, 116, 61–76. [Google Scholar] [CrossRef]
  44. Wosten, H.; Pachepsky, Y.; Rawls, W.J. Pedotransfer functions: Bridging the gap between available basic soil data and missing soil hydraulic characteristics. J. Hydrol. 2001, 251, 123–150. [Google Scholar] [CrossRef]
  45. Saxton, K.E.; Rawls, W.J.; Romberger, J.S.; Papendick, R.I. Estimating Generalized Soil-water Characteristics from Texture. Soil. Sci. Soc. Am. J. 1986, 50, 1031–1036. [Google Scholar] [CrossRef]
  46. Bagarello, V.; Castellini, M.; Di Prima, S.; Iovino, M. Soil hydraulic properties determined by infiltration experiments and different heights of water pouring. Geoderma 2014, 213, 492–501. [Google Scholar] [CrossRef]
  47. Hodnett, M.G.; Tomasella, J. Marked differences between van Genuchten soil water-retention parameters for temperate and tropical soils: A new water-retention pedo-transfer functions developed for tropical soils. Geoderma 2002, 108, 155–180. [Google Scholar] [CrossRef]
  48. Hunt, E.D.; Hubbard, K.G.; Wilhite, D.A.; Arkebauer, T.J.; Dutcher, A.L. The development and evaluation of a soil moisture index. Int. J. Climatol. 2010, 29, 747–759. [Google Scholar] [CrossRef]
  49. Pan, X.; QIU, Q.; Li, J.; Wang, J.; He, Q.; Su, Y.; Ma, J.; Du, K. Physiological indexes of six plant species from the tibetan plateau under drought stress. Acta Ecol. Sin. 2014, 34, 3558–3567. [Google Scholar] [CrossRef]
  50. Wu, J.; Zhou, L.; Liu, M.; Zhang, J.; Leng, S.; Diao, C. Establishing and assessing the Integrated Surface Drought Index (ISDI) for agricultural drought monitoring in mid-eastern China. Int. J. Appl. Earth Obs. 2013, 23, 397–410. [Google Scholar] [CrossRef]
  51. An, X.; Wu, J. Assessing the relative soil moisture for agricultural drought monitoring in Northeast China. Geogr. Res-Aust. 2017, 36, 837–849. [Google Scholar]
  52. Xu, Z.; Wu, Z.; He, H.; Guo, X.; Zhang, Y. Comparison of soil moisture at different depths for drought monitoring based on improved soil moisture anomaly percentage index. Water Sci. Eng. 2021, 14, 171–183. [Google Scholar] [CrossRef]
  53. Laimighofer, J.; Laaha, G. How standard are standardized drought indices? Uncertainty components for the SPI & SPEI case. J. Hydrol. 2022, 613, 128385. [Google Scholar] [CrossRef]
  54. Bhardwaj, K.; Mishra, V. Drought detection and declaration in India. Water Secur. 2021, 14, 100104. [Google Scholar] [CrossRef]
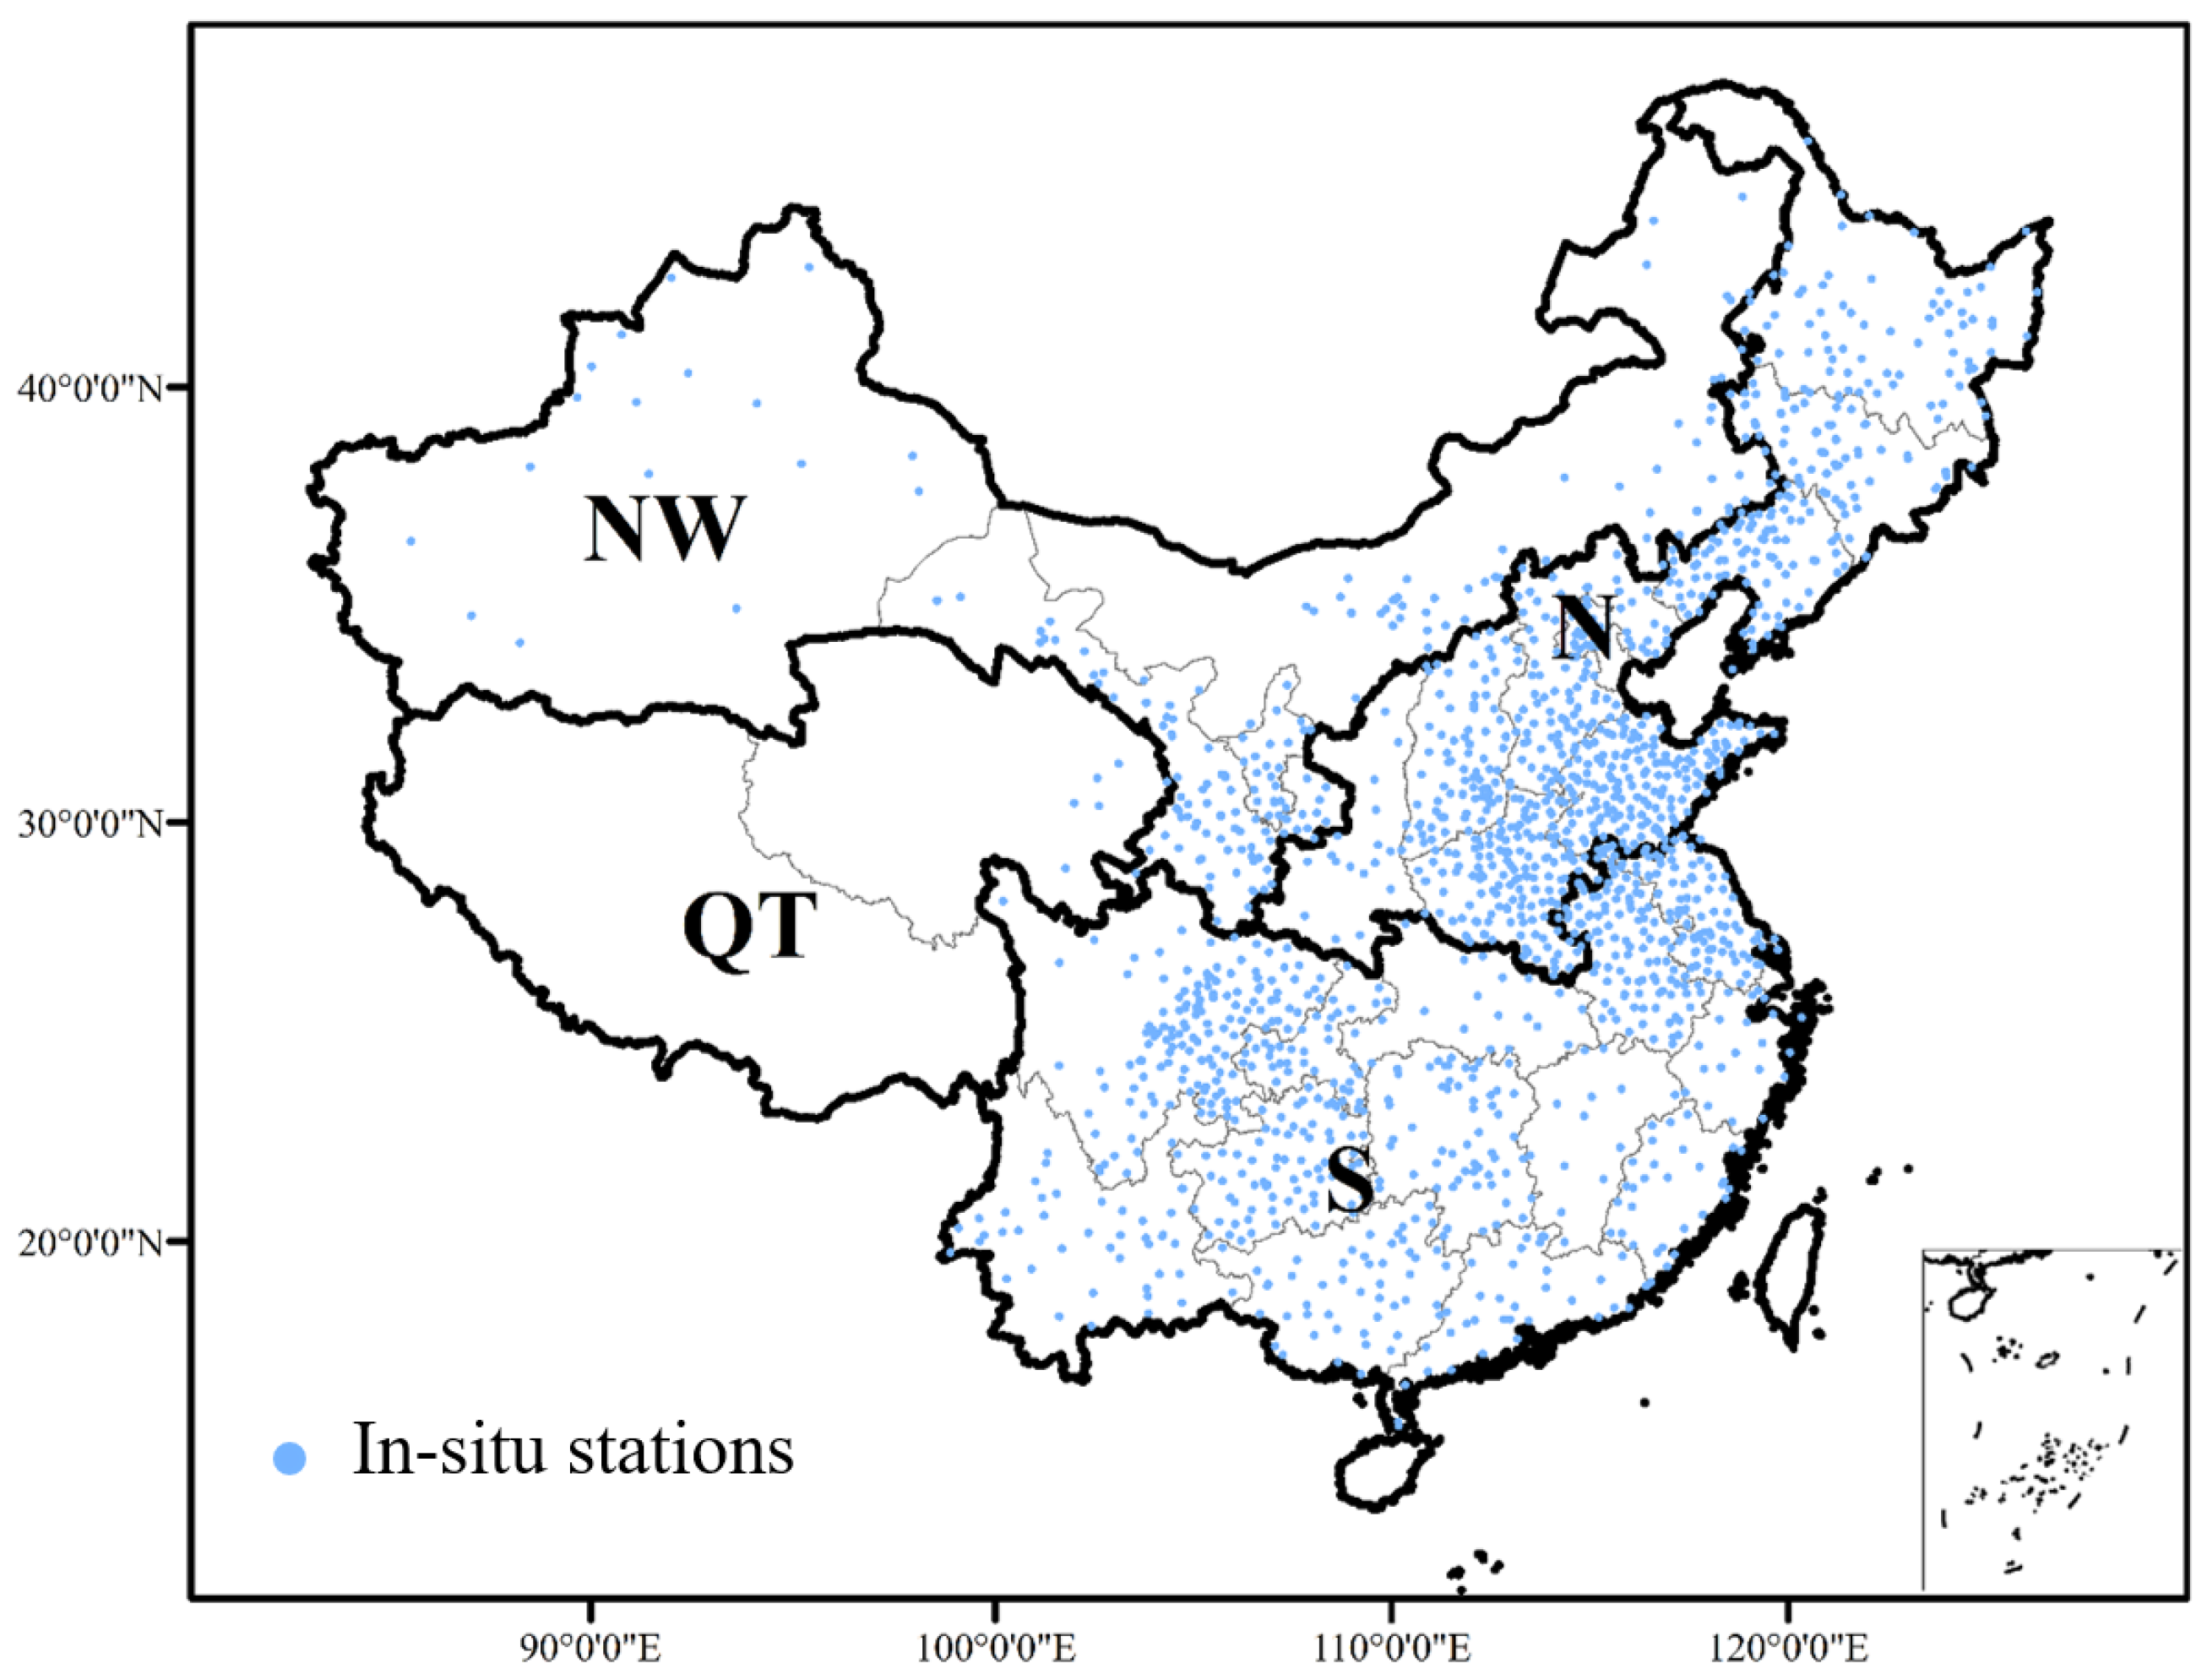
Figure 1. The spatial distribution of in situ soil moisture stations in China. N represents north China, NW represents the northwest China, QT represents the Qinghai−Tibet plateau, S represents south China.
Remotesensing 16 02156 g001
Figure 2. The research area map of the study. The uppercase letters represent six crop divisions and their corresponding provinces. NT for the northwestern and Qinghai−Tibet plateau, NE for northeastern China, N for northern China, YZ for the Yangtze River basin in China, SW for southwestern China, S for southern China.
Remotesensing 16 02156 g002
Figure 3. Technical framework for the drought index development and results analysis.
Remotesensing 16 02156 g003
Figure 4. The spatial distribution map of (a) CCIA, (b) CCIP, (c) VIC Correlation coefficient based on ETC.
Remotesensing 16 02156 g004
Figure 5. The spatial distribution map of (a) CCIA, (b) CCIP, (c) VIC weight based on ETC.
Remotesensing 16 02156 g005
Figure 6. The difference in correlation coefficients between the merged products and in situ soil moisture compared to the correlation coefficients between (a) VIC products, (b) CCI product, and in situ soil moisture.
Remotesensing 16 02156 g006
Figure 7. The percentage improvement in accuracy by merged products compared to (a) VIC, (b) CCI using the correlation coefficient as a metric (%).
Remotesensing 16 02156 g007
Figure 8. Boxplot of the correlation coefficient between (a) CCI, (b) VIC, (c) merged soil moisture and in situ soil moisture in different regions. Horizontal lines of the box indicate the 25th percentiles, median, and 75th percentiles, respectively. Whiskers indicate the minimum and maximum values. The hollow point in the box represents the mean of the corresponding correlation coefficient. All singular values have been removed.
Remotesensing 16 02156 g008
Figure 9. The spatial distribution map of (a) field capacity and (b) wilting point across China. The same colorbar is used for both field capacity and wilting point distribution.
Remotesensing 16 02156 g009
Figure 10. Boxplot of drought accuracy evaluation using merged, VIC, SMAP, SMOS, CCI soil moisture product-based SWDIs considering (a) POD and (b) MI. Horizontal lines of the box indicate the 25th percentiles (blue line), median (red line), and 75th percentiles (blue line), respectively. Whiskers (black line) indicate the minimum and maximum values.
Remotesensing 16 02156 g010
Figure 11. The spatial distribution of correlation coefficient between AWD and (a) CCI, (b) VIC, (c) merged soil moisture-based SWDI.
Remotesensing 16 02156 g011
Figure 12. The distribution map for the difference in correlation coefficients between (a) merged-based SWDI and AWD compared to (a) CCI-based SWDI and AWD, and (b) VIC-based SWDI and AWD.
Remotesensing 16 02156 g012
Figure 13. Boxplot of correlation coefficient between CCI, VIC, merged soil moisture-based SWDI and AWD over the northwest, Tibet, north and south China.
Remotesensing 16 02156 g013
Figure 14. The spatial distribution of correlation coefficient between the merged soil moisture-based SWDI and AWD in (a) spring, (b) summer, (c) autumn, (d) winter.
Remotesensing 16 02156 g014
Figure 15. Time series of drought-affected crop area (in units of ten thousand hectares), SWDI drought intensity, drought tendency in (a) mainland China, (b) northeastern, (c) northern, (d) southwestern, (e) Yangtze River basin, (f) southern China from 1992 to 2018. The drought tendency is calculated by a 5-year moving window average.
Remotesensing 16 02156 g015
Table 1. Categories of each drought index.
AWDSPISWDISMISMAPI
No drought>0>−0.5>0>60>−0.05
DroughtLight ≤0−1.0~−0.5−2~050~60−0.15~−0.05
Moderate −1.5~−1.0−5~−240~50−0.20~−0.15
Severe −2.0~−1.5−10~−530~40−0.25~−0.20
Extreme ≤−2.0≤−10≤30≤−0.25
Table 2. The averaged POD of different soil moisture product-based SWDIs over northwest, north, and south China regions. The darker the red background color, the higher the correlation coefficient. The bold number represents the drought index with the highest correlation coefficient in this crop region.
PODNorthwestNorthSouth
Merged0.950.960.93
VIC0.810.870.83
SMAP0.890.920.86
SMOS0.760.810.73
CCI0.83 0.890.84
Table 3. Averaged MI of different soil moisture product-based SWDIs over northwest, north, and south China regions. The darker the red background color, the higher the correlation coefficient. The bold number represents the drought index with the highest correlation coefficient in this crop region.
MINorthwestNorthSouth
Merged0.310.390.29
VIC0.180.260.22
SMAP0.360.270.28
SMOS0.180.150.23
CCI0.18 0.250.22
Table 4. Comparison of correlation coefficient between drought-affected crop area and drought intensity of SWDI, SMI, SMAPI and SPI in different crop regions of China. The bold number represents the drought index with the highest correlation coefficient in this crop region.
|R|ChinaNortheasternNorthernSouthwesternYangtze RiverSouthern
SWDI0.880.690.880.750.890.76
SMI0.830.690.850.740.850.74
SMAPI0.810.690.820.730.790.75
SPI0.510.130.430.630.320.34
Disclaimer/Publisher’s Note: The statements, opinions and data contained in all publications are solely those of the individual author(s) and contributor(s) and not of MDPI and/or the editor(s). MDPI and/or the editor(s) disclaim responsibility for any injury to people or property resulting from any ideas, methods, instructions or products referred to in the content.