Article

Spatiotemporal Variability of Gross Primary Productivity in Türkiye: A Multi-Source and Multi-Method Assessment

by
Eyyup Ensar Başakın
1,2,*,
Paul C. Stoy
2,
Mehmet Cüneyd Demirel
1 and
Quoc Bao Pham
3
1
Hydraulics Division, Civil Engineering Department, Istanbul Technical University, Istanbul 34469, Türkiye
2
Department of Biological Systems Engineering, University of Wisconsin-Madison, Madison, WI 53706, USA
3
Faculty of Natural Sciences, Institute of Earth Sciences, University of Silesia in Katowice, Będzińska Street 60, 41-200 Sosnowiec, Poland
*
Author to whom correspondence should be addressed.
Remote Sens. 2024, 16(11), 1994; https://doi.org/10.3390/rs16111994
Submission received: 16 April 2024 / Revised: 20 May 2024 / Accepted: 28 May 2024 / Published: 31 May 2024
(This article belongs to the Special Issue Remote Sensing of Carbon Fluxes and Stocks II)

Abstract

:
We investigated the spatiotemporal variability of remotely sensed gross primary productivity (GPP) over Türkiye based on MODIS, TL-LUE, GOSIF, MuSyQ, and PMLV2 GPP products. The differences in various GPP products were assessed using Kruskal–Wallis and Mann–Whitney U methods, and long-term trends were analyzed using Modified Mann–Kendall (MMK), innovative trend analysis (ITA), and empirical mode decomposition (EMD). Our results show that at least one GPP product significantly differs from the others over the seven geographic regions of Türkiye (χ2 values of 50.8, 21.9, 76.9, 42.6, 149, 34.5, and 168; p < 0.05), and trend analyses reveal a significant increase in GPP from all satellite-based products over the latter half of the study period. Throughout the year, the average number of months in which each dataset showed significant increases across all study regions are 6.7, 8.1, 5.9, 9.6, and 8.7 for MODIS, TL-LUE, GOSIF, MuSyQ, and PMLV2, respectively. The ITA and EMD methods provided additional insight into the MMK test in both visualizing and detecting trends due to their graphical techniques. Overall, the GPP products investigated here suggest ‘greening’ for Türkiye, consistent with the findings from global studies, but the use of different statistical approaches and satellite-based GPP estimates creates different interpretations of how these trends have emerged. Ground stations, such as eddy covariance towers, can help further improve our understanding of the carbon cycle across the diverse ecosystem of Türkiye.

1. Introduction

Gross primary productivity (GPP) represents the carbon taken up by the biosphere that can be used for biotic processes. Understanding its changes across space and time is crucial in understanding our changing planet, as it is the largest component of the global carbon budget [1]. GPP has been increasing across much of the globe due, in large part, to global greening [2,3] and CO2 fertilization [4], and it is predicted to increase further throughout the 21st century [5]. Simultaneously, water limitation is playing an increasing role in controlling GPP at interannual to decadal time scales [6], often dampening its response to otherwise favorable climatic conditions [7].
Satellite remote sensing has revolutionized our ability to estimate GPP [8,9,10] and is particularly important for understanding its changes in areas where ground observations are sparse. Interpreting GPP from space can be difficult because different interpretations can result from different GPP data products [11,12,13] and from different statistical methods for time series analysis [14,15,16,17]. Multi-method comparisons can help reduce uncertainties, critique methods, and lend confidence that results are robust [18]. Doing so across diverse regions can further help understand how, why, and where GPP is changing, and where our interpretations of changes are insensitive to a chosen satellite product or methodological approach, thereby requiring additional study for more robust inference.
The calculation of trends over time for any natural phenomenon can employ parametric or non-parametric methods (or both). Among the parametric methods, linear regression is the most frequently used. Despite numerous studies predicting the trend of GPP values using linear regression [19,20,21,22], researchers tend to prefer non-parametric methods such as the Mann–Kendall, Sen’s Slope, and Spearman’s Rho due to the preconditions of linear regression, including the assumption of normal distributions, homoscedasticity, and the absence of multicollinearity [4,23,24]. Certain details, which conventional methods struggle to elucidate, can be examined through graphical methods such as Innovative Trend Analysis (ITA) and Empirical Mode Decomposition (EMD). Contrary to conventional methods, ITA and EMD provide detailed information on the fluctuations of the trend over time and, in our case, the tendencies of trends at low, medium, and high GPP values. Utilizing over-simplified methods to deduce the trend in GPP values may omit significant details.
GPP varies dynamically across multiple scales in time, but studies tend to conduct trend analyses of annual GPP values. For example, the annual trend of GPP values has been investigated in studies where the entire Earth is considered as the study area [25,26], in studies for China [27,28,29,30], in studies for India [21,31] and in studies for Australia [32]. While this may provide acceptable results for the study at hand, the trend of monthly GPP values over time is important in natural areas, and especially in cultivated agricultural areas, for understanding trends in productivity and investigating changes in seasonal patterns that may have management implications [33]. Annual GPP values represent the whole year after a single value has been obtained by averaging or summing, and do not explicitly consider variations during periods that are sensitive to plant growth including agricultural activity. The second innovation in this study, in addition to the multi-trend analysis, is the trend analysis of monthly GPP values.
Here, we compare multiple satellite-based GPP estimates and multiple approaches for time series analysis to interpret decadal-scale GPP trends, using the diverse geography and vegetation of the Republic of Türkiye as a case study. Türkiye has relatively sparse observations from the eddy covariance of surface–atmosphere carbon dioxide exchange from which GPP can be inferred [34,35,36], emphasizing the importance of satellite remote sensing in interpreting carbon cycling dynamics [37]. It also has a relatively large and growing population and a changing climate with increases in temperature and atmospheric heat content [38]. Precipitation has been increasing in parts of the north and east and decreasing in the west [39,40], with an expansion of semi-arid regions [41] and predicted future declines in precipitation throughout the country [42,43]. Carbon cycle processes have changed in response to changes in aridity across different parts of Türkiye [44,45], further emphasizing the importance of understanding trends in GPP. Here, we analyze multi-decadal time series from six different GPP products across the seven different regions of Türkiye, employing various trend analysis methods, both standard and novel, to interpret patterns. In this study, alongside the conventional trend method (Mann–Kendall), the simultaneous interpretation of two graphical trend methods (ITA and EMD) aims to develop an original methodology in ecological and carbon cycle studies. This approach is designed to prevent the over-simplification of trend analyses, thereby identifying trends with higher temporal resolution. In addition, we aim to provide insight into how key components of the carbon cycle of Türkiye have been changing and to provide a framework for multi-method approaches for understanding these changes.

2. Materials

2.1. Study Area

Türkiye is located at the crossroads of Europe and Asia and between 36° and 42° North and 26° and 45° East. The total land area of the country is approximately 780,000 km2 and elevation above sea level (asl) generally increases from west to east [46]. Four main climate types—Mediterranean, Continental, Marmara (Transition), and Black Sea—are observed across Türkiye. The Mediterranean climate is characterized by hot and dry summers and mild and rainy winters. The Continental climate, corresponding to the Dsa category in the Köppen climate classification, is found in the mountainous parts of the eastern region, southeast region, and inner region of Türkiye [47], characterized by hot summers and cold winters. The Marmara region serves as an ecological and climatic intermediary, bridging the Mediterranean climate found in the south with the Continental climate of the north. The average annual temperatures are 14.5 °C in the eastern part of the Marmara region and 13.6 °C in the north. While summer temperatures (in July) vary around 25 °C along the coasts, these values tend to decrease in the inland areas [48]. The Black Sea region receives relatively high precipitation throughout the year and its eastern coast experiences the most rainfall, with more than 2200 mm annually, whereas the central Anatolian region only receives about 400 mm each year (Figure 1b). The warmest areas are along the Mediterranean and Aegean coasts, as well as in the southern and southeastern parts of Türkiye, where average temperatures are consistently higher than in the rest of the country (Figure 1c). The land cover map related to the study area is provided in Figure 1a. Combined, these differences in climate and vegetation create unique opportunities to study nationwide trends in GPP.
Türkiye is divided into seven different geographical regions—Aegean, Black Sea, Central Anatolia, Eastern Anatolia, Marmara, Mediterranean, and Southeastern Anatolia. These regions are defined based on similarities and differences in climatic and topographic characteristics [49]. To provide a comprehensive understanding for the entirety of the country, we selected one location from each region to study trends in GPP using multiple remote sensing-based estimates. The criteria for the selection of grids from which GPP values are obtained encompass areas that are typically distant from residential areas in the regions with the most significant agricultural activity in their respective geographical locations.

2.2. GPP Datasets

This section provides relevant information regarding the GPP datasets as well as the methods that they use to estimate GPP; additional details are provided in the Supplementary Materials. To ascertain whether the similarity among GPP datasets can be analyzed using parametric methods, an analysis was also conducted to determine whether these datasets are normally distributed using the Shapiro–Wilk test, with a null hypothesis that the data are normally distributed at the α < 0.05 level. The map representing GPP values for 7 different points used as a study area is presented in Figure 2. In the study, due to the different temporal and spatial resolutions of the utilized datasets, monthly averages have been adopted for temporal resolution for comparison. The spatial resolution varies, with the highest being 0.05 degrees and the lowest 0.5 degrees. In the selection of spatial resolution, a lower resolution value was chosen, and for datasets with higher resolutions, averages of 10 × 10 grids corresponding to 0.5 × 0.5 degrees in the selected area were calculated. Descriptive information pertaining to the datasets used in the study is presented in Table 1.

2.2.1. MODIS

The Moderate Resolution Imaging Spectroradiometer (MODIS), launched into space on the Terra satellite in 1999 and on the Aqua satellite in 2002, is designed to observe the Earth’s surface, atmosphere, and oceans. One of the key functions of MODIS is to regularly measure the carbon dioxide uptake of the Earth’s terrestrial vegetation through GPP products [51,52] that are generated by calculating the daily net photosynthesis values of plants and combining these values over 8-day observation intervals throughout the year at 1 km (MOD17). The MODIS GPP algorithm, developed by Running et al. [53], is based on the Light Use Efficiency (LUE) concept originally proposed by Monteith [54] and depends on the type of vegetation in a specific area and the amount of sunlight absorbed for photosynthesis. The MODIS GPP data used in the study were provided by [55]. The flowchart for obtaining MODIS GPP values is given in Figure S1.

2.2.2. MuSyQ

The Multisource Data Synergized Quantitative (MuSyQ) algorithm employs methods similar to the MODIS GPP algorithm, but it differentiates itself by using multiple remote sensing products and implementing certain improvements in the calculation of the LUE by taking into account the finding that the LUE for diffuse solar radiation is higher than for direct solar radiation [56]. Particularly in cloudy regions, and in tropical, evergreen broadleaf forests, the accuracy of GPP predictions can be enhanced by incorporating the clearness index (CI) into the LUE estimation. The MuSyQ dataset was provided by [57]. The flowchart of the MuSyQ algorithm is provided in Figure S2.

2.2.3. PMLV2

The Penman–Monteith–Leuning (PML) model was initially developed by Leuning [58] and introduced a biophysical model for surface conductance (Gs) based on the Penman–Monteith (PM) equation [59]. Since then, there have been two improved versions of the PML model: PML-V1 and PML-V2. The PML-V2 employs a biophysical canopy conductance (Gc) model to combine Evapotranspiration (ET) with GPP, as described by Gan et al. [60]. To streamline the model, it retains only essential parameters that are of physiological significance for stomatal response and assimilation [61]. Unlike PML-V1, PML-V2 takes into account the effects of increasing Leaf Area Index (LAI), rising CO2 levels, and climate forcing on ET and GPP [62]. PML-V2 products consist of five components: GPP, vegetation transpiration (Ec), soil evaporation (Es), evaporation of intercepted rainfall (Ei), and the evaporation from ice, snow, and water bodies (ETwater) (see [13,63]). The PMLV2 dataset used here was provided by Zhang et al. [64].

2.2.4. TL-LUE

The two-leaf light use efficiency (TL-LUE) model calculates the GPP of sunlit and shaded leaves separately and sums them along the canopy [65]. The revised (TL-LUE) adds an atmospheric CO2 concentration regulation scalar and modifies the air temperature regulation scalar [50]. TL-LUE GPP values were obtained from the study by [66].

2.2.5. GOSIF

The GOSIF GPP product is generated from solar-induced chlorophyll fluorescence (SIF) data based on the relationship between SIF and GPP across various vegetation types, utilizing data from the Orbiting Carbon Observatory-2 (OCO-2), MODIS, and meteorological data from the Modern-Era Retrospective analysis for Research and Applications (MERRA-2). Developed by Li and Xiao [67], this product has a spatial resolution of 0.05° and offers temporal resolutions of 8 days, monthly, and annually. The GOSIF GPP dataset has been validated through comparisons with independent flux tower data, demonstrating high precision and the ability to effectively represent spatiotemporal variations in large-scale GPP [68]. This validation, which considered each biome separately, confirmed the dataset’s accuracy in representing photosynthetic activity, particularly in grassland ecosystems. The monthly GOSIF GPP values were provided by Li and Xiao [67].

2.2.6. FLUXCOM

FLUXCOM is an initiative formed through the collaboration of various experts, aiming to understand uncertainties in empirical scaling and to present global GPP values based on machine learning [69]. In FLUXCOM, a variety of machine learning-based regression tools, such as model tree ensembles, multiple adaptive regression splines, artificial neural networks, and kernel methods, are used. This study aims to estimate CO2 and energy fluxes using two different scaling strategies: (1) 8-day average fluxes based solely on remotely sensed data and (2) daily average fluxes based on remotely sensed and meteorological data. Machine learning (ML) approaches have been applied and extensively cross-validated with flux towers for both setups, and it is important to note that FLUXCOM was designed to not have trends in the “RS + METEO” products used here [70]. For the calibration of GPP values in the study, FLUXNET GPP values were used. The dataset was obtained from http://www.fluxdata.org (accessed on 11 December 2023).
Due to the varying lengths of these time series across datasets, the start date of the latest commencing dataset, GOSIF, was chosen as the baseline start date. Similarly, the end date of the earliest finishing dataset, PMLV2, was used as the overall end date to enable more accurate comparisons between the datasets.

2.3. Validation of GPP Datasets

Validating a new global dataset is a challenging process, as ideal validation would involve measuring daily GPP across a diverse range of biomes and climates. An algorithm successful in a coniferous forest might be inadequate in a tropical savanna. Therefore, a global array of validation sites is necessary. More fundamentally, each available measurement for validating GPP represents a different spatial scale and presents unique limitations [71]. Three types of data appear useful for validating global GPP data: direct measurements of biomass [72], tower flux measurements [73], and measurements of atmospheric CO2 concentrations [74]. However, each data type has limited precision or scope. Direct biomass measurements of GPP are typically measured on an annual basis (or longer) and the sample area is often less than 1 hectare [53], with uncertain carbon losses due to respiration. Tower flux measurements are continuous over time and sample a footprint that may be of a similar spatial extent to a 1 km pixel of satellite images, but towers only directly measure NEE, such that deriving GPP requires additional modelling and subsequent assumptions. Measurements of atmospheric CO2 concentrations integrate over a large, difficult-to-define land area and include anthropogenic CO2 emissions and are often collected through a monthly repeat snapshot sampling process. In short, no measure matches the detail represented by GPP in terms of time, space, and ecosystem characteristics.
A network called FLUXNET, comprising hundreds of tower sites across all continents and biome types, provides accurate seasonal measurements about vegetation carbon uptake and local land CO2 balances [75]. These towers enable validation of GPP values derived from remote sensing products.
The MODIS GPP dataset was validated using all station data in the FLUXNET network. The MuSyQ dataset was validated using measurements from stations in the BigFoot and FLUXNET networks [56]. For the PMLV2 GPP dataset, 26 EC towers selected in China covering 9 PFTs were used and a Genetic Algorithm was employed during the calibration process [76]. The TL-LUE model utilized 68 towers from the FLUXNET network for calibration and 25 for validation [50]. The GOSIF dataset was developed using 91 FLUXNET sites and has been tested for 10 different biome types with satisfactory results [67]. The FLUXCOM dataset was developed using current machine learning techniques and information from 224 towers in the FLUXNET system to represent 15 different PFTs [69]. Detailed technical information on how the GPP datasets used in the study were calculated by the developers is shared in the Supplementary Materials.

3. Methods

3.1. Kruskal–Wallis and Mann–Whitney U

The Kruskal–Wallis test is used for comparing the median values of data obtained from different groups [77]. This non-parametric statistical method is preferred, especially when the data are not normally distributed or when sample sizes are small [78]. The Kruskal–Wallis test investigates the hypothesis that K groups of samples originate from a single statistical population, or from comparable statistical populations, with respect to their means [79].
After the Kruskal–Wallis test identifies that at least one group is different, the Mann–Whitney U test can be applied for pairwise comparisons between groups. (This test is also referred to as Wilcoxon’s rank sum [80].) The Mann–Whitney U (MWU) test combines the data from two groups to form an overall ranking [81] to jointly assess data from both groups and calculate rank sums. The test statistic is then determined based on the rank sums of both groups and the number of observations in each group and used to test whether there is a significant difference between the group medians.

3.2. Modified Mann–Kendal Test

The Mann–Kendall test is a widely used method for detecting trends in time series data [15]. It does not account for autocorrelation (the correlation between consecutive observations in a time series), which can lead to misleading results. The Modified Mann–Kendall (MMK) test is designed to reduce the effects of autocorrelation [82]. This test constitutes the fundamental principles of the original Mann–Kendall test while considering the presence of autocorrelation. The specific equations of the MMK test are similar to those of the original Mann–Kendall test but include some additions and corrections to account for autocorrelation. Detailed information about MMK can be accessed in Berhanu et al.’s study [83].

3.3. Innovative Trend Analysis

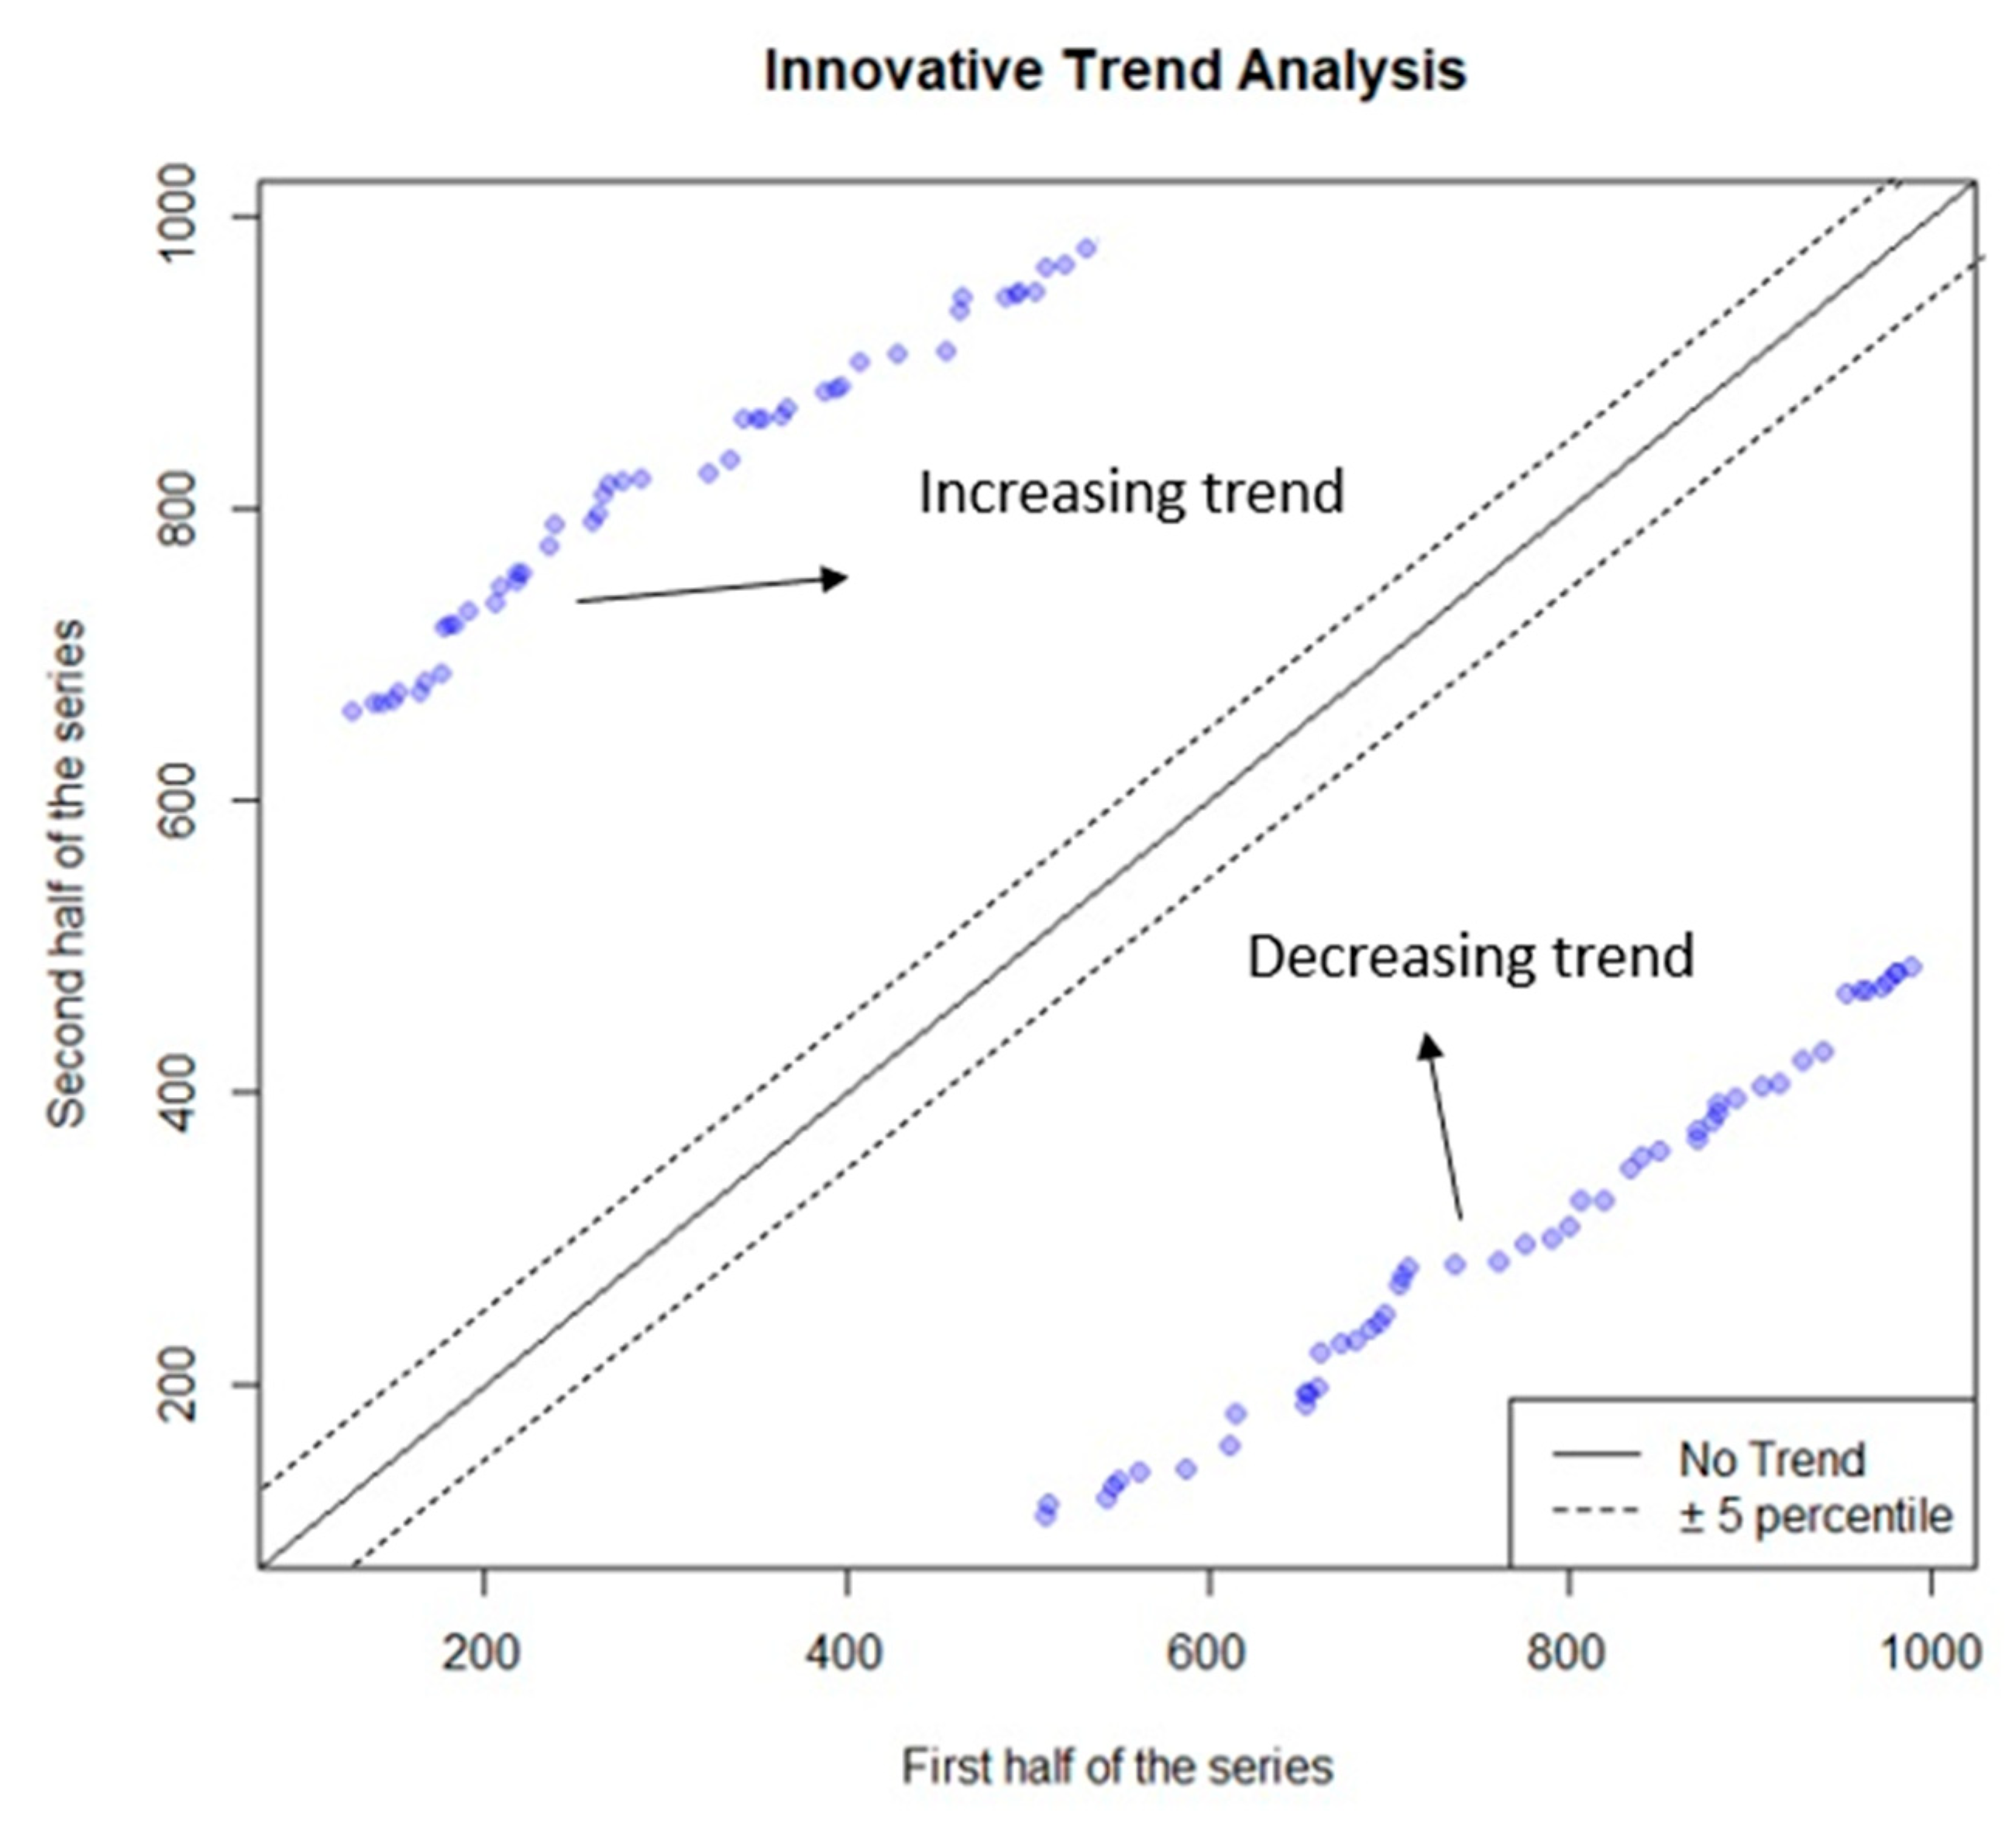
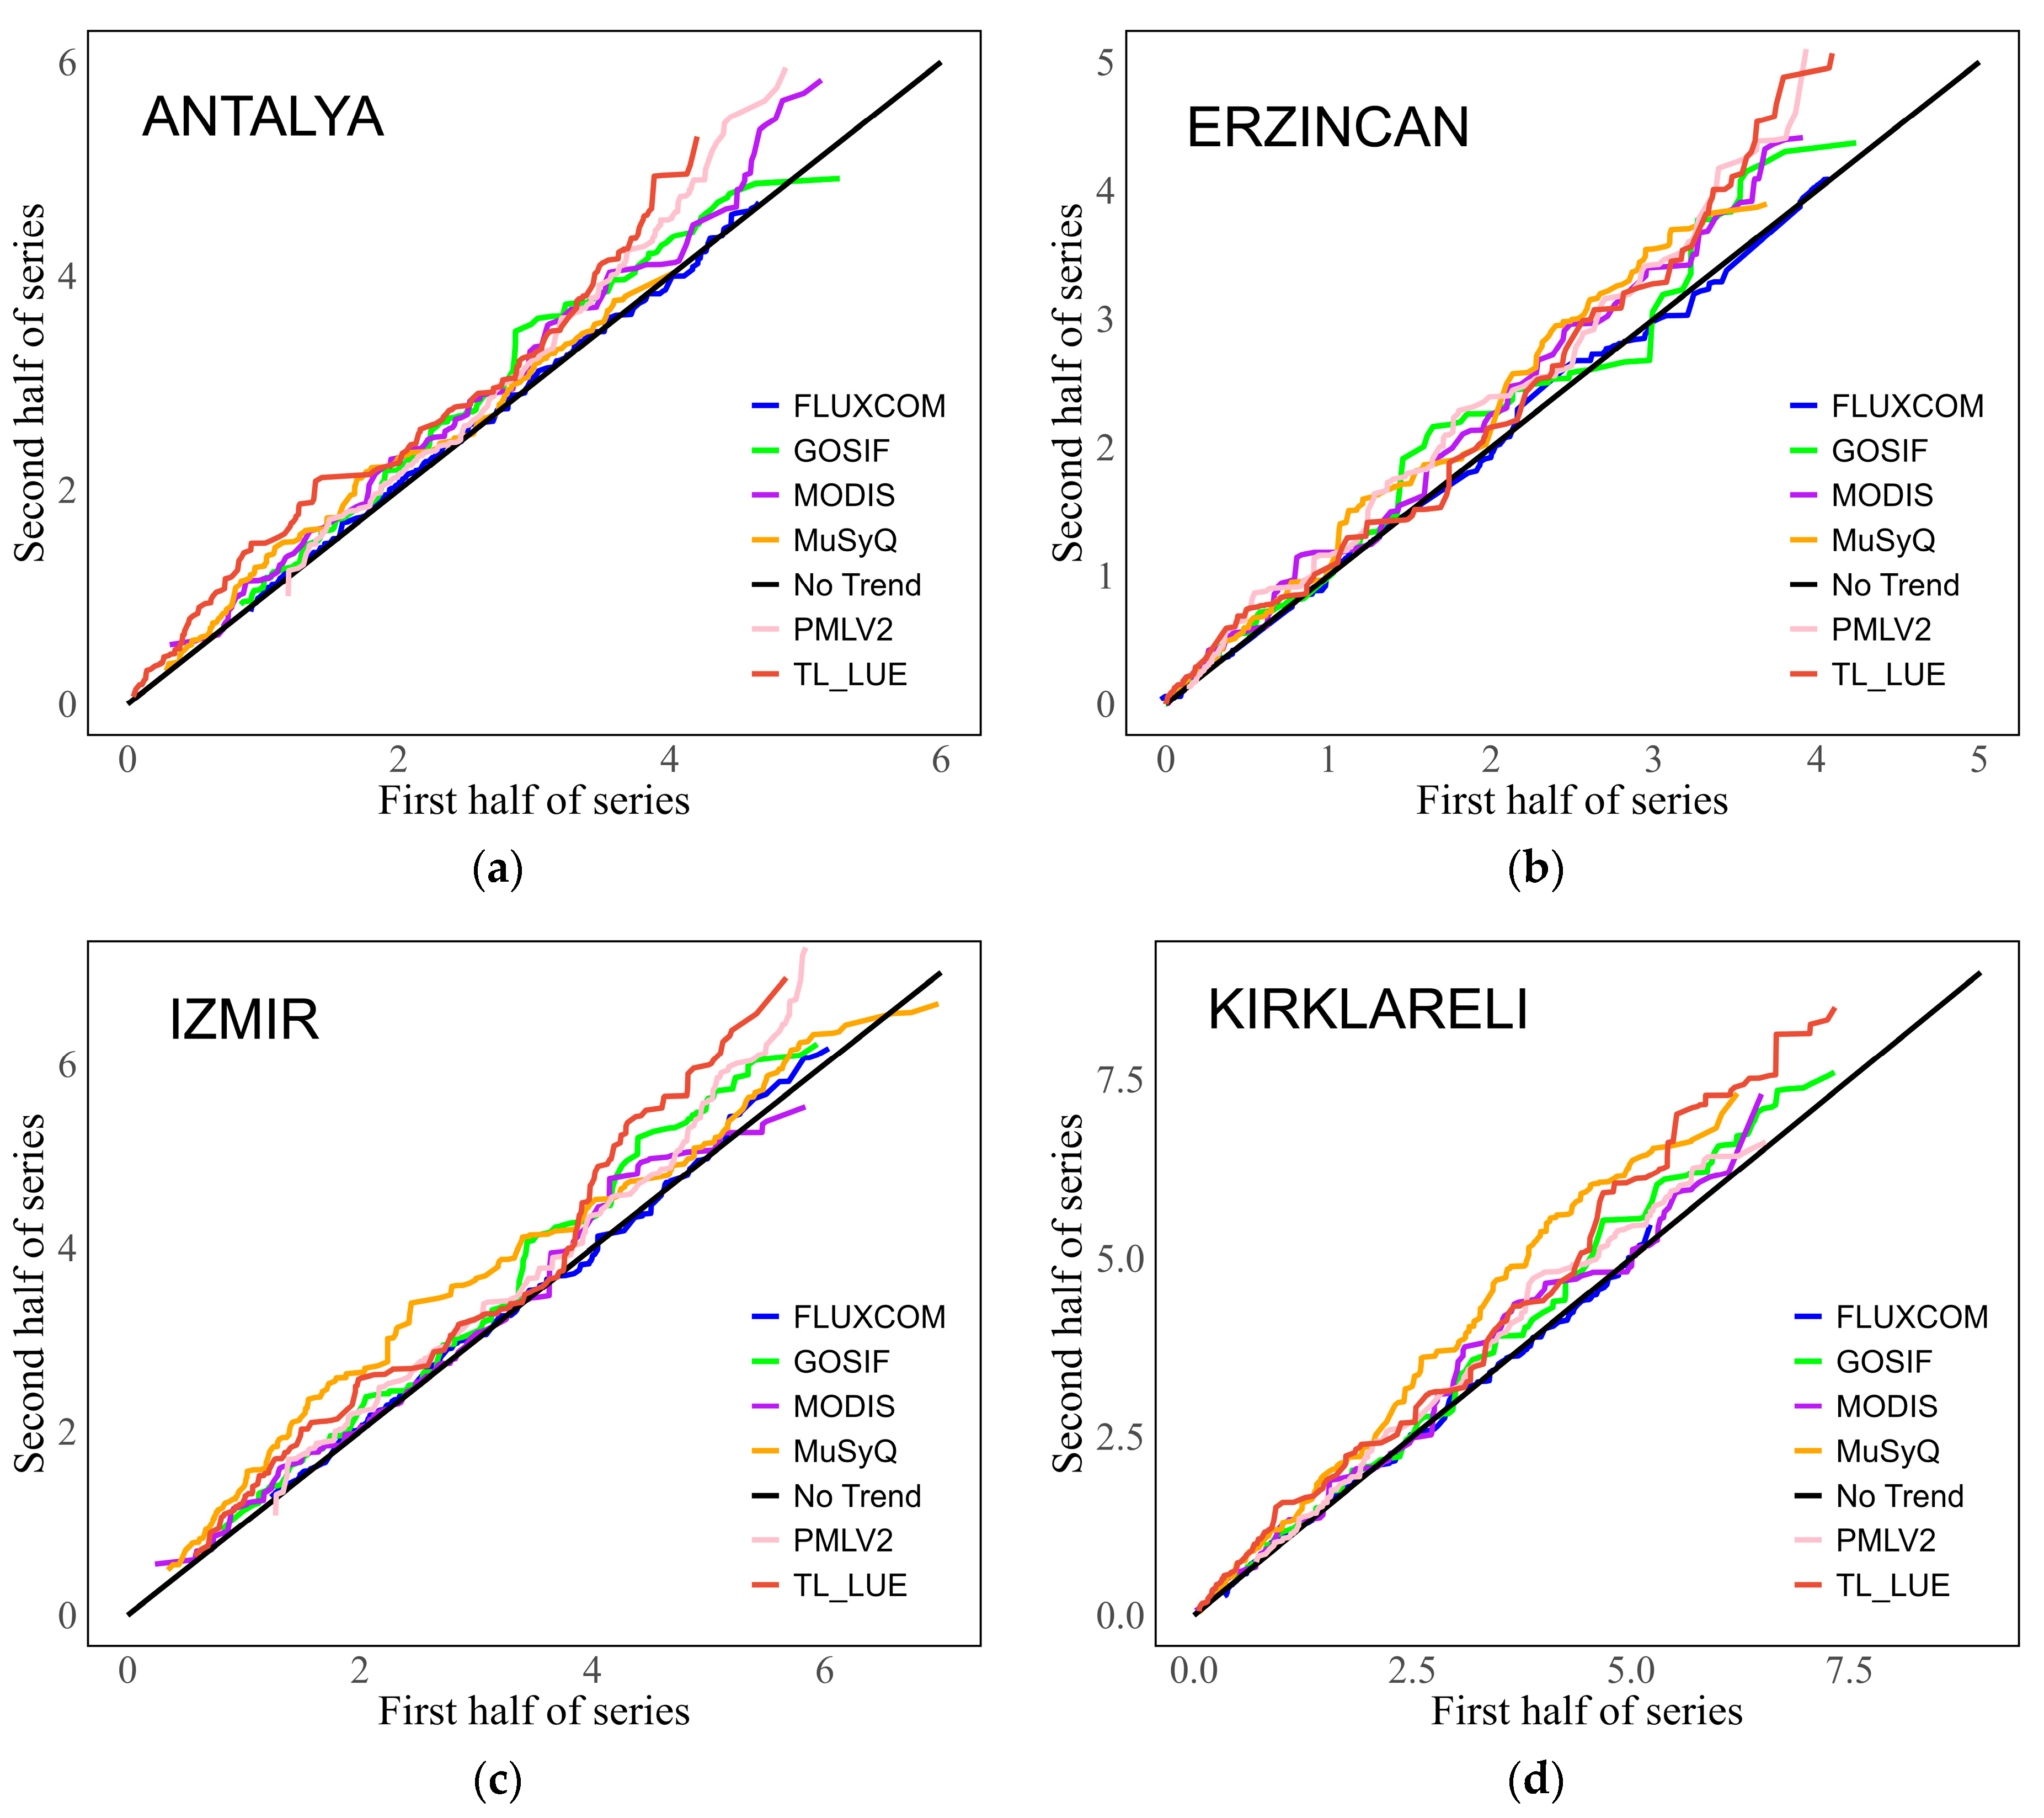
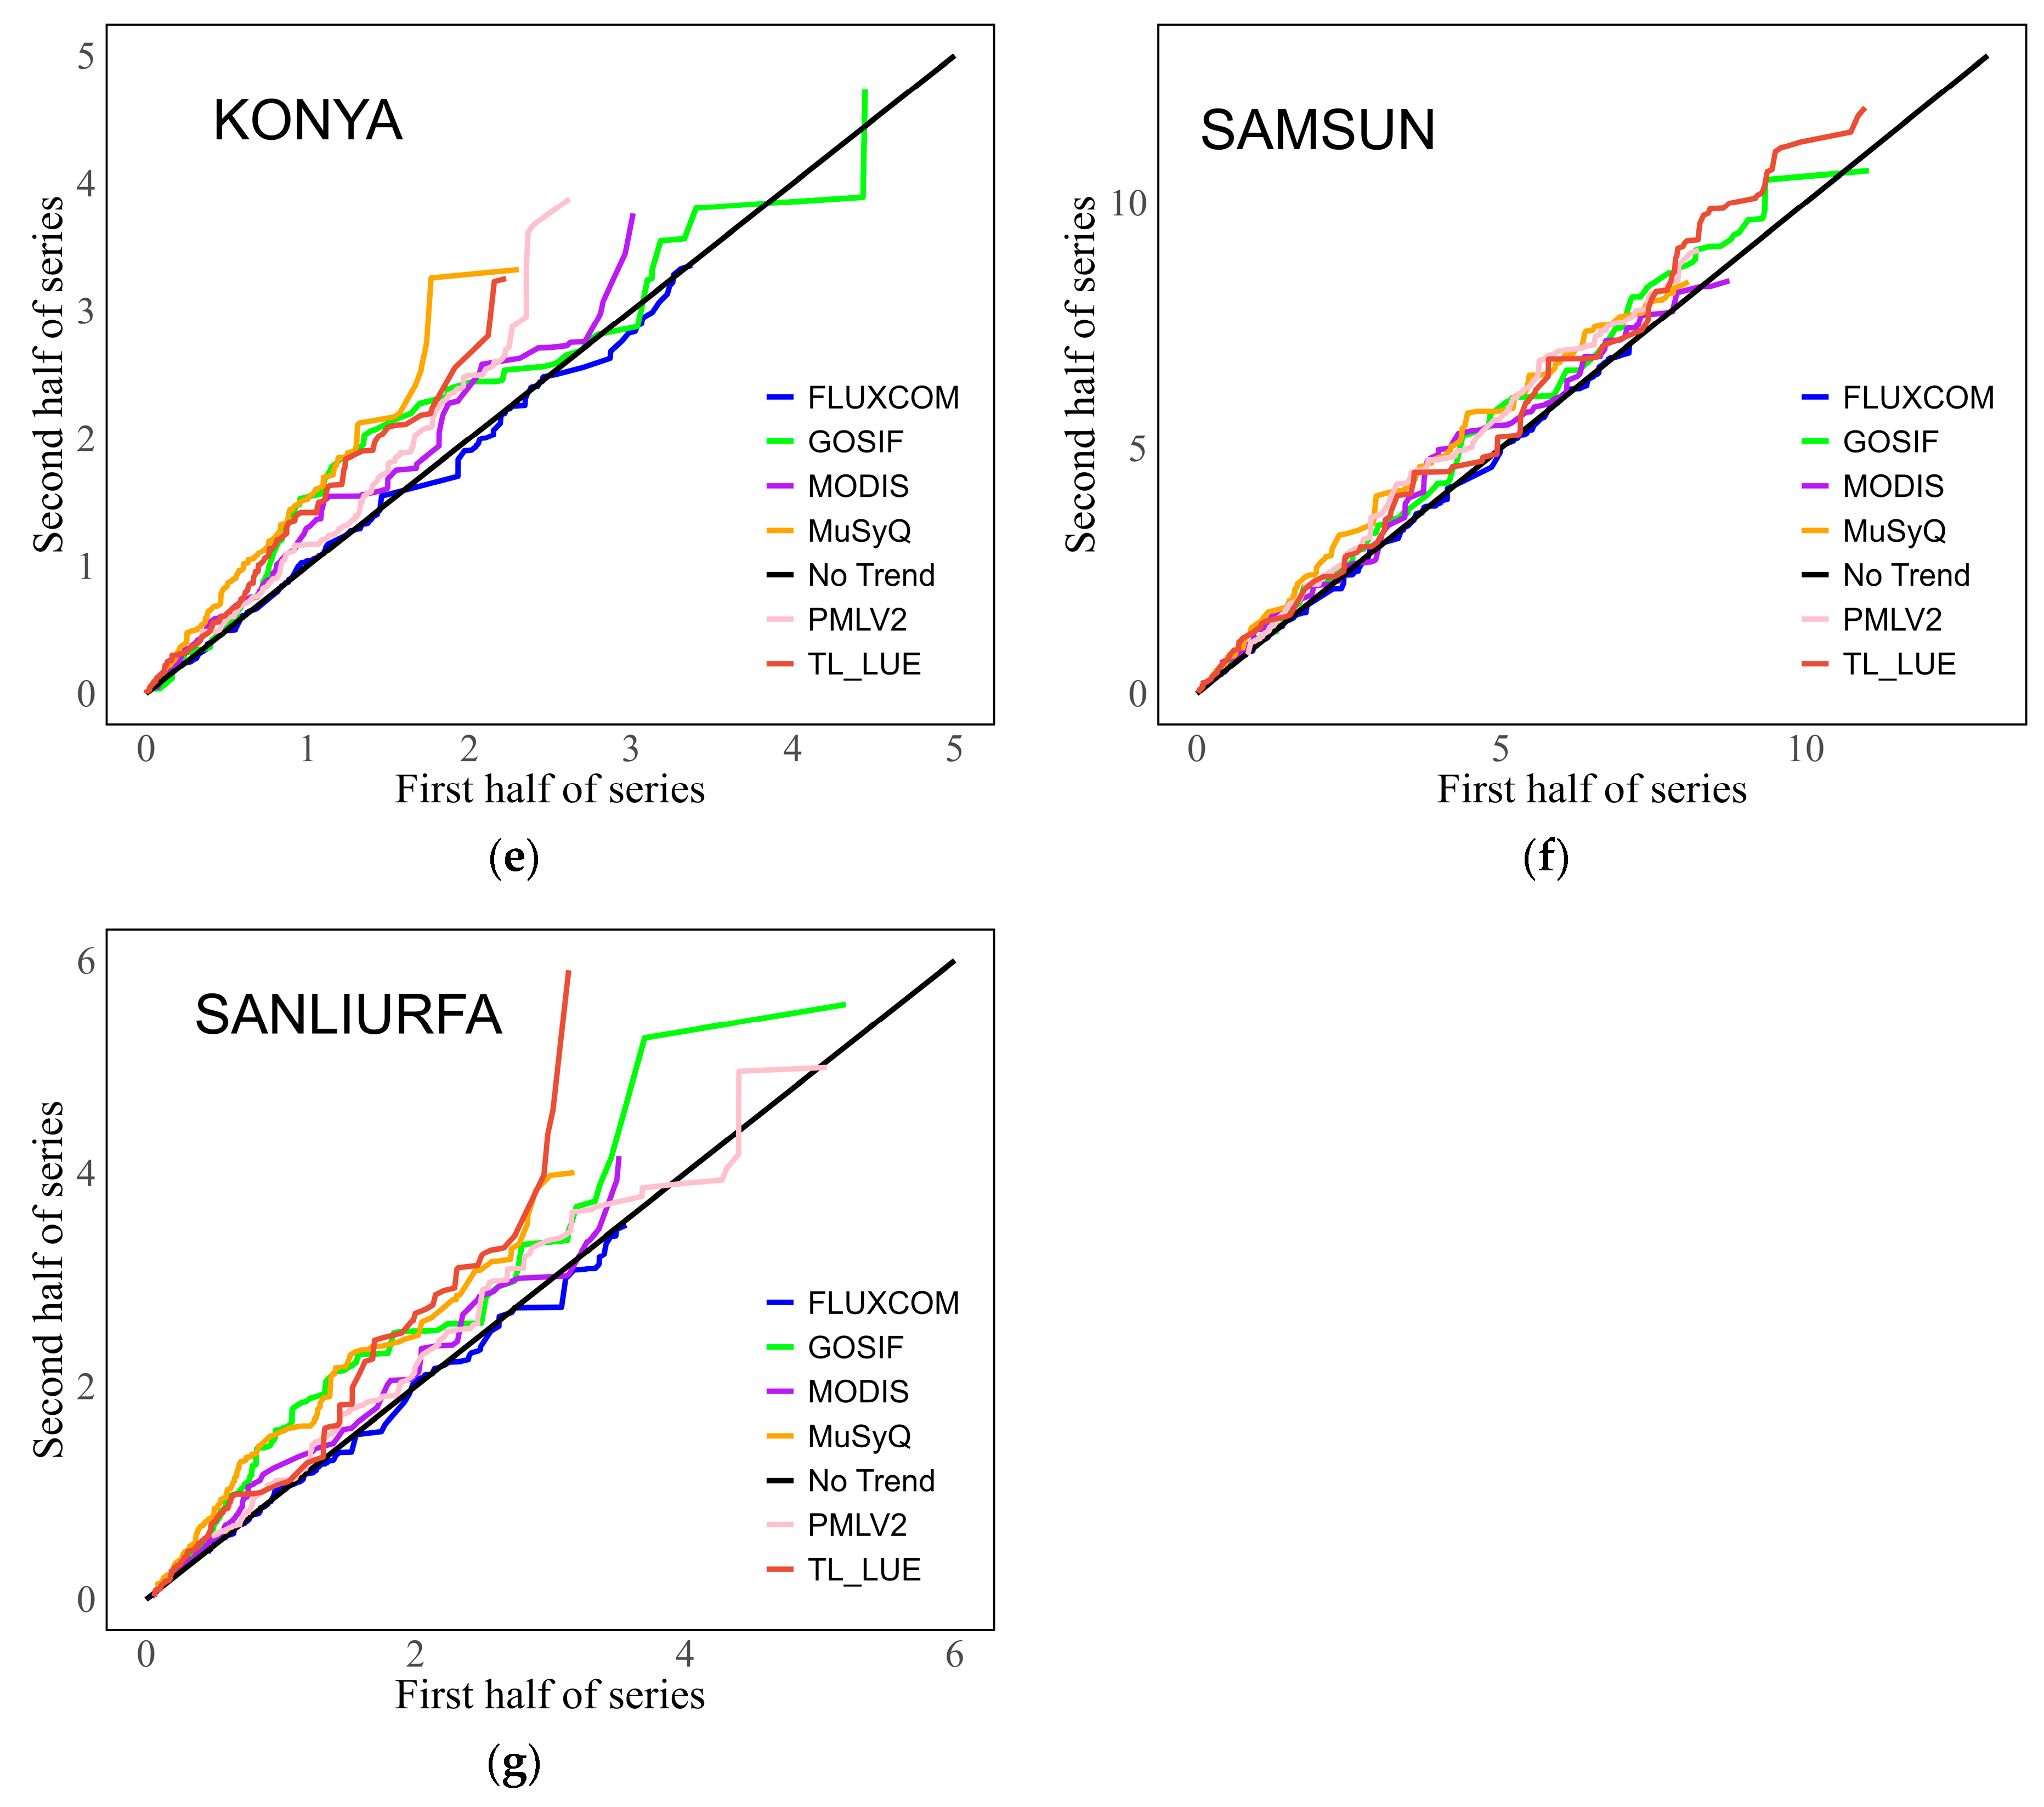
Innovative trend analysis (ITA) is a non-parametric method used for identifying trends in time series data [17] regardless of data distribution and length and allows for a quick graphical understanding of trends. In this method, observational data are divided into two equal lengths starting from the beginning date and sorted from smallest to largest; one of the key advantages of the ITA method is its capability to interpret the trend behaviors of low-, medium-, and high-valued data [84]. The first sub-series is placed on the x-axis and the second sub-series on the y-axis on the Cartesian coordinate plane. If the data fall on or very close to the 1:1 (45°) line, it is practically understood that there is no significant trend in the series being examined. If the data fall above (or below) the 1:1 (45°) line and continue to deviate from the straight line in an increasing (or decreasing) manner, the trend is monotonically increasing (or decreasing). Series that do not show a continuous increase (or decrease) at smaller values but exhibit an increasing (or decreasing) character as the values increase are referred to as series with a non-monotonic increasing (or decreasing) trend. The steps of obtaining the confidence interval limits used to determine the significance of the trend values produced by the ITA method are described below.
The trend slope and indicator of the ITA are calculated using Equations (1) and (2).
s = 2 ( x ¯ y ¯ ) n
where s is the trend slope, n is the number of data points available, x ¯ is the mean of the first part of the series, and y ¯ is the mean of the second part of the series.
D = 1 n i = 1 n 10 ( y i x i ) x ¯
D is a trend indicator (a positive value indicates an increasing trend and a negative value indicates a decreasing trend), n is the number of data points in each subseries, x ¯ is the mean value of the first subseries, and x i and y i are the observed data values in the first and second subseries, respectively.
The significance of the ITA is estimated using a probability distribution function. The confidence interval of a standard normal distribution function with zero mean and standard deviation of the ITA trend slope ( σ s ) at the significance level α is calculated using the confidence limit of the trend slope (CL):
C L ( 1 α ) = 0 s σ s
When the estimated ITA trend slope (i.e., s) is greater than the critical value, the null hypothesis of no slope is rejected. Therefore, if the data points fall outside the specified confidence limit, s calculated from the data series is considered statistically significant. In this study, a 95% confidence level is considered. An example of a graphical representation of the ITA method is presented in Figure 3.
Among the areas where the ITA method is most frequently used is the examination of hydrological and meteorological variables. In this context, considering the strong link between carbon cycles and water cycles [85], we seek to investigate the utility of ITA GPP trend analysis. For the ITA analysis, the trendchange package [86] in R was utilized [87].

3.4. Empirical Mode Decomposition

Empirical Mode Decomposition (EMD) is a signal processing method that aims to uncover the internal structure of data by decomposing a signal into its sub-components at different frequencies [14]. EMD has been used for various applications, such as analyzing time series data, identifying periodic or continuous structures in data, and decomposing signals in the frequency domain. These components are called Intrinsic Mode Functions (IMFs). Each IMF represents the local frequency modulation of the data and reflects the time–variance relationship in the signal. IMFs preserve the intrinsic characteristics of the data while determining their fundamental frequencies. EMD decomposes a signal into IMFs through a series of progressive steps. For a signal component to be considered as an IMF, it must satisfy two conditions: (i) the number of local maxima and minima and the number of zero crossings must be the same or differ at most by one and (ii) the arithmetic mean of the envelope defined by the local maxima and the envelope defined by the local minima must be zero. The sum of the IMF and residual mode components, determined through the decomposition and elimination processes of a signal by EMD, reconstructs the original signal. EMD calculation steps are defined as follows.
Step 1: All extrema in the time series are identified. The local maxima and minima are then used for interpolation and the upper U x ( t ) and lower L x ( t ) envelopes are derived using cubic spline.
Step 2: The mean envelope value m(t) and the detailed component d(t) are calculated.
m t = U x t L x ( t ) 2
d t = x t m t
Step 3: If the resulting d(t) meets the stopping criteria, it becomes the first IMF. Otherwise, the procedure is repeated on d(t) until the stopping criteria are met, where the stopping criteria are defined as follows:
t = 1 T d j t d j 1 ( t ) 2 d j 1 2 ( t ) S D
where T represents the length of the time series and j denotes the number of iterative calculations. The default value of SD is usually set between 0.2 and 0.3. Thus, in this study, the default SD value was set to 0.2.
Step 4: Continue iterating steps two to three until all IMFs and the detailed signal are obtained. Finally, the original time series f t can be decomposed as given below:
f t = i N I M F i t + R N ( t )
where R N ( t ) is the final residual and can be considered as the global trend signal.
The residual band obtained through the EMD method is commonly referred to as the long-term trend component [88], which identifies changes in the nonlinear trend present in the time series over time. In the literature, its application is noted in various fields such as precipitation [89], air temperature [90], extreme sea levels [91], and regional drought [92].
We decomposed the GPP time series into sub-series with different frequencies using the EMD method. This decomposition process utilized the EMD library [93,94] in R. While the EMD algorithm performs a data-based decomposition, it still contains certain hyperparameters including the maximum number of siftings and the maximum number of IMFs. The maximum number of siftings refers to the maximum iterations the algorithm will perform during the extraction of each IMF, which influences in how much detail the algorithm will process each IMF and how long it will run. A larger maximum sifting number can lead to longer extraction processes for each IMF. This can create a significant computational cost, especially for large datasets. Excessive sifting may sometimes result in the over-sifting of the signal, causing the IMFs to be overly detailed and to fail to reflect the main signal’s characteristics [95]. Depending on the specific application of the algorithm and the characteristics of the dataset, the optimal value of this hyperparameter can vary. In practical applications, it is typically adjusted through trial and error, and we achieved this by choosing values from 10 to 30. In the EMD algorithm, the “maximum number IMFs” setting determines the maximum number of IMFs the algorithm will extract from a signal. This setting is a crucial hyperparameter that directly affects how EMD works and its outcomes. The maximum number of IMFs was also set using a trial-and-error method. In this study, the maximum number of IMFs varied between 4 and 8. After extracting the IMFs and the trend component, the variance contribution rate (VCR) values of all the sub-series were calculated. This value measures the extent to which each sub-series explains the variance of the original time series. Although simple and practical, the EMD method also has some disadvantages. For example, EMD-based techniques are sensitive to the noise contained in the signal. A small change in the signal-to-noise ratio of the signal can lead to significantly different signal decomposition results [96]. The EMD method also has a mixing problem [97], which is caused by the mixing of frequency components between various IMFs. These issues should be taken into account when using the EMD algorithm.

4. Study Design

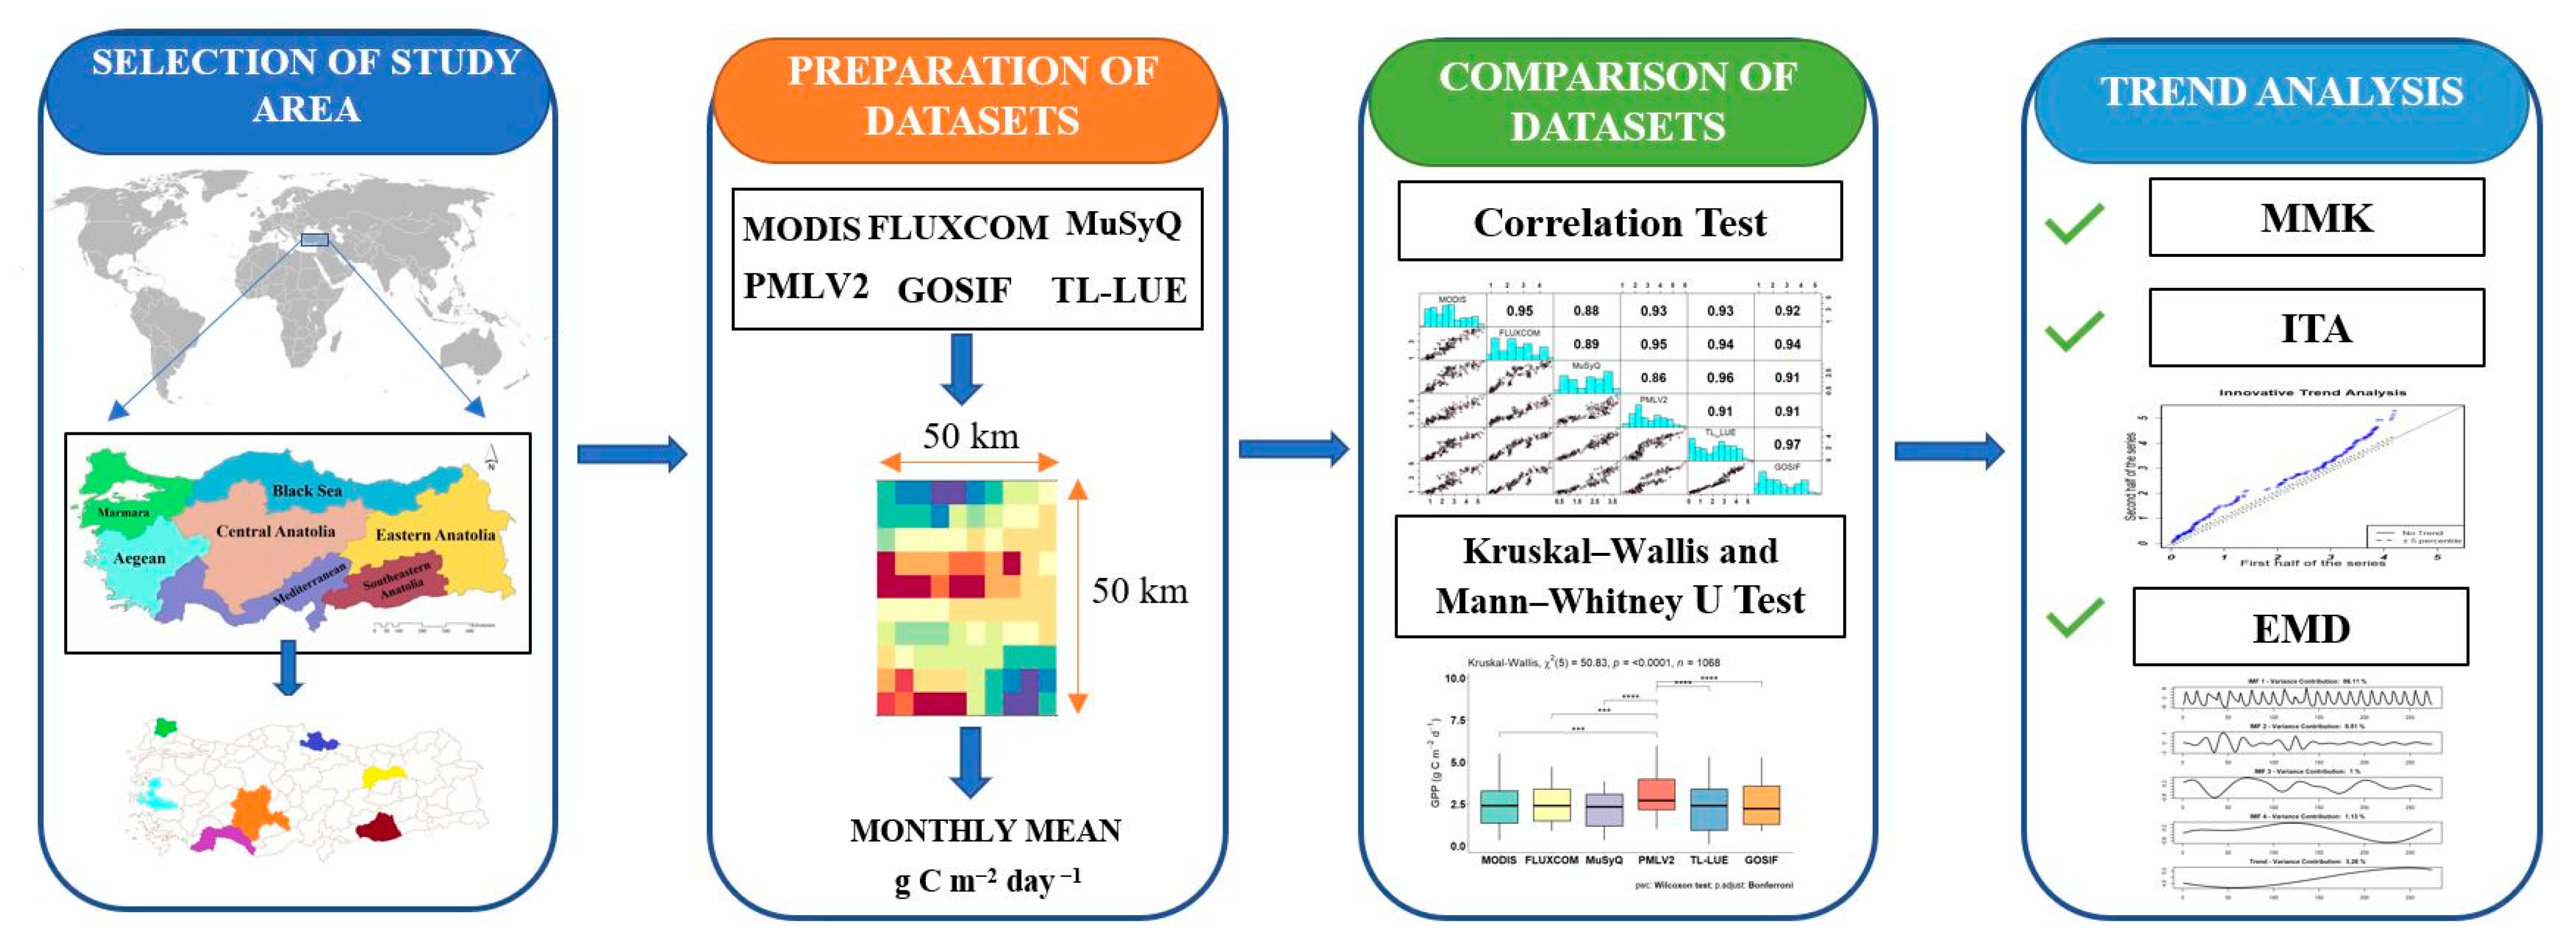
The flowchart of the study is illustrated in Figure 4. First, we obtained global Gross Primary Production (GPP) datasets from various sources. These datasets were carefully selected to ensure a comprehensive representation of GPP values across different geographical locations. These datasets were then subjected to a sub-setting process in which data corresponding to specific points in seven different regions in Türkiye were extracted for a more localized analysis of GPP. Given the concern that GPP values examined at the highest spatial resolution could potentially be misleading and may not accurately reflect larger-scale variability, 50 × 50 km areas were defined within each region. For each of these defined areas, average GPP values were calculated. Once the time series data for each region and the corresponding dataset were obtained, a series of statistical analyses were performed. First, correlation analyses were conducted to determine the degree of similarity and strong relationships between data within the same region. Non-parametric statistical tests, specifically the Kruskal–Wallis (KW) test and the Mann–Whitney U (MWU) test, were used to evaluate differences between the datasets. Following the identification of similarities and differences through these statistical tests, temporal trends in GPP values were analyzed using three different methods. These methods were chosen to comprehensively capture and analyze temporal dynamics and trends in GPP values over time. Each method provided unique insights into the temporal evolution of GPP.

5. Results

5.1. Statistical Evaluation of the GPP Datasets

None of the GPP product data follow a normal distribution across the study regions. The time series of MODIS GPP for all regions, and histograms related to these time series, are shared in Figure S3. The average GPP values for Antalya, Erzincan, Izmir, Kirklareli, Konya, Samsun, and Sanliurfa are 2.53, 1.29, 2.51, 2.52, 0.97, 3.27, and 1 g C m−2 d−1, respectively. The lowest GPP value, 0 g C m−2 d−1, was found in the Erzincan region, while the highest GPP value, 8.72 g C m−2 d−1, was observed in the Samsun region. The time series of MuSyQ GPP for all regions, and histograms associated with these time series, are presented in Figure S4. The average GPP values from MuSyQ were as follows: Antalya 2.04, Erzincan 1.13, Izmir 3.43, Kirklareli 2.51, Konya 0.68, Samsun 3.00, and Sanliurfa 1.05 g C m−2 d−1. The lowest GPP value was 0.03, observed in the Erzincan region, while the highest GPP value was 8.23 g C m−2 d−1, which was observed in the Samsun region. Distribution graphs and time series graphs for the study areas are presented in Figure S5. The lowest GPP estimates from the PMLV2 were 0.11 g C m−2 d−1 and 0.33 g C m−2 d−1, recorded in the regions of Erzincan and Konya, respectively, while the maximum GPP values recorded were between 7.27 g C m−2 d−1 and 9.04 g C m−2 d−1, observed in the Antalya and Samsun regions, respectively (Figure S5). Recent years have seen notably high values in the Antalya, Erzincan, Izmir, and Konya regions; the increase in the frequency of high values in recent years can be observed from the time series graphs (Figure S6). In the TL-LUE GPP datasets, the highest values were detected at 11.93 g C m−2 d−1 in Samsun and 8.51 g C m−2 d−1 in Kirklareli. The lowest GPP from GOSIF values were identified in Erzincan, while the highest were observed in Samsun (Figure S7). Similar to MuSyQ GPP values, almost all of the GOSIF GPP values also exhibited a distribution that was heavily right-skewed (e.g., Figure 5). The lowest values from FLUXCOM occurred in Erzincan, while the highest values were identified in Samsun. The FLUXCOM GPP average values for Antalya, Erzincan, Izmir, Kirklareli, Konya, Samsun, and Sanliurfa were 2.49, 1.34, 3.39, 2.07, 0.85, 2.79, and 1.31 g C m−2 d−1, respectively (Figure S8).
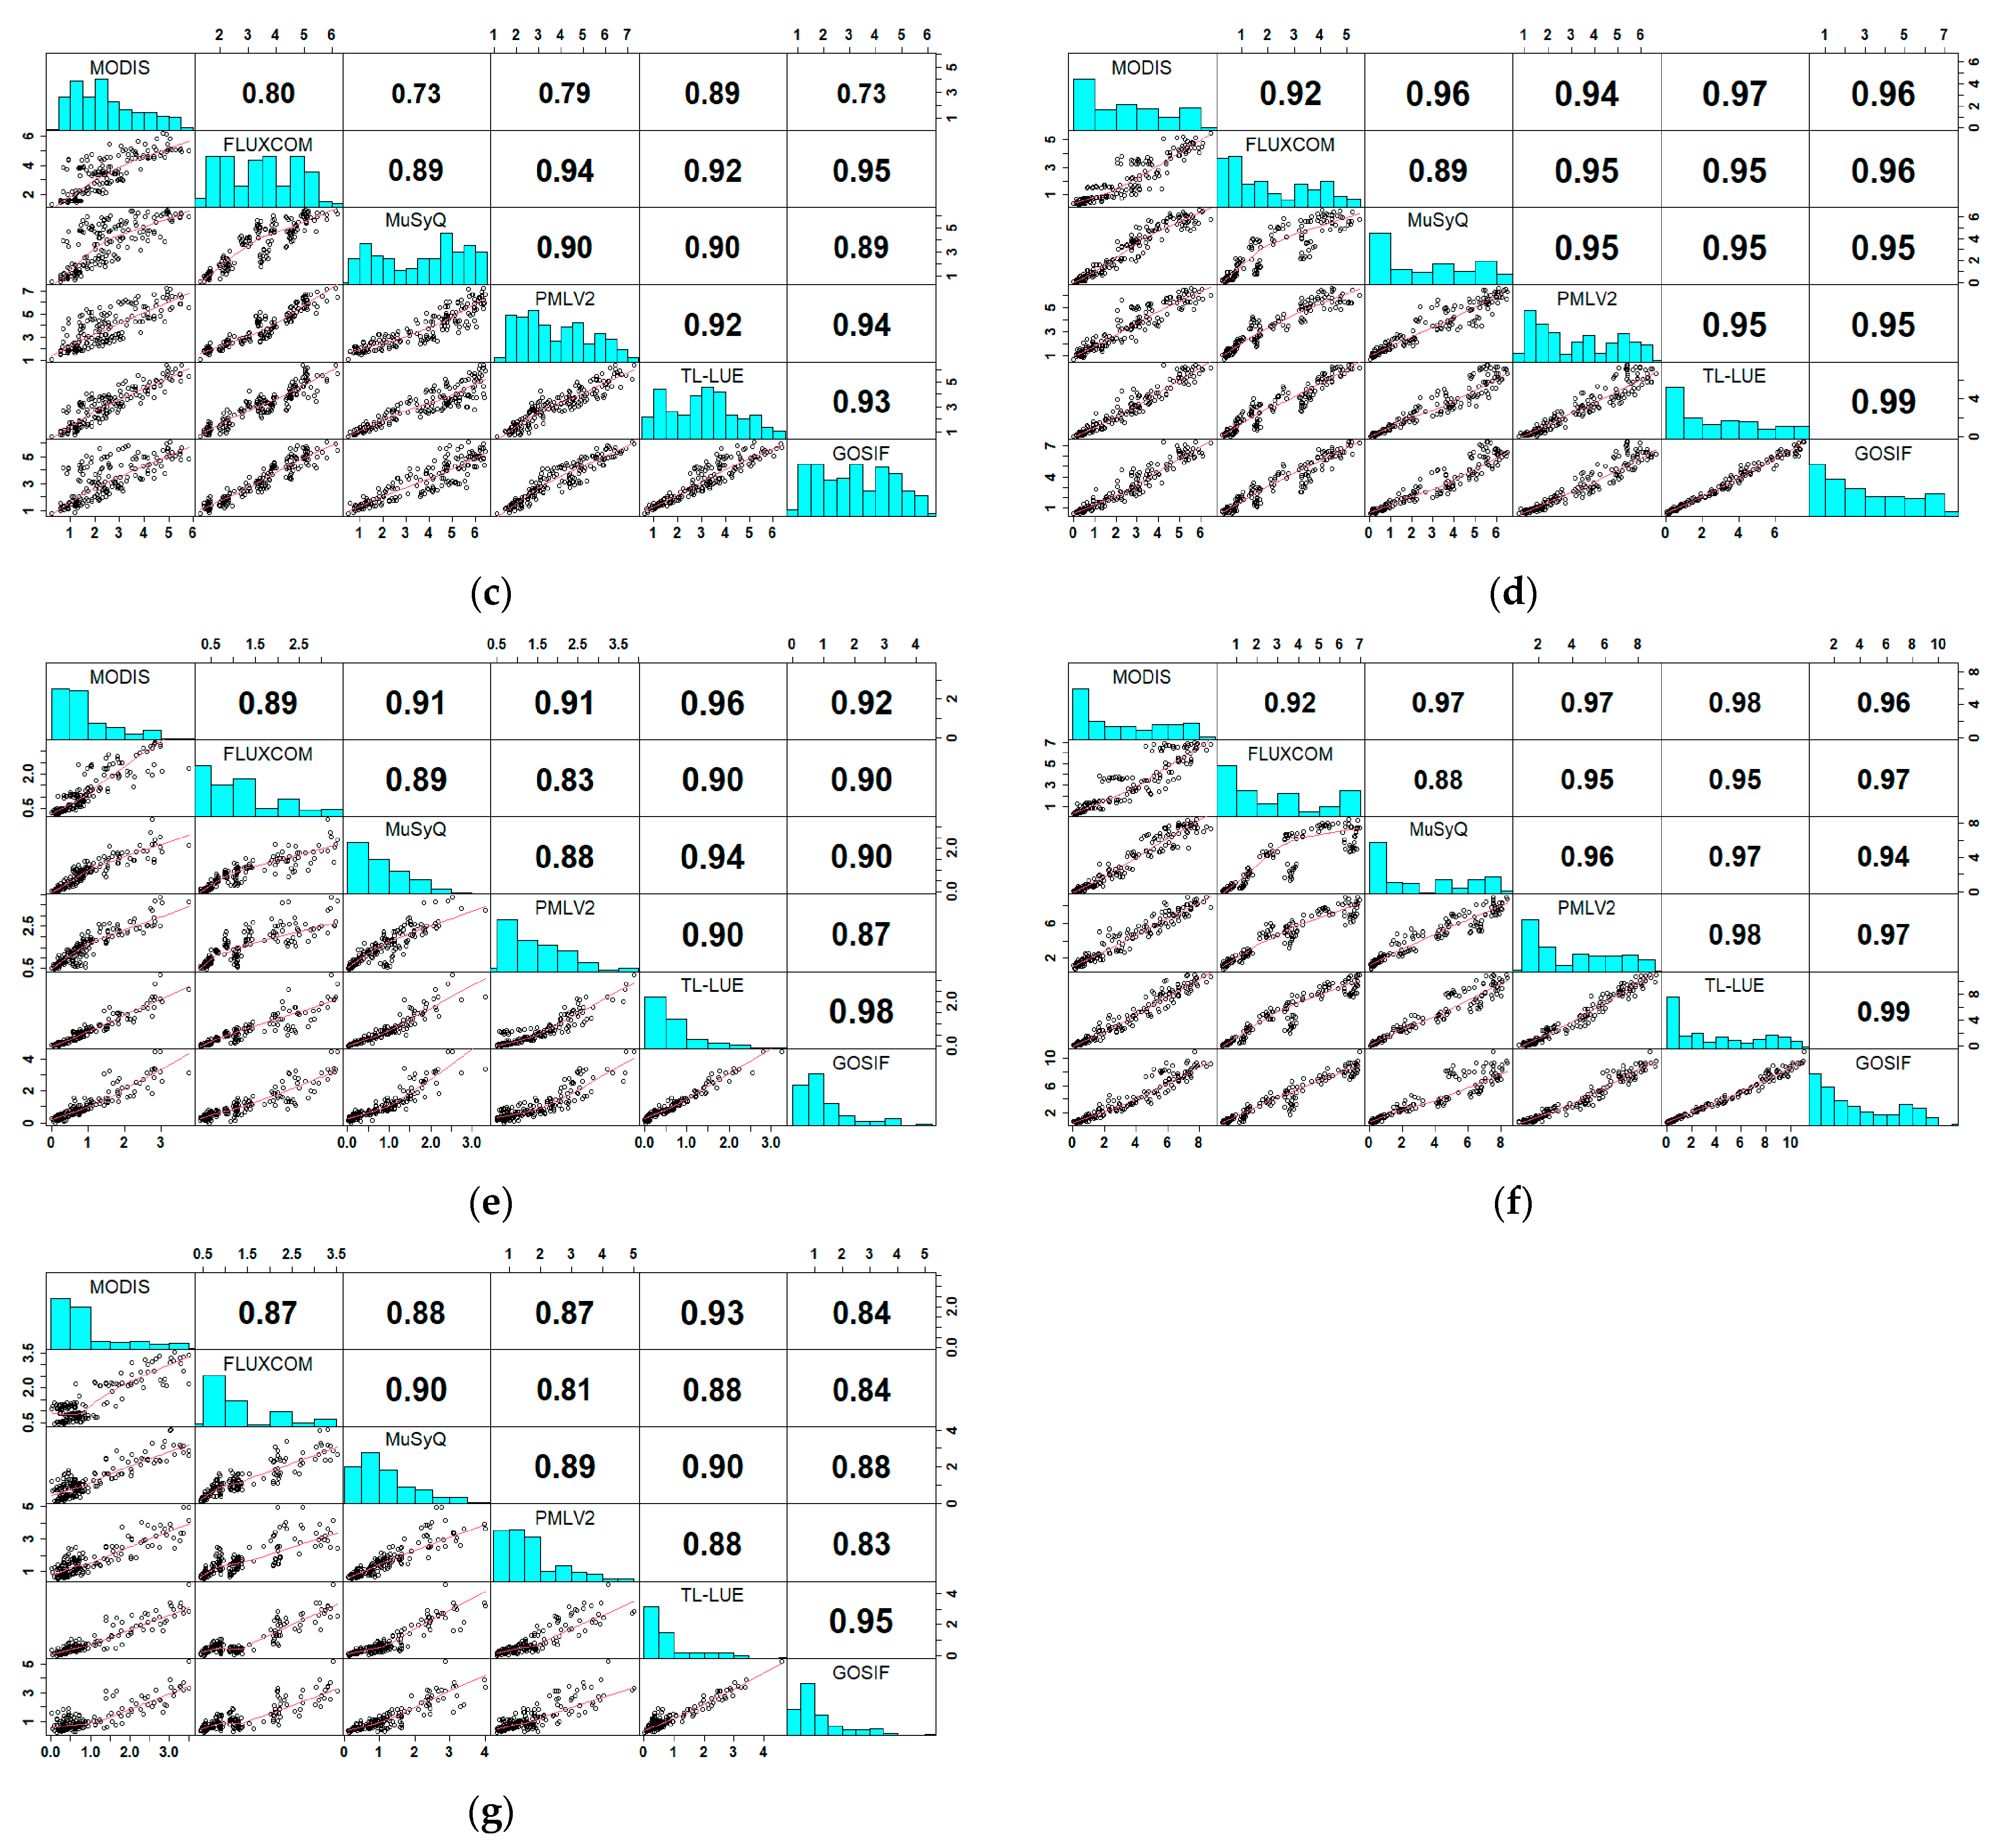
First, correlation coefficient values were calculated to determine relationships between different GPP products from each data point from different regions (Figure 5). All relationships were statistically significant, with important differences in the strength of the agreement. For instance, in the Antalya region, the highest correlation of 0.97 was observed between GOSIF and TL-LUE, while the lowest was 0.88 between MODIS and MuSyQ datasets. The scatter plots illustrate that variance tended to be lower for lower GPP values and vice versa for higher GPP values. A noticeable increase in variance can be observed between FLUXCOM and MuSyQ, and MuSyQ and GOSIF for high GPP values. In the case of the Erzincan region, the highest correlation was 0.99 between GOSIF and TL-LUE, and the lowest was 0.92 between FLUXCOM and MuSyQ datasets. Scatter diagrams for the Erzincan region indicate a relatively lower variance at low values compared to medium and high values. Regarding the Kirklareli region, the highest correlation coefficient of 0.99 was measured between GOSSIF and TL-LUE, while the lowest correlation coefficient of 0.89 was observed between FLUXCOM and MuSyQ. For the Izmir region, the higher variance can be observed for medium and high values compared to lower values. When examining scatter plots for the Konya region, the variance between low and medium values is significantly lower compared to very high values. The highest correlation coefficient in Konya was 0.98 between GOSIF and TL-LUE, while the lowest was 0.83 between PMLV2 and FLUXCOM. In the Samsun region, an almost perfect scatter was observed between TL-LUE and GOSIF, resulting in a correlation coefficient of 0.99. The lowest correlation, at 0.88, occurred between MuSyQ and FLUXCOM. When examining scatter plots between FLUXCOM and other datasets, a noticeable difference is apparent. Finally, for the Sanliurfa region, the highest correlation coefficient of 0.95 was between TL-LUE and GOSIF, while the lowest correlation was 0.84, both between GOSIF and MODIS and GOSIF and FLUXCOM. Low variance can be observed among low values, but variance noticeably increased for medium and high values.

5.2. Kruskal–Wallis and Mann–Whitney U Test Results

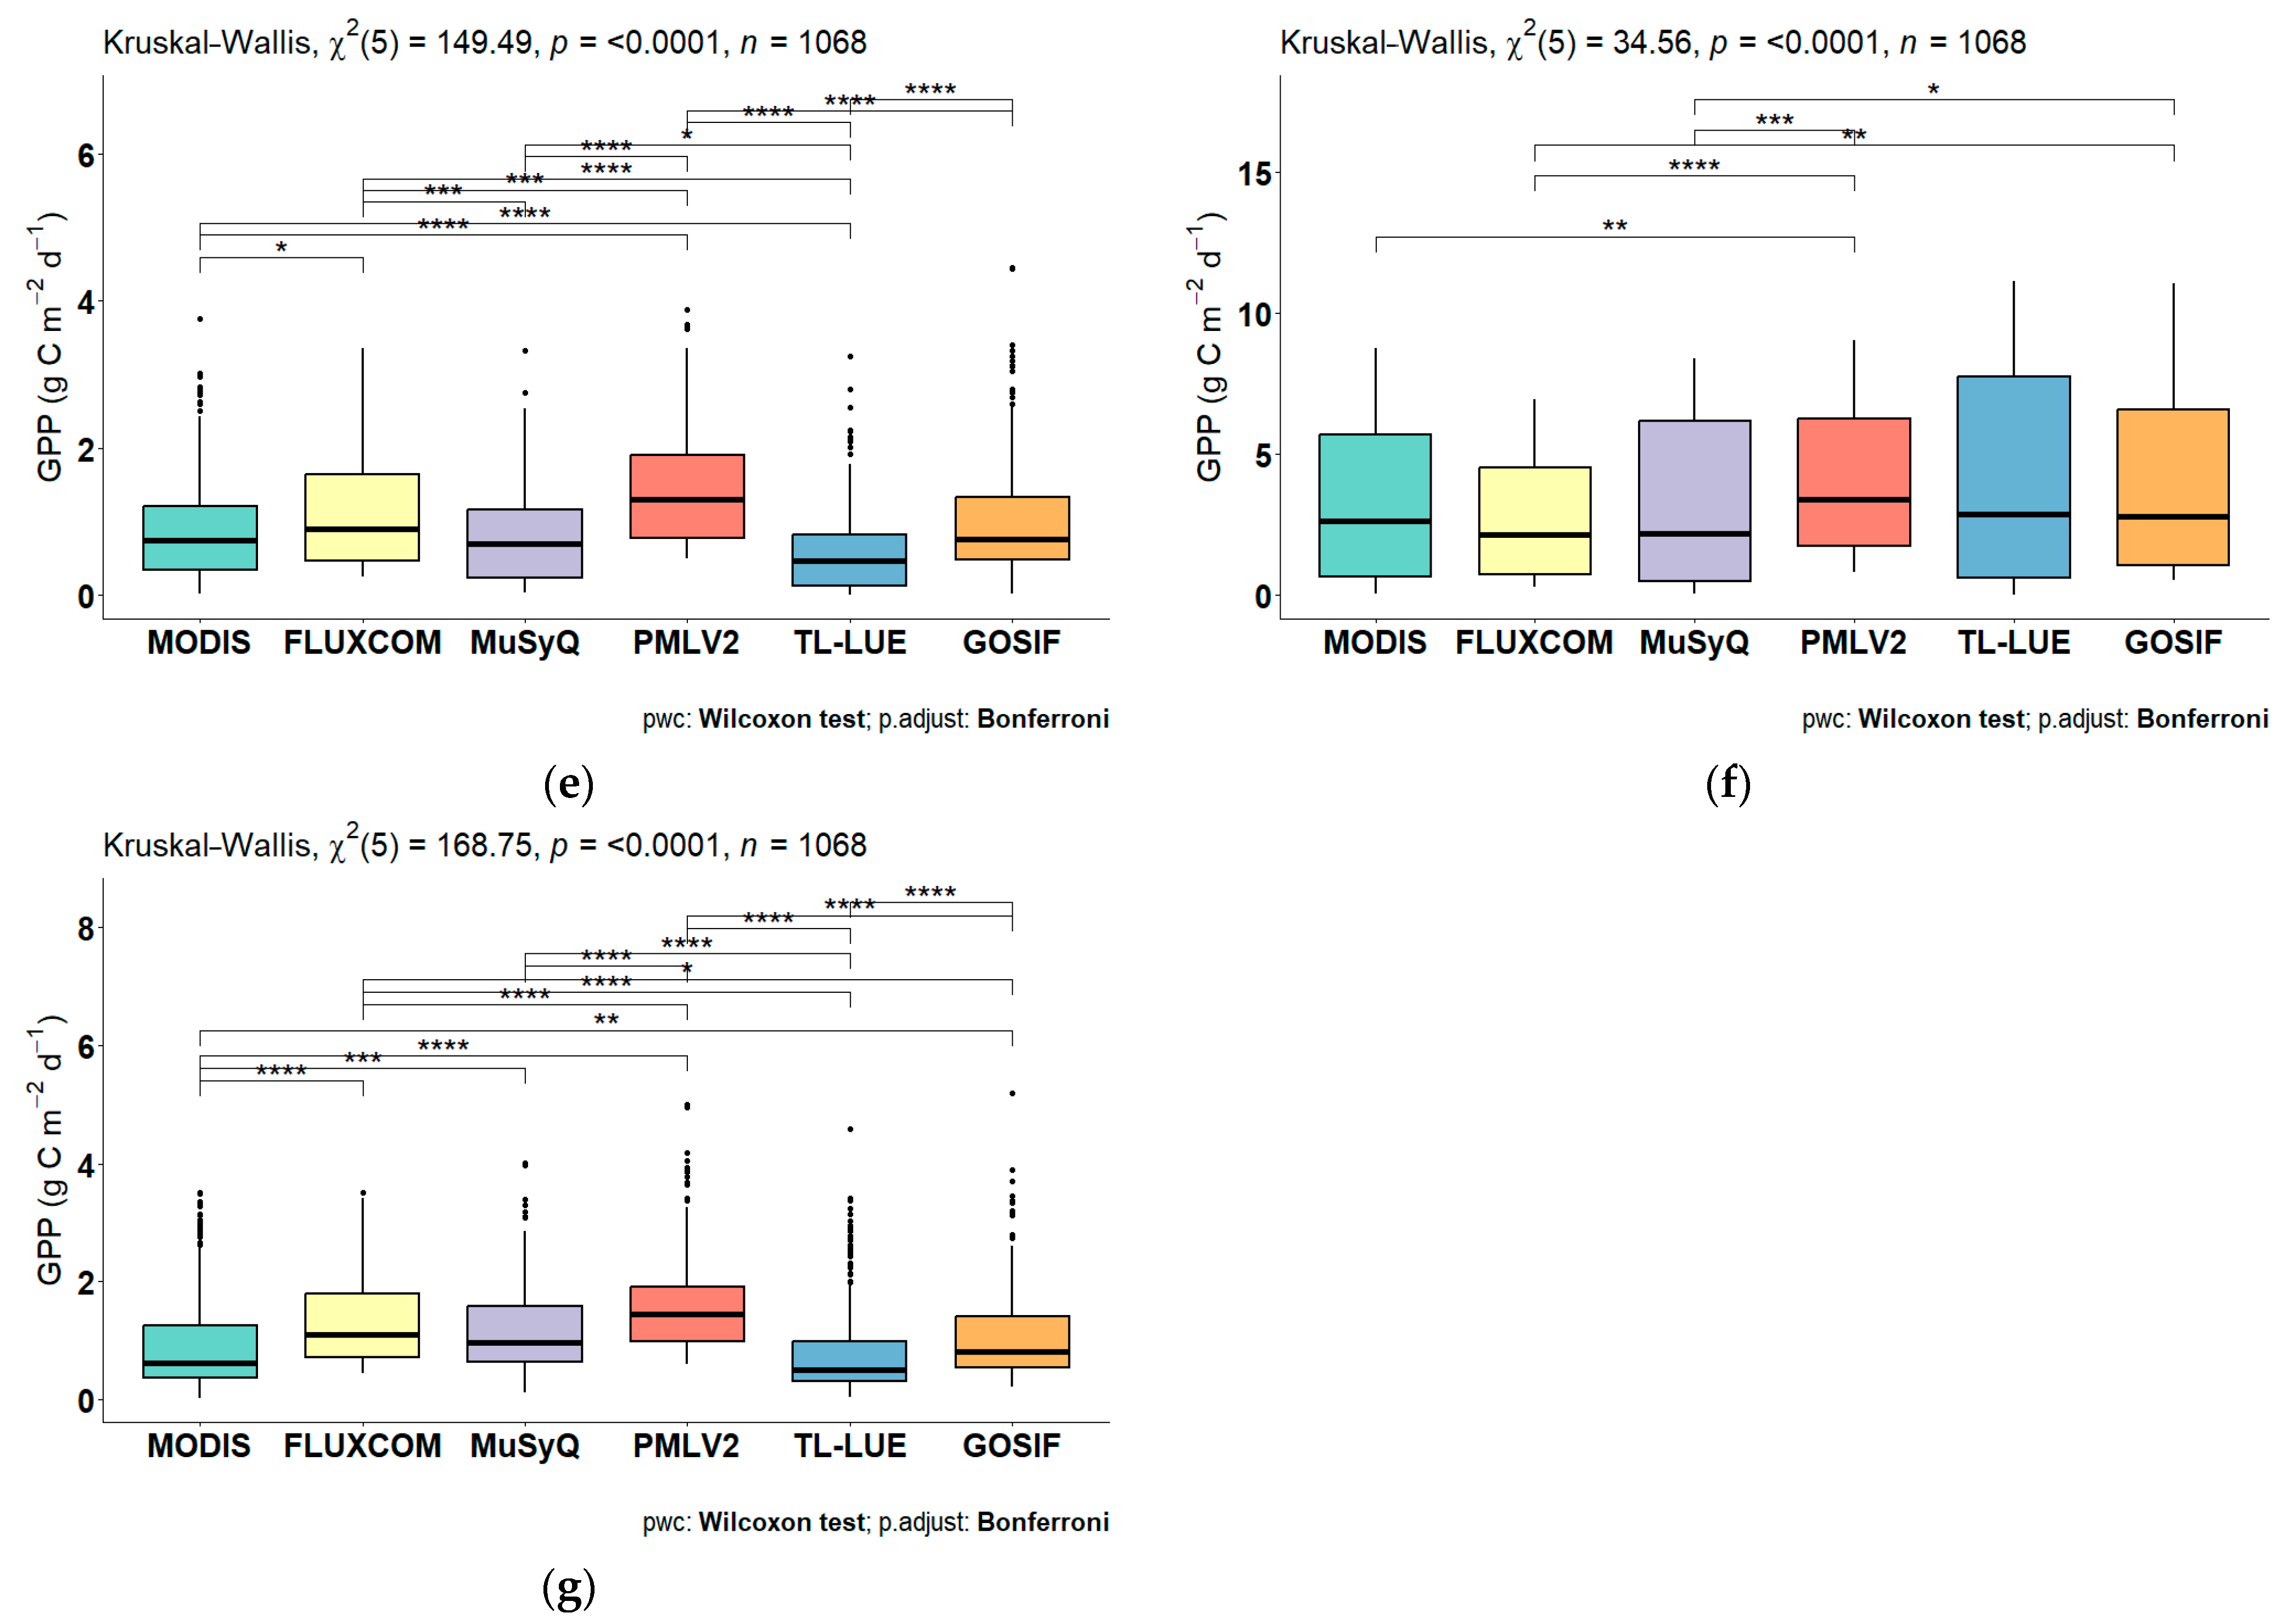
Upon examining the KW test results, the KW test statistic values for all regions were calculated as χ2 = 50.8, χ2 = 21.9, χ2 = 76.9, χ2 = 42.6, χ2 = 149, χ2 = 34.5, and χ2 = 168 (p < 0.05), respectively: at least one group among the GPP estimation methods differed significantly from the others. Following the KW test, the MWU test was applied to test which groups had significant differences. This test enabled pairwise comparisons and groups differing from each other were tested at different levels of significance. Due to the number of groups evaluated simultaneously being more than two, the Bonferroni correction was applied to prevent an increase in Type I errors during the MWU test. The KW and MWU test results for all regions are presented, comparatively, using box plot graphs in Figure 6. The quartile information of the distributions of the GPP datasets can be read on the box plot diagrams, and the data groups that are significantly different on the graph are marked with an asterisk. A significant difference was found between the PMLV2 and all other datasets in Antalya. For the Erzincan region, PMLV2 showed significant differences compared to MODIS, MuSyQ, and TL-LUE. In the Izmir region, the MODIS dataset was significantly different from all other datasets, and significant differences were also found between MuSyQ-TL-LUE, PMLV2-TL-LUE, and PMLV2-GOSIF. In the Kirklareli region, the pairs identified with significant differences, in order, were MODIS-PMLV2, FLUXCOM-PMLV2, MuSyQ-PMLV2, and FLUXCOM-GOSIF. In the Konya region, nearly all datasets showed significant differences, with only MODIS-MuSyQ, MODIS-GOSIF, FLUXCOM-GOSIF, and MuSyQ-GOSIF appearing similar. In the Samsun region, MODIS-PMLV2, FLUXCOM-PMLV2, FLUXCOM-GOSIF, and MuSyQ-GOSIF were significantly different. In the Sanliurfa region, similar to Konya, almost all datasets were significantly different, except for MODIS-TL-LUE, FLUXCOM-MuSyQ, and MuSyQ-GOSIF.

5.3. Modified Mann–Kendall Results

The present study involves the temporal analysis of GPP values, employing Mann–Kendall (MK) tests. These non-parametric tests provide insights into the direction of trends in time series data. The purpose of using the Modified Mann–Kendall (MMK) test in this study is to address the issue of autocorrelation, which can lead to inaccurate results in datasets with high autocorrelation when using the MK test alone. The MMK test attempts to eliminate internal dependency, aiming for statistically more reliable results. The monthly trend results are presented in Table 2. The values pertaining to the Antalya region have been interpreted in detail as an example.
In the analyses conducted on a monthly basis, no significant trend was observed in any dataset for January in the Antalya region. In February, MODIS indicated a decrease in GPP, while other datasets (except PMLV2) showed an increase. In March, no trend was observed in the GOSIF dataset, while MODIS showed a decrease, and other datasets indicated an increase. In April, MODIS indicated a decrease in GPP, FLUXCOM showed no trend, and other datasets showed an increase. In May, MODIS again showed a decrease, FLUXCOM had no trend, and other datasets exhibited a significant increase. In June, there was no trend in FLUXCOM and MuSyQ, while other datasets showed an increase. The same was observed in July and August. In September, no significant trend was detected in the FLUXCOM, MODIS, and PMLV2, while other datasets showed an increasing trend. In October, FLUXCOM and PMLV2 showed no significant trend, while other datasets continued to show an increasing trend. In November, all datasets except FLUXCOM showed an increasing trend and, in December, all datasets except MuSyQ showed an increasing trend.
The TL-LUE dataset shows no trend during the winter months, while it displays an increasing trend in all regions during the spring and summer months. The GOSIF dataset generally exhibits an increasing trend and MODIS, distinct from other datasets, shows a tendency to decrease in many regions during the months of March, April, and May. MuSyQ shows no trend in January and December, while exhibiting an increasing trend in all other months. PMLV2 shows no trend during the winter months but an increasing trend during the spring and summer months. Monthly trend values for all regions are shared in the Supplementary Materials (Tables S1–S7).
After conducting an analysis of the monthly values, the datasets were examined using the MMK test. According to the results presented in Table 3, significant increasing trends were identified in TL-LUE, MuSyQ, and PMLV2 for the Antalya region. In the Erzincan region, a notable increasing trend was detected exclusively in MuSyQ. In Izmir, significant trends were observed in TL-LUE, GOSIF, and PMLV2. For the Kirklareli region, statistically significant increasing trends were found only in TL-LUE and MuSyQ. In Konya, an upward tendency was identified in TL-LUE, GOFIS, MuSyQ, and PMLV2. In Samsun, increasing trends were observed in MuSyQ and PMLV2. Lastly, in the Sanliurfa region, significant increases were detected in all datasets except for FLUXCOM and MODIS. MuSyQ showed a strong and statistically significant upward trend in the Kirklareli, Konya, Samsun, and Sanliurfa regions with a 99% confidence interval.

5.4. Innovative Trend Analysis Results

The ITA results for the GPP values for all regions are shared in Figure 7. Examining the results for the Antalya region, a monotonic increasing trend can be observed throughout the TL-LUE dataset, with distinct increasing trends in both low and high GPP values. The FLUXCOM dataset is scattered along the trendless 1:1 line, indicating an absence of trend. In the GOSIF dataset, while no clear trend is evident, there is a slight increasing trend in medium GPP values. The MODIS dataset nearly shows a trendless pattern; however, an increasing trend is noticeable at higher GPPs values. In the MuSyQ dataset, while low and medium values show an increasing trend, high values are distributed near the trendless region. In the PMLV2 dataset, there is no trend in low GPP values and an increasing trend as GPP becomes higher. In the Erzincan region, except for the FLUXCOM dataset, all datasets exhibit a notable monotonically increasing GPP trend that is more pronounced at high values. Regarding the ITA results for the Izmir region, no trend is observed in the low and medium GPP values except for the MuSyQ, which increase towards medium values with a smaller increase in high values and some higher values showing a decreasing trend. TL-LUE, GOSIF, and PMLV2 also exhibit an increasing trend at high GPP values, while MODIS shows slight decreasing trends in higher values. In Izmir, a monotonic increasing trend is observed in TL-LUE, GOSIF, and PMLV2, while MODIS and MuSyQ display a non-monotonic, increasing trend at medium values but trendless behavior at low and high values. The ITA results for the Konya region display a markedly different trend compared to other regions. Except for the FLUXCOM and GOSIF datasets, all other datasets show a monotonically increasing trend. In the GOSIF dataset, while the medium values show a clear increasing trend, its high values are scattered in the trendless region. In the PMLV2 dataset, very pronounced increases are observed at high GPP values.
In examining the GPP values in the Samsun region, a distinct monotonic increasing trend can be observed in MuSyQ and PMLV2. The TL-LUE dataset shows an increasing trend at high values, and an increasing trend at medium values is apparent in MODIS and GOSIF. In Sanliurfa, a notably different trend distribution is present compared to other regions. In the GOSIF dataset, an increasing trend in low values slightly diminishes in medium values but increases again in high values. The common point in the trend analyses across all regions is the tendency for increases at high values. While there are clear differences between the trends in the Sanliurfa and Konya regions, the trend movements in other regions are similar. To provide a more detailed analysis, the trend results obtained with the ITA method are shared in the appendix for each time series (Figure S9).

5.5. Empirical Mode Decomposition Results

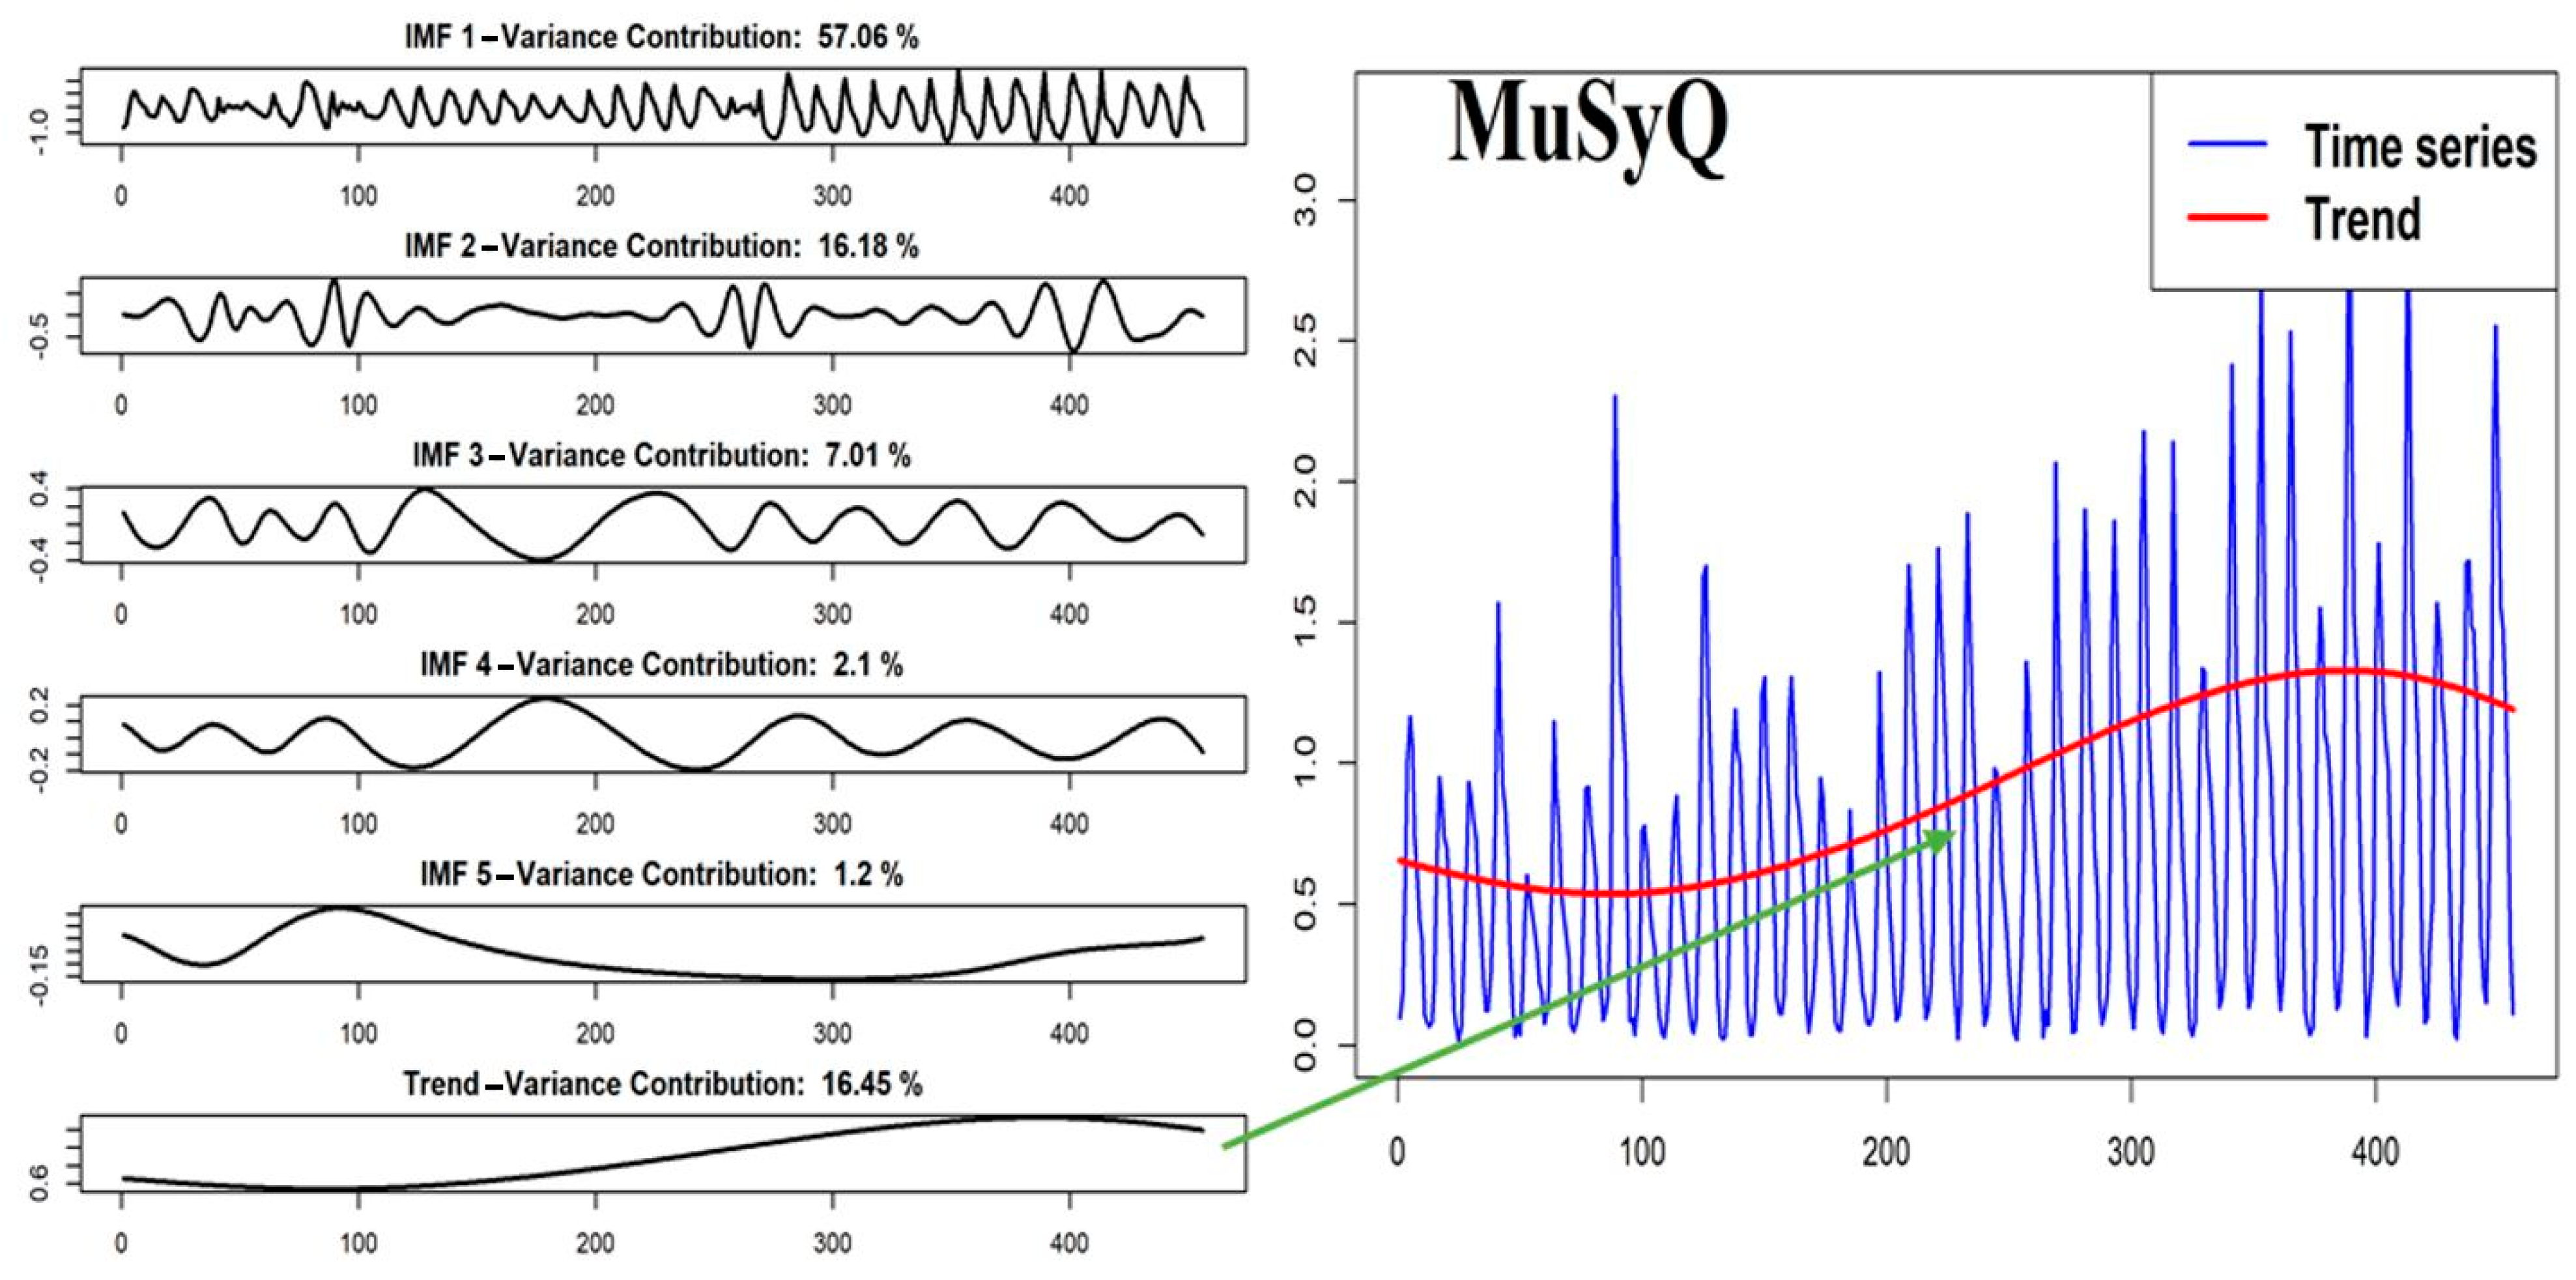
Using monthly data, it was generally observed that the second IMF had a high VCR value. This measure essentially evaluates the explanatory power of the trend component on the original series and provides insights into the significance of the trend. One of the key features distinguishing the trend component obtained by EMD from other trend analysis methods is its nonlinear structure and its ability to provide information about changes over time. Figure 8 presents an example of the IMFs and trend component obtained after EMD analysis. This graph shares insights from the analysis of the MuSyQ dataset values from the Konya region. The related time series was decomposed into a total of six sub-series, with the last sub-series representing the trend. The sub-series that explained the most variance of the original data was IMF1 with 57.1%, followed by the trend component with 16.5%. Examining the trend component overlaid on the original time series reveals a decreasing trend during the first 100 months, followed by an increasing trend up to the 400th month, and then a slight decrease thereafter. However, the overall trend from the beginning to the end points is increasing.
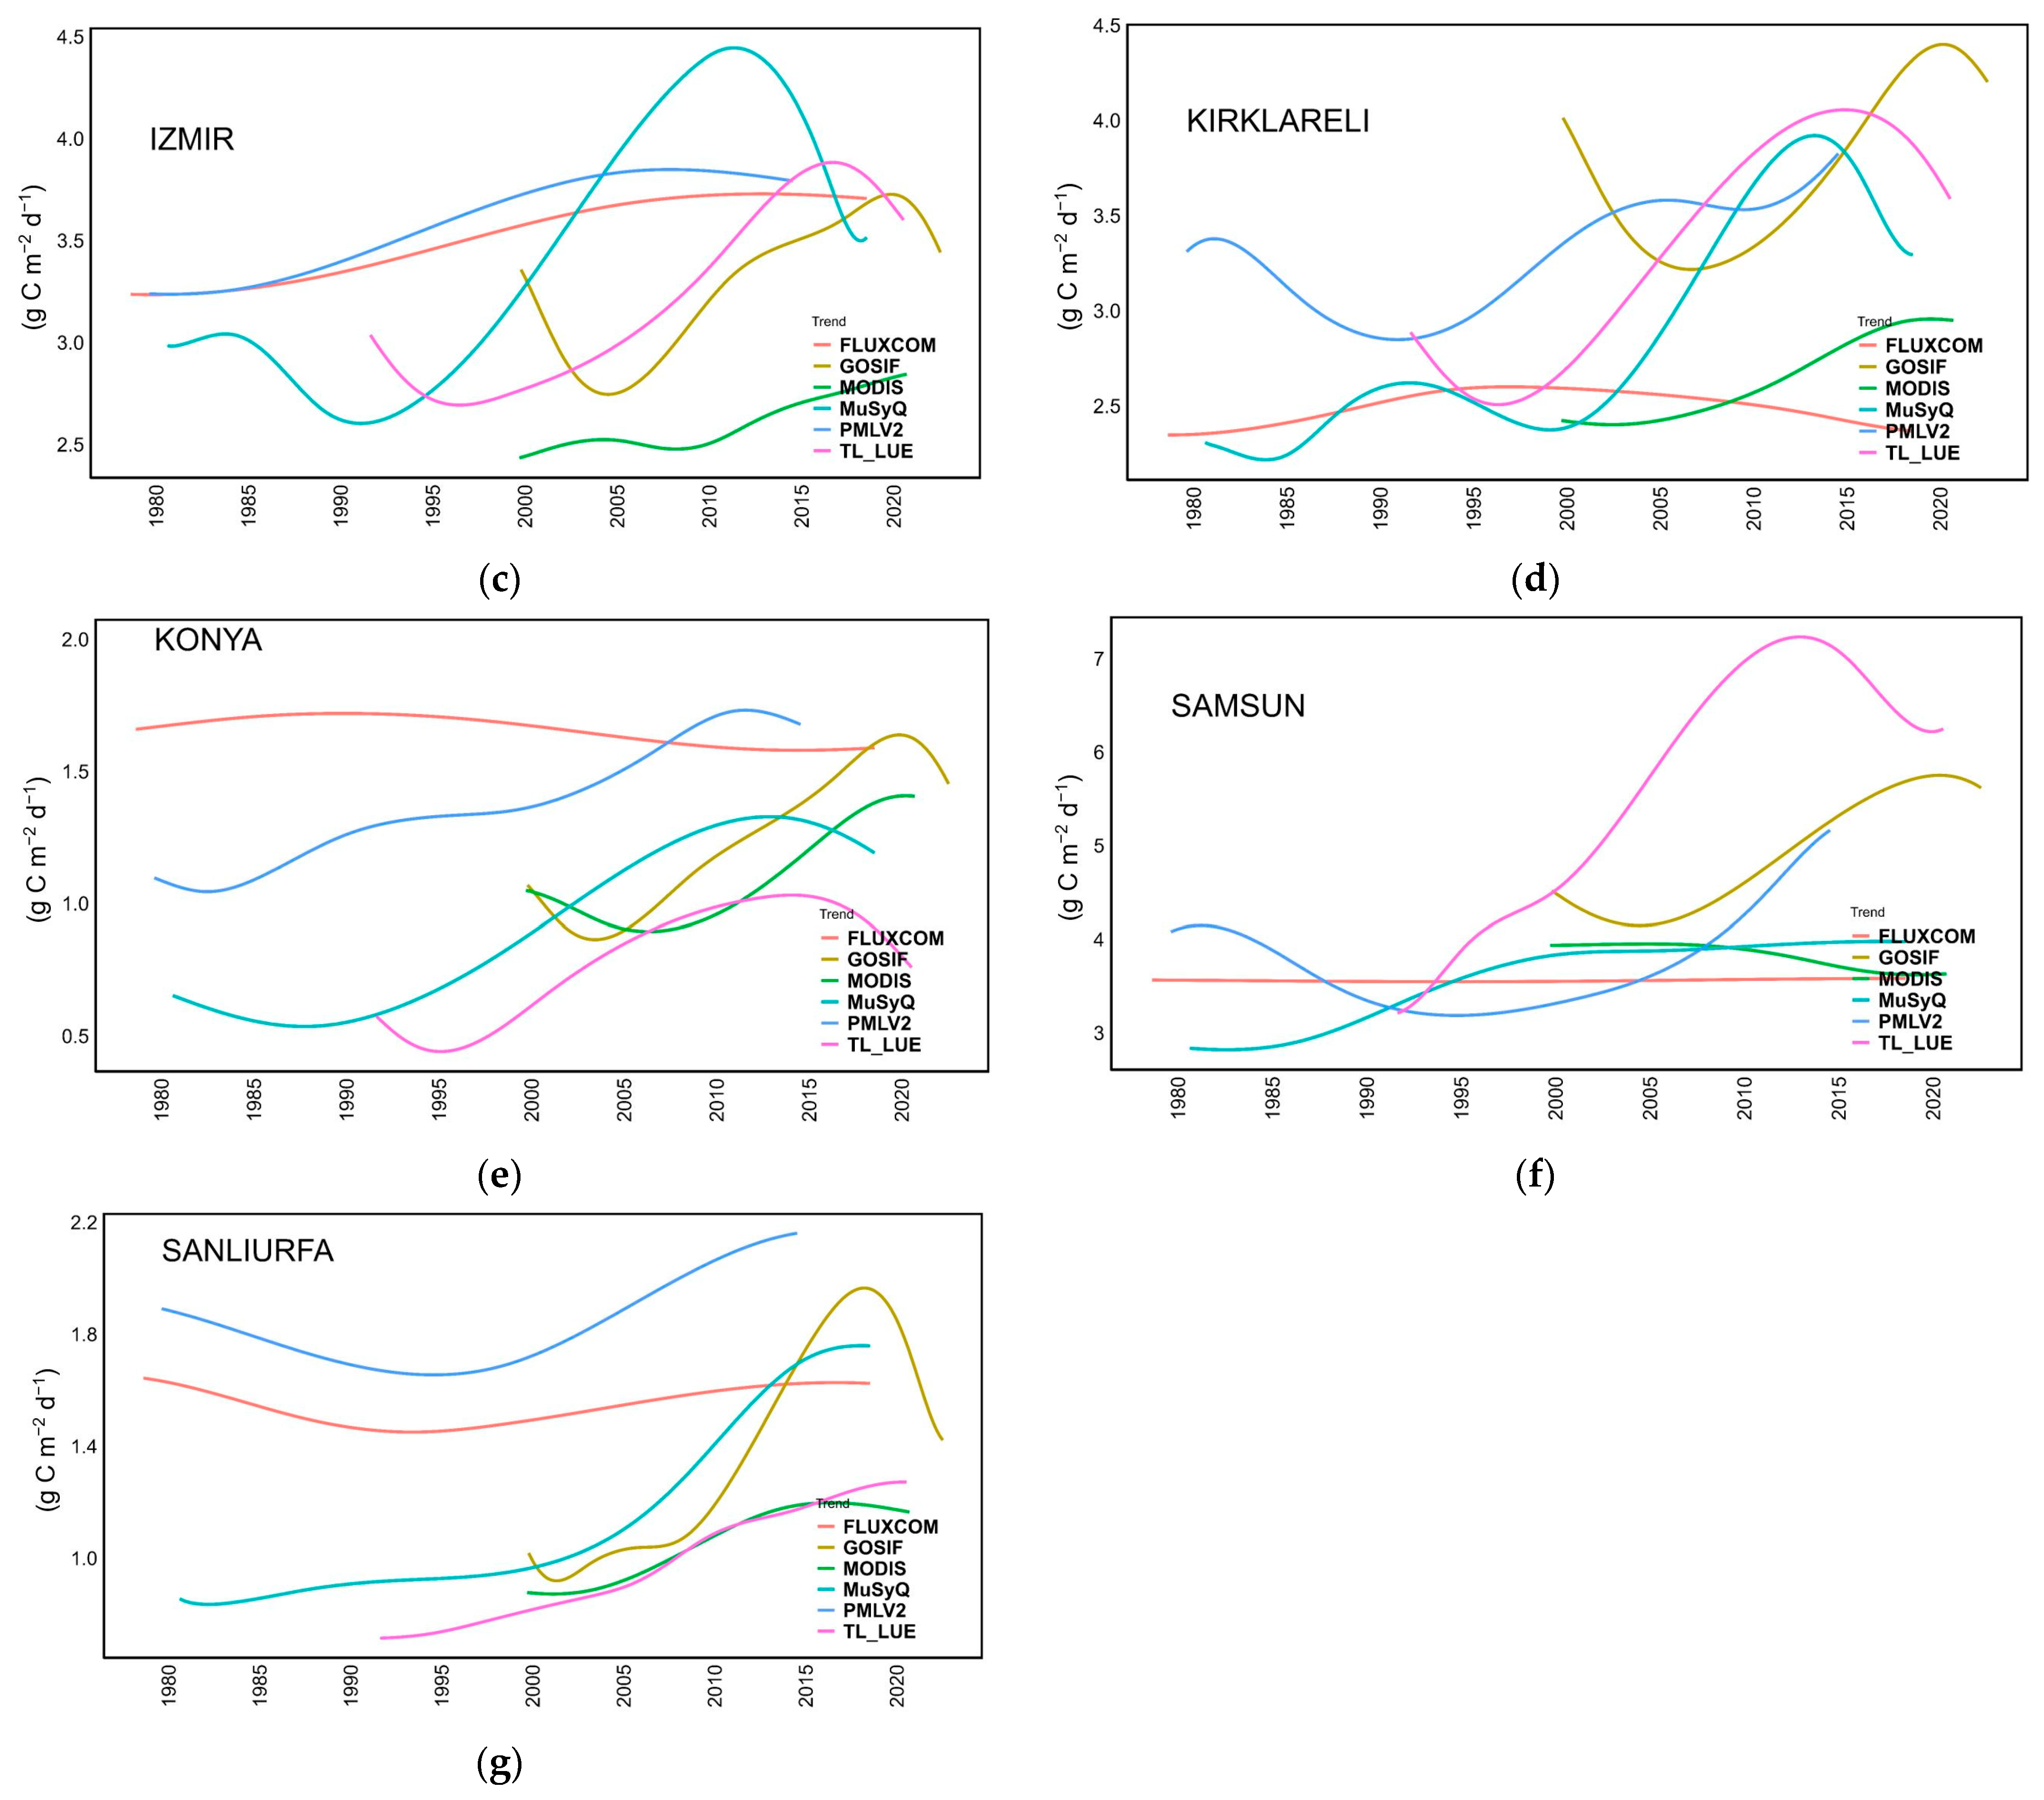
All the GPP values for each region were analyzed in this manner, and the sub-series obtained through EMD along with their VCR values are shared in the Supplementary Materials (Table S8). Upon examining Figure 9, for the Antalya region, an increasing trend can be observed in all datasets except for FLUXCOM. In TL-LUE and PMLV2, a nearly linear increase is observed, whereas in GOSIF, MODIS, and MuSyQ, a trend of initial decrease followed by an increase is detected. The lowest VCR, at 0.13%, is calculated for FLUXCOM, while the highest, at 5.5%, belongs to GOSIF; the GOSIF and MODIS trend bands exhibit similar behavior. In Erzincan, an increasing trend is apparent in most datasets with the highest VCR (4.1%) in TL-LUE. In the Izmir region, a slight increasing trend is observed in the FLUXCOM dataset with a VCR of 1.73%, while TL-LUE, MuSyQ, GOSIF, and PMLV2 show an initial decrease followed by an increase. In Konya, TL-LUE and MuSyQ exhibit similar behavior, as do MODIS and GOSIF. The most pronounced VCR, at 16.45%, is calculated for the trend in the MuSyQ data series. In Samsun, a near-linear increase is seen in TL-LUE and a decrease followed by an increase is observed in GOSIF, MODIS, and MuSyQ; this pattern is even more pronounced in PMLV2. In Sanliurfa, the most distinct trend behavior belongs to the MuSyQ dataset with a VCR of 11.61%. The TL-LUE trend series follows a near-linear course; the trend in the PMLV2 dataset can be interpreted as showing an overall trendless movement, decreasing until the midpoint and then increasing. All the time series and trend components obtained with EMD are shared in the Supplementary Materials (Figure S10).

6. Discussion

6.1. Overview

This study’s regional focus on Türkiye, segmented into seven distinct areas, provided a unique opportunity to explore GPP trends in varied ecological and climatic contexts. The use of six different GPP datasets—that could not be validated due to the limited presence of eddy covariance systems—aligns with the existing literature, showing an increasing trend in GPP across many global regions [2,3]. Our methodology, which incorporated multiple GPP estimates and trend analysis methods, lends confidence to the overall finding that GPP increased at the study locations but also leads to important nuances when interpreting results; we will describe these nuances in more detail below.
The datasets utilized, derived from various remote sensing methodologies, underscore the potential and challenges of using satellite data for GPP estimation. The inclusion of different calculation methods, namely Light Use Efficiency models (e.g., MODIS, MuSyQ, TL-LUE), machine learning (FLUXCOM), GPP proxies (GOSIF), and biophysical models (PMLV2) reinforces our results; for example, there are numerous outliers in the MODIS, GOSIF, and TL-LUE GPP datasets in the Konya region, whereas in the Sanliurfa region, similar findings are observed in the MODIS, PMLV2, GOSIF, and TL-LUE GPP datasets. Moreover, ITA analyses have demonstrated that there is a pronounced increasing trend in TL-LUE across all regions at high GPP values, meaning that large carbon uptake events are becoming larger. Significant increases at high values of the PMLV2 dataset were observed in the regions of Antalya, Erzincan, Izmir, and Konya. At the same time, the TL-LUE data have exhibited a declining trend in recent years across all areas, GPP values from the GOSIF dataset have shown a slight decreasing trend in recent years across all regions, except for Erzincan, and PMLV2 data have maintained a continuous increasing trend, which demonstrates the importance of using multiple datasets for a conservative interpretation of GPP trends.
Although most trend analysis methods agree on the presence of an increasing trend across most regions, they diverge in certain details. The MMK method follows a classical ranking-based approach, allowing for the interpretation of the presence of a trend based on a certain Z value, but lacks the graphical extrapolation capabilities of ITA and EMD. ITA provides detailed information about the trend status at low, medium, and high values, whereas EMD is more successful in explaining how the trend changes over time. The multi-method analysis ensures that the results are less likely to be an artifact of the particular method used [98].

6.2. Spatial Analysis of GPP Datasets

We noticed nuanced insights into the factors influencing GPP in various regions of Türkiye. Samsun, positioned along the Black Sea coast, emerged as the region with the highest average GPP, consistent with the wetter conditions (Figure 1) and coniferous forests in the area, including the Anatolian black pine (Pinus nigra) that has a relatively high photosynthetic capacity [99] and is relatively insensitive to ecoclimatic setting [100]. Additionally, Samsun’s climate, particularly its relative humidity, is more favorable to plant growth than other regions, resulting in a relatively lower vapor pressure deficit (VPD). GPP is strongly constrained by VPD [101] and the combination of favorable climate and dense forest cover create an optimal environment for high GPP. The Kirklareli region, known for its extensive agricultural activities, displayed the next highest average GPP. This region, situated in the north of Thrace, benefits from the western Black Sea’s precipitation patterns, receiving rainfall levels above the national average (Figure 1). The İzmir and Antalya regions, both influenced significantly by their coastal locations, exhibit distinct GPP dynamics. İzmir’s annual average precipitation tends to be lower than that of the coastal regions of Samsun and Antalya (Figure 1). However, its average temperature is higher than Samsun’s and similar to Antalya’s. The warmer temperatures in İzmir favor agricultural practices that depend on warm and humid conditions, and this intensive agricultural management impacts GPP, such that the selected region of Izmir has higher GPP than Antalya, albeit with similar trends (Figure 7 and Figure 9).
The Konya region is one of the least rainy areas in Türkiye and has a predominantly arid climate (Figure 1). The majority of agricultural activities in this region rely on dryland farming due to the limited availability of water. Konya has little forest cover, and the vegetation is largely dependent on the diversity of seasonally cultivated agricultural crops. According to data from the Turkish Statistical Institute (TUIK), the cultivated area in the region has increased from 1,326,220 hectares in 2004 to 1,507,451 hectares in 2022, which is consistent with the observed trend of increasing GPP values in the study region (Figure 7 and Figure 9). Similarly, the Sanliurfa region is characterized by low rainfall but has greater irrigation intensity than Konya, which supports large-scale agricultural operations [102]. After Konya, Sanliurfa has some of the lowest average GPP values among the regions studied, but likewise with an increasing trend (Figure 7 and Figure 9). These findings highlight the complex interplay between climatic factors, vegetation types, and topography in determining regional GPP and point to the importance of understanding ongoing GPP trends for ecological management and forecasting the impacts of climate change on regional productivity.

6.3. Temporal Analysis of GPP Datasets

In the analysis of the temporal trends of GPP values, the study employed various trend analysis methods, all of which were non-parametric, thus avoiding the strict preconditions associated with parametric methods like linear regression. Among these, the MK method is one of the most commonly used trend analysis methods. Although not a parametric method, it is generally preferred for data without high autocorrelation [103]. To enhance the reliability of the results, a modified MK method (MMK) was used in this study. Despite efforts to mitigate false trends arising from autocorrelation through pre-whitening processes, some studies have reported that MMK can still be prone to errors and may produce misleading results [104]. Notably, it interpreted significant trends far less often than ITA and EMD for the study datasets, such that the interpretation of GPP trends will often differ if MK (or MMK) or the graphical trend analysis methods, ITA or EMD, were used. ITA is adept at clearly delineating trends at both low and high values, while EMD provides information on how trends in GPP have increased or decreased over specific years. When assessing all regions collectively, the trend analysis results from ITA and EMD were similar.
Analysis with the MMK method using monthly GPP data across all regions revealed that the FLUXCOM dataset, consistent with the literature [70,105], showed a trendless pattern. In contrast, the MODIS dataset indicated a decreasing GPP trend during February, March, and April (Table 2)—although this was not observed in other datasets—which would lead one to search for the mechanisms underlying GPP changes during late winter and early spring. The most pronounced increases in GPP values were calculated during the summer months (Table 2), which would lead one to study how changes in climate, leaf area index, and perhaps agricultural intensity have altered GPP since the 1980s.
Izmir and Antalya displayed similar trends in GPP values (Figure 7). It is believed that this similarity is influenced by the fact that both regions share the same Köppen climate classification (Csa), indicating a similarity in their climatic conditions.
In examining the results of the EMD method, the FLUXCOM dataset consistently showed no trend across all regions, as expected [70,105]. A key distinction of the EMD method was its indication of initially decreasing trends in GPP values, followed by increasing trends (Figure 9), due, likely in part, to its search for the oscillating signals that underlie a dataset [89]. The GOSIF dataset showed a slight decreasing trend in recent years in all regions except Erzincan (Figure 9). Overall, these findings highlight the complexity of analyzing GPP trends and the importance of selecting appropriate trend analysis methods that can accurately reflect the temporal dynamics of GPP in various ecological settings. As mentioned by Du et al., a potential reason is that the GOSIF dataset was reconstructed using MODIS surface reflectance data, which may have led to some biases in its algorithms [106].

6.4. Differences and Similarities between GPP Datasets

In the study, correlation analysis and the Kruskal–Wallis test were applied to analyze the similarities and differences among the datasets. Initially, scatter plots were used to determine at which levels the datasets were more similar or different. It was generally observed that, while the similarity was high at lower values, it decreased with higher values, indicating the presence of increasing variance. Correlation values confirmed high positive relationships across all regions, but since these values were linear and not statistically powerful enough to compare the entire group together, the KW test was additionally applied. The results of the KW test and subsequent pairwise comparisons indicated that, in each region, at least one dataset possessed a distinct structure (Figure 6). The most significant difference among the GPP datasets was observed in the PMLV2 dataset. Its emphasis on following physical processes could be the reason for this divergence and, given its explicit coupling of the carbon and water cycles, one may argue that it has advantages for the temperate, semi-arid, and arid climate zones of Türkiye. A notable finding was that, in arid regions like Konya and Sanliurfa, almost all datasets exhibited differences (Figure 6), further emphasizing the importance of water limitation on GPP, GPP products, and their trends. Zhang and Aizhong Ye [107] reported similar results. Basically, the differences in various remote sensing-based GPP products can be attributed to different algorithms using different input data and having different parameter values when describing environmental mechanisms over climate zones [108]. In addition, stomatal closure when drought occurs in terrestrial ecosystems has been shown to affect photosynthesis due to limited leaf and canopy water content or high VPD in the atmosphere. Different GPP models using different model parameters, such as the maximum LUE and optimum temperature for different ecosystems, are the second major contributor to the possible differences in arid regions. Moreover, different GPP datasets in the literature have used different flux tower data to calibrate LUE parameters, which may also contribute to differences in simulated GPP [109]. The use of different leaf area index data and land cover data [50] can also cause significant differences. Additionally, the number of outliers in all datasets for these regions was higher than in other regions. These analyses suggest that variations in the algorithms of the datasets significantly impact the calculation of values in arid regions. Therefore, it is recommended that, in developing new GPP prediction methods, one should consider these variations and devise algorithms that account for the distinct characteristics of arid regions.

6.5. The Importance of the Findings

When making a general commentary on the results obtained from this study, a trend of increasing greenness in Türkiye was identified, consistent with many global regions [3]. The observed low GPP values in the semi-arid regions of Türkiye (Konya, Sanliurfa, and Erzincan) are attributed to the high sensitivity of semi-arid ecosystems to water availability. Adverse trends in rainfall can lead to abrupt declines in vegetation productivity or the loss of ecosystem resilience [110]. Additionally, vegetation in arid areas is more sensitive to changes in environmental factors, which can significantly underestimate maximum LUE values in arid ecosystem models [111]. Consequently, the lack of appropriate LUE parameters in arid areas and the inability to accurately simulate the complex relationship between water and the LUE contribute to most LUE models yielding low GPP estimates [112].
GPP values vary across different geographical regions, and it is strongly recommended that these values be examined on a region-specific basis. Identifying the parameters that most significantly affect GPP and, if necessary, using local adjustment coefficients to enhance the representational accuracy of GPP datasets are crucial. Given Türkiye’s geographical position, surrounded by seas on three sides and hosting a variety of microclimates, it is essential to increase the number of ground observation stations to enable more accurate carbon cycle analyses. Doing so across Türkiye’s geographical regions would be beneficial given the differences in GPP magnitudes and trends. These measurements should then be used to calibrate remote sensing datasets, ensuring that they accurately reflect the distinct environmental and ecological characteristics of each region in Türkiye. This approach will not only improve the accuracy of current GPP estimations but also enhance our understanding of regional ecological dynamics, contributing to better environmental management and policymaking.

6.6. Limitations of Study

Our study has some limitations. The most important limitation is that the GPP values produced by remote sensing systems cannot be verified with site measurement data in the study area. This is due to the very limited number of eddy covariance systems in Turkey. The spatial resolution of the datasets used in the study is limited to 0.05 degrees, and more accurate analyses could result from higher-resolution data in light of recent developments in remote sensing systems.

7. Conclusions

In this study, spatiotemporal analysis of GPP values for seven major regions in Türkiye was conducted. We evaluated different remote sensing products for GPP, since there are inadequate measurement systems, i.e., flux towers and tower networks, in the study area. While many studies in the literature have focused on the global-scale analysis of GPP values, local-scale analyses are rarely conducted. Moreover, many studies in the literature have focused on annual GPP sums, whereas this study presents monthly analyses of GPP. The key conclusions drawn from this study can be listed as follows:
  • GPP values show high similarity among datasets at low values, but this similarity decreases at high GPP values. The inputs used by the algorithms differ and more meticulous regional calibration and validation are necessary. When conducting a monthly trend analysis of GPP values, only the MODIS dataset exhibited a decreasing trend at certain months. The factors causing this trend should be further investigated. Additionally, significant increasing trends are detected in GPP values during summer months. There are many potential mechanisms that underlie these trends, which should be studied further to understand the changing carbon cycle of Türkiye.
  • The ITA and EMD methods could be promising alternatives to MMK as they provide additional insight into how time series change. This comparison in the field of GPP is a first, and future studies may benefit from these methods for trend analysis. The ITA and EMD methods have already made substantial contributions to the literature in terms of visualizing trends. While ITA can easily detect trends at low and high values, EMD stands out for answering how the trend follows a nonlinear path over time. Optimizing the hyperparameters of the EMD method could lead to the more rational extraction of trend component information.
We hope that the present analysis helps motivate more studies on carbon cycling and its trends, in Türkiye and other regions that are under-represented in flux networks, to improve our mechanistic understanding of the carbon cycle across larger regions of the globe. Also, researchers are encouraged to use data with higher spatial resolution in future studies, to work with data classified according to plant functional type, and to analyze variables that may affect the trends in GPP values.

Supplementary Materials

The following supporting information can be downloaded at: https://www.mdpi.com/article/10.3390/rs16111994/s1, Figure S1. MODIS GPP algorithm flow chart.. Figure S2. The MuSyQ GPP algorithm flowchart.. Figure S3: Histograms and time series of MODIS datasets (a) Antalya, (b) Erzincan, (c) Izmir, (d) Kirklareli, (e) Konya, (f) Samsun, (g) Sanliurfa. Figure S4. Histograms and time series of MuSyQ datasets (a) Antalya, (b) Erzincan, (c) Izmir, (d) Kirklareli, (e) Konya, (f) Samsun, (g) Sanliurfa. Figure S5. Histograms and time series of PMLV2 datasets (a) Antalya, (b) Erzincan, (c) Izmir, (d) Kirklareli, (e) Konya, (f) Samsun, (g) Sanliurfa. Figure S6. Histograms and time series of TL-LUE datasets (a) Antalya, (b) Erzincan, (c) Izmir, (d) Kirklareli, (e) Konya, (f) Samsun, (g) Sanliurfa. Figure S7. Histograms and time series of GOSIF datasets (a) Antalya, (b) Erzincan, (c) Izmir, (d) Kirklareli, (e) Konya, (f) Samsun, (g) Sanliurfa. Figure S8. Histograms and time series of FLUXCOM datasets (a) Antalya, (b) Erzincan, (c) Izmir, (d) Kirklareli, (e) Konya, (f) Samsun, (g) Sanliurfa. Figure S9. ITA trend analysis results (horizontal and vertical axes show GPP values in g C m−2 d−1), (a) Antalya, (b) Erzincan, (c) Izmir, (d) Kirklareli, (e) Konya, (f) Samsun, (g) Sanliurfa. Figure S10. EMD trend analysis results (the horizontal axis shows time; the vertical axis shows GPP values), (a) Antalya, (b) Erzincan, (c) Izmir, (d) Kirklareli, (e) Konya, (f) Samsun, (g) Sanliurfa. Table S1. Mann-Kendall and Sens’ Slope trend analysis results of Antalya region. Table S2. Mann-Kendall and Sens’ Slope trend analysis results of Erzincan region. Table S3. Mann-Kendall and Sens’ Slope trend analysis results of Izmir region. Table S4. Mann-Kendall and Sens’ Slope trend analysis results of Kirklareli region. Table S5. Mann-Kendall and Sens’ Slope trend analysis results of Konya region. Table S6. Mann-Kendall and Sens’ Slope trend analysis results of Samsun region. Table S7. Mann-Kendall and Sens’ Slope trend analysis results of Sanliurfa region. Table S8. Variance contribution rate of IMFs.

Author Contributions

Conceptualization, E.E.B.; methodology, E.E.B.; software, E.E.B.; validation, E.E.B.; formal analysis, E.E.B.; investigation, E.E.B.; writing—original draft preparation, E.E.B. and P.C.S.; writing—review and editing, P.C.S. and Q.B.P.; visualization, E.E.B.; supervision, M.C.D. All authors have read and agreed to the published version of the manuscript.

Funding

This research was funded by the Scientific and Technological Research Council of Türkiye (TÜBİTAK), BIDEB2214-A program, grant number 1059B142201613.

Data Availability Statement

We also appreciate the open source data of global GPP products (MODIS, https://doi.org/10.25592/uhhfdm.8880 (accessed on 11 December 2023); MuSyQ, https://doi.org/10.5281/zenodo.3996814 (accessed on 11 December 2023); PMLV2, https://doi.org/10.6084/m9.figshare.14185739.v4 (accessed on 11 December 2023); TL-LUE; https://doi.org/10.5061/dryad.dfn2z352k (accessed on 11 December 2023); GOSIF, https://doi.org/10.3390/rs11212563 (accessed on 11 December 2023); FLUXCOM; http://www.fluxdata.org (accessed on 11 December 2023)).

Acknowledgments

The authors would like to thank the Scientific and Technological Research Council of Türkiye (TÜBİTAK) for their support in funding doctoral research. We would like to thank the Turkish State of Meteorological Service (MGM) for providing data. This work was supported by the Turkish National Center for High Performance Computing (UHeM) under grants 1007292019.

Conflicts of Interest

The authors declare no conflicts of interest.

References

  1. Friedlingstein, P.; O’Sullivan, M.; Jones, M.W.; Andrew, R.M.; Bakker, D.C.E.; Hauck, J.; Landschützer, P.; Le Quéré, C.; Luijkx, I.T.; Peters, G.P.; et al. Global Carbon Budget 2023. Earth Syst. Sci. Data 2023, 15, 5301–5369. [Google Scholar] [CrossRef]
  2. Zhu, Z.; Piao, S.; Myneni, R.B.; Huang, M.; Zeng, Z.; Canadell, J.G.; Ciais, P.; Sitch, S.; Friedlingstein, P.; Arneth, A.; et al. Greening of the Earth and Its Drivers. Nat. Clim. Chang. 2016, 6, 791–795. [Google Scholar] [CrossRef]
  3. Piao, S.; Wang, X.; Park, T.; Chen, C.; Lian, X.; He, Y.; Bjerke, J.W.; Chen, A.; Ciais, P.; Tømmervik, H.; et al. Characteristics, Drivers and Feedbacks of Global Greening. Nat. Rev. Earth Environ. 2019, 1, 14–27. [Google Scholar] [CrossRef]
  4. Keenan, T.F.; Luo, X.; Stocker, B.D.; De Kauwe, M.G.; Medlyn, B.E.; Prentice, I.C.; Smith, N.G.; Terrer, C.; Wang, H.; Zhang, Y.; et al. A Constraint on Historic Growth in Global Photosynthesis Due to Rising CO2. Nat. Clim. Chang. 2023, 13, 1376–1381. [Google Scholar] [CrossRef]
  5. Lu, Q.; Liu, H.; Wei, L.; Zhong, Y.; Zhou, Z. Global Prediction of Gross Primary Productivity under Future Climate Change. Sci. Total Environ. 2024, 912, 169239. [Google Scholar] [CrossRef] [PubMed]
  6. Liang, C.; Zhang, M.; Wang, Z.; Xiang, X.; Gong, H.; Wang, K.; Liu, H. The Strengthened Impact of Water Availability at Interannual and Decadal Time Scales on Vegetation GPP. Glob. Chang. Biol. 2024, 30, e17138. [Google Scholar] [CrossRef] [PubMed]
  7. Madani, N.; Parazoo, N.C.; Kimball, J.S.; Ballantyne, A.P.; Reichle, R.H.; Maneta, M.; Saatchi, S.; Palmer, P.I.; Liu, Z.; Tagesson, T. Recent Amplified Global Gross Primary Productivity Due to Temperature Increase Is Offset by Reduced Productivity Due to Water Constraints. AGU Adv. 2020, 1, e2020AV000180. [Google Scholar] [CrossRef]
  8. Hilker, T.; Coops, N.C.; Wulder, M.A.; Black, T.A.; Guy, R.D. The Use of Remote Sensing in Light Use Efficiency Based Models of Gross Primary Production: A Review of Current Status and Future Requirements. Sci. Total Environ. 2008, 404, 411–423. [Google Scholar] [CrossRef]
  9. Song, C.; Dannenberg, M.P.; Hwang, T. Optical Remote Sensing of Terrestrial Ecosystem Primary Productivity. Prog. Phys. Geogr. Earth Environ. 2013, 37, 834–854. [Google Scholar] [CrossRef]
  10. Anav, A.; Friedlingstein, P.; Beer, C.; Ciais, P.; Harper, A.; Jones, C.; Murray-Tortarolo, G.; Papale, D.; Parazoo, N.C.; Peylin, P.; et al. Spatiotemporal Patterns of Terrestrial Gross Primary Production: A Review. Rev. Geophys. 2015, 53, 785–818. [Google Scholar] [CrossRef]
  11. Zhou, Y.; Zhang, L.; Xiao, J.; Chen, S.; Kato, T.; Zhou, G. A Comparison of Satellite-Derived Vegetation Indices for Approximating Gross Primary Productivity of Grasslands. Rangel. Ecol. Manag. 2014, 67, 9–18. [Google Scholar] [CrossRef]
  12. Jiang, C.; Guan, K.; Wu, G.; Peng, B.; Wang, S. A Daily, 250 m and Real-Time Gross Primary Productivity Product (2000–Present) Covering the Contiguous United States. Earth Syst. Sci. Data 2021, 13, 281–298. [Google Scholar] [CrossRef]
  13. Zhang, Y.; Ye, A. Uncertainty Analysis of Multiple Terrestrial Gross Primary Productivity Products. Glob. Ecol. Biogeogr. 2022, 31, 2204–2218. [Google Scholar] [CrossRef]
  14. Huang, N.E.; Shen, Z.; Long, S.R.; Wu, M.C.; Shih, H.H.; Zheng, Q.; Yen, N.-C.; Tung, C.C.; Liu, H.H. The Empirical Mode Decomposition and the Hilbert Spectrum for Nonlinear and Non-Stationary Time Series Analysis. Proc. R. Soc. London. Ser. A Math. Phys. Eng. Sci. 1998, 454, 903–995. [Google Scholar] [CrossRef]
  15. Mann, H.B. Nonparametric Tests Against Trend. Econometrica 1945, 13, 245. [Google Scholar] [CrossRef]
  16. Sen, P.K. Estimates of the Regression Coefficient Based on Kendall’s Tau. J. Am. Stat. Assoc. 1968, 63, 1379–1389. [Google Scholar] [CrossRef]
  17. Şen, Z. Innovative Trend Analysis Methodology. J. Hydrol. Eng. 2012, 17, 1042–1046. [Google Scholar] [CrossRef]
  18. Tucker, C.; Yan, D.; Dannenberg, M.; Reed, S.C.; Smith, W. Science at the Frontier: Multimethod Research to Evaluate Ecosystem Change across Multiple Scales. New Phytol. 2018, 218, 1318–1320. [Google Scholar] [CrossRef] [PubMed]
  19. Moore, C.E.; Beringer, J.; Donohue, R.J.; Evans, B.; Exbrayat, J.-F.; Hutley, L.B.; Tapper, N.J. Seasonal, Interannual and Decadal Drivers of Tree and Grass Productivity in an Australian Tropical Savanna. Glob. Chang. Biol. 2018, 24, 2530–2544. [Google Scholar] [CrossRef]
  20. Ma, J.; Xiao, X.; Miao, R.; Li, Y.; Chen, B.; Zhang, Y.; Zhao, B. Trends and Controls of Terrestrial Gross Primary Productivity of China during 2000–2016. Environ. Res. Lett. 2019, 14, 084032. [Google Scholar] [CrossRef]
  21. Gupta, S.; Deb Burman, P.K.; Tiwari, Y.K.; Dumka, U.C.; Kumari, N.; Srivastava, A.; Raghubanshi, A.S. Understanding Carbon Sequestration Trends Using Model and Satellite Data under Different Ecosystems in India. Sci. Total Environ. 2023, 897, 166381. [Google Scholar] [CrossRef] [PubMed]
  22. Liu, X.; Cui, Y.; Li, W.; Li, M.; Li, N.; Shi, Z.; Dong, J.; Xiao, X. Urbanization Expands the Fluctuating Difference in Gross Primary Productivity between Urban and Rural Areas from 2000 to 2018 in China. Sci. Total Environ. 2023, 901, 166490. [Google Scholar] [CrossRef] [PubMed]
  23. Tian, F.; Zhang, Y. Spatiotemporal Patterns of Evapotranspiration, Gross Primary Productivity, and Water Use Efficiency of Cropland in Agroecosystems and Their Relation to the Water-Saving Project in the Shiyang River Basin of Northwestern China. Comput. Electron. Agric. 2020, 172, 105379. [Google Scholar] [CrossRef]
  24. He, P.; Ma, X.; Meng, X.; Han, Z.; Liu, H.; Sun, Z. Spatiotemporal Evolutionary and Mechanism Analysis of Grassland GPP in China. Ecol. Indic. 2022, 143, 109323. [Google Scholar] [CrossRef]
  25. Yang, R.; Wang, J.; Zeng, N.; Sitch, S.; Tang, W.; McGrath, M.J.; Cai, Q.; Liu, D.; Lombardozzi, D.; Tian, H.; et al. Divergent Historical GPP Trends among State-of-the-Art Multi-Model Simulations and Satellite-Based Products. Earth Syst. Dyn. 2022, 13, 833–849. [Google Scholar] [CrossRef]
  26. Tang, X.; Li, H.; Huang, N.; Li, X.; Xu, X.; Ding, Z.; Xie, J. A Comprehensive Assessment of MODIS-Derived GPP for Forest Ecosystems Using the Site-Level FLUXNET Database. Environ. Earth Sci. 2015, 74, 5907–5918. [Google Scholar] [CrossRef]
  27. Shi, X.; Zhang, D.; Ding, H.; Chen, X.; Zhang, J. Distribution, Trends and Drivers of Precipitation Use Efficiency in the Loess Plateau. Hydrol. Process. 2024, 38, e15102. [Google Scholar] [CrossRef]
  28. Cai, S.; Zuo, D.; Wang, H.; Xu, Z.; Wang, G.Q.; Yang, H. Assessment of Agricultural Drought Based on Multi-Source Remote Sensing Data in a Major Grain Producing Area of Northwest China. Agric. Water Manag. 2023, 278, 108142. [Google Scholar] [CrossRef]
  29. Lv, Y.; Li, X.; Chi, W. Maximum Gross Primary Productivity Dominates the Trend in Gross Primary Productivity in China’s Deciduous Forest Ecosystems. Forests 2023, 14, 1880. [Google Scholar] [CrossRef]
  30. Liu, H.; Liu, Y.; Chen, Y.; Fan, M.; Chen, Y.; Gang, C.; You, Y.; Wang, Z. Dynamics of Global Dryland Vegetation Were More Sensitive to Soil Moisture: Evidence from Multiple Vegetation Indices. Agric. For. Meteorol. 2023, 331, 109327. [Google Scholar] [CrossRef]
  31. Sarkar, D.P.; Uma Shankar, B.; Ranjan Parida, B. A Novel Approach for Retrieving GPP of Evergreen Forest Regions of India Using Random Forest Regression. Remote Sens. Appl. Soc. Environ. 2024, 33, 101116. [Google Scholar] [CrossRef]
  32. Hutley, L.B.; Beringer, J.; Fatichi, S.; Schymanski, S.J.; Northwood, M. Gross Primary Productivity and Water Use Efficiency Are Increasing in a High Rainfall Tropical Savanna. Glob. Chang. Biol. 2022, 28, 2360–2380. [Google Scholar] [CrossRef]
  33. O, S.; Park, S.K. Global Ecosystem Responses to Flash Droughts Are Modulated by Background Climate and Vegetation Conditions. Commun. Earth Environ. 2024, 5, 88. [Google Scholar] [CrossRef]
  34. Evrendilek, F.; Karakaya, N.; Aslan, G.; Ertekin, C. Using Eddy Covariance Sensors to Quantify Carbon Metabolism of Peatlands: A Case Study in Turkey. Sensors 2011, 11, 522–538. [Google Scholar] [CrossRef]
  35. Șaylan, L.; Ceyhan, E.S.; Bakanoğullarİ, F.; Çaldağ, B.; Özkoca, Y.; Uysal, S.K.; Altınbas, N.; Eitzinger, J. Analysis of Seasonal Carbon Dioxide Exchange of Winter Wheat Using Eddy Covariance Method in the Northwest Part of Turkey. Ital. J. Agrometeorol. 2018, 23, 39–52. [Google Scholar]
  36. Yesilkoy, S.; Akatas, N.; Caldag, B.; Saylan, L. Comparison of Modeled and Measured CO2 Exchanges over Winter Wheat in the Thrace Part of Turkey. Fresenius Environ. Bull. 2017, 26, 93–99. [Google Scholar]
  37. Gulbeyaz, O.; Bond-Lamberty, B.; Akyurek, Z.; West, T.O. A New Approach to Evaluate the MODIS Annual NPP Product (MOD17A3) Using Forest Field Data from Turkey. Int. J. Remote Sens. 2018, 39, 2560–2578. [Google Scholar] [CrossRef]
  38. Stoy, P.C.; Roh, J.; Bromley, G.T. It’s the Heat and the Humidity: The Complementary Roles of Temperature and Specific Humidity to Recent Changes in the Energy Content of the Near-Surface Atmosphere. Geophys. Res. Lett. 2022, 49, e2021GL096628. [Google Scholar] [CrossRef]
  39. Tayanç, M.; İm, U.; Doğruel, M.; Karaca, M. Climate Change in Turkey for the Last Half Century. Clim. Chang. 2009, 94, 483–502. [Google Scholar] [CrossRef]
  40. Türkeș, M.; Yozgatlıgil, C.; Batmaz, İ.; İyigün, C.; Kartal Koç, E.; Fahmi, F.; Aslan, S. Has the Climate Been Changing in Turkey? Regional Climate Change Signals Based on a Comparative Statistical Analysis of Two Consecutive Time Periods, 1950–1980 and 1981–2010. Clim. Res. 2016, 70, 77–93. [Google Scholar] [CrossRef]
  41. Selek, B.; Tuncok, I.K.; Selek, Z. Changes in Climate Zones across Turkey. J. Water Clim. Chang. 2018, 9, 178–195. [Google Scholar] [CrossRef]
  42. Demircan, M.; Gürkan, H.; Eskioğlu, O.; Arabacı, H.; Coşkun, M. Climate Change Projections for Turkey: Three Models and Two Scenarios. Turk. J. Water Sci. Manag. 2017, 1, 22–43. [Google Scholar] [CrossRef]
  43. Turkes, M.; Turp, M.T.; An, N.; Ozturk, T.; Kurnaz, M.L. Impacts of Climate Change on Precipitation Climatology and Variability in Turkey; Harmancioglu, N.B., Altinbilek, D., Eds.; Springer International Publishing: Cham, Switzerland, 2020; pp. 467–491. ISBN 978-3-030-11729-0. [Google Scholar]
  44. Erşahin, S.; Bilgili, B.C.; Dikmen, Ü.; Ercanli, İ. Net Primary Productivity of Anatolian Forests in Relation to Climate, 2000–2010. For. Sci. 2016, 62, 698–709. [Google Scholar] [CrossRef]
  45. Bilgili, B.C.; Erşahin, S.; Kavakligil, S.S.; Öner, N. Net Primary Productivity of A Mountain Forest Ecosystem as Affected by Climate and Topography. CERNE 2020, 26, 356–368. [Google Scholar] [CrossRef]
  46. Aksu, H.; Taflan, G.Y.; Yaldiz, S.G.; Akgül, M.A. Evaluation of IMERG for GPM Satellite-Based Precipitation Products for Extreme Precipitation Indices over Turkiye. Atmos. Res. 2023, 291, 106826. [Google Scholar] [CrossRef]
  47. Demir, V.; Citakoglu, H. Forecasting of Solar Radiation Using Different Machine Learning Approaches. Neural Comput. Appl. 2023, 35, 887–906. [Google Scholar] [CrossRef]
  48. Biltekin, D.; Eriş, K.K.; Çağatay, M.N.; Henry, P.; Yakupoğlu, N. New Records of Vegetation and Climate Changes in the Sea of Marmara during the Marine Isotope Stages 3, 4 and 5 (a-C). Quat. Int. 2023, 667, 1–18. [Google Scholar] [CrossRef]
  49. Zeybekoğlu, U.; Keskin, A.Ü. Defining Rainfall Intensity Clusters in Turkey by Using the Fuzzy C-Means Algorithm. Geofizika 2020, 37, 181–195. [Google Scholar] [CrossRef]
  50. Bi, W.; He, W.; Zhou, Y.; Ju, W.; Liu, Y.; Liu, Y.; Zhang, X.; Wei, X.; Cheng, N. A Global 0.05° Dataset for Gross Primary Production of Sunlit and Shaded Vegetation Canopies from 1992 to 2020. Sci. Data 2022, 9, 213. [Google Scholar] [CrossRef] [PubMed]
  51. Turner, D.P.; Ritts, W.D.; Cohen, W.B.; Gower, S.T.; Running, S.W.; Zhao, M.; Costa, M.H.; Kirschbaum, A.A.; Ham, J.M.; Saleska, S.R.; et al. Evaluation of MODIS NPP and GPP Products across Multiple Biomes. Remote Sens. Environ. 2006, 102, 282–292. [Google Scholar] [CrossRef]
  52. Xie, X.; Li, A.; Tian, J.; Wu, C.; Jin, H. A Fine Spatial Resolution Estimation Scheme for Large-Scale Gross Primary Productivity (GPP) in Mountain Ecosystems by Integrating an Eco-Hydrological Model with the Combination of Linear and Non-Linear Downscaling Processes. J. Hydrol. 2023, 616, 128833. [Google Scholar] [CrossRef]
  53. Running, S.W.; Nemani, R.R.; Heinsch, F.A.; Zhao, M.; Reeves, M.; Hashimoto, H. A Continuous Satellite-Derived Measure of Global Terrestrial Primary Production. Bioscience 2004, 54, 547–560. [Google Scholar] [CrossRef]
  54. Monteith, J.L. Solar Radiation and Productivity in Tropical Ecosystems. J. Appl. Ecol. 1972, 9, 747–766. [Google Scholar] [CrossRef]
  55. Kern, S. MODIS Collection 6 Global 8-Daily Gross Primary Production. 2021, (Version 2020_fv0.01) [Data set]. [CrossRef]
  56. Wang, J.; Sun, R.; Zhang, H.; Xiao, Z.; Zhu, A.; Wang, M.; Yu, T.; Xiang, K. New Global MuSyQ GPP/NPP Remote Sensing Products from 1981 to 2018. IEEE J. Sel. Top. Appl. Earth Obs. Remote Sens. 2021, 14, 5596–5612. [Google Scholar] [CrossRef]
  57. Sun, R.; Xiao, Z.; Wang, J.; Zhu, A.; Wang, M. Algorithm of Global Gross and Net Primary Productivity Products. 2020. Available online: https://zenodo.org/records/3996814 (accessed on 11 December 2023).
  58. Leuning, R.; Zhang, Y.Q.; Rajaud, A.; Cleugh, H.; Tu, K. A Simple Surface Conductance Model to Estimate Regional Evaporation Using MODIS Leaf Area Index and the Penman-Monteith Equation. Water Resour. Res. 2008, 44, W10419. [Google Scholar] [CrossRef]
  59. Pei, Y.; Dong, J.; Zhang, Y.; Yang, J.; Zhang, Y.; Jiang, C.; Xiao, X. Performance of Four State-of-the-Art GPP Products (VPM, MOD17, BESS and PML) for Grasslands in Drought Years. Ecol. Inform. 2020, 56, 101052. [Google Scholar] [CrossRef]
  60. Gan, R.; Zhang, Y.; Shi, H.; Yang, Y.; Eamus, D.; Cheng, L.; Chiew, F.H.S.; Yu, Q. Use of Satellite Leaf Area Index Estimating Evapotranspiration and Gross Assimilation for Australian Ecosystems. Ecohydrology 2018, 11, e1974. [Google Scholar] [CrossRef]
  61. Li, B.; Ryu, Y.; Jiang, C.; Dechant, B.; Liu, J.; Yan, Y.; Li, X. BESSv2.0: A Satellite-Based and Coupled-Process Model for Quantifying Long-Term Global Land–Atmosphere Fluxes. Remote Sens. Environ. 2023, 295, 113696. [Google Scholar] [CrossRef]
  62. Naeem, S.; Zhang, Y.; Zhang, X.; Rehman, A.U.; Tang, Z.; Xu, Z.; Li, C.; Azeem, T. Recent Change in Ecosystem Water Use Efficiency in China Mainly Dominated by Vegetation Greening and Increased CO2. Remote Sens. Environ. 2023, 298, 113811. [Google Scholar] [CrossRef]
  63. Zhang, X.; Zhang, Y.; Ma, N.; Kong, D.; Tian, J.; Shao, X.; Tang, Q. Greening-Induced Increase in Evapotranspiration over Eurasia Offset by CO2-Induced Vegetational Stomatal Closure. Environ. Res. Lett. 2021, 16, 124008. [Google Scholar] [CrossRef]
  64. Zhang, X.; Zhang, Y.; Kong, D. Global Monthly GPP, ET, Ec, Es and Ei Simulated by PML-V2 with AVHRR Data at a 0.05 Degree Resolution over 1982–2014. Figshare. [Dataset]. 2023. [CrossRef]
  65. He, M.; Ju, W.; Zhou, Y.; Chen, J.; He, H.; Wang, S.; Wang, H.; Guan, D.; Yan, J.; Li, Y.; et al. Development of a Two-Leaf Light Use Efficiency Model for Improving the Calculation of Terrestrial Gross Primary Productivity. Agric. For. Meteorol. 2013, 173, 28–39. [Google Scholar] [CrossRef]
  66. Bi, W.; Zhou, Y. A Global 0.05° Dataset for Gross Primary Production of Sunlit and Shaded Vegetation Canopies (1992–2020). 2022 [Dataset]. Dryad. [CrossRef]
  67. Li, X.; Xiao, J. Mapping Photosynthesis Solely from Solar-Induced Chlorophyll Fluorescence: A Global, Fine-Resolution Dataset of Gross Primary Production Derived from OCO-2. Remote Sens. 2019, 11, 2563. [Google Scholar] [CrossRef]
  68. Gu, Q.; Zheng, H.; Yao, L.; Wang, M.; Ma, M.; Wang, X.; Tang, X. Performance of the Remotely-Derived Products in Monitoring Gross Primary Production across Arid and Semi-Arid Ecosystems in Northwest China. Land 2020, 9, 288. [Google Scholar] [CrossRef]
  69. Tramontana, G.; Jung, M.; Schwalm, C.R.; Ichii, K.; Camps-Valls, G.; Ráduly, B.; Reichstein, M.; Arain, M.A.; Cescatti, A.; Kiely, G.; et al. Predicting Carbon Dioxide and Energy Fluxes across Global FLUXNET Sites with Regression Algorithms. Biogeosciences 2016, 13, 4291–4313. [Google Scholar] [CrossRef]
  70. Jung, M.; Koirala, S.; Weber, U.; Ichii, K.; Gans, F.; Camps-Valls, G.; Papale, D.; Schwalm, C.; Tramontana, G.; Reichstein, M. The FLUXCOM Ensemble of Global Land-Atmosphere Energy Fluxes. Sci. Data 2019, 6, 74. [Google Scholar] [CrossRef]
  71. Running, S.W.; Baldocchi, D.D.; Turner, D.P.; Gower, S.T.; Bakwin, P.S.; Hibbard, K.A. A Global Terrestrial Monitoring Network Integrating Tower Fluxes, Flask Sampling, Ecosystem Modeling and EOS Satellite Data. Remote Sens. Environ. 1999, 70, 108–127. [Google Scholar] [CrossRef]
  72. Liao, Z.; Zhou, B.; Zhu, J.; Jia, H.; Fei, X. A Critical Review of Methods, Principles and Progress for Estimating the Gross Primary Productivity of Terrestrial Ecosystems. Front. Environ. Sci. 2023, 11, 1093095. [Google Scholar] [CrossRef]
  73. Zhu, W.; Xie, Z.; Zhao, C.; Zheng, Z.; Qiao, K.; Peng, D.; Fu, Y.H. Remote Sensing of Terrestrial Gross Primary Productivity: A Review of Advances in Theoretical Foundation, Key Parameters and Methods. GISci. Remote Sens. 2024, 61, 2318846. [Google Scholar] [CrossRef]
  74. Joiner, J.; Yoshida, Y.; Zhang, Y.; Duveiller, G.; Jung, M.; Lyapustin, A.; Wang, Y.; Tucker, C. Estimation of Terrestrial Global Gross Primary Production (GPP) with Satellite Data-Driven Models and Eddy Covariance Flux Data. Remote Sens. 2018, 10, 1346. [Google Scholar] [CrossRef]
  75. Falge, E.; Tenhunen, J.; Baldocchi, D.; Aubinet, M.; Bakwin, P.; Berbigier, P.; Bernhofer, C.; Bonnefond, J.-M.; Burba, G.; Clement, R.; et al. Phase and Amplitude of Ecosystem Carbon Release and Uptake Potentials as Derived from FLUXNET Measurements. Agric. For. Meteorol. 2002, 113, 75–95. [Google Scholar] [CrossRef]
  76. He, S.; Zhang, Y.; Ma, N.; Tian, J.; Kong, D.; Liu, C. A Daily and 500m Coupled Evapotranspiration and Gross Primary Production Product across China during 2000–2020. Earth Syst. Sci. Data 2022, 14, 5463–5488. [Google Scholar] [CrossRef]
  77. Kruskal, W.H.; Wallis, W.A. Use of Ranks in One-Criterion Variance Analysis. J. Am. Stat. Assoc. 1952, 47, 583–621. [Google Scholar] [CrossRef]
  78. Pagliacci, F.; Salpina, D. Territorial Hotspots of Exposure to Climate Disaster Risk. The Case of Agri-Food Geographical Indications in the Veneto Region. Land Use Policy 2022, 123, 106404. [Google Scholar] [CrossRef]
  79. Avand, M.; Moradi, H.; Ramazanzadeh Lasboyee, M. Predicting Temporal and Spatial Variability in Flood Vulnerability and Risk of Rural Communities at the Watershed Scale. J. Environ. Manage. 2022, 323, 116261. [Google Scholar] [CrossRef]
  80. Shah, W.U.H.; Hao, G.; Yasmeen, R.; Yan, H.; Shen, J.; Lu, Y. Role of China’s Agricultural Water Policy Reforms and Production Technology Heterogeneity on Agriculture Water Usage Efficiency and Total Factor Productivity Change. Agric. Water Manag. 2023, 287, 108429. [Google Scholar] [CrossRef]
  81. Mann, H.B.; Whitney, D.R. On a Test of Whether One of Two Random Variables Is Stochastically Larger than the Other. Ann. Math. Stat. 1947, 18, 50–60. [Google Scholar] [CrossRef]
  82. Hamed, K.H. Trend Detection in Hydrologic Data: The Mann–Kendall Trend Test under the Scaling Hypothesis. J. Hydrol. 2008, 349, 350–363. [Google Scholar] [CrossRef]
  83. Berhanu, K.G.; Lohani, T.K.; Hatiye, S.D. Long-Term Spatiotemporal Dynamics of Groundwater Storage in the Data-Scarce Region: Tana Sub-Basin, Ethiopia. Heliyon 2024, 10, e24474. [Google Scholar] [CrossRef]
  84. Güçlü, Y.S. Improved Visualization for Trend Analysis by Comparing with Classical Mann-Kendall Test and ITA. J. Hydrol. 2020, 584, 124674. [Google Scholar] [CrossRef]
  85. Yu, P.; Zhang, Y.; Liu, P.; Zhang, J.; Xing, W.; Tong, X.; Zhang, J.; Meng, P. Regulation of Biophysical Drivers on Carbon and Water Fluxes over a Warm-Temperate Plantation in Northern China. Sci. Total Environ. 2024, 907, 167408. [Google Scholar] [CrossRef] [PubMed]
  86. Patakamuri, S.K.; Das, B. Trendchange: Innovative Trend Analysis and Time-Series Change Point Analysis; The R project for Statistical Computing: Vienna, Austria, 2022. [Google Scholar]
  87. R Core Team. R: A Language and Environment for Statistical Computing. The R Foundation for Statistical Computing: Vienna, Austria, 2023. [Google Scholar]
  88. De Souza, U.B.; Escola, J.P.L.; da Brito, L.C. A Survey on Hilbert-Huang Transform: Evolution, Challenges and Solutions. Digit. Signal Process. A Rev. J. 2022, 120, 103292. [Google Scholar] [CrossRef]
  89. Guo, B.; Chen, Z.; Guo, J.; Liu, F.; Chen, C.; Liu, K. Analysis of the Nonlinear Trends and Non-Stationary Oscillations of Regional Precipitation in Xinjiang, Northwestern China, Using Ensemble Empirical Mode Decomposition. Int. J. Environ. Res. Public Health 2016, 13, 345. [Google Scholar] [CrossRef] [PubMed]
  90. Liu, H.; Xu, X.; Lin, Z.; Zhang, M.; Mi, Y.; Huang, C.; Yang, H. Climatic and Human Impacts on Quasi-Periodic and Abrupt Changes of Sedimentation Rate at Multiple Time Scales in Lake Taihu, China. J. Hydrol. 2016, 543, 739–748. [Google Scholar] [CrossRef]
  91. Lee, H.S. Estimation of Extreme Sea Levels along the Bangladesh Coast Due to Storm Surge and Sea Level Rise Using EEMD and EVA. J. Geophys. Res. Ocean. 2013, 118, 4273–4285. [Google Scholar] [CrossRef]
  92. Adarsh, S.; Janga Reddy, M. Evaluation of Trends and Predictability of Short-term Droughts in Three Meteorological Subdivisions of India Using Multivariate EMD-based Hybrid Modelling. Hydrol. Process. 2019, 33, 130–143. [Google Scholar] [CrossRef]
  93. Kim, D.; Oh, H.-S. EMD: A Package for Empirical Mode Decomposition and Hilbert Spectrum. R J. 2009, 1, 40. [Google Scholar] [CrossRef]
  94. Kim, D.; Oh, H.-S. EMD: Empirical Mode Decomposition and Hilbert Spectral Analysis; The R project for Statistical Computing: Vienna, Austria, 2021. [Google Scholar]
  95. Jia, L.; Wang, H.; Jiang, L.; Du, W. Weak Fault Detection of Rolling Element Bearing Combining Robust EMD with Adaptive Maximum Second-Order Cyclostationarity Blind Deconvolution. J. Vib. Control 2023, 29, 2374–2391. [Google Scholar] [CrossRef]
  96. Yang, W.; Peng, Z.; Wei, K.; Shi, P.; Tian, W. Superiorities of Variational Mode Decomposition over Empirical Mode Decomposition Particularly in Time–Frequency Feature Extraction and Wind Turbine Condition Monitoring. IET Renew. Power Gener. 2017, 11, 443–452. [Google Scholar] [CrossRef]
  97. Santhosh, M.; Venkaiah, C.; Vinod Kumar, D.M. Ensemble Empirical Mode Decomposition Based Adaptive Wavelet Neural Network Method for Wind Speed Prediction. Energy Convers. Manag. 2018, 168, 482–493. [Google Scholar] [CrossRef]
  98. Vernay, A.; Hasselquist, N.; Leppä, K.; Klosterhalfen, A.; Gutierrez Lopez, J.; Stangl, Z.R.; Chi, J.; Kozii, N.; Marshall, J.D. Partitioning Gross Primary Production of a Boreal Forest among Species and Strata: A Multi-Method Approach. Agric. For. Meteorol. 2024, 345, 109857. [Google Scholar] [CrossRef]
  99. Deligöz, A.; Bayar, E.; Karatepe, Y.; Genç, M. Photosynthetic Capacity, Nutrient and Water Status Following Precommercial Thinning in Anatolian Black Pine. For. Ecol. Manag. 2019, 451, 117533. [Google Scholar] [CrossRef]
  100. Fkiri, S.; Rzigui, T.; Ghazghazi, H.; Khouja, L.M.; Khaldi, A.; Guibal, F.; Nasr, Z. Ecotype Effects on Photosynthesis Performance Using A/PFFD among Pinus Nigra Arn. Not. Bot. Horti Agrobot. Cluj-Napoca 2023, 51, 12599. [Google Scholar] [CrossRef]
  101. Fu, Z.; Ciais, P.; Prentice, I.C.; Gentine, P.; Makowski, D.; Bastos, A.; Luo, X.; Green, J.K.; Stoy, P.C.; Yang, H.; et al. Atmospheric Dryness Reduces Photosynthesis along a Large Range of Soil Water Deficits. Nat. Commun. 2022, 13, 989. [Google Scholar] [CrossRef]
  102. Ozdogan, M.; Woodcock, C.E.; Salvucci, G.D.; Demir, H. Changes in Summer Irrigated Crop Area and Water Use in Southeastern Turkey from 1993 to 2002: Implications for Current and Future Water Resources. Water Resour. Manag. 2006, 20, 467–488. [Google Scholar] [CrossRef]
  103. Mirabbasi, R.; Ahmadi, F.; Jhajharia, D. Comparison of Parametric and Non-Parametric Methods for Trend Identification in Groundwater Levels in Sirjan Plain Aquifer, Iran. Hydrol. Res. 2020, 51, 1455–1477. [Google Scholar] [CrossRef]
  104. Bürger, G. Trends? Complicated Answers to a Simple Question. Hydrol. Sci. J. 2023, 68, 1680–1692. [Google Scholar] [CrossRef]
  105. Jung, M.; Schwalm, C.; Migliavacca, M.; Walther, S.; Camps-Valls, G.; Koirala, S.; Anthoni, P.; Besnard, S.; Bodesheim, P.; Carvalhais, N.; et al. Scaling Carbon Fluxes from Eddy Covariance Sites to Globe: Synthesis and Evaluation of the FLUXCOM Approach. Biogeosciences 2020, 17, 1343–1365. [Google Scholar] [CrossRef]
  106. Du, Y.; Zhu, K.; Zhang, Z. CSIF and GOSIF Do Not Accurately Capture the Vegetation Greening During the Spring of 2020. IEEE Geosci. Remote Sens. Lett. 2024, 21, 1–5. [Google Scholar] [CrossRef]
  107. Zhang, Y.; Ye, A. Would the Obtainable Gross Primary Productivity (GPP) Products Stand up? A Critical Assessment of 45 Global GPP Products. Sci. Total Environ. 2021, 783, 146965. [Google Scholar] [CrossRef] [PubMed]
  108. Chen, Y.; Gu, H.; Wang, M.; Gu, Q.; Ding, Z.; Ma, M.; Liu, R.; Tang, X. Contrasting Performance of the Remotely-Derived GPP Products over Different Climate Zones across China. Remote Sens. 2019, 11, 1855. [Google Scholar] [CrossRef]
  109. Lv, Y.; Liu, J.; He, W.; Zhou, Y.; Tu Nguyen, N.; Bi, W.; Wei, X.; Chen, H. How Well Do Light-Use Efficiency Models Capture Large-Scale Drought Impacts on Vegetation Productivity Compared with Data-Driven Estimates? Ecol. Indic. 2023, 146, 109739. [Google Scholar] [CrossRef]
  110. Lee, D.; Kim, J.-S.; Park, S.-W.; Kug, J.-S. An Abrupt Shift in Gross Primary Productivity over Eastern China-Mongolia and Its Inter-Model Diversity in Land Surface Models. Sci. Rep. 2023, 13, 22971. [Google Scholar] [CrossRef] [PubMed]
  111. Wang, H.; Li, X.; Ma, M.; Geng, L. Improving Estimation of Gross Primary Production in Dryland Ecosystems by a Model-Data Fusion Approach. Remote Sens. 2019, 11, 225. [Google Scholar] [CrossRef]
  112. Zhang, W.; Luo, G.; Hamdi, R.; Ma, X.; Li, Y.; Yuan, X.; Li, C.; Ling, Q.; Hellwich, O.; Termonia, P.; et al. Can Gross Primary Productivity Products Be Effectively Evaluated in Regions with Few Observation Data? GISci. Remote Sens. 2023, 60, 2213489. [Google Scholar] [CrossRef]
Figure 1. Maps of elevation (a), annual average precipitation (1980–2020) (b), annual average temperature (1980–2020) (c), and land use/land cover (2021) (d) of Türkiye.
Remotesensing 16 01994 g001
Figure 2. Gross Primary Productivity across Türkiye as estimated by the TL-LUE dataset [50] for June 2020.
Remotesensing 16 01994 g002
Figure 3. ITA example.
Remotesensing 16 01994 g003
Figure 4. Flowchart of the study.
Remotesensing 16 01994 g004
Figure 5. Correlation matrices of GPP datasets from the (a) Antalya, (b) Erzincan, (c) Izmir, (d) Kirklareli, (e) Konya, (f) Samsun, and (g) Sanliurfa regions.
Remotesensing 16 01994 g005aRemotesensing 16 01994 g005b
Figure 6. GPP dataset similarity test results for the (a) Antalya, (b) Erzincan, (c) Izmir, (d) Kirklareli, (e) Konya, (f) Samsun, and (g) Sanliurfa regions of Türkiye (**** p < 0.0001, *** p < 0.001, ** p < 0.01, * p < 0.05).
Remotesensing 16 01994 g006aRemotesensing 16 01994 g006b
Figure 7. ITA results for (a) Antalya, (b) Erzincan, (c) Izmir, (d) Kirklareli, (e) Konya, (f) Samsun, and (g) Sanliurfa.
Remotesensing 16 01994 g007aRemotesensing 16 01994 g007b
Figure 8. Example of EMD subseries for MuSyQ GPP estimates from Konya, Türkiye.
Remotesensing 16 01994 g008
Figure 9. Trends in GPP extracted from the last mode of an Empirical Mode Decomposition (EMD) on GPP estimates from different remote sensing data products from different regions of Türkiye, (a) Antalya, (b) Erzincan, (c) Izmir, (d) Kirklareli, (e) Konya, (f) Samsun and (g) Sanliurfa.
Remotesensing 16 01994 g009aRemotesensing 16 01994 g009b
Table 1. Temporal and spatial information of GPP dataset.
DatasetDate RangeData Length (Months)UnitsScale FactorSpatial ResolutionTemporal Resolution
MODIS02/2000–12/2020253kg C m−2 m−1-50 km8 days
FLUXCOM01/1979–12/2018480g C m−2 m−1-50 kmmonthly
TL-LUE01/1992–12/2020348g C m−2 m−10.15 kmmonthly
PMLV201/1980–12/2014420umol m−2 s−1-5 kmmonthly
GOSIF03/2000–12/2022274g C m−2 m−10.015 kmmonthly
MuSyQ01/1981–12/2018456g C m−2 d−10.015 km8 days
Table 2. Monthly MMK trend analysis results.
RegionDatasetsJanFebMarAprMayJunJulAugSepOctNovDec
AntalyaTL-LUE
FLUXCOM
GOFIS
MODIS
MuSyQ
PMLV2
ErzincanTL-LUE
FLUXCOM
GOFIS
MODIS
MuSyQ
PMLV2
IzmirTL-LUE
FLUXCOM
GOFIS
MODIS
MuSyQ
PMLV2
KirklareliTL-LUE
FLUXCOM
GOFIS
MODIS
MuSyQ
PMLV2
KonyaTL-LUE
FLUXCOM
GOFIS
MODIS
MuSyQ
PMLV2
SamsunTL-LUE
FLUXCOM
GOFIS
MODIS
MuSyQ
PMLV2
SanliurfaTL-LUE
FLUXCOM
GOFIS
MODIS
MuSyQ
PMLV2
and indicate significant increasing or decreasing trends at 5% significant level; and indicate significant increasing or decreasing trends at 1% significant level; indicates no significant trend.
Table 3. Modified Mann–Kendall trend analysis results for GPP estimates from different remote sensing data products from selected areas in different regions of Türkiye.
Dataset AntalyaErzincanIzmirKirklareliKonyaSamsunSanliurfa
TL-LUEZ3.16 *1.172.61 *2 *3.03 *1.583.68 **
p0.0010.230.0080.0440.0020.110.0002
Slope0.00210.000050.0020.00150.00050.0010.0007
FLUXCOMZ0.610.240.360.21−1.7−0.98−0.48
p0.5390.80.710.820.860.920.62
Slope0.00010.000020.000040.00003−0.0001−0.00002−0.0005
GOFISZ1.91.052.13 *1.412.6 *1.374.69 **
p0.0560.290.0320.150.0090.160.000
Slope0.00130.00040.0020.00140.00120.00130.0021
MODISZ1.380.950.81.071.730.91.73
p0.1660.340.420.280.080.360.08
Slope0.00150.00030.00080.00130.00080.00130.0006
MuSyQZ2.07 *2.09 *0.293.57 **5.28 **2.27 *6.66 **
p0.0380.0350.290.00030.0000.0220.000
Slope0.00060.00020.0010.00190.00080.0010.0014
PMLV2Z3.08 *1.752.74 *1.933.44 **2.66 *2.87 *
p0.0020.080.0060.0520.0000.0070.004
Slope0.00120.00030.00150.0010.00070.00160.0006
* p < 0.05, ** p < 0.001.
Disclaimer/Publisher’s Note: The statements, opinions and data contained in all publications are solely those of the individual author(s) and contributor(s) and not of MDPI and/or the editor(s). MDPI and/or the editor(s) disclaim responsibility for any injury to people or property resulting from any ideas, methods, instructions or products referred to in the content.