Article

New 3-D Fluorescence Spectral Indices for Multiple Pigment Inversions of Plant Leaves via 3-D Fluorescence Spectra

1
College of Artificial Intelligence, Hangzhou Dianzi University, Hangzhou 310018, China
2
Institute of Agricultural Remote Sensing & Information Application, Zhejiang University, Hangzhou 310058, China
3
Key Laboratory of Agricultural Remote Sensing and Information System, Hangzhou 310058, China
*
Author to whom correspondence should be addressed.
Remote Sens. 2024, 16(11), 1885; https://doi.org/10.3390/rs16111885
Submission received: 20 February 2024 / Revised: 13 May 2024 / Accepted: 20 May 2024 / Published: 24 May 2024
(This article belongs to the Special Issue Remote Sensing for Crop Nutrients and Related Traits)

Abstract

:
High-sensitivity fluorescence monitoring has been widely used in agriculture and environmental science. However, the active fluorescence detection information of leaf segments mainly focuses on total chlorophyll, and the fluorescence information of chlorophyll a, chlorophyll b, and some other pigments has not been explored. This only considers the fluorescence spectrum characteristics at a single wavelength or the fluorescence integral from a range of wavelength regions and does not completely consider the linkage relation between the excitation, emission, and interference information. In this paper, the three-dimensional fluorescence spectrum, containing the excitation and emission fluorescence spectra, and the corresponding multiple pigment characteristics from the upgraded LOPEX_ZJU database were collected. The linkages of excitation and emission of the three-dimensional fluorescence spectra of these pigments were analyzed for the newly built multiple pigment 3-D fluorescence spectral indices (3-D FSIs), including those of chlorophyll a, chlorophyll b, carotenoid, anthocyanin, and flavonoid 3-D FSIs. Then, these pigment inversion models were established and validated. The results show that the 3-D FSIs performances for the photosynthetic pigment content inversion (including chlorophyll a and b, and carotenoids) were much better than those for the photo-protective pigments (including anthocyanins and flavonoids) from the 3-D fluorescence spectra of these plant leaves. Here, the 3-D fluorescence normalization index (FNI ((F430,690 − F430,763)/(F430,690 + F430,763))) for the chlorophyll a inversion model has a high accuracy, the RMSE is 2.96 μg/cm2, and the 3-D fluorescence reciprocal difference index (FRI (F650,704/F650,668) for the chlorophyll b model has an encouraging RMSE (2.01 μg/cm2). The RMSE of the 3-D fluorescence ratio index (FRI (F500,748/F500,717)) for the carotenoid inversion is 3.77 μg/cm2 RMSE. Only FRI (F370,615/F370,438) was selected for the modeling and validating evaluation of the leaf Flas content inversion, but the evaluation metrics were not good, with an RMSE (151.13 μg/cm2). For Ants, although there was a 3-D FSI (FRDI (1/F540,679 − 1/F540,557)), and its evaluation metrics, with an RMSE (2.8 μg/cm2), were at or over 0.05 level, the validating evaluation metric VC (98.3577%) was not encouraging. These results showed that fluorescence, as a nondestructive and efficient detection method, could determine the contents of chlorophyll a, chlorophyll b, and carotenoid in plant leaves, providing a new method to detect plant information. It can also provide a potential chance for the fluorescence images of fine photo-protective pigments, especially chlorophyll a and b, using the special active fluorescence excitation light source and a few fluorescence imaging channels from the optimal FSIs.

1. Introduction

When a beam of light enters in vivo plant leaves, some of the incident light is transmitted and reflected off their surface, and the rest is absorbed by their biochemical substances. The biochemical substances of a plant leaf plays a role in absorbing light energy and then converting it into chemical energy, which is stored in plant starch; this process is called photosynthesis [1]. The energy utilized by photosynthesis is a part of leaf absorbing light energy, while the parts that are not smoothly converted become fluorescence and heat loss. These energy activities are closely related to plant physiological and ecological characteristics and its leaf pigment information. Leaf pigments are the main actors of incident light absorption and are composed of liposoluble chloroplast pigments and water-soluble cytochrome pigments [2]. The liposoluble chloroplast pigments are for plant photosynthesis and are also called photosynthetic pigments [3], which mainly contain chlorophyll a (Chla), chlorophyll b (Chlb), and carotenoids (Cars). The water-soluble cytochrome pigments protect plant photosynthesis and are also called photo-protective pigments (mainly containing anthocyanins (Ants) and flavonoids (Flas)). Among them, Chla and Chlb molecules harvest, transport, and absorb photosynthetic electrons in leaves [4]; Chla and Chla molecules also perform leaf fluorescence emission [5]. When plants are under disease stress, the chlorophyll content in their bodies will decrease rapidly, and the content of chlorophyll a changes faster than that of chlorophyll b [6]. Therefore, the content of chlorophyll a and b can provide a more comprehensive understanding of plant physiological information than the total chlorophyll content. Cars perform leaf heat dissipation in the lutein cycle [7]; and Ants quench excess light energy in leaves [8]. Flavonoids promote plant stress resistance [9]. These pigments, which are actors of plant photosynthesis, fluorescence and heat loss, are closely related to the physiological and ecological functions of vegetation, and are also known as the characteristic parameters of plant physiological and ecological conditions [10]. Therefore, pigment contents in leaves could be better measured to enhance understanding of their function, which would enable a better understanding of plant growth conditions.
Most studies on the inversion of plant pigments focus on the reflectance of the plant leaf or canopy level through vegetation indices (VI) [11] and the optical radiation transfer (RT) model [12] based on these pigments’ absorption spectrum characteristics. The measurement of reflected light requires a certain angle [13], including the viewing zenith angle, the viewing azimuth angles, and the lighting zenith angle. This could reduce the monitoring stability of these pigments from plant leaf or canopy reflection spectra [14]. However, the fluorescence is a uniform scattering [15], and these measurements do not need to consider the effect of the angle, which could facilitate the detection and application of plant leaves’ biochemical components via remote sensing technology. In addition, the emission spectrum characteristics in the fluorescence spectrum are formed through exciting light resources at the specific wavelength that matches the absorption peak position of the monitored objects [16], in which the exciting light resource with a very narrow band could reduce the interference from other photosensitive substances with similar absorption spectra [17]. Thus, fluorescence detection is regarded as a nondestructive probe.
Fluorescence detection technology has been applied in many fields, such as water detection [18], plant component detection [19,20,21], and other fields [22]. At present, the application of fluorescence spectroscopy in the plant field mainly focuses on the detection of plants’ total chlorophyll contents. Chlorophyll fluorescence is the spectral signal excited by the reaction center of the photosystem during the process of photosynthesis in plants [23]. According to the different excitation light sources and detection methods, the observation of chlorophyll fluorescence can be divided into active and passive observation techniques. Among them, SIF is the light signal that is observed by ultra-high spectral remote sensing sensor in the ascending spectrum of vegetation under sunlight and performed in the fluorescence band, which belongs to the passive observation technology [24]. Tubuxin [25] used a high-spectral resolution HR2000+ and an ordinary USB4000 spectrometer to measure leaf reflectance under solar and artificial light, respectively, to estimate Chl fluorescence. The SIF method was less accurate for Chl content estimation when Chl content was high. This may be due to the fact that solar-induced fluorescence is a dynamic fluorescence monitoring process and cannot directly reflect the relationship between fluorescence and pigment content.
In the active fluorescence field, it is driven by an artificial light source. Schreiber [19] designed and manufactured the world’s first modulated fluorometer Pam-101, which used single-point chlorophyll fluorescence (excitation wavelength 470 nm, emission wavelength 685 nm) to measure the total chlorophyll concentration of planktic cyanobacteria. Yang et al. [20] studied the quantitative relationship between the fluorescence spectral characteristics of tea leaves and their total chlorophyll content, and the results showed that there was a significant correlation, with fluorescence intensity at 685 nm. Ndao et al. [21] used a blue laser diode at 404 nm to continuously excite some tropical plants to produce chlorophyll fluorescence at room temperature and determined the intensity and location of the fluorescence band. The corrected fluorescence intensity ratio F690/730 had a good correlation with the total chlorophyll content. Yang et al. [26] studied the relationship between the fluorescence parameters F732/F685 of 10 cucumber leaves and chlorophyll content in cucumber leaves under the fluorescence spectra generated by a light source with an intensity of 7.5 mW and a wavelength of 473 nm and found that there was a very significant linear relationship (R2 = 0.93, p < 0.001). Current studies have not isolated chlorophyll a and b through fluorescence measuring, and there are few studies on carotenoids, anthocyanins, and flavonoids. Meanwhile, emission characteristics are rarely considered in combination with the absorption characteristics of pigments.
The three-dimensional (3-D) fluorescence spectrum is a function of both the excitation wavelength and emission wavelength and provides more complete and detailed fluorescence information for substances than conventional fluorescence analysis. It is suitable for the spectral characterization of multi-component mixtures and is a spectral fingerprint technology with a wide application value [27]. At present, many scholars use 3-D fluorescence spectroscopy as a research tool. Suarez-Fernandez et al. [28] combined high-performance liquid chromatography with 3-D fluorescence spectroscopy to explore the effect of chitosan on tomato root exudates and analyzed the changes in fluorescent substances such as salicylic acid, auxin, and phenols. Zhang et al. [29] studied the classification and discrimination of 3-D fluorescence spectra of algae and classified and recognized various Marine algae species. Yi et al. [30] used three-dimensional fluorescence spectroscopy and traditional water quality analysis methods to determine the wastewater quality at different nodes during the sewage treatment process of a sewage plant in a city in Guangzhou and analyzed the relationship between fluorescence characteristics and data obtained through traditional analysis methods. Zhou et al. [31] used DAX-8 resin to classify and separate DOM from corn stover at different stages of decomposition and conducted spectral analysis and fluorescence component identification of DOM classification components through UV spectroscopy, three-dimensional fluorescence spectroscopy, and synchronous fluorescence spectroscopy. Thus, the 3-D fluorescence spectrum has complete fluorescence intensity information, which can be applied to the detection of fluorescent substances in plants [32]. However, the 3-D fluorescence spectrum is rarely studied in the field of plant leaf multiple pigment detection.
Although three-dimensional fluorescence spectrum of in vivo leaf includes the excitation and emission information of leaf pigments, there are some other fluorescence interferences in the emission spectrum, such as proteins, phenols, and other substances. Here, how to contain excitation and emission information and eliminate the interference of these substances is the key to solve the accurate extraction of fluorescence information from leaf pigments. Fortunately, The spectral index from vegetation reflectance can effectively extract spectral characteristics for monitoring vegetation information [33]. For example, NDVI, the central band reflectance (red band) that can express the spectral features of the monitored objective substance, was used for the extraction of vegetation’s chlorophyll information, and the reference band reflectance (NIR band) was used to avoid the effect of the vegetation background on the normalization algorithm [34]. Bartold [35] found that biophysical factors, as denoted by spectral indices related to greenness and leaf pigments, were highly impactful variables among the top classifiers. However, the spectral extraction from leaf fluorescence used in the current studies only considered a single band or the fluorescence integral with the specific band exciting light [36]. Moreover, in addition to pigments, the trace substances of in vivo leaves, such as protein and nucleic acid [37], also have fluorescence characteristics. Although the fluorescence from these trace substances was weak, it would disturb the fluorescence extraction of leaf pigment information, and there was a need to reduce the disturbance from leaf trace substances. Thus, the extraction efficiency of leaf fluorescence characteristics could be improved by simultaneously considering the exciting light, the central band, and the reference band of leaf pigment fluorescence, and then it could improve the ability for pigment inversion via the 3-D leaf fluorescence spectrum. The fluorescence indices containing exciting light, central band, and reference band information are called 3-D fluorescence spectral indices (3-D FSIs).
The active fluorescence detection information by artificial light source excitation mainly focuses on total chlorophyll, while the fluorescence information of chlorophyll a, b, and some other pigments has not been explored. This only considers the fluorescence spectral features of a single wavelength or the fluorescence integral in a wavelength range, and does not fully consider the linkage between excitation, emission, and interference information. Therefore, in this paper, leaf samples from the 12 typical plant species in the upgraded LOPEX_ZJU dataset were selected, and the 3-D fluorescence spectra and the pigment contents of these selected leaf samples were collected. A study on the inversion of multiple pigments, including Chla, Chlb, Cars, Ants, and Flas content, was performed using leaf 3-D fluorescence with the newly built 3-D FSIs. Firstly, combining the excitation spectrum of leaf 3-D fluorescence with the absorption coefficients of these pigments in vivo leaf, the linear regression determination coefficient was employed for the sensitive band analysis of the excitation, and the emission fluorescence pigment inversion in the emission spectrum and the new 3-D FSIs for multiple leaf pigments were built. Then, the linear function with the newly built 3-D FSI as a variable was employed for the fluorescence pigment inversion models. Finally, the evaluation metrics were used to evaluate the accuracy of these pigments’ inversion. We strive to provide a new method for the multiple pigment detection of plant leaves, especially Chla and Chlb, with a 3-D FSI.

2. Materials and Methods

2.1. Materials and Data

2.1.1. Experimental Materials

The LOPEX_ZJU dataset (Leaf Optical Properties Experiment at ZheJiang University) was first published in 2020 [38]. In this paper, this dataset was upgraded. The upgraded dataset contains the leaf reflectance and transmittance spectra (in the range of 400–2400 nm), the leaf 3-D fluorescence spectrum (320–800 nm), the leaf net photosynthetic rate, and the leaf biochemical component (including in chlorophyll a, chlorophyll b, sub-classified carotenoids, anthocyanins, and total flavonoid content). The data for leaf reflectance, transmittance spectra, and the leaf biochemical component were published in 2020, and the leaf 3-D fluorescence spectrum and leaf net photosynthetic rate were upgraded in this paper. The dataset contained 12 species of plants growing in the warm and humid Marine climate community interleaved zone, including evergreen and deciduous trees, shrubs, semi-shrubs, and herbs, with a total of 12 families, covering 8% of the plant families and 1% of the plant genera (Table 1).
This dataset was built in December 2015 [40]. The colors of leaves changed continuously throughout the life cycle (such as that of the maple tree), while some remained unchanged for a long time (e.g., for the tea tree), which ensures the existence of various leaf pigments in different concentration gradients. To ensure the physiological and ecological functional activity of each pigment, the leaves that could represent the physiological and ecological characteristics of plants at the collection time were collected between 9:00 a.m. and 11:00 a.m. every day [41]. Leaf net photosynthetic rate data were collected with a Li-6400 portable photosynthesis system in situ. Additionally, the leaves were collected with branches and cultured in a nutrient solution immediately after collection. In the experiment, dark adaptations of these collected leaves were performed for 30 min [42] in a darkroom. We waited for leaf reflectance and transmittance spectra, leaf 3-D fluorescence spectra, and biochemical component determination.

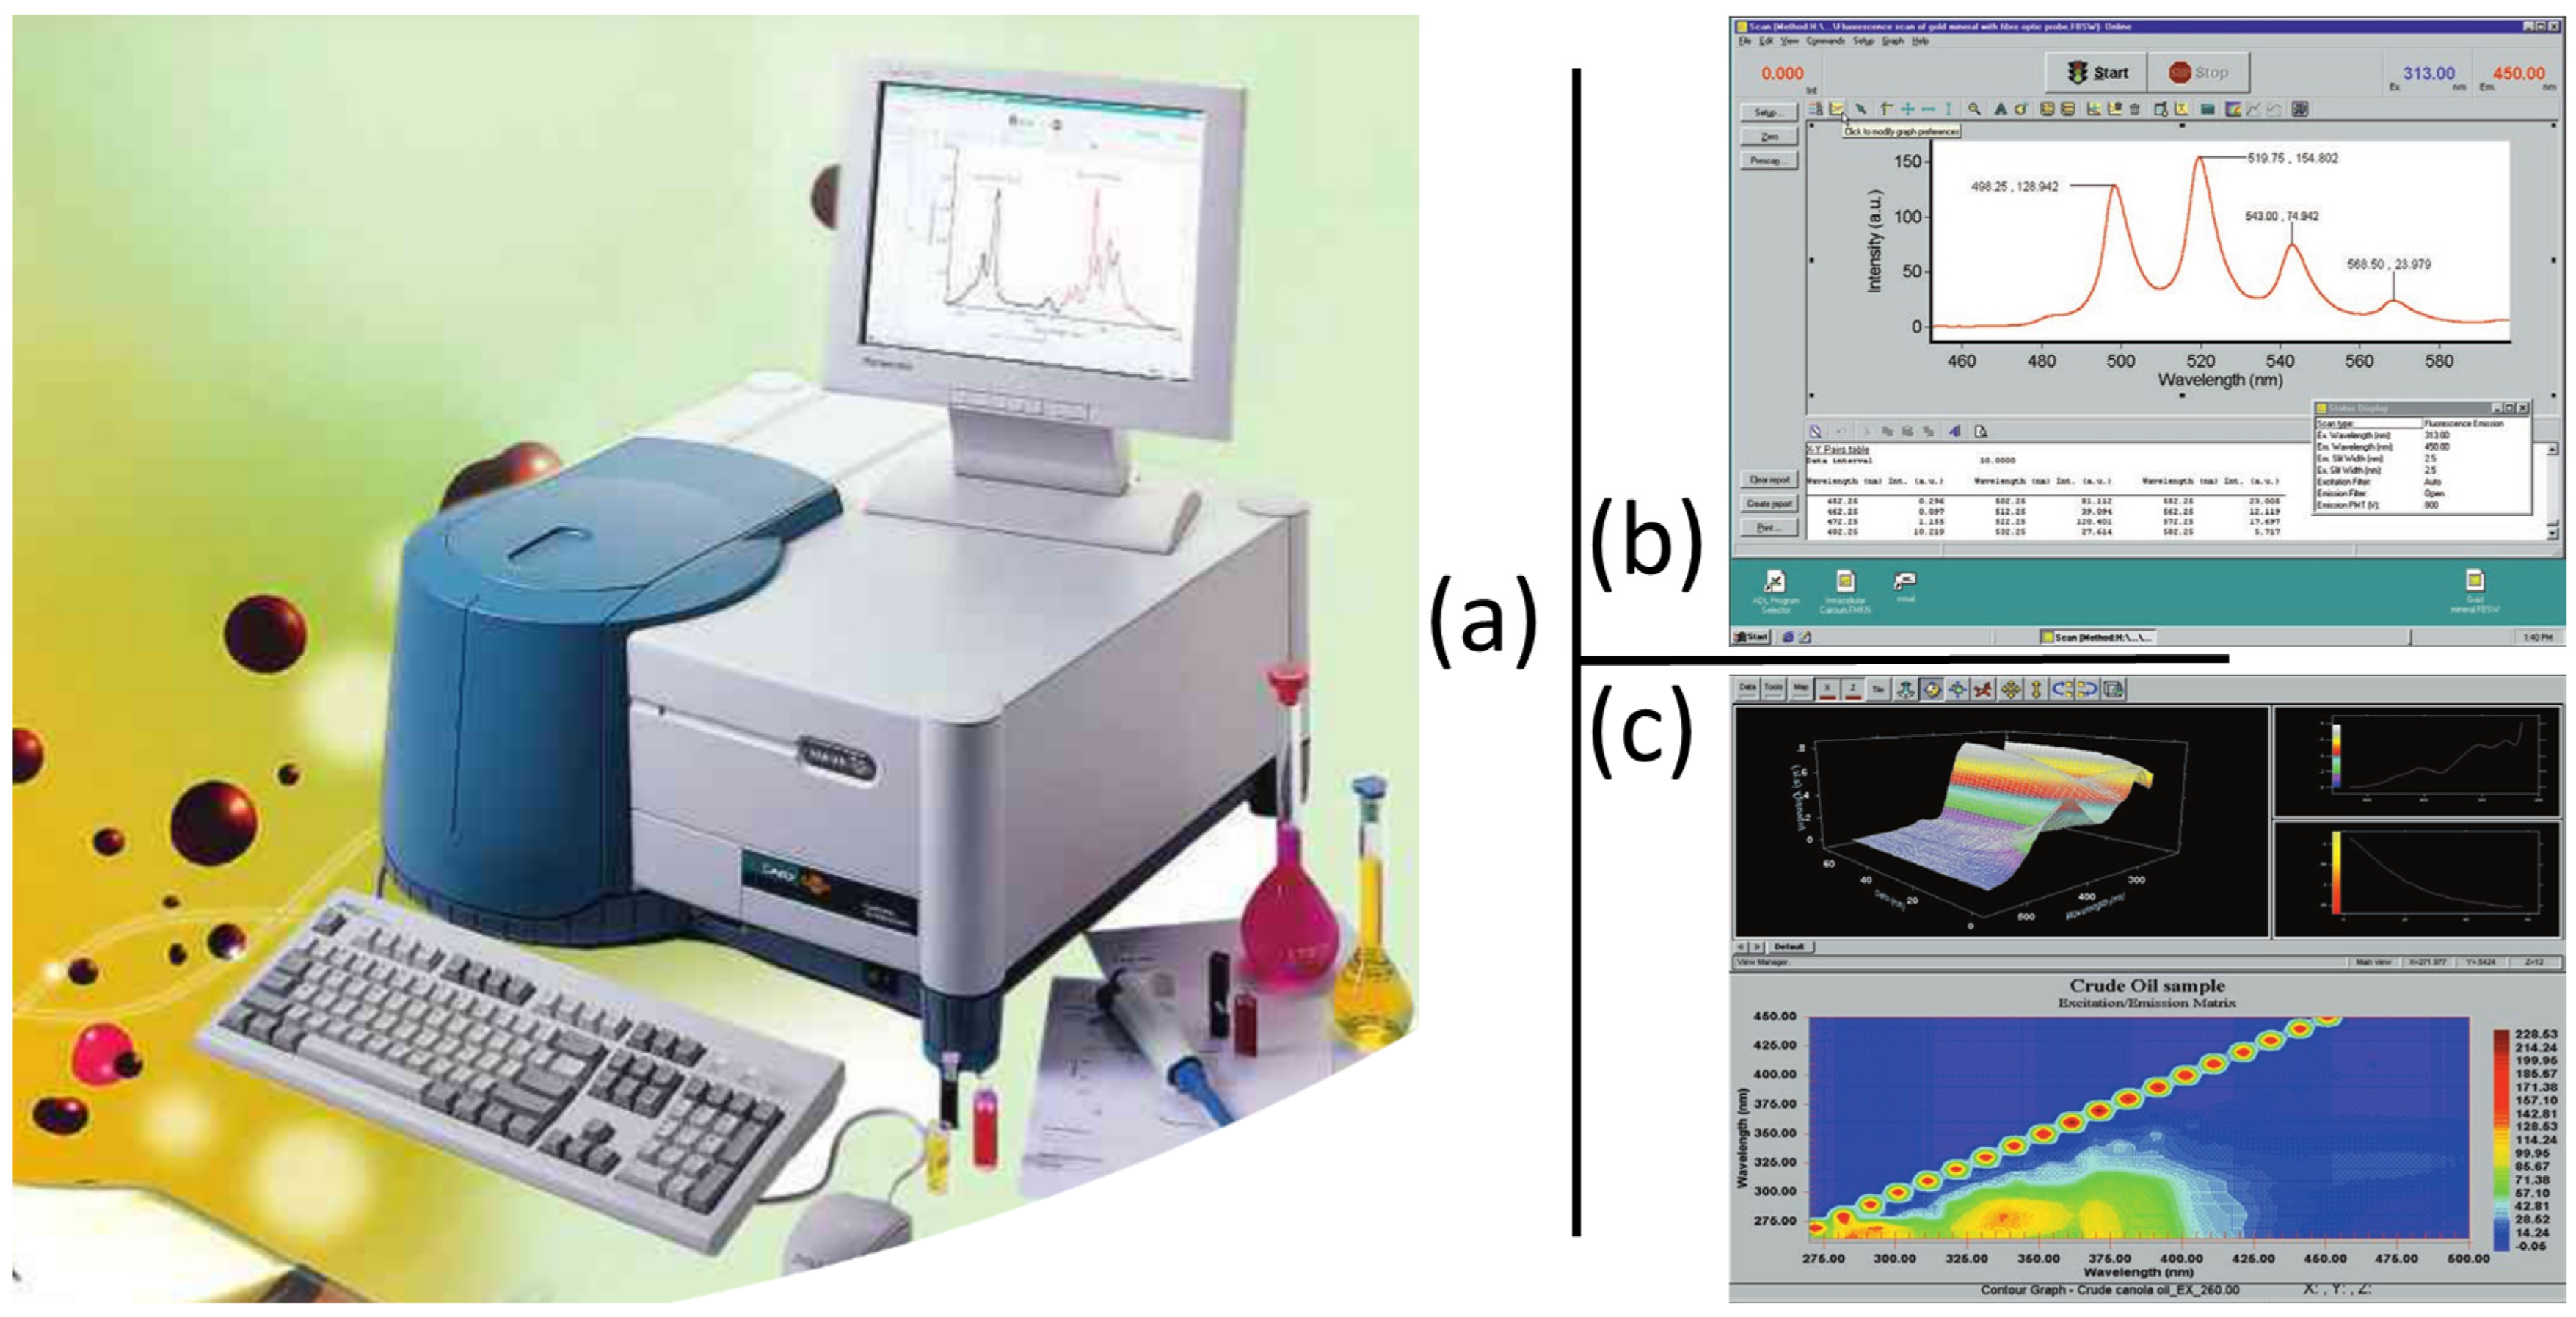
2.1.2. Leaf 3-D Fluorescence Spectrometry

An Agilent Cary Eclipse-type fluorescence spectrophotometer was employed in the LOPEX_ZJU dataset for the leaf fluorescence spectrum. The fluorescence spectrophotometer was produced by VARIAN, Inc., Santa Clara, California, USA, with a high sensitivity (>750:1 RMS, excitation at 350 nm, emission and excitation slit at 10 nm, average sampling time of 1 s) (Figure 1). The excitation wavelength range was 200–900 nm, zero-order optional, and with a spectral resolution of 0.5 nm. The emission detection wavelength range was 200–900 nm, zero-order optional, and with a spectral resolution of 0.5 nm. The instrument can create specific single-band light source excitation fluorescence spectrum curves and continuous-band light source excitation three-dimensional fluorescence spectrum curves for solid thin slices, liquids, solutions, etc. It is a powerful data acquisition tool for the collaborative study of fluorescence excitation light sources and fluorescence spectra.
In this paper, plant leaf pigments included chlorophyll a, chlorophyll b, carotenoids, anthocyanins, and total flavonoids. The absorption characteristics of these pigments were between 320 nm and 700 nm [43], and the difference between the absorption peaks between the pigments was greater than 20 nm [44,45]. Therefore, the excitation bands of 320 nm and 900 nm with an interval of 10 nm were selected based on the Agilent Cary Eclipse fluorescent scenery photometer. The corresponding emission fluorescence spectrum was as follows: the range of the spectrum was 320–900 nm, and the sampling interval of the fluorescence spectrum was 1 nm. All measured fluorescence was steady-state fluorescence.
For the test samples, a rectangular perforator was used to take 1.4 cm × 3 cm leaf samples, and the transparent 1 cm × 1 cm × 3 cm cuvette was vertically placed diagonally. The cuvette with leaf samples was placed in the sample pool of the Cary Eclipse fluorescence spectrophotometer, and the paraxial plane of the blade 45° was aligned with the incidence direction of the light source. In addition, the three-dimensional fluorescence of test sample blades was measured according to the selected fluorescence excitation and fluorescence emission detection conditions [15].
The fluorescence of plant leaf pigments was produced by their emission photos with a wavelength longer than the excitation wavelength of the excitation light [46], in which secondary scattering and Raman scattering were synchronously produced. These other scatterings would interfere with the fluorescence characteristics of leaf pigments [47]. Thus, it was necessary to remove these other scatterings following the method provided in the report by [48]. The 3-D fluorescence after other scatterings were removed is shown in Figure 2.

2.1.3. Multiple Pigment Properties of Leaves

Leaf pigments in the LOPEX_ZJU dataset included photosynthetic pigments (chlorophyll a, chlorophyll b, carotenoids) and photo-protective pigments (anthocyanins and total flavonoids). There, the measurement of chlorophyll a, chlorophyll b, carotenoid, and anthocyanin concentrations of leaves’ samples are shown in Table 2 [49], but that of total flavonoids is not.
The measurement of the leaf samples’ total flavonoids was performed using a UV3600 spectrophotometer to measure the absorbance of the extraction solution at 510 nm. Two leaf discs (1 cm in diameter and 0.1 g in fresh weight) were taken from both sides of the main vein of the leaf. They were placed in an oven with automatic temperature control to dry at 105 °C for 30 min (the de-enzyming step) and 70 °C for about 6 h (the drying step) [50]. The measured extraction solution of total flavonoids from the dried leaf discs was processed using the Al(NO3)3 complexation reaction [51]. The measured absorbance was represented in a Rutin standard curve (y = 88.439x + 2.2563, R2 = 0.992) to calculate the total content of flavonoids in the leaf samples.

2.1.4. Auxiliary Data Acquisition

The emission fluorescence of plant leaf pigments was produced by exciting the light resources at the specific wavelength, in which the exciting light resource was commonly located in the range of absorption spectra of plant pigments according to the formation principle of the fluorescence spectrum [52]. To better understand the relationship between excitation and emission spectral characteristics in the 3-D leaf fluorescence spectrum, a priori knowledge was needed regarding the multiple pigment absorption spectral characteristics for the analysis of the exciting characteristics in the 3-D leaf fluorescence spectrum. The absorption characteristics of Chla, Chlb, Cars, and Ants in in vivo leaves [38] and Flas in the organic solution are illustrated [53] in Figure 2.
The band range of these leaf pigments’ main absorption characteristics, shown in Figure 3, was analyzed with the full width at half of the maximum (FWHM) parameter in the spectral fitting based on the Gaussian function, and the ranges of absorption for each pigment are shown in Table 3. According to the formation principle of fluorescence spectrum, these absorption characteristics could be used as the basis for selecting the central band of the excitation light source. In addition, the wavelength intervals of the excitation light source of these pigments were designed to be 10 nm for leaves’ multiple pigment content inversion via the leaf 3-D fluorescence spectrum. The excitation wavelengths of these pigments are shown in Table 3.

2.2. Methods

2.2.1. Research Technical Framework

This study was divided into three main steps (Figure 4). The first step was data collection from the upgraded dataset, which included collecting the leaves’ 3-D fluorescence spectra data from 12 plant species, 60 leaf samples of the photosynthetic and photo-protective pigment content, and auxiliary data. The second step was building the 3-D fluorescence index and sensitivity analysis of the 3-D fluorescence spectra of plant pigments using all leaf samples from the upgraded dataset (60 leaf samples), which included building the 3-D fluorescence spectral index, determining the 3-D fluorescence characteristics of different pigment types, analyzing the spectral fluorescence sensitivity of the excitation and emissions of different pigments and non-pigment. The third step was modeling and validation, which included the following: (1) Using part of the leaf samples from the upgraded dataset (40 leaf samples), the suitable 3-D fluorescence spectral indices selected for the inversion of pigment content using leaves’ 3-D fluorescence spectra from the second step were employed for the models of each pigment content inversion. (2) The inversion ability of the pigment content of the 3-D fluorescence spectral index was evaluated using the 18 remaining leaf samples.

2.2.2. New 3-D Fluorescence Spectral Index

The trace substances in the in vivo leaves, such as protein and nucleic acid [37], also have fluorescence characteristics. Although this fluorescence information was very low compared with that of leaf pigments, it could have an impact on the extraction ability of leaf pigment fluorescence characteristics [54]. Coincidentally, the spectral index from reflection spectra with the combinatorial calculation of the central and reference bands can enhance the target information contained in the reflection spectral data and minimize the influence of non-target information, various scattering modes, and noise sources [55], e.g., RVI, NDVI, and EVI. Thus, a new 3-D fluorescence spectral index for leaves’ multiple pigment inversions can be proposed, simultaneously considering the excitation and emission of leaf multiple pigment fluorescence and non-pigment interference fluorescence. The four kinds of newly built 3-D fluorescence spectral indices for leaf pigment content inversion are shown in Table 4.

2.2.3. Multiple Pigment Content Inversion Method for Plants via 3-D Fluorescence Spectrum

The research on leaf multiple pigment content inversion using the 3-D fluorescence spectrum consisted of a sensitivity analysis of 3-D fluorescence spectral indices (3-D FSI) of each plant pigment and the modeling and validation of pigment content inversion using 3-D FSI.
(1) Sensitivity analysis of the 3-D fluorescence spectral indices of each pigment
The correlation coefficient between leaf pigments and 3-D FSI was employed for the sensitivity of the inversing pigment content from the 3-D fluorescence spectrum using all leaf samples (60 samples). The sensitivity analysis simultaneously considered the fluorescence exciting and emitting characteristics of leaf pigment and non-pigment interference fluorescence. Here, the comparisons of sensitivity between the fluorescence of the single band and the 3-D FSI for each pigment at different exciting bands were also performed. A T-test was employed to compare the difference between the correlation coefficient square of these sensitivities from different 3-D FSIs. The expression of the correlation coefficient is as follows:
C 3 D   F S I , C 2 = ( C o v 3 D   F S I , C σ 3 D   F S I , σ C ) 2
where  C 3 D   F S I , C 2  is the correlation coefficient square between 3-D FSI and leaf pigment content I;  C o v ( 3 D   F S I , C )  is the covariance between 3-D FSI and C; and  σ 3 D   F S I  and  σ C  are the standard deviations between 3-D FSI and C from all leaf samples, respectively.
(2) Modeling and validation of pigment content inversion by 3-D FSI
To learn about plants’ biochemical parameters (leaf pigment content) using remote sensing, the selected spectral indices should effectively maximize their sensitivity to plant biochemical parameters using a linear response in order that sensitivity be available for a wide range of vegetation conditions. This should also be carried out to facilitate the validation and calibration of the index [56]. In this paper, a linear function with the selected 3-D FSI variable was employed to establish the model of the leaf pigment content inversion via a 3-D fluorescence spectrum from 38 leaf sample data, and the data from the 20 remaining leaf samples were used to validate the established models [57].
R 2 = 1 i = 1 n ( C m e a i C m o d i ) 2 i = 1 n ( C m e a i M e a n ( C m e a i ) ) 2
In the above formula,  R 2  is the determination coefficient of the established model for leaf pigment content inversion in a linear function from the 3-D fluorescence spectrum; n is the employed leaf samples for the established model (n = 40);  C m e a i  is the i-th sample of the measured pigment content (including Chla, Chlb, Cars, Ants, and Flas);  c m o d i  is the modeled pigment content in the corresponding leaf sample; and  M e a n ( C m e a i )  is the mean value of the measured pigment content used for the established model.
In the validation step, the metrics RMSE (root mean square error), BIAS (bias), SEC (standard error corrected), and the VC (variability coefficient) [58] were employed to estimate the inversion abilities of leaf pigment content using the 3-D FSIs. Additionally, a T-test was also used to compare the different models. The validated metrics were expressed following Equation (3-6), and sample leaf data used were the left leaf sample data (m = 18).
R M S E = 1 m i = 1 m ( C m e a i C i n v i ) 2
B I A S = 1 m i = 1 m ( C m e a i C i n v i )
S E C = 1 m i = 1 m ( C m e a i C i n v i B I A S ) 2
V C = ( S E C / C m e a i ¯ ) × 100
In the above forumlae,  C i n v i  is the i- t h  sample of the inversed pigment content (including Chla, Chlb, Cars, Ants, and Flas);  c m o d i  is the modeled pigment content in the corresponding leaf sample; and  C m e a i ¯  is the mean value of the measured pigment content used for the validation.
The research methodology of this article is divided into three parts (Figure 5). The first part is the data collection of the upgraded dataset (LOPEX_ZJU), including 3-D fluorescence spectrum data, photosynthetic and photo-protective pigment content, and auxiliary data collection. The second part is the construction of a 3-D FSI based on the common spectral indexes (DVI, RVI, RDVI, and NDVI) and the selection of optimal bands of the exciting wavelength, the emitting wavelength, and the reference wavelength with the linear correlation analysis. The third part is modeling using a linear function from the optimal 3-D FSIs and validation with the four evaluation metrics (RMSE, BIAS, SEC, and VC).

3. Results and Analysis

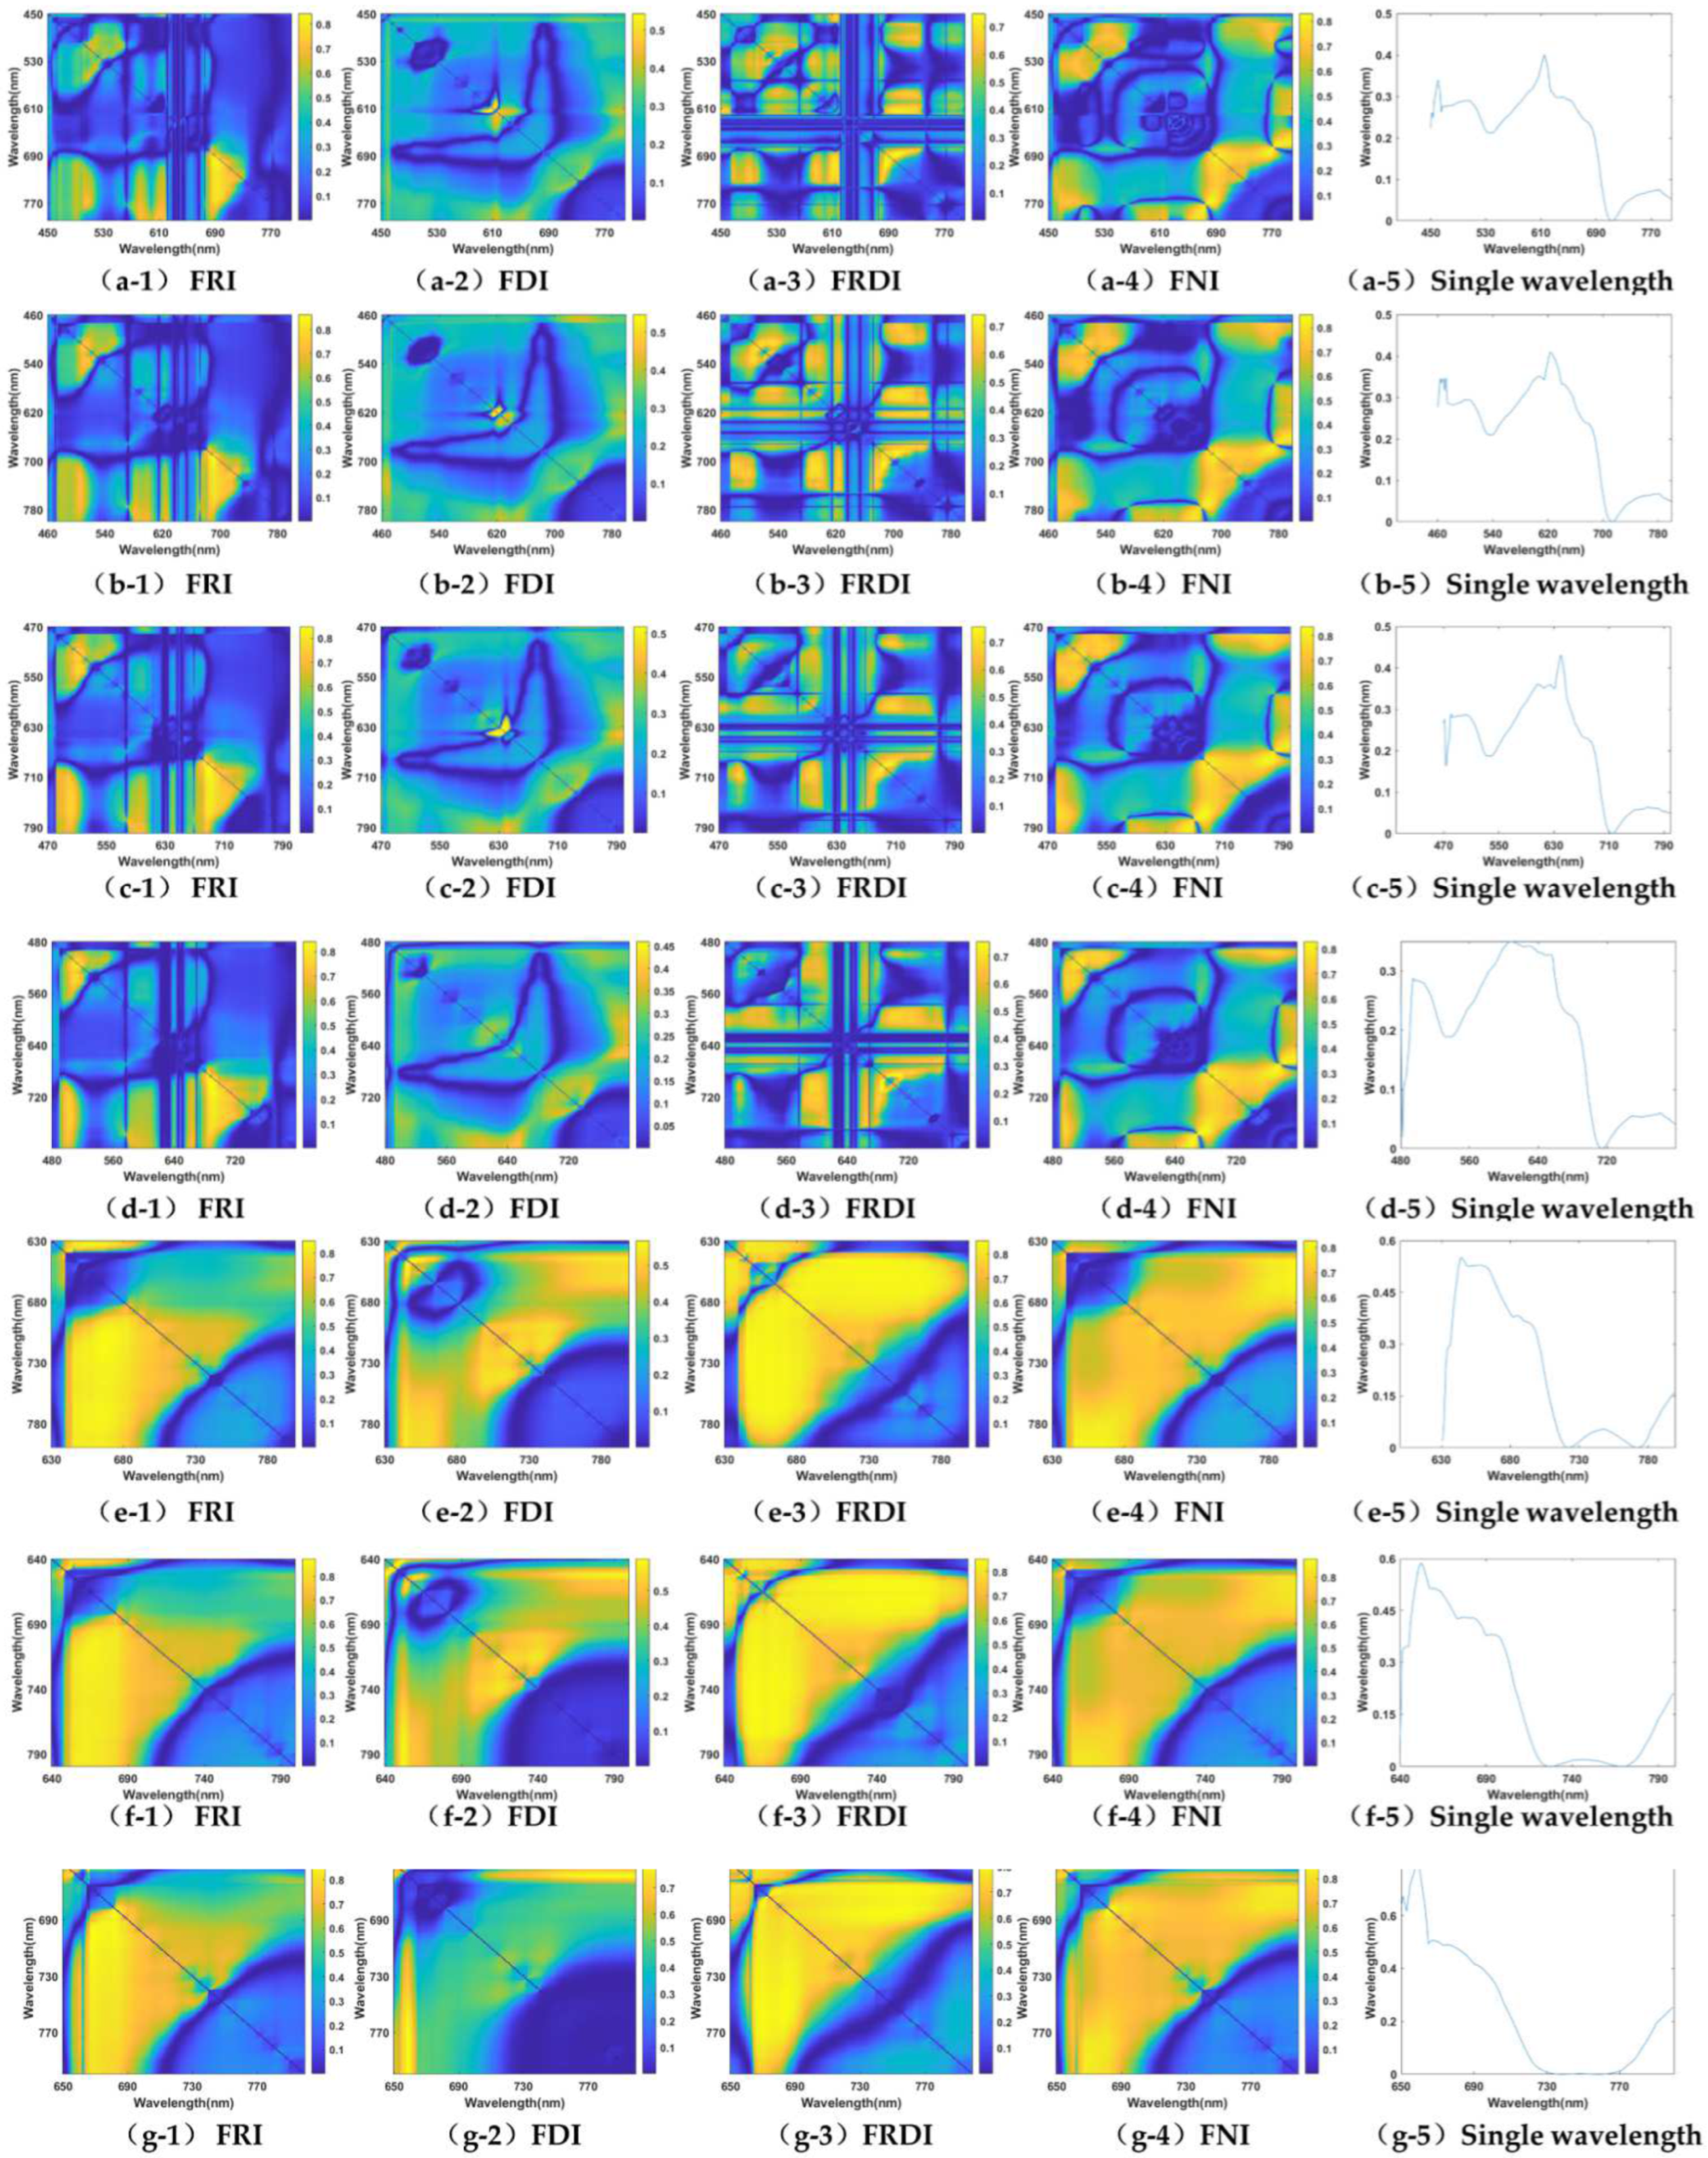
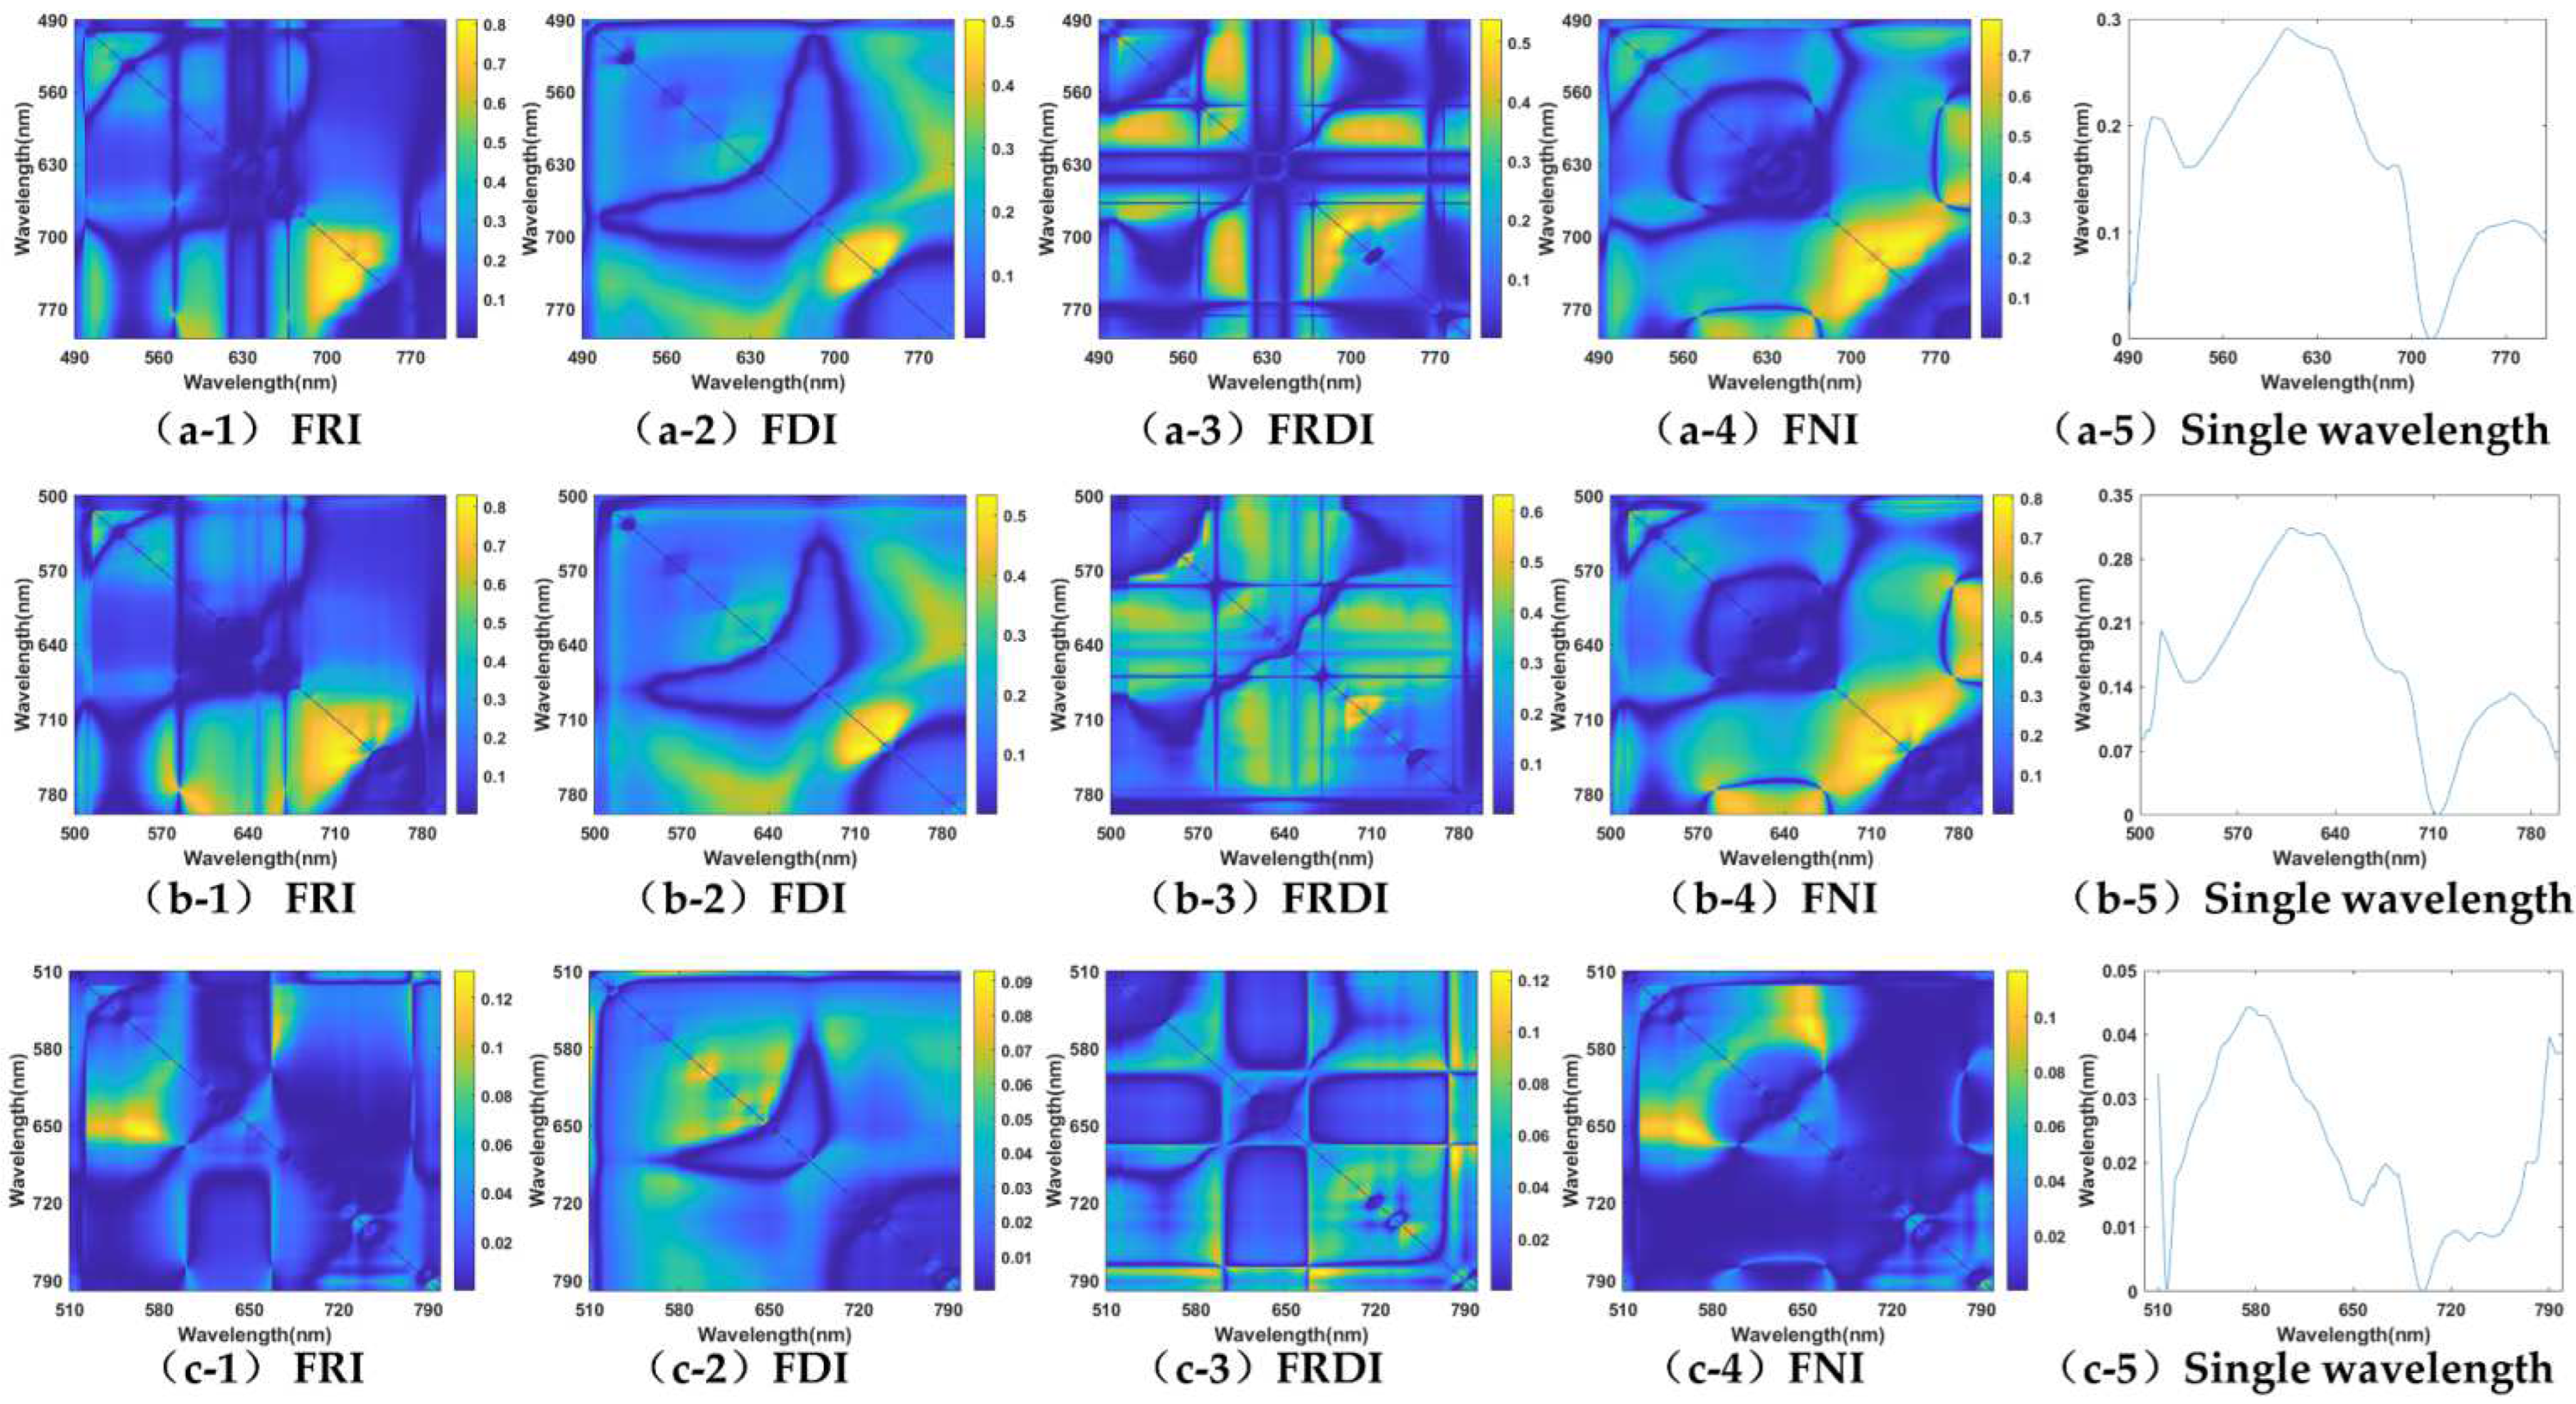
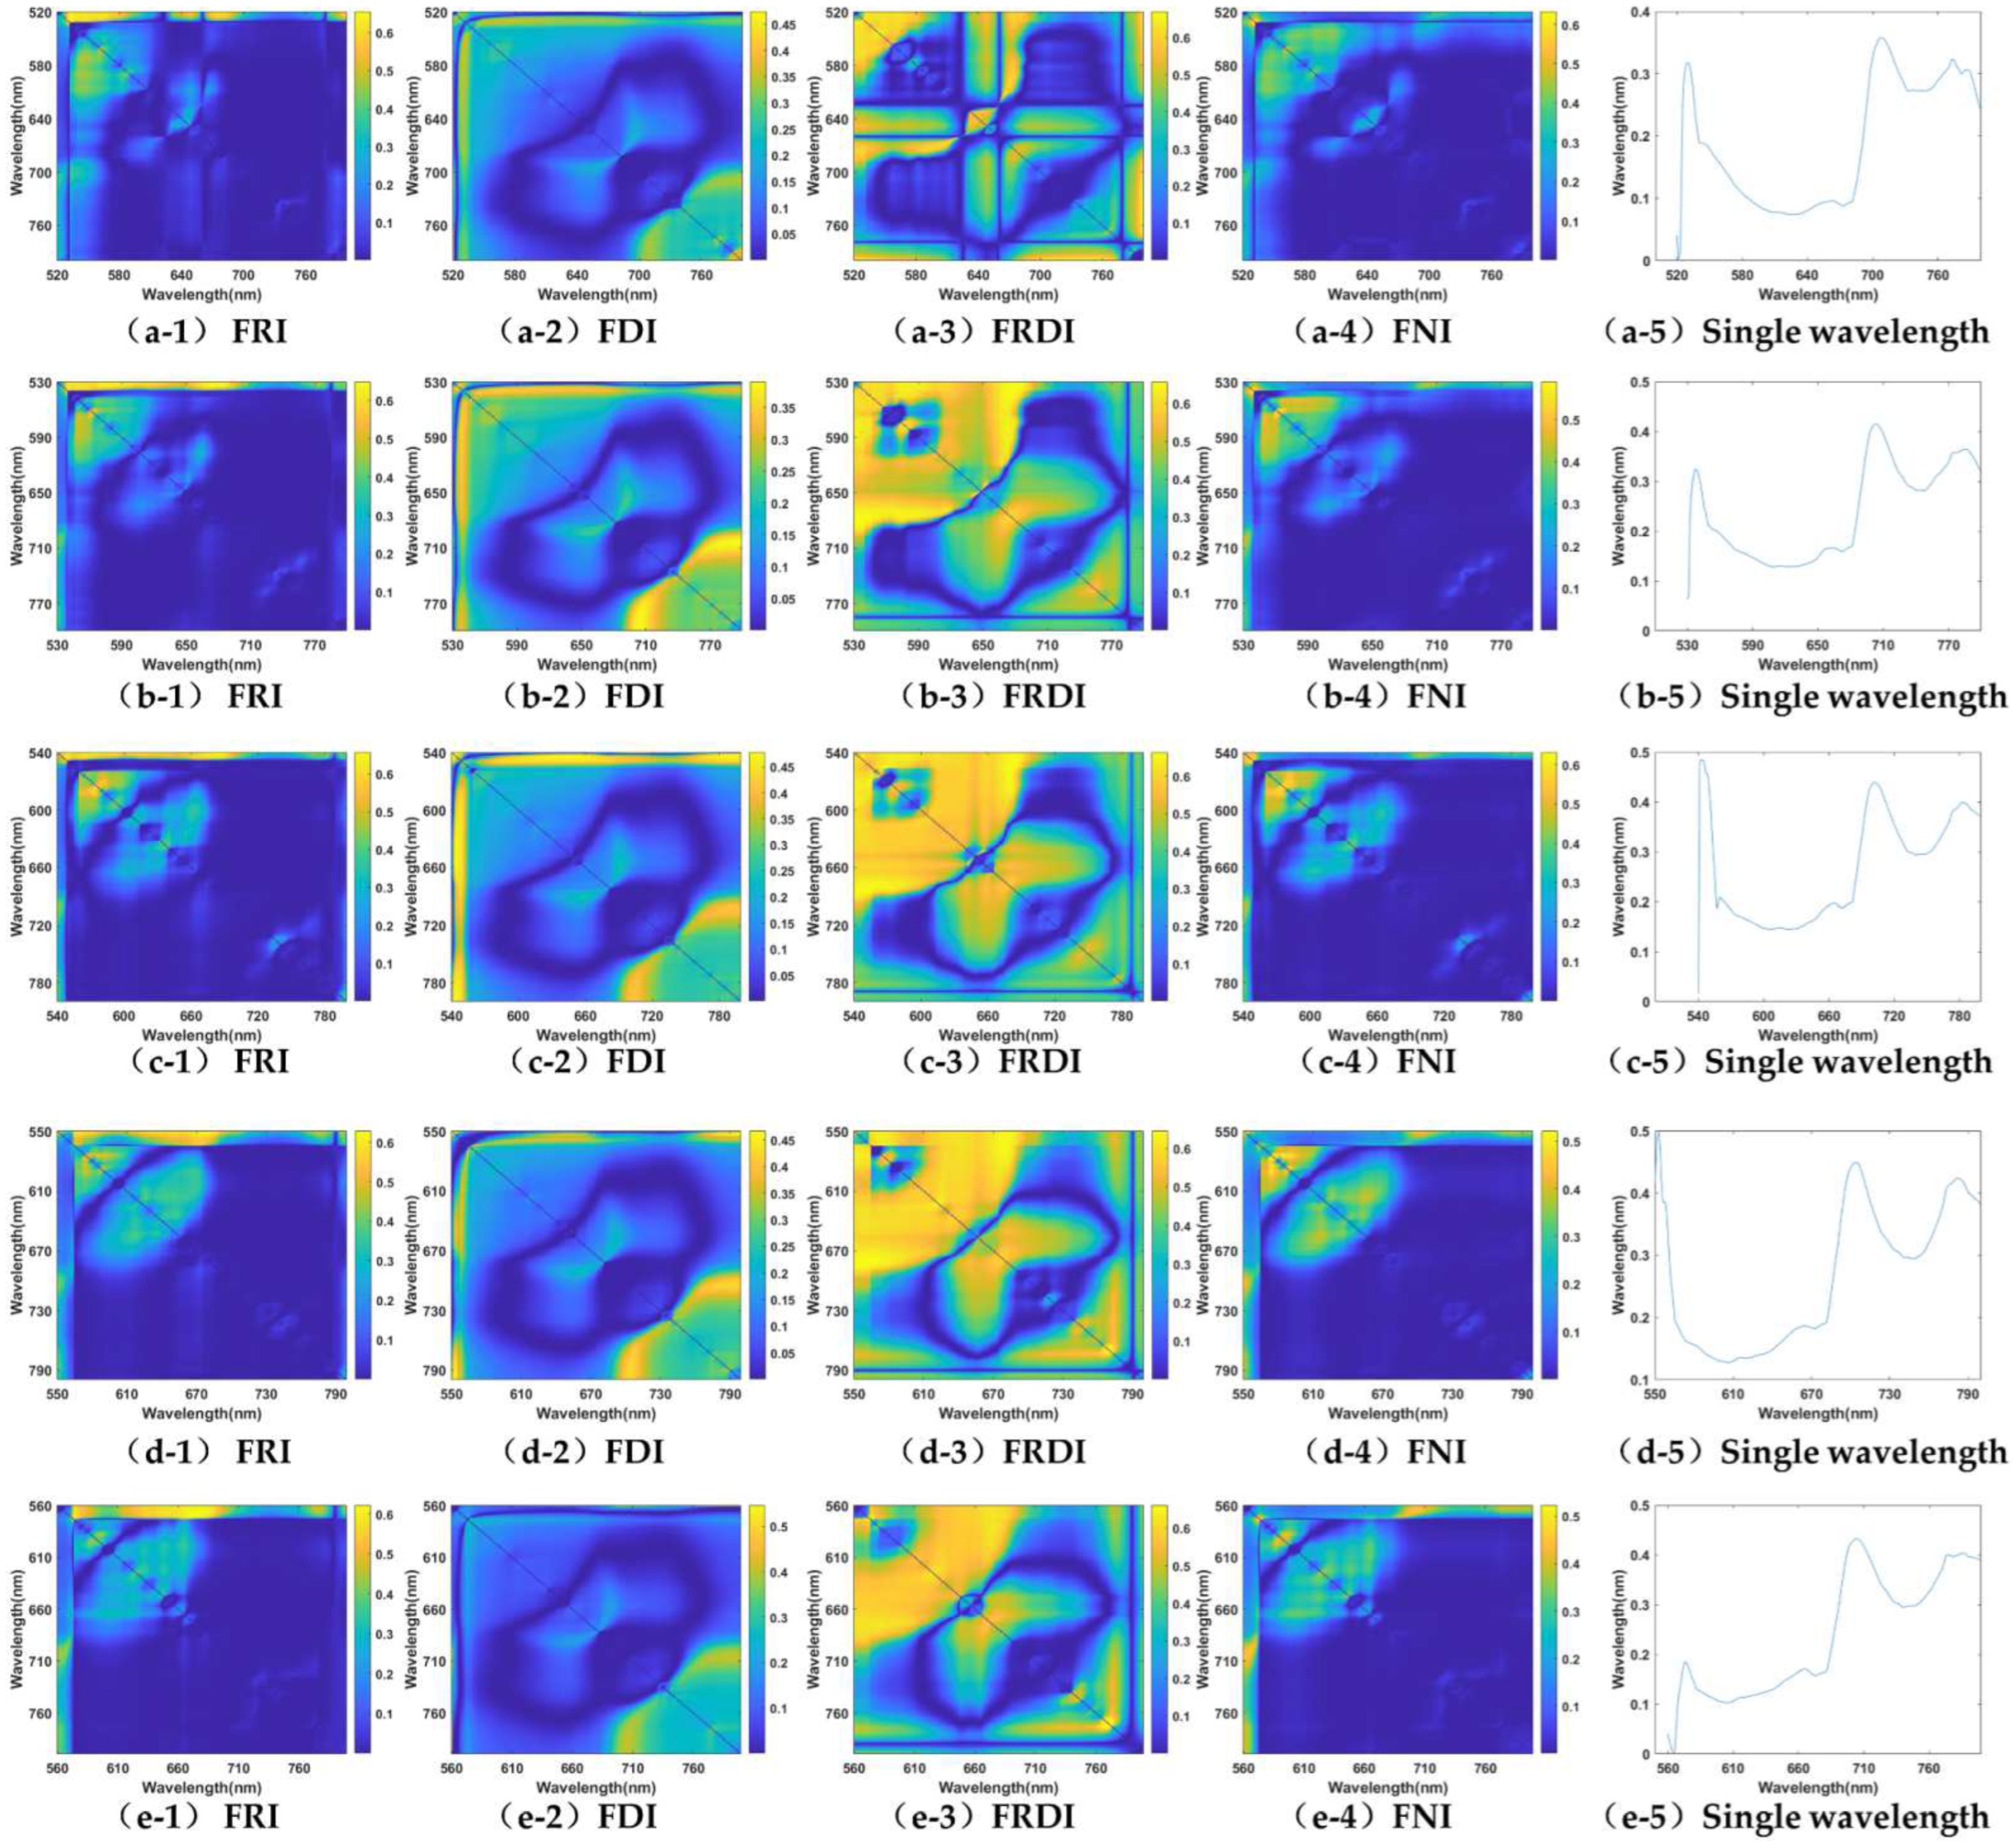
3.1. Band Sensitivity Analysis of 3-D Fluorescence Spectral Index

The new 3-D fluorescence spectral indices (3-D FSI) for multiple pigment content inversion for leaves via 3-D fluorescence spectra were composed of the pigments’ fluorescence information at the specific sensitive excitation band, emission band, and reference band. The sensitivity analyses for the sensitive band selection of the 3-D FSIs were performed using the correlation coefficient square, C2, between pigment content and 3-D FSI values. According to the selected excitation band for each pigment fluorescence shown in Table 3, four kinds of 3-D FSI combined with any two bands within the emission band were constructed, and the correlation analyses were performed between the fluorescence intensity of single band within the emission band and the value of four kinds of 3-D FSI and the corresponding pigment content. The maximum value of C2 was selected for each 3-D FSI. A comparison of the sensitivity analysis between 3-D FIS and the single-band value of pigment fluorescence was also analyzed. Finally, according to the maximum value and the T-test of C2, the excitation band, emission band, and reference band for the appropriate 3-D FSIs were selected to construct the inversion model of leaf pigment content (Chla, Chlb, Cars, Ants, and Flas) via the leaf fluorescence spectrum.

3.1.1. Chlorophyll a (Chla)

The fluorescence excited light resources in leaves at 410, 420, 430, 660, 670, and 680 nm from Table 3 were employed for the sensitivity analysis of Chla content with the fluorescence difference index (FDI), the fluorescence ratio index (FRI), the fluorescence reciprocal difference index (FRDI), and the fluorescence normalization index (FNI). The square C2 of the correlation coefficient between the Chla content and these 3-D FSI values, from any two emission bands and a single-band value, is shown in Figure A1.
Under the six excitation wavelengths, these C2 values from the single-band emission were less than 0.6, and they show no obvious correlation compared with those from 3-D FSI (Figure A1 and Table 5). The distribution of C2 values in the correlation matrix map from FDI, FNI, and FRDI was symmetrical in the diagonal direction in all the excitation wavelengths, while the C2 values from FRI were asymmetrical. This could be due to the second absorption of Chla emission fluorescence by leaf chlorophyll at 620–700 nm [59]. Under 410 nm, 420 nm, and 430 nm excitation, the maximum values of C2 from FRI and FNI, the highest sensitivity between Chla content and its fluorescence characteristics were strong, and they were all above 0.85 and 0.77, respectively, while the maximum values from FDI and FRDI were weak, below 0.55 and 0.71, respectively. Under 660 nm 670 nm, and 680 nm excitation, the sensitivities from FRI, FRDI, and FNI were strong, respectively, and all were above 0.81 of the maximum C2, but the FDI was weaker, below, or equal to 0.75. The maximum values of C2 were selected from the correlation matrix map of all excitation light resources, which is shown in Table 5. In the band sensitivity analysis on Chla with the 3-D FSI and the single-wavelength fluorescence information, the 3-D FSIs with significance levels at 0.01 and 0.05, including FRI at Fex,410; FRI at Fex,420; FRI and FNI at Fex,430; FRI, FRDI, and FNI at Fex,660; FRI, FRDI, and FNI at Fex,670; and FRI, FRDI, and FNI at Fex,680 in Table 5, were selected to structure the model of the leaf Chla content via the 3-D fluorescence spectrum.

3.1.2. Chlorophyll b (Chlb)

The excitation wavelengths at 450 nm, 460 nm, 470 nm, 480 nm, 630 nm, 640 nm, and 650 nm (see Table 3) were employed for the sensitivity analysis of Chlb. The correlation coefficient square C2 distributions for Chlb between its content and the 3-D FSIs or single-band fluorescence information were similar to those of Chla in Figure A2. Under the seven excitation wavelengths, these C2 values from the single-band emission for Chlb still showed no obvious correlation compared with those from 3-D FSI. The maximum values of C2 for Chlb were selected from the correlation matrix map of those excitation light resources, as shown in Table 5. Although the C2 maximum values from FRI, FNI, or FRDI at the 450 nm, 460 nm, and 470 nm excitation wavelengths were significant at the 0.01 and 0.05 levels, the distances between the central and reference wavelengths for these 3-D FSIs were less than 10 nm. Considering that the chlorophyll fluorescence was a feature of the wide spectrum in the two fluorescence emission peaks (fluorescence peak positions at 680 nm and 740 nm) [61], these 3-D FSIs with a short distance between the central and reference wavelengths were not selected for the Chlb inversion, and the other 3-D FSIs with more than 10 nm wavelength distance at the 0.01 and 0.05 level in the T-test, including FRDI at Fex,480, FRI and FRDI at Fex,630, FRDI at Fex,640, and FRI and FRDI at Fex,650 in Table 6, were carried out to build the Chlb inversion model via the leaf 3-D fluorescence spectrum. Compared with Chla, there were some 3-D FSIs for Chlb with a band distance of less than 10 nm between the central and reference wavelengths of 3-D FSIs. This could indicate a high correlation between Chla and Chlb content in these leaf samples [38].

3.1.3. Carotenoids (Cars)

For the sensitivity analysis of Cars, we employed the excitation bands in the 490 nm, 550 nm, and 510 nm wavelengths (Table 3). The distributions of the correlation coefficient square, C2, for Cars between its content and 3-D FSIs or single-band fluorescence information were also similar to those of Chla and Chlb in Figure A3. These C2 values from the single-band emission for Cars under the three excitation bands (490 nm, 500 nm, and 510 nm) still showed no obvious correlation with the lower correlation coefficient square C2 compared with those from the 3-D FSIs, and the C2 values from the 3-D FSIs showed a significantly obvious correlation at the 0.05 T-test levels (Table 7), which were more than 0.8. These corresponding 3-D FSIs, including FRI at Fex,490 and FRI and FNI at Fex,500 in Table 7, were selected to build the Cars inversion model via the leaf 3-D fluorescence spectrum.

3.1.4. Flavonoids (Flas)

For Flas, the excitation bands in the 350 nm, 360 nm, and 370 nm wavelengths (from Table 3) were employed for the band sensitivity analysis based on Flas content inversion with a 3-D fluorescence spectrum. Compared with leaf photosynthetic pigments (Chla, Chlb and Cars), the distributions of the correlation coefficient square, C2, for Flas, between its content and single-band fluorescence information, were also similar, as shown in Figure A4, and had lower C2 values, but the maxima of these C2 values from the 3-D FSIs for Flas were far lower than those for the photosynthetic pigments. There was only FRI at Fex,370, with the maximum value of the correlation coefficient square C2 (0.54) at the 0.05 level from the T-test (Table 8), and the 3-D FSI was selected to build the Flas inversion model via the leaf 3-D fluorescence spectrum.

3.1.5. Anthocyanin (Ants)

For the band sensitivity analysis on the 3-D FSIs of Ants, the excitation light resources in the 520 nm, 530 nm, 540 nm, 550 nm, and 560 nm wavelengths (from Table 3) were employed. Like the leaf photo-protective pigment (Flas), the correlation coefficient square C2 distributions for the single-band sensitivity of Ants were also similar, as shown in Figure A5, and had higher C2 values, and the maxima of these C2 values from the 3-D FSIs for Ants in Table 9 were higher than those for Flas in Table 8. But these C2 values in Table 9 were lower than those for photosynthetic pigments (Chla, Chlb, and Cars) in Table 5, Table 6 and Table 7. Here, 3-D FSIs for Ants with a distance of less than 10 nm between the central and reference wavelengths still emerged, including FRI, FRDI, and FNI at Fex520, FRDI at Fex530, and FRDI at Fex560, all with a 0.05 level from the T-test. This could indicate a high correlation between total chlorophyll and anthocyanin contents in the green leaf [40]. Thus, FRI and FRDI at Fex540 were selected to build the Ants inversion model via the leaf 3-D fluorescence spectrum.

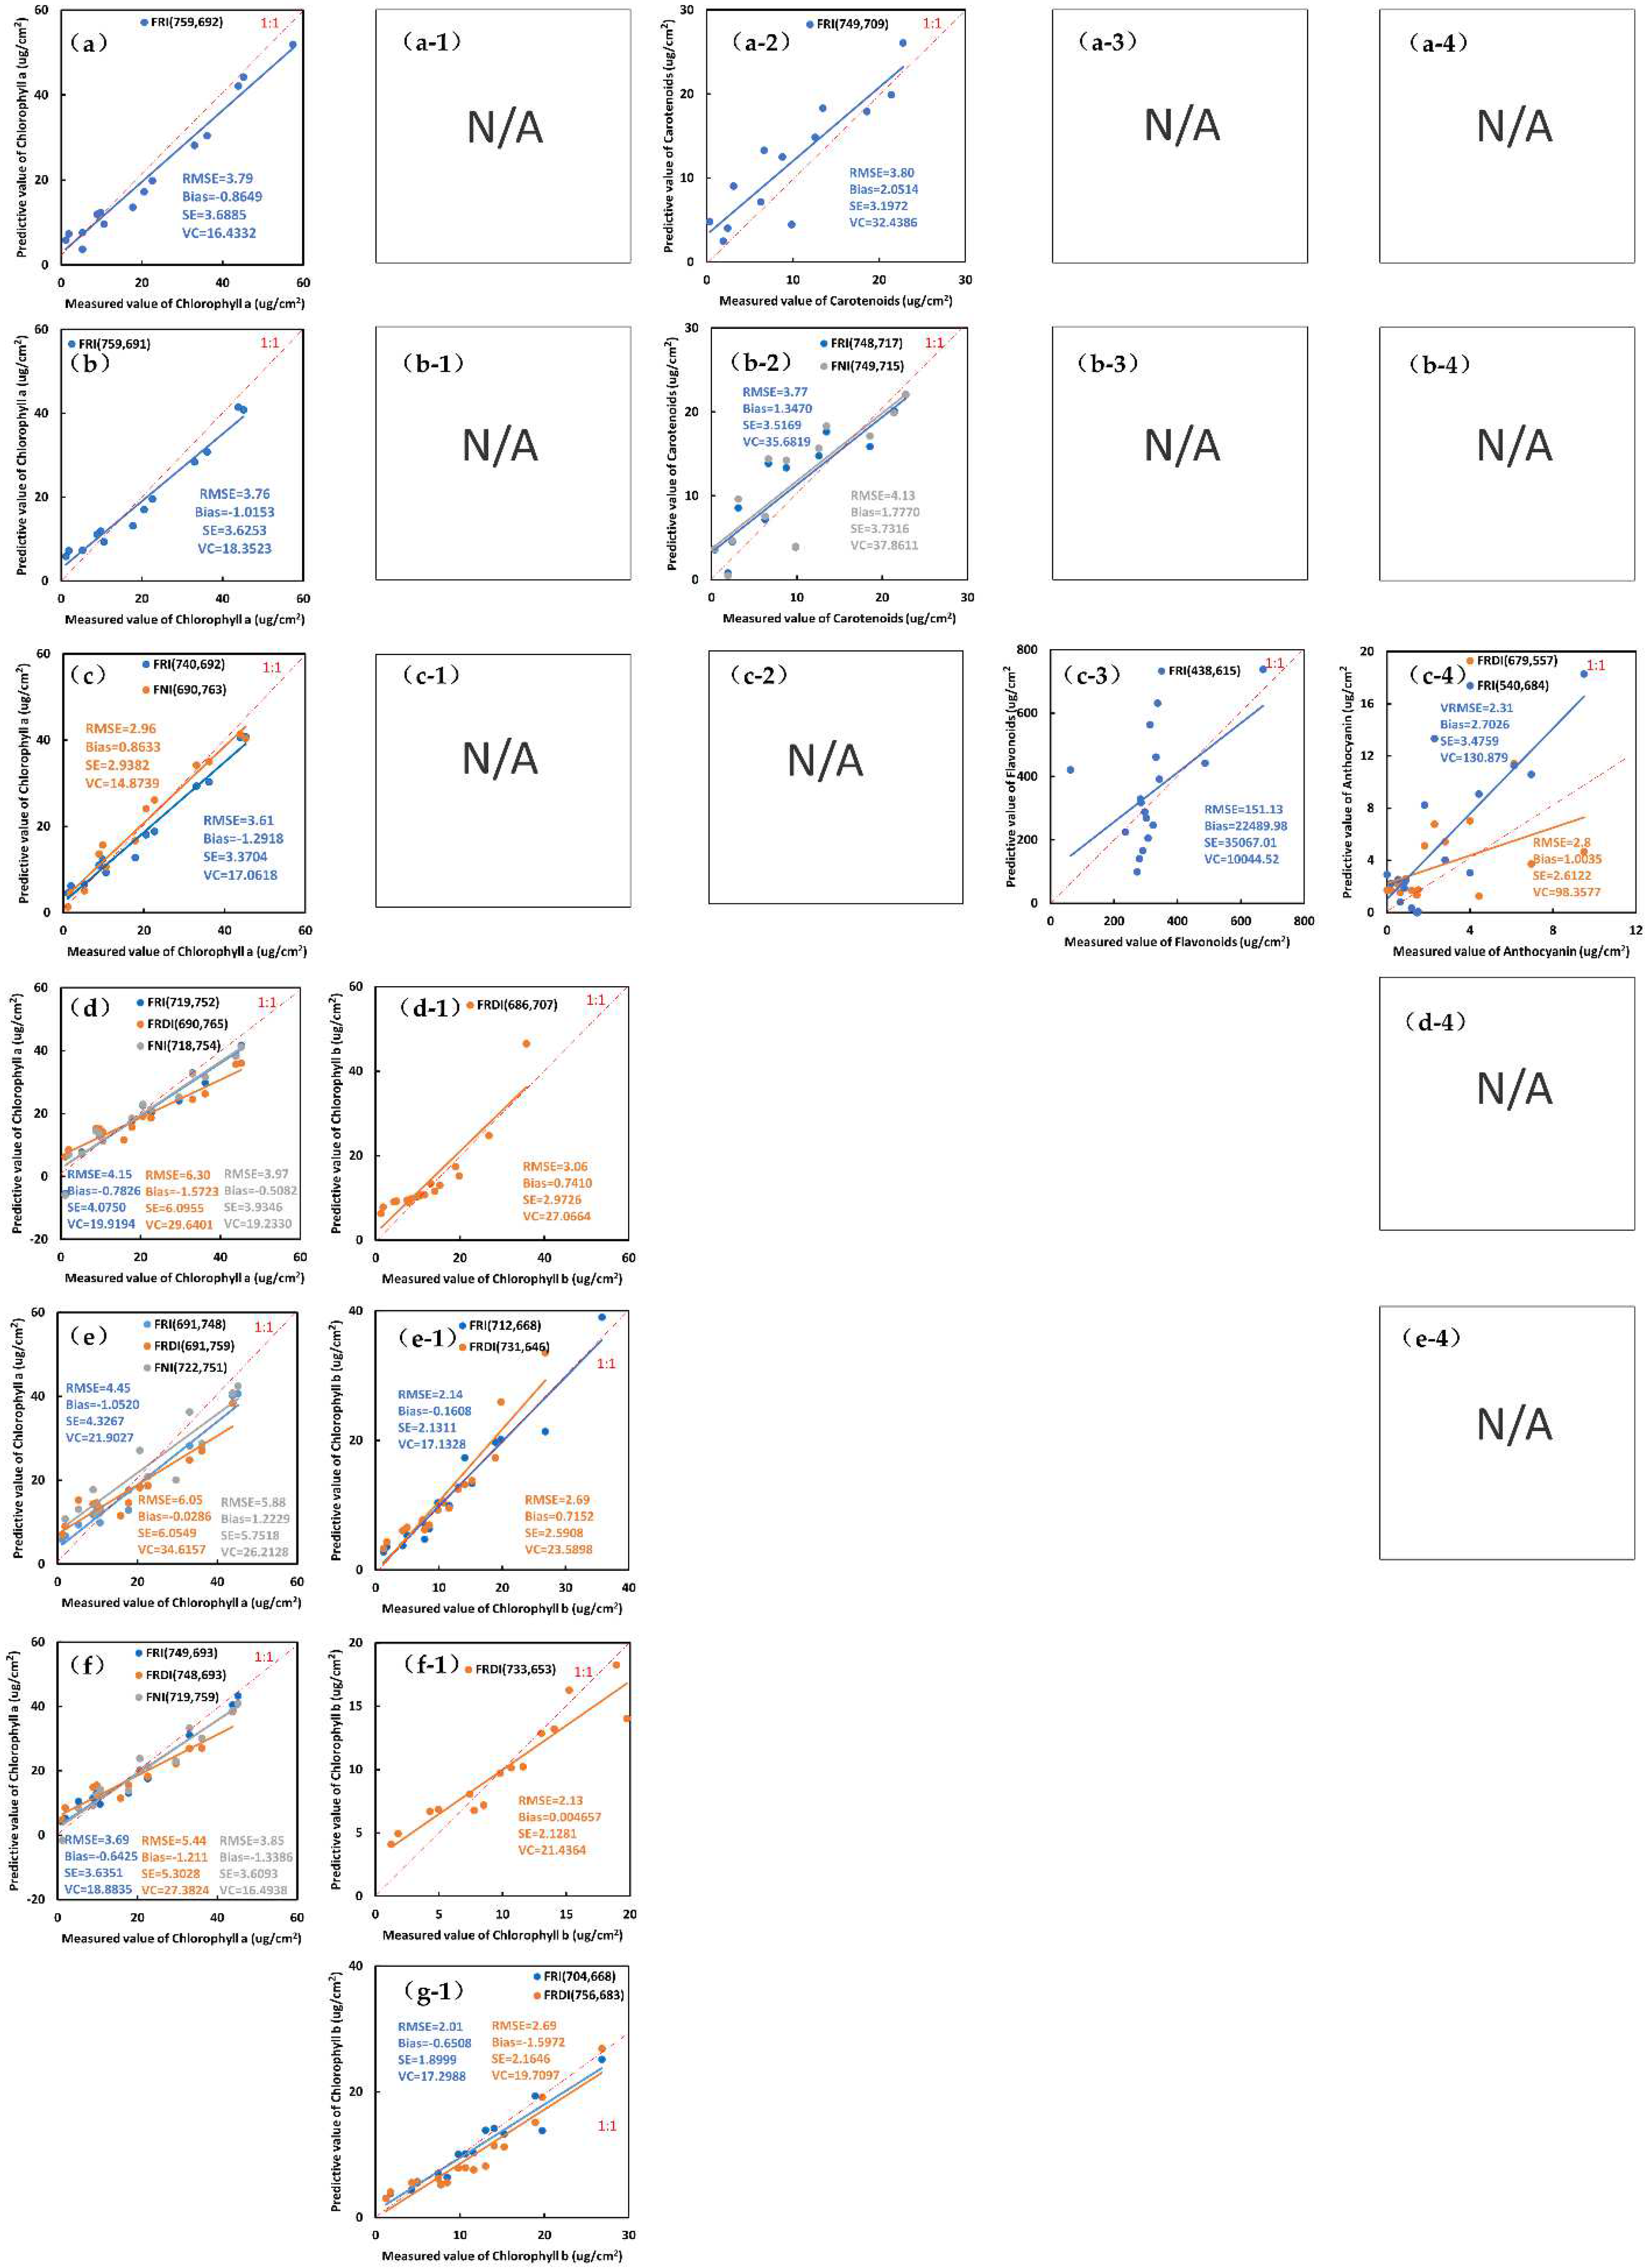
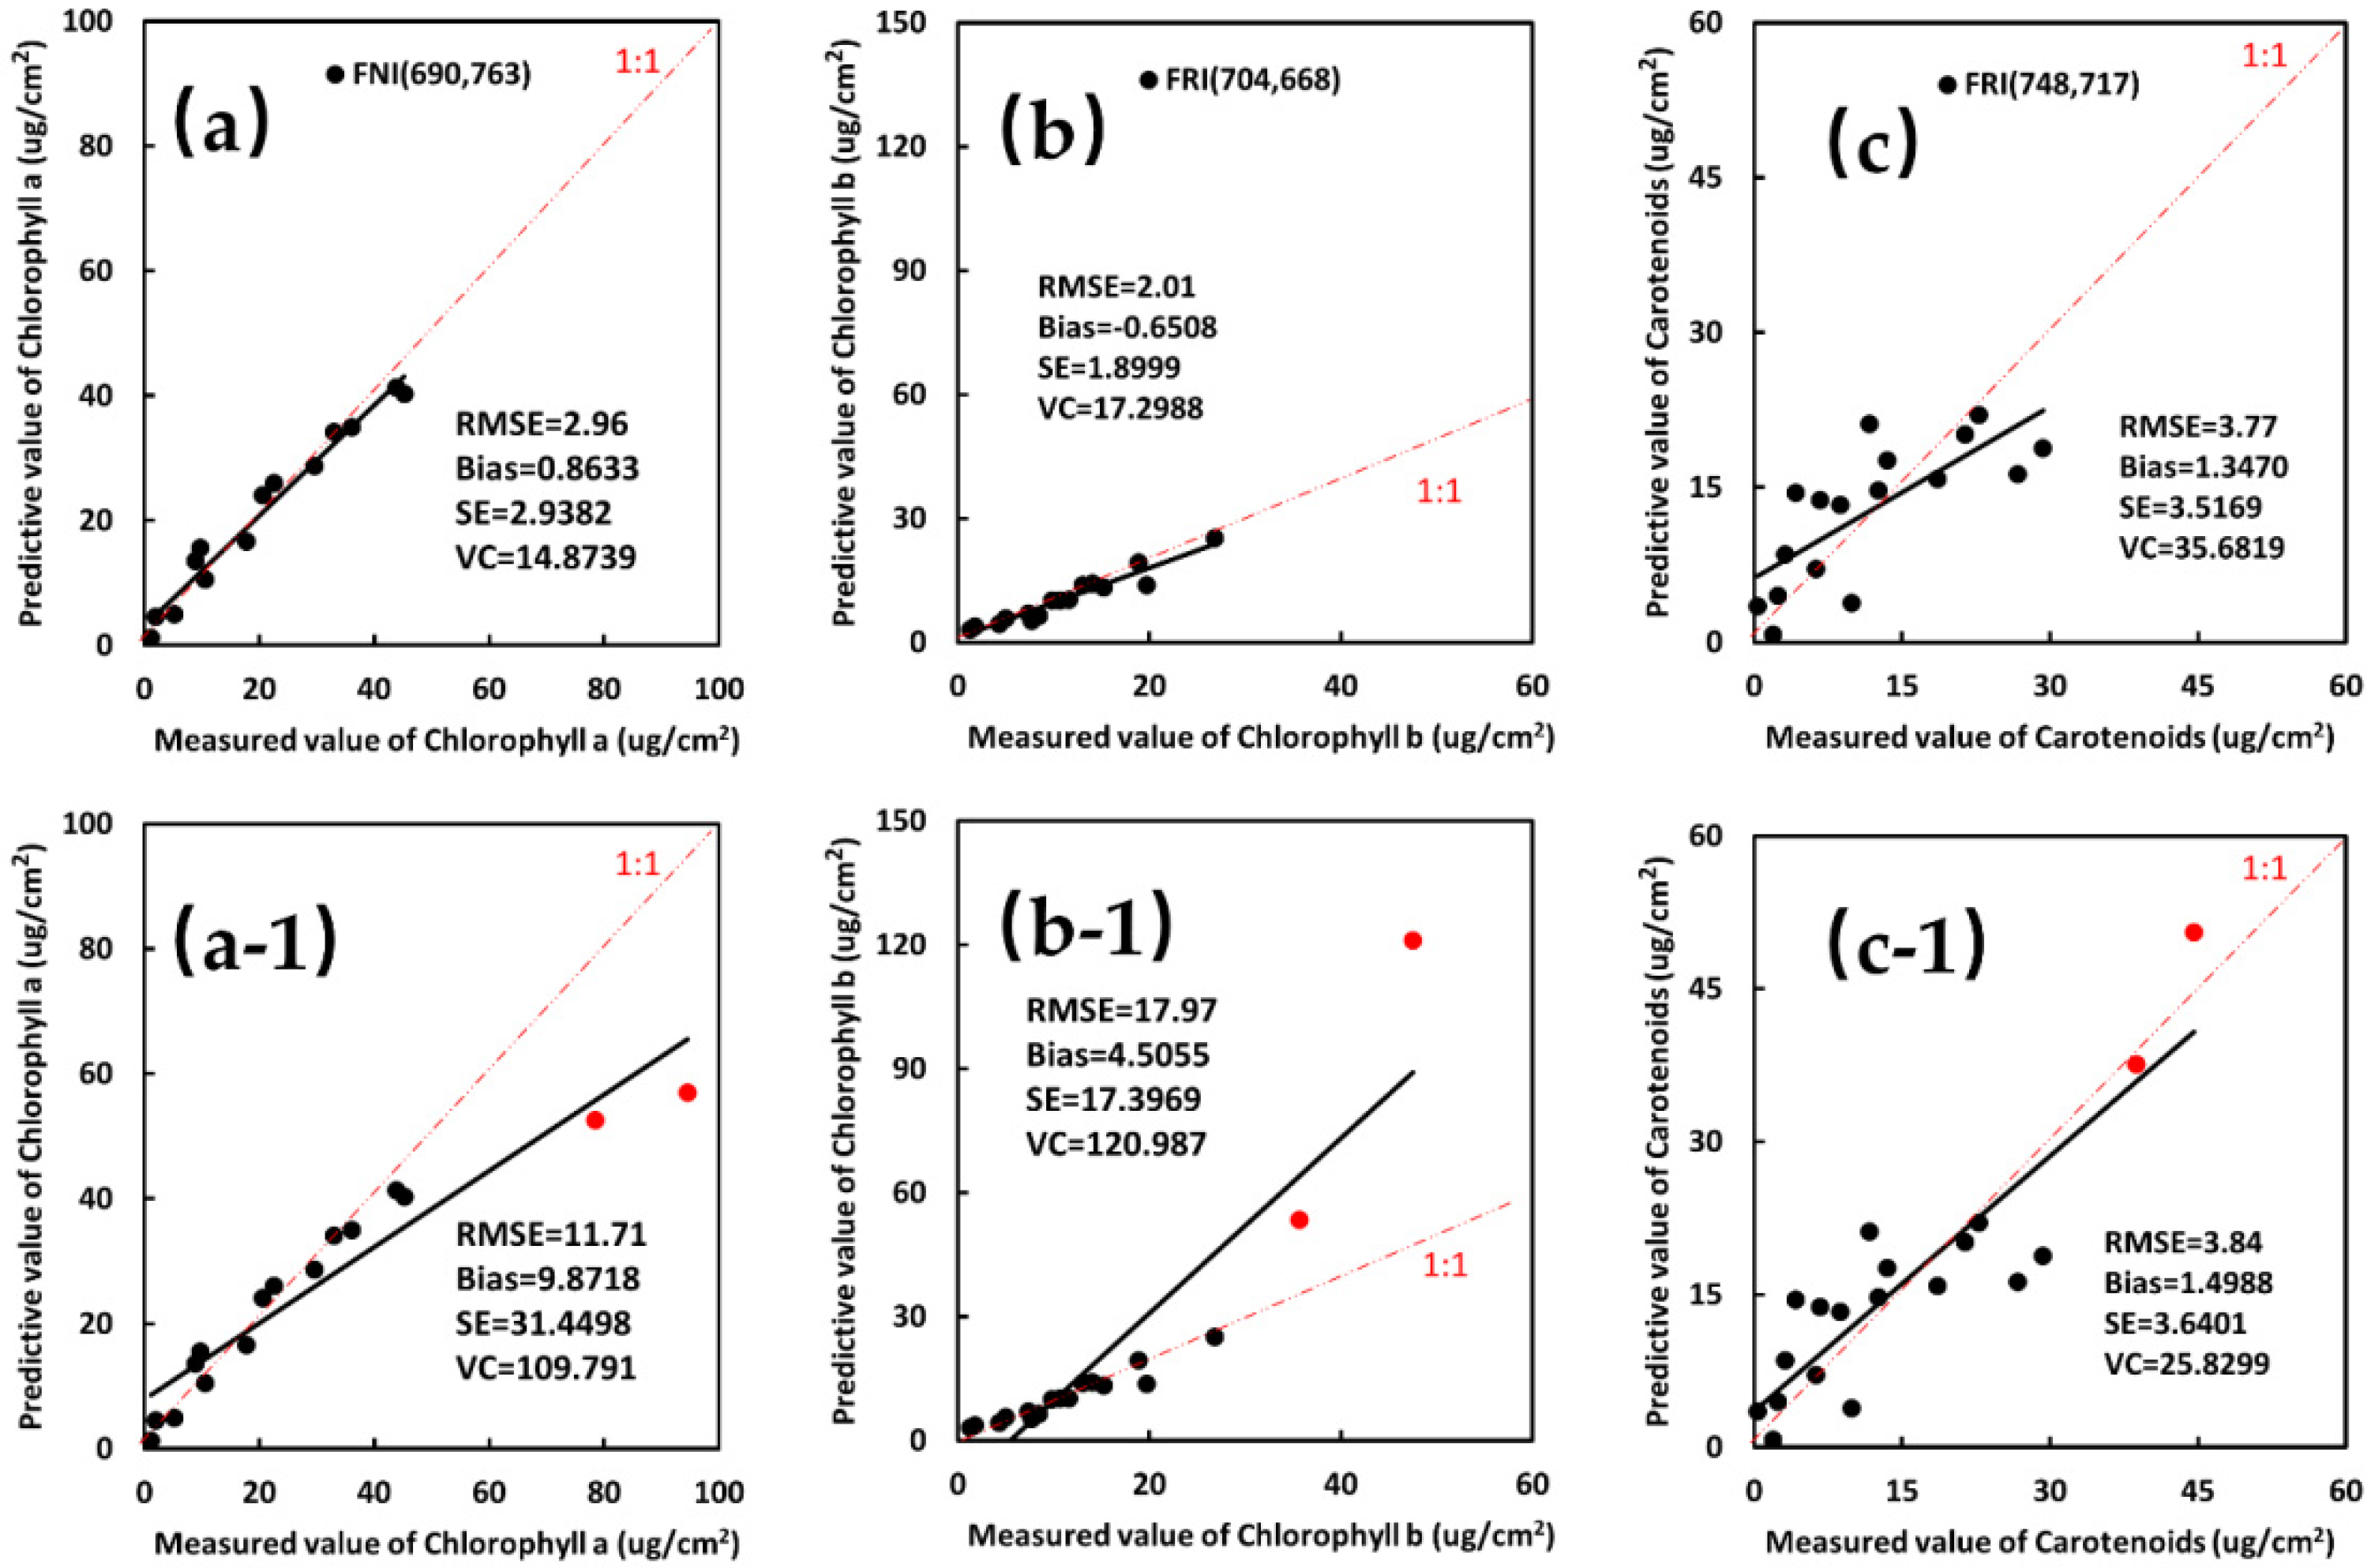
3.2. Modeling and Validation of Multiple Pigment Content Inversion Model of Leaves from 3-D FSIs

The excitation wavelength and the central and reference wavelengths of the fluorescence emission for the selected 3-D FSIs with a high sensitivity were used to build the inversion models of Chla, Chlb, Cars, Flas, and Ants contents, and these building models employed a linear function. The determination coefficient R2 of the linear fitting function was designed as an evaluation metric for building models of the multiple pigment content inversion of leaves via 3-D fluorescence spectra, and the RMSE, Bias, SE, and VC were employed for the accuracy evaluation based on the inversion ability of these built models. The T-test was used for the comparison of modeling and validation between the different models with the 3-D FSI of pigment inversion via 3-D fluorescence spectra.
The linear characteristics and evaluation of the inversion models with 3-D FSI are shown in Figure A6 and Figure A7, and the evaluation metrics of these inversion models are shown in Table 10.
For the modeling and validation of Chla with high-sensitivity 3-D FSIs at the different excitation wavelengths, the T-tests of all the evaluation metrics of FRI (F410,759/F410,692), FNI ((F430,690 − F430,763)/(F430,690 + Fem,763)), FNI ((F660,718 − F660,754)/(F660,718 + F660,754)), and FRI (F680,749/F680693) (Table 10), including the R2 metric for modeling evaluation and RMSE, Bias, SEC, and VC metrics for the validation evaluation, were at or over the 0.05 level. Additionally, the best validation evaluation metrics were from the 3-D FSI (FNI ((F430,690 − F430,763)/(F430,690 + Fem,763))), with RMSE (2.96 µg/cm2), Bias (0.8633 µg/cm2), SEC (2.9382 µg/cm2), and VC (14.8739%). For Chlb, the T-tests of all evaluation metrics of FRI (F630,712/F630,668) and FRI (F650,704/F650,668) were at or over the 0.05 level, and the best validating evaluation metrics were from FRI (F650,704/F650,668) with RMSE (2.01 µg/cm2), Bias (−0.6508 µg/cm2), SEC (1.8999 µg/cm2), and VC (17.2988%). For Cars, the T-tests of all evaluation metrics of the only FRI (F500,748/F500,717) were at or over the 0.05 level, and the validating evaluation metrics RMSE, Bias, SEC, and VC were 3.77 µg/cm2, 1.3470 µg/cm2, 3.5169 µg/cm2, and 35.6819%, respectively. Only FRI (Fem,615/Fem,438) was selected for the modeling and validation evaluation of the leaf Flas content inversion, but the evaluation metrics were not good. For Ants, although there was a 3-D FSI (FRDI (1/F540,679-1/F540,557)) with evaluation metrics at or over the 0.05 level, the validating evaluation metric VC (98.3577%) was not encouraging.
Thus, the results showed that the performances of 3-D FSIs for photosynthetic pigments content inversion (including Chla, Chlb, and Cars) were much better than for photo-protective pigments (including Flas and Ants) from the 3-D fluorescence spectra of plant leaves. Here, the 3-D FSI (FNI ((F430,690 − F430,763)/(F430,690 + Fem,763))) for the Chla inversion model had the highest accuracy, the RMSE was 2.96 μg/cm2, and the 3-D FSI (FRI (F650,704/F650,668)) for the Chlb model had an encouraging RMSE (2.01 μg/cm2). The RMSE of the 3-D FSI (FRI (F500,748/F500,717)) for carotenoid inversion was 3.77 μg/cm2.

4. Discussion

4.1. New 3-D Fluorescence Indices for Multiple Pigment Content Inversions

In this study, new 3-D fluorescence indices (3-D FIs) were proposed for the content inversion of multiple plant pigments from the 3-D leaf fluorescence spectrum, and the inversion performance of chlorophyll a and b were the best, mainly because they are the main fluorescent-emission pigments in green plant leaves [29]. The dataset employed in this paper was composed of green leaves [38]. Compared with the current studies on plant leaf pigment inversion using leaf spectral reflectance, the inversion accuracy of Chla and Chlb with the 3-D FSIs were better than those of the RT model [38,62] and the spectral index [28], especially in the evaluation metric RMSE (2.96 μg/cm2) of Chla and RMSE (2.01 μg/cm2) of Chlb. Moreover, vegetation spectral can simplify spectral feature and not descale the extraction accuracy of plant information through with a drone multispectral imaging camera in the Barnhart report [63]. Similarly, the 3-D FSIs for leaf chlorophyll a and b could simplify the spectrum characteristics compared with 3-D leaf fluorescence spectrum, and there would a potential chance for the fluorescence images of leaf chlorophyll a and chlorophyll b, using a multi-band imaging camera with a special active fluorescence excitation light source and a few fluorescence imaging channels.
Compared with existing fluorescence research, the newly built 3-D FSIs in this study can inverse the content of Chla and Chlb with an encouraging determination coefficient (0.8251 and 0.8696 from Table 10, respectively), but the previous research [25] only aimed to inverse leaf total chlorophyll content with a lower determination coefficient (0.73 and 0.75, respectively). The total chlorophyll fluorescence was commonly applied in the plant stress monitoring and the monitoring results, such as plant drought and disease, were not ideal for the early stage stress [64], but chlorophyll a and b both decreased rapidly in the early stage of plant stress, and the decline rate of a was faster than that of b [6]. Thus, the 3-D FSls for Chla and Chlb could provide a chance for the early stage of plant stress.
Although the inversion accuracy of Cars was encouraging in the evaluation metrics, no literature had proposed that carotenoids have fluorescence in plant leaves. The good precision of the inversion results could be related to the high correlation between the content of chlorophyll in plant leaves and the content of carotenoids [65].
The inversion ability of photo-protective pigments Flas and Ants was lower than that of photosynthetic leaf pigments. Although the emission fluorescence band of flavonoids was around 520–570 nm [66] and it had obvious emission fluorescence bright spots in the 3-D fluorescence spectrum in Figure 2, the absorption spectral characteristics of Ants, Chla, and Chlb were within this range. This could have produced the re-absorption result, and then the inversion ability of Flas content was brought down. Drabent et al. [67] showed that fluorescent anthocyanins (or other fluorescent species) exist in the aqueous extract of red cabbage, and their fluorescence spectra are concentrated at 363, 434, and 519 nm, respectively. No literature has indicated obvious fluorescence in living leaves. In this study, anthocyanin in living leaves showed no fluorescence characteristics in the 3-D fluorescence spectrum. Compared with Ants, the lower inversion ability of Flas could be produced based on the absence of a relationship between the total chlorophyll and the Flas content and based on the relationship between the total chlorophyll and the Ants content in the green leaves [40]. All of these factors were the cause of the lower inversion performance of Flas than Ants with 3-D FSI, and the inversion performance of the two photo-protective pigments was lower than those of photosynthetic pigments.

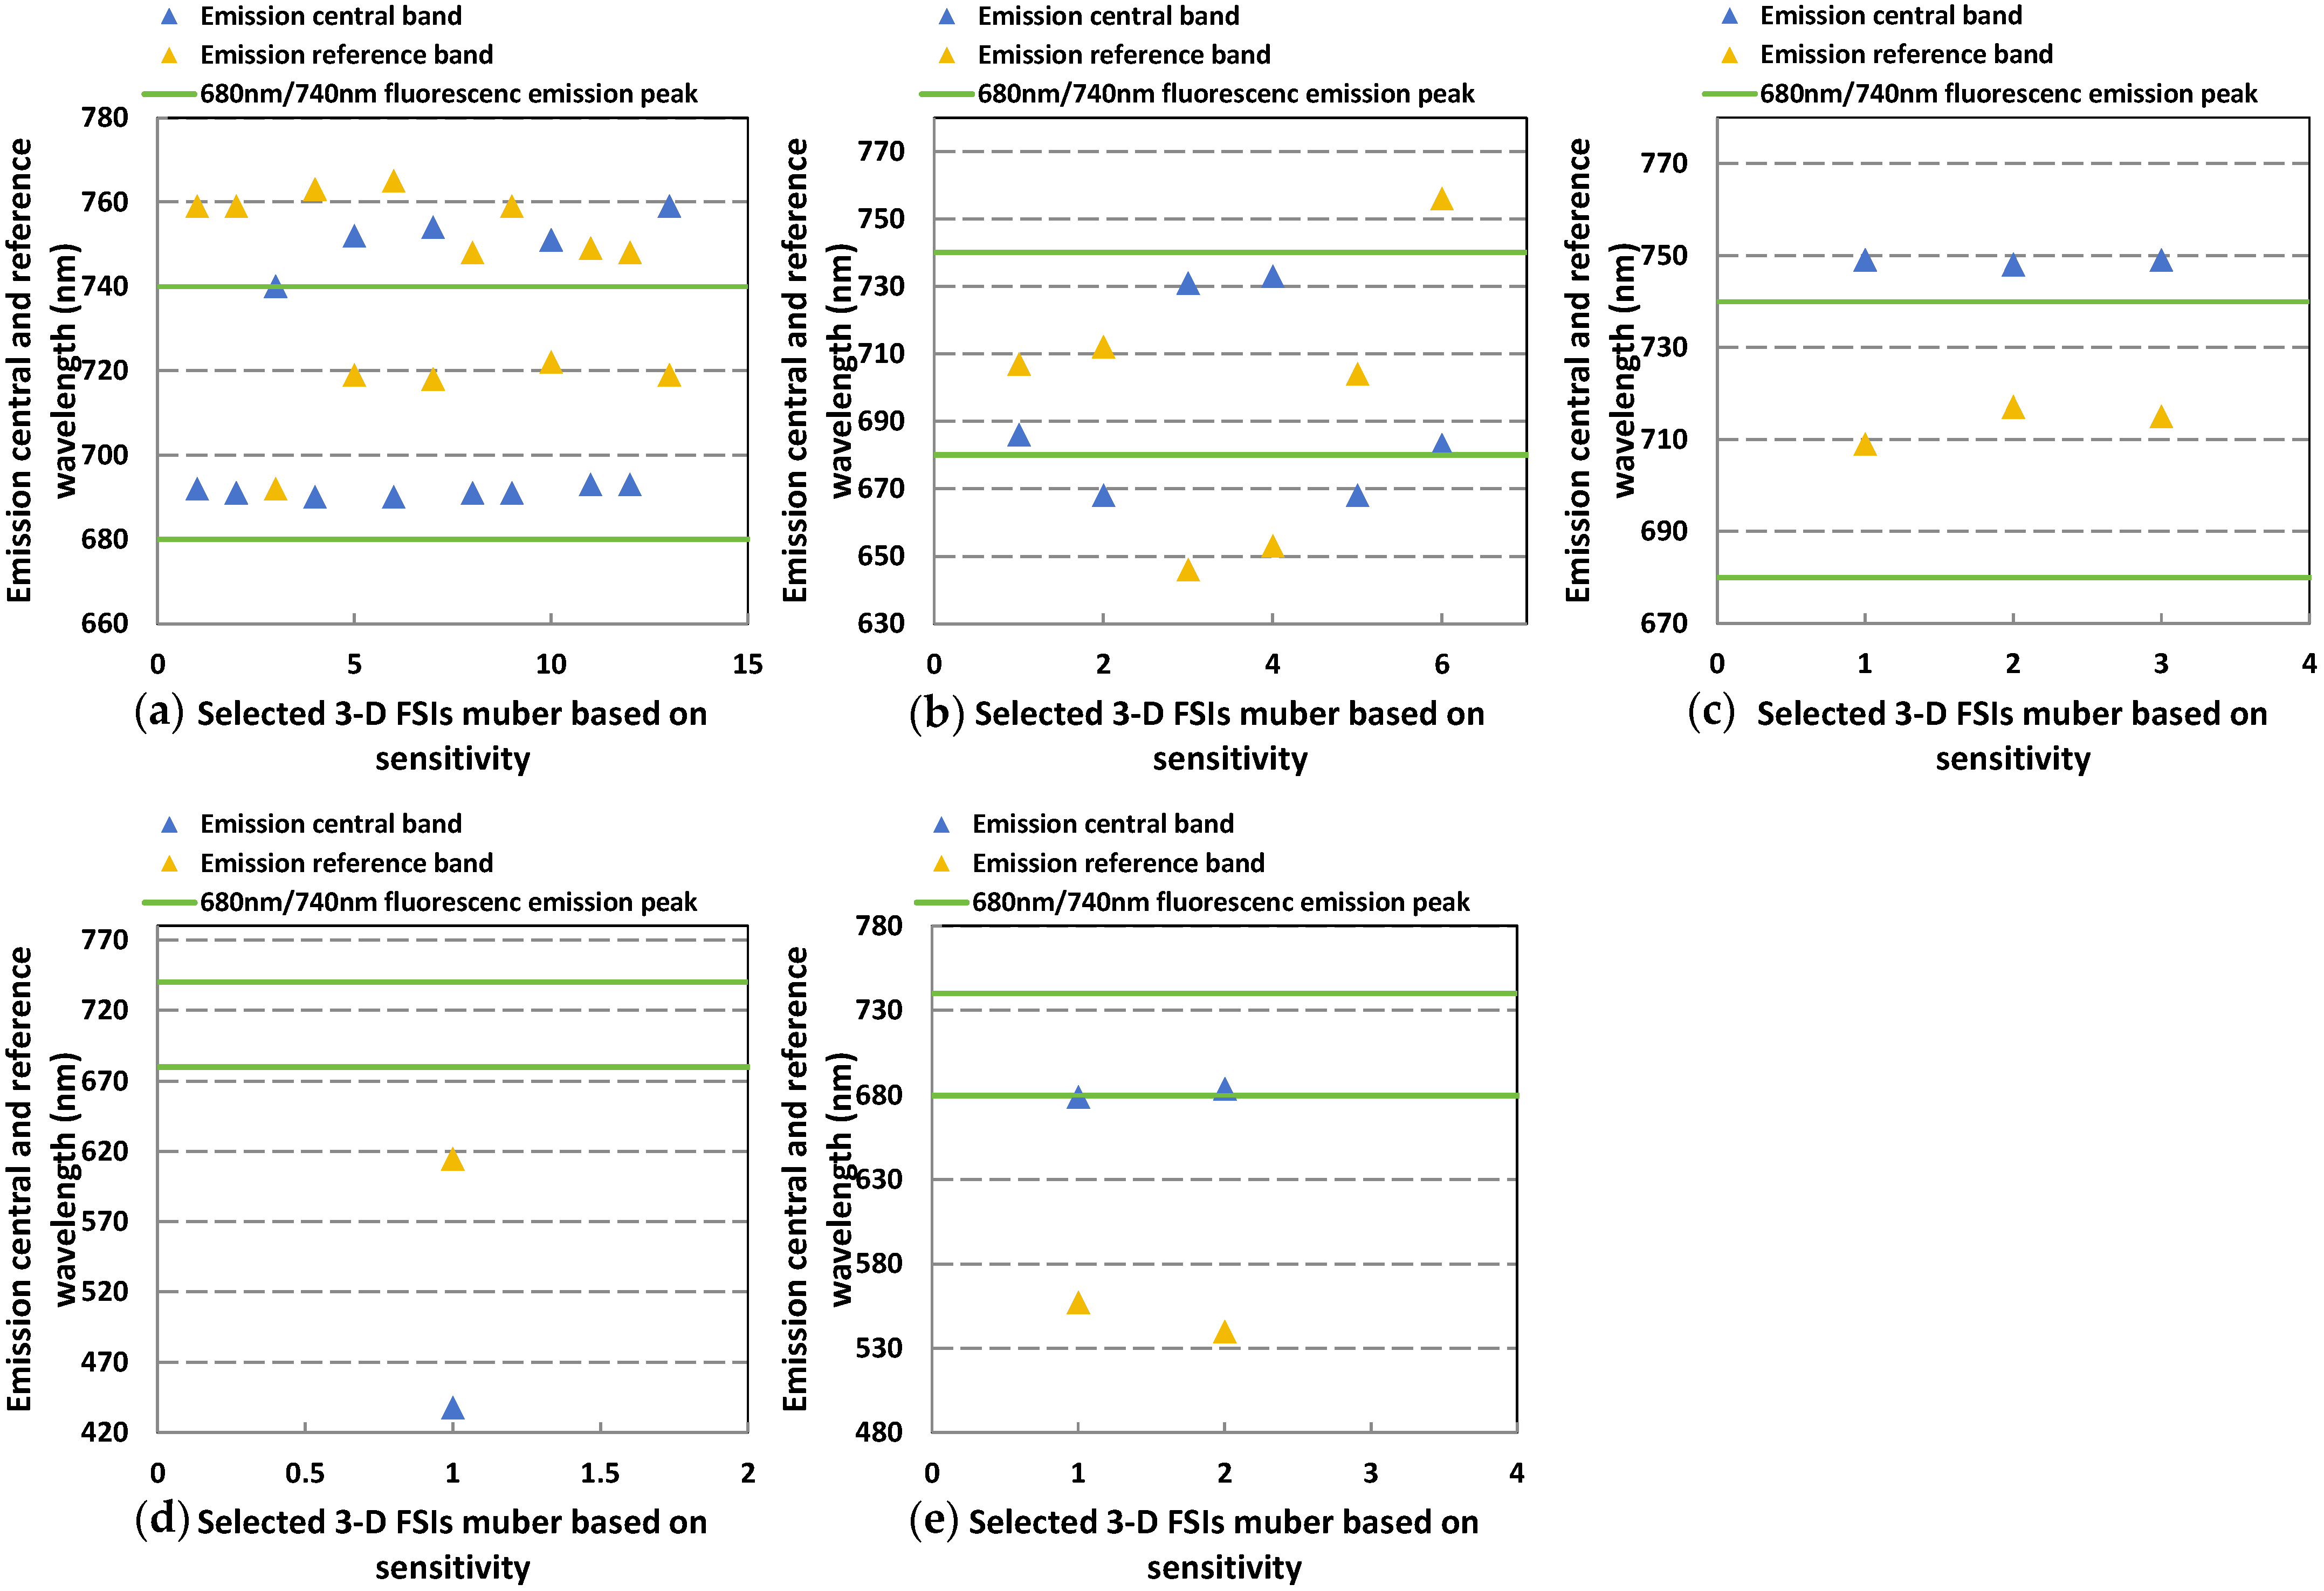
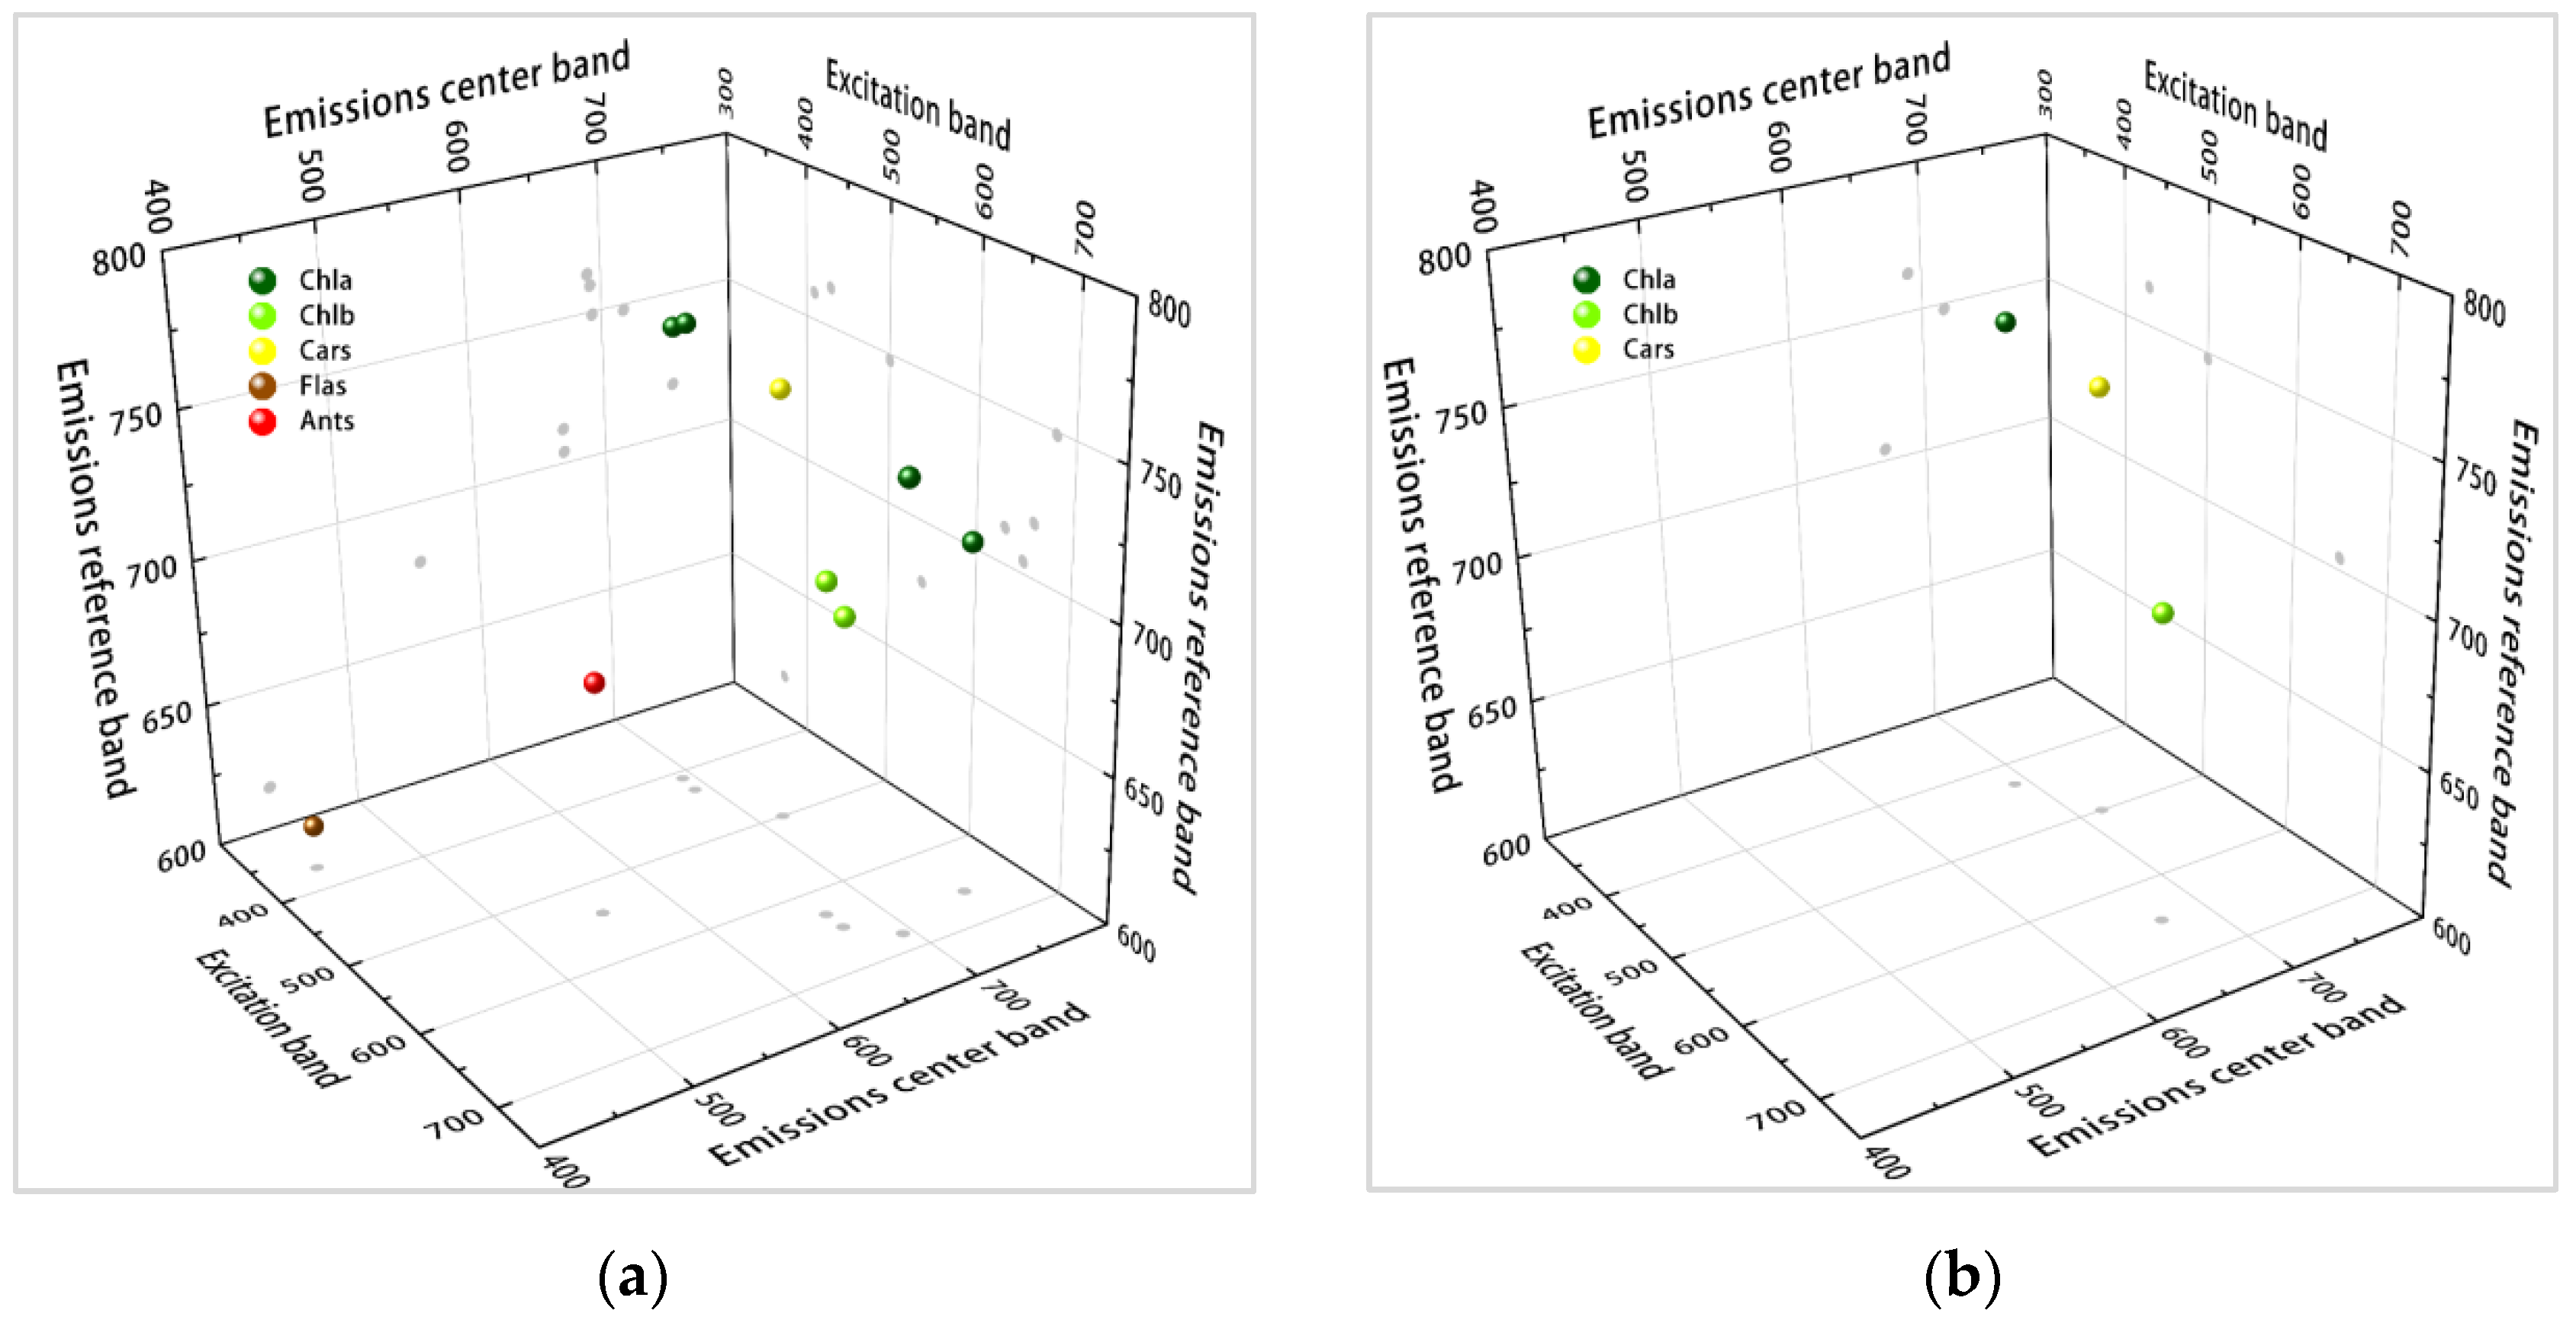
4.2. The 3-D Relationship between the Excitation Band of Excitation Fluorescence and the Central and Reference Bands of Emission Fluorescence in the New 3-D FSI

New 3-D FSIs for the content inversion of photosynthetic and photo-protective pigments in leaves were built in this study, simultaneously considering the excitation band of leaf fluorescence and the central and reference bands of fluorescence emission. The central and reference fluorescence bands of these 3-D FSIs for leaf Chla, Chlb, Cars, Flas, and Ants content inversion were selected based on the sensitivity analysis at the corresponding excitation band of the photosynthetic and photo-protective pigments of leaves from Table 3. These selected central and reference bands are shown in Figure 6. Except for Flas, the central band distribution of 3-D FSIs of all other leaf pigments was closer to the fluorescence emission peak position (680 nm or 740 nm) than those of the corresponding reference bands, which follows the principle that the spectral index can enhance the spectral information of the central band and reduce other forms of interference information [68]. Green leaves had two obvious fluorescence emission peaks, which were located at 680 nm and 740 nm [61], and the distribution characteristics of the central and reference bands of the selected 3-D FSIs could have been caused by the dominant role of green leaf samples in the LOPEX_ZJU dataset (Table 1).
There are two methods for the spectral remote sensing of plant leaves’ biochemical components: direct and indirect detection. The direct detection of biochemical components is a method that utilizes the spectral reflection or fluorescence emission characteristics, and indirect detection is a method that utilizes the high correlation between one substance and another to indirectly detect the characteristics of the reflection spectrum or fluorescence emissions of the biochemical components [69]. In Figure 6, the central bands of the 3-D FSIs of Chla and Chlb are located near the 680 nm and 740 nm emission peaks, which belong to the fluorescence emission characteristics of total chlorophyll, including in Chla and Chlb; this was a direct detection. However, the central bands of Cars and Ants were also located near the 740 nm and 680 nm fluorescence peaks of chlorophyll, respectively. This was an indirect detection. Although there were definite excitation bands of the 3-D FSIs of Ants and Cars, meaning Ants and Cars should have their own fluorescence emission central band, in fact, Cars and Ants of the 3-D FSIs were still in the central band of chlorophyll fluorescence emission. This shows that (1) there was a high relationship between Cars or Ants and total chlorophyll content, and these pigment contents were indirectly inversed, or (2) there were characteristics of the re-absorption of the emission fluorescence of Cars or Ants by chlorophyll. Thus, a separation is needed between multiple pigment emission fluorescence based on the special leaf sample, for example, mutant rice leaves (only containing Chla, not Chlb), to obtain the pigment fluorescence emission spectra of single leaves (including in Chla, Chlb, Cars, Flas, and Ants).
The modeling and validation of these 3-D FSIs were performed based on the evaluation metrics and the T-test. The encouraging and optimum 3-D FSIs for the photosynthetic and photo-protective pigment content inversion of leaves are shown in Figure 7a,b, respectively. Except for Ants, the FRI and FNI types for 3-D FSIs (see Table 10) fit the inversion of the leaf pigment content via 3-D fluorescence spectra. This was consistent with the ratio index (RI) and normalization vegetation index (NDVI), which were used for the extraction of reflection and spectral information [70]. In the optimum 3-D FSIs, the central band from Chla was located near 680 nm (see Figure 7b); this result is consistent with the report by Porcar [24], namely, that of a dominant fluorescence emission peak (in 680 nm) and a weaker fluorescence emission peak (at 740 nm). The spectral characteristics of the two dominant peaks’ fluorescence of total chlorophyll are well known, and the central band of Chlb should be located near 740 nm; in fact, the central band from Chlb is still near 680 nm (see Figure 7b). This was the cause of the high correlation between Chla and Chlb contents in the LOPEX_ZJU dataset, and Chlb did not have obvious fluorescence emission characteristics near 740 nm compared with near 680 nm. More studies are needed to explain the causes of these phenomena. For example, the fluorescence emission spectra of Chla and Chlb in in vivo leaves were separated.

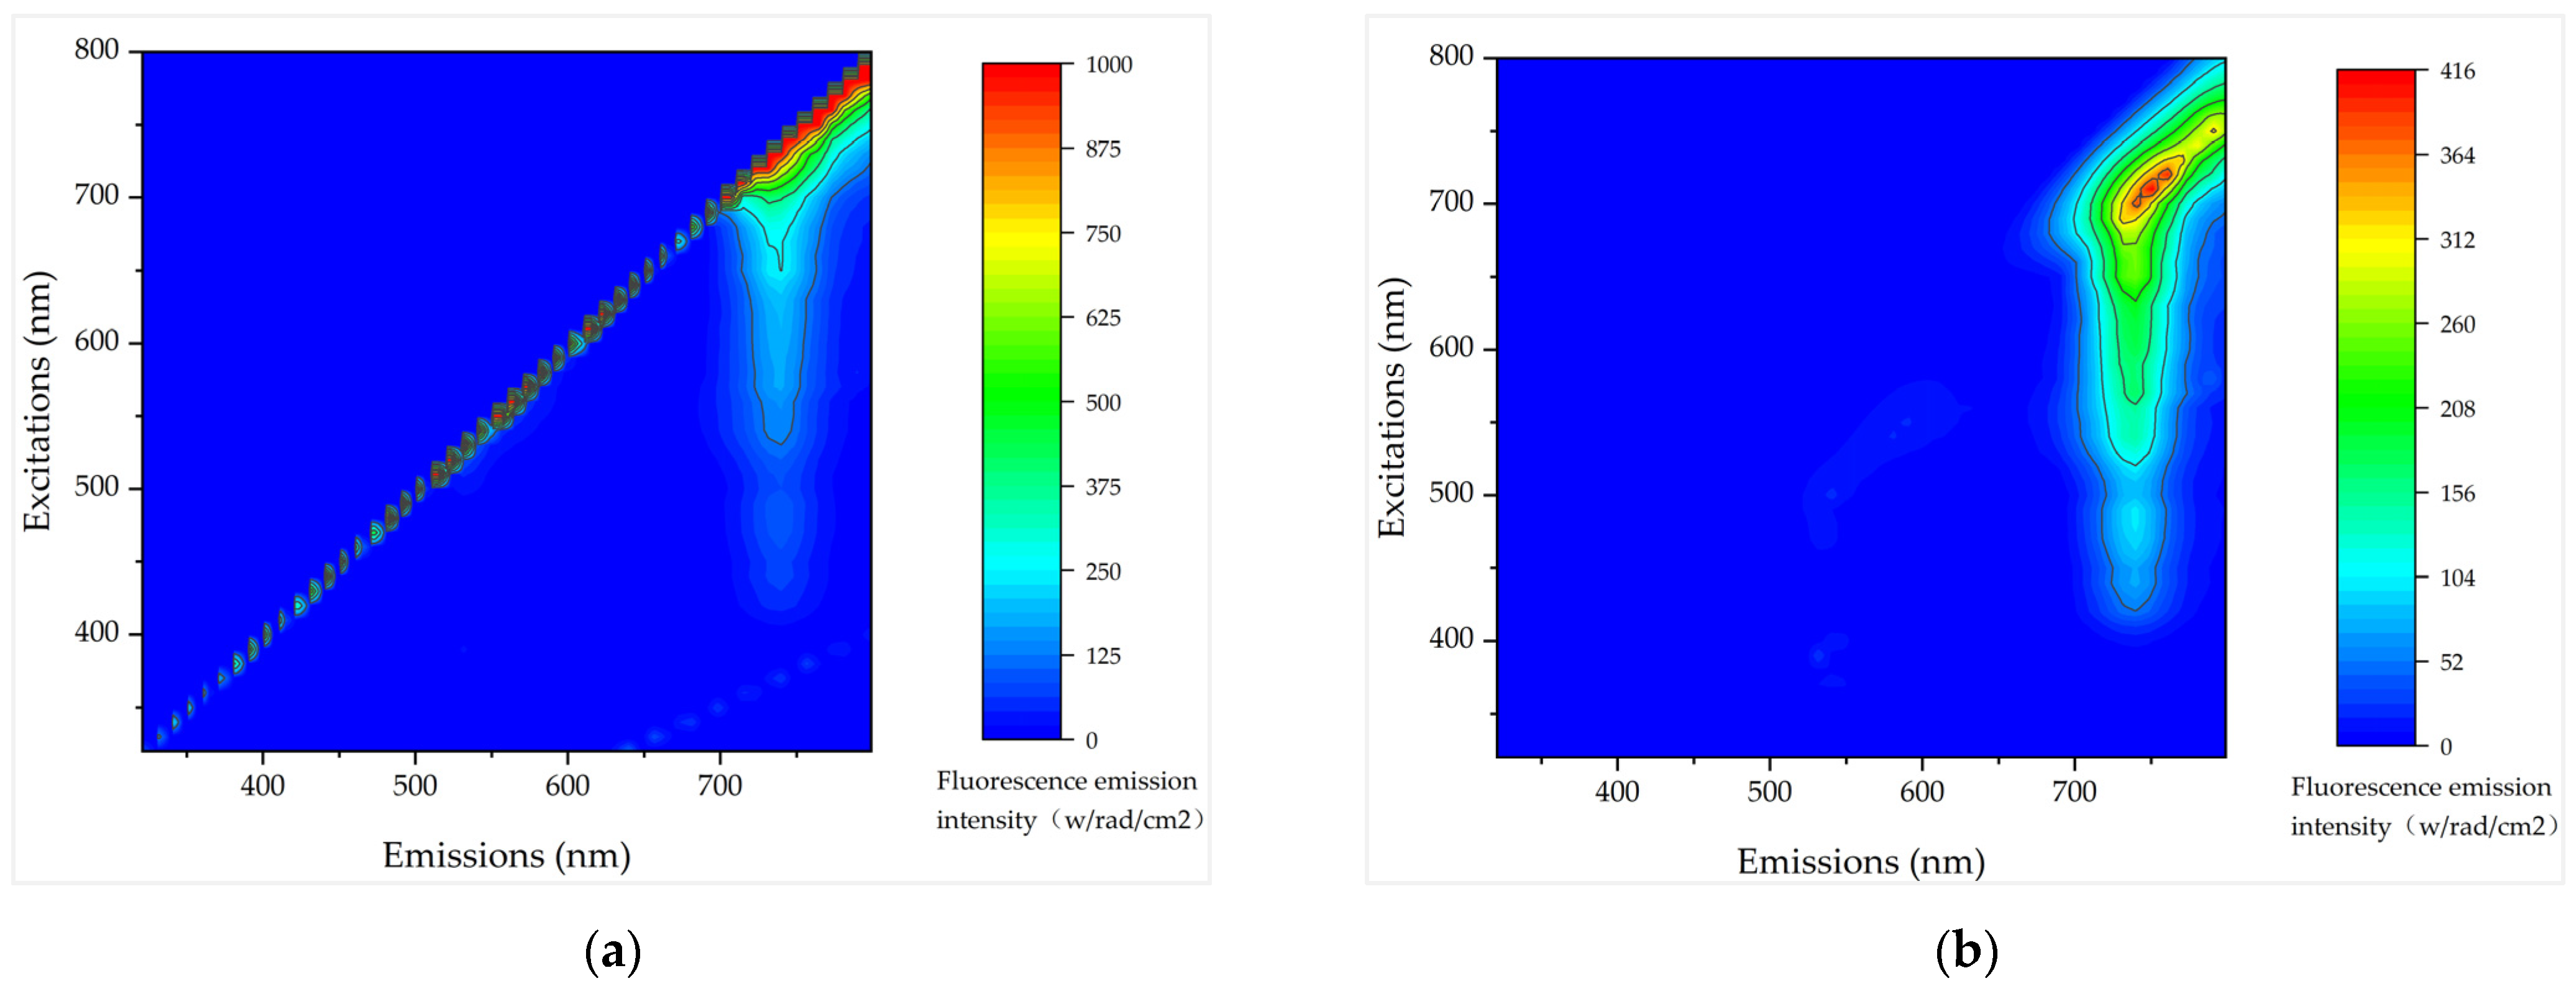
4.3. Fluorescent Oversaturation Characteristics of High Chlorophyll Content

In the high pigment content leaf, chlorophyll fluorescence had been shown to be partially reabsorbed by the chlorophyll molecule, and chlorophyll fluorescence yield decreased sharply with the increase of total chlorophyll content regardless of the type of artificial light source or solar light source. So, in the modeling and validation of 3-D FSIs for the multiple pigment content inversion of leaves, the leaf samples from the LOPEX_ZJU dataset (60 leaf samples) that we used were 40 and 18, respectively. The pigment content of the two leaf samples that were not employed had high contents: their Chla contents were 94.53 μg/cm2 and 78.35 μg/cm2, respectively; Chlb contents were 47.49 and 35.61 μg/cm2, respectively; and Cars contents were 44.55 and 38.70 μg/cm2, respectively.
The two leaf samples with high pigment content were used to evaluate the pigment inversion ability in the optimum 3-D FSIS. The evaluation metrics were obviously decreased, as shown in Figure 8. This could be because (1) the high chlorophyll content produced an oversaturation characteristic of the leaf spectrum [71] or some chlorophyll molecules were not excited, or (2) these not-excited chlorophyll molecules would not participate in the chlorophyll fluorescence emission and would even re-absorb the emission fluorescence of other pigments in the range of 580–670 nm. Thus, we further studied the adaptation range of the model of 3-D FSIs for the leaf pigment content inversion via the 3-D fluorescence spectrum of leaves.

5. Conclusions

The 3-D fluorescence spectrum of leaves combined the spectral characteristics of the pigment excitation band (pigment absorption band) and the emission band and provided rich information on fluorescence characteristics. To make full use of the information from each band, this paper applied the central and reference bands of the vegetation index to the 3-D fluorescence spectrum. New 3-D FSIs for the photosynthetic and photo-protective pigment content inversion of leaves were built. A more complete dataset of optical property experiments on leaves (LOPEX_ZJU), including the reflectance and transmittance spectra of leaves, the 3-D fluorescence spectra of leaves, the net photosynthetic rate, and leaf photosynthetic and photo-protective pigment content of leaves, was used for the band sensitivity analysis, modeling, and validation of the 3-D FSIs for the multiple pigment content inversion of leaves. The results showed the following:
(1) The performances of the 3-D FSIs for the content inversion of photosynthetic pigments (including chlorophyll a, chlorophyll b, and carotenoids) were much better than those for photo-protective pigments (including anthocyanins and flavonoids) based on the 3-D fluorescence spectra of these plant leaves.
(2) The 3-D fluorescence normalization index (FNI (F430,690 − F430,763)/(F430,690 + Fem,763)) for the chlorophyll a inversion model had a high accuracy, the RMSE was 2.96 μg/cm2, and the 3-D fluorescence reciprocal difference index (FRI (F650,704/F650,668) for the chlorophyll b model had an encouraging RMSE (2.01 μg/cm2). The RMSE of the 3-D fluorescence ratio index (FRI (F500,748/F500,717)) for carotenoids inversion was 3.77 μg/cm2.
(3) Only FRI (Fem,615/Fem,438) was selected for the modeling and validation evaluation of the leaf Flas content inversion, but the evaluation metrics were not good, with an RMSE of 151.13 μg/cm2. Although Ants had a 3-D FSI (FRDI (1/F540,679 − 1/F540,557)), showing that its evaluation metrics had an RMSE (2.8 μg/cm2) of 0.05 or higher, the validating evaluation metric VC (98.3577%) was not encouraging.
Our research is the first to present the photosynthetic and photo-protective pigment content inversion of leaves using 3-D FSIs via the 3-D fluorescence spectra of leaves. The results provided a potential capability for the nondestructive and efficient detection method that can determine the contents of chlorophyll a, b, and carotenoids in plant leaves, providing a new method for detecting plant information. Follow-up studies should be conducted to establish more accurate and stable models, considering the separation of the fluorescence emission spectra of single leaf pigments, the oversaturation characteristics of high pigment content, and the data collection of special leaf samples. In addition, this method can be extended to multiple-channel fluorescence image monitoring technology according to the channels and bandwidths determined by the ideal 3-D FSIs and can then be low-cost popularized and applied in the estimation of plant growth status at the canopy or larger scale.

Author Contributions

Conceptualization, Y.Z. and S.T.; methodology, Y.Z. and S.T; software, J.W.; validation, R.Z., W.W. and Y.H.; formal analysis, X.W.; investigation, W.S.; resources, D.L.; data curation, Y.X.; writing—original draft preparation, S.T.; writing—review and editing, Y.Z.; visualization, F.W.; supervision, Y.Z.; project administration, Y.Z.; funding acquisition, Y.Z. All authors have read and agreed to the published version of the manuscript.

Funding

This research was funded by the Jinhua Science and Technology Plan Project, Zhejiang Province (2022-2-010), the Natural Science Foundation of Zhejiang Province Exploration Project (LY20D010004), the National Key R&D Program of China (2022YFD2000100), and the National Natural Science Foundation of China (42071420).

Data Availability Statement

The original contributions presented in the study are included in the article, further inquiries can be directed to the corresponding author.

Acknowledgments

We acknowledge the contribution of Zongtai He and Lisong Jin for the collection of 3-D Fluorescence Spectra and associated support.

Conflicts of Interest

The authors declare no conflicts of interest. The funders had no role in the design of the study; in the collection, analyses, or interpretation of data; in the writing of the manuscript; or in the decision to publish the results.

Appendix A

The results on band sensitivity analysis of 3-D fluorescence spectral indices for leaf multiple pigment content inversion.
Figure A1. The distributions of the determination coefficients R2 between Chla content and the four kinds of 3-D FSIs composed of any two bands, or the fluorescence intensity of single band under the range of 410 nm–430 nm and 660 nm–680 nm excitation. (a-1a-5) is for the excitation in 410 nm, (b-1b-5) in 420 nm, (c-1c-5) in 430 nm, (d-1d-5) in 660 nm, (e-1e-5) in 670 nm, and (f-1f-5) in 680 nm.
Remotesensing 16 01885 g0a1
Figure A2. The distributions of the determination coefficients R2 between Chlb content and the four kinds of 3-D FSIs, or the single band fluorescence intensity under the range of 450 nm–480 nm and 630 nm–650 nm excitation. (a-1a-5) is for the excitation in 450 nm, (b-1b-5) in 460 nm, (c-1c-5) in 470 nm, (d-1d-5) in 480 nm, (e-1e-5) in 630 nm, (f-1f-5) in 640 nm and (g-1g-5) in 650 nm.
Remotesensing 16 01885 g0a2
Figure A3. The distributions of the determination coefficients R2 for Cars, (a-1a-5) is for the excitation in 490 nm, (b-1b-5) in 500 nm, and (c-1c-5) in 510 nm.
Remotesensing 16 01885 g0a3
Figure A4. The distributions of the determination coefficients R2 for Flas, (a-1a-5) is for the excitation in 350 nm, (b-1b-5) in 360 nm, and (c-1c-5) in 370 nm.
Remotesensing 16 01885 g0a4
Figure A5. The distributions of the determination coefficients R2 for Ants, (a-1a-5) is for the excitation in 350 nm, (b-1b-5) in 360 nm, (c-1c-5) in 360 nm, (d-1d-5) in 360 nm, and (e-1e-5) in 370 nm.
Remotesensing 16 01885 g0a5

Appendix B

The results on Modeling and Validating of leaf multiple pigment content inversion model from 3-D FSIs. “N/A” stands for the no-encouraging 3-D FSI in the corresponding excitation band for modeling of leaf pigment content inversion
Figure A6. Modeling of leaf multiple pigment content inversion model from 3-D FSIs. (af) is the encouraging 3-D FSIs for modeling of Chla at the six excitation bands (410 nm–430 nm, 660 nm–680 nm), respectively; (a-1g-1) for modeling of Chlb at the seven bands(450 nm–480 nm, 630 nm–660 nm); (a-2c-2) for Cars at the three and (490 nm–510 nm); (a-3c-3) for Flas at the three bands (350 nm–370 nm); (a-4e-4) for Ants at the three bands(520 nm–560 nm).
Remotesensing 16 01885 g0a6
Figure A7. Validating of leaf multiple pigment content inversion model from 3-D FSIs. (af) is the encouraging 3-D FSIs for modeling of Chla at the six excitation bands (410 nm–430 nm, 660 nm–680 nm), respectively; (a-1g-1) for modeling of Chlb at the seven bands(450 nm–480 nm, 630 nm–660 nm); (a-2c-2) for Cars at the three and (490 nm–510 nm); (a-3c-3) for Flas at the three bands (350 nm–370 nm); (a-4e-4) for Ants at the three bands (520 nm–560 nm).
Remotesensing 16 01885 g0a7

References

  1. Emerson, R.; Arnold, W. The photochemical reaction in photosynthesis. J. Gen. Physiol. 1932, 16, 191–205. [Google Scholar] [CrossRef] [PubMed]
  2. Wen, G.; Zhu, W. The extraction and exploitation of natural pigment. J. Henan Univ. Ence Technol. 2003, 23, 68–74. [Google Scholar]
  3. Nishio, J.N. Why are higher plants green? Evolution of the higher plant photosynthetic pigment complement. Plant Cell Environ. 2010, 23, 539–548. [Google Scholar] [CrossRef]
  4. Michel, K.P.; Pistorius, E.K. Adaptation of the photosynthetic electron transport chain in cyanobacteria to iron deficiency: The function of IdiA and IsiA. Physiol. Plant 2010, 120, 36–50. [Google Scholar] [CrossRef] [PubMed]
  5. Van Der Tol, C.; Verhoef, W.; Rosema, A. A model for chlorophyll fluorescence and photosynthesis at leaf scale. Agric. For. Meteorol. 2009, 149, 96–105. [Google Scholar] [CrossRef]
  6. Zhang, M. Relationship Between Soluble Protein, Chlorophyll and ATP in Drought-Resistant Sweet Potato Under Water Stress. Agric. Sci. China 2002, 1, 1329–1333. [Google Scholar]
  7. Verhoeven, A.S.; Demmig-Adams, B.; Adams III, W.W. Enhanced Employment of the Xanthophyll Cycle and Thermal Energy Dissipation in Spinach Exposed to High Light and N Stress. Plant Physiol. 1997, 113, 817–824. [Google Scholar] [CrossRef]
  8. Tattini, M.; Landi, M.; Brunetti, C.; Giordano, C.; Remorini, D.; Gould, K.S.; Guidi, L. Epidermal coumaroyl anthocyanins protect sweet basil against excess light stress: Multiple consequences of light attenuation. Physiol. Plant. 2014, 152, 585–598. [Google Scholar] [CrossRef]
  9. He, D.; Singh, S.K.; Peng, L.; Kaushal, R.; Vílchez, J.I.; Shao, C.; Wu, X.; Zheng, S.; Morcillo, R.J.L.; Paré, P.W.; et al. Correction to: Flavonoid-attracted Aeromonas sp from the Arabidopsis root microbiome enhances plant dehydration resistance. ISME J. 2022, 16, 2622–2632. [Google Scholar] [CrossRef]
  10. Blackburn, G.A.; Steele, C.M. Towards the Remote Sensing of Matorral Vegetation Physiology: Relationships between Spectral Reflectance, Pigment, and Biophysical Characteristics of Semiarid Bushland Canopies. Remote Sens. Environ. 1999, 70, 278–292. [Google Scholar] [CrossRef]
  11. Kim, H.; Kim, W.; Kim, S.D. Damage Assessment of Rice Crop after Toluene Exposure Based on the Vegetation Index (VI) and UAV Multispectral Imagery. Remote Sens. 2020, 13, 25. [Google Scholar] [CrossRef]
  12. Zhang, Z.; Yang, P.; Kattawar, G.; Huang, H.-L.A.; Greenwald, T.; Li, J.; Baum, B.A.; Zhou, D.K.; Hu, Y. A fast infrared radiative transfer model based on the adding–doubling method for hyperspectral remote-sensing applications. J. Quant. Spectrosc. Radiat. Transf. 2007, 105, 243–263. [Google Scholar] [CrossRef]
  13. Mempel, T.R.; Moser, C.; Hutter, J.; Kuebler, W.M.; Krombach, F. Visualization of Leukocyte Transendothelial and Interstitial Migration Using Reflected Light Oblique Transillumination in Intravital Video Microscopy. J. Vasc. Res. 2003, 40, 435–441. [Google Scholar] [CrossRef] [PubMed]
  14. Zhu, L.; Chen, Z.; Wang, J.; Ding, J.; Yu, Y.; Li, J.; Xiao, N.; Jiang, L.; Zheng, Y.; Rimmington, G.M. Monitoring plant response to phenanthrene using the red edge of canopy hyperspectral reflectance. Mar. Pollut. Bull. 2014, 86, 332–341. [Google Scholar] [CrossRef] [PubMed]
  15. Volpati, D.; Spada, E.R.; Plá Cid, C.C.; Sartorelli, M.L.; Aroca, R.F.; Constantino, C.J.L. Exploring copper nanostructures as highly uniform and reproducible substrates for plasmon-enhanced fluorescence. Analyst 2015, 140, 476–482. [Google Scholar] [CrossRef] [PubMed]
  16. Sang, M.; Li, A.; Xu, N.; Liu, T.; Duan, S. Characteristics of fluorescence emission spectrum at 77K of diatom and chrysophyta in Chromaphytae. Chin. J. Ecol. 2006, 25, 1033–1037. [Google Scholar] [CrossRef]
  17. Chen, D.; Gao, P.; Wu, X.; Gao, Y.; Wen, G.; Wang, Y.; Gao, R.; Zhang, R. Chloroplast Ultrastructure and Emission Fluorescence Spectrum Characteristics for Stems of Phyllostachys pubescens. Chin. Bull. Bot. 2013, 48, 635–642. [Google Scholar] [CrossRef]
  18. Cheng, P.; Wang, S.; Zhu, Y.; Cui, C.; Pan, J. Application of Three-Dimensional Fluorescence Spectroscopy in Smart Agriculture—Detection of Oil Pollutants in Water. Int. J. Pattern Recognit. Artif. Intell. 2023, 37, 23550042. [Google Scholar] [CrossRef]
  19. Schreiber, U.; Schliwa, U.; Bilger, W. Continuous recording of photochemical and non-photochemical chlorophyll fluorescence quenching with a new type of modulation fluorometer. Photosynth. Res. 1986, 10, 51–62. [Google Scholar] [CrossRef]
  20. Yang, Y.; Chen, B.; Cai, G.; Shao, M.; Tian, P. Study on the Relationship between Fluorescence Spectra and Chlorophyll Content of fresh tea Leaves. Jiangsu Agric. Sci. 2012, 40, 270–272. [Google Scholar] [CrossRef]
  21. Ndao, A.S.; Konté, A.; Biaye, M.; Faye, M.E.; Faye, N.A.B.; Wagué, A. Analysis of Chlorophyll Fluorescence Spectra in Some Tropical Plants. J. Fluoresc. 2005, 15, 123–129. [Google Scholar] [CrossRef]
  22. Swarin, S.J.; Lipari, F. Determination of Formaldehyde and Other Aldehydes by High Performance Liquid Chromatography with Fluorescence Detection. J. Liq. Chromatogr. 2015, 6, 425–444. [Google Scholar] [CrossRef]
  23. Baker, N.R. Chlorophyll fluorescence: A probe of photosynthesis in vivo. Annu. Rev. Plant Biol. 2008, 59, 89–113. [Google Scholar] [CrossRef]
  24. Porcar-Castell, A.; Tyystjärvi, E.; Atherton, J.; van der Tol, C.; Flexas, J.; Pfündel, E.E.; Moreno, J.; Frankenberg, C.; Berry, J.A. Linking chlorophyll a fluorescence to photosynthesis for remote sensing applications: Mechanisms and challenges. J. Exp. Bot. 2014, 65, 4065–4095. [Google Scholar] [CrossRef]
  25. Tubuxin, B.; Rahimzadeh-Bajgiran, P.; Ginnan, Y.; Hosoi, F.; Omasa, K. Estimating chlorophyll content and photochemical yield of photosystem II (ΦPSII) using solar-induced chlorophyll fluorescence measurements at different growing stages of attached leaves. J. Exp. Bot. 2015, 66, 5595–5603. [Google Scholar] [CrossRef]
  26. Yang, H.; Yu, H.; Zhang, L.; Sui, Y. Detecting of Chlorophyll Content of Cucumber Leaves Based on Laser-induced Fluorescence Spectrum Analysis Technique. Trans. Chin. Soc. Agric. Mach. 2009, 40, 169–172. [Google Scholar]
  27. Jiang, D.; Li, J.; Xu, J.; Zhang, L. Three-Dimensional Fluorescence Spectra of Dissolved Organic Matter in a Eutrophic River on Chongming Island. J. Hydroecol. 2019, 40, 33–40. [Google Scholar] [CrossRef]
  28. Suarez-Fernandez, M.; Marhuenda-Egea, F.C.; Lopez-Moya, F.; Arnao, M.B.; Lopez-Llorca, L.V. Chitosan induces plant hormones and defences in tomato root exudates. Front. Plant Sci. 2020, 11, 572087. [Google Scholar] [CrossRef]
  29. Zhang, Q.; Lei, S.; Wang, X.; Wang, L.; Zhu, C. Discrimination of phytoplankton classes using characteristic spectra of 3D fluorescence spectra. Spectrochim. Acta Part A Mol. Biomol. Spectrosc. 2006, 63, 361–369. [Google Scholar] [CrossRef]
  30. Yi, Y.; Zhou, Y.; Bridgeman, J.; Kong, W.; Yang, C.; Mao, H.; Wang, Z. Determination of Organic Pollutants in Municipal Sewage by Three-Dimensional Fluorescence Spectroscopy. Adm. Tech. Environ. Monit. 2017, 29, 37–39. [Google Scholar] [CrossRef]
  31. Zhou, X.; Zhao, Y. Molecular Spectra of Dissolved Organic Matter Fractions from Corn Straw. J. Hebei Agric. Sci. 2023, 27, 66–74. [Google Scholar]
  32. Wang, J.; Liu, B.; Du, H.; Liang, Z.; Zhao, Y.; Zhao, Y.; Zhang, M.; Wang, L. New Method for Identification of Dalbergia Cochinchinensis Pierre and Dalbergia Oliveri Prain by Fluorescence Spectroscopy. Spectrosc. Spectr. Anal. 2019, 39, 2182–2189. [Google Scholar]
  33. Gonsamo, A.; Chen, J.M. Spectral Response Function Comparability Among 21 Satellite Sensors for Vegetation Monitoring. IEEE Trans. Geosci. Remote Sens. 2013, 51, 1319–1335. [Google Scholar] [CrossRef]
  34. Wang, F.; Huang, J.; Wang, X.; Cheng, L.; Tang, Y. Effects of Band Position and Bandwidth on NDVI Measurements of Rice at Different Growth Stages. J. Remote Sens. 2008, 12, 626–632. [Google Scholar]
  35. Bartold, M.; Kluczek, M. Estimating of chlorophyll fluorescence parameter Fv/Fm for plant stress detection at peatlands under Ramsar Convention with Sentinel-2 satellite imagery. Ecol. Inform. 2024, 81, 102603. [Google Scholar] [CrossRef]
  36. Zhao, F.; Guo, Y.; Huang, Y.; Reddy, K.N.; Zhao, Y.; Molin, W.T. Detection of the onset of glyphosate-induced soybean plant injury through chlorophyll fluorescence signal extraction and measurement. J. Appl. Remote Sens. 2015, 9, 097098. [Google Scholar] [CrossRef]
  37. Juskowiak, B. Nucleic acid-based fluorescent probes and their analytical potential. Anal. Bioanal. Chem. 2011, 399, 3157–3176. [Google Scholar] [CrossRef]
  38. Zhang, Y.; Wang, C.; Huang, J.; Wang, F.; Huang, R.; Lin, H.; Chen, F.; Wu, K. Exploring the Optical Properties of Leaf Photosynthetic and Photo-Protective Pigments In Vivo Based on the Separation of Spectral Overlapping. Remote Sens. 2020, 12, 3615. [Google Scholar] [CrossRef]
  39. Zhang, Y.; Wei, C.; Zhang, K.; Huang, J.; Wang, X. FOLIUM Model and Multi Pigment Leaf Spectral Simulation Method. CN Patent 201610629796.6, 4 January 2017. [Google Scholar]
  40. Zhang, Y. Hyperspectral Quantitative Remote Sensing Inversion Model and Regieme of Multiple Pigments at Leaf Scale Based on PROSPECT-PLUS Model. Ph.D Thesis, Zhejiang University, Hangzhou, China, 2015. [Google Scholar]
  41. Hu, J.; Tian, Q.; Lu, X. Relationship between changes of the pigments content and leaf color changing in Liquidambar formosana. J. North West A F Univ. 2007, 35, 219–223. [Google Scholar] [CrossRef]
  42. Jiang, T.; Wang, Y.; Wang, C.; Zheng, W. Uncertainty evaluation of the arsenic in the bush twigs and leaves by atomic fluorescence spectrometry. Strait Pharm. J. 2012, 24, 46–48. [Google Scholar] [CrossRef]
  43. Guan, Y.; Lin, B.; Ling, B. Interaction effects of light density and nitrogen on maize leaf pigments, chlorophyll fluorescence and energy transition. Plant Nutr. Fertil. Sci. 2000, 6, 152–158. [Google Scholar] [CrossRef]
  44. Richard Burns, G. Photosynthesis and the Absorption Spectra of Plant Pigments. II. Am. J. Bot. 1938, 24, 257–265. [Google Scholar] [CrossRef]
  45. Peters, R.D.; Noble, S.D. Spectrographic measurement of plant pigments from 300 to 800 nm. Remote Sens. Environ. 2014, 148, 119–123. [Google Scholar] [CrossRef]
  46. Zhang, R. Extraction of Fluorescence Characteristics of Photosynthetic Pigments in Plant Leaves and Development of Portable Net Photosynthetic Rate Detection Instrument. Ph.D Thesis, Hangzhou Dianzi University, Hangzhou, China, 2023. [Google Scholar]
  47. He, Y.; Liu, S.; Liu, Q.; Liu, Z.; Hu, X. Absorption, fluorescence and resonance Rayleigh scattering spectral characteristics of interaction of gold nanoparticle with safranine T. Sci. China 2005, 48, 216–226. [Google Scholar] [CrossRef]
  48. Xu, X.; Wang, J.; Zhu, J.; Zhang, C.; Zhang, G. Analysis of fluorescent and raman spectra with spatial resolution (depth analysis) method. J. Infrared Millim. Waves 2001, 20, 169–173. [Google Scholar] [CrossRef]
  49. Zavřel, T.; Sinetova, M.A.; Červený, J. Measurement of Chlorophyll a and Carotenoids Concentration in Cyanobacteria. Bio-Protocol 2015, 5, 1–5. [Google Scholar] [CrossRef]
  50. Liu, F.; Chen, Q.; Chen, J. A Drying Method for Guava Leaves. CN Patent 201611150134.7, 26 April 2017. [Google Scholar]
  51. Pekal, A.; Pyrzynska, K. Evaluation of Aluminium Complexation Reaction for Flavonoid Content Assay. Food Anal. Methods 2014, 7, 1776–1782. [Google Scholar] [CrossRef]
  52. Lang, M.; Siffel, P.; Braunová, Z.; Lichtenthaler, H.K. Investigations of the Blue-green Fluorescence Emission of Plant Leaves. Bot. Acta 1992, 105, 435–440. [Google Scholar] [CrossRef]
  53. Li, M.M.; Chen, Y.T.; Ruan, J.C.; Wang, W.J.; Chen, J.G.; Zhang, Q.F. Structure-activity relationship of dietary flavonoids on pancreatic lipase. Curr. Res. Food Sci. 2023, 6, 100424. [Google Scholar] [CrossRef]
  54. Udenfriend, S.; Zaltzman, P. Fluorescence characteristics of purines, pyrimidines, and their derivatives: Measurement of guanine in nucleic acid hydrolyzates. Anal. Biochem. 1962, 3, 49–59. [Google Scholar] [CrossRef]
  55. Yin, H.; Chi, H.; Shang, Z.; Qaitoon, A.; Yu, J.; Meng, Q.; Zhang, Z.; Jia, H.; Zhang, R. Development of a new water-soluble fluorescence probe for hypochlorous acid detection in drinking water. Food Chem. Mol. Sci. 2021, 2, 100027. [Google Scholar] [CrossRef]
  56. Xu, P.; Chen, B.; Zhang, J.; Xue, L.; Zhu, L.; Qiu, B. Greedy compressive sensing and reconstruction of vegetation spectra for plant physiological and biochemical parameters inversion. Comput. Electron. Agric. 2018, 145, 379–388. [Google Scholar] [CrossRef]
  57. Jensen, J.R. Remote Sensing of the Environment: An Earth Resource Perspective, 2nd ed.; China Science PRESS: Beijing, China, 2000; pp. 355–408. [Google Scholar]
  58. Feret, J.-B.; François, C.; Asner, G.P.; Gitelson, A.A.; Martin, R.E.; Bidel, L.P.R.; Ustin, S.L.; le Maire, G.; Jacquemoud, S. PROSPECT-4 and 5: Advances in the leaf optical properties model separating photosynthetic pigments. Remote Sens. Environ. 2008, 112, 3030–3043. [Google Scholar] [CrossRef]
  59. Gitelson, A.A.; Buschmann, C.; Lichtenthaler, H.K. Leaf chlorophyll fluorescence corrected for re-absorption by means of absorption and reflectance measurements. J. Plant Physiol. 1998, 152, 283–296. [Google Scholar] [CrossRef]
  60. Moore, D.S.; Craig, B.A.; McCabe, G.P. Introduction to the Practice of Statistics, 7th ed.; W. H. Freeman: New York, NY, USA, 2012; p. 401. [Google Scholar]
  61. Zhang, Y.; Zhao, C.; Liu, L.; Wang, J.; Ma, Z.; Wang, R. Preliminary study on the effects of water stress on maize leaf physiological status through passive chlorophyll fluorescence detection. Trans. Chin. Soc. Agric. Eng. 2006, 22, 39–43. [Google Scholar] [CrossRef]
  62. Cheng, T.; Song, R.; Li, D.; Zhou, K.; Zheng, H.; Yao, X.; Tian, Y.; Cao, W.; Zhu, Y. Spectroscopic Estimation of Biomass in Canopy Components of Paddy Rice Using Dry Matter and Chlorophyll Indices. Remote Sens. 2017, 9, 319. [Google Scholar] [CrossRef]
  63. Barnhart, I.; Rosso, L.H.M.; Secchi, M.A.; Ciampitti, I.A. Evaluating Sorghum Senescence Patterns Using Small Unmanned Aerial Vehicles and Multispectral Imaging. Kans. Agric. Exp. Stn. Res. Rep. 2019, 5. [Google Scholar] [CrossRef]
  64. Grishina, A.; Sherstneva, O.; Zhavoronkova, A.; Ageyeva, M.; Zdobnova, T.; Lysov, M.; Brilkina, A.; Vodeneev, V. Comparison of the Efficiency of Hyperspectral and Pulse Amplitude Modulation Imaging Methods in Pre-Symptomatic Virus Detection in Tobacco Plants. Plants 2023, 12, 3831. [Google Scholar] [CrossRef]
  65. Bojović, B.; Stojanović, J. Chlorophyll and carotenoid content in wheat cultivars as a function of mineral nutrition. Arch. Biol. Sci. 2005, 57, 283–290. [Google Scholar] [CrossRef]
  66. Deng, S.; Chen, D.; Huang, B.; Luo, Z.; Fan, H. Study on Fluorescence Photometric Determination of Flavonoids. Chem. World 1999, 40, 375–379. [Google Scholar]
  67. Drabent, R.; Pliszka, B.; Olszewska, T. Fluorescence properties of plant anthocyanin pigments. I. Fluorescence of anthocyanins in Brassica oleracea L. extracts. J. Photochem. Photobiol. B Biol. 1999, 50, 53–58. [Google Scholar] [CrossRef]
  68. Deng, S.; Chen, Q. Overview of vegetation spectral characteristics and vegetation indices. In Proceedings of the 17th China Remote Sensing Conference, Hangzhou, China, 27–31 August 2010. [Google Scholar]
  69. Yin, G.; Zhao, N.; Hu, L.; Yu, X.; Shi, C.; Xiao, X.; Li, F.; Duan, J.; Gan, T.; Zhang, Y.; et al. Classified Measurement of Phytoplankton Based on Characteristic Fluorescence of Photosynthetic Pigments. Acta Opt. Sin. 2014, 34, 9. [Google Scholar] [CrossRef]
  70. Yu, L.; Cai, H.; Yao, F.; Zheng, Z.; Wang, J.; Li, Z. Research on the applicability of vegetation index inversion for winter wheat vegetation coverage. Trans. Chin. Soc. Agric. Mach. 2015, 46, 231–249. [Google Scholar] [CrossRef]
  71. Gitelson, A.; Merzlyak, M. Signature Analysis of Leaf Reflectance Spectra: Algorithm Development for Remote Sensing of Chlorophyll. J. Plant Physiol. 1996, 148, 494–500. [Google Scholar] [CrossRef]
Figure 1. Agilent fluorescence spectrometer measurement system. (a) Fluorescence spectrometer, (b) fluorescence spectrum curve excited by single-band light source, (c) 3-D fluorescence spectrum diagram.
Remotesensing 16 01885 g001
Figure 2. Three-dimensional fluorescence of leaves without (a) or with (b) the removal of other scatterings. The multiple pigment contents of leaves were Chla (73.77 μg/cm2), Chlb (35.73 μg/cm2), Cars (36.43 μg/cm2), Ants (6.26 μg/cm2), and Flas (421.37 μg/cm2).
Remotesensing 16 01885 g002
Figure 3. Absorption characteristics of leaves’ photosynthetic and photo-protective pigments. (a) shows the absorption characteristics of Chla, Chlb, Cars, and Ants in vivo leaves [38]; (b) shows the absorption characteristics of Flas in the organic solution [53].
Remotesensing 16 01885 g003
Figure 4. The technical framework of leaf pigment content inversion based on 3-D fluorescence spectra data.
Remotesensing 16 01885 g004
Figure 5. The methodology roadmap of leaf pigment content inversion by 3-D fluorescence spectra data.
Remotesensing 16 01885 g005
Figure 6. The central and reference bands of the selected 3-D FSIs based on the sensitivity analysis. (a) Chla; (b) Chlb; (c) Cars; (d) Flas; and (e) Ants.
Remotesensing 16 01885 g006
Figure 7. The 3-D relationship between the excitation band and central and reference bands of the fluorescence emission of 3-D FSIs for the multiple pigment inversion of leaves via their 3-D fluorescence spectrum. (a) shows the band relationship of 3-D FSIs of leaf photosynthetic and photo-protective pigments; (b) shows optimum band relation of 3-D FSIs of photosynthetic pigments.
Remotesensing 16 01885 g007
Figure 8. The fluorescence supersaturation phenomenon generated by adding two high-pigment content samples to the optimal 3-D FSI for the content inversion of leaves’ photosynthetic pigments. (The red dashed line represents a 1:1 contour line, while the black line represents the model’s linear fitting line) (ac) is for no-adding two high-pigment content samples; (a-1c-1) for adding the two samples; (a,a-1) for Chla and its inversion model from FNI(F430,690 − F430,763)/(F430,690 + F430,763); (b,b-1) for Chlb and its inversion model from FRI (F650,704/F650,668); (c,c-1) Cars and its inversion model from FRI (F500,748/F500,717).
Remotesensing 16 01885 g008
Table 1. Description of leaf samples in the LOPEX_ZJU data from Zhang et al. [39].
Species No.Common NameSpecies NameVegetation Type and FunctionThe Position of Selected Leaf in Vegetation CanopyLeaf SampleLeaf Life Cycle StageSPAD Range
1 Red RobinPhotiniaxfraseriEvergreen shrub for soil improvement The 3–5th leaf in the top of new shoots 2/5 (color/green)Y, M22.3–60.5
2 Japan Arrow woodViburnum awabukiK.KochEvergreen shrub for garden ornamentThe 4–6th leaf in the top of new shoots0/5 (color/green)Y, M32.6–70.2
3 GinkgoGinkgo bilobaDeciduous tree for landscape ornamentThe 3rd pair of whorled leaves from the top0/5 (color/green)M, S3.8–41.8
4 Sweet-scented osmanthusOsmanthusFragransEvergreen tree for garden ornamentThe 4–6th leaf in the top of new shoots0/5 (color/green)Y, M15.1–51.5
5 MulberryMorus AlbaDeciduous tree for cash cropThe 2–4th leaf in the top of new shoots0/4 (color/green)Y, M13.7–52.5
6 Moso BambooPhyllostachysheterocycla (Carr.)Evergreen tree for garden ornamentThe 5–7th leaf in the top of new shoots0/4 (color/green)Y, M, S12.3–52.3
7 DecipiensElaeocarpussylvestris (Lour.) PoirDeciduous tree for landscape ornamentThe 4–6th leaf in the top of new shoots3/5 (color/green)M, S1.5–61.0
8 PterostyraxPterostyrax corymbosus Sieb. et ZuccDeciduous tree for garden ornamentMiddle leaflet of 5–7th trifoliate compound leaf from the top0/5 (color/green)Y, M, S4.3–44.0
9 SapindusSapindusmukurossiGaertnDeciduous tree for garden ornamentMiddle leaflet of 3–5th pinnately compound leaves from the top0/5 (color/green)M, S0.0–42.9
10 Sugar MapleAcer saccharum MarshDeciduous tree for landscape ornamentThe 2–4th leaf in the top of new shoots0/6 (color/green)M, S, A0.0–30.3
11 Camphor TreeCinnamomumcamphora (L.) Presl.Evergreen tree for landscape ornamentThe 4–6th leaf in the top of new shoots0/5 (color/green)M, S4.2–34.7
12 Tea TreeCamellia Sinensis (L.)Evergreen shrub for cash cropChoose one from the third pair of leaves from the top0/6 (color/green)Y, M34.1–80.4
Note: Y, M, S, and A represent young leaves, mature leaves, senile leaves, and albino leaves, respectively.
Table 2. Leaf photosynthetic and photo-protective pigments characteristics in the LOPEX_ZJU dataset.
Leaf PigmentMaximumMinimumAverageUnit
Chla94.530.0425.20μg/cm2
Chlb47.490.0512.96μg/cm2
Cars44.550.2413.32μg/cm2
Ants47.220.014.37μg/cm2
Flas1064.4561.07399.73μg/cm2
Cars A44.550.2416.09μg/cm2
Lu17.710.024.76μg/cm2
An1.830.000.37μg/cm2
Ze6.990.021.06μg/cm2
Vi4.100.000.95μg/cm2
Ne7.430.001.85μg/cm2
β-car15.330.024.10μg/cm2
Water content73.8311.6152.34%
Table 3. Selection of the pigment-absorption characteristic band and the excitation wavelength.
PigmentAbsorption Peak NumberRange of Absorption (nm)Excitation Wavelength (nm)
Chlorophyll a1400–434410, 420, 430
2659–699660, 670, 680
Chlorophyll b1442–495450, 460, 470, 480
2639–683630, 640, 650
Carotenoids1447–517490, 500, 510
Anthocyanin1494–594520, 530, 540, 550, 560
Flavonoids1200–285——
2340–380350, 360, 370
Note: —— indicates that this band was not considered in this study.
Table 4. The four kinds of newly built 3-D fluorescence spectral indices for leaf pigment content inversion.  E X λ i  and  E M λ j  stand for the exciting and emitting wavelengths of leaf pigment fluorescence, respectively;  E M λ k  is the emitting wavelength of leaves’ non-pigment interference fluorescence;  F E X λ i , E M λ j  is the pigment fluorescence characteristic at a wavelength of  E M λ k  with an  E X λ i  exciting wavelength;  F ( E X λ i , E M λ k )  is the non-pigment fluorescence at  E M λ j  wavelength with an  E X λ i  exciting wavelength.
Fluorescence Spectral IndexAbbreviationCalculation Formula
Fluorescence difference indexFDI   F E X λ i , E M λ j F ( E X λ i , E M λ k )
Fluorescence ratio indexFRI   F E X λ i , E M λ j / F ( E X λ i , E M λ k )
Fluorescence reciprocal difference indexFRDI   F E X λ i , E M λ j 1 F E X λ i , E M λ k 1
Fluorescence normalization indexFNI   ( F E X λ i , E M λ j F ( E X λ i , E M λ k ) ) / ( F E X λ i , E M λ j + F ( E X λ i , E M λ k ) )
Table 5. The band sensitivity analysis for chlorophyll a (Chla) using the maximum value of the correlation coefficient square C2 from the 3-D FSI and the single-band fluorescence information.
Excitation Wavelength 3-D Fluorescence Spectral IndexSingle Wavelength
Maximum Value of C2 from FRIMaximum Value of C2 from FDIMaximum Value of C2 from FRDIMaximum Value
of C2 from FNI
Maximum Value of C2
Fex,410nm0.8513 ***
(Fem,759/Fem,692)
0.3552
(Fem,607 − Fem,799)
0.5576
(1/Fem,509 − 1/Fem,511)
0.7746 *
((Fem,685 − Fem,777)/(Fem,685 + Fem,777))
0.2623
(Fem,607nm)
Fex,420nm0.8783 **
(Fem,759/Fem,691)
0.5105
(Fem,422 − Fem,740)
0.5661
(1/Fem,693 − 1/Fem,695)
0.7974 *
((Fem,689 − Fem,762)/(Fem,689 + Fem,762))
0.4495
(Fem,422nm)
Fex,430nm0.8816 ***
(Fem,740/Fem,692)
0.5414
(Fem,431 − Fem,740)
0.7076
(1/Fem,692 − 1/Fem,694)
0.8251 ***
((Fem,690 − Fem,763)/(Fem,690 + Fem,763))
0.4700
(Fem,431nm)
Fex,660nm0.8315 **
(Fem,752/Fem,719)
0.6970
(Fem,666 − Fem,748)
0.8119 **
(1/Fem,690 − 1/Fem,765)
0.8346 **
((Fem,718 − Fem,754)/(Fem,718 + Fem,754))
0.5678
(Fem,667nm)
Fex,670nm0.8407 ***
(Fem,748/Fem,691)
0.7306 *
(Fem,728 − Fem,738)
0.8246 ***
(1/Fem,759 − 1/Fem,691)
0.8343 ***
((Fem,722 − Fem,751)/(Fem,722 + Fem,751))
0.5270
(Fem,675nm)
Fex,680nm0.8594 ***
(Fem,749/Fem,693)
0.7505 *
(Fem,725 − Fem,736)
0.8304 **
(1/Fem,748 − 1/Fem,693)
0.8429 ***
((Fem,719 − Fem,759)/(Fem,719 + Fem,759))
0.5287
(Fem,680nm)
Note: *** Significant at the 0.01 level; ** Significant at the 0.05 level; * Significant at the 0.1 level. Significance test on the maximum values of C2 in the same wavelength of the excitation light resource was performed following the report by Moore, David S. [60].
Table 6. The band sensitivity analysis for chlorophyll b (Chlb) based on the maximum value of the correlation coefficient square, C2, from 3-D FSI and single-band fluorescence information.
Excitation Wavelength 3-D Fluorescence Spectral IndexSingle Wavelength
Maximum Value of C2 from FRIMaximum Value of C2 from FDIMaximum Value of C2 from FRDIMaximum Value
of C2 from FNI
Maximum Value of C2
Fex450nm0.8420 ***
(Fem,701/Fem,691)
0.5426
(Fem,603 − Fem,615)
0.7475 **
(1/Fem,687 − 1/Fem,702)
0.8302 ***
((Fem,692 − Fem,690)/(Fem,692 + Fem,690))
0.4006
(Fem,615nm)
Fex,460nm0.8623 ***
(Fem,698/Fem,691)
0.5463
(Fem,622 − Fem,619)
0.7409 **
(1/Fem,686 − 1/Fem,705)
0.8540 ***
((Fem,692 − Fem,690)/(Fem,692 + Fem,690))
0.4096
(Fem,624nm)
Fex,470nm0.8473 ***
(Fem,701/Fem,691)
0.5174
(Fem,628 − Fem,641)
0.7575 **
(1/Fem,694 − 1/Fem,693)
0.8380 **
((Fem,691 − Fem,690)/(Fem,691 + Fem,690))
0.4314
(Fem,640nm)
Fex,480nm0.8408 ***
(Fem,692/Fem,689)
0.4596
(Fem,480 − Fem,749)
0.7537 **
(1/Fem,686 − 1/Fem,707)
0.8298 ***
((Fem,692 − Fem,689)/(Fem,692 + Fem,689))
0.3499
(Fem,607nm)
Fex,630nm0.8510 ***
(Fem,712/Fem,668)
0.5677
(Fem,651 − Fem,645)
0.8563 ***
(1/Fem,731 − 1/Fem,646)
0.8289 ***
((Fem,643 − Fem,639)/(Fem,643 + Fem,639))
0.5513
(Fem,644nm)
Fex,640nm0.8741 ***
(Fem,650/Fem,648)
0.5912
(Fem,650 − Fem,643)
0.8528 **
(1/Fem,733 − 1/Fem,653)
0.8784 ***
((Fem,650 − Fem,648)/(Fem,650 + Fem,648))
0.5872
(Fem,652nm)
Fex,650nm0.8696 ***
(Fem,704/Fem,668)
0.7933 *
(Fem,779 − Fem,659)
0.8135 **
(1/Fem,756 − 1/Fem,683)
0.8649 ***
((Fem,683 − Fem,682)/(Fem,683 + Fem,682))
0.7971
(Fem,659nm)
Note: *** Significant at the 0.01 level; ** Significant at the 0.05 level; * Significant at the 0.1 level. Significance test on the maximum values of R2 in the same wavelength of the excitation light resource was performed.
Table 7. The band sensitivity analysis for carotenoids (Cars) based on the maximum value of correlation coefficient square, C2, from the 3-D FSI and single-band fluorescence information.
Excitation Wavelength 3-D Fluorescence Spectral IndexSingle Wavelength
Maximum Value
of C2 from FRI
Maximum Value of C2 from FDIMaximum Value
of C2 from FRDI
Maximum Value of C2 from FNIMaximum Value
of C2
Fex,490nm0.8122 **
(Fem,749/Fem,709)
0.5029 *
(Fem,743 − Fem,713)
0.5390 *
(1/Fem,696 − 1/Fem,691)
0.7874 *
((Fem,730 − Fem,720)/(Fem,730 + Fem,720))
0.2915
(Fem,607nm)
Fex,500nm0.8302 **
(Fem,748/Fem,717)
0.5339 *
(Fem,737 − Fem,721)
0.6315 *
(1/Fem,565 − 1/Fem,555)
0.8070 **
((Fem,749 − Fem,715)/(Fem,749 + Fem,715))
0.3136
(Fem,607nm)
Fex,510nm0.1237
(Fem,782/Fem,677)
0.0931
(Fem,648 − Fem,647)
0.1237 *
(1/Fem,782 − 1/Fem,677)
0.1169
((Fem,656 − Fem,557)/(Fem,656 + Fem,557))
0.0443
(Fem,574nm)
Note: ** Significant at the 0.05 level; * Significant at the 0.1 level. Significance test on the maximum values of C2 in the same wavelength of the excitation light resource was performed.
Table 8. The band sensitivity analysis for flavonoids (Flas) based on the maximum value of the correlation coefficient square, C2 from the 3-D FSI and single-band fluorescence information.
Excitation Wavelength 3-D Fluorescence Spectral IndexSingle Wavelength
Maximum Value
of C2 from FRI
Maximum Value of C2 from FDIMaximum Value
of C2 from FRDI
Maximum Value of C2 from FNIMaximum Value of C2
Fex,350nm0.3736 *
(Fem,671/Fem,526)
0.4967
(Fem,566 − Fem,644)
0.4632
(1/Fem,523 − 1/Fem,545)
0.3896 *
((Fem,523 − Fem,541)/(Fem,523 + Fem,541))
0.0917
(Fem,523nm)
Fex,360nm0.4629 *
(Fem,392/Fem,521)
0.4961 *
(Fem,581 − Fem,615)
0.3567
(1/Fem,522 − 1/Fem,770)
0.3598
((Fem,551 − Fem,393)/(Fem,551 + Fem,393))
0.0863
(Fem,648nm)
Fex,370nm0.5438 **
(Fem,615/Fem,438)
0.4966 *
(Fem,587 − Fem,603)
0.5032 *
(1/Fem,580 − 1/Fem,370)
0.4951 *
((Fem,465 − Fem,614)/(Fem,465 + Fem,614))
0.4266
(Fem,532nm)
Note: ** Significant at the 0.05 level; * Significant at the 0.1 level. Significance test on the maximum values of C2 in the same wavelength of the excitation light resource was performed.
Table 9. The band sensitivity analysis for anthocyanin (Ants) based on the maximum value of correlation coefficient square, C2, from the 3-D FSI and single-band fluorescence information.
Excitation Wavelength 3-D Fluorescence Spectral IndexSingle Wavelength
Maximum Value
of R2 from FRI
Maximum Value of R2 from FDIMaximum Value
of R2 from FRDI
Maximum Value of R2 from FNIMaximum Value of C2
Fex520nm0.6560 **
(Fem,520/Fem,531)
0.4743 *
(Fem,787 − Fem,520)
0.6703 **
(1/Fem,533 − 1/Fem,532)
0.6329 **
((Fem,533 − Fem,531)/(Fem,533 + Fem,531))
0.3579
(Fem,708nm)
Fex,530nm0.6494 *
(Fem,531/Fem,677)
0.3903 *
(Fem,799 − Fem,704)
0.6577 **
(1/Fem,547 − 1/Fem,546)
0.5897 *
((Fem,540 − Fem,539)/(Fem,540 + Fem,539))
0.4147
(Fem,703nm)
Fex,540nm0.6578 **
(Fem,540/Fem,684)
0.4781 *
(Fem,543 − Fem,542)
0.6640 ***
(1/Fem,679 − 1/Fem,557)
0.6320 *
((Fem,548 − Fem,547)/(Fem,548 + Fem,547))
0.4852
(Fem,542nm)
Fex,550nm0.6284 *
(Fem,550/Fem,682)
0.4670 *
(Fem,551 − Fem,550)
0.6458 *
(1/Fem,682 − 1/Fem,565)
0.5218 *
((Fem,579 − Fem,573)/(Fem,579 + Fem,573))
0.4979
(Fem,553nm)
Fex,560nm0.6221 *
(Fem,569/Fem,676)
0.5462 *
(Fem,798 − Fem,560)
0.6615 **
(1/Fem,772 − 1/Fem,770)
0.5231 *
((Fem,574 − Fem,573)/(Fem,574 + Fem,573))
0.4322
(Fem,705nm)
Note: *** Significant at the 0.01 level; ** Significant at the 0.05 level; * Significant at the 0.1 level. Significance test on the maximum values of C2 in the same wavelength of the excitation light resource was performed.
Table 10. Modeling and validation of multiple pigment content inversion of leaves with 3-D FSI via 3-D fluorescence spectra.
PigmentExcitation Band (nm)3-D FSIModeling (n = 40)Validating (m = 18)
Linear FunctionR2RMSE
(µg/cm2)
Bias
(µg/cm2)
SEC
(µg/cm2)
VC
(%)
ChaFex,410FRI(Fem,759/Fem,692)y = 14.192x + 3.82280.8513 ***3.79 ***−0.8649 **3.6885 ***16.4332 ***
Fex,420FRI(Fem,759/Fem,691)y = 13.293x + 3.88640.8783 ***3.76 ***−1.0153 *3.6253 ***18.3523 ***
Fex,430FRI(Fem,740/Fem,692)y = 7.9658x + 2.27460.8816 ***3.61 ***−1.2918 *3.3704 ***17.0618 ***
FNI((Fem,690 − Fem,763)/(Fem,690 + Fem,763))y = −32.308x + 26.7070.8251 **2.96 ***0.8633 ***2.9382 ***14.8739 ***
Fex,660FRI(Fem,752/Fem,719)
FRDI((1/Fem,690 − 1/Fem,765))
FNI((Fem,718 − Fem,754)/(Fem,718 + Fem,754))
y = 131.47x − 66.499
y = 1928.3x + 23.275
y = −176.25x + 63.736
0.8315 **
0.8119 *
0.8346 **
4.15 *
6.30 *
3.97 ***
−0.7826 **
−1.5723 *
−0.5082 **
4.0750 **
6.0955 *
3.9346 ***
19.9194 ***
29.6401 *
19.2330 ***
Fex,670FRI(Fem,748/Fem,691)
FRDI(1/Fem,759 − 1/Fem,691)
FNI((Fem,751 − Fem,722)/(Fem,751 + Fem,722))
y = 10.641x + 3.5315
y = −2146x + 19.379
y = 242.53x + 72.021
0.8407 **
0.8246 *
0.8343 *
4.45 **
6.05 *
5.88 *
−1.0520 *
−0.0286 ***
1.2229 *
4.3267 **
6.0549 *
5.7518 *
21.9027 **
34.6157 *
26.2128 **
Fex,680FRI(Fem,749/Fem693)
FRDI(1/Fem,748 − 1/Fem,693)
y = 18.453x − 0.1245
y = −3669.1x + 18.569
0.8594 **
0.8304 *
3.69 ***
5.44 *
−0.6425 **
−1.211 *
3.6351 ***
5.3028 *
18.8835 ***
27.3824 **
FNI((Fem,719 − Fem,759)/(Fem,719 + Fem,759))y = −212.81x + 100.30.8429 *3.85 ***−1.3386 *3.6093 ***16.4938 ***
ChlbFex,480FRDI(1/Fem,686 − 1/Fem,707)y = 117.74x + 9.42860.7537 *3.06 ***0.7410 **2.9726 *27.0664 **
Fex,630FRI(Fem,712/Fem,668)y = 2.7284x + 1.80160.8510 **2.14 ***−0.1608 ***2.1311 ***17.1328 ***
FRDI((1/Fem,731) − (1/Fem,646))y = −513.65x + 7.08990.8563 **2.69 ***0.7152 **2.5908 *23.5898 **
Fex,640FRDI((1/Fem,733) − (1/Fem,653))y = −621.23x + 7.70390.8528 **2.13 ***0.004657 ***2.1281 *21.4364 **
Fex,650FRI(Fem,704/Fem,668)
FRDI((1/Fem,756) − (1/Fem,683))
y = 2.5455x + 2.199
y = −571.93x + 9.2498
0.8696 **
0.8135 *
2.01 ***
2.69 *
−0.6508 **
−1.5972 *
1.8999 **
2.1646 *
17.2988 ***
19.7097 *
CarsFex,490FRI(Fem,749/Fem,709)y = 25.056x − 11.2950.8122 **3.80 ***2.0514 *3.1972 ***32.4386 **
Fex,500FRI(Fem,748/Fem,717)y = 47.655x − 28.0520.8302 **3.77 ***1.3470 **3.5169 **35.6819 **
FNI((Fem,749 − Fem,715)/(Fem,749 + Fem,715))y = 69.5x + 19.2640.8070 *4.13 **1.7770 *3.7316 *37.8611 *
FlasFex,370FRI(Fem,615/Fem,438)y = 302.29x + 264.680.5438151.1322,489.9835,067.0110,044.52
AntsFex,540FRI(Fem,540/Fem,684)
FRDI(1/Fem,679 − 1/Fem,557)
y = 0.0837x + 0.8159
y = 96.778x + 0.7982
0.6578 **
0.6640 **
2.31 ***
2.8 **
2.7026 *
1.0035 **
3.4759 *
2.6122 **
130.879 *
98.3577 **
Note: *** Significant at the 0.01 level; ** Significant at the 0.05 level; * Significant at the 0.1 level. Significance test on the maximum values of C2 in the same wavelength of the excitation light resource was performed.
Disclaimer/Publisher’s Note: The statements, opinions and data contained in all publications are solely those of the individual author(s) and contributor(s) and not of MDPI and/or the editor(s). MDPI and/or the editor(s) disclaim responsibility for any injury to people or property resulting from any ideas, methods, instructions or products referred to in the content.

