Abstract
Identifying potassium (K+) deficiency in plants has traditionally been a difficult and expensive process. Traditional methods involve inspecting leaves for symptoms and conducting a laboratory analysis. These methods are not only time-consuming but also use toxic reagents. Additionally, the analysis is performed during the reproductive stage of growth, which does not allow enough time for corrective fertilization. Moreover, soybean growers do not have other tools to analyze the nutrition status during the earlier stages of development. Thus, this study proposes a quick approach for monitoring K+ in soybean crops using hyperspectral data through principal component analysis (PCA) and linear discriminant analysis (LDA) with a wavelength selection algorithm. The experiment was carried out at the Brazilian National Soybean Research Center in the 2017–2018, 2018–2019, and 2019–2020 soybean crop seasons, at the stages of development V4–V5, R1–R2, R3–R4, and R5.1–R5.3. Three treatments were evaluated that varied in K+ availability: severe potassium deficiency (SPD), moderate potassium deficiency (MPD), and an adequate supply of potassium (ASP). Spectral data were collected using an ASD Fieldspec 3 Jr. hyperspectral sensor. The results showed a variation in the leaf spectral signature based on the K+ availability, with SPD having higher reflectance in the visible region due to a lower concentration of pigments. PCA explained 100% of the variance across all stages and seasons, making it possible to distinguish SPD at an early development stage. LDA showed over 70% and 59% classification accuracies for discriminating a K+ deficiency in the simulation and validation stages. This study demonstrates the potential of the method as a rapid nondestructive and accurate tool for identifying K+ deficiency in soybean leaves.
1. Introduction
Soybean (Glycine max (L.) Merrill) is one of the main oilseeds produced and consumed worldwide. In the 2017–2018, 2018–2019, and 2019–2020 crop seasons, Brazil consolidated its status as the world’s largest producer, with productions of 123.4, 119.7, and 126.0 million tons (World Agricultural Production—USDA 2022). However, global and national production is constantly threatened by various biotic and abiotic factors [1,2,3,4,5,6,7,8], which can compromise grain yield and producer profitability.
Among the main abiotic factors that seriously compromise grain yield, nutritional management stands out due to the inherent low fertility of tropical soils, their high degree of weathering, and the frequent use of fertilizers at a low concentration. These challenges make nutritional management a crucial aspect of maintaining productivity [9,10,11].
Considering all the essential nutrients for the growth and development of soybean plants, potassium (K+) is the most abundant and the second most absorbed and assimilated element compared to the others. K+ participates extensively in many physiological and biochemical processes in plants, such as photosynthesis, respiration, carbohydrate synthesis and metabolism, protein formation, and the translocation and storage of sugars, among others. K+ deficiency causes several physiological disorders, compromising plant growth and development, and the main visual symptom of K+ deficiency is a marginal chlorosis of older leaves and leaf tissue necrosis due to the accumulation of soluble nitrogen compounds, such as amines, putrescines, and agmatine [12,13].
Crop monitoring for K+ deficiency typically involves lab analysis, or it can be conducted in the field by technicians and farmers trained in diagnosing symptoms via the visual inspection of leaves. However, this approach can be slow, expensive, and ineffective [7,11,14]. Although marginal chlorosis on the leaves is the main visible symptom of deficiency, there is a lack of additional indicators and parameters that evidence the deficiency of this nutrient, which imposes limitations on the identification of nutritional status in a time-efficient manner, so as to carry out correction fertilization with K+ within the crop season.
Remote sensing, employing sensors such as photographic cameras and multispectral, hyperspectral, fluorescent, and thermal sensors, presents an effective technique for the early, accurate, non-destructive discrimination and identification of plant deficiencies [15,16,17]. The underlying principle of this technique hinges on biochemical alterations induced by nutrient deficiency. These deficiencies can lead to changes in photosynthetic activity, cell structure, and chemical bond stability, resulting in modifications to the reflectance spectrum in the visible regions (Vis) and near-infrared (NIR) bands. Changes in the Vis region are primarily due to variations in leaf pigments such as chlorophylls “a” and “b”, carotenoids, and flavonoids, while changes in the NIR bands can be attributed to the physical structure and spatial distribution of cells, water content, lignin, cellulose, and pectin compounds [7,14,18,19,20,21,22].
Reflectance in the Vis/NIR spectrum, combined with linear discriminant analysis (LDA), has been successfully and accurately applied for the early diagnosis and discrimination of nutritional deficiency, water stress, weed detection, disease monitoring, and other related stresses [2,23,24,25,26,27]. For instance, studies conducted by Gómez-Casero et al. [28], Foster et al. [29], and Siedliska et al. [17] demonstrated the efficacy of hyperspectral data from leaves/canopies and LDA, with variable selection via the “Stepwise” procedure, for the monitoring and identification of potassium (K), nitrogen (N), and phosphorus (P) in olive, celery, beetroot, strawberry, sorghum, and perennial millet crops.
However, although remote sensing has often been applied in the identification of N, P, and other nutrients to assess nutritional status, few studies have addressed the identification and classification of the deficiency caused by K+. In particular, there are no reports of research carried out on soybean crops.
This study proposes that it may be possible to detect K+ deficiency in soybean plants by using a non-imaging hyperspectral sensor. By utilizing multivariate statistical techniques, this method may provide a quicker and more cost-effective means to identify and differentiate K+ deficiency in soybeans, serving as an alternative or complement to traditional analysis methods. The primary objective of this research was to analyze the response of soybean plants to varying degrees of K+ deficiency during the vegetative and reproductive growth stages (V4–V5, R1–R2, R3–R4, and R5.1–R5.3) across three seasons (2017–2018, 2018–2019, and 2019–2020). The specific objectives were as follows: (1) identifying the optimal wavelengths for distinguishing between different levels of K+ deficiency using the “Stepwise” approach, (2) constructing linear discriminant analysis (LDA) models, and (3) proposing a novel method for detecting K+ deficiency in soybean crops at an early stage.
2. Materials and Methods
2.1. Study Area
The experiment was conducted at the experimental farm of the National Soybean Research Center (Embrapa Soja), a branch of the Brazilian Agricultural Research Corporation, located in the Londrina municipality, Paraná State, the southern region of Brazil (23°11′37″S, 51°11′03″W, 630 m above sea level) (Figure 1).
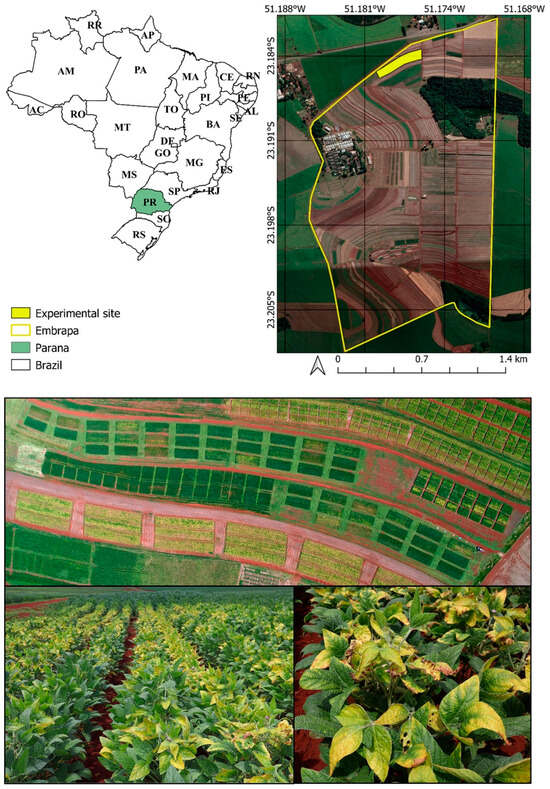
Figure 1.
Geographical representation of the experimental site evaluated in 2017–2018, 2018–2019, and 2019–2020 for soybean crops.
The experimental site is cultivated under a no-tillage planting system, with a soybean/corn or soybean/wheat succession, with mechanized planting, and without an irrigation system. The evaluations in the experimental site were carried out in the 2017–2018, 2018–2019, and 2019–2020 soybean crop seasons in a soil fertility experiment with a history of potassium (K+) nutritional deficiency. The study was conducted in a randomized complete block design with four blocks and three treatments, to evaluate the effects of fertilization on plant growth. The fertilization treatments were managed in a way that created a wide range of potassium availability in the soil, allowing for the detection of any deficiency symptoms that might occur.
The three established treatments were as follows: severe potassium deficiency (SPD) without any application of potassium chloride (KCl), moderate potassium deficiency (MPD) with the application of 50 kg ha−1 KCl (often referred to as “hidden hunger”), and an adequate supply of potassium (ASP), with the application of 130 kg ha−1 KCl (considered the standard of fertilization). The soybean cultivar evaluated was BRS1003IPRO, modified by Embrapa Soja, which presents a wide adaptation and grain yield stability with a high performance. Other management practices, such as the application of herbicides, fungicides, and insecticides, followed the technologies for soybean production [30].
2.2. Spectral Data Acquisition
Spectral data collection was performed with the ASD Fieldspec 3 Jr. spectroradiometer (Analytical Spectral Devices, Inc., Boulder, CO, USA) with a spectral resolution of 3 nm (ranging from 350 to 1400 nm) and 30 nm (ranging from 1400 to 2500 nm). The device automatically interpolates the wavelengths at 1 nm intervals, resulting in a total of 2151 wavelengths being measured. Before starting the spectral assessment, the equipment remained in operation for 15 min, the time necessary for the preheating and stabilization of the system, as recommended by the ASD FieldSpec® 3 User Manual.
To avoid external interference and atmospheric attenuation, the measurements were made with the Plant-probe accessory connected to the ASD FieldSpec 3 Jr. with an optical fiber. The Plant-probe has an artificial light of 4.5 Watts and a 4.25 Volts halogen lamp, which enables its operation regardless of natural sunlight conditions. The sensor also has a Lambertian surface (Spectralon®—used as the maximum reflectance standard) and an opaque and black surface (used during the spectral measurements) (Figure 2), necessary for the standardization of the acquired data and the conversion of spectral information from radiance to reflectance (ASD FieldSpec® 3 User Manual).
In this study, we used only the spectral range between 400 and 1000 nm (comprising 601 wavelengths). This range corresponds to the main spectral changes promoted by the “nutritional deficiency-plant-electromagnetic energy” interaction, resulting from changes in the synthesis of proteins, pigments, and cellular structures [31,32]. Spectral measurements were performed on 21 soybean leaves for each treatment in each block, totaling 252 reflectance spectra (3 treatments × 4 blocks × 21 spectral measurements) at the V4–V5, R1–R2, R3–R4, and R5.1–R5.3 (V—vegetative, R—reproductive) stages of development in the 2017–2018, 2018–2019, and 2019–2020 soybean crop seasons, following the scale of plant development by [33].
These stages of development were established according to the rate of K+ accumulation in the soybean plants, as shown by Oliveira Junior et al. [34]. These stages represent the highest rates of K+ accumulation by plants, exhibiting exponential absorption behavior, as shown in Figure 2b.
A total of 3024 spectral samples were obtained (3 treatments × 4 blocks × 21 spectral measurements × 4 stages of development per season × 3 seasons). The sample size was justified by statistical analysis to obtain a robust linear discriminant model (LDA) with external validation possibility.
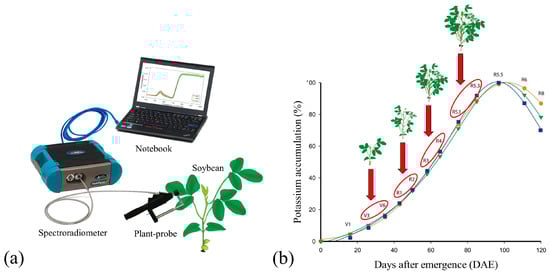
Figure 2.
Representation of equipment used in the field to collect spectral data from leaves of soybean plants (a). Development stages evaluated in 2017–2018, 2018–2019, and 2019–2020 crop seasons (b). Adapted from Oliveira Junior et al. [34].
Foliar samples were collected on the same dates as the spectral assessments to determine the K+ content. The samples were washed, dried, and processed for nutrient determination using the methodology described in the manual for the chemical analysis of soils, plants, and fertilizers [35].
2.3. Spectral Data Preprocessing
The spectral data obtained by the spectroradiometer were processed in ViewSpecPRO Pro® v6.2 software (Analytical Spectral Devices, Inc., Boulder, CO, USA) and exported in radiance format for later conversion into reflectance, using mathematical Equation (1):
These data were used for all multivariate statistical procedures performed in the Statistical Analysis System® (SAS) v9.4 and The Unscrambler® X v10.4 software, as described in Section 2.4.
2.4. Statistical Analysis
2.4.1. Analysis of Variance and Comparison of Means
To verify the effect of K+ deficiency on grain yield and leaf content, the data were analyzed using ANOVA, Shapiro–Wilk, Kolmogorov–Smirnov, and Bartlett’s tests for the normality of residuals and homogeneity of variances, and when significant, Tukey’s multiple comparison of means test at the 5% error probability level (α).
2.4.2. Analysis of Homogeneity of Spectral Curves
An analysis of the homogeneity of the spectral curves was performed using the T2 Hotelling’s and Leverage tests in The Unscrambler® X v10.4 software at the 5% significance level. These procedures are necessary for the detection of outliers and their possible influence on subsequent analyses [36,37].
2.4.3. Principal Component Analysis (PCA)
Principal component analysis was applied to verify the existence of treatment separability by the full spectral curve and the possible formation of isolated clusters or overlaps among treatments via two-dimensional plots of the first component (PC1) vs. the second component (PC2).
2.4.4. Linear Discriminant Analysis (LDA)
The linear discriminant analysis (LDA) technique is well-known for generating accurate and easily interpretable results, widely used in classification models [38,39]. We utilized three different approaches to adjust the LDA models, which are defined below:
- (1)
- LDA adjusted to differentiate treatments at each development stage and in each crop season (2017–2018, 2018–2019, and 2019–2020).
- (2)
- LDA by combining data from development stages with similar characteristics. The following combinations were used: V4–V5; R1–R2; R3–R4; and R5.1–R5.3. The data used for each combination were from the 2017 to 2020 crop seasons. The goal of this approach was to create an effective LDA model that can reduce the impact of variations inherent to each crop season.
- (3)
- LDA by combining all the data collected regardless of the development stages and crop seasons. The goal of this approach was to assess the potential for discriminating treatments independent of the evaluated stages and crop seasons.
Before adjusting the LDA model, the proc “Stepwise” was applied to the spectral curves using the SAS software v9.4 at a 5% significance level (p-value ≤ 0.05). This procedure selects the wavelengths that best maximize the variances between the evaluated treatments, removing multicollinearity and reducing the dimensionality of the LDA models.
The LDAs were created using the proc “Discrim” procedure in the SAS software to obtain regression coefficients and create a predictive model of treatment spectral characteristics. The model uses linear combinations of previously selected wavelengths, as reported in Equation (2).
where Yn: linear discriminant model for each treatment; α: intercept; Xi: explanatory variables (reflectance value of the selected wavelength); β: discriminant coefficients for each explanatory variable; and εi: random error.
Yn = α + β1Xi,1 + β2Xi,2 + β3Xi,3 + … + βiXi,n + εi
The LDA’s performance evaluation involved dividing the spectral curve dataset into two subsets: 70% for training and 30% for testing. The first subset created a “simulation discriminant model”, while the second subset validated it. To ensure unbiased results, the spectral curves for external validation (30%) were randomly assigned from the dataset used for simulation model (70%) generation.
Subsequently, a report was generated, with tables showing error and correctness percentages for each treatment, to assess the classification accuracy and evaluation of the models.
3. Results and Discussion
3.1. Foliar Potassium in the Crop Seasons 2017–2018, 2018–2019, and 2019–2020
The K+ leaf concentration displayed a normal distribution for all development stages, and all treatments were significantly different and separable as per the test (Table 1).

Table 1.
Descriptive statistics and mean comparison test for leaf K+ concentration at different developmental stages evaluated for 2017 to 2020 crop seasons.
According to the interpretation manual of NEPAR/SBCS [40], soybean plants at the R2 stage require an ideal foliar K+ concentration ranging between 17 and 25 g kg−1 for proper growth. However, the SPD and MPD treatments failed to provide the required concentrations, which were categorized as deficient. For the other stages of development, as there are no reports in the literature on the range of interpretation of the concentration of the nutrient, the ASP treatment was used as a reference for comparison. Thus, it was observed that, in all other stages evaluated, SPD and MPD were classified as deficient.
The treatment with severe deficiency (SPD) displayed the lowest average leaf K+ concentration in all developmental stages, with values between 3.71 and 14.77 g kg−1 (R5.3, 2019–2020 and R2, 2017–2018). The standard treatment (ASP) exhibited a K+ concentration nearly three times that of SPD, with values from 15.65 to 27.09 g kg−1 (R4, 2017–2018 and R2, 2017–2018). Despite showing no deficient symptoms in the field, the MPD treatment was considered deficient when compared to the ASP, with a K+ concentration approximately 1.76 times lower.
3.2. Soybean Grain Yield in the 2017–2018, 2018–2019, and 2019–2020 Crop Seasons
Figure 3 displays the descriptive statistics and comparison test of means for soybean grain yields during the 2017–2018, 2018–2019, and 2019–2020 crop seasons. All the basic assumptions of the ANOVA were validated. The Tukey’s test for each crop season showed a significant difference in grain yield values, making it possible to distinguish all treatments in 2017–2018 and 2019–2020. As observed in Figure 3, SPD produced the lowest grain yield value in relation to the other treatments, displaying values of 1548.80 kg ha−1 in the 2017–2018, 817.40 kg ha−1 in the 2018–2019, and 717.40 kg ha−1 in the 2019–2020 crop seasons. Although MPD did not show visual deficiency symptoms in the field, there could be observed a grain yield decrease of around 34% in relation to the ASP in 2017–2019 and 2019–2020, showing the importance of the nutrient supply and the need for new tools to identify K+ deficiency in a fast and accurate manner.
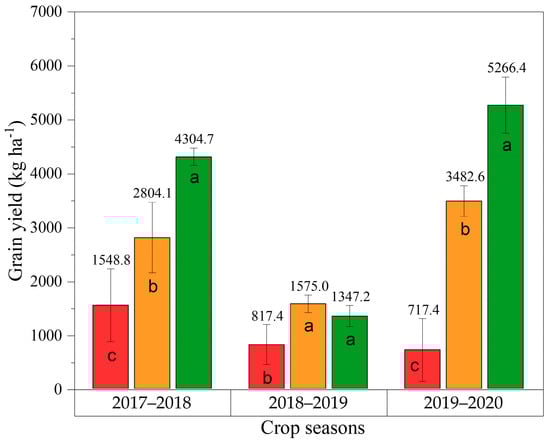
Figure 3.
Descriptive statistics and mean comparison test (Tukey’s) for soybean grain yield (kg ha−1) in 2017–2018, 2018–2019, and 2019–2020 crop seasons. Coefficient of variation (%): 19.12 (2017–2018), 20.81 (2018–2019) and 15.22 (2019–2020). Statistical differences are represented by different letters in each bar for each crop season (p-value ≤ 0.05).
The 2018–2019 crop season exhibited significantly lower average grain yield values due to a period of water deficit that occurred in January/February. This impacted the soybean plants at the V5 and the R1–R5.3 stages of development, periods critical to the crop’s establishment and flower, pod, and grain formation. Water stress led to a decrease in photosynthetic rates and the interruption of carbohydrate metabolism in the leaves, thus impacting the formation of flowers per plant and reducing photo-assimilates available for reproductive organ development [41,42]. This increased the rate of flower abortion, contributing to a substantial reduction in grain yield values. Similar findings were reported by Sentelhas et al. [43] and Crusiol et al. [5], who noted that extended periods of drought can impair grain production by approximately 30%.
3.3. Visual Analysis of the Reflectance Spectra
Figure 4 displays the average reflectance spectra, along with the standard deviation for each treatment’s 3024 spectral samples gathered across the 2017–2020 crop seasons.
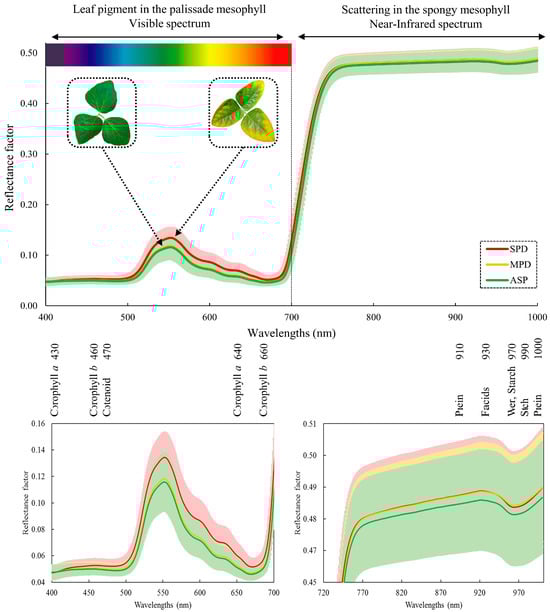
Figure 4.
Average spectral signature of soybean leaves from 2017–2020 crop seasons and regions of absorptions of leaf pigments and compounds.
The principal symptoms of nutritional deficiencies, such as the onset of chlorosis followed by leaf tissue necrosis, often correlate with an increase in the reflectance factor in the visible region (500 and 700 nm). This is especially prominent in the treatment with the most significant nutrient deficiency (SPD). A subtle difference in the reflectance spectrum was observed between the MPD and ASP treatments. As MPD did not exhibit visual symptoms of K+ deficiency, its spectral signature was expected to be closer to the nutrient-sufficient treatment (ASP).
The visible region of the electromagnetic spectrum is strongly influenced by the presence of photosynthetic pigments, including chlorophylls “a” and “b”, and carotenoids, such as carotenes and xanthophylls [18,21,44,45]. Plants susceptible to K+ deficiency exhibit lower chlorophyll “a” and “b” concentrations, higher stomatal restriction, and lower electron transition compared to tolerant plants, as mentioned in the study conducted by Zhao et al. [46]. Consequently, the photosynthesis rate will be reduced. Zhao, Oosterhuis, and Bednarz [47] also related that plants under a K+ deficiency showed reduced chlorophyll and changes in chloroplast ultrastructure, restricted saccharide translocation, limited stomatal conductance, a reduced leaf area, and impaired assimilate partitioning among plant tissues. Although we did not measure the chlorophyll, photosynthesis rate, and other physiological/biological parameters, the grain yield values suggest that plants with a K+ deficiency could present limitations in these parameters.
Reflectance changes in the Vis/NIR regions in plants under a K+ deficiency have been reported by Ayala-Silva and Beyl [48], Lu et al. [49], Oliveira et al. [50], and Furlanetto et al. [16], showing the importance of these wavelengths for nutrient discrimination. In the near-infrared (NIR, between 750–1000 nm), the ASP treatment displayed a lower reflectance than the other treatments. This portion of the spectrum is strongly associated with the level of cell hydration and shows a linear spectral response. Under nutrient-deficient and stressful conditions, changes in mesophyll cell layering, cell wall hydration, and plant canopy structure are reflected in the NIR spectrum [51,52].
Regarding the standard deviation, the lowest values were seen at the blue and red spectrum visible wavelengths, approximately 450 nm and 680 nm, respectively. The standard deviation had the greatest amplitude at green spectrum wavelengths, probably due to differing pigment concentrations and distributions among treatments, resulting in increased variability. The NIR spectrum standard deviation remained constant between 750 to 1000 nm for all treatments.
3.4. Wavelength Selection by Proc “Stepwise”
The wavelength selection results for the 2017–2018, 2018–2019, and 2019–2020 crop seasons, all stages of development and all crop seasons together, are presented in Figure 5.
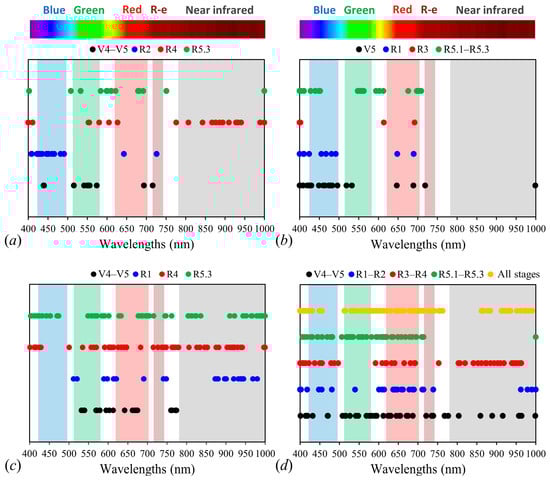
Figure 5.
Wavelengths selected by the proc “Stepwise” for 2017–2018 (a), 2018–2019 (b), 2019–2020 (c) crop season, and similar development stages in the 2017–2020 crop seasons, all development stages together (d).
For the 2017–2018 soybean crop season, from the total of 601 wavelengths of the Vis/NIR spectrum obtained by the ASD Fieldspec 3 Jr. sensor, 10 wavelengths were selected at the V4–V5 stage of development; 16 at R2; 22 at R4; and 15 at R5.3. Most of the selected wavelengths are in the Vis region of the electromagnetic spectrum, distributed in the blue region (420 ≈ 500 nm), green (500 ≈ 570 nm), and red (620 ≈ 700 nm). For the red-edge portion, only two wavelengths were selected at V4–V5 and R2. In the NIR region, the largest number of selected wavelengths was observed for the R4 stage, with 15 wavelengths selected, distributed between 776 and 1000 nm.
In the 2018–2019 crop season, 20 wavelengths were selected at the V5 development stage; 10 at R1; 4 at R3; and 20 at R5.1–R5.3. Similar to the 2017–2018 crop season, a predominance of selected wavelengths from the Vis region of the electromagnetic spectrum was observed, with only one wavelength selected (999 nm) in the NIR region at V5, as observed in Figure 5b. Additionally, according to Figure 5b, the most recurrent wavelengths in the selection were located in the blue (420 ≈ 500 nm) and red (620 ≈ 700 nm) regions.
For the 2019–2020 crop season, the proc “Stepwise” selected 19 wavelengths at V4–V5; 25 at R1; 52 at R4; and 55 at R5.3, as shown in Figure 5c. In this crop season, a larger number of wavelengths were selected compared to previous crop seasons. Regarding the spectral regions, the Vis region exhibited a larger proportion of wavelengths for the red, green, and blue bands, directly related to the activity of photosynthetic pigments.
Considering that electromagnetic radiation strongly interacts with these pigments, greater variability in the spectral curve is expected in the region that corresponds to the peak of chlorophyll absorption due to its content, and, consequently, greater discriminant weight is attributed to this region [45]. In contrast to the observations in the other crop seasons, in 2019–2020, there was a selection of many wavelengths across the red-edge and NIR regions, with a larger proportion observed for stages R1, R4, and R5.3. This shows its good statistical properties and ability to discriminate between the treatments.
When gathering the development stages with similar characteristics from the 2017 to 2020 crop seasons (Figure 5d), 44 wavelengths were selected at V4–V5, 26 at R1–R2, 44 at R3–R4, and 44 at R5.1–R5.3. Once again, most of the selected wavelengths were located in the Vis spectrum, red (620 ≈ 700 nm), green (500 ≈ 570 nm), and blue (420 ≈ 500 nm). For the red-edge and NIR spectrum, V4–V5 and R3–R4 showed a larger number of selected wavelengths compared to the other stages: 11 wavelengths at V4–V5 and 22 at R3–R4.
Finally, combining all stages of development from all crop seasons, 72 wavelengths were selected to compose the LDA, as shown in (Figure 5d). As observed in the previous analysis, the spectral region with a larger number of selected wavelengths was the Vis spectrum, across the red, green, and blue regions. The red region presented the largest number of selected wavelengths (21) over the other regions. In the red-edge, 4 wavelengths were selected; and in the NIR, 21 wavelengths were selected and distributed between 754 to 991 nm.
The more significant proportion of selected wavelengths located in the Vis region is primarily due to K+ deficiency altering the distribution and concentration of photosynthetic pigments. Besides that, stomatal dysfunctions resulting from this nutrient deficiency can lead to an imbalance between the production of reactive oxygen species (ROS) and the synthesis of plant defense antioxidant compounds, leading to oxidative stress [53,54]. This stress, due to the accumulation of ROS, leads to the consequent degradation of pigments. Consequently, a reduction in photosynthetic rates is expected, causing changes in the absorption and usage of Vis light and altering the reflectance spectrum in plants with K+ deficiency [55]. Furthermore, the green and yellow regions are known to be sensitive to subtle changes in photosynthetic pigments [56,57].
For the NIR spectrum, an adequate supply of K+ alleviated the harmful effects of water stress on plants, increasing root length, root density, and the secretion of organic acids. Consequently, plants that are not deficient and are well-supplied with K+ exhibit a better metabolic use of water and cell walls with a higher degree of hydration [13]. This characteristic allows for more frequent multiple refractions and interactions of electromagnetic energy, leading to significant changes in the spectral response.
3.5. Principal Component Analysis (PCA)
The first two components (PC1 and PC2) were sufficient to explain 100% of the variability in the spectra across all the analyzed datasets. The high variance in PC1 corresponds to the separation of spectral responses which results from the interaction of electromagnetic energy with leaf pigments. On the other hand, PC2, which represents the lowest variance, primarily separates data based on the NIR spectrum. This can be attributed to interactions with the internal cellular structures of leaves, water content, and the thickness of mesophyll cells, among others [2,22,27,58].
Figure 6 shows the results from the 2017–2018 crop season. During the V4–V5 development stage (Figure 6a), the ASP treatment stood out from the others, while the MPD and SPD treatments overlapped slightly in PC1. In PC2, MPD was separated from the ASP and SPD, but there was no distinct clustering between SPD and the ASP in this component. Conversely, at the reproductive stage R2 (full bloom), only SPD could be separated from the other treatments in PC1, with no clustering tendency noted between the ASP and MPD. For PC2, there was no possibility of separating the ASP and MPD, but a minor clustering tendency was observed for the ASP relative to MPD. Furthermore, stage R2 showed the most data overlap of all the evaluated stages in this crop, contributing to the overall lower performance of the PCA compared to the other stages. Soybean plants during stages R4 and R5.3 intensify the absorption, accumulation, and reallocation of K+ to the grains, which can lead to K+ deficiency. The ASP, MPD, and SPD exhibited separation in PC1 and PC2 at these stages. They also showed the highest proportions of data variance explanation (82.51–89.36%, respectively) compared to V4–V5 and R2, coinciding with the complete filling and ripening of the grains in the pods.
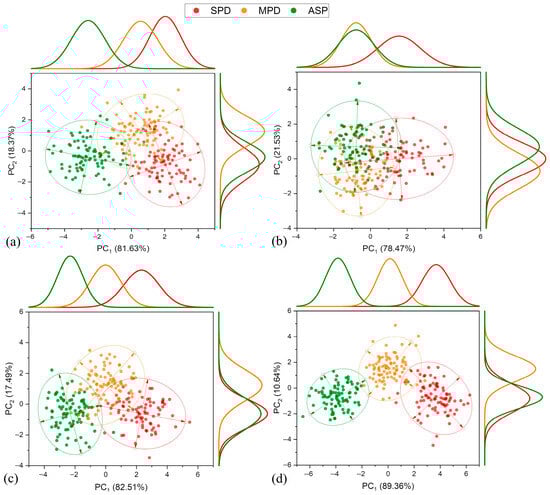
Figure 6.
Principal component analysis, frequency distribution, and confidence ellipse of reflectance data of treatments in 2017–2018 crop season, at 5% level significance. Development stage V4–V5 (a), R2 (b), R4 (c), and R5.3 (d).
For the 2018–2019 crop season, it was observed that the treatment with the highest K+ deficiency (SPD) could be distinctly separated from the others in all the evaluated stages of development, with a greater intensity attributed to PC1 (Figure 7). In this component, the explained variance values of the reflectance data increased as the plants developed, with the maximum value observed at R5.1–R5.3, 90.01%. It is notable that only at R5.1–R5.3 was there a tendency for MPD to separate from the standard treatment (ASP). Conversely, analyzing PC2, a satisfactory separation of MPD from the ASP was observed for all stages of development. These results are extremely important, as they suggest the possibility of promptly identifying MPD conditions in the early stages of plant development through reflectance data, even when these symptoms are not visually apparent (as in the case of MPD).
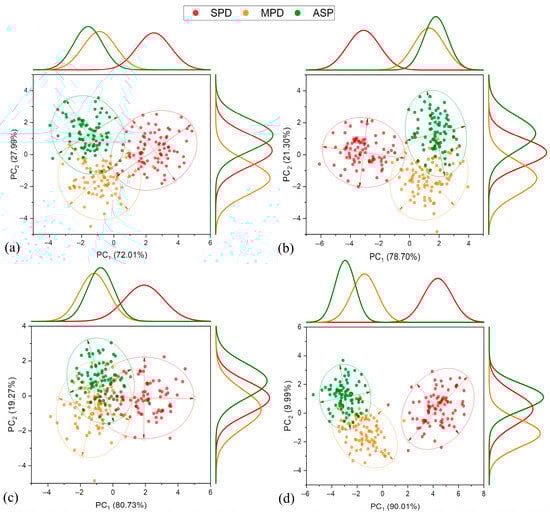
Figure 7.
Principal component analysis, frequency distribution, and confidence ellipse of reflectance data of treatments in 2018–2019 crop season, at 5% level significance. Development stage V5 (a), R1 (b), R3 (c), and R5.1–R5.3 (d).
In the 2019–2020 crop season (Figure 8), a severe K+ deficiency (SPD) was completely separated from other treatments (MPD and ASP) at all stages of development. This season showed the most distinct separation of SPD among all the crop seasons evaluated, primarily attributed to PC1. The variance values of the explained reflectance data increased as the plants developed, reaching a maximum at R5.3 with 89.85%. However, again, the separation of the MPD and ASP treatments was not noticeable via PC1, resulting in substantial overlap between them, except for a slight separation trend at the R5.3 stage. On the other hand, PC2 showed more favorable results compared to previous crop seasons, with a satisfactory separation between the MPD and ASP treatments. This separation was noticeable from the early development stages V4–V5 to the reproductive stage R5.3, achieving complete separation between them.
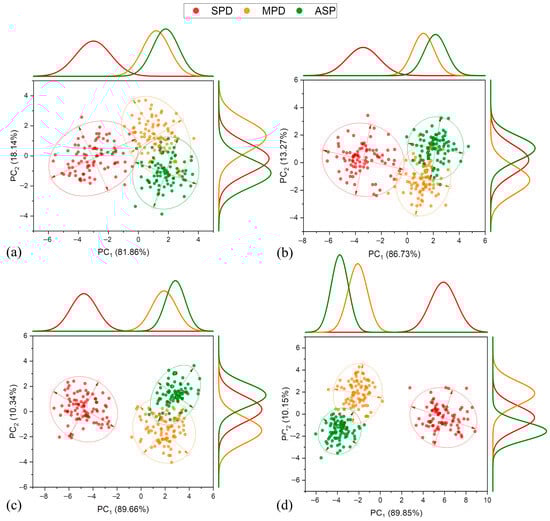
Figure 8.
Principal component analysis, frequency distribution, and confidence ellipse of reflectance data of treatments in 2019–2020 crop season, at 5% level significance. Development stage V4–V5 (a), R1 (b), R4 (c), and R5.3 (d).
When all the evaluated crop seasons with all development stages with similar characteristics were grouped (Figure 9), at the V4–V5 stage the PC1 showed a tendency to separate only the treatment with severe K+ deficiency (SPD) from the others, with a total of 76.99% of the explained variance attributed to this component. In other development stages, a greater separation of the SPD treatment was observed, reaching a maximum at the R5.1–R5.3 stage with 92.45% of the variability attributed to this component. For the other treatments, MPD and ASP, a separation tendency was only observed at stages R3–R4 and R5.1–R5.3, intensifying at the final stage, making it possible to separate all the evaluated treatments. For PC2, there is a notable trend to separating MPD and the ASP across all developmental stages observed, in contrast to the severe K+ deficiency (SPD) treatment, which does not exhibit any separation attributed to PC2.
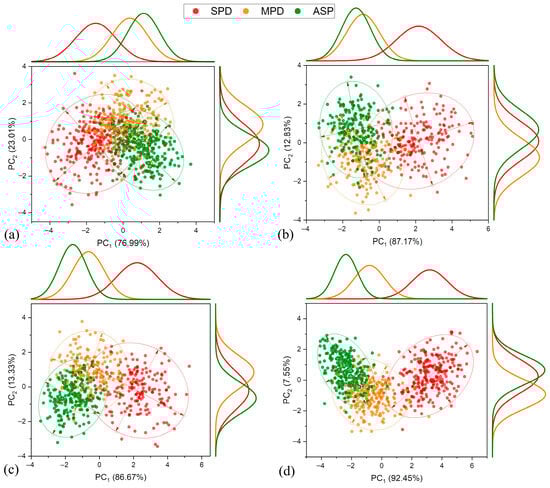
Figure 9.
Principal component analysis, frequency distribution, and confidence ellipse of reflectance data of treatments in the 2017–2020 crop seasons, at 5% level significance. Development stage V4–V5 (a), R1–R2 (b), R3–R4 (c), and R5.1–R5.3 (d).
Finally, when combining all soybean crop seasons (2017–2018, 2018–2019, and 2019–2020) and all stages of development (Figure 10), the frequency distribution of PC1 reveals a separation of the treatment with a severe K+ deficiency (SPD) from the others. However, no clear separation trend for the ASP and MPD treatments could be identified within this component. For PC2, which has a lower accumulated variance, a separation of treatments could not be achieved. However, a slight tendency for MPD to separate from the other treatments could be observed. Despite the limited separation of treatments, these results indicate that it is possible to identify K+ deficiency, regardless of the cultivation year and the developmental stage of the plants.
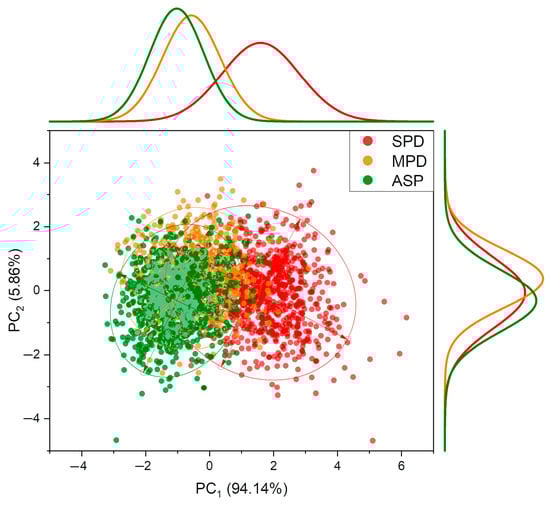
Figure 10.
Principal component analysis, frequency distribution, and confidence ellipse of reflectance data of treatments in all development stages and all crop seasons (2017–2020), at 5% level significance.
3.6. Linear Discriminant Analysis (LDA)
The LDA (linear discriminant analysis) results were highly accurate when the datasets were randomly partitioned into 70–30% in the SAS system (Figure 11). During the development stage of V4–V5 in the 2017–2018 crop season, an overall classification accuracy of 70.63% (simulation) and 63.53% (external validation) was achieved. For reproductive stages R2, R4, and R5.3, accuracies of 96.61%, 87.89%, and 88.94% (simulation) and 71.02%, 78.04%, and 84.43% (external validation) were obtained.
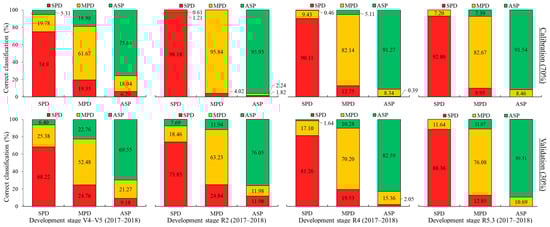
Figure 11.
LDA for 2017–2018 soybean crop season at each plant development stage evaluated. Spectral datasets: percentage of accuracy in spectral classification of each treatment (bar) in relation to all treatments (colors within bar) for calibration and validation steps.
Analyzing Figure 11, the accuracy of treatment classification during the simulation step was lower for the V4–V5 development stage compared to the others, with a correct classification of 74.9% of the spectral curves for SPD, 61.67% for MPD, and 75.68% for the ASP. The highest classification success was observed at the R2 stage, with values of 98.18% for SPD, 95.84% for MPD, and 95.93% for the ASP. In other stages, the observed accuracy rates exceeded 80%.
When the external validation was performed using 30% of the spectral curves, the classification accuracy was reduced across all development stages. However, there can be observed high classification rates for SPD in all the development stages evaluated, with values ranging from 68.22% at V4 to 88.36% at R5.3. There was a misclassification with SPD and MPD, with values oscillating from 25.38% at V4 to 11.64% at R5.3. This misclassification is an important result since we are classifying the MPD spectral curves as a deficient treatment. A small rate of misclassification with the ASP was observed at the V4, R2, and R4 development stages, decreasing when the plants’ development progressed. This characteristic may not be appropriate, since we are classifying the ASP as a deficient treatment, and this can misidentify the nutrient conditions for early fertilizer management.
Regarding the MPD treatment, the lowest values were obtained at the early development stages (V4—52.48%, R2—63.23%). However, when the plant’s nutrient demand increases as it grows, a high classification accuracy is observed, with the maximum value observed at R5.3 with 76.08%. MPD tended to have more misclassification rates with the SPD treatment, with values decreasing as the development stage progressed, showing values ranging from 24.76% at V4 to 12.85% at R5.3. This is a good result, as we are classifying MPD as being a deficient treatment. However, it can observed that there was also a misclassification with the ASP, with values ranging from 22.76% at V4 to 11.07% at R5.3. In this case, this result is not appropriate, since we are classifying a deficient condition (MPD) as nutrient-sufficient (ASP).
By adding the classification success rate in V4–V5 for the treatment with moderate K+ deficiency (MPD, 52.48%) and the confusion rate with the treatment showing greater deficiency (SPD, 24.76%), we achieve a classification success of 77.24% (52.48% + 24.76%) for the nutrient deficiency condition. Therefore, the results suggest that it is feasible to apply nutrient corrections during the early stages of plant development to prevent grain yield losses.
For the crop season in 2018–2019, the V5 stage achieved an overall classification accuracy of 78.23% (simulation) and 67.43% (external validation). For the reproductive stage R1, accuracies of 71.13% (simulation) and 65.54% (external validation) were obtained. For R3, values of 70.06% (simulation) and 59.61% (external validation), and for R5.1–R5.3, values of 88.17% (simulation) and 82.15% (external validation), were obtained.
A higher proportion of misclassification between treatments was observed in 2018–2019 in comparison to the 2017–2018 crop season. During the 2018–2019 season, periods without rain resulted in water deficiency in the plants, which is likely to have increased the misclassification rate between treatments, especially at stage R3. The water deficit periods coincided with crucial stages of development that are vital for plant growth. This is supported by the fact that there was no statistical significance for grain yield between the MPD and ASP treatments in this season compared to the others (Figure 12).
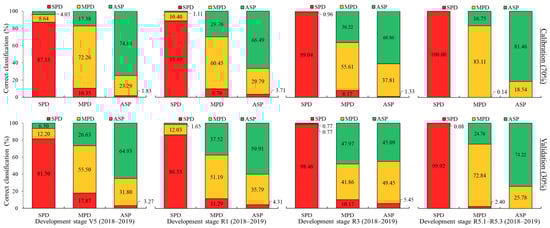
Figure 12.
LDA for 2018–2019 soybean crop season at each plant development stage evaluated. Spectral datasets: percentage of accuracy in spectral classification of each treatment (bar) in relation to all treatments (colors within bar) for calibration and validation steps.
When analyzing the treatments, SPD achieved a classification success of over 80% at all development stages, reaching near-100% accuracy at R3 and R5.1–R5.3 for both the simulation and external validation. Although there were some misclassifications with MPD at V5 and R1, the plants were still classified as deficient.
In contrast, a higher confusion rate was noted between MPD and the ASP across all the stages evaluated, with values ranging from 16.75% to 47.97% for both the simulation and external validation. The highest percentages occurred from stage R1 onwards, with the lowest performance at R3, in contrast to the 2017–2018 crop season.
Considering only the treatments that present nutrient deficiency (SPD + MPD), a classification above 93.70% in V5 is observed (81.50% + 12.20%, external validation), indicating the LDA models’ high classification accuracy. At the R5.1–R5.3 stage, an accuracy of 100% was obtained (99.92% + 0.08%, external validation).
In the 2019–2020 crop season, during the V4–V5 stage, an overall classification success rate of 83% was achieved during the simulation and 74.19% during the external validation. In the development stages R1, R4, and R5.3, the results showed accuracies of 89.72%, 98.33%, and 99.72% (simulation), while the external validation showed accuracies of 83.13%, 90.66%, and 97.15%. According to Figure 13, the most accurate classification rates were achieved for the severe K+ deficiency treatment (SPD) in all stages of development, including the simulation stage and external validation. These rates were over 90% in V4–V5 and almost 100% accurate in R5.3. However, the moderate K+ deficiency treatment (MPD) resulted in misclassification, with rates of 3.24–5.90% in V4–V5 during the simulation and external validation. In the other stages, rates of less than 2% were obtained.
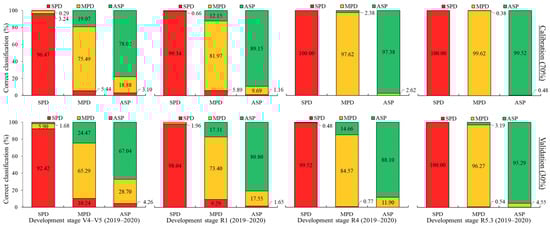
Figure 13.
LDA for 2019–2020 soybean crop season at each plant development stage evaluated. Spectral datasets: percentage of accuracy in spectral classification of each treatment (bar) in relation to all treatments (colors within bar) for calibration and validation steps.
MPD demonstrated a higher misclassification rate with the ASP compared to SPD, with values of 19.07–24.47% in V4–V5 and 12.15–17.31% in R1, during the external simulation and validation stages. However, the R4 and R5.3 stages showed the highest percentages of correct classification for this treatment, surpassing 97% (simulation) and 84% (external validation). Despite the confusion between MPD and the ASP, considering only the treatments that present nutrient deficiency (SPD + MPD), a classification accuracy above 75% in V4–V5 is observed (65.29% + 10.24%, external validation), indicating the high classification accuracy of the LDA models. At the R5.3 stage, an accuracy above 95% was obtained (96.27% + 0.54%, external validation), reaffirming the excellent results obtained for this crop season.
When all the crop seasons with similar development stages were gathered in a new dataset, the results showed values of 74.17% for V4–V5 in the simulation stage and 66.84% in the external validation stage. For R1–R2, the values were 75.61% (simulation) and 70.08% (external validation). In the R3–R4 stage, the values were 83.45% (simulation) and 76.78% (external validation). In the R5.1–R5.3 development stage, classification accuracies of 87.18% (simulation) and 83.83% (external validation) were achieved.
Regarding the classification between the treatments, Figure 14 shows that the highest classification accuracy rates were, again, obtained for the severe K+ deficiency (SPD) treatment across all development stages evaluated, both in the simulation and external validation stages, with classification accuracy values ranging between 82.69 and 97.29% (simulation) and between 75.52 and 96.19% (external validation). When confounding between treatments occurred, the greatest proportion was observed between nutrient-deficiency treatments, particularly between SPD with MPD rather than SPD and ASP. However, when assessing the classification accuracy rate for MPD, a greater confusion with the ASP treatment was observed. The worst performance was observed at V4–V5 and R1–R2.
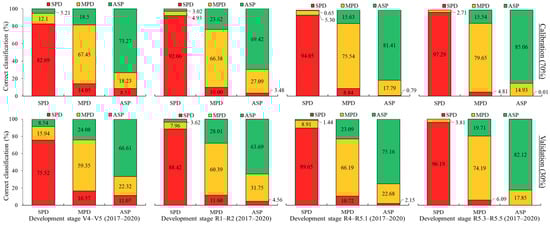
Figure 14.
LDA for 2017–2020 soybean crop seasons at each plant development stage evaluated. Spectral datasets: percentage of accuracy in spectral classification of each treatment (bar) in relation to all treatments (colors within bar) for calibration and validation steps.
As the plant development stage progressed, higher classification accuracies for the MPD treatment were noted at R3–R4, with 75.54% (simulation) and 66.19% (external validation), and R5.1–R5.3, with 79.65% (simulation) and 74.19% (external validation). A similar trend was observed for the ASP at these same stages, with it showing higher percentages of correct classification, with values of 81.41% (simulation) and 75.16% (external validation) at R3–R4, and 85.06% (simulation) and 82.12% (external validation) at R5.1–R5.3. The highest confusion rate was observed between the ASP and MPD, with values of 27.09% (simulation) and 31.75% (external validation) at R1–R2. However, it is important to mention that an accuracy greater than 75% was observed in the ASP classification at the R3–R4 and R5.1–R5.3 stages, indicating that the LDA models have a high accuracy and potential for use.
Gathering all the spectral curves of the evaluated crop seasons is expected to produce a lower LDA performance. The main reason can be explained by the different variations inherent in each crop season, such as rainfall distribution, water deficit periods, and other biotic and abiotic factors. These factors could contribute to the increased misclassification between each treatment, especially for MPD and the ASP, due to the similarity of spectral curves and non-visual symptoms of K+ deficiency for MPD. Nonetheless, the LDA proved robust enough for accurate classification, enabling the discrimination of each treatment by development stage independent of the crop season year.
Finally, the LDA for the 3.024 spectral curves separated by treatments showed a classification accuracy of 72.27% (simulation) and 68.60% (external validation), as observed in Figure 15.
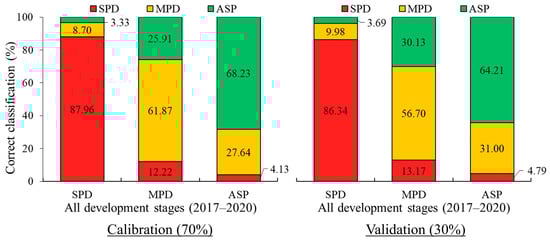
Figure 15.
LDA for 2017–2020 for all development stages and all crop seasons. Spectral datasets: percentage of accuracy in spectral classification of each treatment (bar) in relation to all treatments (colors within bar) for calibration and validation steps.
It can observed in Figure 15 that the highest classification accuracy was for the SPD treatment, with accuracy rates of 87.96% (simulation) and 86.34% (external validation). When treatment classification confusion occurred, SPD was predominantly misclassified as MPD rather than ASP. Conversely, when examining the classification accuracy and confounding rate for MPD, the lowest performance was observed. Correct classification rates of 61.87% (simulation) and 56.70% (external validation), as well as misclassification rates of 25.91% (simulation) and 30.13% (external validation) with the ASP, were obtained. For ASP, accuracies of 68.23% (simulation) and 64.21% (external validation) were obtained. Most of the ASP classification errors were with the MPD treatment, displaying values of 27.64% (simulation) and 31.00% (external validation), and there was a low rate of misclassification with SPD of 4.13% (simulation) and 4.79% (external validation).
Although the overall classification performance tended to decrease when merging spectral curves from all crops and development stages, the goal was to distinguish treatments regardless of the plant’s development stage or the year of the crop seasons. By using this approach, we demonstrated that discriminating K+ deficiency is possible.
Our results showed a larger number of wavelengths selected to compose the LDA models, showing that more variables are needed, and they were widely distributed in the Vis/NIR spectrum to distinguish the K+ deficiency. On the other hand, many variables have collinearity and non-informative properties and, therefore, they are discarded during the selection process. In general, models with a smaller number of variables are more robust in relation to models that use all the variables [16,59].
The use of Vis/NIR spectroradiometry has the advantage of being highly efficient, low-cost, and non-destructive. The differences in the numbers of wavelengths and regions selected across the different crop seasons and plant development stages show that the mathematical principles involved in minimizing the model error often led to the selection of certain regions that are not similar, exhibiting a certain degree of inconsistency during the selection process.
The extent of K+ nutritional limitation reaches areas that do not express visual symptoms of K+ deficiency in plants, leading the plants to produce “hidden hunger”, as represented by the MPD treatment. This phenomenon can occur on a large scale, especially in regions/areas where the balance of potassium fertilization is consistently negative. This can promote an increase in similarity to the spectral response of a well-nurtured plant, in this case, the ASP treatment, which can decrease the LDA accuracy in distinguishing between these two treatments.
When the LDA analysis was applied to this research, it demonstrated that the models adjusted using the selected wavelengths produced high classification accuracy rates for distinguishing the K+ deficiency treatment from the MPD and ASP treatments, as observed when gathering all the crop seasons from 2017 to 2020. In addition to that, it was possible to discriminate MPD with a successful rate ranging from 59.35% (V4–V5) to 74.19% (R5.1–R5.3) when external validation was applied. It is important to mention that the recommended foliar K+ analysis is conducted at the R2 development stage. In the earlier development stages, soybean growers do not have the tools to analyze the nutrition status, and this approach can be a feasible solution to overcome the lack of information.
As the plant development stages progressed, the accuracy rate was higher in all the crop seasons evaluated, demonstrating again the good results obtained. This can be explained by nutrient exportation to grain-filling, since intense nutrient export occurs to the reproductive organs. According to Oliveira Junior et al. [34], at the R5.3 and R5.5 stages of development occur the accumulation of 80–100% of K+ by the plant. This maximum accumulation of K+ causes symptoms to be accentuated under conditions of nutrient deficiency and strong changes in the reflectance spectrum are expected, increasing the accuracy of the models. On the other hand, Oliveira Junior et al. [34] showed that, in the early stages of development, around 10–15% of K+ is observed in soybean leaves. As a result, a lower model accuracy is expected, as plants show little or no symptoms of nutrient absence, and there is a lower nutrient variability in plants and the reflectance spectrum.
The crop season of the 2018–2019 drought conditions resulted in the lowest classification accuracy compared to the other crop seasons. It is a known fact that water stress reduces nutrient uptake by crops as transpiration decreases, and the active nutrient absorption and transport mechanisms of the roots are impaired. Additionally, water stress reduces the dry matter of the crops, which decreases the demand for nutrients. Drought stress can also affect the accumulation of mineral elements in the plant tissues by affecting the growth of roots, nutrient mobility in soil, and nutrient uptake [60,61], leading to the reflectance factors of the treatments being quite similar.
Crusiol et al. [6] conducted an in-depth discussion of soybean plants under water deficiency, showing that water content can affect the interaction of the incident light over the mesophyll cells, which can decrease the overall LDA classification accuracy.
The monitoring and early detection of plant stress are crucial for ensuring a maximum grain yield. However, few studies have extensively researched how to characterize soybean K+ deficiency using hyperspectral sensor data across several soybean crop seasons in a long-term experimental trial. Our results affirm that the methodology employed has a high potential for practical application by using portable spectrometers at ground level. Future research will involve applying these results to large areas to verify the quality and robustness of the derived LDA models over the years.
4. Conclusions
This study has confirmed that Vis/NIR spectroscopy can classify K+ deficiency in soybean plants based on their reflectance spectra. K+ deficiency was found to significantly reduce the soybean yield and foliar nutrient concentration in all the crop seasons evaluated. This led to significant changes in the reflectance spectrum within the Vis region, particularly as the K+ deficiency became more pronounced.
The stepwise procedure selected wavelengths ranging from 10 to 72 widely located in the broad Vis/NIR spectrum. The PCA explained 100% of the spectral variability in the first and second components across all the evaluated crop seasons and development stages, demonstrating a potential separation of severe deficiency in relation to the other treatments. It was possible to differentiate between SPD, MPD, and the ASP at all stages of development, but PCA clustering was more prominent in soybean plants at advanced stages.
The LDA models effectively discriminated between the treatments under study, achieving an overall accuracy rate greater than 75%. For the model’s simulation and external validation stages, accuracy rates above 70% and 59% were achieved, respectively. SPD had the highest discrimination rate in all development stages and combinations evaluated. Misclassification rates were higher in earlier development stages for MPD and the ASP but decreased when the plants reached reproductive stages.
These results demonstrate the high potential of the employed method for monitoring K+ deficiency in soybean plants. It not only ensures rapid, non-destructive assessments but also allows for extrapolation of the acquired data to new study areas, contributing to improved efficiency in the utilization of K+-based inputs and providing soybean growers with a complementary decision-making tool.
Author Contributions
Conceptualization, R.H.F.; Investigation, R.H.F. and L.G.T.C.; Software, R.H.F.; Data curation, R.H.F.; Formal analysis, R.H.F.; Methodology, R.H.F., L.G.T.C. and R.N.R.S.; writing—original draft preparation, R.H.F.; writing—review and editing, R.H.F.; Funding acquisition, M.R.N. and A.d.O.J.; Resources, M.R.N. and A.d.O.J.; Supervision, M.R.N. and A.d.O.J.; Validation, R.H.F.; Visualization, R.H.F., L.G.T.C., M.R.N., R.N.R.S. and A.d.O.J. All authors have read and agreed to the published version of the manuscript.
Funding
This study was financed by the Coordenação de Aperfeiçoamento de Pessoal de Nível Superior: 001, Brasil (CAPES), the Conselho Nacional de Desenvolvimento Científico e Tecnológico (CNPq).
Data Availability Statement
The data that support the findings of this study are available from the corresponding author R.H.F., upon reasonable request.
Acknowledgments
Thanks are due to Programa de Pós–Graduação em Agronomia (PGA–UEM) at the State University of Maringá for encouragement and supporting communication and Embrapa Soja for supporting the experimental trials and analysis.
Conflicts of Interest
Authors Luís Guilherme Teixeira Crusiol, Adilson de Oliveira Junior and Rubson Natal Ribeiro Sibaldelli were employed by the company Embrapa Soja (National Soybean Research Center—Brazilian Agricultural Research Corporation). The remaining authors declare that the research was conducted in the absence of any commercial or financial relationships that could be construed as a potential conflict of interest.
References
- Crusiol, L.G.T.; Nanni, M.R.; Furlanetto, R.H.; Sibaldelli, R.N.R.; Cezar, E.; Mertz-Henning, L.M.; Nepomuceno, A.L.; Neumaier, N.; Farias, J.R.B. UAV-Based Thermal Imaging in the Assessment of Water Status of Soybean Plants. Int. J. Remote Sens. 2020, 41, 3243–3265. [Google Scholar] [CrossRef]
- Crusiol, L.G.T.; Nanni, M.R.; Furlanetto, R.H.; Sibaldelli, R.N.R.; Cezar, E.; Sun, L.; Foloni, J.S.S.; Mertz-Henning, L.M.; Nepomuceno, A.L.; Neumaier, N.; et al. Classification of Soybean Genotypes Assessed Under Different Water Availability and at Different Phenological Stages Using Leaf-Based Hyperspectral Reflectance. Remote Sens. 2021, 13, 172. [Google Scholar] [CrossRef]
- Crusiol, L.G.T.; Sun, L.; Sibaldelli, R.N.R.; Junior, V.F.; Furlaneti, W.X.; Chen, R.; Sun, Z.; Wuyun, D.; Chen, Z.; Nanni, M.R.; et al. Strategies for Monitoring Within-Field Soybean Yield Using Sentinel-2 Vis-NIR-SWIR Spectral Bands and Machine Learning Regression Methods. Precis. Agric. 2022, 23, 1093–1123. [Google Scholar] [CrossRef]
- Crusiol, L.G.T.; Nanni, M.R.; Furlanetto, R.H.; Sibaldelli, R.N.R.; Cezar, E.; Sun, L.; Foloni, J.S.S.; Mertz-Henning, L.M.; Nepomuceno, A.L.; Neumaier, N.; et al. Yield Prediction in Soybean Crop Grown under Different Levels of Water Availability Using Reflectance Spectroscopy and Partial Least Squares Regression. Remote Sens. 2021, 13, 977. [Google Scholar] [CrossRef]
- Crusiol, L.G.T.; Nanni, M.R.; Furlanetto, R.H.; Sibaldelli, R.N.R.; Sun, L.; Gonçalves, S.L.; Foloni, J.S.S.; Mertz-Henning, L.M.; Nepomuceno, A.L.; Neumaier, N.; et al. Assessing the Sensitive Spectral Bands for Soybean Water Status Monitoring and Soil Moisture Prediction Using Leaf-Based Hyperspectral Reflectance. Agric. Water Manag. 2023, 277, 108089. [Google Scholar] [CrossRef]
- Guilherme Teixeira Crusiol, L.; Braga, P.; Rafael Nanni, M.; Furlanetto, R.H.; Sibaldelli, R.N.R.; Cezar, E.; Sun, L.; Foloni, J.S.S.; Mertz-Henning, L.M.; Lima Nepomuceno, A.; et al. Using Leaf-Based Hyperspectral Reflectance for Genotype Classification within a Soybean Germplasm Collection Assessed under Different Levels of Water Availability. Int. J. Remote Sens. 2021, 42, 8165–8184. [Google Scholar] [CrossRef]
- de Oliveira, K.M.; Furlanetto, R.H.; Rodrigues, M.; dos Santos, G.L.A.A.; Reis, A.S.; Teixeira Crusiol, L.G.; Rafael Nanni, M.; Cezar, E.; de Oliveira, R.B. Assessing Phosphorus Nutritional Status in Maize Plants Using Leaf-Based Hyperspectral Measurements and Multivariate Analysis. Int. J. Remote Sens. 2022, 43, 2560–2580. [Google Scholar] [CrossRef]
- Bandara, A.Y.; Weerasooriya, D.K.; Bradley, C.A.; Allen, T.W.; Esker, P.D. Dissecting the Economic Impact of Soybean Diseases in the United States over Two Decades. PLoS ONE 2020, 15, e0231141. [Google Scholar] [CrossRef] [PubMed]
- Chen, L.; Qi, X.; Zhang, X.; Li, Q.; Zhang, Y. Effect of Agricultural Land Use Changes on Soil Nutrient Use Efficiency in an Agricultural Area, Beijing, China. Chin. Geogr. Sci. 2011, 21, 392–402. [Google Scholar] [CrossRef]
- Esper Neto, M.; Minato, E.A.; Besen, M.R.; Inoue, T.T.; Batista, M.A. Biometric Responses of Soybean to Different Potassium Fertilization Management Practices in Years with High and Low Precipitation. Rev. Bras. Cienc. Solo 2018, 42, e0170305. [Google Scholar] [CrossRef]
- Furlanetto, R.H.; Rafael Nanni, M.; Guilherme Teixeira Crusiol, L.; Silva, G.F.C.; Junior, A.d.O.; Sibaldelli, R.N.R. Identification and Quantification of Potassium (K+) Deficiency in Maize Plants Using an Unmanned Aerial Vehicle and Visible/near-Infrared Semi-Professional Digital Camera. Int. J. Remote Sens. 2021, 42, 8783–8804. [Google Scholar] [CrossRef]
- Johnson, R.; Vishwakarma, K.; Hossen, M.d.S.; Kumar, V.; Shackira, A.M.; Puthur, J.T.; Abdi, G.; Sarraf, M.; Hasanuzzaman, M. Potassium in Plants: Growth Regulation, Signaling, and Environmental Stress Tolerance. Plant Physiol. Biochem. 2022, 172, 56–69. [Google Scholar] [CrossRef]
- Xu, Q.; Fu, H.; Zhu, B.; Hussain, H.A.; Zhang, K.; Tian, X.; Duan, M.; Xie, X.; Wang, L. Potassium Improves Drought Stress Tolerance in Plants by Affecting Root Morphology, Root Exudates, and Microbial Diversity. Metabolites 2021, 11, 131. [Google Scholar] [CrossRef] [PubMed]
- Rodrigues, M.; Cezar, E.; Abrantes dos Santos, G.L.A.; Reis, A.S.; Furlanetto, R.H.; de Oliveira, R.B.; D’Àvila, R.C.; Nanni, M.R. Estimating Technological Parameters and Stem Productivity of Sugarcane Treated with Rock Powder Using a Proximal Spectroradiometer Vis-NIR-SWIR. Ind. Crops Prod. 2022, 186, 115278. [Google Scholar] [CrossRef]
- Azadnia, R.; Rajabipour, A.; Jamshidi, B.; Omid, M. New Approach for Rapid Estimation of Leaf Nitrogen, Phosphorus, and Potassium Contents in Apple-Trees Using Vis/NIR Spectroscopy Based on Wavelength Selection Coupled with Machine Learning. Comput. Electron. Agric. 2023, 207, 107746. [Google Scholar] [CrossRef]
- Furlanetto, R.H.; Crusiol, L.G.T.; Gonçalves, J.V.F.; Nanni, M.R.; de Oliveira Junior, A.; de Oliveira, F.A.; Sibaldelli, R.N.R. Machine Learning as a Tool to Predict Potassium Concentration in Soybean Leaf Using Hyperspectral Data. Precis. Agric. 2023, 24, 2264–2292. [Google Scholar] [CrossRef]
- Siedliska, A.; Baranowski, P.; Pastuszka-Woźniak, J.; Zubik, M.; Krzyszczak, J. Identification of Plant Leaf Phosphorus Content at Different Growth Stages Based on Hyperspectral Reflectance. BMC Plant Biol. 2021, 21, 28. [Google Scholar] [CrossRef] [PubMed]
- Gitelson, A.A. Remote Estimation of Fraction of Radiation Absorbed by Photosynthetically Active Vegetation: Generic Algorithm for Maize and Soybean. Remote Sens. Lett. 2019, 10, 283–291. [Google Scholar] [CrossRef]
- Gould, K.S.; Jay-Allemand, C.; Logan, B.A.; Baissac, Y.; Bidel, L.P.R. When Are Foliar Anthocyanins Useful to Plants? Re-Evaluation of the Photoprotection Hypothesis Using Arabidopsis thaliana Mutants That Differ in Anthocyanin Accumulation. Environ. Exp. Bot. 2018, 154, 11–22. [Google Scholar] [CrossRef]
- Falcioni, R.; Gonçalves, J.V.F.; de Oliveira, K.M.; de Oliveira, C.A.; Reis, A.S.; Crusiol, L.G.T.; Furlanetto, R.H.; Antunes, W.C.; Cezar, E.; de Oliveira, R.B.; et al. Chemometric Analysis for the Prediction of Biochemical Compounds in Leaves Using UV-VIS-NIR-SWIR Hyperspectroscopy. Plants 2023, 12, 3424. [Google Scholar] [CrossRef]
- Falcioni, R.; Moriwaki, T.; Rodrigues, M.; de Oliveira, K.M.; Furlanetto, R.H.; dos Reis, A.S.; dos Santos, G.L.A.A.; Mendonça, W.A.; Crusiol, L.G.T.; Gonçalves, J.V.F.; et al. Nutrient Deficiency Lowers Photochemical and Carboxylation Efficiency in Tobacco. Theor. Exp. Plant Physiol. 2023, 35, 81–97. [Google Scholar] [CrossRef]
- Falcioni, R.; Moriwaki, T.; Pattaro, M.; Herrig Furlanetto, R.; Nanni, M.R.; Camargos Antunes, W. High Resolution Leaf Spectral Signature as a Tool for Foliar Pigment Estimation Displaying Potential for Species Differentiation. J. Plant Physiol. 2020, 249, 153161. [Google Scholar] [CrossRef]
- Gold, K.M.; Townsend, P.A.; Herrmann, I.; Gevens, A.J. Investigating Potato Late Blight Physiological Differences across Potato Cultivars with Spectroscopy and Machine Learning. Plant Sci. 2020, 295, 110316. [Google Scholar] [CrossRef] [PubMed]
- Gold, K.M.; Townsend, P.A.; Chlus, A.; Herrmann, I.; Couture, J.J.; Larson, E.R.; Gevens, A.J. Hyperspectral Measurements Enable Pre-Symptomatic Detection and Differentiation of Contrasting Physiological Effects of Late Blight and Early Blight in Potato. Remote Sens. 2020, 12, 286. [Google Scholar] [CrossRef]
- Fallon, B.; Yang, A.; Lapadat, C.; Armour, I.; Juzwik, J.; Montgomery, R.A.; Cavender-Bares, J. Spectral Differentiation of Oak Wilt from Foliar Fungal Disease and Drought Is Correlated with Physiological Changes. Tree Physiol. 2020, 40, 377–390. [Google Scholar] [CrossRef]
- Junges, A.H.; Almança, M.A.K.; Fajardo, T.V.M.; Ducati, J.R. Leaf Hyperspectral Reflectance as a Potential Tool to Detect Diseases Associated with Vineyard Decline. Trop. Plant Pathol. 2020, 45, 522–533. [Google Scholar] [CrossRef]
- Furlanetto, R.H.; Moriwaki, T.; Falcioni, R.; Pattaro, M.; Vollmann, A.; Sturion Junior, A.C.; Antunes, W.C.; Nanni, M.R. Hyperspectral Reflectance Imaging to Classify Lettuce Varieties by Optimum Selected Wavelengths and Linear Discriminant Analysis. Remote Sens. Appl. 2020, 20, 100400. [Google Scholar] [CrossRef]
- Gómez-Casero, M.T.; López-Granados, F.; Peña-Barragán, J.M.; Jurado-Expósito, M.; García-Torres, L.; Fernández-Escobar, R. Assessing Nitrogen and Potassium Deficiencies in Olive Orchards through Discriminant Analysis of Hyperspectral Data. J. Am. Soc. Hortic. Sci. 2007, 132, 611–618. [Google Scholar] [CrossRef]
- Foster, A.J.; Kakani, V.G.; Ge, J.; Gregory, M.; Mosali, J. Discriminant Analysis of Nitrogen Treatments in Switchgrass and High Biomass Sorghum Using Leaf and Canopy-Scale Reflectance Spectroscopy. Int. J. Remote Sens. 2016, 37, 2252–2279. [Google Scholar] [CrossRef]
- EMBRAPA. Tecnologias de Produção de Soja—Região Central Do Brasil—2014; Embrapa Soja: Londrina, Brazil, 2013; Volume 1. [Google Scholar]
- Muhammed, H.H. Hyperspectral Crop Reflectance Data for Characterising and Estimating Fungal Disease Severity in Wheat. Biosyst. Eng. 2005, 91, 9–20. [Google Scholar] [CrossRef]
- Muhammed, H.H. Using Hyperspectral Reflectance Data for Discrimination between Healthy and Diseased Plants, and Determination of Damage-Level in Diseased Plants. In Proceedings of the 2002 Applied Imagery Pattern Recognition Workshop, Washington, DC, USA, 16–18 October 2002; pp. 49–54. [Google Scholar]
- Farias, J.R.B.; Nepomuceno, A.L.; Neumaier, N. Ecofisiologia Da Soja; Embrapa Soja: Londrina, Brazil, 2007. [Google Scholar]
- Oliveira Junior, A.D.; Castro, C.D.; Pereira, L.R.; Domingos, C.D.S. Estádios Fenológicos e Marcha de Absorção de Nutrientes Da Soja; Embrapa: Londrina, Brazil, 2016. [Google Scholar]
- EMBRAPA. Manual de Análises Químicas de Solos, Plantas e Fertilizantes; Embrapa Solos: Brasilia, Brazil, 2009; Volume 1. [Google Scholar]
- Lletí, R.; Meléndez, E.; Ortiz, M.C.; Sarabia, L.A.; Sánchez, M.S. Outliers in Partial Least Squares Regression. Anal. Chim. Acta 2005, 544, 60–70. [Google Scholar] [CrossRef]
- Varmuza, K.; Filzmoser, P. Introduction to Multivariate Statistical Analysis in Chemometrics; CRC Press: Boca Raton, FL, USA, 2016; ISBN 9780429145049. [Google Scholar]
- Tharwat, A.; Gaber, T.; Ibrahim, A.; Hassanien, A.E. Linear Discriminant Analysis: A Detailed Tutorial. AI Commun. 2017, 30, 169–190. [Google Scholar] [CrossRef]
- Izenman, A.J. Linear Discriminant Analysis; Springer: Berlin/Heidelberg, Germany, 2013; pp. 237–280. [Google Scholar]
- Sociedade Brasileira de Ciencia do Solo. Manual de Adubação e Calagem Para o Estado Do Paraná Curitiba; Sociedade Brasileira de Ciência do Solo—Núcleo Estadual Paraná: Estadual Paraná, Brazil, 2017; p. 482. ISBN 978-85-69416-07-0. [Google Scholar]
- Pelleschi, S.; Rocher, J.P.; Prioul, J.L. Effect of Water Restriction on Carbohydrate Metabolism and Photosynthesis in Mature Maize Leaves. Plant Cell Environ. 1997, 20, 493–503. [Google Scholar] [CrossRef]
- Kim, J.-Y.; Mahé, A.; Brangeon, J.; Prioul, J.-L. A Maize Vacuolar Invertase, IVR 2, Is Induced by Water Stress. Organ/Tissue Specificity and Diurnal Modulation of Expression. Plant Physiol. 2000, 124, 71–84. [Google Scholar] [CrossRef] [PubMed]
- Sentelhas, P.C.; Battisti, R.; Câmara, G.M.S.; Farias, J.R.B.; Hampf, A.C.; Nendel, C. The Soybean Yield Gap in Brazil—Magnitude, Causes and Possible Solutions for Sustainable Production. J. Agric. Sci. 2015, 153, 1394–1411. [Google Scholar] [CrossRef]
- Pattaro, M.C.; Falcioni, R.; Moriwaki, T.; Corrêa Alves, D.; Antunes, W.C. Blue Light Strongly Promotes De-Etiolation over Green, Moderate over Red, but Have Limited Action over Far-Red Lights in Lettuce Plants. Sci. Hortic. 2024, 328, 112863. [Google Scholar] [CrossRef]
- Moriwaki, T.; Falcioni, R.; Tanaka, F.A.O.; Cardoso, K.A.K.; Souza, L.A.; Benedito, E.; Nanni, M.R.; Bonato, C.M.; Antunes, W.C. Nitrogen-Improved Photosynthesis Quantum Yield Is Driven by Increased Thylakoid Density, Enhancing Green Light Absorption. Plant Sci. 2019, 278, 1–11. [Google Scholar] [CrossRef] [PubMed]
- Zhao, X.; Du, Q.; Zhao, Y.; Wang, H.; Li, Y.; Wang, X.; Yu, H. Effects of Different Potassium Stress on Leaf Photosynthesis and Chlorophyll Fluorescence in Maize (Zea mays L.) at Seedling Stage. Agric. Sci. 2016, 7, 44–53. [Google Scholar] [CrossRef]
- Zhao, D.; Oosterhuis, D.M.; Bednarz, C.W. Influence of Potassium Deficiency on Photosynthesis, Chlorophyll Content, and Chloroplast Ultrastructure of Cotton Plants. Photosynthetica 2001, 39, 103–109. [Google Scholar] [CrossRef]
- Ayala-Silva, T.; Beyl, C.A. Changes in Spectral Reflectance of Wheat Leaves in Response to Specific Macronutrient Deficiency. Adv. Space Res. 2005, 35, 305–317. [Google Scholar] [CrossRef]
- Lu, J.; Yang, T.; Su, X.; Qi, H.; Yao, X.; Cheng, T.; Zhu, Y.; Cao, W.; Tian, Y. Monitoring Leaf Potassium Content Using Hyperspectral Vegetation Indices in Rice Leaves. Precis. Agric. 2020, 21, 324–348. [Google Scholar] [CrossRef]
- de Oliveira, L.F.R.; Santana, R.C. Estimation of Leaf Nutrient Concentration from Hyperspectral Reflectance in Eucalyptus Using Partial Least Squares Regression. Sci. Agric. 2020, 77, e20180409. [Google Scholar] [CrossRef]
- Kumar, L.; Schmidt, K.; Dury, S.; Skidmore, A. Imaging Spectrometry and Vegetation Science; Springer: Berlin/Heidelberg, Germany, 2002; pp. 111–155. [Google Scholar]
- Mutanga, O.; Skidmore, A.K.; Prins, H.H.T. Predicting in Situ Pasture Quality in the Kruger National Park, South Africa, Using Continuum-Removed Absorption Features. Remote Sens. Environ. 2004, 89, 393–408. [Google Scholar] [CrossRef]
- Tewari, R.K.; Kumar, P.; Sharma, P.N. Oxidative Stress and Antioxidant Responses in Young Leaves of Mulberry Plants Grown Under Nitrogen, Phosphorus or Potassium Deficiency. J. Integr. Plant Biol. 2007, 49, 313–322. [Google Scholar] [CrossRef]
- Wang, M.; Zheng, Q.; Shen, Q.; Guo, S. The Critical Role of Potassium in Plant Stress Response. Int. J. Mol. Sci. 2013, 14, 7370–7390. [Google Scholar] [CrossRef] [PubMed]
- Watson, M.B.; Malmberg, R.L. Regulation of Arabidopsis thaliana (L.) Heynh Arginine Decarboxylase by Potassium Deficiency Stress. Plant Physiol. 1996, 111, 1077–1083. [Google Scholar] [CrossRef] [PubMed]
- Globe, D. The Benefits of the 8 Spectral Bands of WorldView-2; Digital Globe: Online, 2009; Volume 12, Available online: https://www.yumpu.com/en/document/read/10428472/the-benefits-of-the-8-spectral-bands-of-worldview-2-digitalglobe (accessed on 22 March 2024).
- Maimaitiyiming, M.; Ghulam, A.; Bozzolo, A.; Wilkins, J.L.; Kwasniewski, M.T. Early Detection of Plant Physiological Responses to Different Levels of Water Stress Using Reflectance Spectroscopy. Remote Sens. 2017, 9, 745. [Google Scholar] [CrossRef]
- Furlanetto, R.H.; Nanni, M.R.; Mizuno, M.S.; Crusiol, L.G.T.; da Silva, C.R. Identification and Classification of Asian Soybean Rust Using Leaf-Based Hyperspectral Reflectance. Int. J. Remote Sens. 2021, 42, 4177–4198. [Google Scholar] [CrossRef]
- Wang, Y.; Jiang, F.; Gupta, B.B.; Rho, S.; Liu, Q.; Hou, H.; Jing, D.; Shen, W. Variable Selection and Optimization in Rapid Detection of Soybean Straw Biomass Based on CARS. IEEE Access 2018, 6, 5290–5299. [Google Scholar] [CrossRef]
- Tanguilig, V.C.; Yambao, E.B.; O’toole, J.C.; De Datta, S.K. Water Stress Effects on Leaf Elongation, Leaf Water Potential, Transpiration, and Nutrient Uptake of Rice, Maize, and Soybean. Plant Soil. 1987, 103, 155–168. [Google Scholar] [CrossRef]
- Samarah, N.; Mullen, R.; Cianzio, S. Size Distribution and Mineral Nutrients of Soybean Seeds in Response to Drought Stress. J. Plant Nutr. 2004, 27, 815–835. [Google Scholar] [CrossRef]
Disclaimer/Publisher’s Note: The statements, opinions and data contained in all publications are solely those of the individual author(s) and contributor(s) and not of MDPI and/or the editor(s). MDPI and/or the editor(s) disclaim responsibility for any injury to people or property resulting from any ideas, methods, instructions or products referred to in the content. |
© 2024 by the authors. Licensee MDPI, Basel, Switzerland. This article is an open access article distributed under the terms and conditions of the Creative Commons Attribution (CC BY) license (https://creativecommons.org/licenses/by/4.0/).