Article

Mapping Plant Nitrogen Concentration and Aboveground Biomass of Potato Crops from Sentinel-2 Data Using Ensemble Learning Models

1
Inner Mongolia Key Laboratory of Soil Quality and Nutrient Resource, College of Grassland, Resources and Environment, Inner Mongolia Agricultural University, Hohhot 010011, China
2
Department Life Science Engineering, School of Life Sciences, Technical University of Munich, 85354 Freising, Germany
*
Author to whom correspondence should be addressed.
Remote Sens. 2024, 16(2), 349; https://doi.org/10.3390/rs16020349
Submission received: 13 November 2023 / Revised: 25 December 2023 / Accepted: 5 January 2024 / Published: 16 January 2024
(This article belongs to the Special Issue Remote Sensing for Crop Nutrients and Related Traits)

Abstract

:
Excessive nitrogen (N) fertilization poses environmental risks at regional and global levels. Satellite remote sensing provides a novel approach for large-scale N monitoring. In this study, we evaluated the performance of different types of spectral bands and indices (SIs) coupled with ensemble learning models (ELMs) at retrieving the plant N concentration (PNC) and plant aboveground biomass (AGB) of potato from Sentinel-2 images. Cloud-free Sentinel-2 imagery was acquired during the tuber-formation to starch-accumulation stages from 2020 to 2021. Fourteen optimal SIs were selected using the successive projections algorithm (SPA) and principal component analysis (PCA). The PNC and AGB estimation models were then built using an ELMs. The results showed that the SIs based on chlorophyll absorption bands were strongly related to potato PNC and AGB. Also, the N-correlated bands were mainly concentrated in the red-edge (705 nm) and short-wave infrared (1610 and 2190 nm) regions. The ELMs successfully predicted PNC and AGB (R2PNC = 0.74; R2AGB = 0.82). Compared with the other five base models (k-nearest neighbor (KNN), partial least squares regression (PLSR), support vector regression (SVR), random forest (RF), and Gaussian process regression (GPR)), the ELMs provided higher PNC and AGB estimation accuracy and effectively reduced overfitting to training data. This study demonstrated that the promising solution of using SPA-PCA coupled with an ensemble learning model improves the estimation accuracy of potato PNC and AGB based on Sentinel-2 imagery data.

1. Introduction

Nitrogen (N) is essential for higher levels of photosynthetic and plant productivity. Large amounts of N fertilizer are applied to fields to maintain high yields [1,2,3]. However, soil with excessive nitrogen can lead to significant environmental problems such as nitrogen gasification, leaching, and runoff [4,5]. Plant N concentration (PNC) and aboveground biomass (AGB) information play crucial roles in determining the N nutrition index (NNI) and guiding N fertilization management [6,7]. In addition, PNC and AGB reflect the growing condition of crops and can effectively reflect the final yield. Therefore, the accurate and rapid acquisition of PNC and AGB is essential for optimal management and yield forecasting at regional and global scales [8].
Satellite remote sensing is a highly effective approach for predicting PNC and AGB at both field and regional scales. The predominant technique involves utilizing spectral indices (SIs) to retrieve crucial crop variables [9,10,11]. However, broad-band SIs can lose their sensitivity as a result of proportionally extensive soil backgrounds or large biomass [12,13]. Therefore, several SIs have been suggested for estimating crop parameters using satellite data, such as the Optimized Soil-Adjusted Vegetation Index (OSAVI) and the Transformed Chlorophyll Absorption Reflectance Index (TCARI) [13,14]. Moreover, Sentinel-2 imagery comprises three red-edge bands, enabling the effective prediction of crop PNC and AGB [15,16]. Some studies have demonstrated that SIs including the red-edge region improved the estimation accuracy of plant parameters [17,18]. Gitelson [19] developed the red-edge chlorophyll index (CIrededge), which effectively predicted the chlorophyll content of corn and soybeans. However, despite 13 bands of Sentinel-2 imagery, few studies analyze which types of SIs and which combination of bands better predict potato PNC and AGB.
Unlike SIs, machine learning algorithms (MLAs) estimate crop parameters through explicit regression functions and can effectively explore optical data [4,20]. Therefore, many studies have combined SIs with MLAs to enhance the accuracy of crop PNC and AGB estimation [21,22]. However, the potential multicollinearity among SIs still impacts the estimation performance of MLAs [23]. To solve this problem, many dimensionality reduction methods have been proposed [24,25]. One is the feature extraction method, which transforms the original features into spaces, enabling the resulting low-dimensional features to encompass most information, as exemplified by techniques such as principal component analysis (PCA) [25]. However, the data from all principal components (PCs) are less clear than the original information. Another method involves feature selection, where a subset of features is chosen to retain the essential information from the original features, such as the successive projections algorithm (SPA) [26]. Therefore, in this study, we conjecture that combining two dimensionality reduction methods can further reduce the effect of multicollinearity.
Currently, many SIs have been employed to predict crop parameters at large scales. In addition, Sentinel-2 imagery, which involves three red-edge bands, has been widely used to estimate plant parameters. However, only limited research work has explored the potential of multiple types of SIs and different combinations of bands based on Sentinel-2 imagery for potato PNC and AGB estimation. Therefore, the objectives of this study were as follows: (1) to identify sensitive bands for predicting PNC and AGB and determining quantitative relationships between PNC and AGB and different types of SIs; (2) to evaluate different types of SIs for estimating potato PNC and AGB with different models (KNN, PLSR, SVR, RF, GPR, and ELM) and explore the performance of different methods (SPA, PCA, and SPA-PCA) at PNC and AGB estimation; and (3) map the spatial–temporal variability of potato PNC and AGB at different growth stages and validate prediction map accuracy.

2. Materials and Methods

2.1. Experimental Design

The study was conducted in Zhuozi and Wuchuan counties in the central region of Inner Mongolia, China, from June to September (Figure 1). The potato growing season is mainly concentrated from June to September. The average annual precipitation is approximately 350 mm, 90–95% of which occurs from April to October. Throughout potato growth, average temperature ranges from 20 to 25 °C.
Two potato varieties, Yingniweite and 226, were used under different N fertilizer treatments. Forty-four plots were planted with an area of 120 m2. Experiment 1 had five N levels: three optimized N fertilization application algorithms proposed by Sripada [27,28], Holland [29,30], and van Evert [31]; a N fertilizer optimization algorithm based on N balance combined with spectral indices; and local farmers’ practices at 198, 204, 264, 313, and 373 kg N ha−1, respectively. Each treatment had four replicates. Experiment 2 had six N levels: (i) control (no N was applied); (ii) integrated management-based N fertilizer application algorithm at 60 kg N ha−1; (iii) soil-test-based N fertilizer application algorithm at 80 kg N ha−1; (iv) spectral-index-based N fertilizer optimization algorithm at 151 kg N ha−1; (v) N-balance-based N fertilizer optimization algorithm at 238 kg N ha−1; and (vi) local farmers’ practice at 325 kg N ha−1. There were four replicates for each treatment. Drip irrigation was applied in both experiments.

2.2. Plant Nitrogen Concentration and Aboveground Biomass Measurements

Plant samplings were taken on 19 July 2020, 10 August 2020, 20 August 2020, 23 July 2021, 12 August 2021, and 29 August 2021, which corresponded to periods of potato tuber formation (T1), tuber bulking (T2), and starch accumulation (T3), respectively. Potato requires large amounts of N nutrients to meet the demand of tuber formation and bulking during the tuber-formation and tuber-bulking stages [32,33]. In addition, precise monitoring of PNC and AGB during the starch-accumulation stages can ensure the rational application of N fertilizer at the late reproductive growth stages. Therefore, the accurate monitoring of PNC and AGB for the three critical growth stages is very important. The aboveground plants of two 1 m consecutive rows of potato of each test plot were sampled. The sample was chopped and mixed, and a 400–600 g sample was taken. The samples were dried at 70 °C and subsequently weighed and chemically analyzed. The Kjeldahl-N method was used to measure the potato PNC. AGB can be computed using the following Equation (1). Samples obtained from each plot were used to represent the changes in potato PNC and AGB for each test plot. PNC and AGB are summarized in Table 1.
A G B t   h a 1 = F W 1 + M / 1.8 × 10000
where FW is the fresh weight of all the aboveground plants (kg) and M is the water content of potato plants (%).

2.3. Sentinel-2 Images Acquisition

Sentinel-2A images of the potato crops acquired on 14 July 2020, 3 August 2020, 16 August 2020, 19 July 2021, 13 August 2021, and 31 August 2021 were utilized. Clouds did not cover the Sentinel-2 images on these dates. The Sentinel-2A level product was acquired from the ESA’s Copernicus. The center positions and spatial resolutions of all bands from the Sentinel-2 images are summarized in Table 2. All bands were resampled to 10 m spatial resolution using the resampling tool in the Sentinel Applications Platform (SNAP) software 9.0 and the nearest method. This study utilized ten bands (490, 560, 665, 705, 740, 783, 842, 865, 1610, and 2190 nm) from the Sentinel-2 images. The other three bands (443, 945, and 1375 nm) are used for image atmospheric correction, so they were not used in this study. The coordinates of each test plot were imported from the Sentinel-2 images, and then the average reflectance of each test plot was extracted using the region of interest (ROI) tool in ENVI 5.6 software for subsequent data analysis.

2.4. Spectral Indices Calculation

Spectral indices (SIs) have been widely used to estimate plants’ critical parameters. To evaluate the performance of SIs in retrieving potato PNC and AGB, 14 SIs commonly used in the literature to predict crop PNC and AGB were selected in this study (Table 3). SIs are divided into several categories based on type of application, such as chlorophyll content, nitrogen concentration, vegetation, and biomass. The bands of published spectral indices (Table 3) may not apply to predicting potato crop PNC and AGB due to differences in crop species and growth stages [34,35]. Therefore, in this study, we optimized the sensitive bands based on the formulas of published spectral indices. According to the formulas in Table 3, we combined all bands of Sentinel-2 for calculation, thus re-selecting the optimal bands for each published spectral index.

2.5. SPA and PCA

The multicollinearity among the input variables significantly affected the accuracy of the crop parameter prediction model. In this study, the SPA and PCA were used to reduce the dimensionality of input variables. The SPA is a mathematical technique used for dimensionality reduction and feature extraction that operates by projecting high-dimensional data onto a lower-dimensional space while preserving specific properties or structures of the original data. PCA is a statistical technique employed for dimensionality reduction and data transformation. It identifies the principal components or axes along which the data varies the most. These principal components are orthogonal, and the transformation results in a new set of uncorrelated variables called main components. PCA is widely used in various fields to simplify data while retaining essential information, making it a powerful tool for exploratory data analysis and feature extraction. The SPA combined with PCA was also employed in this study to reduce the dimensionality of the input variables. For a detailed description of the SPA and PCA according to Fan [45] and Howley [46] see their respective studies.

2.6. Machine Learning Model Construction

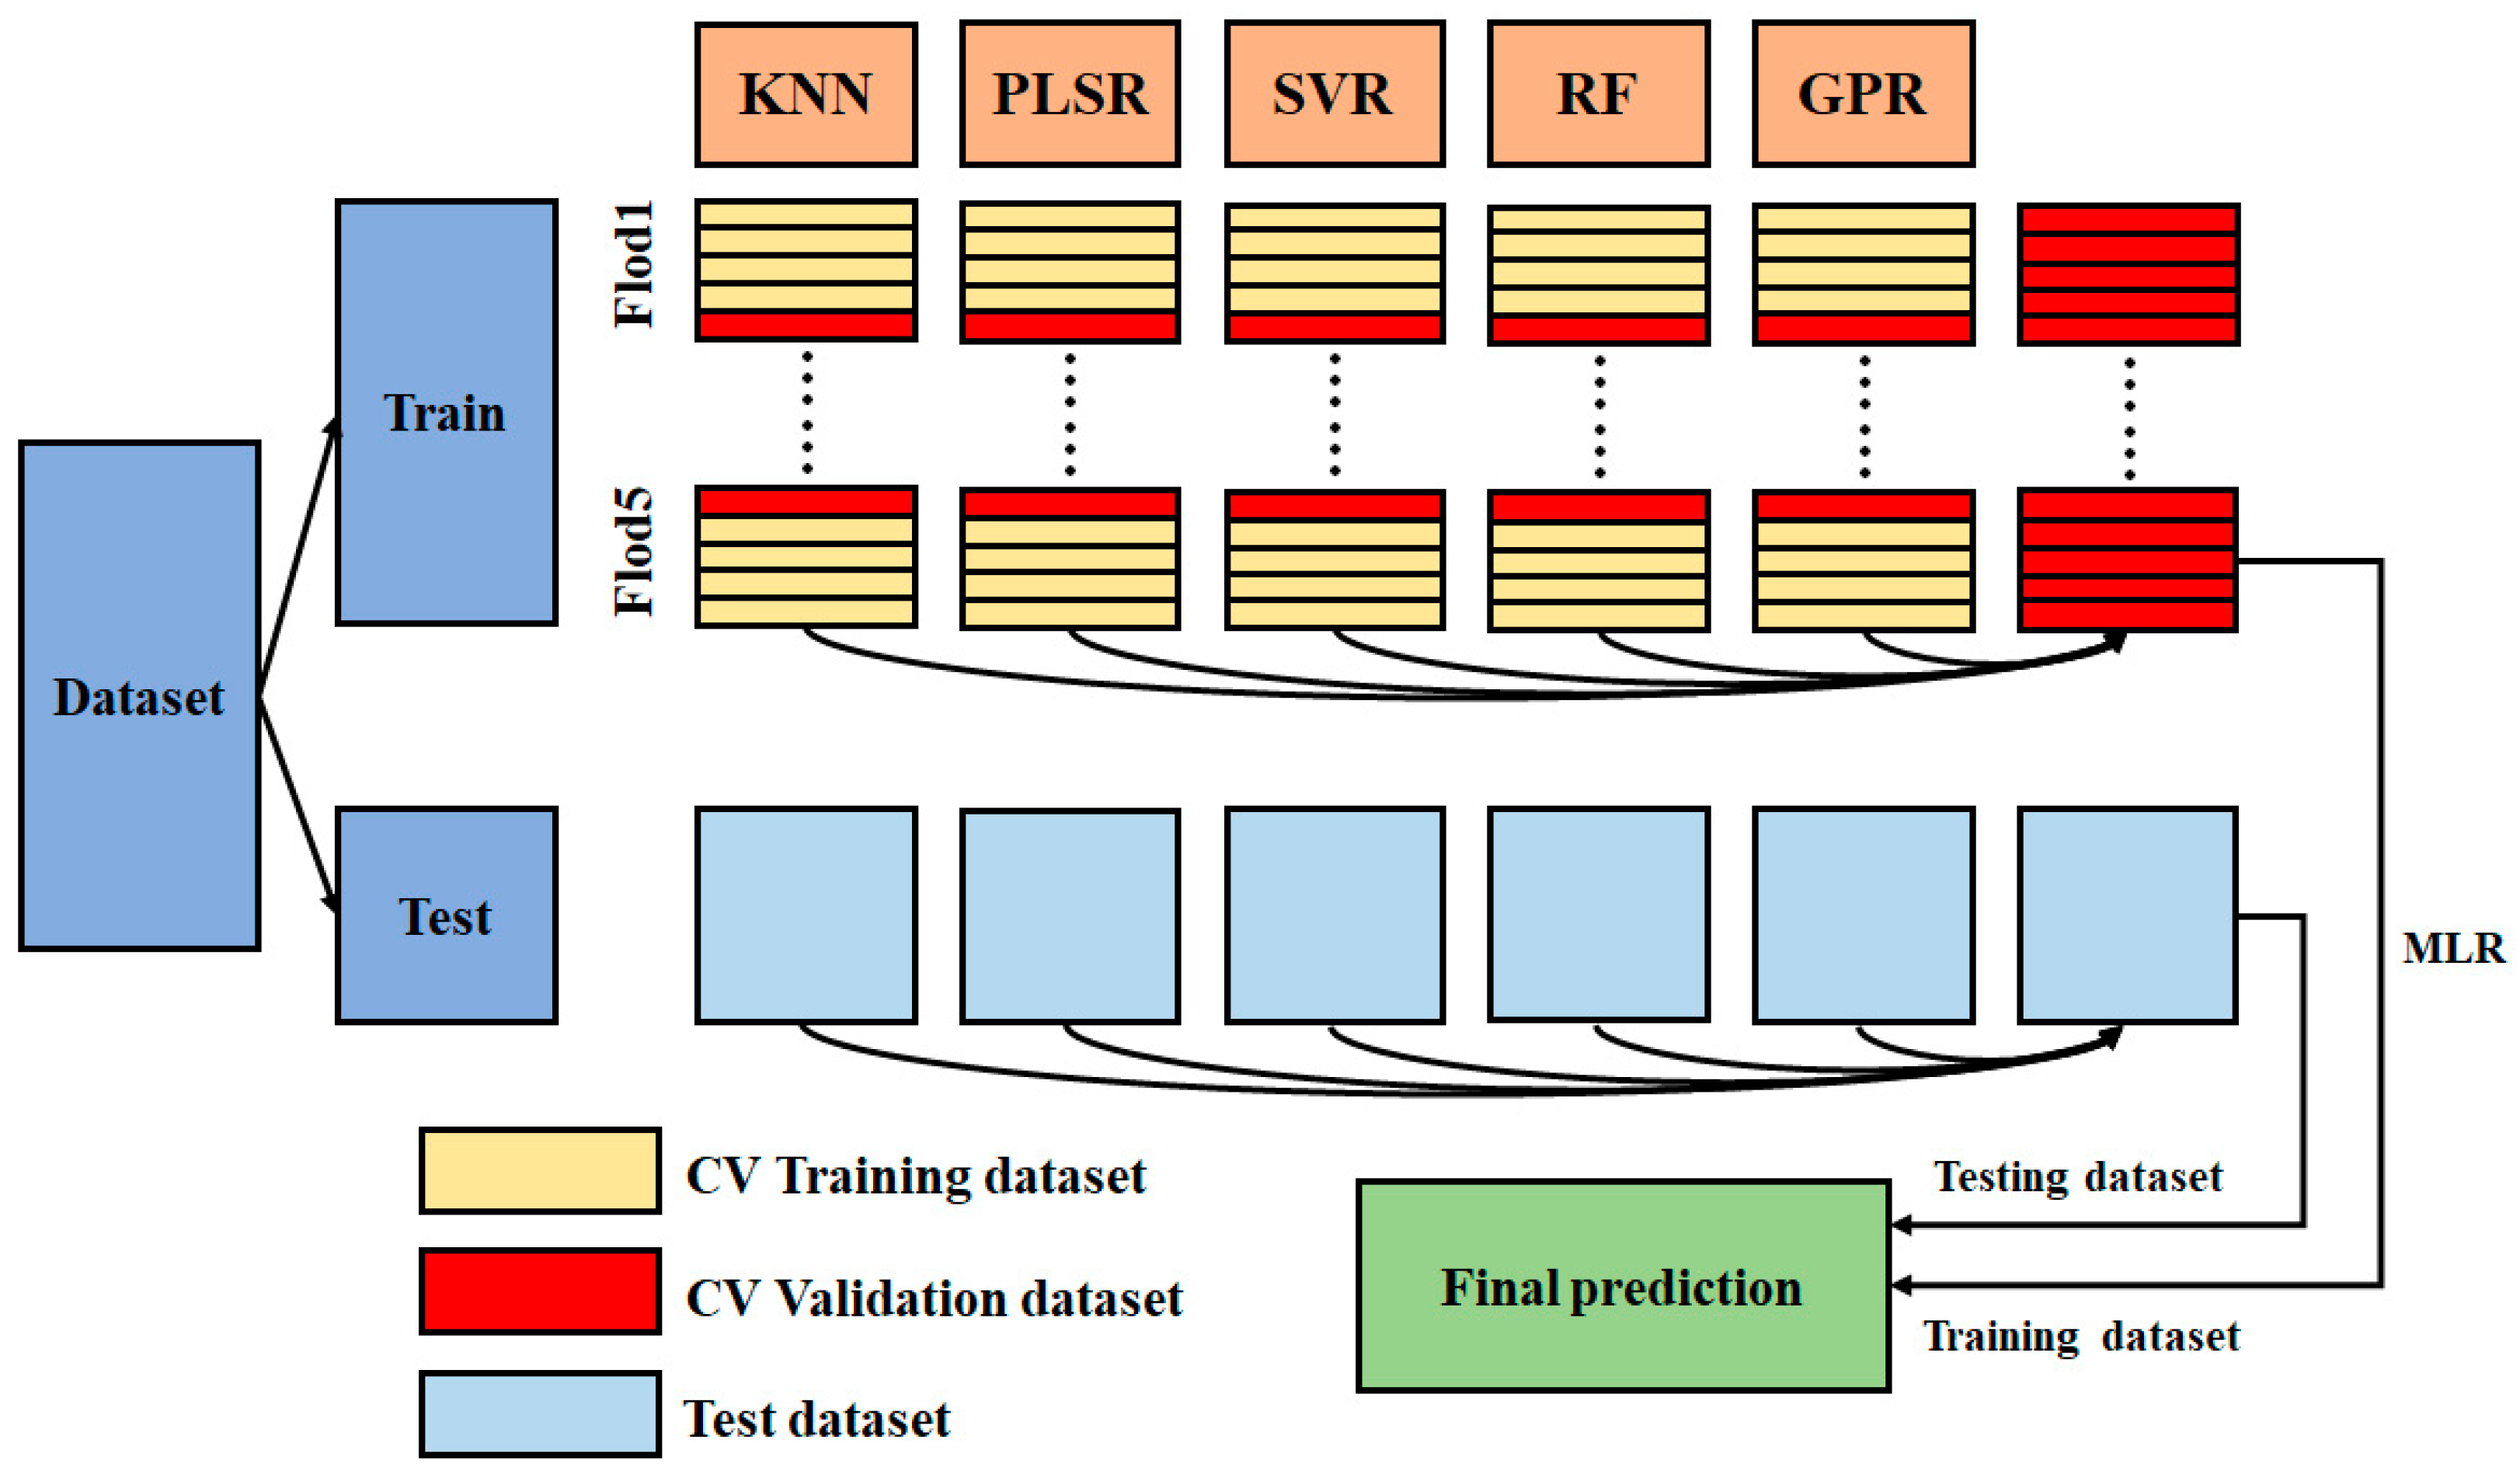
The three main types of ensemble learning include bagging, boosting, and stacking. Both bagging and boosting, such as random forest (RF) and extreme gradient boosting (XGBoost), are homogeneous learners. Unlike RF and XGBoost, stacking integrates different learners. The stacking ensemble learning that is widely used in regression prediction research generally includes two levels. The essential learners consist of multiple machine learning models that generate meta-feature datasets by learning the original datasets, and the meta-learner produces the final result by learning the meta-feature datasets [47]. This is because 5-fold cross-validation is commonly applied at two levels to ensure a fair and comprehensive comparison of different models and their input variables. In this study, therefore, the essential learners included the k-nearest neighbor (KNN) [48], partial least squares regression (PLSR) [49] to support vector regression (SVR) [50], random forest (RF) [34], and Gaussian process regression (GPR) [51]. At the same time, the new model used multiple linear regression (MLR). The ensemble learning model was performed using the “StackingRegressor” library in Python 10.3. The procedures are shown in Figure 2. In addition, this study compared the prediction effects of the three ensemble strategies (RF, XGBoost, and stacking model) for potato PNC and AGB [52].

2.7. Model Performance Evaluation

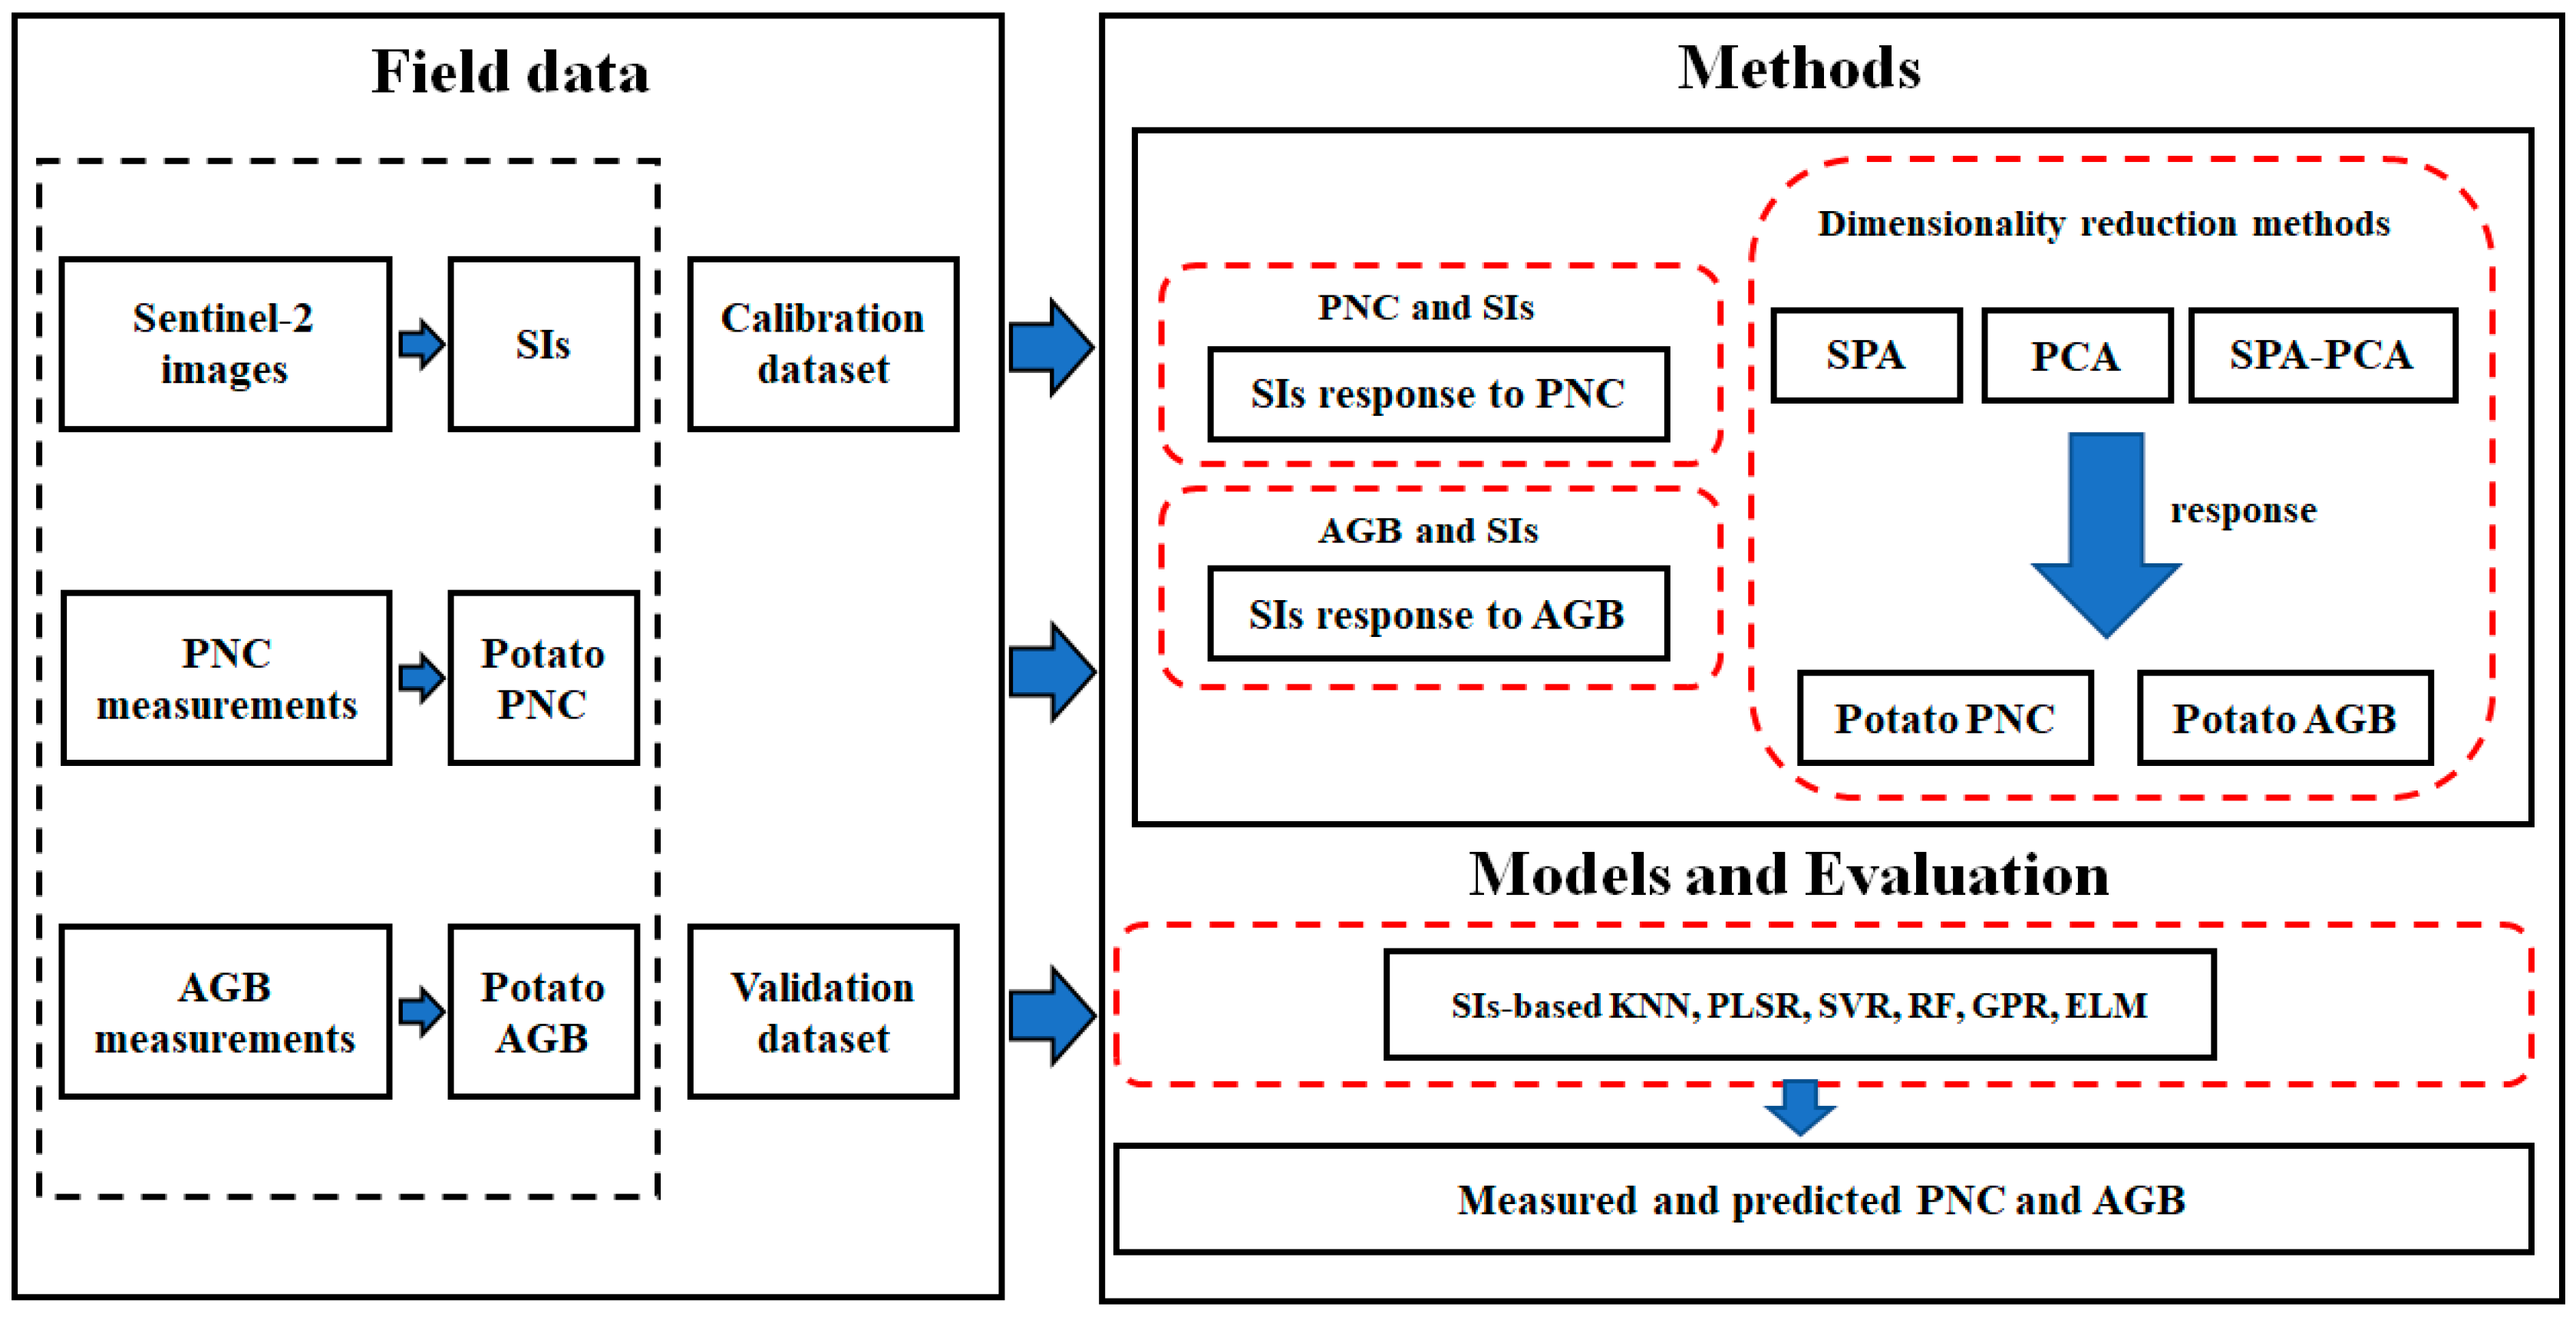
The workflow of the present study is shown in Figure 3. Three accuracy assessment metrics—coefficient of determination (R2), root mean square error (RMSE), and the ratio of performance to deviation (RPD)—were employed to evaluate the performance of all models.
R 2 = ( y i y ¯ ) 2 / ( y i y i ^ ) 2
R M S E = 1 n i = 1 n ( y i y i ^ ) 2
R P D = S D R M S E
where y i ^ , y i , and y ¯ are the measured, predicted, and mean values of PNC and AGB, respectively, n is the number of samples, and SD is the standard deviation of the reference values.
Lin’s concordance correlation coefficient (LCCC) quantifies the deviation of the predicted values from a unity line (1:1), representing the extent to which the predictions align with a concordance line of slope 1.0 through the origin. It serves as a measure of the agreement between the predicted and observed outcomes [53]. The LCCC was calculated as per the following equation:
L C C C = 2 p a x a y a x 2 + a y 2 + b x b y 2
where bx and by are the measured and predicted PNC means, respectively; a x 2 and a y 2 are the variances of measured and predicted PNC and AGB; and p is the Pearson correlation coefficient between measured and predicted PNC and AGB.

3. Results

3.1. Correlation Analysis of SIs and PNC and AGB

According to Table 3, all possible band combinations were used to analyze the Sentinel-2 bands using the training dataset. The best-performing bands per formulation are listed in Table 4. The optimal sensitive bands were different between PNC and AGB. For PNC, sensitive bands were obtained in the RE (705 nm), NIR (865 nm), and SWIR (1610 and 2190 nm) regions. For AGB, sensitive bands were obtained in the visible light regions (490 and 560 nm), and NIR (842 nm), and SWIR regions (1610 and 2190 nm) (Table 4).
To determine the relationship between PNC and AGB and spectral indices, these two variables were correlated with SIs (Table 4). Most SIs were positively related to PNC and AGB. Compared to other types of SIs, SIs based on chlorophyll content were strongly correlated to the PNC and AGB of potato. The coefficient of determination (R2) between PNC, AGB and the SIs was more significant than 0.6 and 0.5, respectively (Table 4).

3.2. Estimation of Potato PNC and AGB Using Different Machine Learning Models

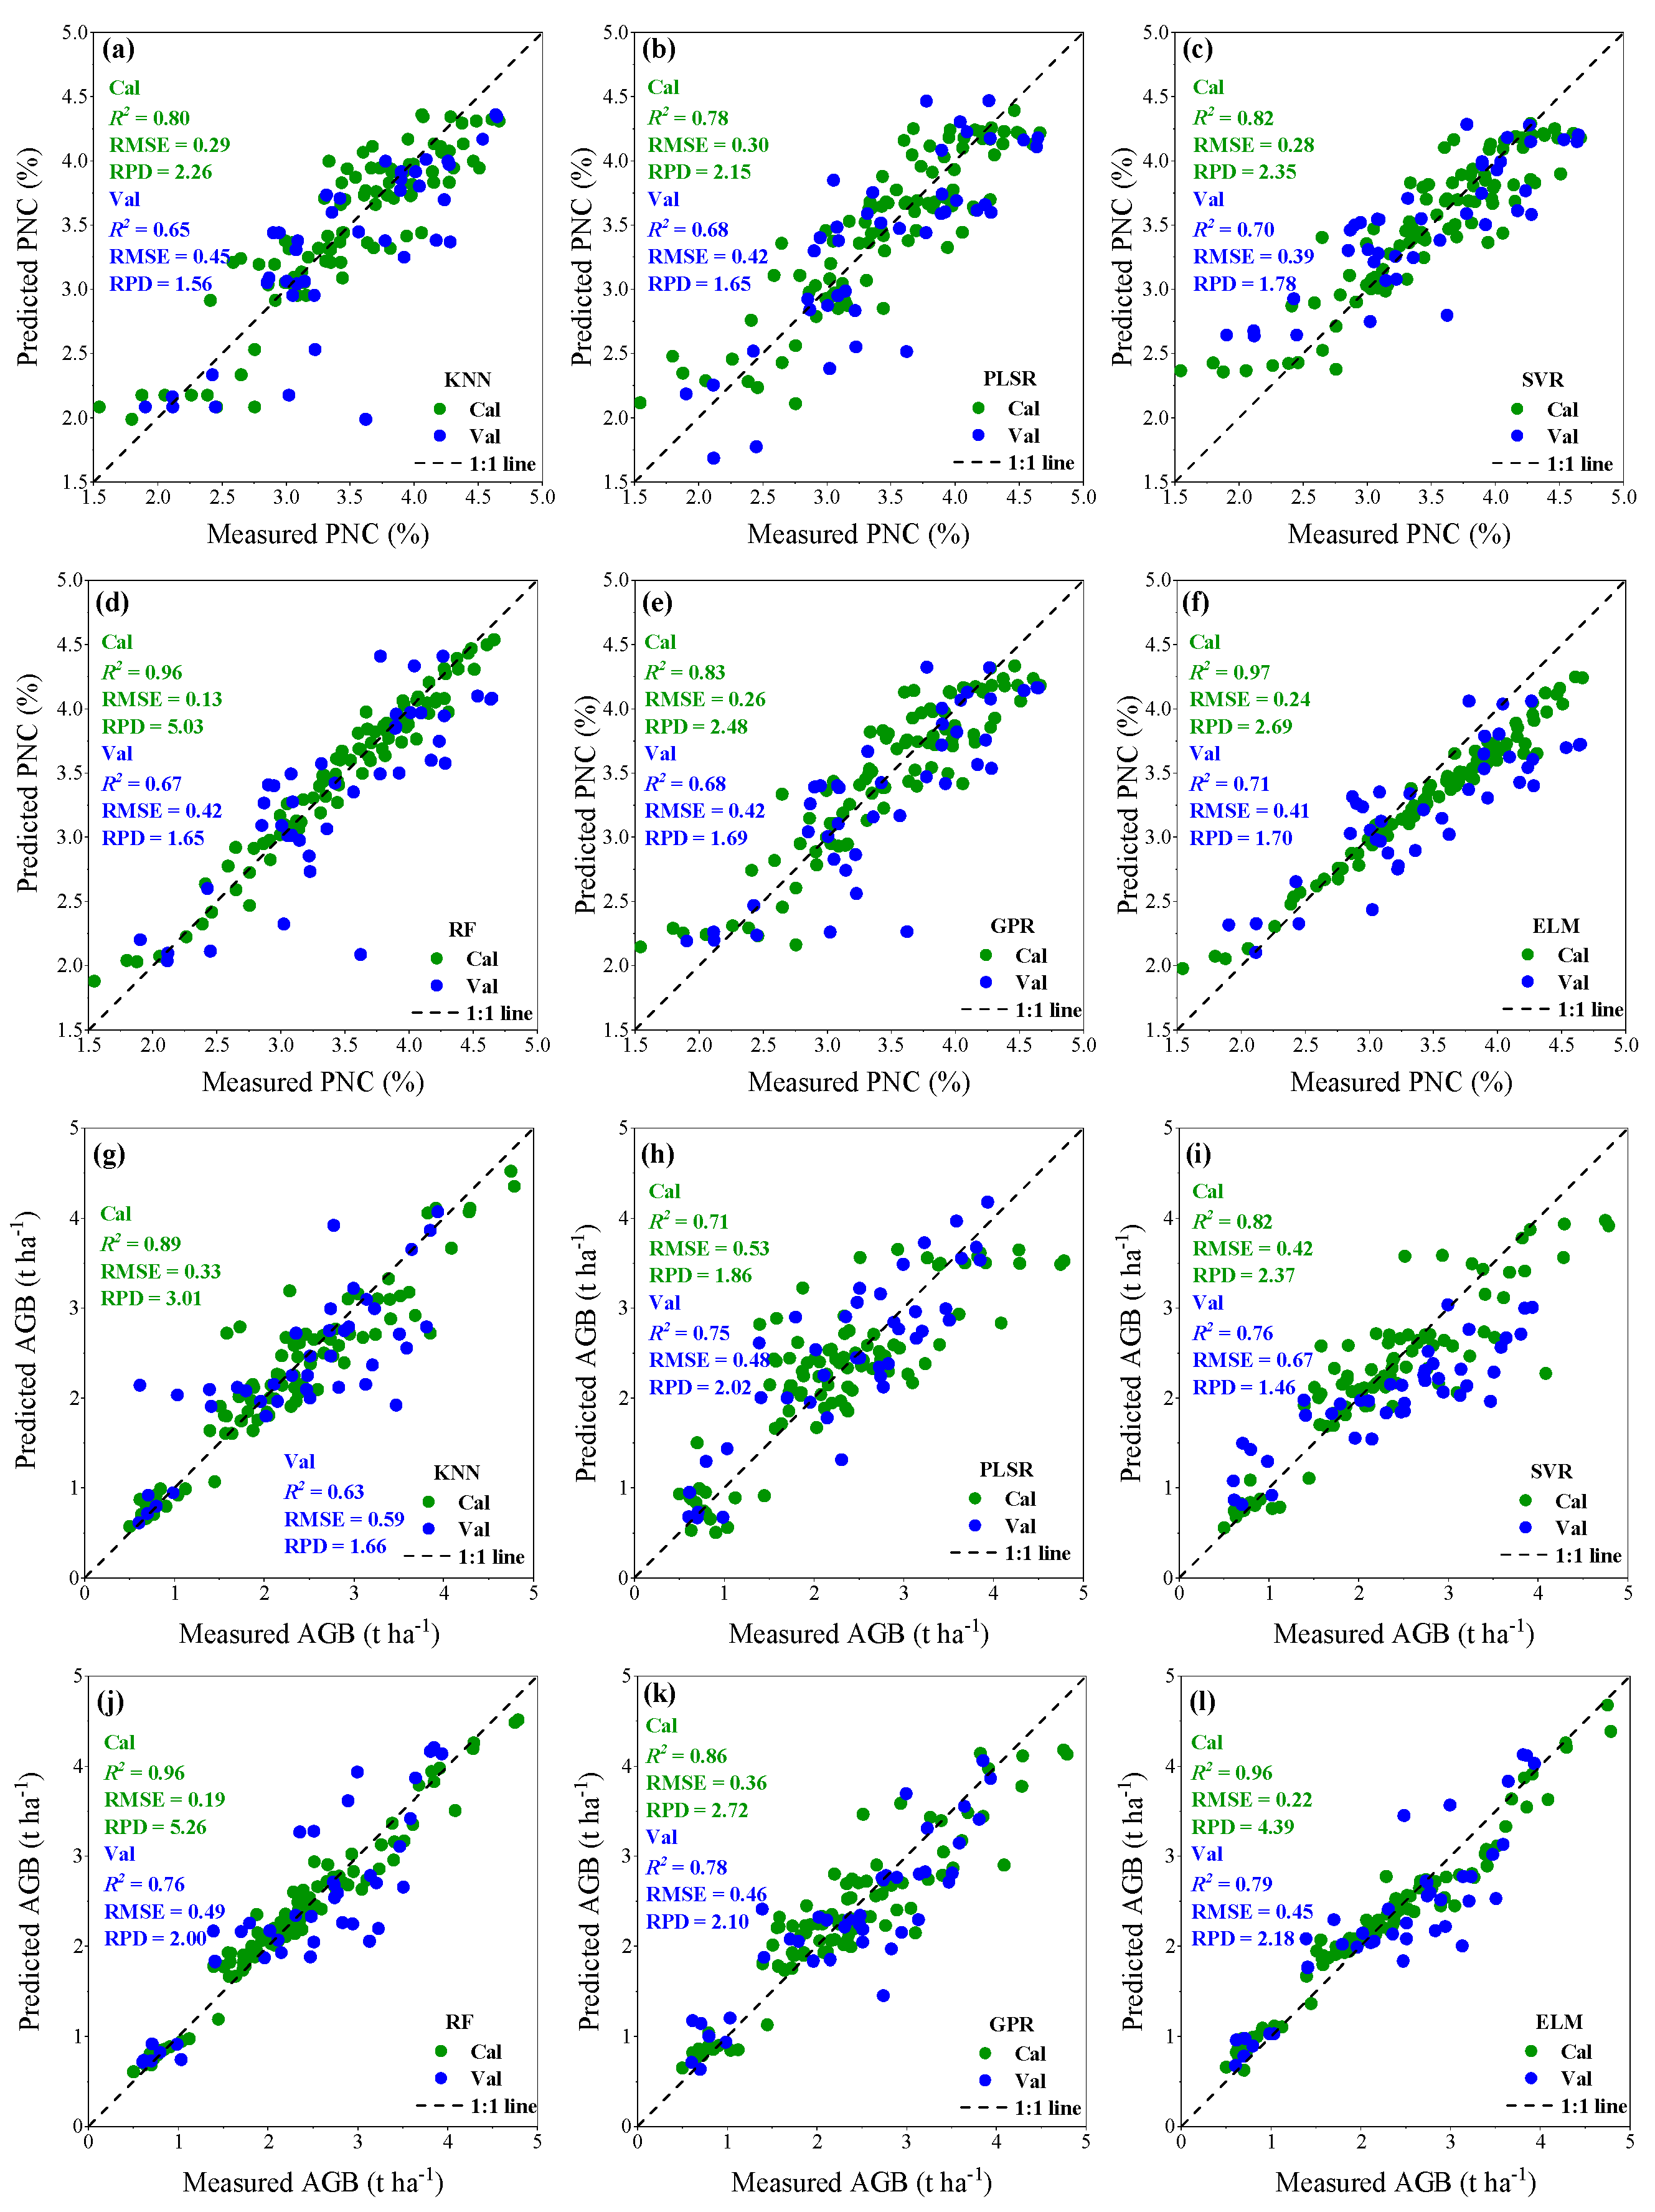
Figure 4 shows the PNC and AGB prediction results of different models without implementing data dimensionality reduction. The ELM could effectively improve the estimating accuracy of PNC and AGB (Figure 4f,l). However, the performance of the models was probably affected by the multicollinearity within input variables.

3.3. Optimization of Input Variables of Machine Learning Models

3.3.1. SPA and PCA-Based Data Dimensionality Reduction

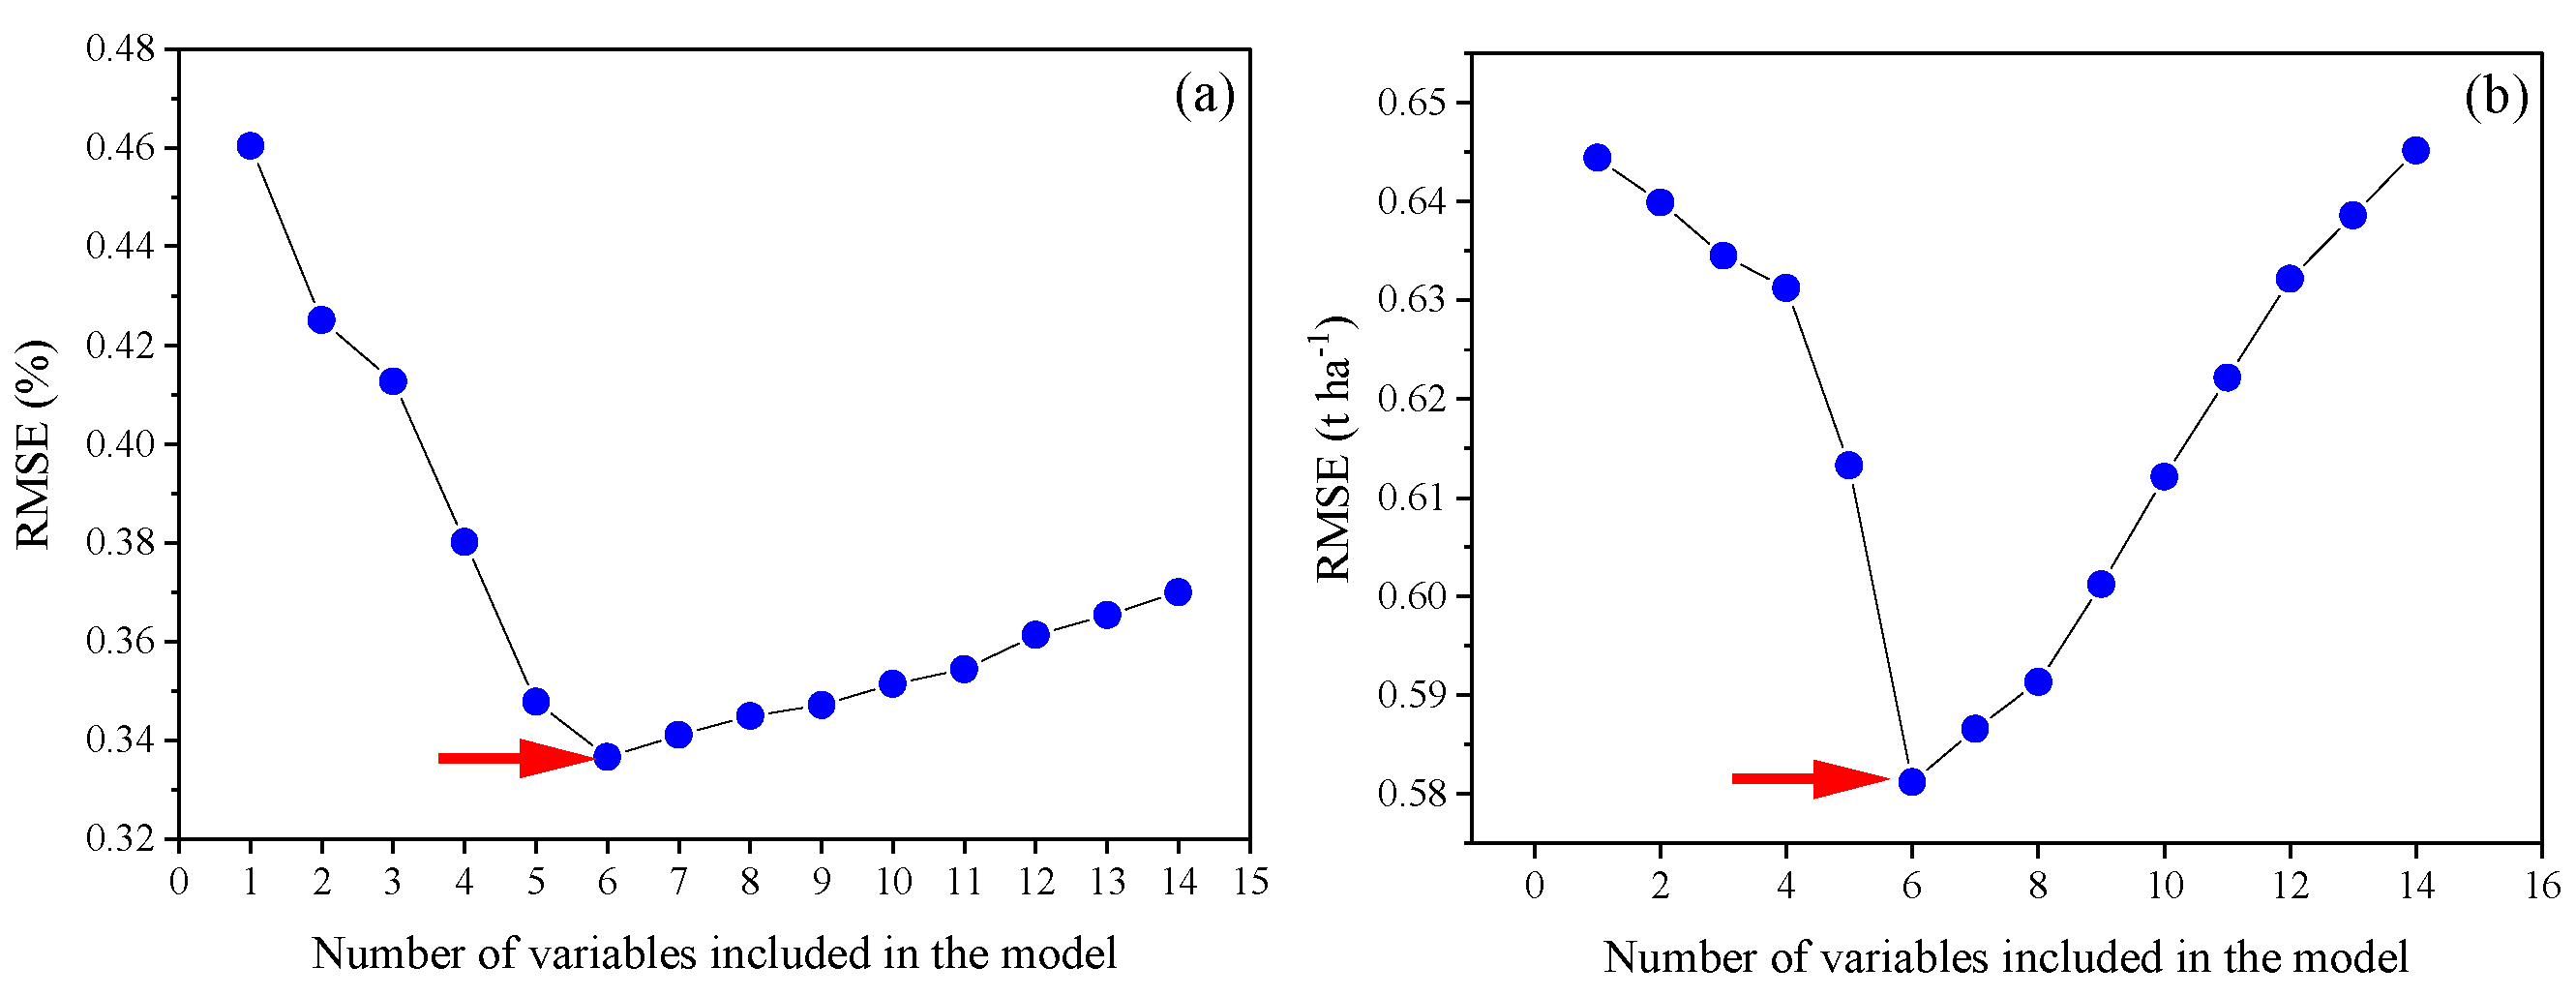
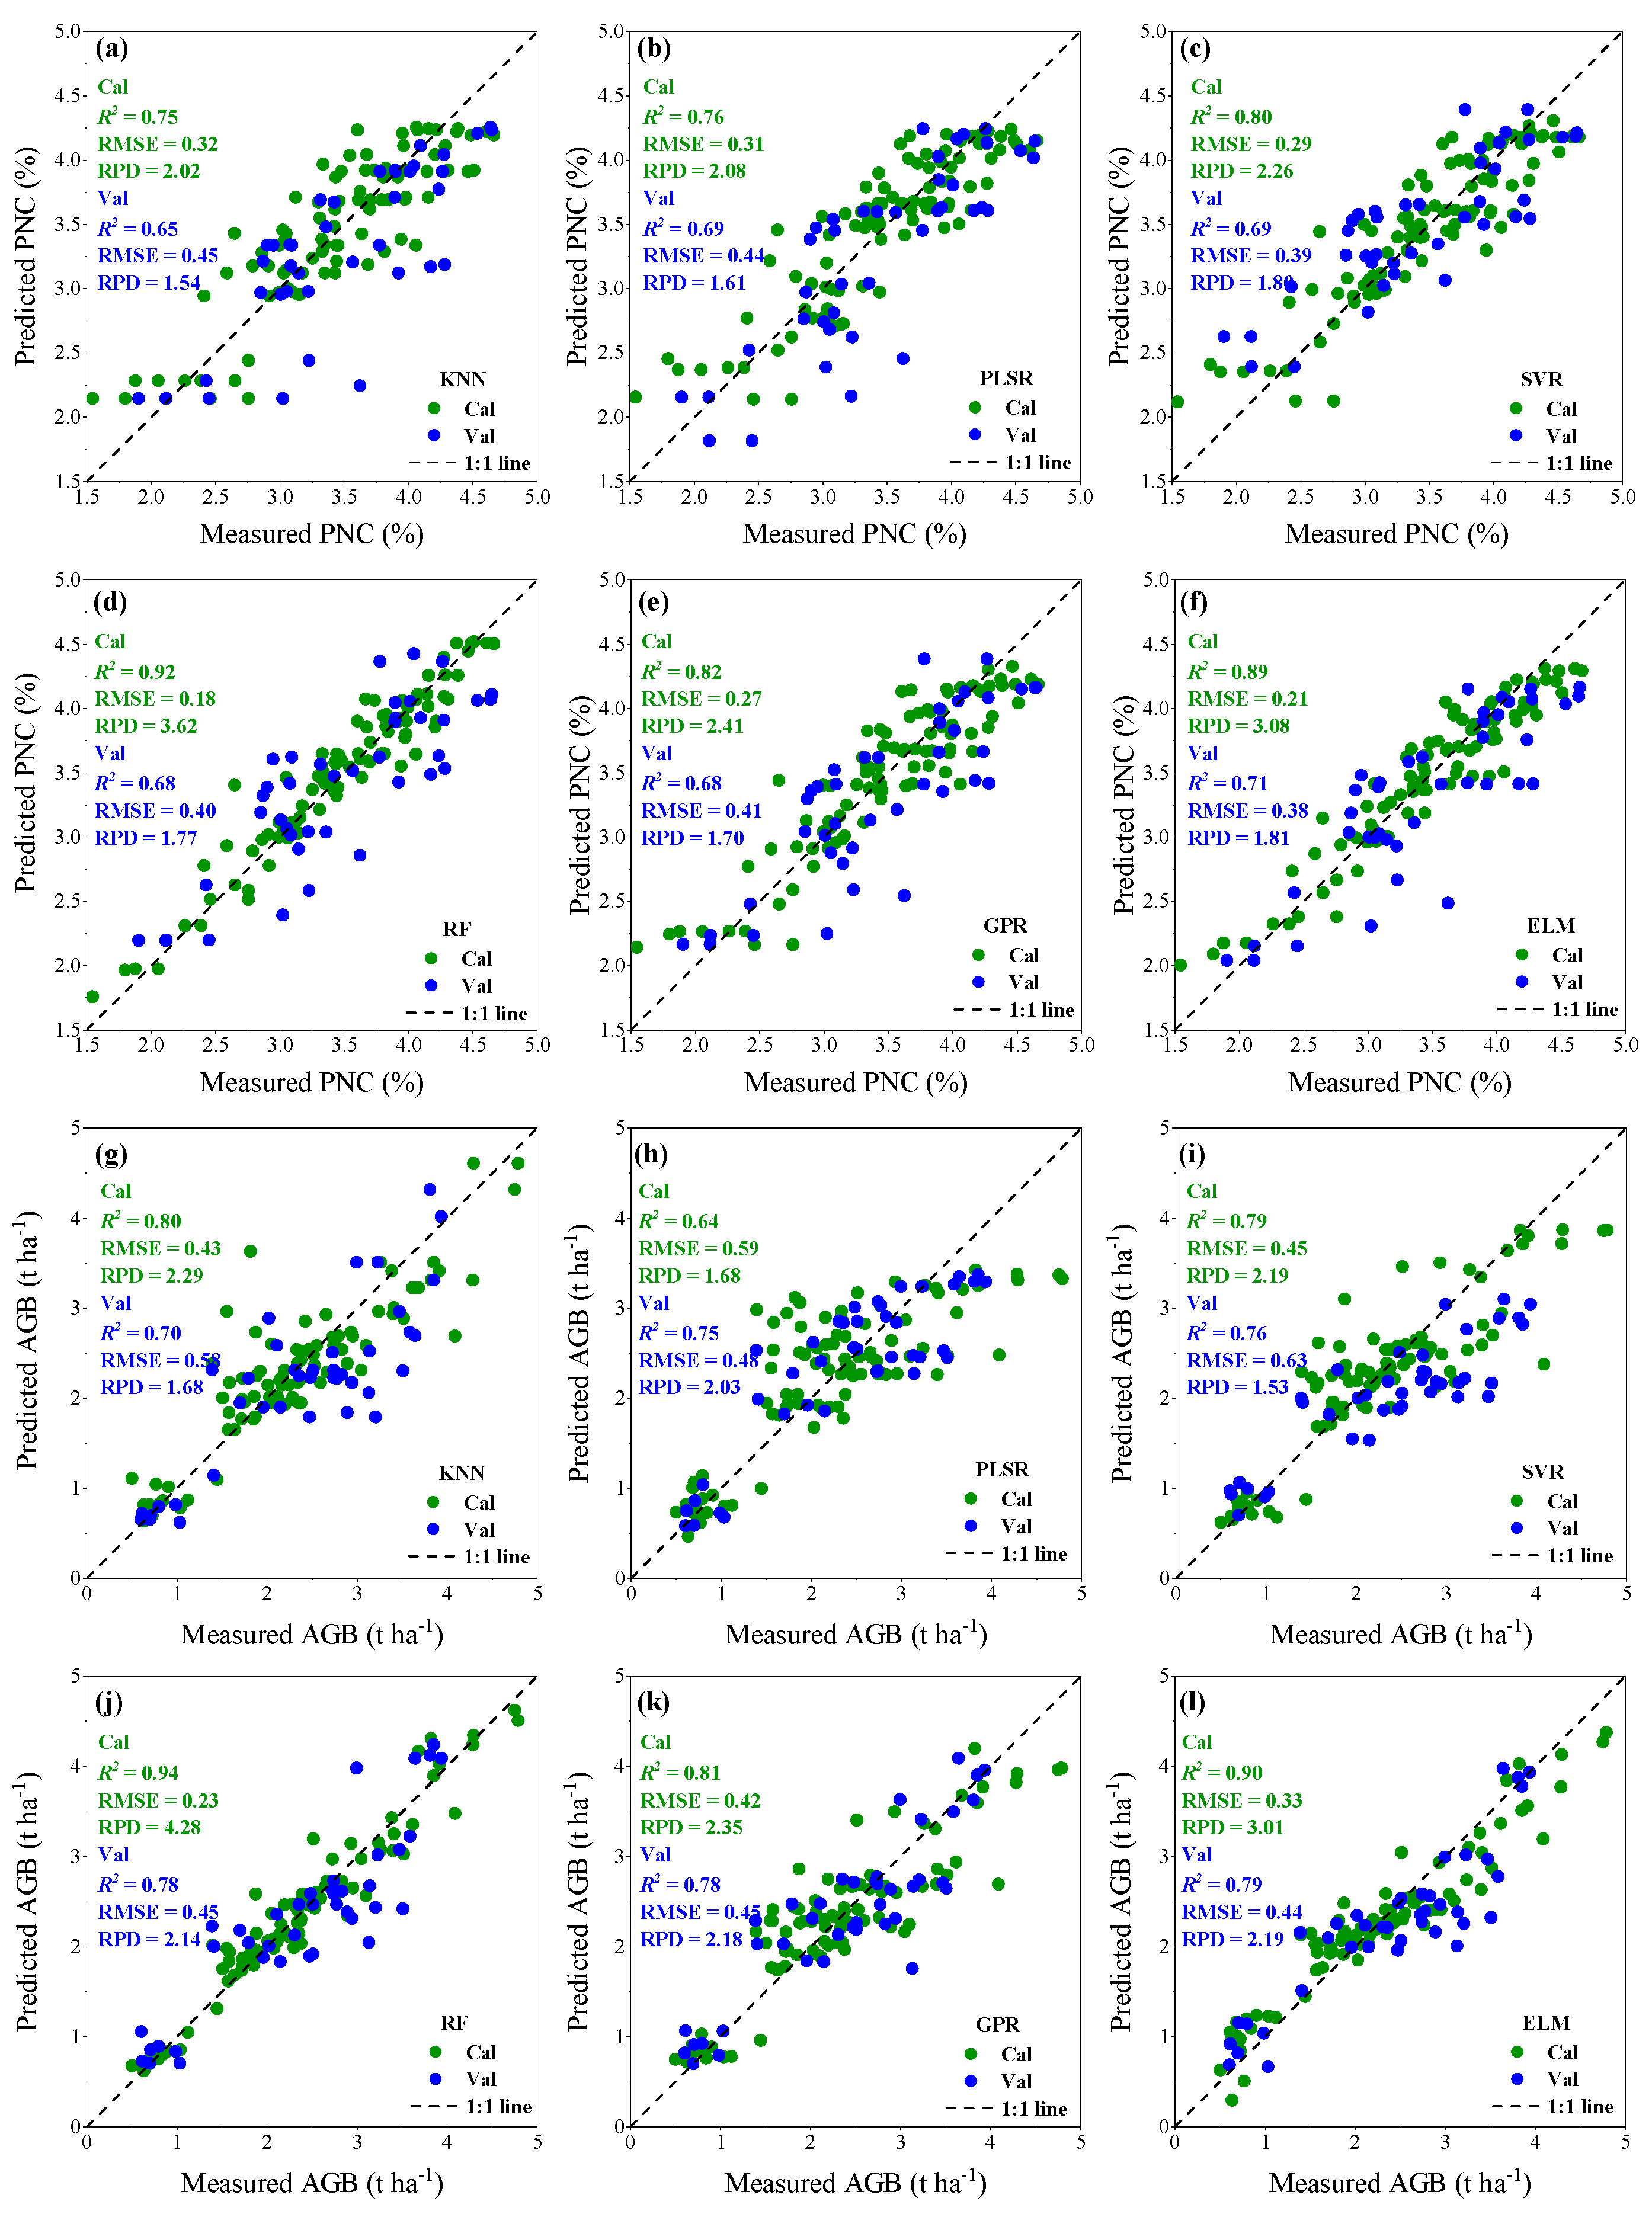
Figure 5 shows the selected features based on the SPA with PNC and AGB. The input variables were chosen according to the RMSE. Figure 6 shows the accuracy of the PNC and AGB estimation models for all models based on the desired features. When SPA-based SIs were used as input variables, most prediction models were not significantly different from the original input variables (14 SIs as input variables), indicating that the SPA method could effectively reduce the number of SIs. The ELM had the best performance for PNC (Figure 6f) and AGB (Figure 6l) prediction compared to the other models.
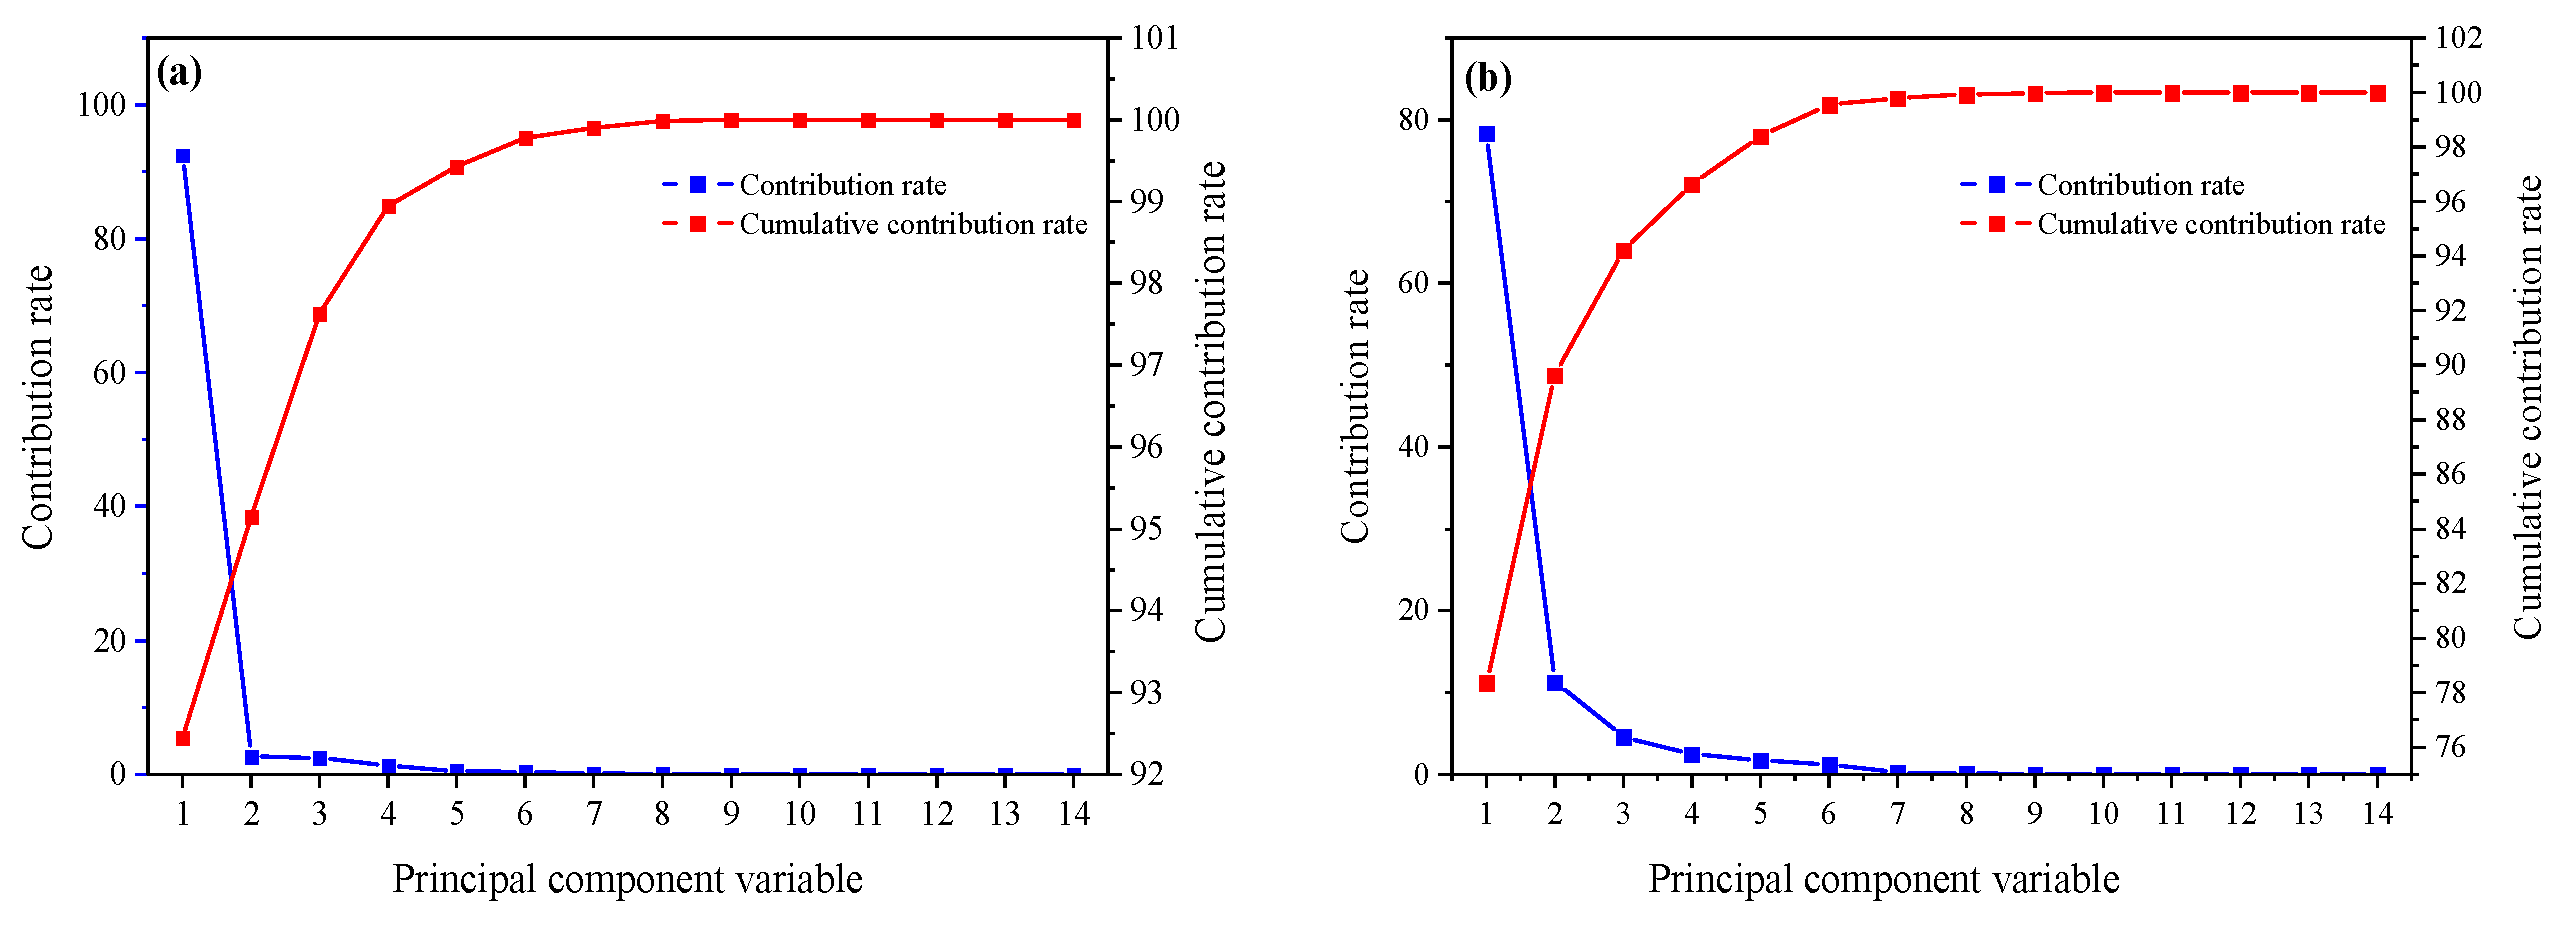
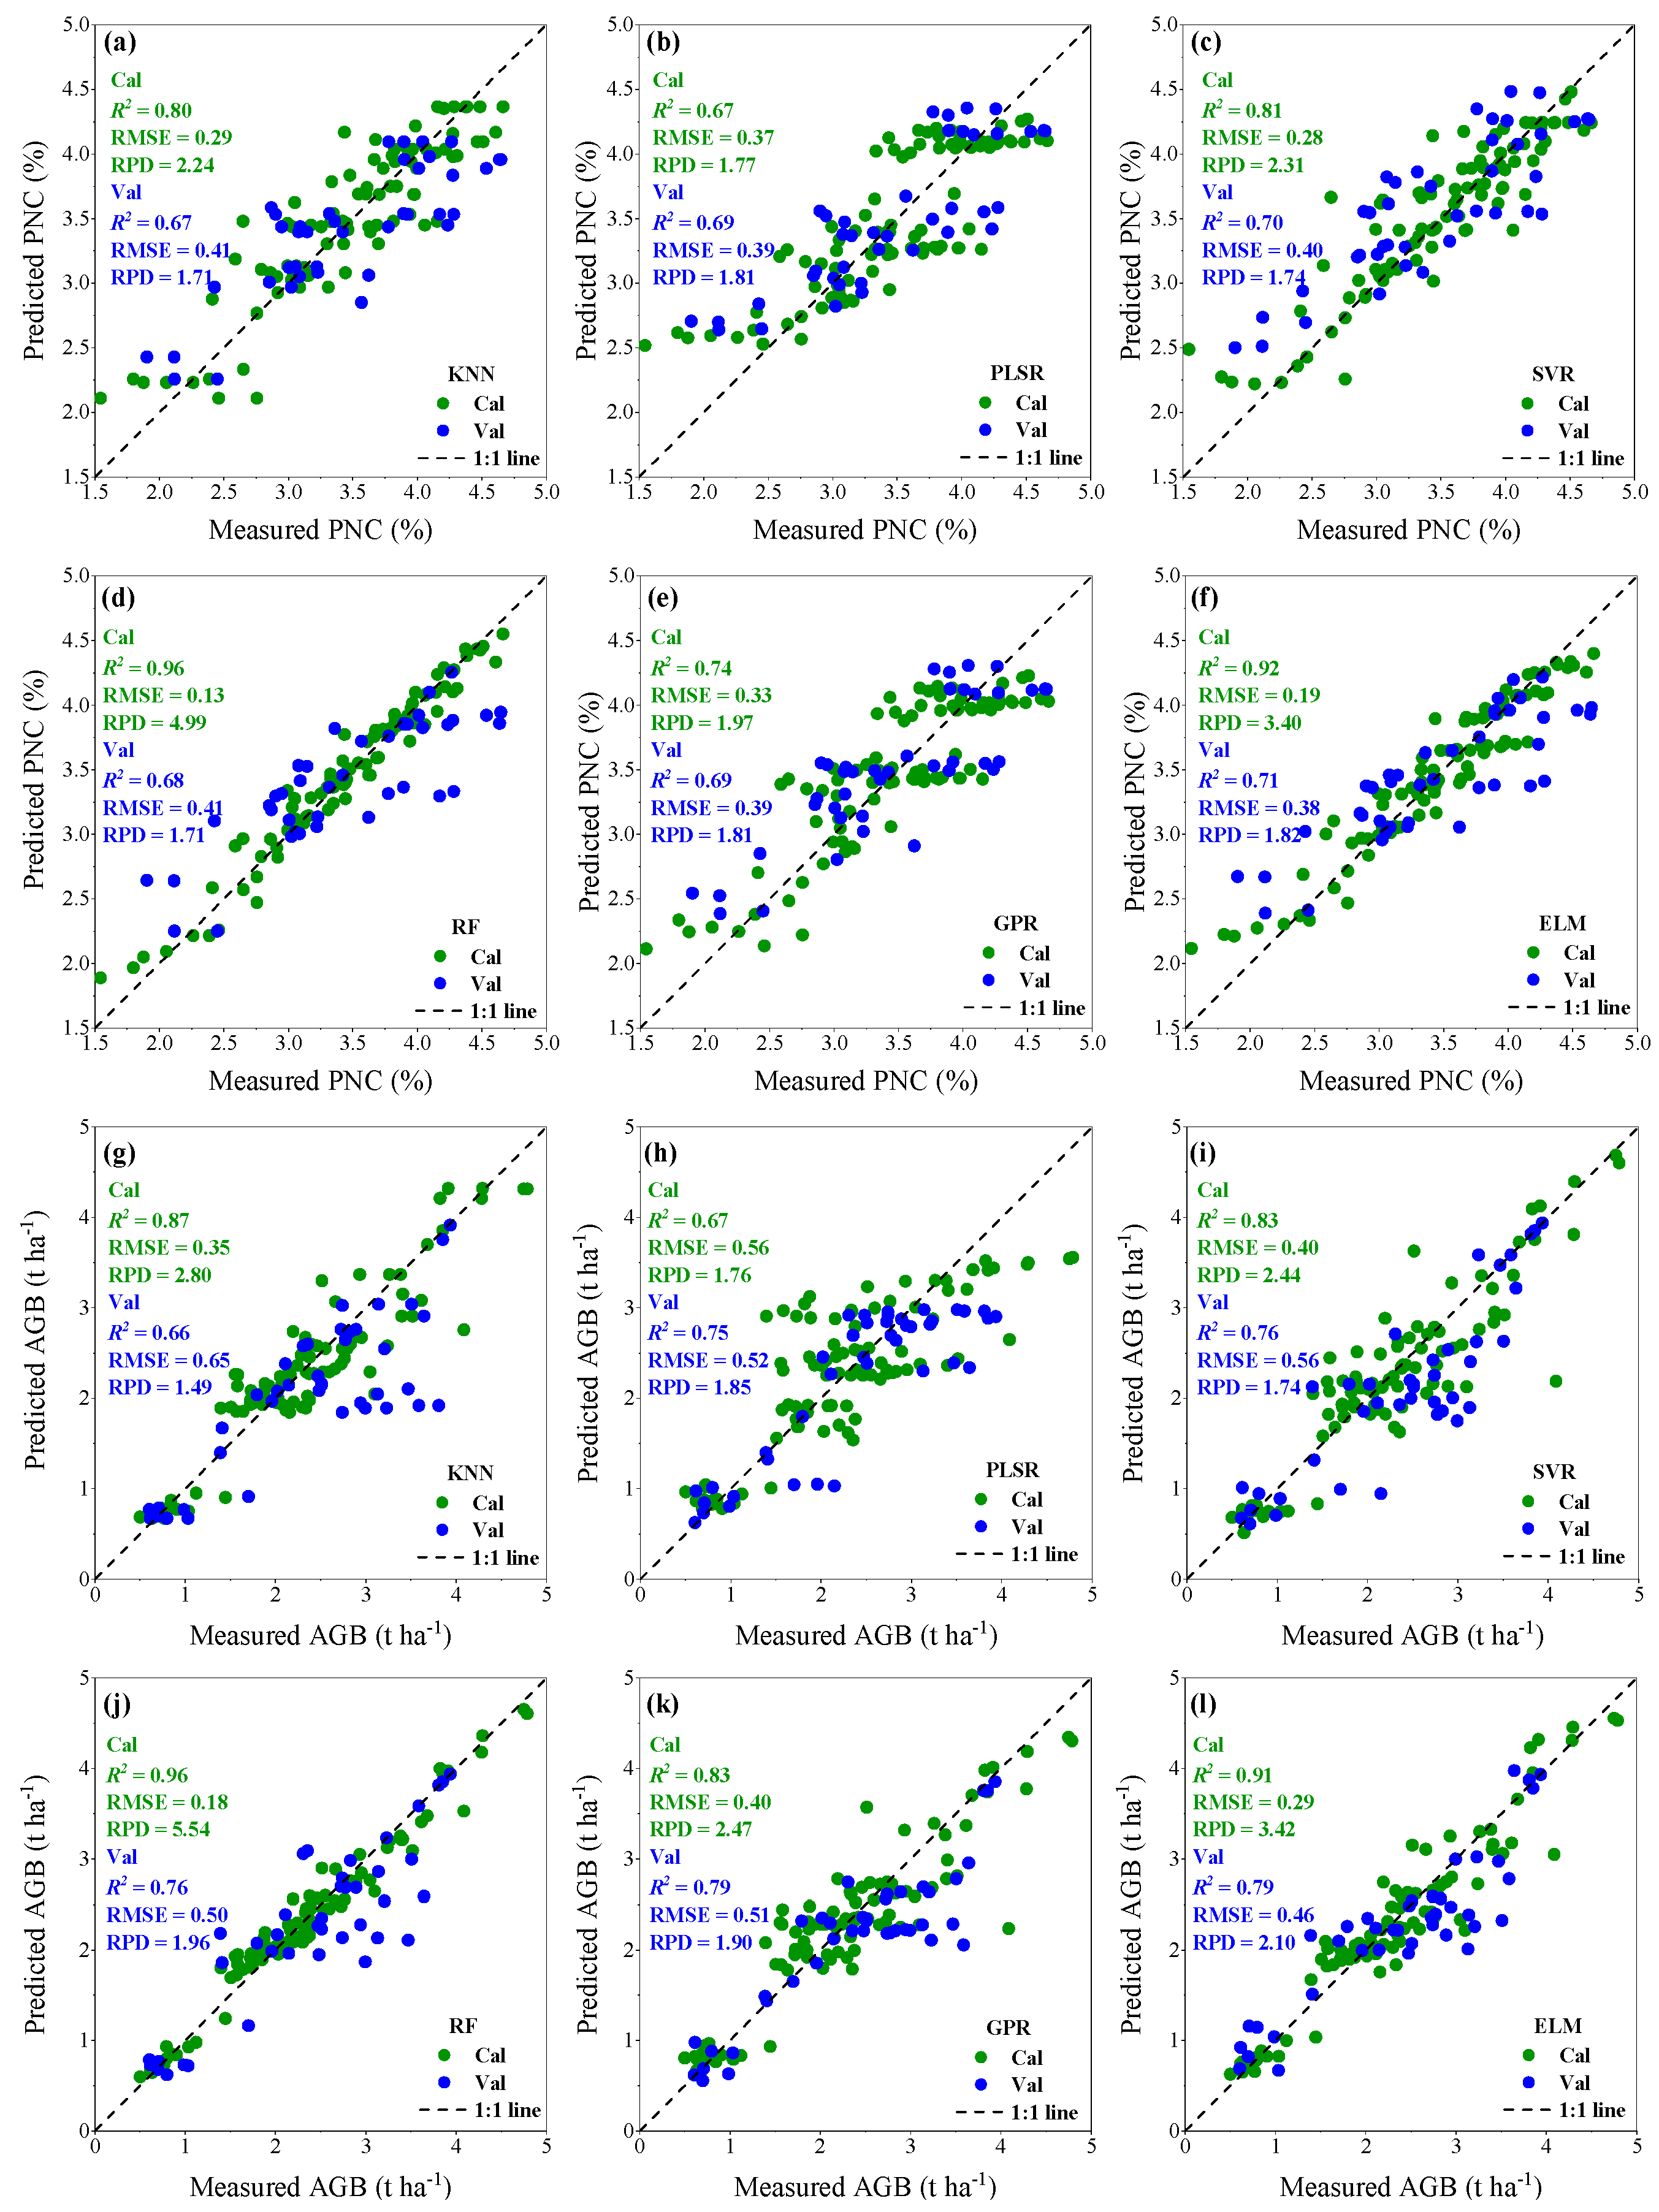
Figure 7 shows the processing of the PCA. The cumulative contribution of the first three PCs was more significant than 95% and can be used for model training. Similar to the SPA method, the performance of the models with the PCA-based SIs as input variables was not significantly different compared to the original input variables (Figure 8). The ELM performed best for potato PNC (Figure 8f) and AGB (Figure 8l) estimation.

3.3.2. SPA-PCA-Based Data Dimensionality Reduction

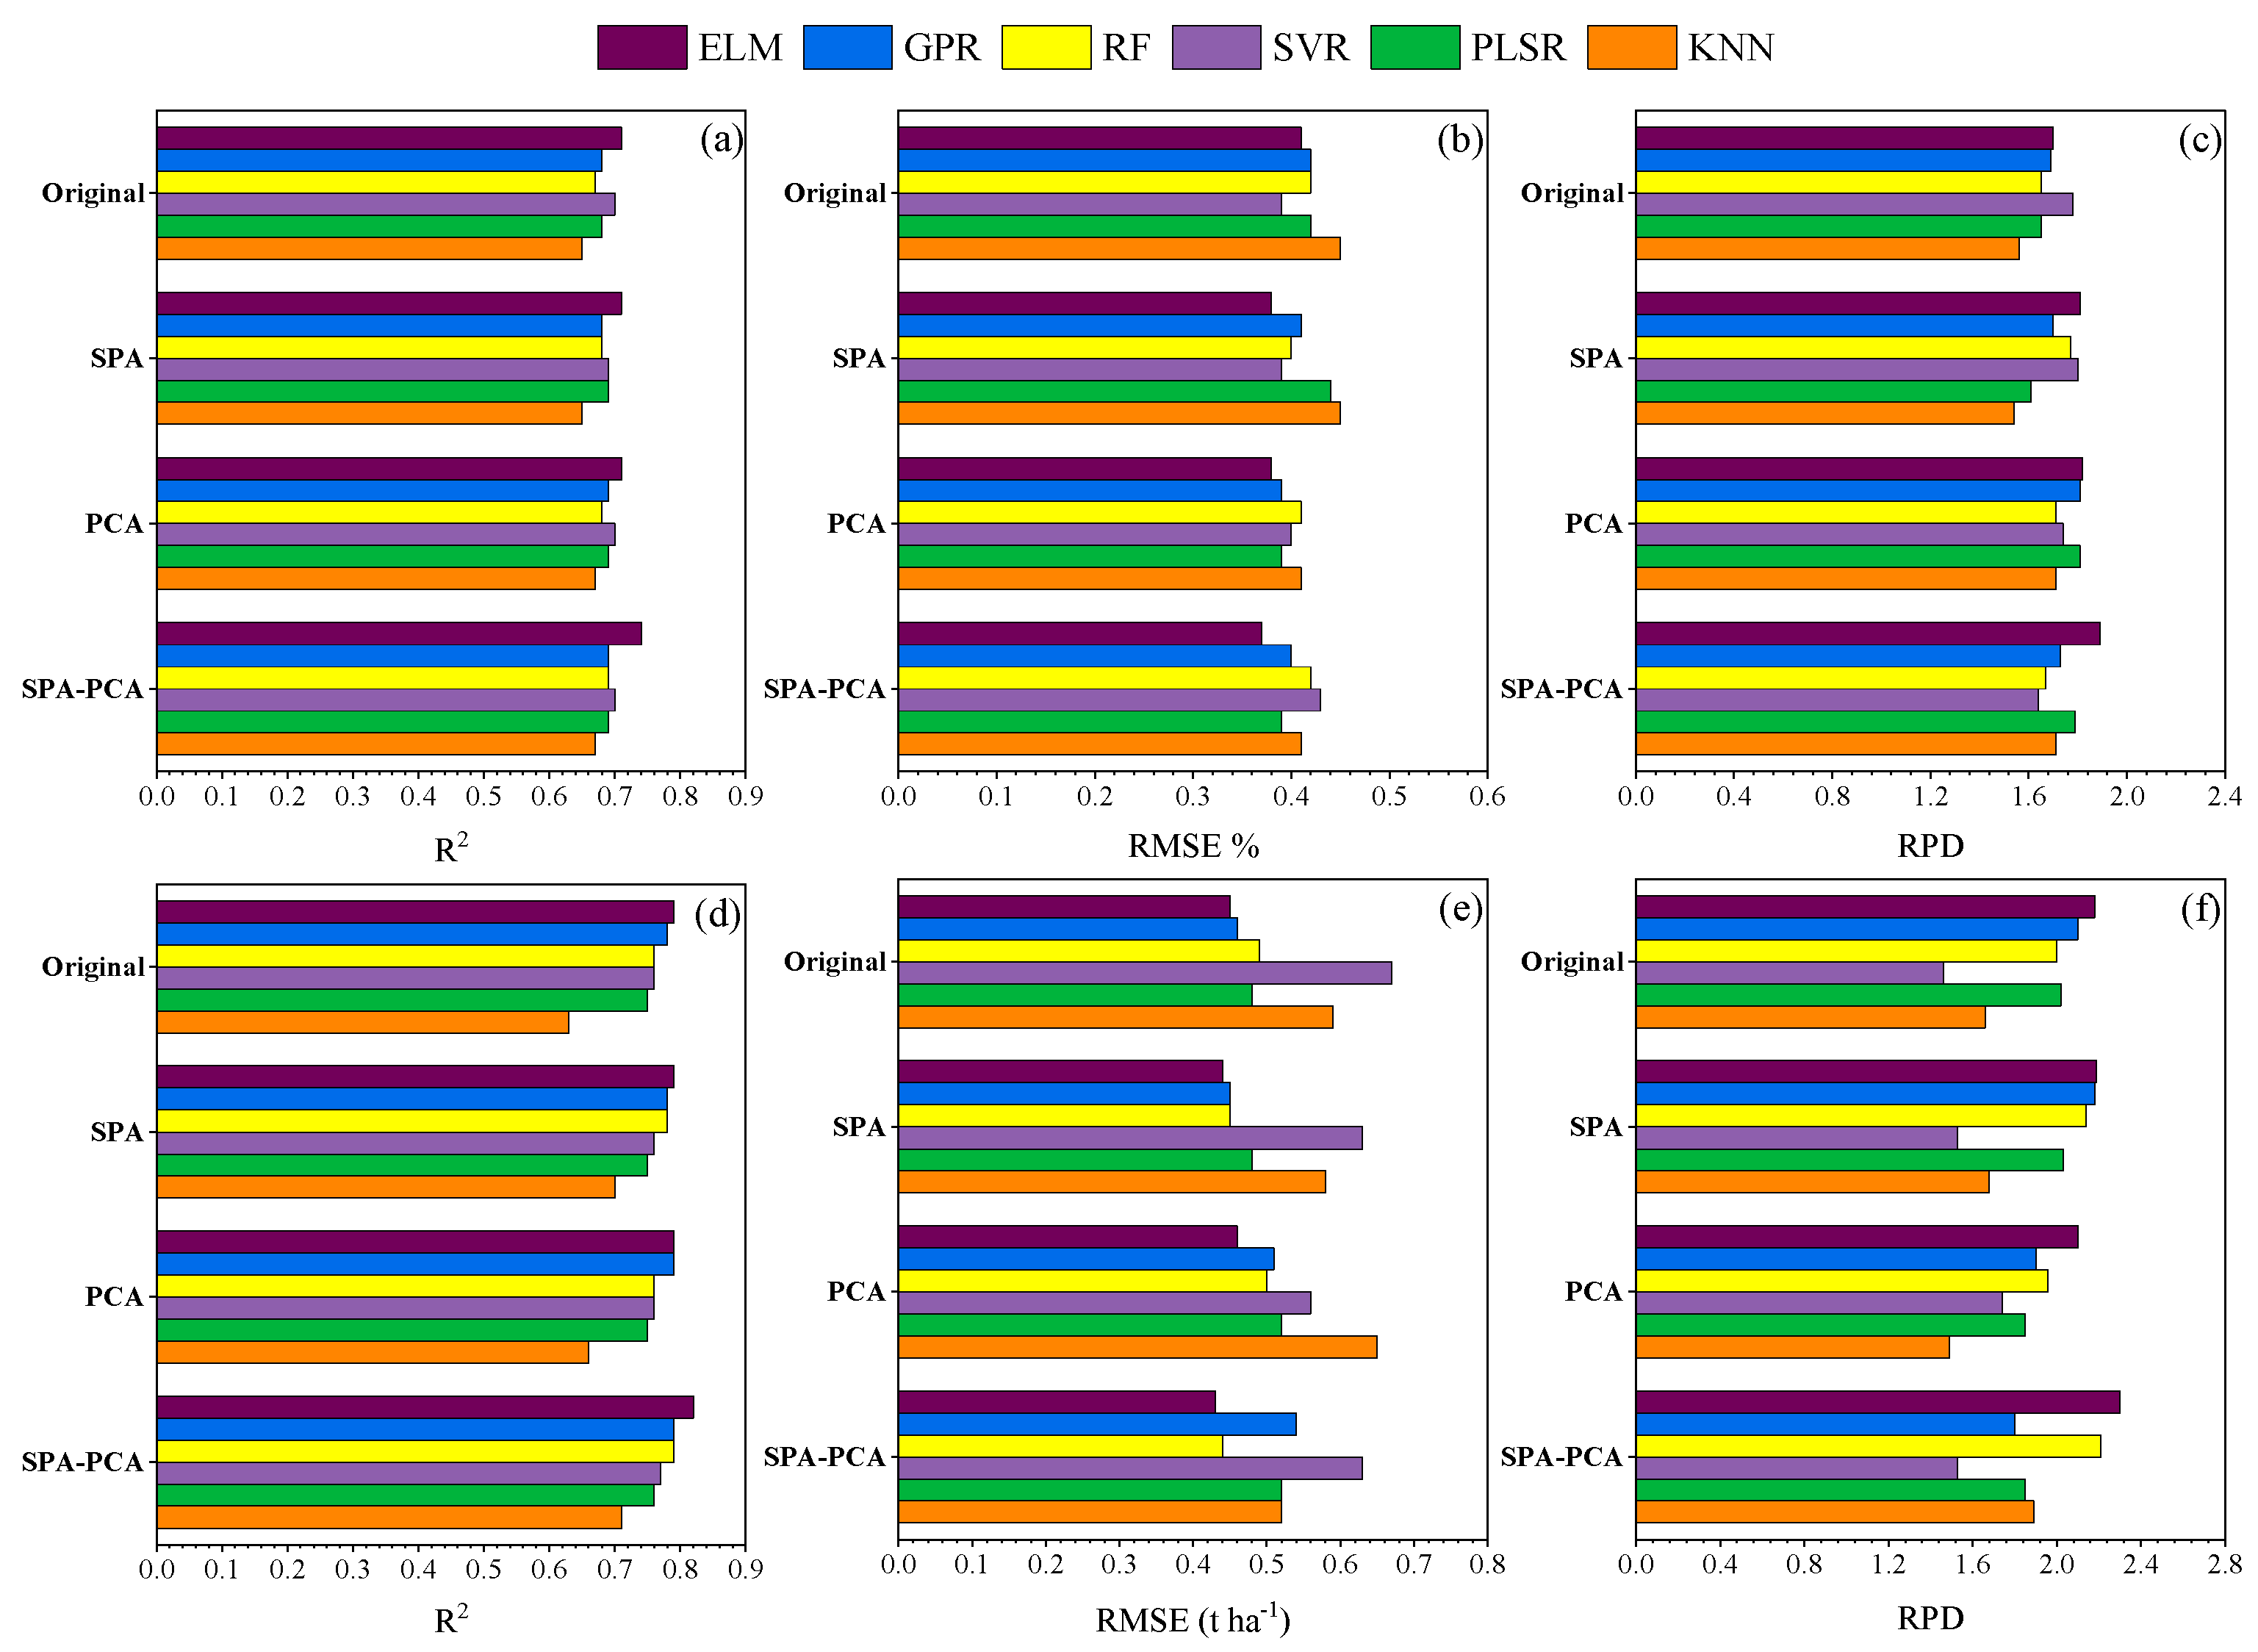
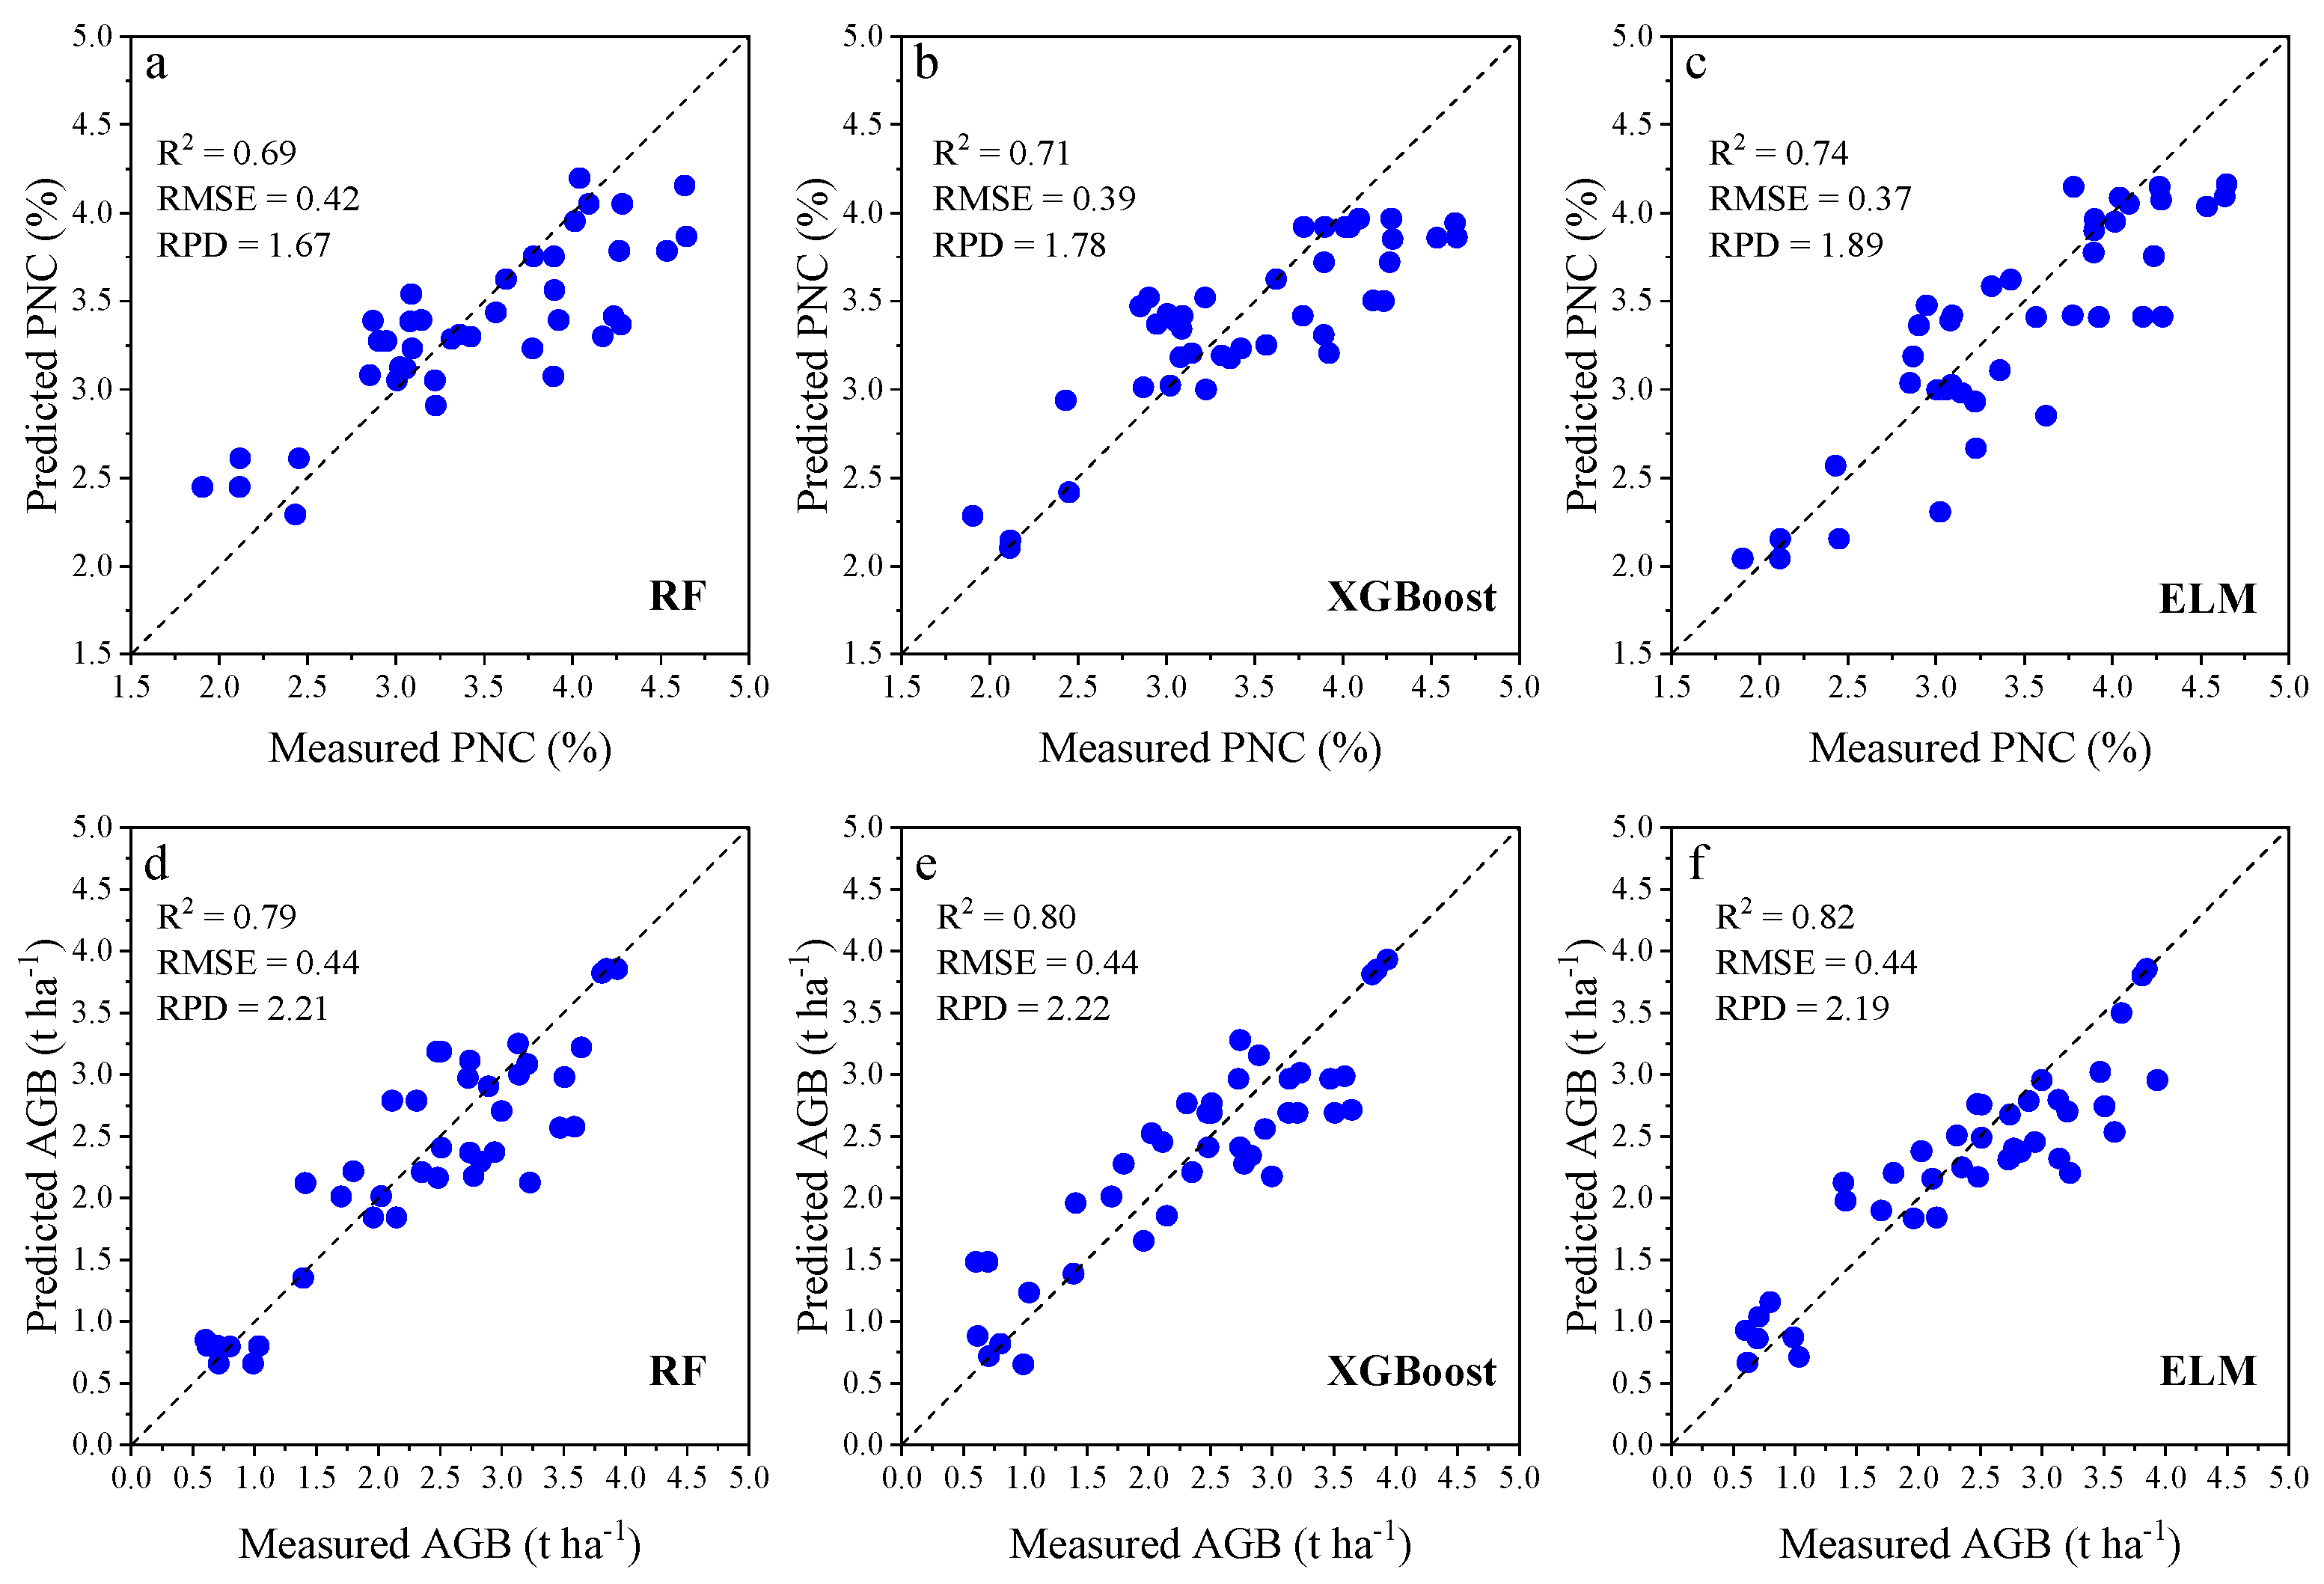
Figure 9 shows the accuracy of the PNC and AGB prediction models established with six models and four input datasets. The results showed that SPA-PCA slightly improved with the PNC and AGB estimation models for most of the basic models for SIs. Compared with other models, the ELM that combined SPA-PCA-based SIs greatly improved the prediction accuracy of PNC (Figure 9a–c) and AGB (Figure 9d–f).

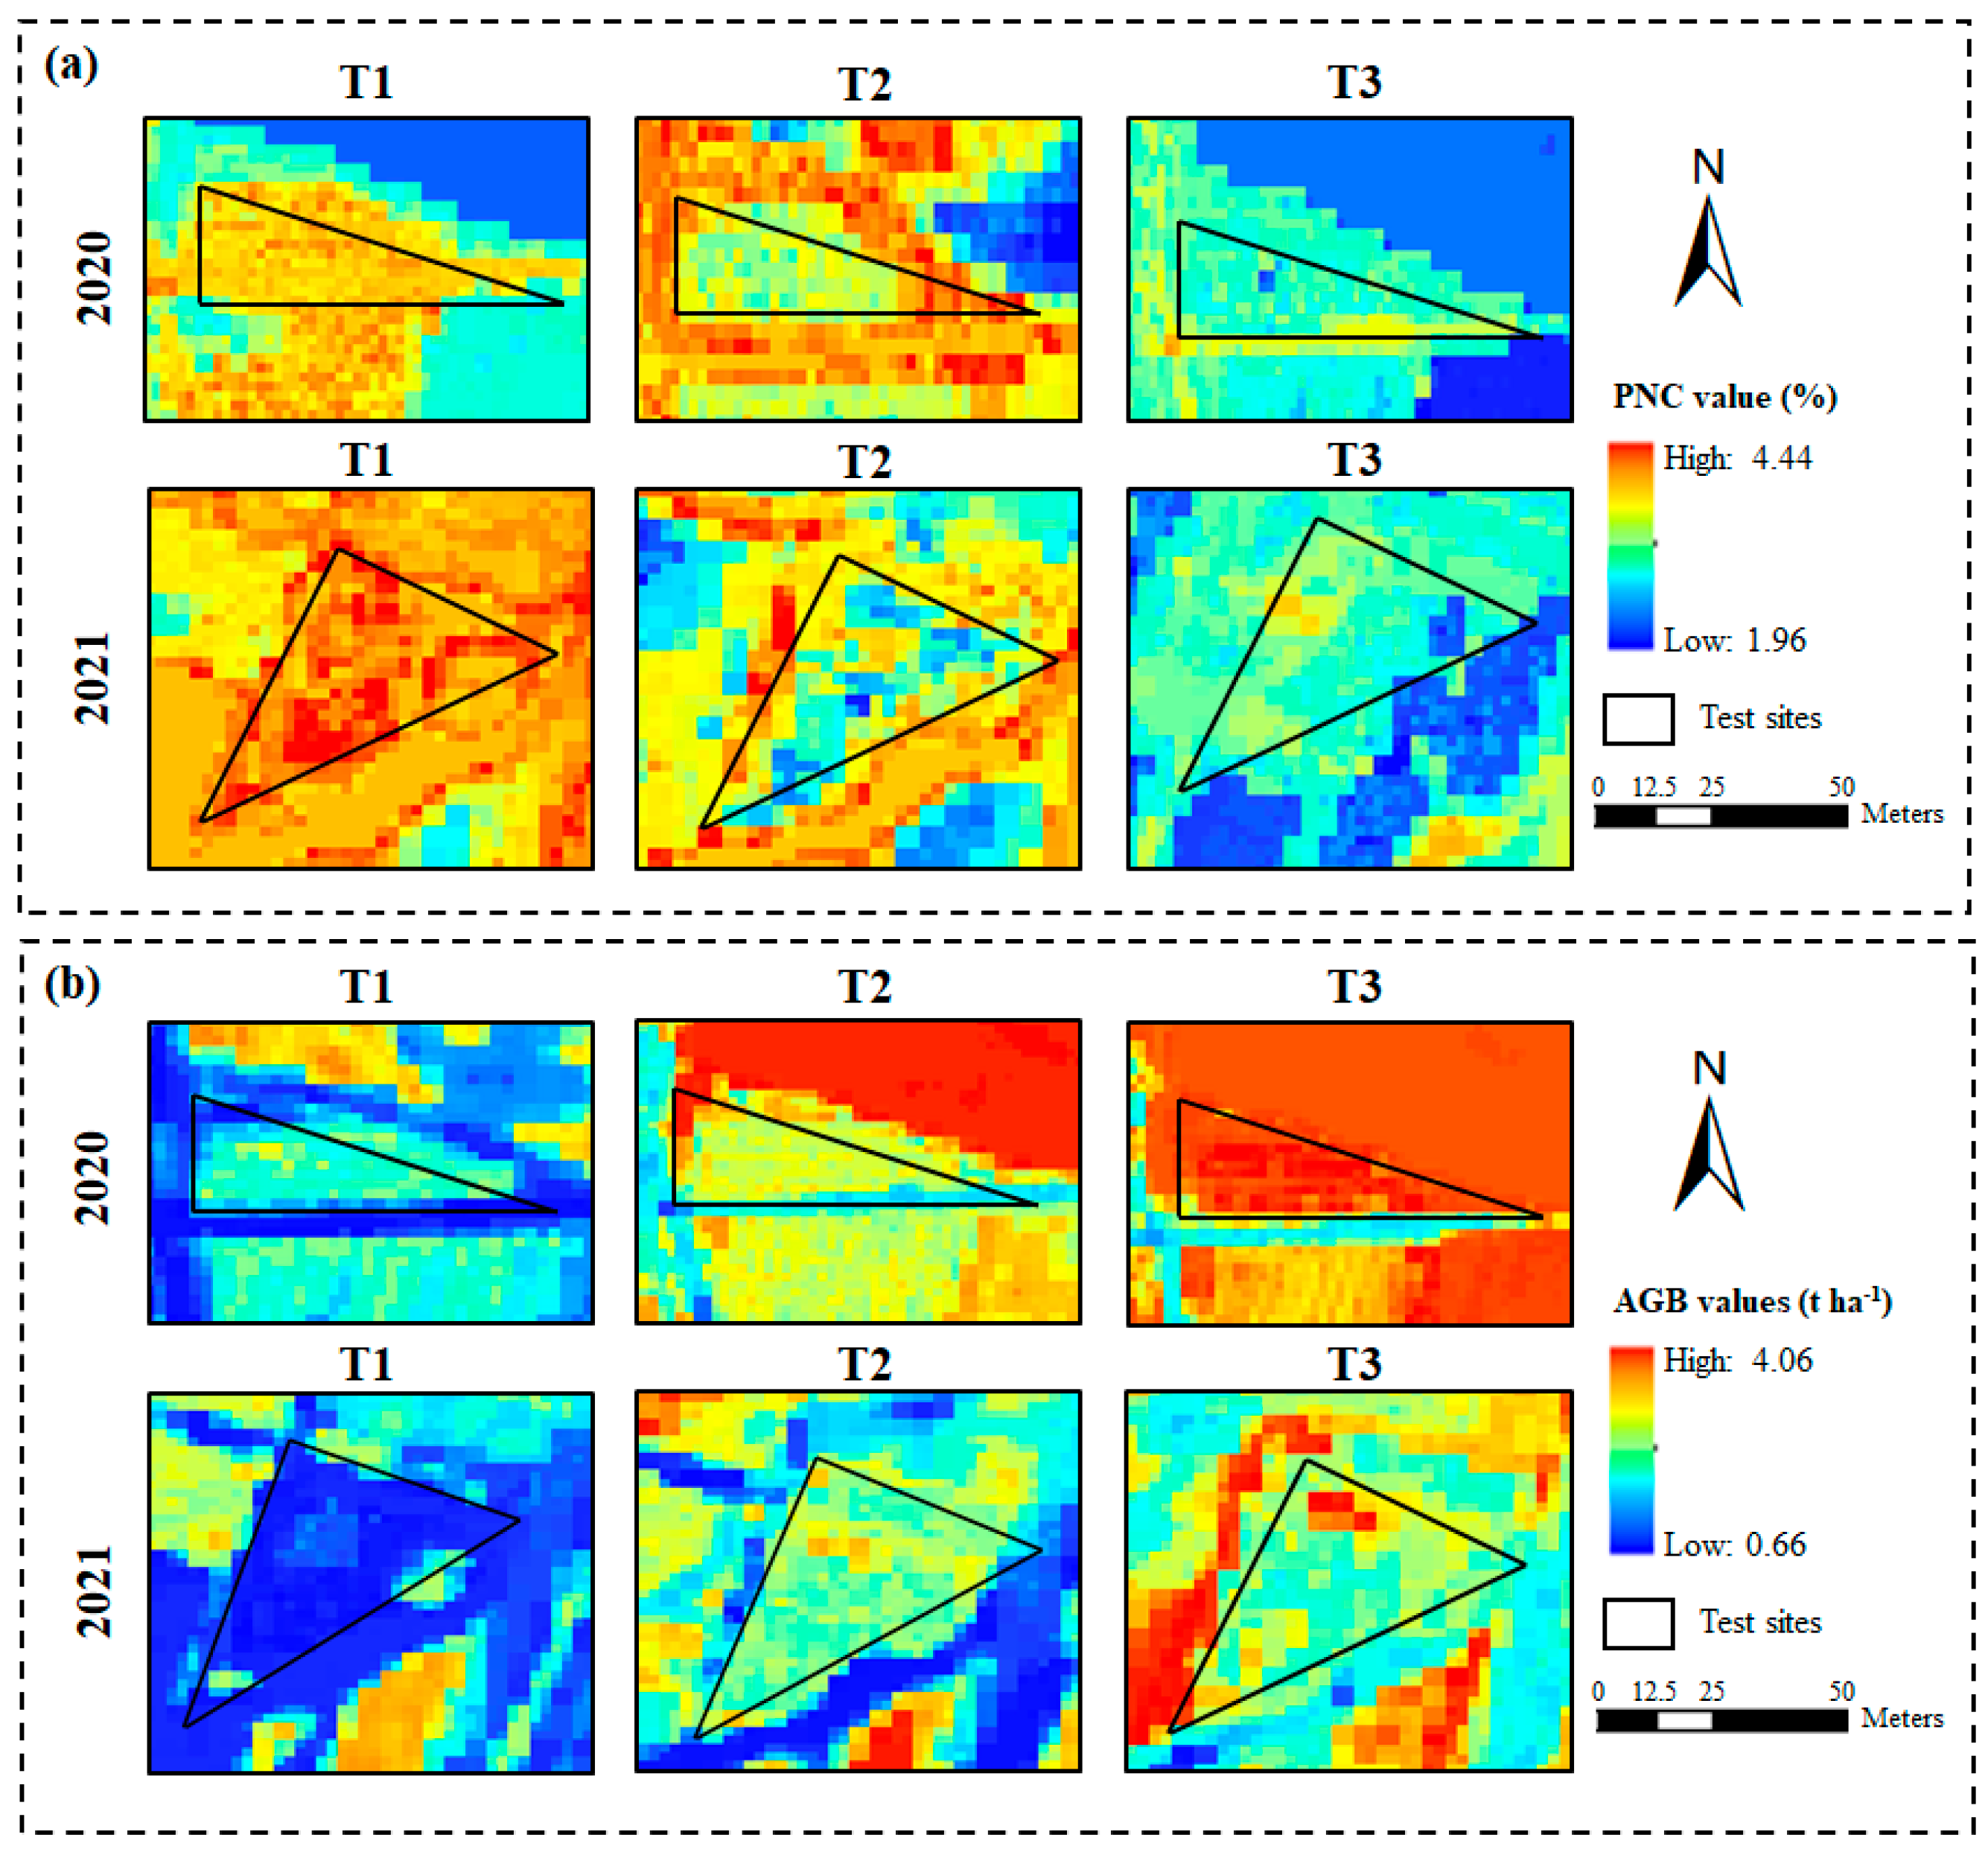
3.4. Mapping PNC and AGB Using Sentinel-2 Imagery

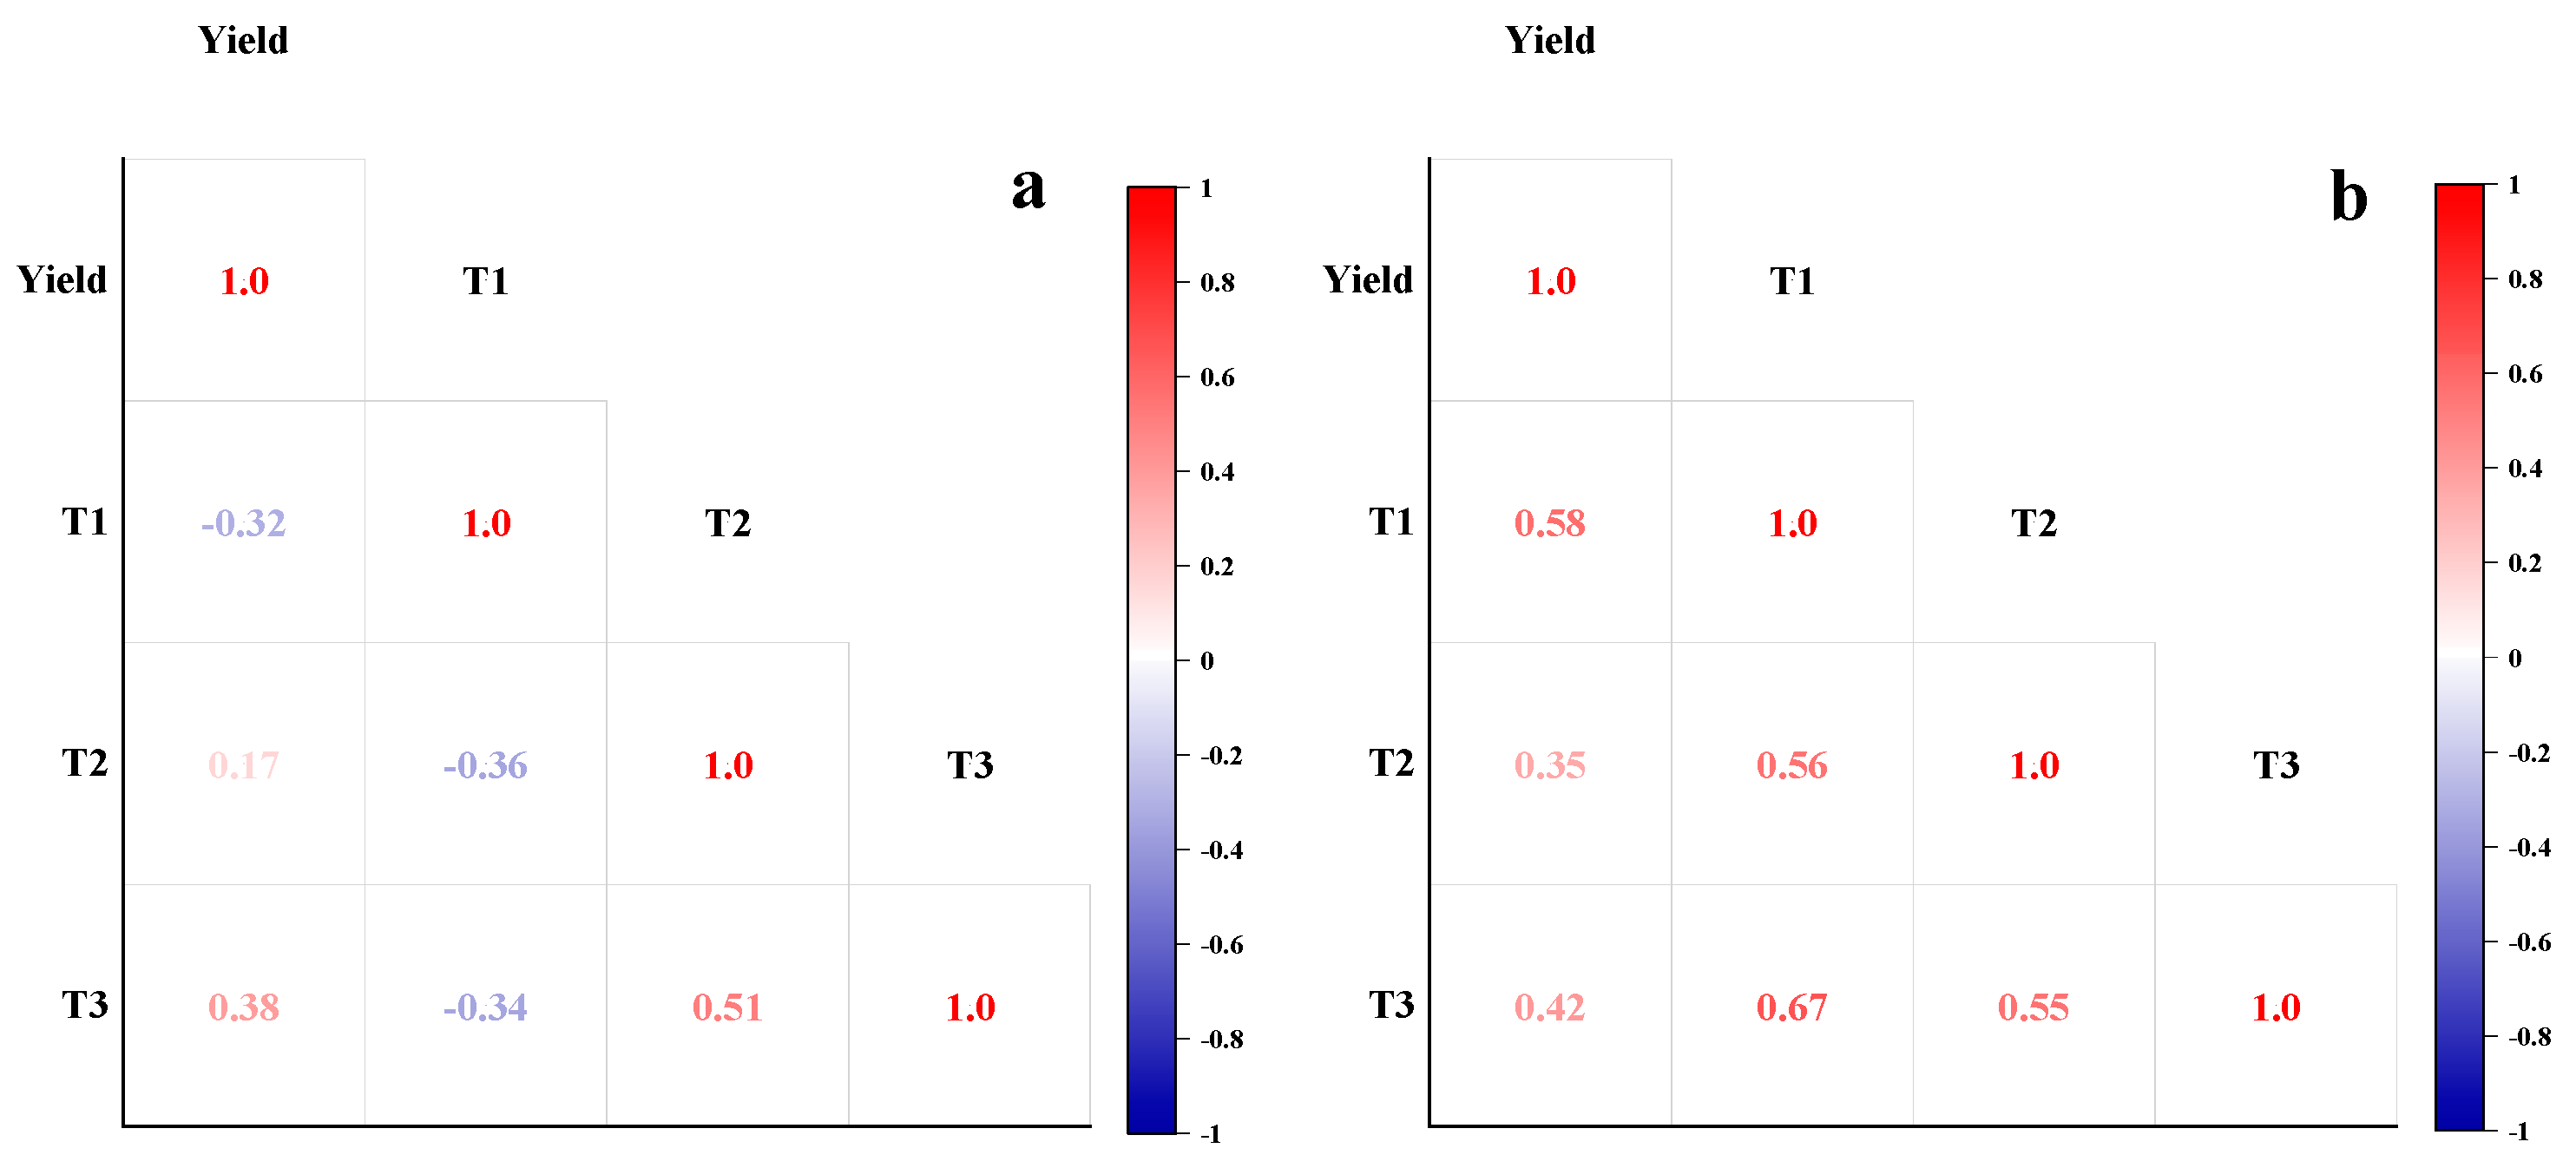
The mapping results based on the ensemble learning model from the SPA-PCA are shown in Figure 10. The potato PNC was highest during tuber formation. With potato growth developed, the PNC of the potato was affected by the dilution effect [54] with a gradual decrease in PNC. In contrast to PNC, the AGB values were minimal during tuber formation. With potato growth developed, AGB gradually increased. In addition, Figure 11 demonstrates the correlation of PNC and AGB with yield at different potato growth stages. The results showed that biomass at the tuber-formation stage (T1) was highly correlated with potato yield (Figure 11b). Therefore, it is important to accurately monitor PNC and AGB during the critical growth stages of potato.
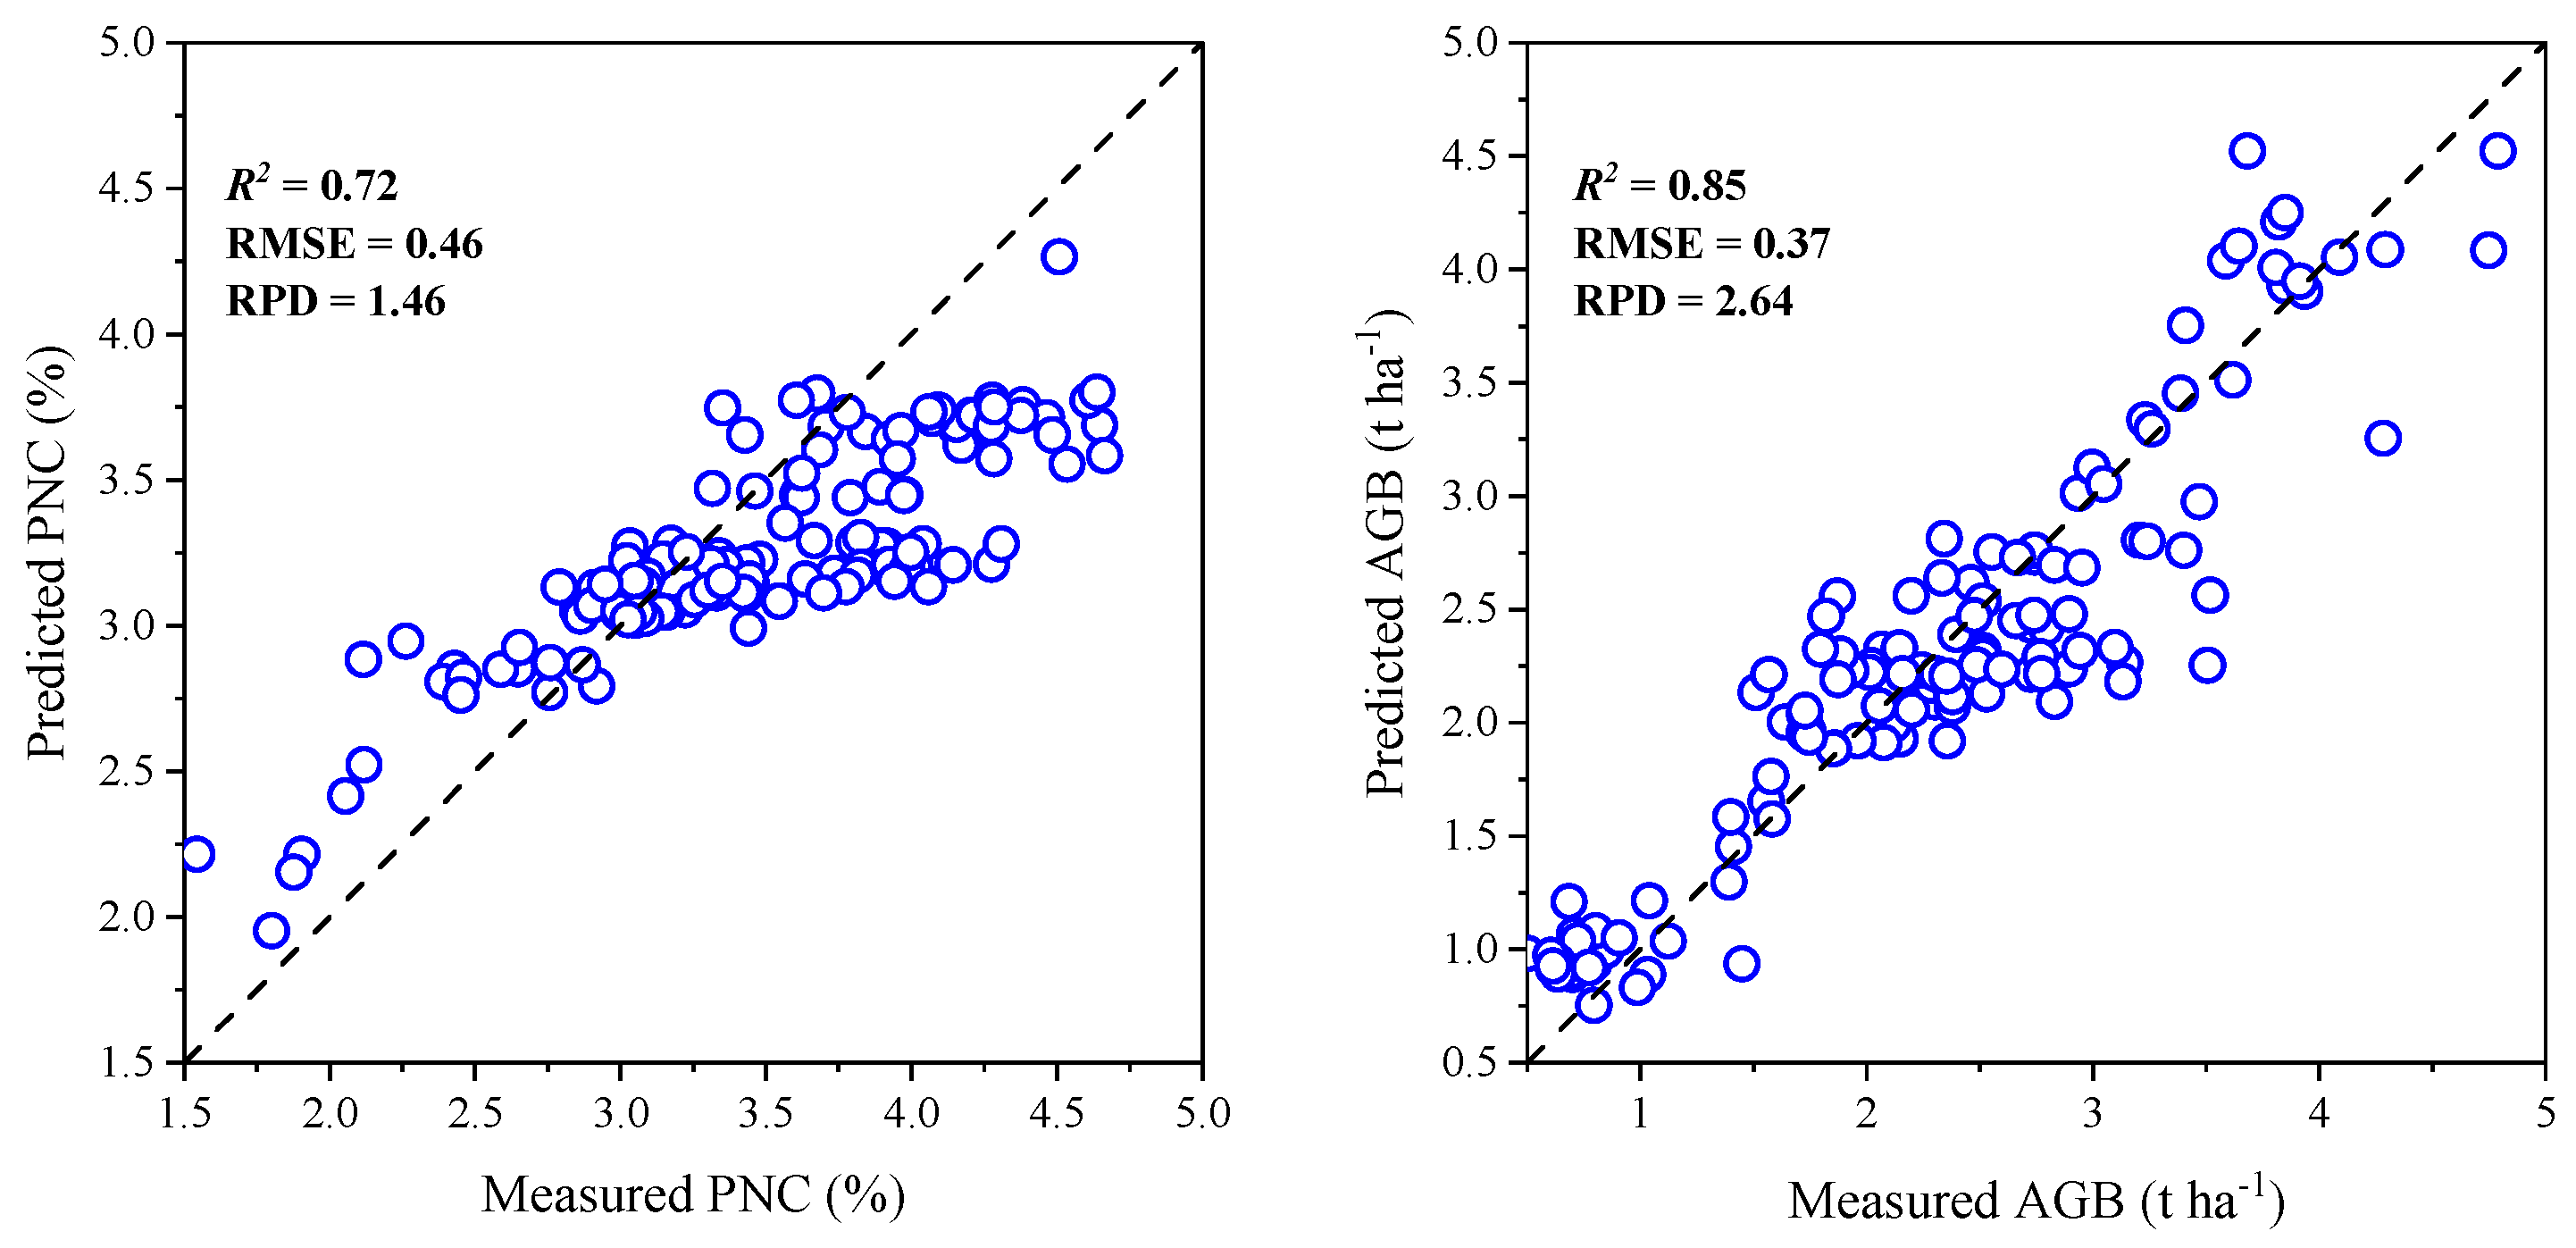
All measured PNC and AGB samples acquired synchronously with Sentinel-2 imagery were used for validation. Figure 12 shows the relationships between measured and predicted PNC and AGB. The accuracy of the prediction map is consistent with that of the spectral data prediction (PNC: R2 = 0.72; RMSE = 0.46%; RPD = 1.46—AGB: R2 = 0.85; RMSE = 0.37%; RPD = 2.64). This result also illustrates the accuracy of the prediction map.

4. Discussion

4.1. Comparison of PNC and AGB Sensitive Bands

Identifying and extracting critical bands from Sentinel-2 imagery is crucial for enhancing the accuracy of estimating crop PNC and AGB [55,56]. Among the tested SIs, the RE region and the SWIR were the most influential for estimating PNC and AGB (Table 4). Similar to the results of most studies, the RE is an effective band for monitoring crop parameters [57,58]. The RE is a region with sharp changes in reflectance, and is considered a sensitive region for monitoring the chlorophyll content of plants. The RE region changes depending on the strength of chlorophyll absorption [54]. However, the results in this study also indicate that SWIR can effectively improve the prediction accuracy of PNC and AGB (Table 4). Similarly, Perich [59] suggested that the SWIR was the best region for plant N status. This may be because protein and amino acid molecules in plants contain N. Proteins typically absorb short-wave infrared light. When using the SWIR to monitor plant growth, light in this band is absorbed by proteins in the plant, resulting in absorption peaks in the spectrum. Therefore, combining the SWIR band and RE can effectively monitor the potato PNC. The SWIR is also more sensitive to AGB. One possible explanation is that the highest aboveground biomass was achieved in the potato post-flowering (T2 + T3 stages) when the dilution effect diminishes [60]. The selected sensitive bands were weakly related to potato AGB during the post-flowering stages (Table 5). Thus, PNC has a more significant influence on choosing AGB sensitive bands. The results reported by Li [54] for winter wheat further confirm the more robust relationship between SIs and PNC when the biomass reaches constant values. Therefore, this study demonstrated the importance of the SWIR for potato PNC and AGB. At the same time, future research should also optimize the sensitive bands of PNC and AGB during different growth stages.

4.2. Comparison of Different Types of SIs

Although a variety of SIs have been successfully used to monitor crop PNC and AGB [61,62,63], limited research has evaluated the effectiveness of different types of SIs, such as chlorophyll-based, nitrogen-based, and biomass-based SIs, for the estimation of PNC and AGB of potato. In this study, four types of SIs were selected, including biomass, vegetation, chlorophyll/LAI, and nitrogen. The results showed chlorophyll-based SIs strongly correlate with potato PNC and AGB (Table 4). This is because chlorophyll, the green pigment in plants, contains N. Plants synthesize chlorophyll by absorbing N from the soil. Therefore, the SIs based on chlorophyll content are closely correlated with PNC [21]. In addition, chlorophyll content often represents plant growth conditions, and plants with high chlorophyll content usually have high biomass. Therefore, SIs based on chlorophyll content and AGB often correlate strongly. Another reason may be the different levels of N fertilizer treatments set up in this study. The different nitrogen supply greatly affected the plant chlorophyll content and, thus, this is reflected in the PNC and AGB of the potato crops. However, unlike the correlation analysis, the SIs selected based on the SPA method included other SIs with weaker correlations (e.g., NDVI and RVI) (Figure 5). The SPA method includes an iterative selection of input variables and picks different numbers of SIs. Weaker SIs may highlight stronger ones and improve the predictive performance of the model.

4.3. Differences in Model Performance

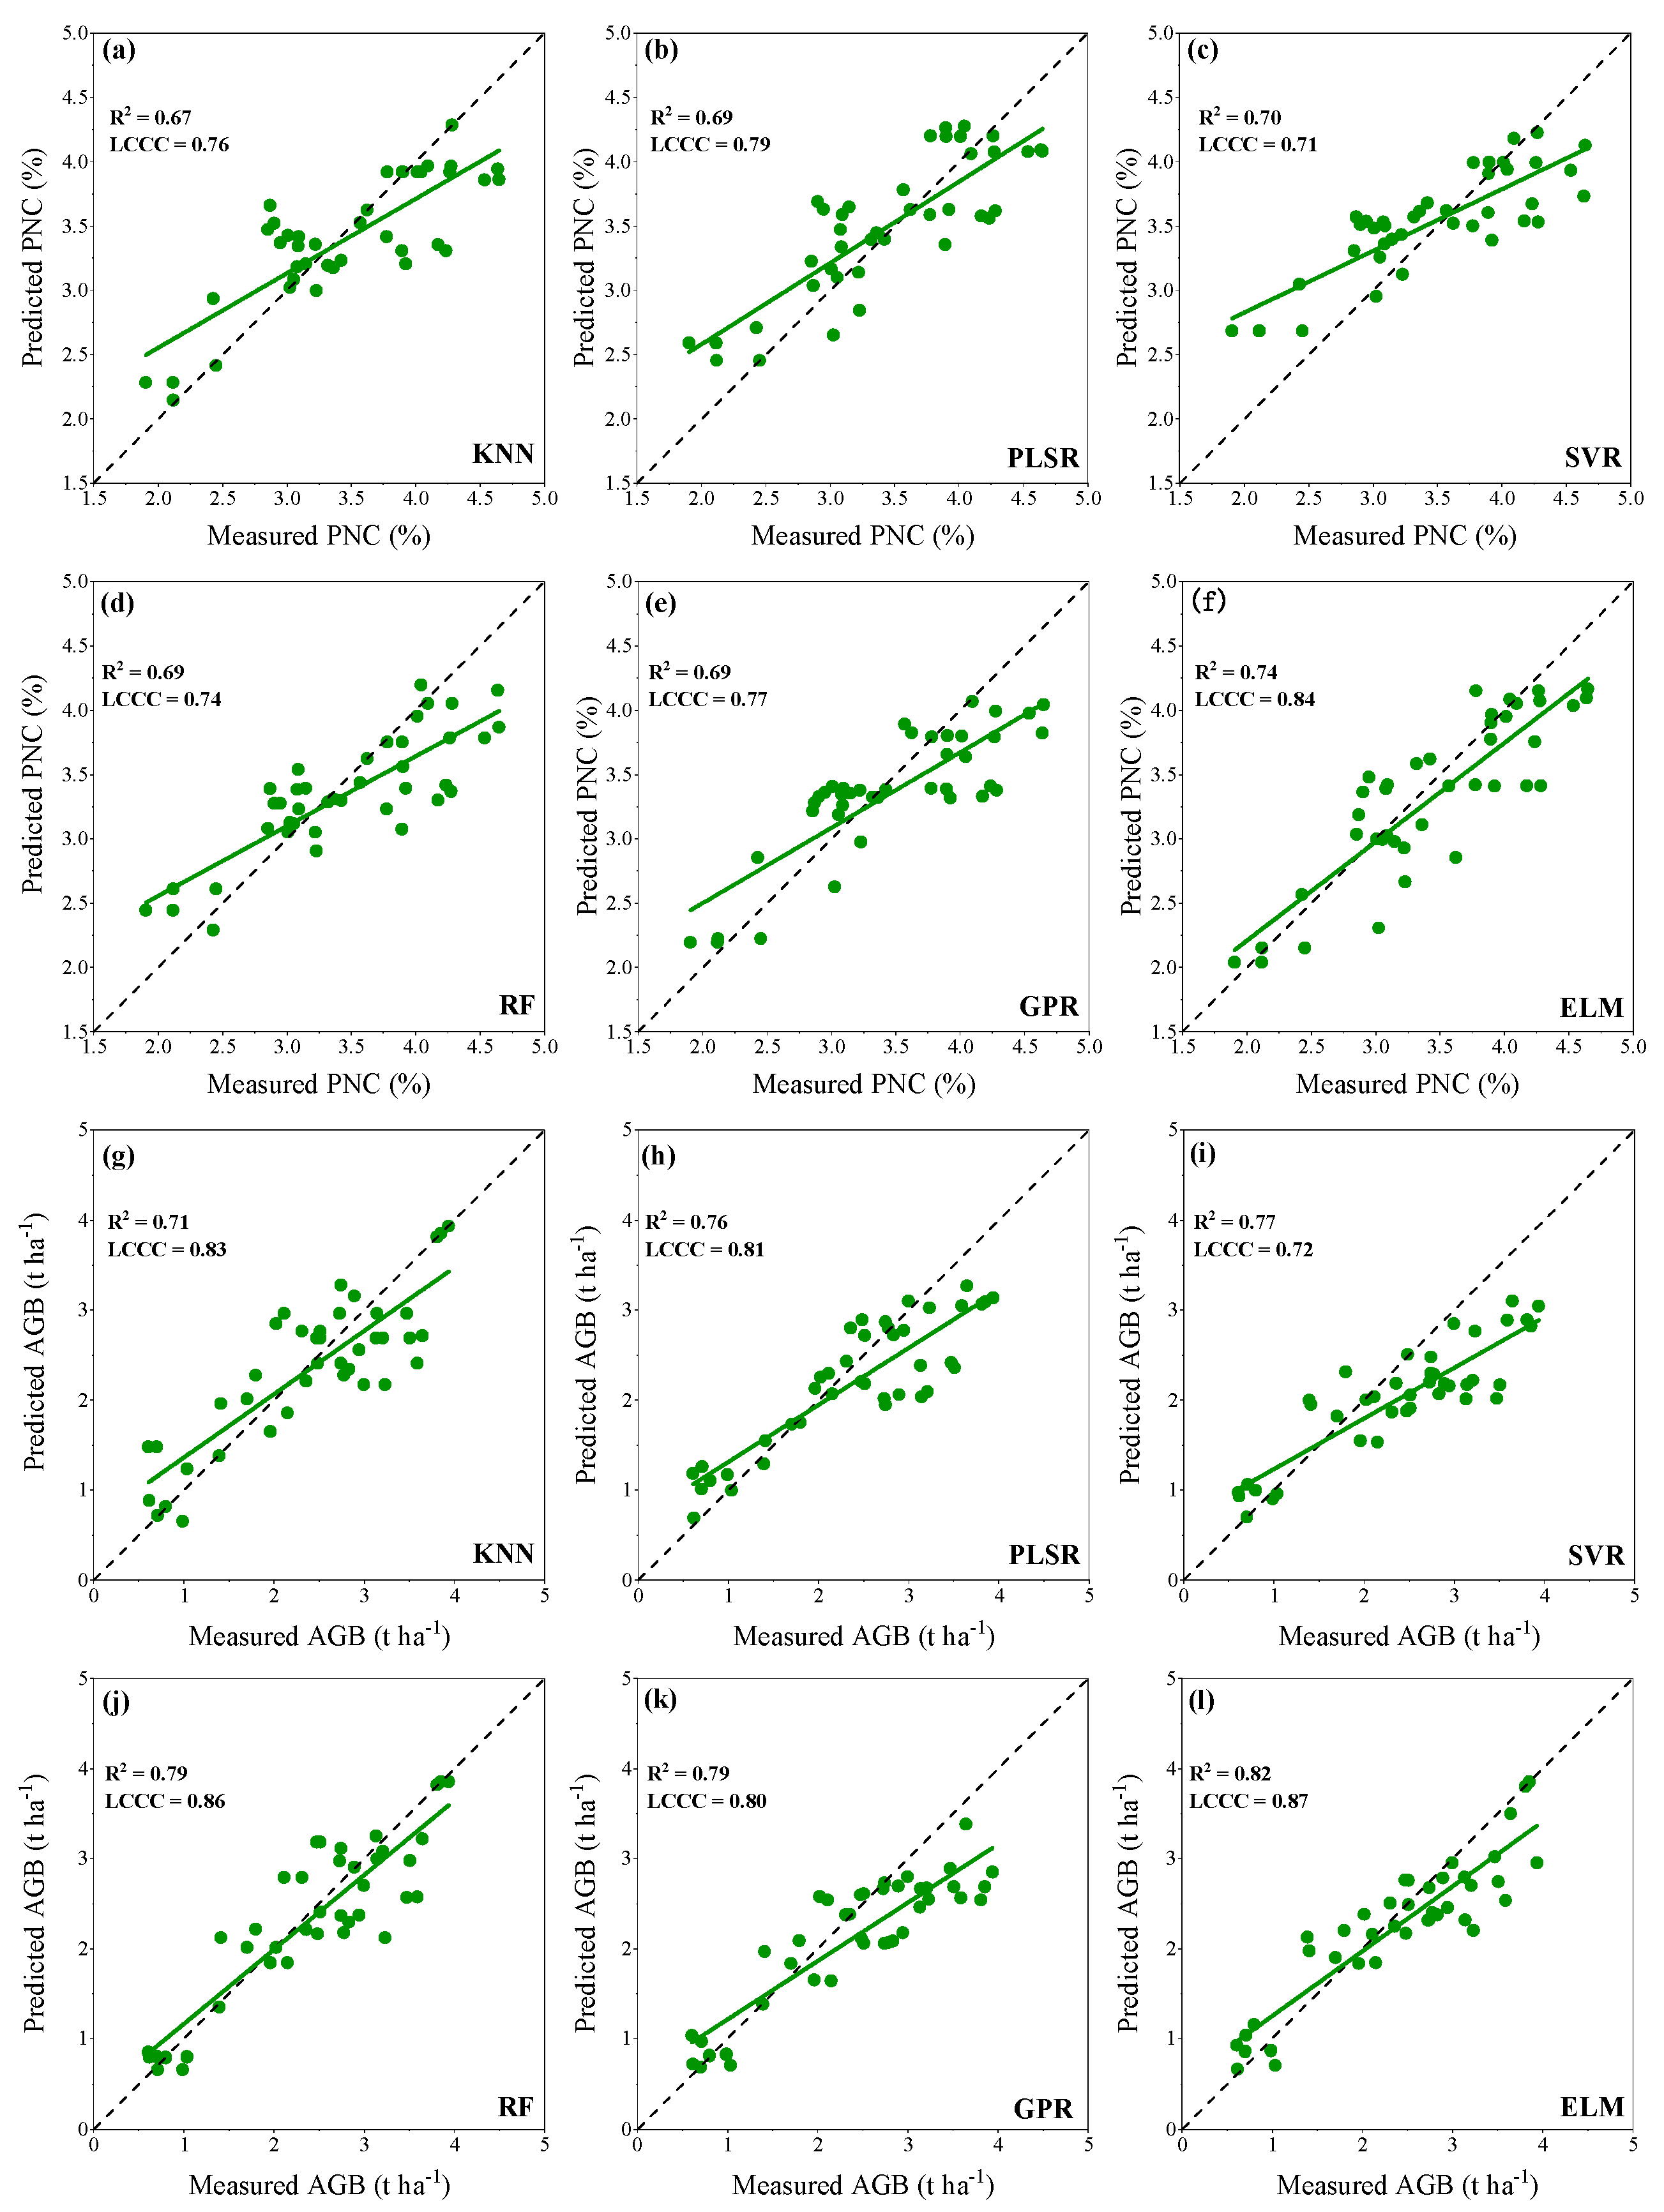
Various research studies have employed individual machine learning models and SIs to assess crop PNC and AGB [20,62,64]. However, using a single machine learning model to estimate PNC and AGB still has limitations [22]. This is due to the inconsistent effect of different single models on limited datasets. This study constructed an ELM that combined different models (KNN, PLSR, SVR, RF, and GPR) for PNC and AGB estimation. The ELM produced a better potato PNC and AGB estimate performance than traditional machine learning models for multiple growth stages (Figure 9). In addition, predicted and measured values based on the ELM were closer to the 1:1 line and had higher LCCC values than the five base models (Figure 13), significantly reducing the overfitting phenomenon. Like Yang [22], the stacking ensemble algorithm yielded the highest estimation accuracy and lowest overfitting for crop parameters. This may be because each base model produces high estimation accuracy (Figure 9), and combining the advantages of various models could improve the estimation accuracy of PNC and AGB under different growth conditions. Moreover, this study compared three ensemble learning strategies (bagging, boosting, and stacking). The results demonstrated the advantages of the stacking model for predicting potato PNC and AGB (Figure 14). Therefore, future studies should determine which base models maximize the effectiveness of ensemble learning models and explore the potential of varying ensemble learning strategies, such as bagging or boosting technology, in different crop parameter estimations.
In this study, Sentinel-2 images were used to combine ensemble learning models for the accurate estimation of potato PNC and AGB. This provides effective help with the use of remote sensing to guide N fertilizer application. Currently, many studies have used crop PNC or AGB prediction based on spectral techniques to guide N fertilizer application. For example, Peng [32] predicted potato PNC using spectral indices and random forest regression models and calculated nitrogen nutrient indices (NNIs) in combination with potato dilution curves. The predicted NNIs provided help with potato nitrogen fertilizer guidance. Therefore, in future studies, we will construct local potato dilution curves to calculate NNIs in combination with potato PNC and AGB prediction models constructed by Sentinel-2 and ensemble learning to achieve large-scale, rapid, and non-destructive potato N fertilizer management.

5. Conclusions

In this study, we compared the effectiveness of different types of SIs and different band combinations at predicting the PNC and AGB of potato. The SPA, PCA, and SPA-PCA were employed to select the optimal features to reduce multicollinearity among 14 SIs. The selected SIs were combined with six models (KNN, PLSR, SVR, RF, GPR, and ELM) for potato PNC and AGB estimation. The SIs based on chlorophyll content were strongly related to potato PNC and AGB. The sensitive bands were mainly concentrated in the red-edge (705 nm) and short-wave infrared (1610 and 2190 nm) regions. ELMs combined with SPA-PCA can effectively improve the prediction of PNC and AGB compared to other base models. The prediction performance was verified using ground-measured PNC and AGB data and the corresponding Sentinel-2 imagery. The resultant PNC and AGB maps confirmed the feasibility of predicting PNC and AGB with high-spatial-resolution Sentinel-2 imagery. This work highlights the potential value of Sentienl-2 data for the practical application of monitoring nitrogen use efficiency in agroecosystems.

Author Contributions

Experiments were designed by F.L.; H.Y. (Hang Yin), H.Y. (Haibo Yang) and Y.D. undertook the plant nitrogen concentration and aboveground biomass extractions in the field; H.Y. (Hang Yin) compiled the data and performed the machine learning analysis; H.Y. (Hang Yin) wrote the initial draft of the manuscript and F.L., Y.H. and K.Y. edited the manuscript. All authors have read and agreed to the published version of the manuscript.

Funding

This work was funded by the National Natural Science Foundation of China (32160757), Hohhot Applied Technology Research and Development Project (2023-Agriculture-5).

Data Availability Statement

The datasets used in this study are available on request from the corresponding author.

Conflicts of Interest

The authors declare no conflict of interest.

References

  1. Li, C.; Wang, X.; Guo, Z.; Huang, N.; Hou, S.; He, G.; Batchelor, W.D.; Siddique, K.H.; Wang, Z.; Zhang, D. Optimizing nitrogen fertilizer inputs and plant populations for greener wheat production with high yields and high efficiency in dryland areas. Field Crop. Res. 2021, 276, 108374. [Google Scholar] [CrossRef]
  2. Vergara-Díaz, O.; Zaman-Allah, M.A.; Masuka, B.; Hornero, A.; Zarco-Tejada, P.; Prasanna, B.M.; Cairns, J.E.; Araus, J.L. A Novel Remote Sensing Approach for Prediction of Maize Yield Under Different Conditions of Nitrogen Fertilization. Front. Plant Sci. 2016, 7, 666. [Google Scholar] [CrossRef] [PubMed]
  3. Huang, S.; Miao, Y.; Zhao, G.; Yuan, F.; Ma, X.; Tan, C.; Yu, W.; Gnyp, M.L.; Lenz-Wiedemann, V.I.; Rascher, U.; et al. Satellite Remote Sensing-Based In-Season Diagnosis of Rice Nitrogen Status in Northeast China. Remote Sens. 2015, 7, 10646–10667. [Google Scholar] [CrossRef]
  4. Chlingaryan, A.; Sukkarieh, S.; Whelan, B. Machine learning approaches for crop yield prediction and nitrogen status estimation in precision agriculture: A review. Comput. Electron. Agric. 2018, 151, 61–69. [Google Scholar] [CrossRef]
  5. Berger, K.; Verrelst, J.; Féret, J.-B.; Wang, Z.; Wocher, M.; Strathmann, M.; Danner, M.; Mauser, W.; Hank, T. Crop nitrogen monitoring: Recent progress and principal developments in the context of imaging spectroscopy missions. Remote Sens. Environ. 2020, 242, 111758. [Google Scholar] [CrossRef]
  6. Mistele, B.; Schmidhalter, U. Estimating the nitrogen nutrition index using spectral canopy reflectance measurements. Eur. J. Agron. 2008, 29, 184–190. [Google Scholar] [CrossRef]
  7. Chen, P. A Comparison of Two Approaches for Estimating the Wheat Nitrogen Nutrition Index Using Remote Sensing. Remote Sens. 2015, 7, 4527–4548. [Google Scholar] [CrossRef]
  8. Shiu, Y.S.; Chuang, Y.C. Yield estimation of paddy rice based on satellite imagery: Comparison of global and local regression models. Remote Sens. 2019, 11, 111. [Google Scholar] [CrossRef]
  9. Wang, L.; Zhou, X.; Zhu, X.; Guo, W. Estimation of leaf nitrogen concentration in wheat using the MK-SVR algorithm and satellite remote sensing data. Comput. Electron. Agric. 2017, 140, 327–337. [Google Scholar] [CrossRef]
  10. Naik, P.; Dalponte, M.; Bruzzone, L. Prediction of Forest Aboveground Biomass Using Multitemporal Multispectral Remote Sensing Data. Remote Sens. 2021, 13, 1282. [Google Scholar] [CrossRef]
  11. Xu, M.; Lacey, C.; Armstrong, S. The feasibility of satellite remote sensing and spatial interpolation to estimate cover crop biomass and nitrogen uptake in a small watershed. J. Soil Water Conserv. 2018, 73, 682–692. [Google Scholar] [CrossRef]
  12. Daughtry, C.S.; Walthall, C.L.; Kim, M.S.; De Colstoun, E.B.; McMurtrey Iii, J.E. Estimating corn leaf chlorophyll concentration from leaf and canopy reflectance. Remote Sens. Environ. 2000, 74, 229–239. [Google Scholar] [CrossRef]
  13. Haboudane, D.; Miller, J.R.; Tremblay, N.; Zarco-Tejada, P.J.; Dextraze, L. Integrated narrow-band vegetation indices for prediction of crop chlorophyll content for application to precision agriculture. Remote Sens. Environ. 2002, 81, 416–426. [Google Scholar] [CrossRef]
  14. Feng, W.; Wu, Y.; He, L.; Ren, X.; Wang, Y.; Hou, G.; Wang, Y.; Liu, W.; Guo, T. An optimized non-linear vegetation index for estimating leaf area index in winter wheat. Precis. Agric. 2019, 20, 1157–1176. [Google Scholar] [CrossRef]
  15. Zhao, Y.; Potgieter, A.B.; Zhang, M.; Wu, B.; Hammer, G.L. Predicting Wheat Yield at the Field Scale by Combining High-Resolution Sentinel-2 Satellite Imagery and Crop Modelling. Remote Sens. 2020, 12, 1024. [Google Scholar] [CrossRef]
  16. Gómez, D.; Salvador, P.; Sanz, J.; Casanova, J.L. Potato Yield Prediction Using Machine Learning Techniques and Sentinel 2 Data. Remote Sens. 2019, 11, 1745. [Google Scholar] [CrossRef]
  17. Clevers JG, P.W.; Gitelson, A.A. Remote estimation of crop and grass chlorophyll and nitrogen content using red-edge bands on Sentinel-2 and-3. Int. J. Appl. Earth Obs. Geoinf. 2013, 23, 344–351. [Google Scholar] [CrossRef]
  18. Delegido, J.; Verrelst, J.; Alonso, L.; Moreno, J. Evaluation of Sentinel-2 Red-Edge Bands for Empirical Estimation of Green LAI and Chlorophyll Content. Sensors 2011, 11, 7063–7081. [Google Scholar] [CrossRef]
  19. Gitelson, A.A.; Gritz, Y.; Merzlyak, M.N. Relationships between leaf chlorophyll content and spectral reflectance and algorithms for non-destructive chlorophyll assessment in higher plant leaves. J. Plant Physiol. 2003, 160, 271–282. [Google Scholar] [CrossRef]
  20. Yang, H.; Yin, H.; Li, F.; Hu, Y.; Yu, K. Machine learning models fed with optimized spectral indices to advance crop nitrogen monitoring. Field Crop. Res. 2023, 293, 108844. [Google Scholar] [CrossRef]
  21. Lee, H.; Wang, J.; Leblon, B. Using Linear Regression, Random Forests, and Support Vector Machine with Unmanned Aerial Vehicle Multispectral Images to Predict Canopy Nitrogen Weight in Corn. Remote Sens. 2020, 12, 2071. [Google Scholar] [CrossRef]
  22. Yang, H.; Hu, Y.; Zheng, Z.; Qiao, Y.; Zhang, K.; Guo, T.; Chen, J. Estimation of Potato Chlorophyll Content from UAV Multispectral Images with Stacking Ensemble Algorithm. Agronomy 2022, 12, 2318. [Google Scholar] [CrossRef]
  23. Prado Osco, L.; Marques Ramos, A.P.; Roberto Pereira, D.; Akemi Saito Moriya, É.; Nobuhiro Imai, N.; Takashi Matsubara, E.; Estrabis, N.; de Souza, M.; Marcato Junior, J.; Gonçalves, W.N.; et al. Predicting canopy nitrogen content in citrus-trees using random forest algorithm associated to spectral vegetation indices from UAV-imagery. Remote Sens. 2019, 11, 2925. [Google Scholar] [CrossRef]
  24. Chen, Z.; Jia, K.; Xiao, C.; Wei, D.; Zhao, X.; Lan, J.; Wei, X.; Yao, Y.; Wang, B.; Sun, Y.; et al. Leaf Area Index Estimation Algorithm for GF-5 Hyperspectral Data Based on Different Feature Selection and Machine Learning Methods. Remote Sens. 2020, 12, 2110. [Google Scholar] [CrossRef]
  25. Zhang, X.; Zhang, K.; Sun, Y.; Zhao, Y.; Zhuang, H.; Ban, W.; Chen, Y.; Fu, E.; Chen, S.; Liu, J.; et al. Combining Spectral and Texture Features of UAS-Based Multispectral Images for Maize Leaf Area Index Estimation. Remote Sens. 2022, 14, 331. [Google Scholar] [CrossRef]
  26. Zhang, J.; Cheng, T.; Guo, W.; Xu, X.; Qiao, H.; Xie, Y.; Ma, X. Leaf area index estimation model for UAV image hyperspectral data based on wavelength variable selection and machine learning methods. Plant Methods 2021, 17, 49. [Google Scholar] [CrossRef]
  27. Sripada, R.P.; Heiniger, R.W.; White, J.G.; Weisz, R. Aerial Color Infrared Photography for Determining Late-Season Nitrogen Requirements in Corn. Agron. J. 2005, 97, 1443–1451. [Google Scholar] [CrossRef]
  28. Sripada, R.P.; Farrer, D.C.; Weisz, R.; Heiniger, R.W.; White, J.G. Aerial Color Infrared Photography to Optimize In-Season Nitrogen Fertilizer Recommendations in Winter Wheat. Agron. J. 2007, 99, 1424–1435. [Google Scholar] [CrossRef]
  29. Holland, K.H.; Schepers, J.S. Derivation of a Variable Rate Nitrogen Application Model for In-Season Fertilization of Corn. Agron. J. 2010, 102, 1415–1424. [Google Scholar] [CrossRef]
  30. Holland, K.H.; Schepers, J.S. Use of a virtual-reference concept to interpret active crop canopy sensor data. Precis. Agric. 2012, 14, 71–85. [Google Scholar] [CrossRef]
  31. van Evert, F.K.; Booij, R.; Jukema, J.N.; ten Berge, H.F.; Uenk, D.; Meurs, E.B.; van Geel, W.C.; Wijnholds, K.H. Using crop reflectance to determine sidedress N rate in potato saves N and maintains yield. Eur. J. Agron. 2012, 43, 58–67. [Google Scholar] [CrossRef]
  32. Peng, J.; Manevski, K.; Kørup, K.; Larsen, R.; Andersen, M.N. Random forest regression results in accurate assessment of potato nitrogen status based on multispectral data from different platforms and the critical concentration approach. Field Crop. Res. 2021, 268, 108158. [Google Scholar] [CrossRef]
  33. Zhou, Z.; Plauborg, F.; Thomsen, A.G.; Andersen, M.N. A RVI/LAI-reference curve to detect N stress and guide N fertigation using combined information from spectral reflectance and leaf area measurements in potato. Eur. J. Agron. 2017, 87, 1–7. [Google Scholar] [CrossRef]
  34. Yang, H.; Li, F.; Wang, W.; Yu, K. Estimating Above-Ground Biomass of Potato Using Random Forest and Optimized Hyperspectral Indices. Remote Sens. 2021, 13, 2339. [Google Scholar] [CrossRef]
  35. Yang, H.; Li, F.; Hu, Y.; Yu, K. Hyperspectral indices optimization algorithms for estimating canopy nitrogen concentration in potato (Solanum tuberosum L.). Int. J. Appl. Earth Obs. Geoinf. 2021, 102, 102416. [Google Scholar] [CrossRef]
  36. Rouse, J.W., Jr.; Haas, R.H.; Deering, D.W.; Schell, J.A.; Harlan, J.C. Monitoring the Vernal Advancement and Retrogradation (Green Wave Effect) of Natural Vegetation. [Great Plains Corridor]; NASA: Washington, DC, USA, 1974.
  37. Jordan, C.F. Derivation of Leaf-Area Index from Quality of Light on the Forest Floor. Ecology 1969, 50, 663–666. [Google Scholar] [CrossRef]
  38. Tucker, C.J. Red and photographic infrared linear combinations for monitoring vegetation. Remote Sens. Environ. 1979, 8, 127–150. [Google Scholar] [CrossRef]
  39. Rondeaux, G.; Steven, M.; Baret, F. Optimization of soil-adjusted vegetation indices. Remote Sens. Environ. 1996, 55, 95–107. [Google Scholar] [CrossRef]
  40. Dash, J.; Curran, P.J. The MERIS terrestrial chlorophyll index. Int. J. Remote Sens. 2004, 25, 5403–5413. [Google Scholar] [CrossRef]
  41. Merzlyak, M.N.; Gitelson, A.A.; Chivkunova, O.B.; Rakitin, V.Y. Non-destructive optical detection of pigment changes during leaf senescence and fruit ripening. Physiol. Plant. 1999, 106, 135–141. [Google Scholar] [CrossRef]
  42. Sims, D.A.; Gamon, J.A. Relationships between leaf pigment content and spectral reflectance across a wide range of species, leaf structures and developmental stages. Remote Sens. Environ. 2002, 81, 337–354. [Google Scholar] [CrossRef]
  43. Li, F.; Mistele, B.; Hu, Y.; Yue, X.; Yue, S.; Miao, Y.; Chen, X.; Cui, Z.; Meng, Q.; Schmidhalter, U. Remotely estimating aerial N status of phenologically differing winter wheat cultivars grown in contrasting climatic and geographic zones in China and Germany. Field Crop. Res. 2012, 138, 21–32. [Google Scholar] [CrossRef]
  44. Zarco-Tejada, P.; Miller, J.; Morales, A.; Berjón, A.; Agüera, J. Hyperspectral indices and model simulation for chlorophyll estimation in open-canopy tree crops. Remote Sens. Environ. 2004, 90, 463–476. [Google Scholar] [CrossRef]
  45. Fan, L.; Zhao, J.; Xu, X.; Liang, D.; Yang, G.; Feng, H.; Yang, H.; Wang, Y.; Chen, G.; Wei, P. Hyperspectral-Based Estimation of Leaf Nitrogen Content in Corn Using Optimal Selection of Multiple Spectral Variables. Sensors 2019, 19, 2898. [Google Scholar] [CrossRef] [PubMed]
  46. Howley, T.; Madden, M.G.; O’Connell, M.L.; Ryder, A.G. The effect of principal component analysis on machine learning accuracy with high dimensional spectral data. In International Conference on Innovative Techniques and Applications of Artificial Intelligence; Springer: London, UK, 2005; pp. 209–222. [Google Scholar]
  47. Ji, Y.; Liu, R.; Xiao, Y.; Cui, Y.; Chen, Z.; Zong, X.; Yang, T. Faba bean above-ground biomass and bean yield estimation based on consumer-grade unmanned aerial vehicle RGB images and ensemble learning. Precis. Agric. 2023, 24, 1439–1460. [Google Scholar] [CrossRef]
  48. Ji, S.; Gu, C.; Xi, X.; Zhang, Z.; Hong, Q.; Huo, Z.; Zhao, H.; Zhang, R.; Li, B.; Tan, C. Quantitative Monitoring of Leaf Area Index in Rice Based on Hyperspectral Feature Bands and Ridge Regression Algorithm. Remote Sens. 2022, 14, 2777. [Google Scholar] [CrossRef]
  49. Li, F.; Mistele, B.; Hu, Y.; Chen, X.; Schmidhalter, U. Reflectance estimation of canopy nitrogen content in winter wheat using optimised hyperspectral spectral indices and partial least squares regression. Eur. J. Agron. 2014, 52, 198–209. [Google Scholar] [CrossRef]
  50. Yang, B.; Wang, M.; Sha, Z.; Wang, B.; Chen, J.; Yao, X.; Cheng, T.; Cao, W.; Zhu, Y. Evaluation of Aboveground Nitrogen Content of Winter Wheat Using Digital Imagery of Unmanned Aerial Vehicles. Sensors 2019, 19, 4416. [Google Scholar] [CrossRef]
  51. Fu, Y.; Yang, G.; Li, Z.; Song, X.; Li, Z.; Xu, X.; Wang, P.; Zhao, C. Winter Wheat Nitrogen Status Estimation Using UAV-Based RGB Imagery and Gaussian Processes Regression. Remote Sens. 2020, 12, 3778. [Google Scholar] [CrossRef]
  52. Joshi, A.; Pradhan, B.; Chakraborty, S.; Behera, M.D. Winter wheat yield prediction in the conterminous United States using solar-induced chlorophyll fluorescence data and XGBoost and random forest algorithm. Ecol. Inform. 2023, 77, 102194. [Google Scholar] [CrossRef]
  53. Lawrence, I.; Lin, K. A concordance correlation coefficient to evaluate reproducibility. Biometrics 1989, 45, 255–268. [Google Scholar]
  54. Li, F.; Mistele, B.; Hu, Y.; Chen, X.; Schmidhalter, U. Optimising three-band spectral indices to assess aerial N concentration, N uptake and aboveground biomass of winter wheat remotely in China and Germany. ISPRS J. Photogramm. Remote Sens. 2014, 92, 112–123. [Google Scholar] [CrossRef]
  55. Rao, N.R.; Garg, P.K.; Ghosh, S.K.; Dadhwal, V.K. Estimation of leaf total chlorophyll and nitrogen concentrations using hyperspectral satellite imagery. J. Agric. Sci. 2008, 146, 65–75. [Google Scholar]
  56. Houborg, R.; Soegaard, H.; Boegh, E. Combining vegetation index and model inversion methods for the extraction of key vegetation biophysical parameters using Terra and Aqua MODIS reflectance data. Remote Sens. Environ. 2007, 106, 39–58. [Google Scholar] [CrossRef]
  57. Dong, T.; Liu, J.; Shang, J.; Qian, B.; Ma, B.; Kovacs, J.M.; Walters, D.; Jiao, X.; Geng, X.; Shi, Y. Assessment of red-edge vegetation indices for crop leaf area index estimation. Remote Sens. Environ. 2018, 222, 133–143. [Google Scholar] [CrossRef]
  58. Jiang, X.; Fang, S.; Huang, X.; Liu, Y.; Guo, L. Rice Mapping and Growth Monitoring Based on Time Series GF-6 Images and Red-Edge Bands. Remote Sens. 2021, 13, 579. [Google Scholar] [CrossRef]
  59. Perich, G.; Aasen, H.; Verrelst, J.; Argento, F.; Walter, A.; Liebisch, F. Crop nitrogen retrieval methods for simulated sentinel-2 data using in-field spectrometer data. Remote Sens. 2021, 13, 2404. [Google Scholar] [CrossRef]
  60. Justes, E.; Mary, B.; Meynard, J.M.; Machet, J.M.; Thelier-Huché, L. Determination of a critical nitrogen dilution curve for winter wheat crops. Ann. Bot. 1994, 74, 397–407. [Google Scholar] [CrossRef]
  61. Huang, S.; Miao, Y.; Yuan, F.; Gnyp, M.L.; Yao, Y.; Cao, Q.; Wang, H.; Lenz-Wiedemann, V.I.S.; Bareth, G. Potential of RapidEye and WorldView-2 Satellite Data for Improving Rice Nitrogen Status Monitoring at Different Growth Stages. Remote Sens. 2017, 9, 227. [Google Scholar] [CrossRef]
  62. Zha, H.; Miao, Y.; Wang, T.; Li, Y.; Zhang, J.; Sun, W.; Feng, Z.; Kusnierek, K. Improving Unmanned Aerial Vehicle Remote Sensing-Based Rice Nitrogen Nutrition Index Prediction with Machine Learning. Remote Sens. 2020, 12, 215. [Google Scholar] [CrossRef]
  63. Hasituya; Li, F.; Elsayed, S.; Hu, Y.; Schmidhalter, U. Passive reflectance sensing using optimized two- and three-band spectral indices for quantifying the total nitrogen yield of maize. Comput. Electron. Agric. 2020, 173, 105403. [Google Scholar] [CrossRef]
  64. Chen, B.; Lu, X.; Yu, S.; Gu, S.; Huang, G.; Guo, X.; Zhao, C. The Application of Machine Learning Models Based on Leaf Spectral Reflectance for Estimating the Nitrogen Nutrient Index in Maize. Agriculture 2022, 12, 1839. [Google Scholar] [CrossRef]
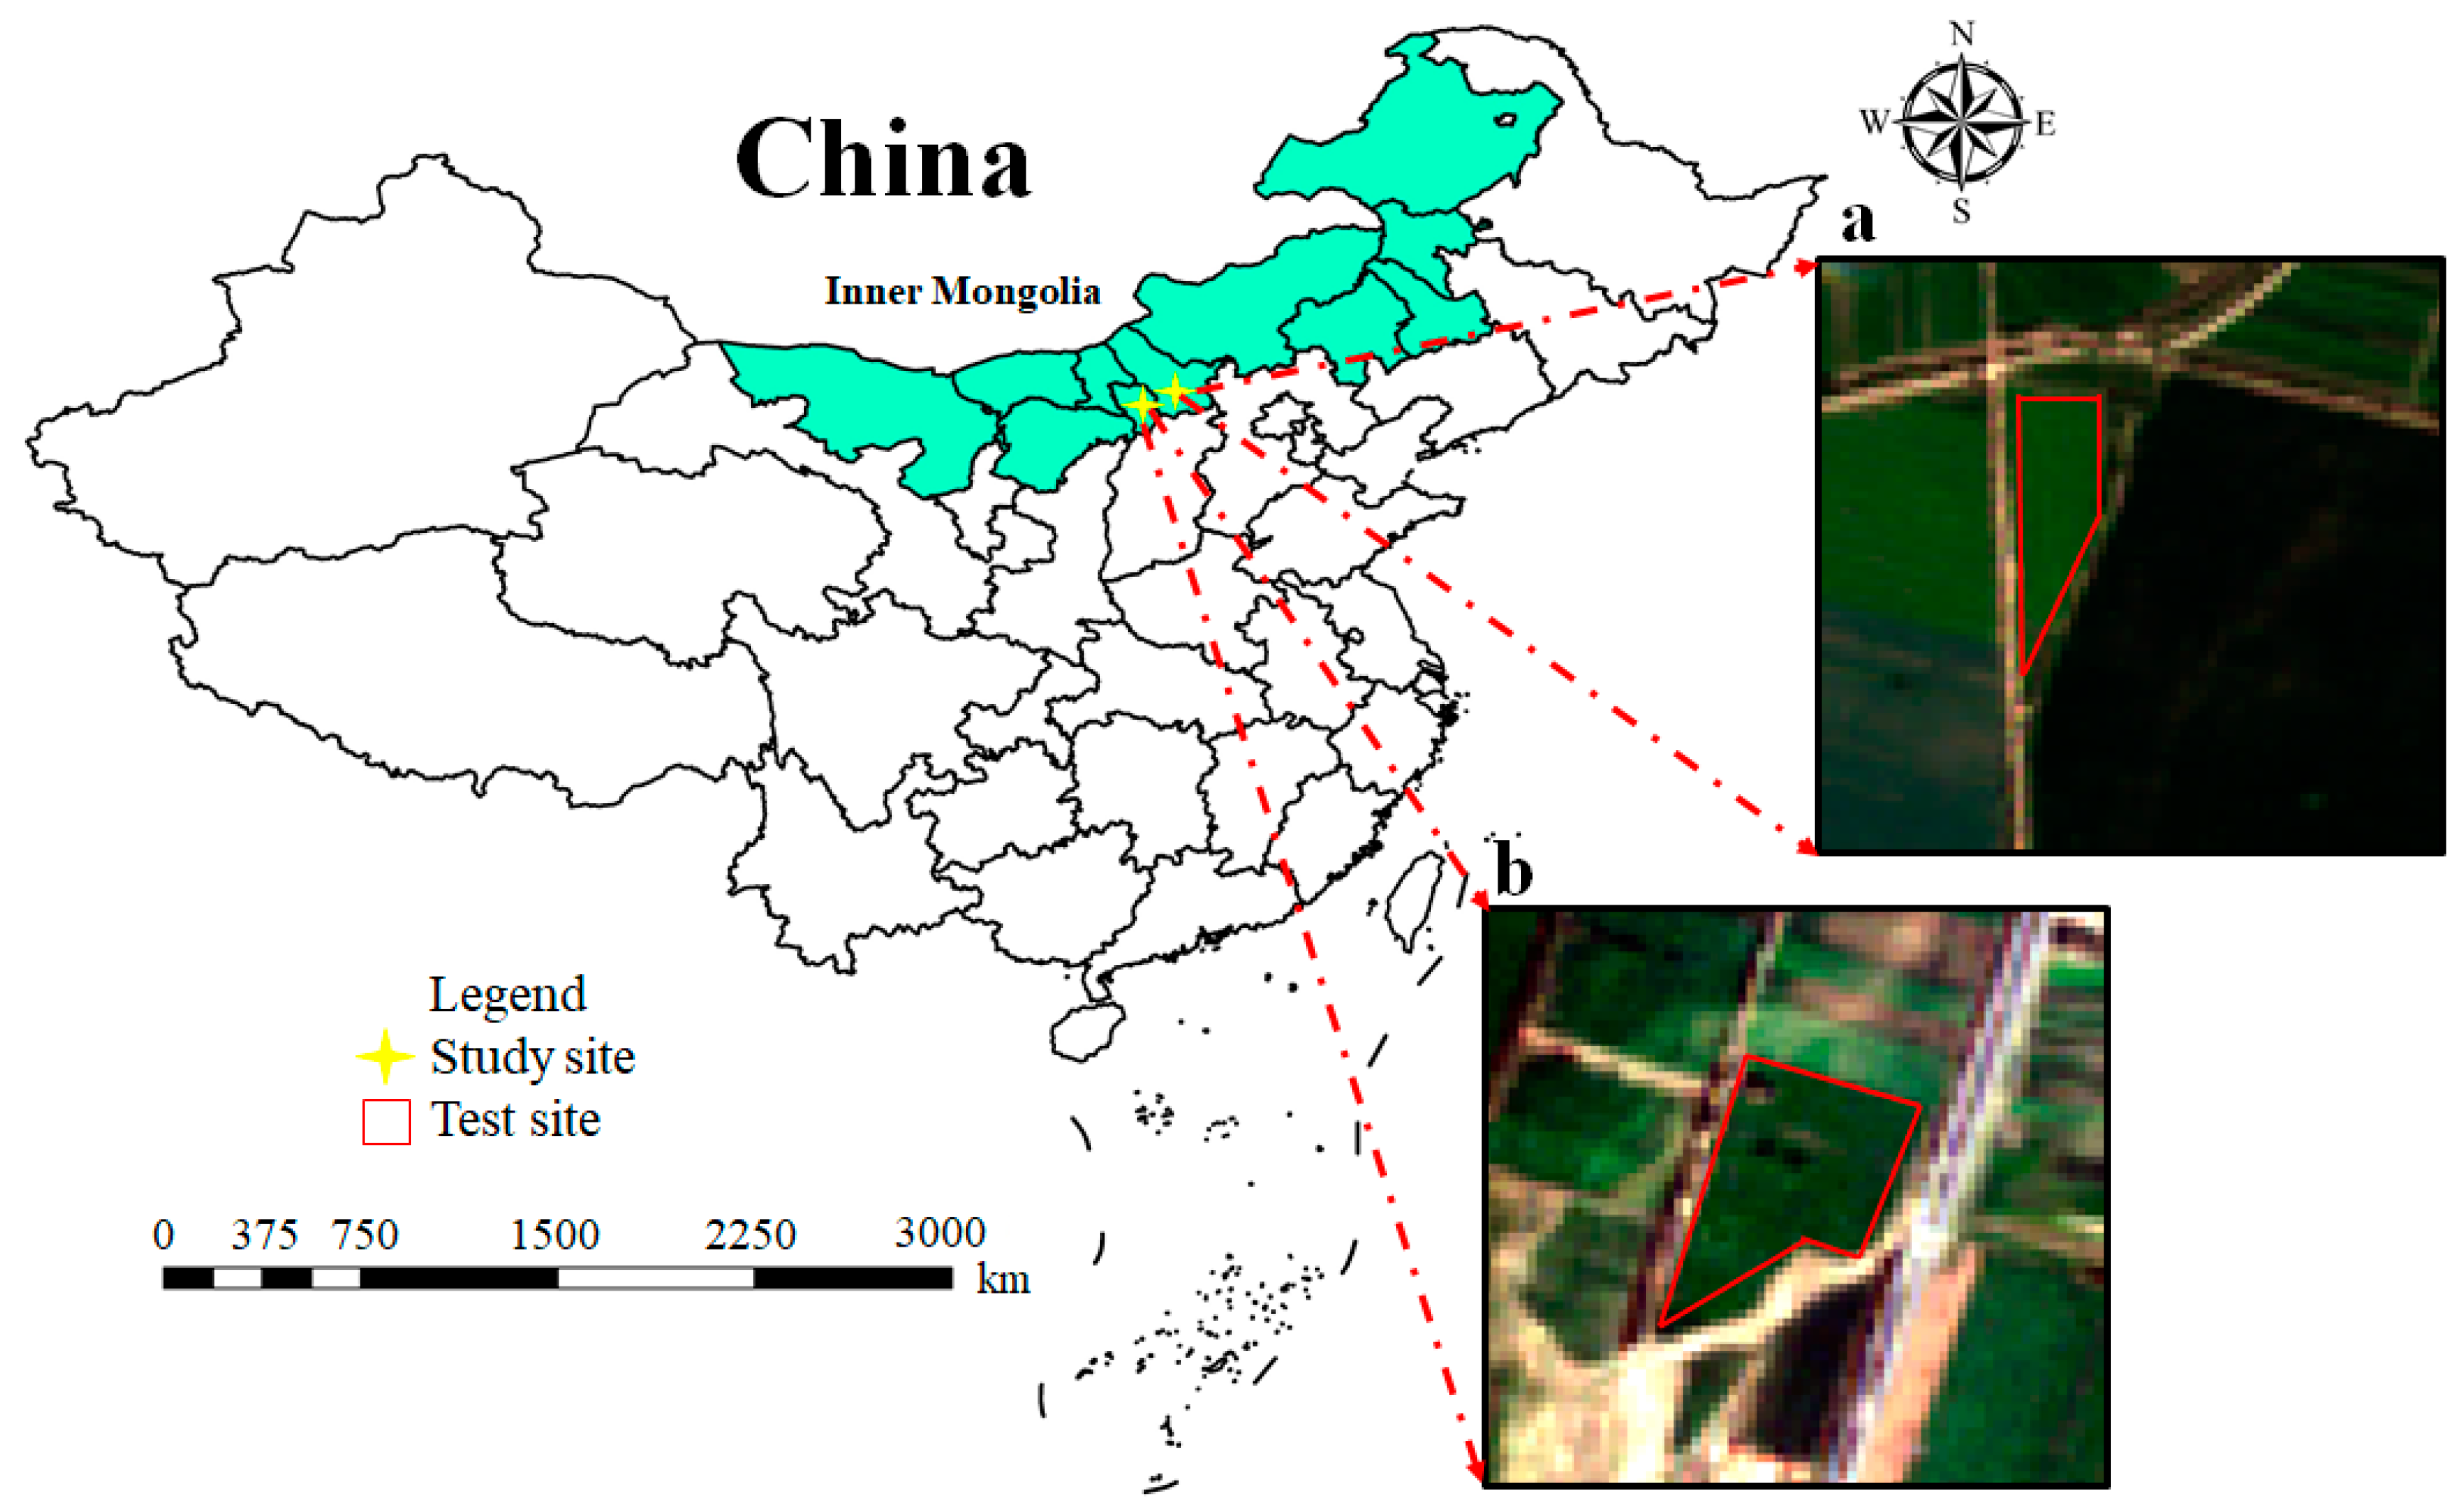
Figure 1. Experimental design at two study sites: (a) at Zhuozi in 2020 and (b) at Wuchan in 2021.
Remotesensing 16 00349 g001
Figure 2. The workflow of the ensemble learning model for PNC and AGB estimation.
Remotesensing 16 00349 g002
Figure 3. Flowchart of potato PNC and AGB estimation modeling methods.
Remotesensing 16 00349 g003
Figure 4. The performance of the estimation of six models for PNC (af) and AGB (gl) without dimensionality reduction. Six models are as follows: K-nearest neighbor (a,g), partial least squares regression (b,h), support vector regression (c,i), random forest (d,j), Gaussian process regression (e,k), ensemble learning model (f,l).
Remotesensing 16 00349 g004
Figure 5. Input variables selection based on SPA algorithm. The red arrows represent the number of variables with the smallest RMSE (%). PNC: NDVI, RVI, MCARI, PSRI, NPDI, MCARI/OSAVI (a); AGB: OSAVI, MTCI, MCARI, PSRI, TCARI, MCARI/OSAVI (b).
Remotesensing 16 00349 g005
Figure 6. The performance of six SPA-based models: PNC (af); AGB (gl). K-nearest neighbor (a,g), partial least squares regression (b,h), support vector regression (c,i), random forest (d,j), Gaussian process regression (e,k), ensemble learning model (f,l).
Remotesensing 16 00349 g006
Figure 7. Input variables selection based on PCA algorithm. PNC (a), AGB (b).
Remotesensing 16 00349 g007
Figure 8. The performance of six PCA-based models: PNC (af), AGB (gl). K-nearest neighbor (a,g), partial least squares regression (b,h), support vector regression (c,i), random forest (d,j), Gaussian process regression (e,k), ensemble learning model (f,l).
Remotesensing 16 00349 g008
Figure 9. R2, RMSE, and RPD of six models for potato PNC (ac) and AGB (df) estimation. Original: 14 SIs as input variables; SPA: SPA-based input variables; PCA: PCA-based input variables; SPA-PCA: input variables based on SPA-PCA; K-nearest neighbor (KNN); partial least squares regression (PLSR); support vector regression (SVR); random forest (RF); Gaussian process regression (GPR); ensemble learning model (ELM).
Remotesensing 16 00349 g009
Figure 10. Spatial distribution of the estimation of PNC (a) and AGB (b) based on ELM method at different growth stages (T1: tuber-formation stage; T2: tuber-bulking stage; and T3: starch-accumulation stage).
Remotesensing 16 00349 g010
Figure 11. Correlation analysis of potato yield (t ha−1) with PNC (a) and AGB (b) during different growth stages (T1: tuber-formation stage; T2: tuber-bulking stage; and T3: starch-accumulation stage).
Remotesensing 16 00349 g011
Figure 12. Relationship between measured and estimated PNC and AGB. PNC and AGB values estimated using the ensemble learning model with the optimal input variables.
Remotesensing 16 00349 g012
Figure 13. Evaluation of the performance of six models based on SPA-PCA. Six models: PNC (af), AGB (gl). K-nearest neighbor (a,g), partial least squares regression (b,h), support vector regression (c,i), random forest (d,j), Gaussian process regression (e,k), ensemble learning model (f,l).
Remotesensing 16 00349 g013
Figure 14. Evaluating the performance of RF (a,d), XGBoost (b,e), and ELM (c,f) based on SPA-PCA.
Remotesensing 16 00349 g014
Table 1. Summary of PNC and AGB of potato.
StagesNumberMinMaxMeanSD
Plant nitrogen concentration (%)
Tuber formation (T1)443.334.664.080.33
Tuber bulking (T2)442.644.283.470.40
Starch accumulation (T3)441.543.972.840.56
Calibration921.544.663.510.67
Validation401.804.643.360.65
Plant aboveground biomass (t ha−1)
Tuber formation (T1)440.502.371.290.60
Tuber bulking (T2)441.394.082.560.57
Starch accumulation (T3)441.394.792.980.85
Calibration920.504.792.231.00
Validation400.603.932.390.98
Table 2. Summary of Sentinel-2 image data.
BandBand NameCenter WavelengthBandwidth (nm)Ground Resolution (m)
B1Coastal aerosol44320.0060
B2Blue49065.0010
B3Green56035.0010
B4Red66530.0010
B5RE170515.0020
B6RE274015.0020
B7RE378320.0020
B8NIR1842115.0010
B8aNIR286520.0020
B9Water vapour94520.0060
B10SWIR-cirrus137530.0060
B11SWIR1161090.0020
B12SWIR22190180.0020
RE: Red-edge band; NIR: near infrared band; SWIR: short-wave infrared.
Table 3. The spectral indices used in this work.
AbbreviationFormulasAlgorithmsVariableReferences
NDVI(NIR − Red)/(NIR + Red)(Rλ1 − Rλ2)/(Rλ1 + Rλ2)Biomass/Others[36]
RVINIR/RedRλ1/Rλ2Vegetation[37]
DVINIR − RedRλ1 − Rλ2Vegetation[38]
CIred edge(NIR/Green) − 1(Rλ1/Rλ2) − 1Chlorophyll/LAI[19]
OSAVI1.16 × (NIR − Red)/(NIR + Red + 0.16)1.16 × (Rλ1 − Rλ2)/(Rλ1 + Rλ2 + 0.16)Vegetation[39]
MTCI(Rededge2 − Rededge1)/(Rededge1 − Red)(Rλ1 − Rλ2)/(Rλ2 − Rλ3)Chlorophyll[40]
MCARI[(Rededge1 − Red) − 0.2 × (Rededge1 − Green)] × (Rededge1/Red)[(Rλ1 − Rλ2) − 0.2 × (Rλ1 − Rλ3)] × (Rλ1/Rλ2)Chlorophyll[12]
PSRI(Red − Green)/Rededge2(Rλ1 − Rλ2)/Rλ3Vegetation[41]
mSR705(Rededge2 − Blue)/(Rededge1 − Blue)(Rλ1 − Rλ2)/(Rλ3 − Rλ2)Chlorophyll[42]
mND705(Rededge2 − Blue)/(Rededge2 + Rededge1 − 2 × Blue)(Rλ1 − Rλ2)/(Rλ1 + Rλ2 − 2 × Rλ3)Chlorophyll[42]
TCARI3 × [(Rededge1 − Red) − 0.2 × (Rededge1 − Green) × (Rededge1/Red)]3 × [(Rλ1 − Rλ2) − 0.2 × (Rλ1 − Rλ3) × (Rλ1/Rλ2)]Chlorophyll[13]
NPDI(CIrededge − CIrededge MIN)/(CIrededge MAX − CIrededge MIN(CIrededge − CIrededge MIN)/(CIrededge MAX − CIrededge MIN)Nitrogen[43]
MCARI/OSAVIMCARI/OSAVIMCARI/OSAVIChlorophyll[44]
TCARI/OSAVITCARI/OSAVITCARI/OSAVIChlorophyll[13]
R: the abbreviation of reflectance; λ: the wavebands of spectral indices.
Table 4. Optimal bands for estimating PNC and AGB of potato.
Spectral IndicesPNC AGB
Rλ1Rλ2Rλ3R2Rλ1Rλ2Rλ3R2
NDVI7052190 0.53490842 0.39
RVI7052190 0.49490842 0.33
DVI7051610 0.655601610 0.56
CIred edge7052190 0.49490842 0.33
OSAVI4902190 0.565601610 0.40
MTCI70586516100.62842161021900.40
MCARI70570516100.6556056016100.57
PSRI865161021900.57842161021900.40
mSR70570586516100.62842161021900.40
mND70549056021900.6049084216100.47
TCARI70570516100.6556070516100.59
NPDI705161021900.624907838420.40
MCARI/OSAVI70586516100.6556070516100.59
TCARI/OSAVI70586516100.6556070516100.59
R: the abbreviations of reflectance; λ: the wavebands of spectral indices; R2: the coefficient of determination.
Table 5. Correlation coefficient between SIs and PNC and between SIs and AGB across different growth stages *.
Spectral IndicesPNCAGB
T1T2 + T3T1T2 + T3
NDVI−0.310.560.260.02
RVI−0.310.520.220.03
DVI0.490.65−0.77−0.39
CIred edge−0.310.520.220.03
OSAVI−0.100.580.42−0.41
MTCI0.27−0.710.69−0.33
MCARI0.490.650.900.39
PSRI0.22−0.590.46−0.42
mSR705−0.270.71−0.690.33
mND7050.29−0.65−0.590.02
TCARI0.500.67−0.88−0.43
NPDI−0.290.66−0.310.03
MCARI/OSAVI0.350.72−0.83−0.43
TCARI/OSAVI0.350.72−0.83−0.43
* T1: tuber-formation stage; T2: tuber-bulking stage; and T3: starch-accumulation stage.
Disclaimer/Publisher’s Note: The statements, opinions and data contained in all publications are solely those of the individual author(s) and contributor(s) and not of MDPI and/or the editor(s). MDPI and/or the editor(s) disclaim responsibility for any injury to people or property resulting from any ideas, methods, instructions or products referred to in the content.