Article

Monitoring Long-Term Land Cover Change in Central Yakutia Using Sparse Time Series Landsat Data

1
Department of Geoinformation Engineering, Sejong University, 209 Neungdong-ro, Gwangjin-gu, Seoul 05006, Republic of Korea
2
Department of Energy and Mineral Resources Engineering, Sejong University, 209 Neungdong-ro, Gwangjin-gu, Seoul 05006, Republic of Korea
*
Author to whom correspondence should be addressed.
Remote Sens. 2024, 16(11), 1868; https://doi.org/10.3390/rs16111868
Submission received: 24 February 2024 / Revised: 13 May 2024 / Accepted: 21 May 2024 / Published: 23 May 2024

Abstract

:
Recently, as global climate change and local disturbances such as wildfires continue, long- and short-term changes in the high-latitude vegetation systems have been observed in various studies. Although remote sensing technology using optical satellites has been widely used in understanding vegetation dynamics in high-latitude areas, there has been limited understanding of various landscape changes at different spatiotemporal scales, their mutual relationships, and overall long-term landscape changes. The objective of this study is to devise a change monitoring strategy that can effectively observe landscape changes at different spatiotemporal scales in the boreal ecosystems from temporally sparse time series remote sensing data. We presented a new post-classification-based change analysis scheme and applied it to time series Landsat data for the central Yakutian study area. Spectral variability between time series data has been a major problem in the analysis of changes that make it difficult to distinguish long- and short-term land cover changes from seasonal growth activities. To address this issue effectively, two ideas in the time series classification, such as the stepwise classification and the lateral stacking strategies were implemented in the classification process. The proposed classification results showed consistently higher overall accuracies of more than 90% obtained in all classes throughout the study period. The temporal classification results revealed the distinct spatial and temporal patterns of the land cover changes in central Yakutia. The spatiotemporal distribution of the short-term class illustrated that the ecosystem disturbance caused by fire could be affected by local thermal and hydrological conditions of the active layer as well as climatic conditions. On the other hand, the long-term class changes revealed land cover trajectories that could not be explained by monotonic increase or decrease. To characterize the long-term land cover change patterns, we applied a piecewise linear model with two line segments to areal class changes. During the former half of the study period, which corresponds to the 2000s, the areal expansion of lakes on the eastern Lena River terrace was the dominant feature of the land cover change. On the other hand, the land cover changes in the latter half of the study period, which corresponds to the 2010s, exhibited that lake area decreased, particularly in the thermokarst lowlands close to the Lena and Aldan rivers. In this area, significant forest decline can also be identified during the 2010s.

1. Introduction

Recent climate change has affected terrestrial ecosystems, causing various forest disturbances in many regions [1]. In particular, as important tipping elements vulnerable to perturbations in the climate system [2], arctic tundra and subarctic boreal forest ecosystems have been active research topics in various studies. As climate change and local disturbances such as wildfires continue, changes in the composition, structure, and spatial distribution of high-latitude ecosystems, e.g., tundra greening and treeline shifts, have been observed [3,4,5,6,7]. Climate- or ecosystem-driven permafrost degradations, e.g., thermokarst development, shrubification, and lake drainage, can also lead to local and regional changes to the vegetation structure and composition [8,9,10,11,12].
Remote sensing technology using optical satellites has been used as one of the most important tools in understanding various temporal and spatial changes in permafrost vegetation systems. In particular, coarse-resolution images such as Moderate-Resolution Imaging Spectroradiometer (MODIS) and Advanced Very-High-Resolution Radiometer (AVHRR) have been applied to the observation and quantification of pan-Arctic scale vegetation changes [13,14,15,16,17,18]. The MODIS and AVHRR time series images have also been used for monitoring the thermal state of permafrost regions [19,20,21] and detecting wildfires [22,23,24,25]. The composition and structures of the subarctic and boreal vegetation systems and their seasonal and annual variations can be spatially and temporally complex and heterogeneous. To capture detailed or localized features of various eco-types, higher-resolution optical satellite data such as Landsat series have been widely used in the subarctic boreal environments [26,27,28]. The optical images have also been used for understanding spatially detailed changes in periglacial landforms, particularly in association with thermokarst processes by analyzing trends of surface reflectance or by using post-classification analysis [9,29,30,31,32,33,34,35].
To deduce changes in interest in the complex and heterogeneous boreal environments, previous studies usually focused on a selected component among various boreal land covers. Therefore, there has been limited understanding of complex land cover changes at different spatiotemporal scales (e.g., thermokarst development, lake expansion/drainage, gradual vegetation degradation, wildfires), their mutual relationships, and overall long-term landscape changes. In order to observe various changes in the permafrost environments from time series optical data, it is important to minimize the scene-dependent spatiotemporal variability in the spectral response, including solar elevation, atmospheric conditions, vegetation phenology, and other observation artifacts. In this context, Ai et al. [36] proposed an object-based classification strategy that considers annual consistency by minimizing spectral variability to observe long-term changes in land covers. Similarly, Nyland et al. [37] attempted to reduce temporal spectral fluctuation in classification results by stacking several Landsat images acquired each year into one representative image. These studies suggest an effective post-classification methodology to retrieve long-term land cover changes from time series Landsat data but require sufficiently dense observations for different seasons. However, in the high-latitude boreal ecosystem, it is often difficult to obtain dense time series observations due to a long winter and a short and rapidly progressing growing season with frequent cloud cover.
This study aims to observe long-term land cover changes in the central Yakutian boreal ecosystem using temporally irregular and sparse time series Landsat data. There are several challenges to monitoring land cover changes in the study area. It is difficult to manage within-class spectral variability from temporally sparse and irregular time series observations. In addition, the heterogeneous landscapes and high temporal dynamics exhibit spatially and temporally complex spectral characteristics, which often hinder efforts to obtain robust classification results that are appropriate for tracking gradual and eventful change information from unchanged classes. To obtain temporal and spatial change information in boreal ecosystems and permafrost, we present a new post-classification change analysis scheme, which considers different temporal scales and the spectral variability of temporally irregular time series data. The rest of this paper is organized as follows. In Section 2, the study area and data used for this study are presented. Details on a new change analysis scheme are explained in Section 3. Section 4 elaborates on the discussion of the proposed change detection and analysis scheme. Finally, summaries and conclusions are described in Section 5.

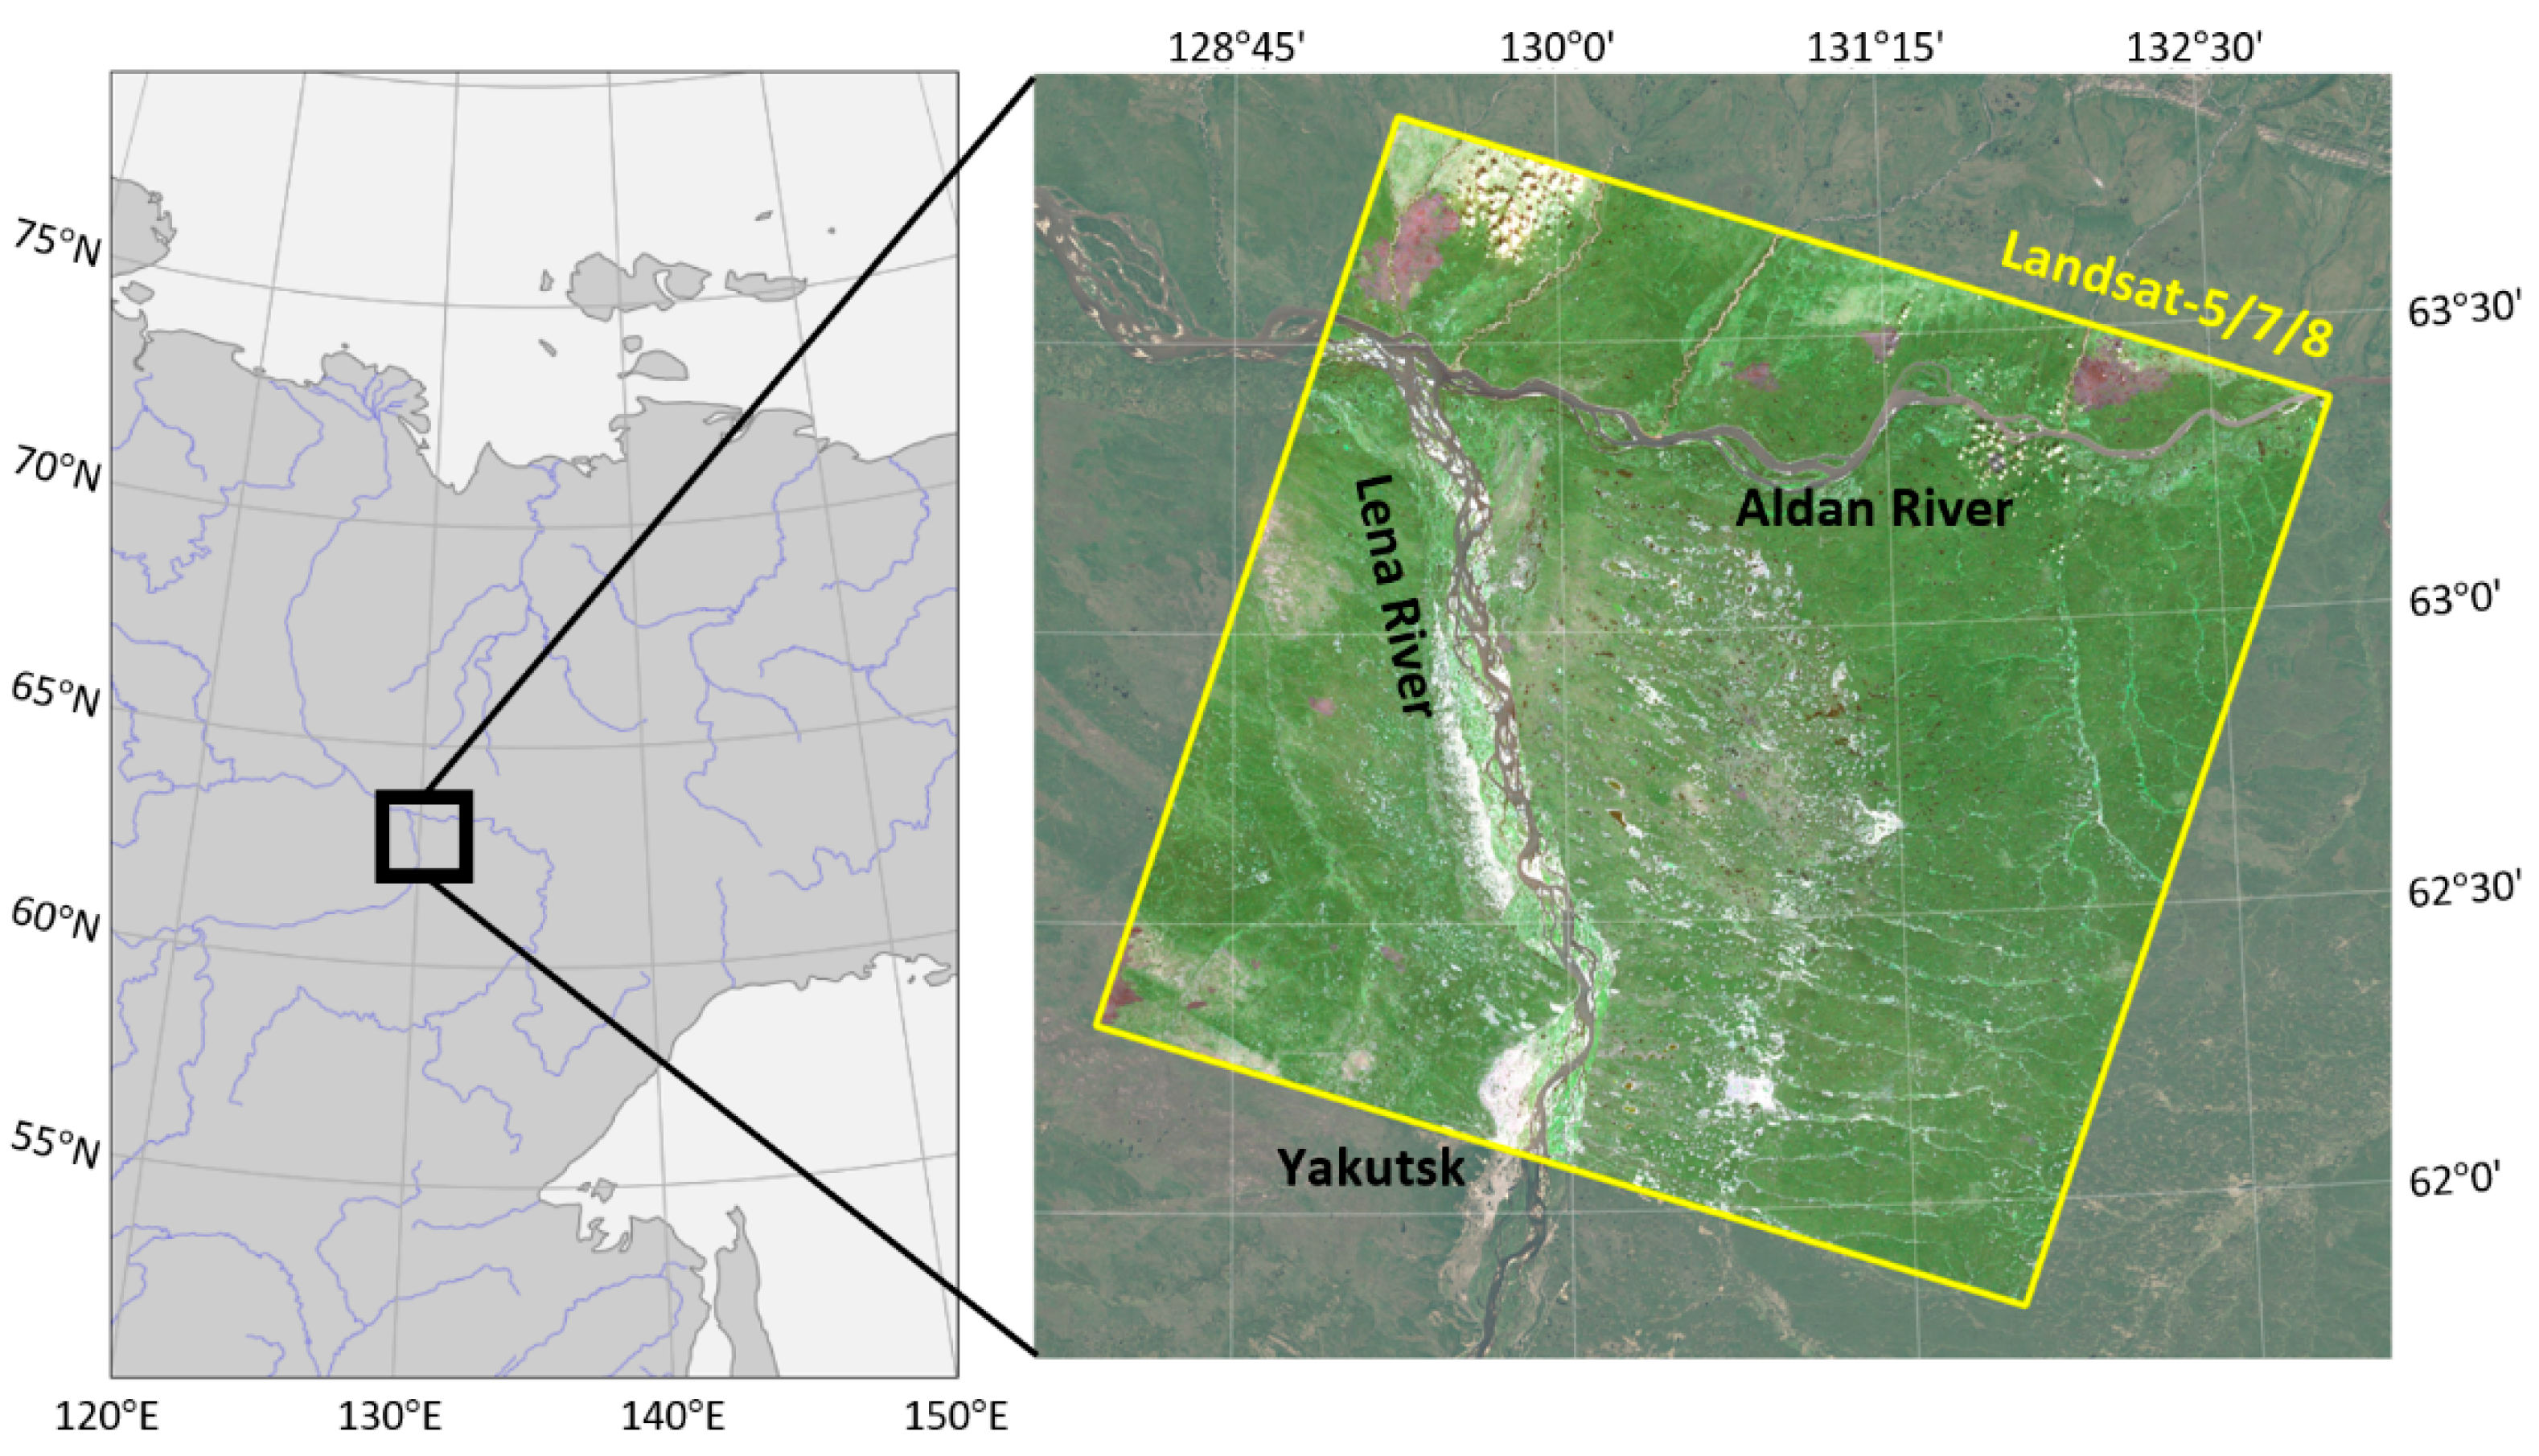
2. Study Area and Data Sets
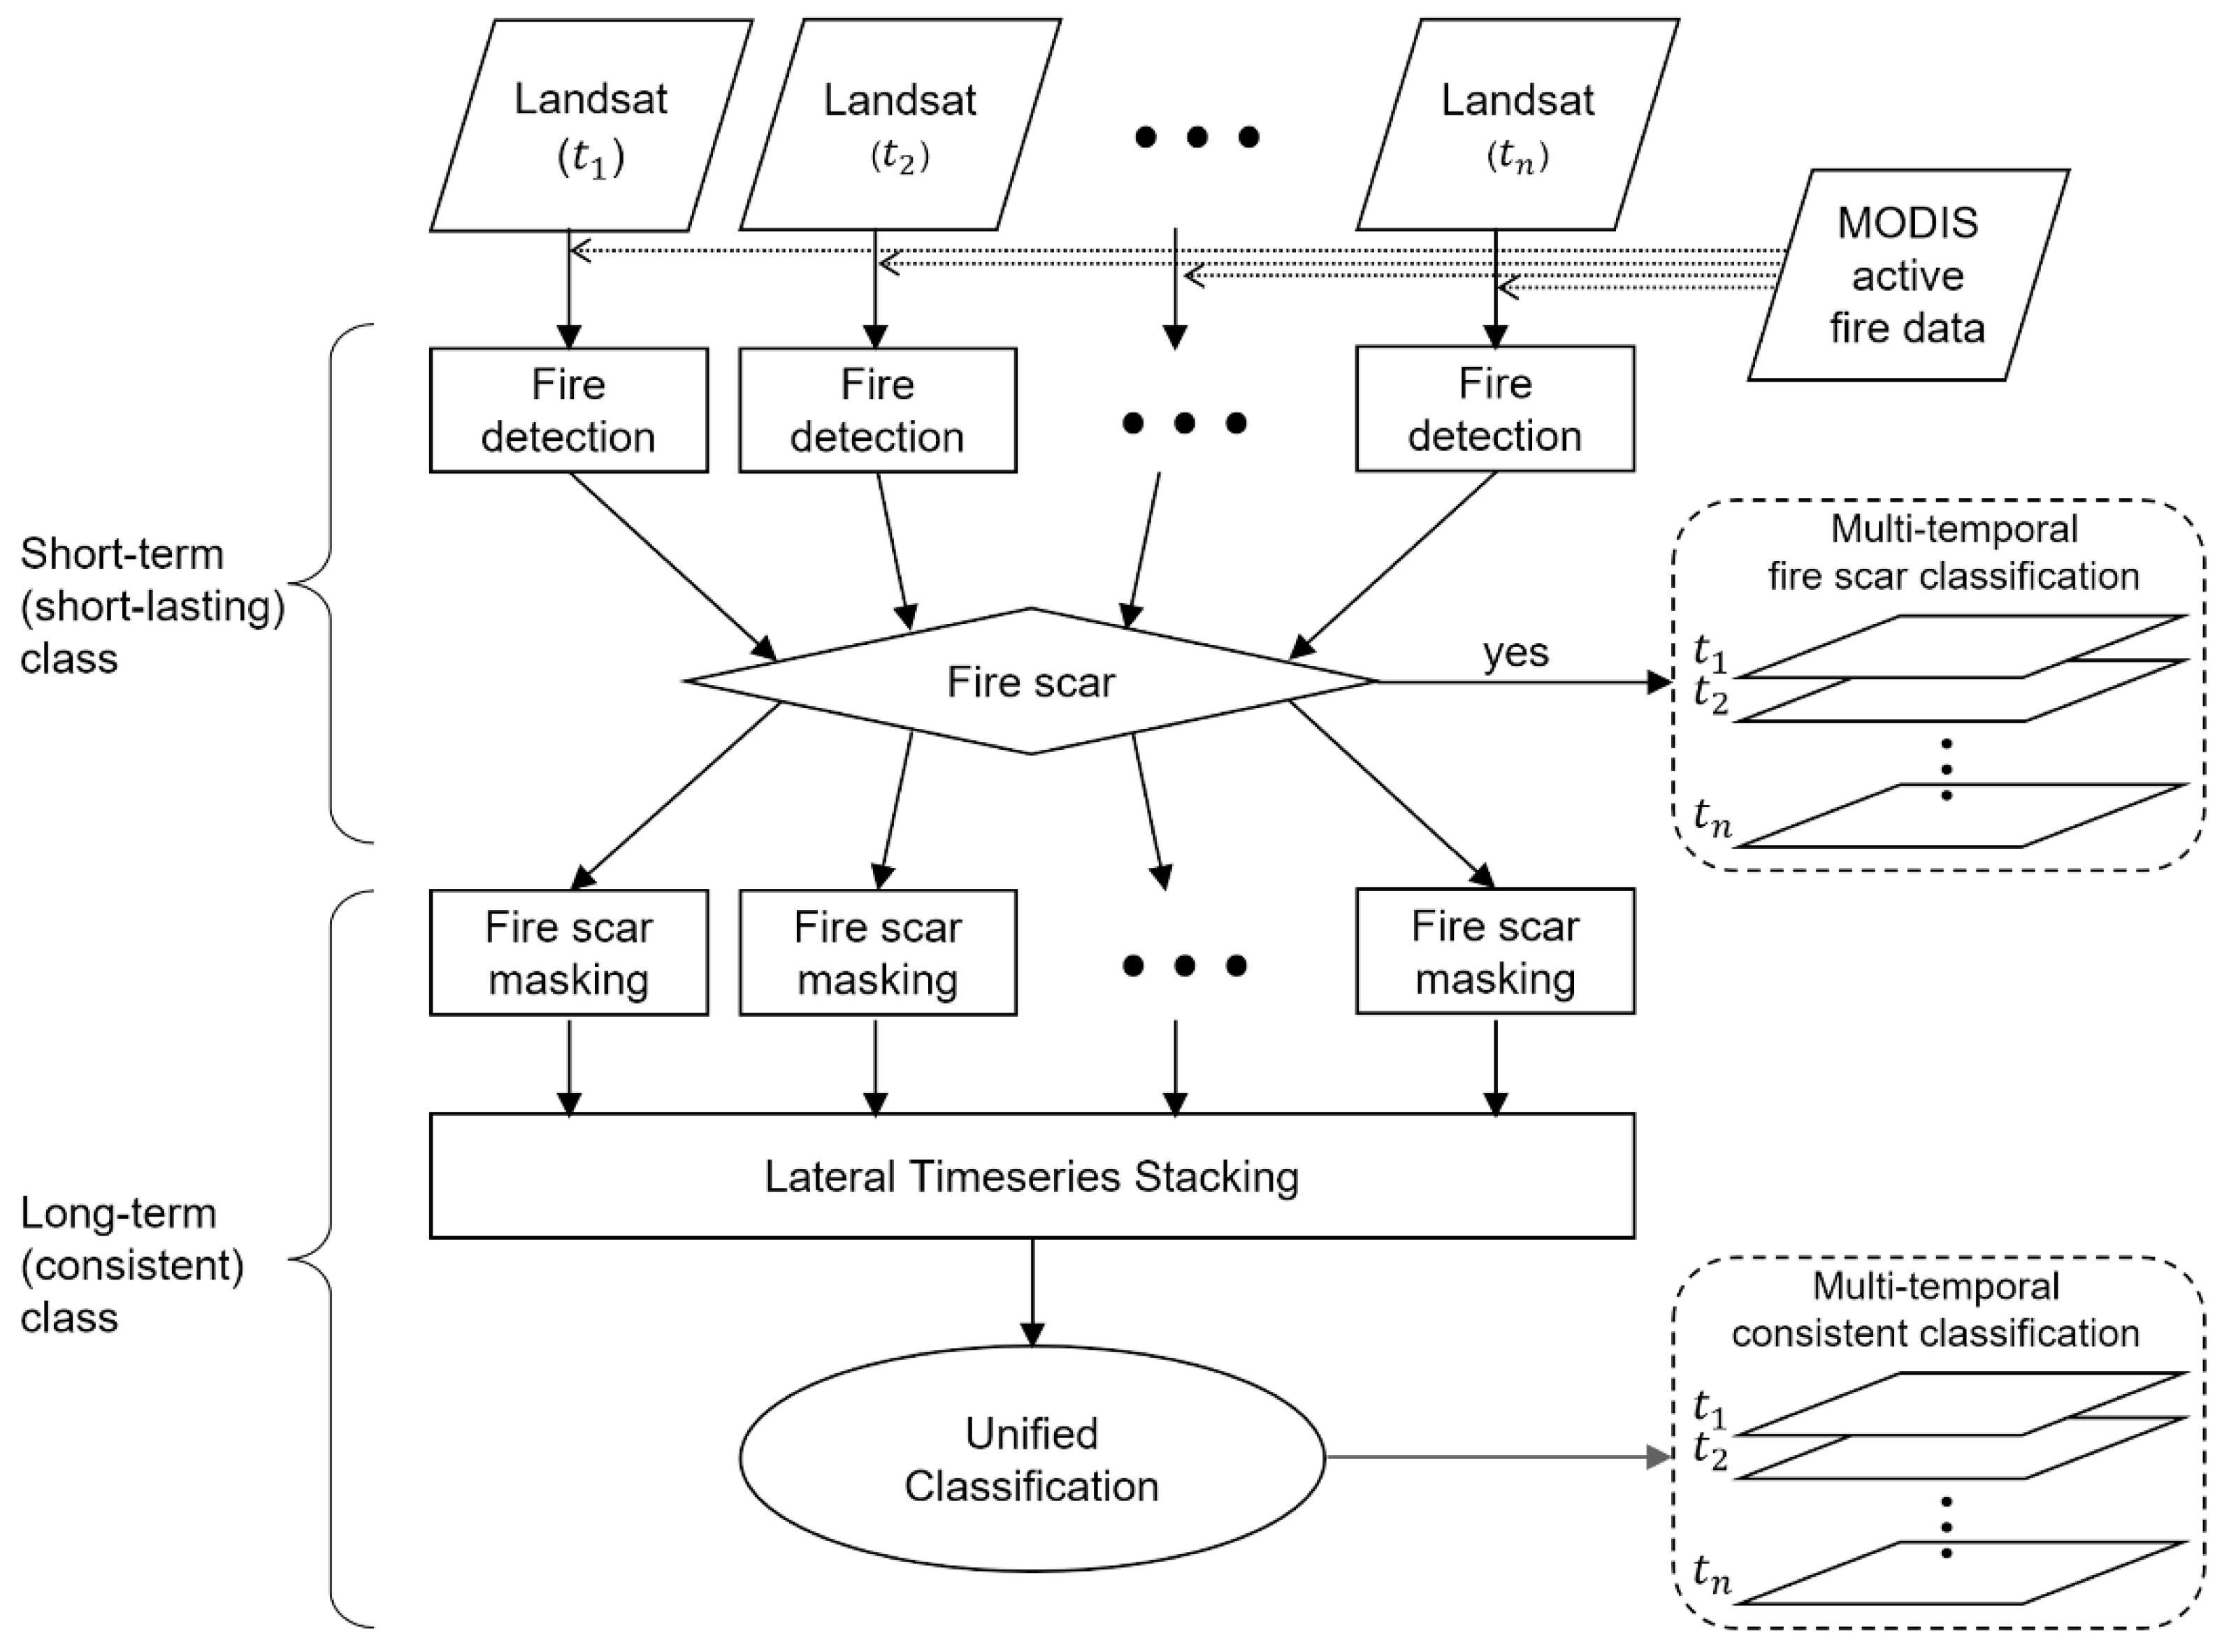
The selected study area is central Yakutia (Figure 1). It includes an alluvial terrace of the Lena River and the Aldan River and is underlain by continuous permafrost. Due to the severe continental climate, the study area has a long freezing season and a short growing season. The mean annual precipitation ranges from 110 mm to 340 mm, and approximately 70% of the precipitation falls in summer. The elevation around the Lena River and the Aldan River is very low at about 80 m above sea level and thermokarst lakes are abundant in the eastern part of the Lena River. Vegetation in this area is dominated by middle-taiga boreal forest consisting of larch and pine, low shrub, and lichen [38,39,40].
To observe ecological changes occurring in the study area, Landsat time series from 2001 to 2019 were obtained in this study. To minimize seasonal effects in the time series analysis, all Landsat images were collected in August, the peak of the growing season. All available Landsat data from 2001 to 2019 are summarized in Table 1. It is worth noting that, due to the long study period, short growing season, and frequent cloud cover, the time series dataset consists of different sensors such as Landsat-5 TM (Thematic Mapper), Landsat-7 ETM+ (Enhanced Thematic Mapper Plus), and Landsat-8 OLI (Operational Land Imager) with irregular temporal intervals. All Landsat data were collected with Landsat Collection-2 Level-2 atmospheric corrected surface reflectance images. Clouds and shadows in each image were masked using the Fmask algorithm [41] before time series analysis. As the ancillary data supporting fire scar detection in Landsat data, MODIS active fire data (AFD) provided by The Fire Information for Resource Management System (FIRMS) were acquired. MODIS AFD provides a point-shape file of the central location of the wildfires that occurred between May and September from 2001 to 2019. Each fire location was converted into an area to be studied by applying a 1 km × 1 km buffer.

3. Method

The spatially heterogeneous and temporally dynamic nature of the boreal ecosystem and irregularly and sparsely acquired data points make it difficult to understand spatial and temporal patterns of change from surface reflectance. In this study, a post-classification change detection strategy was selected to retrieve and interpret complex land cover changes. Here, the classification process of each time series image should be performed based on consistent criteria and be able to exclude any scene-specific fluctuation of inter- and intra-class reflectance. To effectively classify both short-lasting classes related to short-term changes and classes related to gradual changes, this study proposes a two-stage classification scheme that distinguishes changes with different temporal scales as summarized in Figure 2. The first stage performs fire scar detection for each Landsat image. After separating the burned areas from each Landsat image, long-term land cover classification is performed using the time series stacking image as the second stage.

3.1. Classification of Short-Term (Short-Lasting) Class

Wildfire is a typical short-term phenomenon in the permafrost ecosystem that makes it difficult to obtain consistent classification results throughout the entire period because the spectral response of the burned area changes constantly during the recovery period and there may be some images without wildfire class. To discriminate short-term temporal-scale changes from long-term gradual changes, the proposed classification scheme first performs a fire scar detection step for each time series Landsat image.
The Normalized Burn Ratio (NBR) and differential NBR (dNBR) spectral indices have been widely used to discriminate fire scars from other areas [42,43]. However, there are several issues in performing wildfire detection using NBR or dNBR for the time series data. Due to the rapid vegetation changes in burned areas and the temporally irregular and sparse data points, it is not appropriate to perform detection using the difference in time series data. In addition, since sparsely vegetated areas exhibit similar NBR values to the fire scarred areas, the unburned land may be misclassified as a burned class. To minimize false identification, MODIS AFD was used together with Landsat data in fire scar detection. For each time series Landsat image, the candidate fire scar areas were identified based on the fire location information from the MODIS AFD. Then, fire scar detection was performed for the MODIS-based fire candidate areas of each time series data. Here, we used NBR for fire scar detection and adopted a histogram thresholding approach. To find an optimal threshold for the study area, NBR values in burned regions of interest throughout the entire study period were compared with NBR values of forest areas where wildfires have never occurred as shown in Figure 3. The NBR values in burned areas (solid lines) exhibited large variations depending on different types and severities of fire but were limited to lower values than those in unburned forest areas (dashed lines). Based on the sample histogram of burned and unburned areas, the global threshold value of the time series NBR for identifying the burned area was determined to be 0.4. Therefore, for each fire scar candidate of the time series Landsat image, pixels with NBR values less than the threshold were determined as the fire scar class in the first stage of the proposed classification scheme.

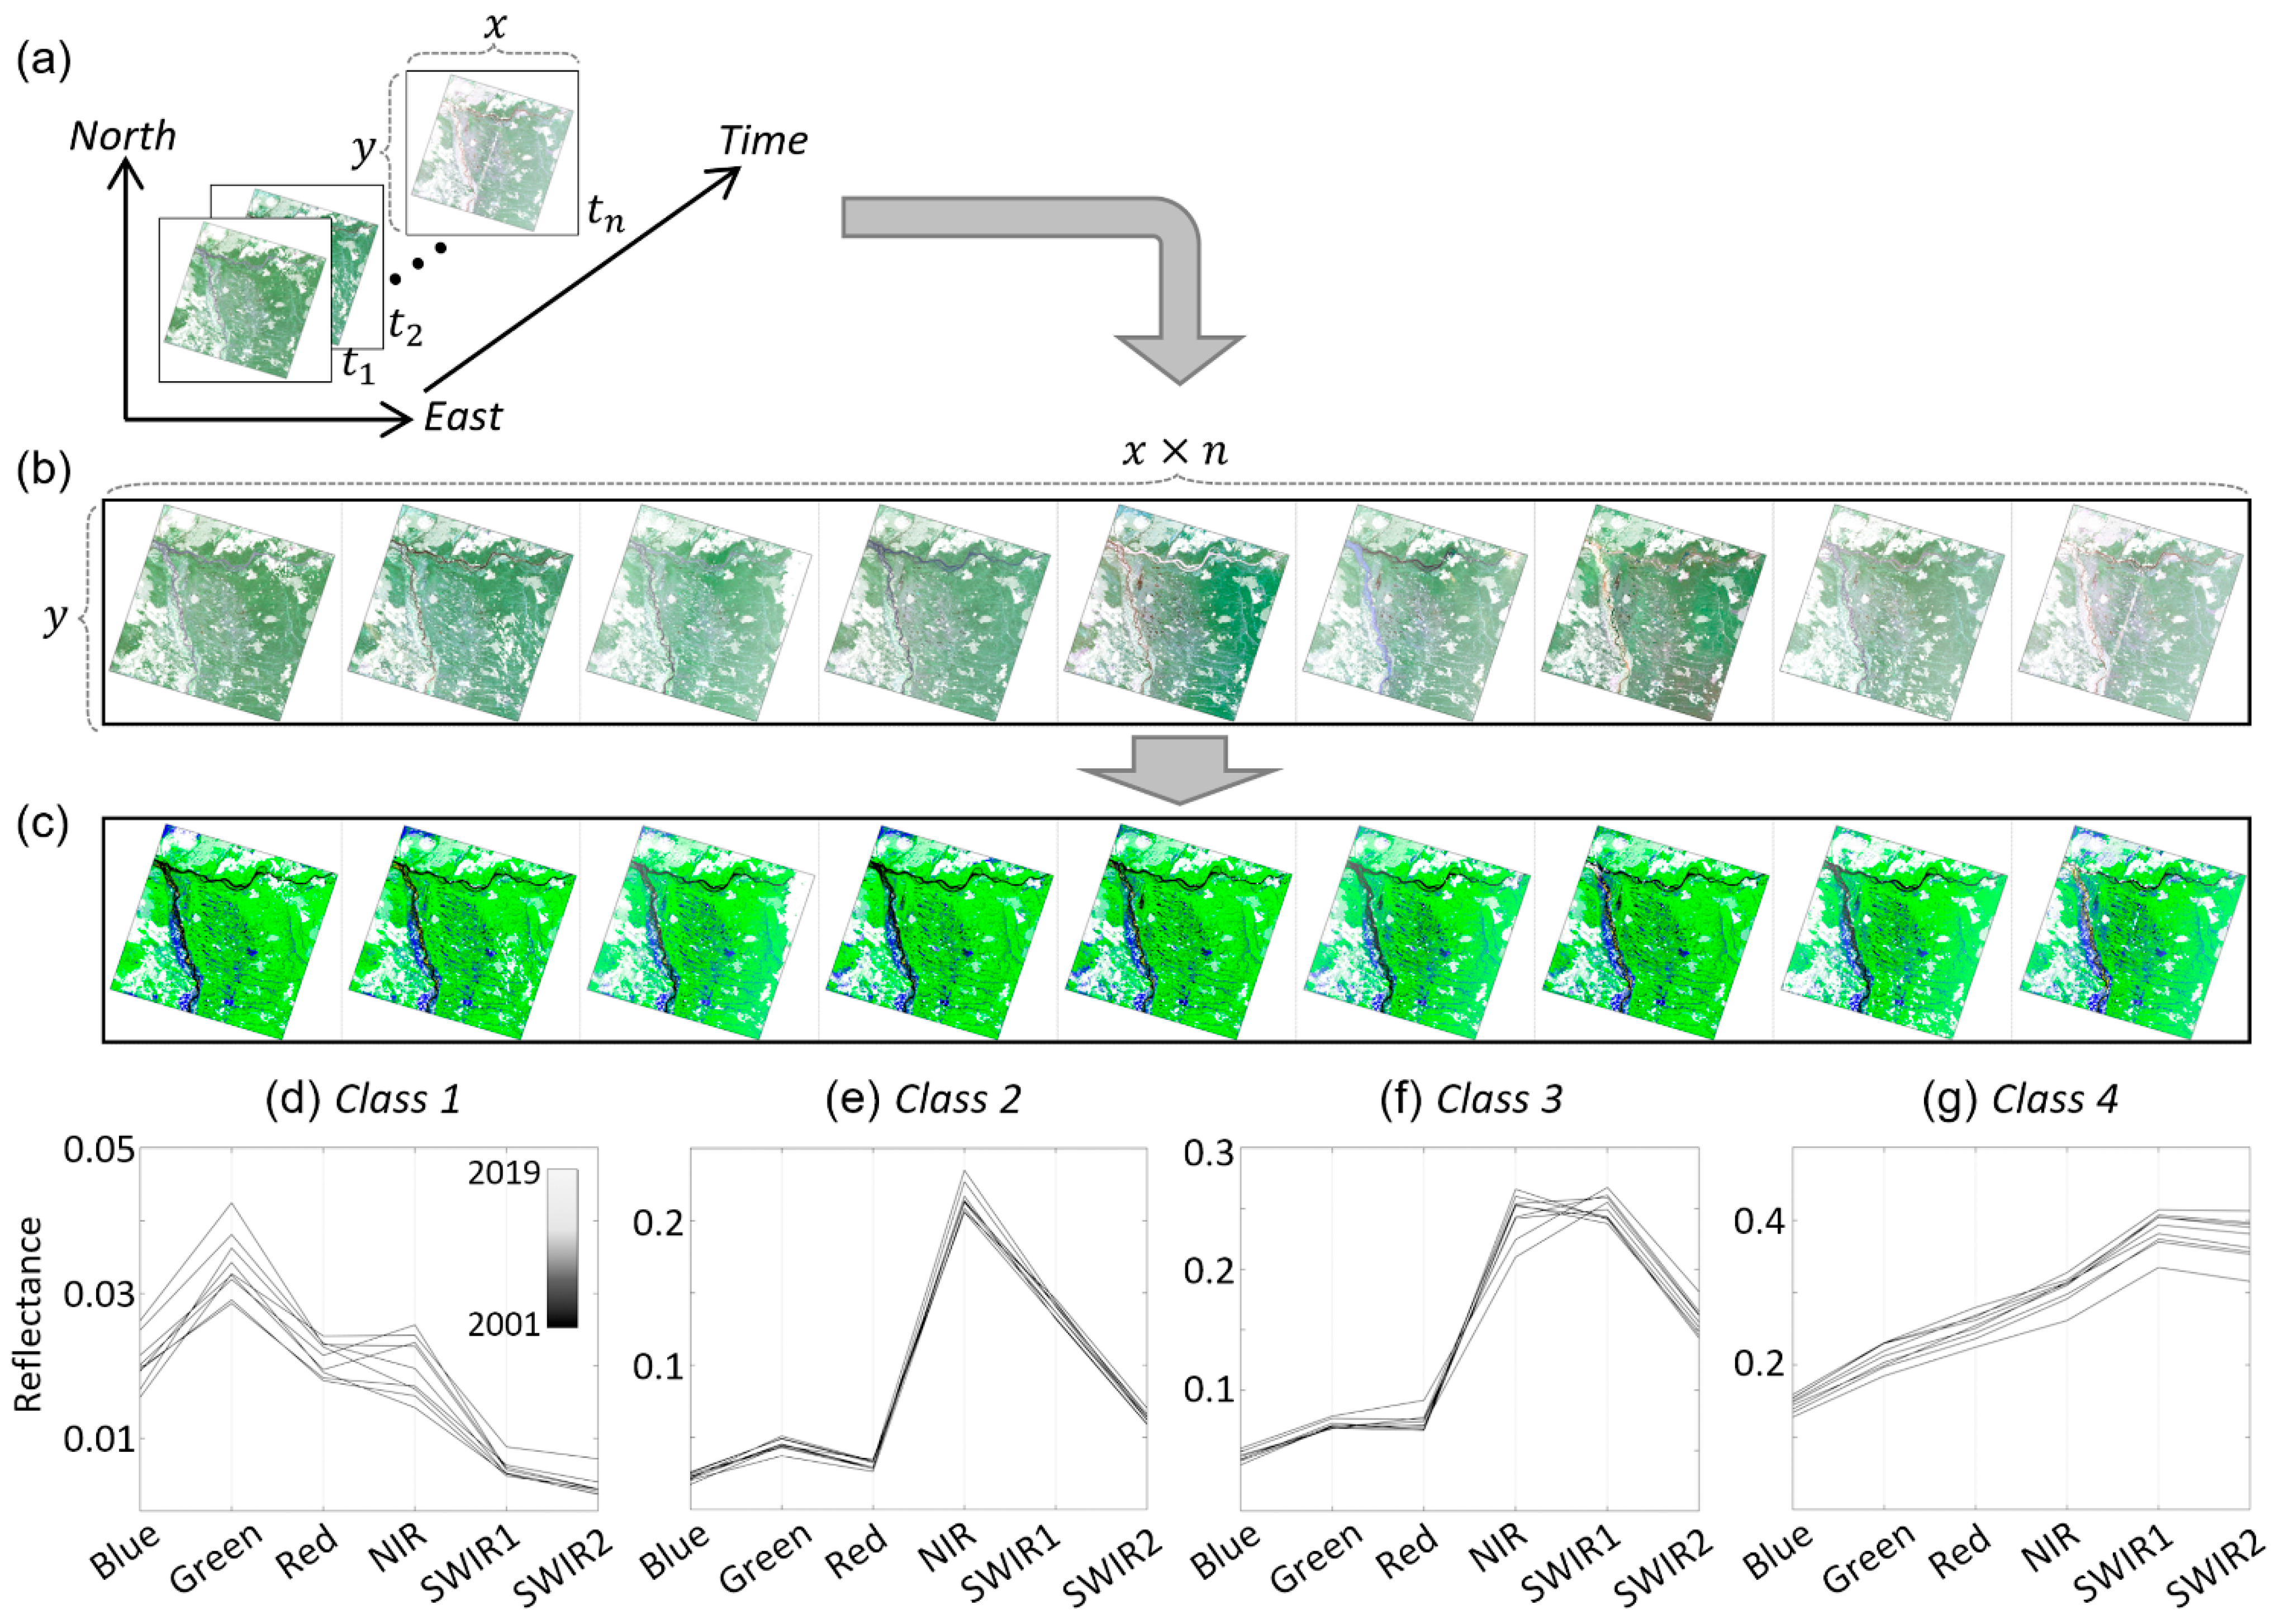
3.2. Classification of Long-Term (Consistent) Class

After masking short-lasting and highly variable burned areas in each Landsat image, long-term land cover classification was performed for classes that existed continuously throughout the entire study period. For identifying long-term changes, it is important to select the number and types of classes appropriately so that classification errors are not misinterpreted as changes in land covers. The lack of reference information for historical images and the spatial landscape heterogeneity makes it difficult to apply supervised classification to all Landsat images by selecting appropriate training data for temporally consistent class types. In this study, we used an unsupervised classification method that does not require subjective class selection, does not rely on predefined training data, and automatically clusters similar spectral responses.
Even if spectral responses are divided into the same number of groups using the same classifier, it is difficult to set temporally consistent classification criteria for all time series data due to temporal fluctuations in environmental conditions and long-term changes in the land cover areas. To minimize the influence of temporally inconsistent classification errors due to inter- and intra-class variations of spectral responses on long-term change analysis, we presented a new spatiotemporal classification method named simultaneous classification with lateral (spatial) stacking as illustrated in Figure 4. After masking fire scars in all time series data (Figure 4a), all multi-temporal data were stacked laterally as shown in Figure 4b to create a single multi-spectral image with spatial dimensions increased by the number of temporal acquisitions. Then, unsupervised classification was performed at once on the laterally stacked image as shown in Figure 4c. Here, we used the K-means unsupervised classification algorithm, and land covers were categorized into four classes considering representative objects known in the study area, such as water bodies, soil surfaces, grass or low vegetation, and forests or high vegetation. Figure 4d–g show the spectral responses for the four classes of each time series data in an area identified to be temporally stable over the entire period. The spectral responses of each class exhibited typical spectral characteristics in water bodies, forests, grasslands, and soils, respectively, and maintained similar spectral patterns throughout the study period. These illustrate that we can obtain consistent classification results for all multi-temporal data for areas where no change has occurred over a long period of time.

4. Results

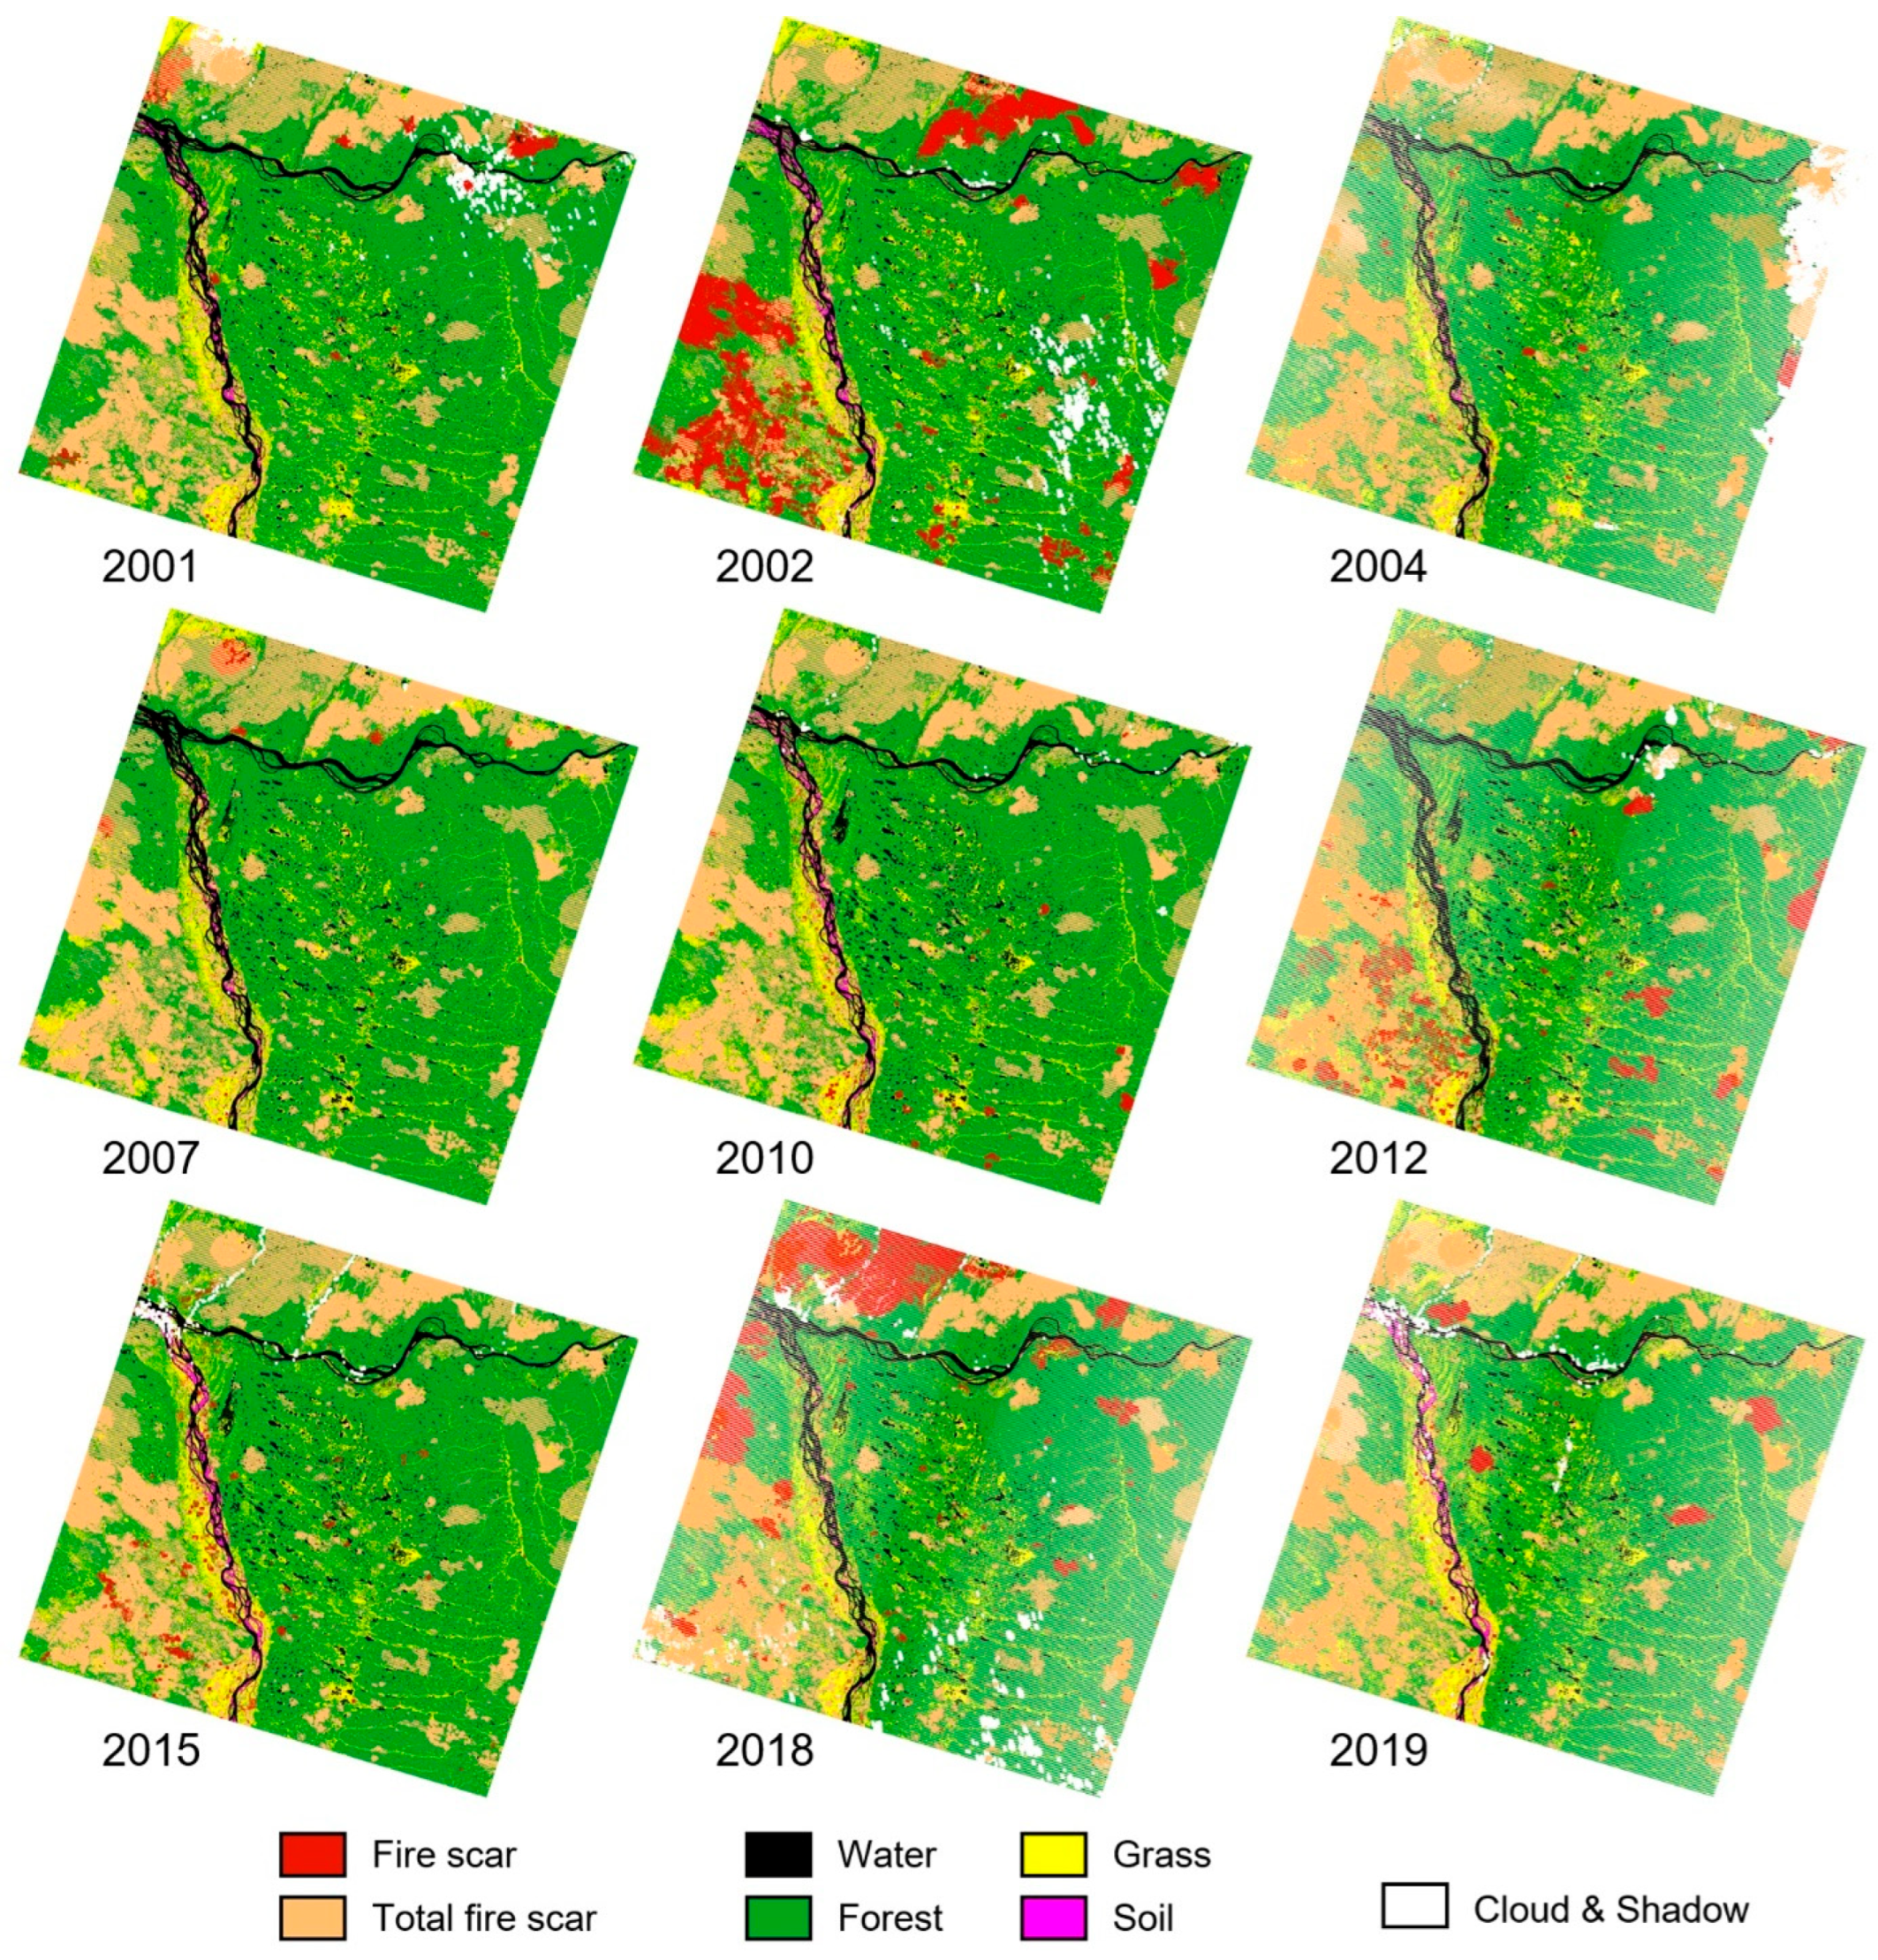
4.1. Classification Results

Based on the spectral characteristics of land covers that continuously exist over the time series images, four classes obtained by unsupervised classification were labeled as water, forest, grass, and soil. Since the short-term fire scar class was detected for each time series image and excluded from the long-term classification, the fire scar class was divided into the current fire scar detected in each time series image and the total fire scar including all fire scars in the entire time series image. Consequently, the two-stage classification method provided time series classification results consisting of six classes, including two short-term fire scar classes and four long-term land cover classes.
Figure 5 shows the two-stage classification results for all time series Landsat images from 2001 to 2019. We can identify that the fire scar class has high spatial and temporal variability and, for land covers in the study area excluding historical fire class, similar classification results were obtained throughout the entire study period without significant temporal fluctuations. Among the areas where land cover changes gradually over a long period, the forest was the most dominant class. Two rivers, the Lena and Aldan Rivers, as well as the thermokarst lake concentration between the two rivers, can be identified by the water class. In addition, the distribution of grasslands and sandbars in the Lena River valley and grasslands distributed around the lakes can be confirmed through the classification results.
The performance of the proposed two-stage multi-temporal classification algorithm was evaluated against selected validation regions. For the short- and long-term land cover classes, pixels that changed and remained unchanged were manually selected from each time series image independently through visual analysis of Landsat images with the aid of Google Earth historical images. For statistically significant accuracy assessment without regional bias, the validation areas were selected to be scattered across the image, consisting of 300‒1200 pixels per class for each time series data.
The accuracy analysis results for each Landsat data are summarized in Table 2. Since the accuracy evaluation was performed independently for all time series data, the total fire scar class was excluded from the accuracy evaluation. Classification accuracy for each land cover class was assessed using the producer’s accuracy and the overall performance for all classes was evaluated using the overall accuracy and Kappa coefficient. Both the overall accuracy, ranging from 93.7% to 98.7%, and the Kappa coefficient, ranging from 0.91 to 0.98, indicate that we can obtain consistently higher classification results for all Landsat data acquired from 2001 to 2019. It is worth noting that the proposed two-stage multi-temporal classification algorithm can provide consistent classification results for both short-lasting fire scar class and long-term gradually changing land cover classes. In particular, high classification accuracies of more than 90% were obtained for water, forest, and grass classes, which are the main land cover types in the study area, throughout the study period. Consequently, by collecting all spectral information of long-term images and setting consistent classification criteria that can be commonly applied to all multi-temporal images, it is possible to reduce misinterpretation of long-term changes caused by the irregular fluctuation of mis-classification results in each time series data.

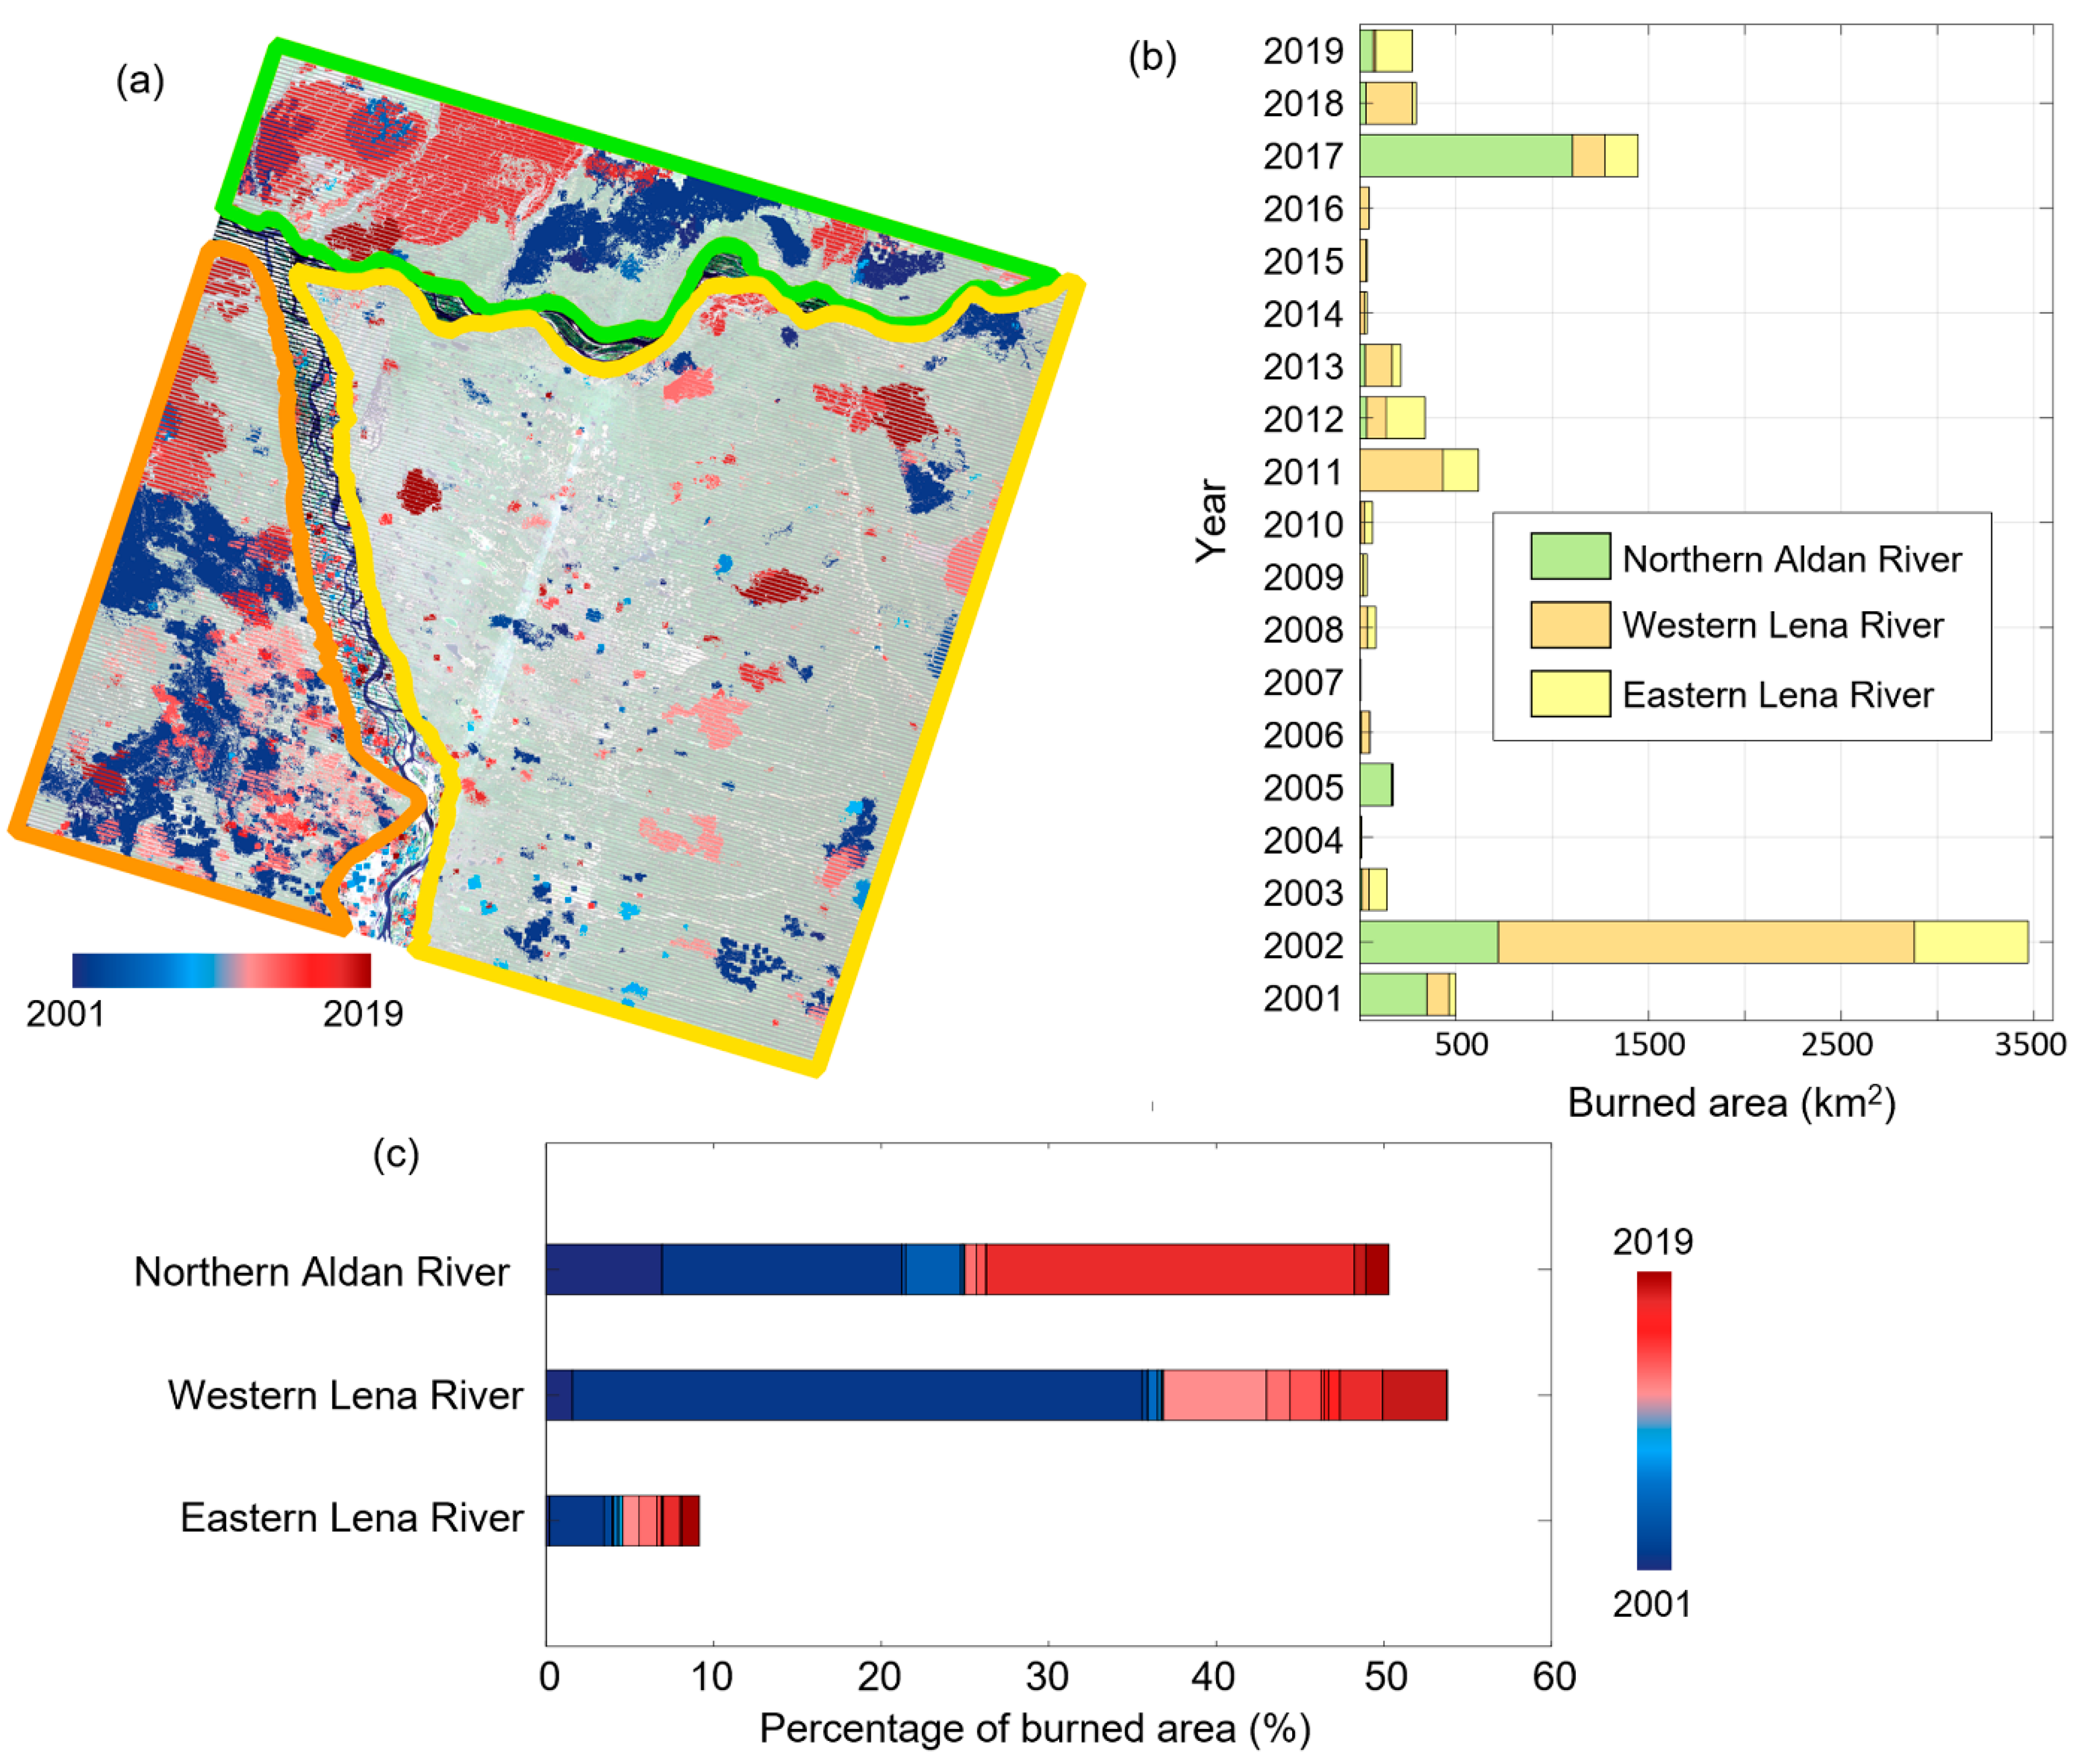
4.2. Short-Term Wildfire Dynamics

The classification results of each Landsat data obtained by the proposed two-stage multi-temporal classification method were used to analyze land cover changes in the study area for 19 years from 2001 to 2019. Since changes in short-lasting wildfire classes and gradual changes in land covers can be very different in their temporal and spatial patterns, change analysis was performed by separating changes with different temporal scales.
Figure 6a shows the spatiotemporal distribution of accumulated fire scar class of the time series Landsat data for the entire study period. The fire scar class also includes wildfires that occurred in years in which Landsat data was omitted. Based on annual MODIS AFD data, the fire scar classes of the Landsat data were projected into the annual burned area as shown in Figure 6b. A total of 7617 km 2 of the Landsat data coverage area (about 20.5% of the total area) was burned at least once during the 19-year period, and the fire activity exhibited significant interannual variability in the burned area. During the study period, the largest wildfire occurred in 2002, with 2017 and 2011 being the next intensive-fire years in the study area.
These temporal variations in the area burned can be explained by fluctuations in climate factors such as temperature or precipitation [7,44]. However, compared to the very high temporal variability of wildfire, the area burned showed similar spatial distributions across the study area. The ecosystem of the study area can be divided into three sections separated by the Lena River and the Aldan River, such as the northern Aldan River, western Lena River, and eastern Lena River eco-sections, as presented by green, orange, and yellow colors in Figure 6a, respectively. Figure 6c shows the percentage of annual area burned within each eco-section to examine the spatial characteristics of annual wildfires across the study area.
The annual area burned exhibited similar patterns in the northern Aldan River and the western Lena River, where the total proportion of area burned within the eco-section reached more than 50% over the entire study period, resulting in widespread fire-induced rapid vegetation changes. In addition, in both eco-sections, large-scale wildfires with a long time lag were observed in adjacent regions, suggesting that local ecological and hydrological characteristics in addition to climatic factors can affect spatial wildfire occurrence. On the other hand, only a small area was affected by wildfires in the eastern Lena River eco-section, with less than 10% of the total area burned over the entire study period, and spatial connectivity between burned areas in different years also decreased. The eastern part of the Lena River is located in the lowlands surrounded by the two rivers and is well known for its widespread distribution of thermokarst lake [9,38,45,46,47]. Therefore, it can be inferred that there is a significantly different soil water regime in this eco-section as compared with the western Lena River and northern Aldan River eco-sections. The spatial and temporal patterns of local scale fire scar distribution suggest that the local soil water regime can play an important role in the fire-induced ecological disturbance.

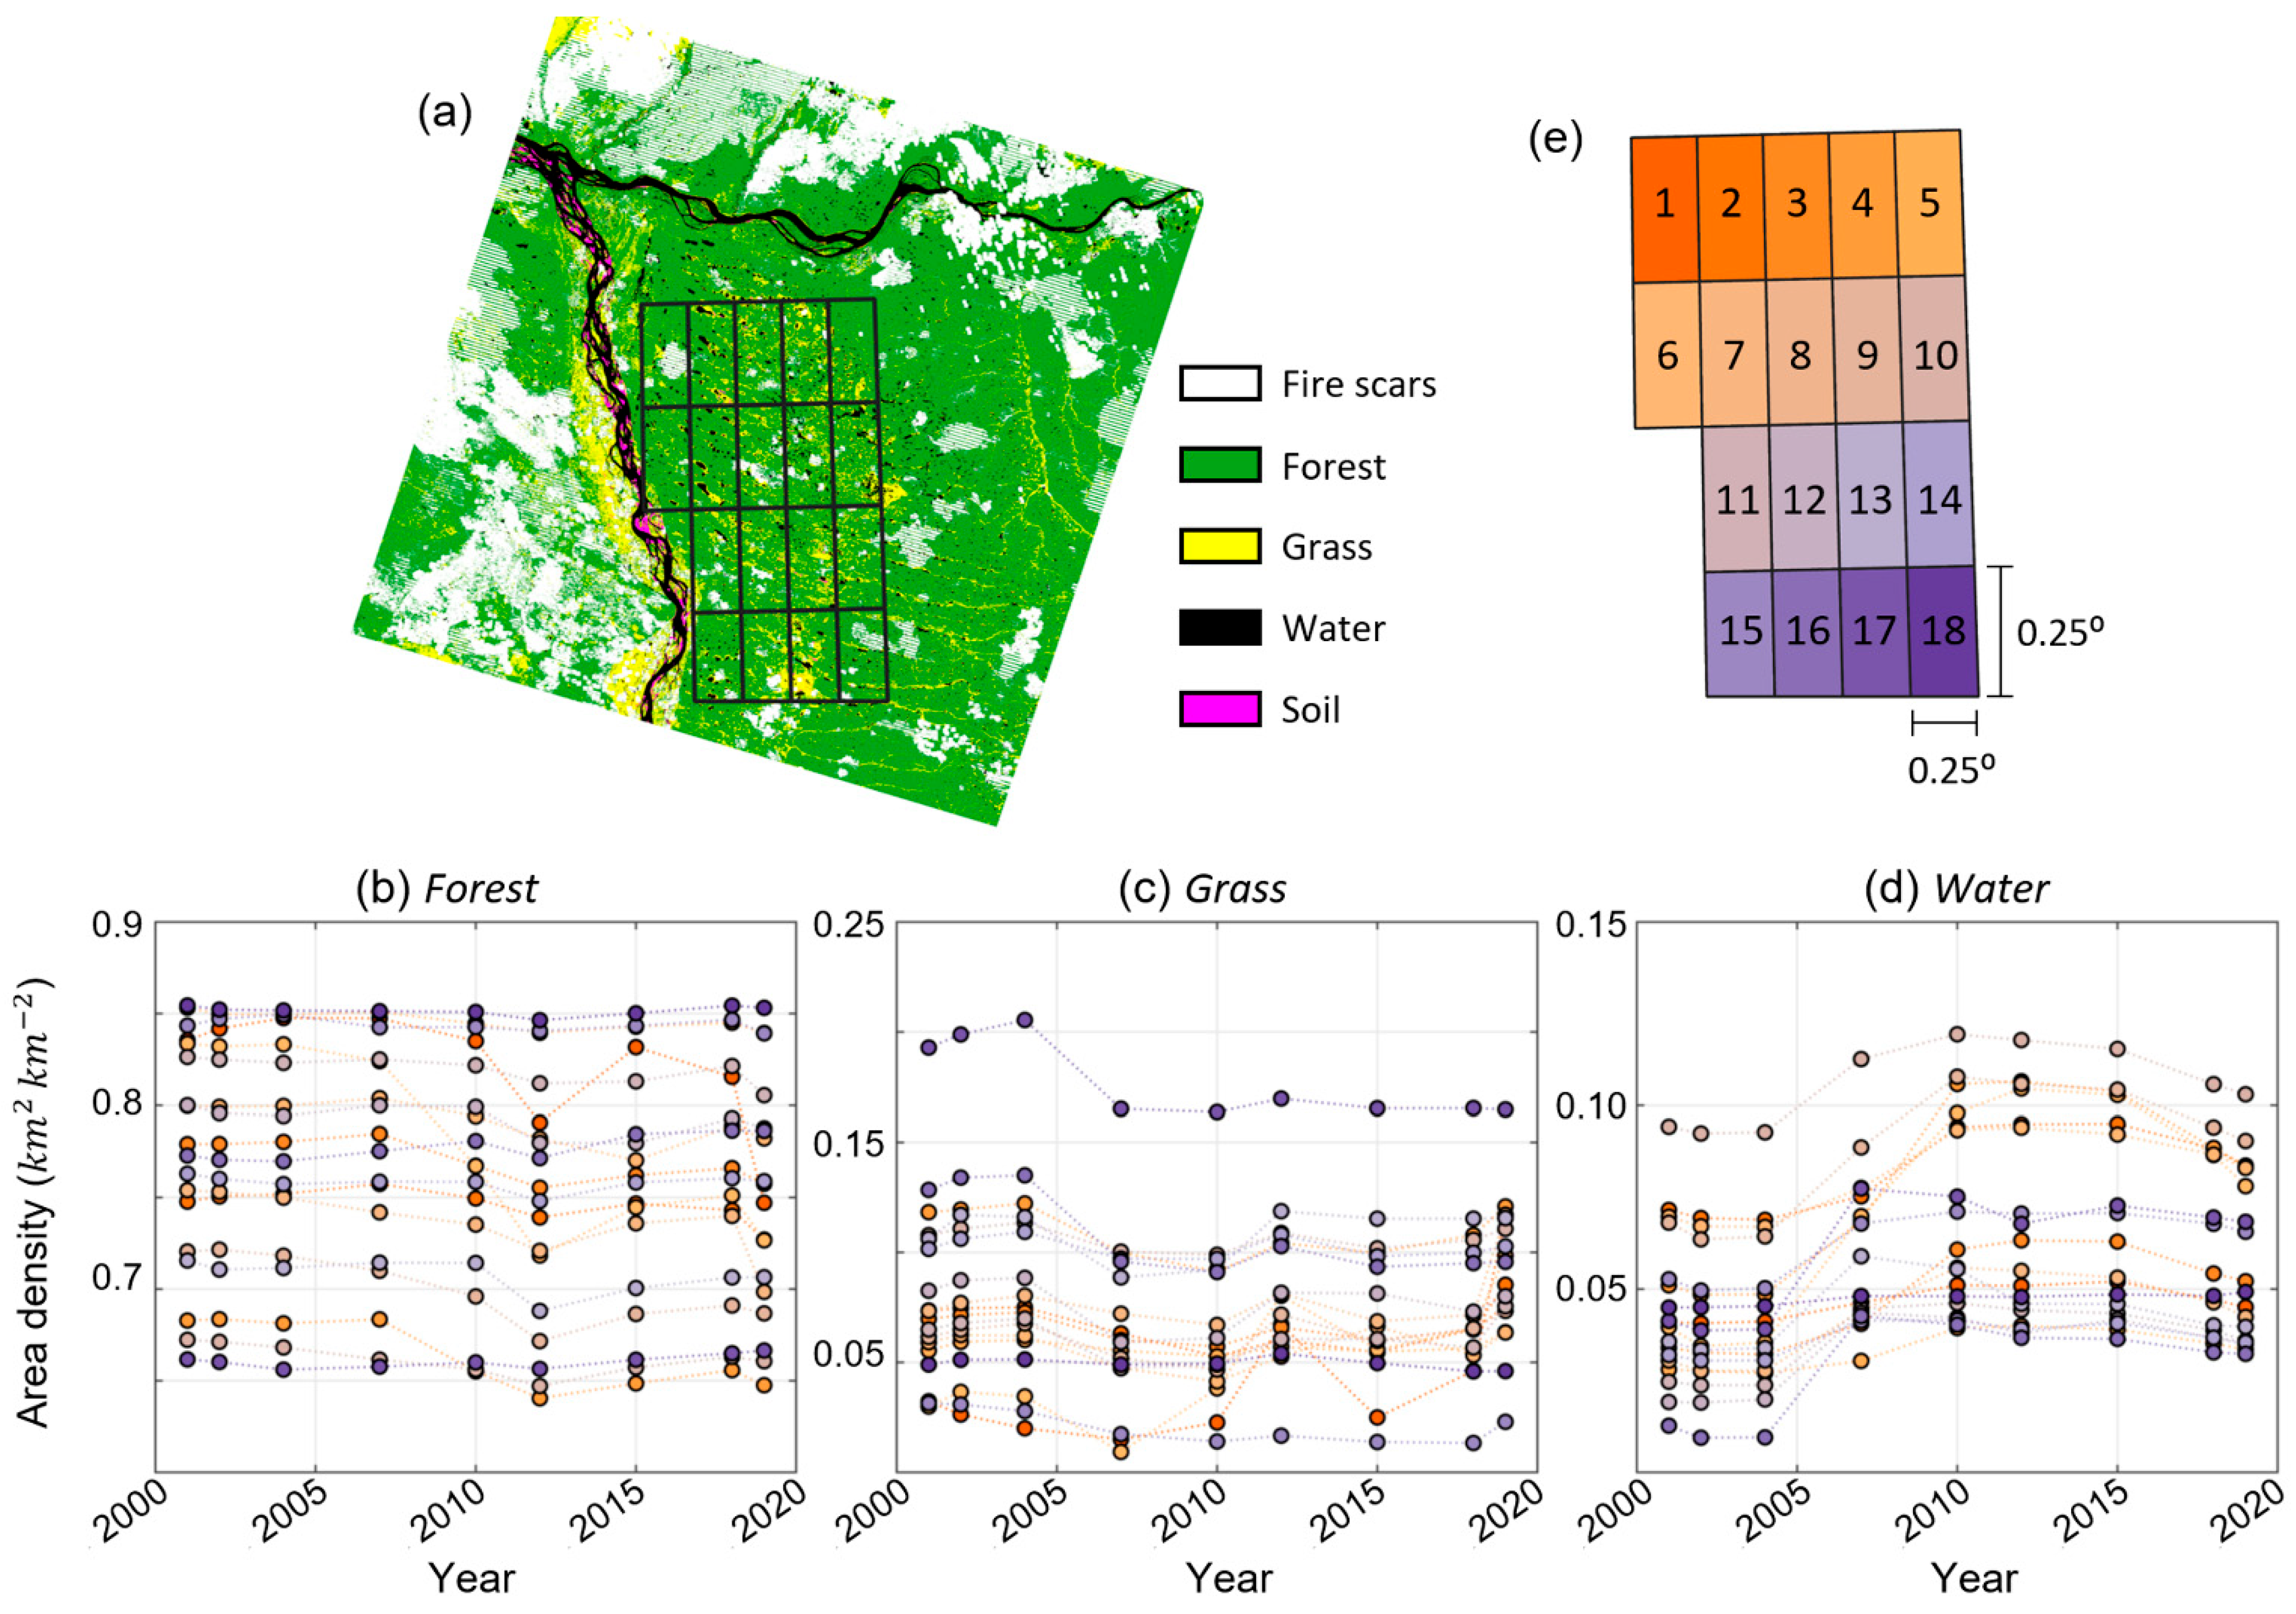
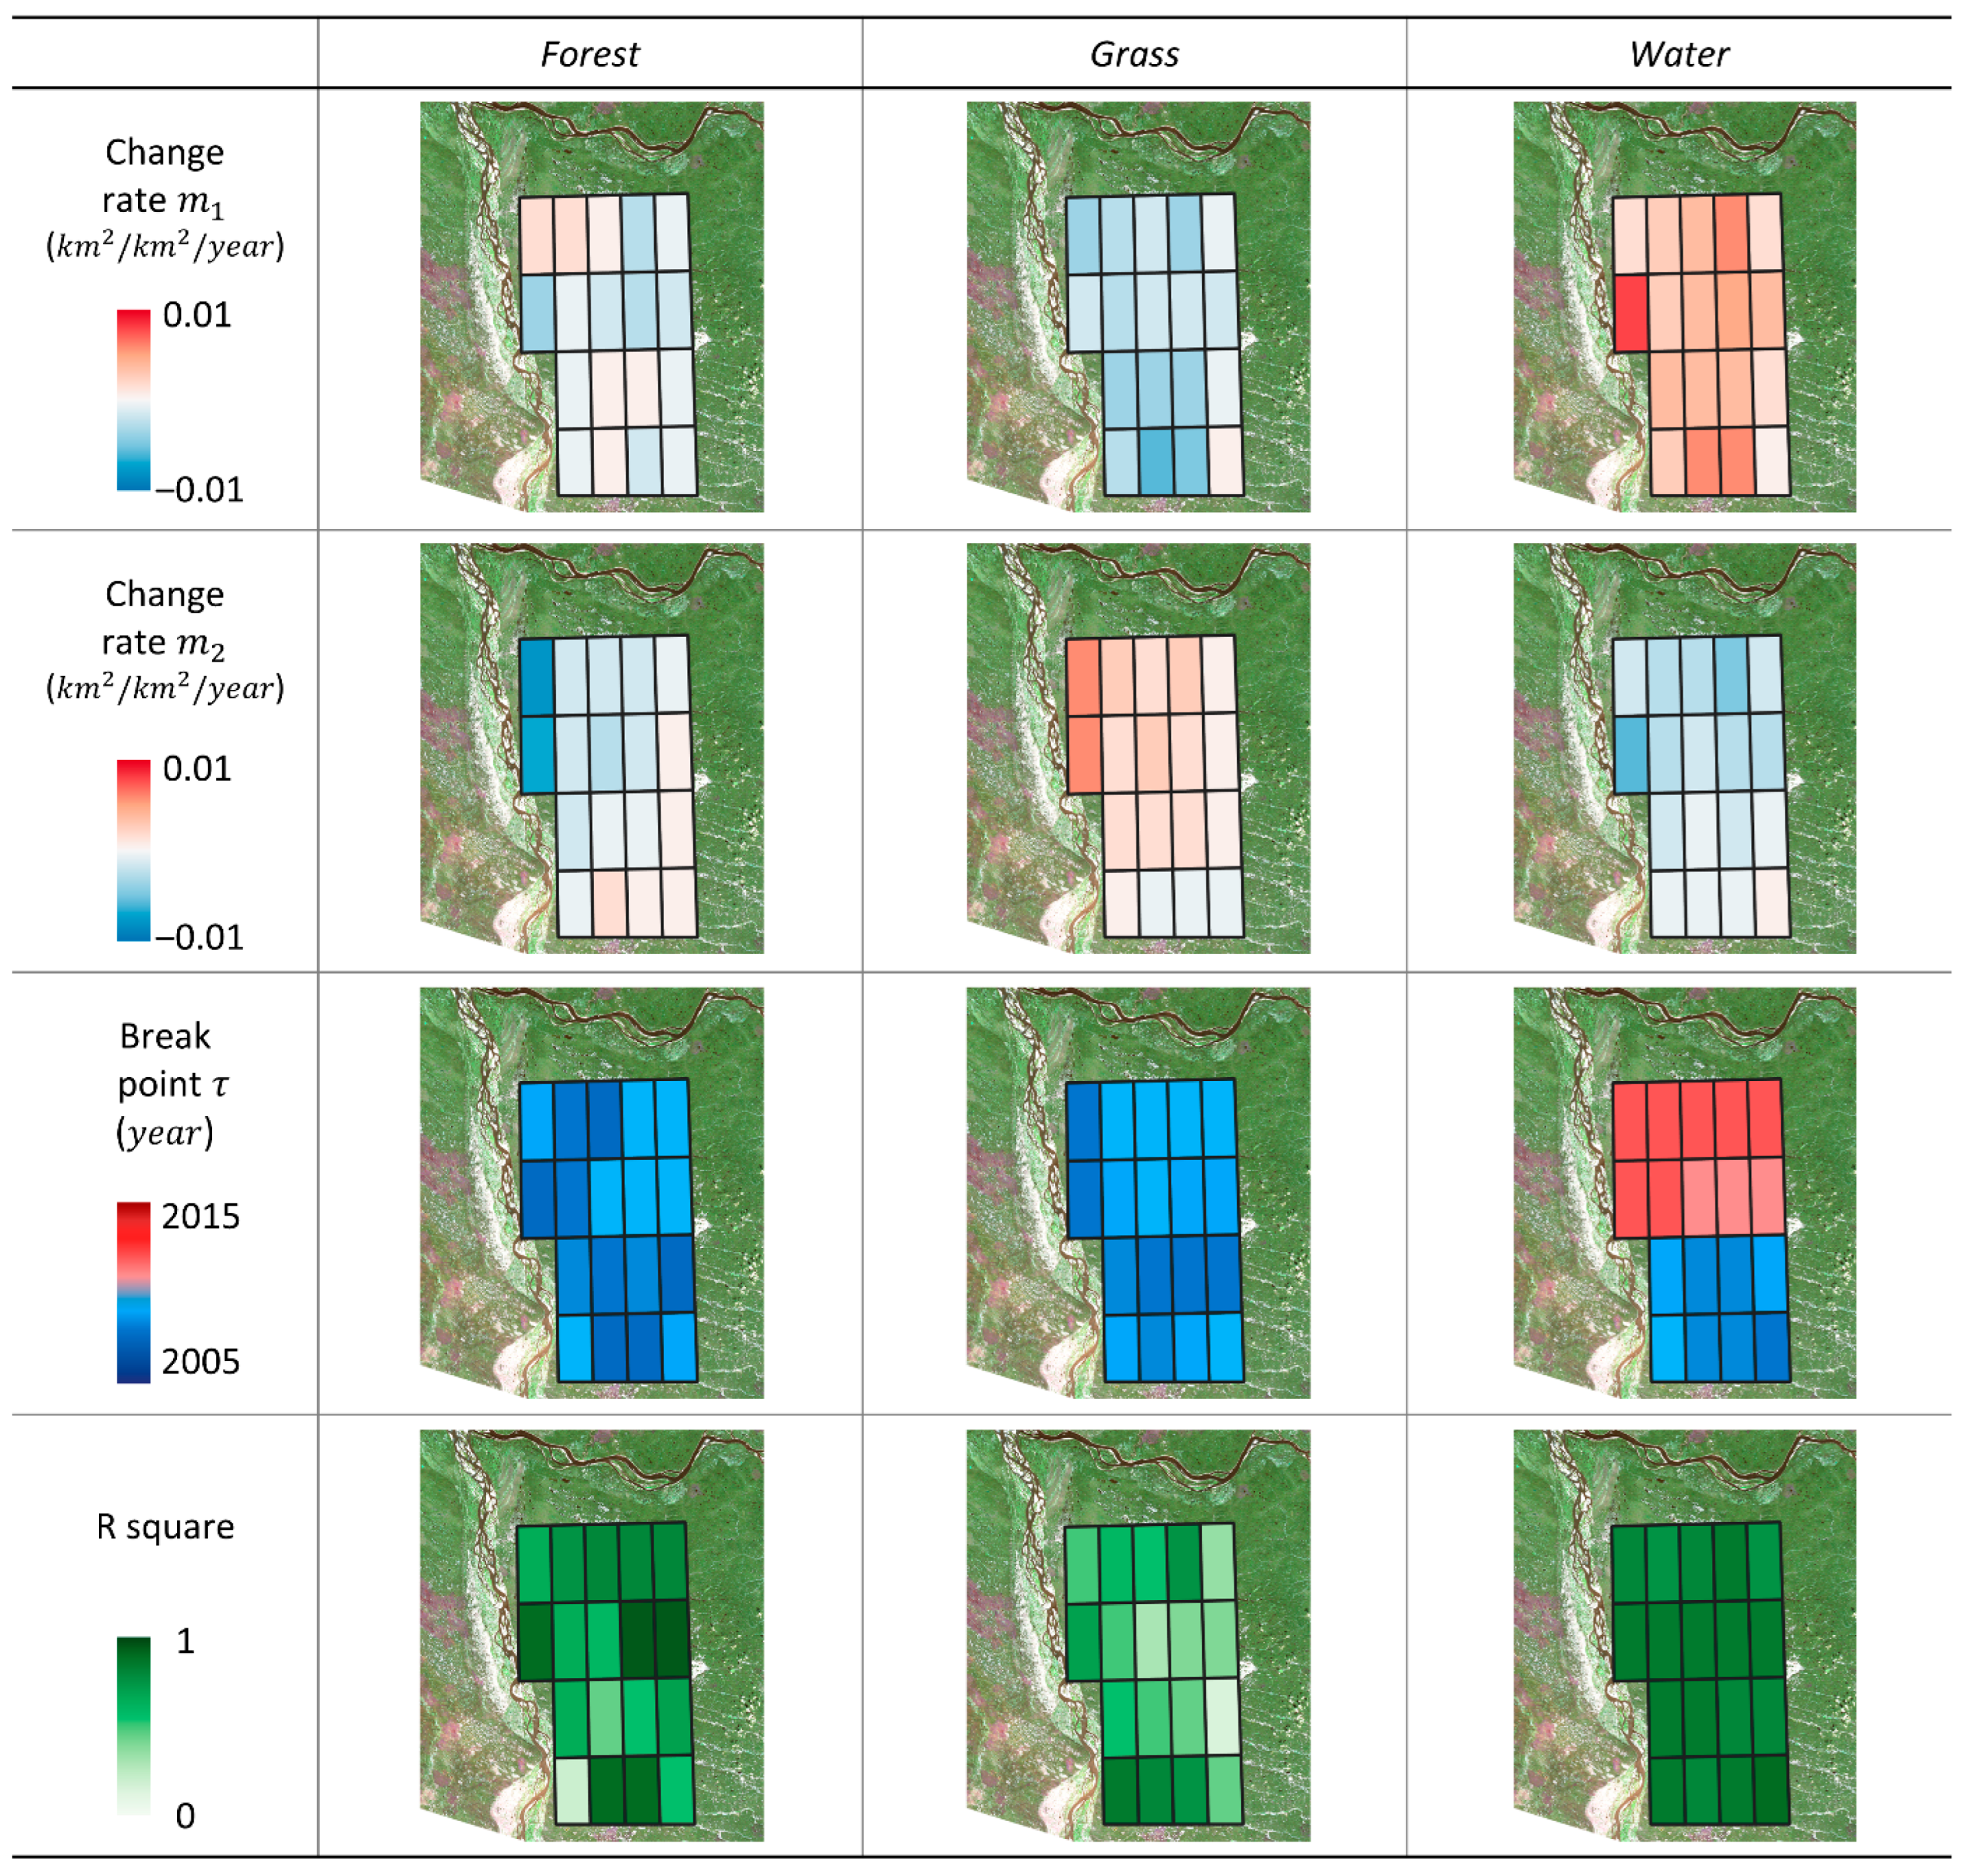
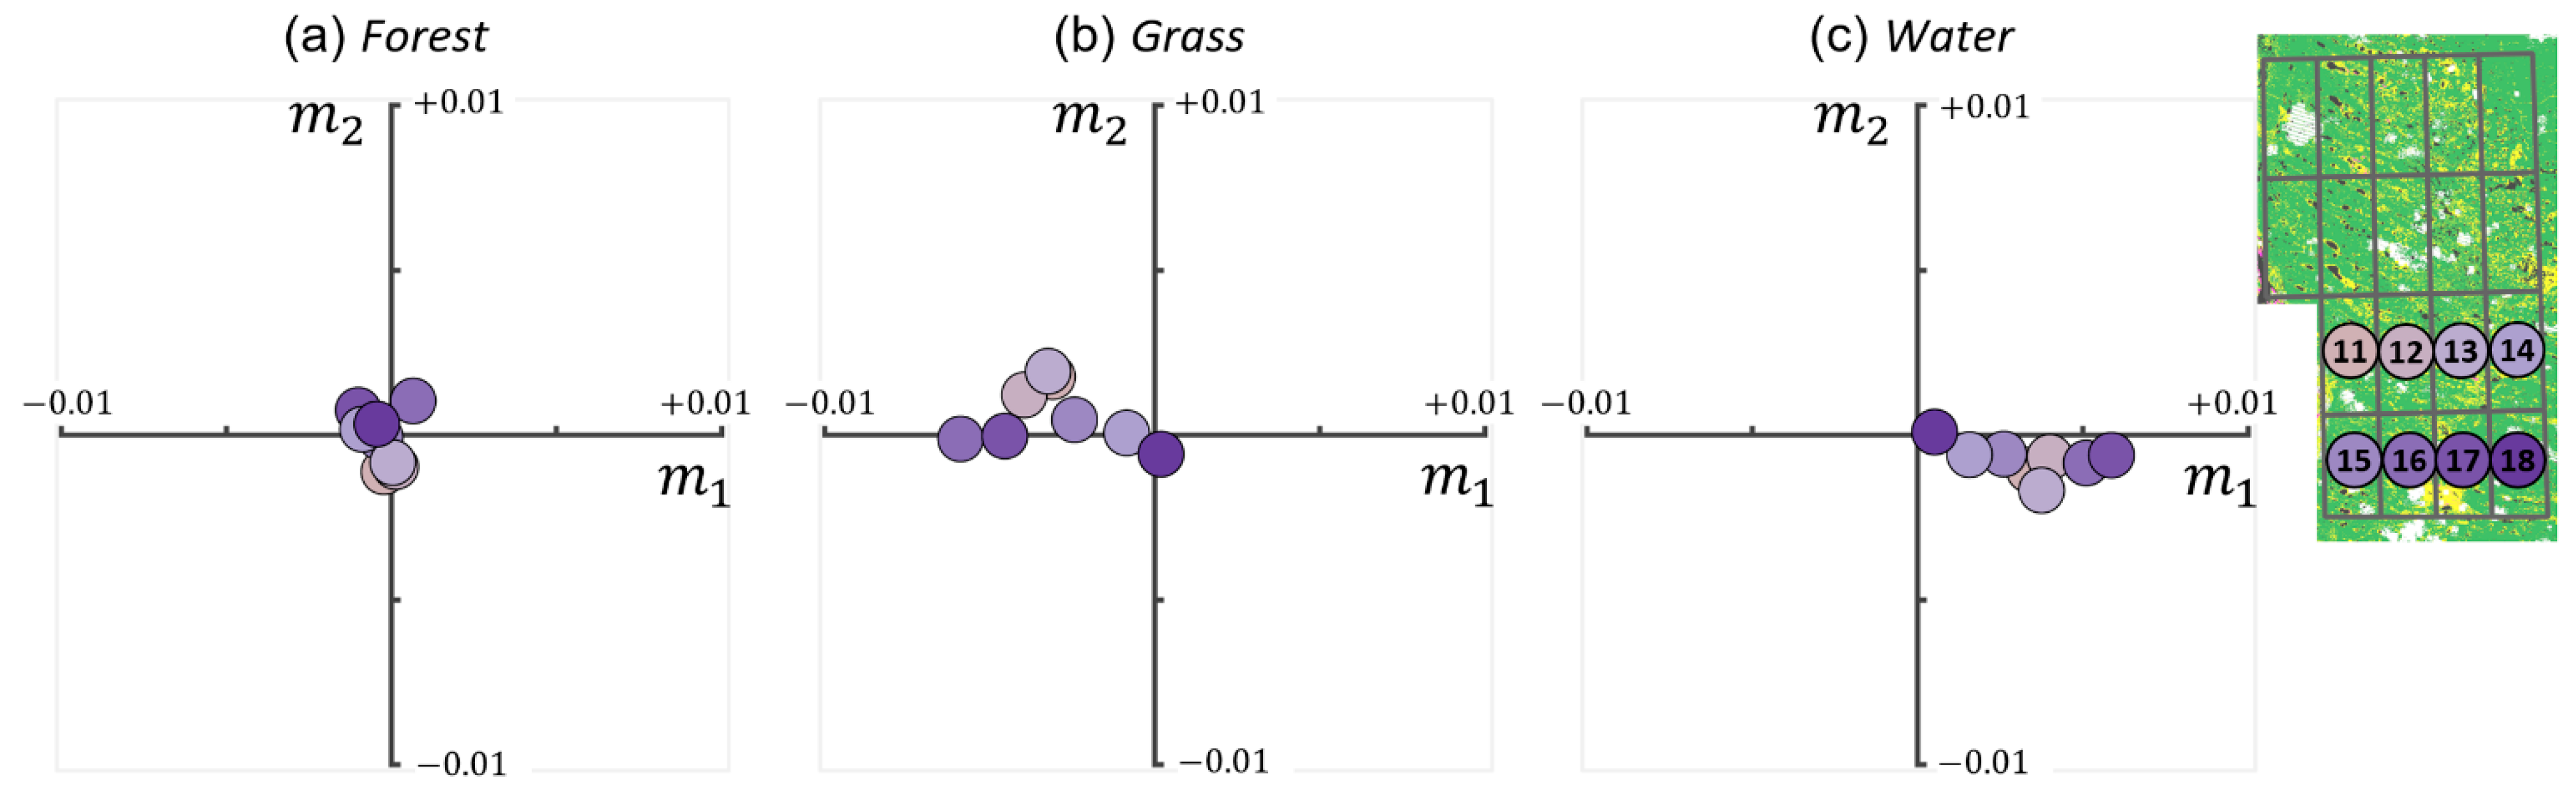
4.3. Long-Term Land Cover Changes

Since the fire-induced short-term changes were concentrated in the western Lena River and northern Aldan River eco-sections, the long-term land cover change analysis was conducted focusing on the thermokarst terrain of the eastern Lena River eco-section, excluding short-term changes. For analyzing the gradual land cover changes, the long-term change analysis area was selected in the thermokarst terrain in the eastern Lena River eco-section as shown in the grided regions in Figure 7a. To understand the spatial pattern of gradual land cover changes during the study period, we analyzed trajectories of the areal fraction of each class by dividing the selected analysis area into a 0.25° grid.
The temporal changes in forest, grass, and water classes within each grid cell over the entire study period were shown in Figure 7b–d, respectively. The graph indicates the pixel areas belonging to each class among the total area of the grid cell ( km 2   km 2 ), and the color of the graph represents the location of each grid as shown in Figure 7e. While the overall temporal pattern of the forest class was relatively stable across the analysis area, other classes (particularly the water class) experienced significant changes during the study period, showing interesting temporal patterns that could not be explained by monotonic increase or decrease.
The time series area densities for the water and grass classes revealed notable structural changes during the study period. In the case of the water class, for example, the area density of the water class within a grid cell tended to increase at the beginning of the study period and then gradually decrease thereafter as shown in Figure 8. In order to characterize the land cover change pattern during the study period, we fitted a simple piecewise linear model to the class area time series A t within the grid, such as:
A t = m 1 t + b t τ m 2 t τ + b + m 1 τ t > τ
where τ is the break point of the two line segments, m 1 and m 2 are the slope parameters for the first and second line segments, respectively, and b is the intercept constant. We applied a piecewise linear model to the temporal changes in forest, grass, and water classes. By the least squares fitting of the piecewise linear model, it is possible to describe the long-term land cover trajectories with low-dimensional parameters, such as the change rates ( m 1 and m 2 ) and the break point ( τ ).
Figure 9 shows the spatial distribution of the estimated change rates and the break point for each class over the analysis area. The coefficients of determination for the fitting results included in Figure 9 were considerably high across the analysis area, except for a few isolated grids in the forest and grass classes. Even for some grid regions with low coefficients of determination, the estimated parameters showed spatial consistency with adjacent grids with high coefficients of determination, which suggests that the piecewise linear model can be an appropriate tool for analyzing the temporal pattern of land cover change over a wide area.
For the forest class, the magnitude of change rates of both early and late periods was relatively small in most analysis areas with no distinguishable spatial patterns except the westernmost grid cells near the Lena River which show apparent decreasing trends in the later period. In the case of grass and water classes, there were significant temporal trends in the long-term changes across the analysis area. The grass class fractions gradually decreased in the early period and increased in the late period. The temporal change in the water class showed the opposite trend to grassland, with an upward trend in the early period followed by a downtrend in the later period. It was difficult to identify a specific spatial pattern in the change rates during the early period. However, in the late period, the change rates of grass and water classes increased in magnitude towards the northwest grid of the analysis area. In the case of break points where changes in temporal trends occur, the forest and grassland classes were estimated to have begun changing around 2010 across the analysis area. On the other hand, there was a distinct spatial pattern at the break point in the case of water class. In the northern grid areas (grid numbers 1–10), changes in temporal trends occurred later than in 2010, while break points existed earlier than in 2010 in the southern grid areas (grid numbers 11–18).
To understand the spatial characteristics of long-term changes, the land cover change rates were examined by dividing the analysis area into southern (Figure 10) and northern (Figure 11) regions. The horizontal and vertical axes of the graphs in Figure 10 and Figure 11 represent the land cover change rate in the early period (approximately 2001 to 2010) and the late period (approximately 2010 to 2019). Looking at the southern region shown in Figure 10, changes during the study period mainly occurred in the early period before 2010 and were characterized by an increase in lake areas and a decrease in grasslands. In the early period, the change rate for both water bodies and grasslands reached 0.06 km 2 per decade, and thereafter the area of each land cover did not substantially change.
In the northern region shown in Figure 11, the land cover change in each grid showed a different pattern from that of the southern region and revealed a continuous change throughout the study period. In the case of the water class, all grid cells showed growth of water area ( m 1 > 0 ) in the early period, followed by areal declines ( m 2 < 0 ) in the later period. Also, it can be seen that there was a recent rapid decrease in water area in grid cells where the water bodies rapidly increased in the early period. For the grass class, the grassland area decreased in the early period but increased in the latter half after the break point around 2010. The rate of grassland growth in the later period exceeded the rate of decline in the earlier period ( m 2 > m 1 ) particularly in the westernmost grid cells (grid numbers 1 and 6) near the Lena River. On the other hand, the forest class exhibited various slow changes in growth or decline in different grid cells in the early period. In the late period after the break point around 2010, however, there was an obvious decreasing trend in forest cover in the most northern grid cells ( m 2 < 0 ). In particular, the westernmost two grids show the distinctive characteristic of rapid later-period decline in the forest area ( m 2 < m 1 ), regardless of the slight increase or decrease in the early period.
A grid-based analysis of the thermokarst terrain of the eastern Lena River revealed that there were three distinct regions in which gradual land cover changes could be grouped into similar patterns. We further classified the thermokarst terrain into three regions, A , B , and C , as shown in Figure 12a. Figure 12b–d summarize the areal change rates in water, grass, and forest classes for the three regions, respectively. Here, to effectively illustrate the spatial characteristics of land cover changes, the mean values of the grid cells belonging to each region were used to represent the regional change rates for each class. The m 1 value, which represents the land cover change rates during the former half of the study period (approximately 2001 to 2010), indicates that there was a dominant change pattern throughout the thermokarst region in which the lake expanded considerably, and the surrounding (mainly grasslands) areas decreased.
On the other hand, the m 2 value indicates characteristic land cover change trends during the latter half of the study period (after 2010), which were significantly different from those of the former half and exhibited spatial patterns with distinct regional characteristics. As aforementioned, the lake area decreased in the latter half, and the lake shrinkage phenomenon was particularly noticeable in region A , which corresponds to thermokarst lowlands close to both the Lena and Aldan rivers. Analogously with the former period, we can identify that the spatial pattern of the grass class changes in the latter half was linked to that of the water class. The lake shrinkage in the area increased the grassland areas around the lake, particularly in region A .
The forest class revealed a characteristic temporal and spatial change pattern distinguished from other land covers. In most of the study areas, the forest area showed a gentle decline or stable condition. However, in region A , where the lake shrinkage was predominant in the latter half, we can identify a significant forest reduction in the latter half of the study period. Looking at the pixel-wise classification results, it can be seen that much of the reduced forest class moved to the grass class. These results suggest that there were characteristic land cover changes related to permafrost degradation, such as forest opening and tree density reduction along with lake shrinkage in the thermokarst lowlands close to rivers.

5. Discussion

5.1. Comparison with Previous Studies

In this study, we analyzed land cover changes in central Yakutia from 2001 to 2019. Several previous studies have investigated changes in central Yakutia that overlap with our study area. Boike et al. [32] examined landscape changes in wide areas of central Yakutia using Landsat and MODIS data. They analyzed net changes in the lake area between 2001 and 2009 based on the Landsat-based water body detection and reported that the total area covered by lakes within the study area increased between 2002 and 2009. They also reported the presence of lake expansion hot spot areas in the lake-rich terrace in the eastern Lena River. Nitze et al. [34] conducted a Landsat-based comparative analysis on the lake dynamics between 1999 and 2014 for four representative thermokarst regions such as Alaska North Slope, Alaska Kobuk-Selawik Lowlands, and Kolyma Lowland along with thermokarst terrain in the Lena River lowlands. They found that the net lake area in other thermokarst regions, such as the northern coastal regions and western Alaska, tended to decrease between the 1999 and 2014 study period, while the eastern Lena River Lowland was characterized by extreme lake expansion.
The lake expansion hotspot in central Yakutia during the 2000s reported in the above two studies is consistent with the analysis area of long-term change trends in this study. The change rates in the former half of our study period, which correspond to the study period of the above two studies, also elucidate that lake expansion is the predominant land cover change throughout the study area. This is consistent with previous reports and can indirectly justify the spatiotemporal land cover monitoring method introduced in our study. The above two studies analyzed only net change using the bi-temporal image and focused only on water bodies that can expect temporally consistent detection performance through multispectral images, whereas our study was able to examine the changes in various land covers comprehensively and to support further understanding of the gradual change patterns in the multi-temporal time series data.
There were few studies on changes in central Yakutia in the 2010s. Zakharova et al. [39] examined the spatial distribution of lakes and grasslands in the central Yakutia thermokarst terrain, which is the same as our study area, and explored the water level changes from 2002 to 2016 using satellite altimeter data, such as ENVISAR RA-2 altimeter and Jason-2 altimeter. Results of water level observations for a small number of lake areas where ENVISAT RA-2 and Jason-2 altimeters overlap from 2002 to 2013 revealed that lake levels increased by an average of 130 cm from 2006 to 2009 and then decreased by an average of 70 cm after 2013. Although detailed information on the spatial location and areal change quantities of lakes with decreasing water levels were not available, considering the Jason-2 ground track, lakes with declined water levels after 2013 can be assumed to correspond well with regions A and B of our study. This is generally consistent with the timing and region of land cover changes identified through our study, which can be another indirect basis supporting the suitability of our approach and justifying the change analysis results. Zakharova et al. [39] also presented the results of in situ verification on the changes in the lake and grassland areas for Yynah alas located in grid 16 of our study area. In the model, the lake area increased from 2003, peaked in 2008, and then decreased slightly. Our study also found that, as a result of fitting the piecewise linear model, the break point of the water class was identified as 2008 in grid area 16, and the area increased before this point and then slightly decreased. Consequently, the field observation results presented in previous studies also confirm the results presented in our study.

5.2. Comparison with Climate Conditions

In addition to previous studies of changes in the central Yakutsk region focusing on lake dynamics, some studies have investigated changes in climatic conditions in association with changes in lake water bodies. Based on in situ data in the central Lena River basin from 1992 to 2008, Iijima et al. [38] observed consecutive positive anomalies of pre-winter rainfall and snowfall in 2004–2007. They suggested that increased soil moisture and active layer thermal properties associated with anomalous precipitation were the main causes of the rise in the water level of thermokarst lakes since 2006. Ulrich et al. [9] also found strong correlations between the increase in lake areas and winter precipitation and winter temperatures. They examined multiple regression models and explained that lake areas can be increased after a preceding warm winter with high precipitation.
More recently, Czerniawska and Chlachula [48] examined the relationship between thermokarst landscape changes and meteorological records from 1980 to 2019 in the Tyungyulyu area, corresponding to regions 16 and 17 in our analysis area. They observed the major expansion of the thermokarst lakes in the Tyungyulyu area in 2008 and interpreted it to be related to the precipitation-rich years of 2006 and 2007 as in the other previous studies. Moreover, they pointed out that the gradual increase in air temperature, particularly in the late spring–early summer period, during 2006–2019, is the most evident regional climate condition, which may trigger dynamic thermokarst lake processes. Based on this steady warming trend since 2006 and in situ survey records, they interpreted the recent water level decline since 2008 as to be the result of permafrost degradation leading to external leakage of the lake water or infiltration into the active layer underneath followed by drainage as the cryolithic boundary retracts. They also reported on the spatiotemporal complexity of and variability in thermokarst topography, in which thermokarst basin systems and their hydrological processes do not respond uniformly to climate.
In order to understand the temporal and spatial changes in climate conditions covering our study area and the study period, we further examined climate parameters including air temperature, soil temperature, and precipitation in the Lena River lowlands as shown in Figure 13. Here, climate parameters were obtained from European Center for Medium-Range Weather Forecasting (ECMWF) reanalysis v5 (ERA5) data [49]. Since it provides temperature and precipitation reanalysis data in a regular latitude–longitude grid of 0.25°, we can analyze the spatial characteristics of climate conditions for grid cells in our land cover change analysis area along with their temporal evolution. Figure 13a,b show variations in the air temperature in the summer and winter seasons, respectively. To represent the annual summer and winter temperatures effectively, the thawing degree days and freezing degree days, defined as the sum of daily mean air temperatures above and below 0   , respectively, were used in this study. Since the land cover trajectories showed different spatial and temporal patterns in the 2000s and 2010s, the temperature change was divided into decadal sequences and fitted to a linear model to infer the decadal trend. In addition, the temperature of each ERA5 grid was grouped into three regions A , B , and C , which showed differences in the trend of land cover changes as discussed in the previous section. In all three regions, the increase in summer temperature in the 2000s and the increase in winter temperature in the 2010s were the dominant temporal trends of air temperature changes. We can hardly identify spatial patterns in air temperature trends in summer, while there were some regional differences in air temperature trends in winter.
Figure 13c,d show the temporal trends of soil temperatures in summer and winter, respectively. Here, we used ERA5 soil temperature level 1 data corresponding to the topsoil temperature. In the case of summer temperature, temporal trends during the entire study period were similar to the air temperature. On the other hand, in the case of soil temperature in winter, there was a difference from air temperature, and a decreasing trend was observed in the 2010s. In addition, we can find slight regional differences in winter soil temperature, particularly in region A , showing a slightly higher increase rate in winter soil temperature during the 2000s. Figure 13e,f show variations in the precipitation in the summer and winter seasons, respectively. We can identify a notable increasing trend in summer precipitation during the 2000s followed by a gentle decreasing trend in the 2010s. In the case of winter precipitation, there was slight increasing winter precipitation in the 2000s particularly in regions A and B .
Considering temporal trends in climate conditions, the widespread lake expansion in the 2000s throughout the thermokarst region in the eastern Lena River may be related to increasing trends in air temperature, soil temperature, and precipitation in the summer season across the ERA5 grid cells in the study area. On the other hand, in the 2010s, more noticeable changes in the climate condition were found in winter. Particularly, there was a clear increasing trend in winter air temperature during the 2010s. In the second half of the study period (approximately after 2010), Landsat data analysis revealed regional decreases in lake and forest areas. Climatic conditions over the period suggest that these land cover changes may be related to changes in soil cryogenic processes during increasingly warm winters. However, climate trends in the three regions were not clearly distinguished, and the spatial pattern of land cover changes identified through Landsat data could not be fully explained by climate variables. It suggests that the evaluation and prediction of permafrost environmental changes require a more detailed understanding of spatial heterogeneity of various thermal and geo-hydrological characteristics of the active layer. Therefore, in addition to observing short- and long-term changes with optical data, other remote sensing techniques that can observe and quantify cryogenic processes in the active layer should be further investigated.

6. Conclusions

Since the various components of the boreal land covers can be mutually related, it is necessary to monitor changes in different components as a system. However, spatially and temporally dense time series observations over a long time required to effectively observe changes occurring on different land cover types at various temporal and spatial scales are often challenging given the short and rapid growing season and meteorological conditions in these regions. The objective of this study was to devise a change monitoring strategy that can effectively observe changes at different spatiotemporal scales in boreal ecosystems from temporally sparse time series remote sensing data.
In this study, we presented a new post-classification-based change analysis scheme and applied it to time series Landsat data for the central Yakutian study area. Spectral variability between time series data has been a major problem in the analysis of changes that make it difficult to distinguish seasonal growth activities from long-term and short-term land cover changes. To address this issue effectively, we presented a two-stage multi-temporal classification algorithm. By considering both short- and long-term changes as well as the spatially and temporally complex spectral characteristics of time series data, we obtained consistently high classification performances for all Landsat time series data with overall accuracy, ranging from 93.7% to 98.7%, and the Kappa coefficients of 0.91 to 0.98.
The temporal classification results for the short-term class illustrated that the vegetation disturbance caused by the fire can be affected by the thermal and hydrological conditions of the active layer soils as well as the climatic conditions. Despite frequent wildfires widespread in central Yakutsk, we can identify scarce fire-induced changes in the eastern Lena River lowlands. We further analyzed the long-term gradual changes for these thermokarst terraces. The temporal classification results revealed long-term land cover trajectories that could not be explained by monotonic increase or decrease. To characterize the land cover change patterns, we applied a piecewise linear model with two line segments to areal changes in water, grass or low vegetation, and forests or high vegetation classes. The temporal change rates in the piecewise linear model revealed a structural trend with a marked difference between the first half of the study period and the second half of the land cover change. During the former half of the study period, which corresponds to the 2000s, the areal expansion of the lakes on the eastern Lena River terrace was the dominant feature of the land cover change. On the other hand, the land cover changes in the latter half of the study period, which corresponds to the 2010s, exhibited different temporal trends compared with the previous period, and there were significant spatial patterns of land cover changes that can classify the eastern Lena River thermokarst terrace into three regions. Contrary to the widespread lake expansion in the first half, the lake area decreased in the latter half, particularly in the thermokarst lowlands close to both the Lena and Aldan rivers. In this area, significant forest decline could also be identified during the 2010s.
Most previous studies on land cover changes in central Yakutsk were focused exclusively on the lake areas in limited temporal or spatial scales. In this study, we presented a time series classification framework for comprehensively understanding long-term land cover changes that were not sufficiently identified in previous studies. Nonetheless, since there are overlapping periods or regions with our study, we can compare and verify our results with those from previous studies. We confirmed that the results of previous studies from various independent data sources and our results shared the same interpretation of lake dynamics in central Yakutian thermokarst terrain. However, it is worth noting that these results were only observations of revealed land cover changes, which cannot explain the causality between ecosystem changes and climate, soil, permafrost, and other abiotic conditions. Although we also identified distinct differences in climate conditions in the study area such as air and soil temperatures between the 2000s and 2010s, changes in climate parameters could not sufficiently explain the variability and spatial patterns of Landsat-based land cover change. Dedicated in situ surveys may provide local information useful to deduce the causality of local temporal vegetation dynamics in relation to thermal, hydrological, and geological conditions. However, it can still be difficult to obtain a comprehensive understanding of spatial and temporal variability and heterogeneity of the air–vegetation–soil–permafrost system in the boreal environment from the local observation. In this context, space-borne remote sensing techniques that can deduce information on soil or permafrost, such as low-frequency radar polarimetry and interferometry, should be further investigated together with multispectral land cover observations for a better understanding of long-term changes in heterogeneous boreal permafrost environments.

Author Contributions

Conceptualization, S.-Y.K. and S.-E.P.; methodology, S.-Y.K., Y.L. and Y.T.J.; software, S.-Y.K. and Y.L.; validation, Y.T.J. and S.-E.P.; formal analysis, S.-Y.K. and Y.L.; investigation, S.-Y.K., Y.L. and Y.T.J.; resources, S.-Y.K. and Y.L.; data curation, S.-Y.K. and Y.L.; writing—original draft preparation, S.-Y.K. and Y.L.; writing—review and editing, Y.T.J. and S.-E.P.; visualization, S.-E.P.; supervision, S.-E.P.; project administration, Y.T.J.; funding acquisition, S.-E.P. All authors have read and agreed to the published version of the manuscript.

Funding

This work was supported by the Korea Polar Research Institute (KOPRI, PE21900) and by the National Research Foundation of Korea (NRF) grant funded by the Korea government (MSIT) (No. RS-2023-00222563).

Data Availability Statement

Landsat data can be freely downloaded from the USGS Earth Explorer data portal (https://earthexplorer.usgs.gov/, accessed on 23 May 2022). MODIS active fire data are available from the FIRMS (https://firms.modaps.eosdis.nasa.gov/, accessed on 27 July 2022).

Acknowledgments

The authors are grateful to USGS for providing Landsat data. The authors would like to thank FIRMS for providing MODIS active fire data.

Conflicts of Interest

The authors declare no conflicts of interest.

References

  1. Allen, C.D.; Macalady, A.K.; Chenchouni, H.; Bachelet, D.; McDowell, N.; Vennetier, M.; Kitzberger, T.; Rigling, A.; Breshears, D.D.; Hogg, E.H.; et al. A global overview of drought and heat-induced tree mortality reveals emerging climate change risks for forests. For. Ecol. Manag. 2010, 259, 660–684. [Google Scholar] [CrossRef]
  2. Lenton, T.M.; Held, H.; Kriegler, E.; Hall, J.W.; Lucht, W.; Rahmstorf, S.; Schellnhuber, H.J. Tipping elements in the Earth’s climate system. Proc. Natl. Acad. Sci. USA 2008, 105, 1789–1793. [Google Scholar] [CrossRef]
  3. Holtmeier, F.K.; Broll, G. Sensitivity and response of northern hemisphere altitudinal and polar treelines to environmental change at landscape and local scales. Glob. Ecol. Biogeogr. 2005, 14, 395–410. [Google Scholar] [CrossRef]
  4. Beck, P.S.A.; Goetz, S.J. Satellite observations of high northern latitude vegetation productivity changes between 1982 and 2008: Ecological variability and regional differences. Environ. Res. Lett. 2011, 6, 045501. [Google Scholar] [CrossRef]
  5. Macias-Fauria, M.; Forbes, B.C.; Zetterberg, P.; Kumpula, T. Eurasian Arctic greening reveals teleconnections and the potential for structurally novel ecosystems. Nat. Clim. Chang. 2012, 2, 613–618. [Google Scholar] [CrossRef]
  6. Mekonnen, Z.A.; Riley, W.J.; Berner, L.T.; Bouskill, N.J.; Torn, M.S.; Iwahana, G.; Breen, A.L.; Myers-Smith, I.H.; Criado, M.G.; Liu, Y. Arctic tundra shrubification: A review of mechanisms and impacts on ecosystem carbon balance. Environ. Res. Lett. 2021, 16, 53001. [Google Scholar] [CrossRef]
  7. Talucci, A.C.; Loranty, M.M.; Alexander, H.D. Siberian taiga and tundra fire regimes from 2001–2020. Environ. Res. Lett. 2022, 17, 025001. [Google Scholar] [CrossRef]
  8. Kokelj, S.V.; Jorgenson, M.T. Advances in Thermokarst Research. Permafr. Periglac. Process. 2013, 24, 108–119. [Google Scholar] [CrossRef]
  9. Ulrich, M.; Matthes, H.; Schmirrmeister, L.; Schütze, J.; Park, H.; Iijima, Y.; Fedorov, A.N. Differences in behavior and distribution of permafrost-related lakes in Central Yakutia and their response to climatic drivers. Water Resour. Res. 2017, 53, 1167–1188. [Google Scholar] [CrossRef]
  10. Carpino, O.A.; Berg, A.A.; Quinton, W.L.; Adams, J.R. Climate change and permafrost thaw-induced boreal forest loss in northwestern Canada. Environ. Res. Lett. 2018, 13, 084018. [Google Scholar] [CrossRef]
  11. Dearborn, K.D.; Wallace, C.A.; Patankar, R.; Baltzer, J.L. Permafrost thaw in boreal peatlands is rapidly altering forest community composition. J. Ecol. 2021, 109, 1452–1467. [Google Scholar] [CrossRef]
  12. Wright, S.N.; Thompson, L.M.; Olefeldt, D.; Connon, R.F.; Carpino, O.A.; Beel, C.R.; Quinton, W.L. Thaw-induced impacts on land and water in discontinuous permafrost: A review of the Taiga Plains and Taiga Shield, northwestern Canada. Earth Sci. Rev. 2022, 232, 104104. [Google Scholar] [CrossRef]
  13. Walker, D.A.; Gould, W.A.; Maier, H.A.; Raynolds, M.K. The Circumpolar Arctic Vegetation Map: AVHRR-derived base maps, environmental controls, and integrated mapping procedures. Int. J. Remote Sens. 2002, 23, 4551–4570. [Google Scholar] [CrossRef]
  14. Jia, G.J.; Epstein, H.E.; Walker, D.A. Greening of arctic Alaska,1981–2001. Geophys. Res. Lett. 2003, 30, 1029–1033. [Google Scholar] [CrossRef]
  15. Stow, D.; Hope, A.; McGuire, D.; Verbyla, D.; Gamon, J.; Huemmrich, F.; Houston, S.; Racine, C.; Sturm, M.; Tape, K.; et al. Remote sensing of vegetation and land-cover change in Arctic Tundra Ecosystems. Remote Sens. Environ. 2004, 89, 281–308. [Google Scholar] [CrossRef]
  16. Goetz, S.J.; Bunn, A.G.; Fiske, G.J.; Houghton, R.A. Satellite-observed photosynthetic trends across boreal North America associated with climate and fire disturbance. Proc. Natl. Acad. Sci. USA 2005, 102, 13521–13525. [Google Scholar] [CrossRef]
  17. Verbyla, D. The greening and browning of Alaska based on 1982–2003 satellite data. Glob. Ecol. Biogeogr. 2008, 17, 547–555. [Google Scholar] [CrossRef]
  18. Bhatt, U.S.; Walker, D.A.; Raynolds, M.K.; Bieniek, P.A.; Epstein, H.E.; Comiso, J.C.; Pinzon, J.E.; Tucker, C.J.; Polyakov, I.V. Recent Declines in Warming and Vegetation Greening Trends over Pan-Arctic Tundra. Remote Sens. 2013, 5, 4229–4254. [Google Scholar] [CrossRef]
  19. Hachem, S.; Allard, M.; Duguay, C. Using the MODIS land surface temperature product for mapping permafrost: An application to Northern Quebec and Labrador, Canada. Permafr. Periglac. Process. 2009, 20, 407–416. [Google Scholar] [CrossRef]
  20. Langer, M.; Westermann, S.; Boike, J. Spatial and temporal variations of summer surface temperatures of wet polygonal tundra in Siberia-implications for MODIS LST based permafrost monitoring. Remote Sens. Environ. 2010, 114, 2059–2069. [Google Scholar] [CrossRef]
  21. Westermann, S.; Langer, M.; Boike, J. Spatial and temporal variations of summer surface temperatures of high-arctic tundra on Svalbard—Implications for MODIS LST based permafrost monitoring. Remote Sens. Environ. 2011, 115, 908–922. [Google Scholar] [CrossRef]
  22. Ichoku, C.; Kaufman, Y.J.; Giglio, L.; Li, Z.; Fraser, R.H.; Jin, J.Z.; Park, W.M. Comparative analysis of daytime fire detection algorithms using AVHRR data for the 1995 fire season in Canada: Perspective for MODIS. Int. J. Remote Sens. 2003, 24, 1669–1690. [Google Scholar] [CrossRef]
  23. Roy, D.P.; Jin, Y.; Lewis, P.E.; Justice, C.O. Prototyping a global algorithm for systematic fire-affected area mapping using MODIS time series data. Remote Sens. Environ. 2005, 97, 137–162. [Google Scholar] [CrossRef]
  24. Loboda, T.; O’neal, K.J.; Csiszar, I. Regionally adaptable dNBR-based algorithm for burned area mapping from MODIS data. Remote Sens. Environ. 2007, 109, 429–442. [Google Scholar] [CrossRef]
  25. Moreno Ruiz, J.A.; García Lázaro, J.R.; del Águila Cano, I.; Leal, P.H. Burned area mapping in the North American boreal forest using terra-MODIS LTDR (2001–2011): A comparison with the MCD45A1, MCD64A1 and BA GEOLAND-2 products. Remote Sens. 2014, 6, 815–840. [Google Scholar] [CrossRef]
  26. Olthof, I.; Fraser, R.H. Mapping northern land cover fractions using Landsat ETM+. Remote Sens. Environ. 2007, 107, 496–509. [Google Scholar] [CrossRef]
  27. Selkowitz, D.J.; Stehman, S.V. Thematic accuracy of the National Land Cover Database (NLCD) 2001 land cover for Alaska. Remote Sens. Environ. 2011, 115, 1401–1407. [Google Scholar] [CrossRef]
  28. Langford, Z.L.; Kumar, J.; Hoffman, F.M.; Breen, A.L.; Iversen, C.M. Arctic Vegetation Mapping Using Unsupervised Training Datasets and Convolutional Neural Networks. Remote Sens. 2019, 11, 69. [Google Scholar] [CrossRef]
  29. Jones, B.M.; Grosse, G.; Arp, C.D.; Jones, M.C.; Walter Anthony, K.M.; Romanovsky, V.E. Modern thermokarst lake dynamics in the continuous permafrost zone, northern Seward Peninsula, Alaska. J. Geophys. Res. 2011, 116, G00M03. [Google Scholar] [CrossRef]
  30. Olthof, I.; Fraser, R.H.; Schmitt, C. Landsat-based mapping of thermokarst lake dynamics on the Tuktoyaktuk Coastal Plain, Northwest Territories, Canada since 1985. Remote Sens. Environ. 2015, 168, 194–204. [Google Scholar] [CrossRef]
  31. Séjourné, A.; Costard, F.; Fedorov, A.N. Evolution of the banks of thermokarst lakes in Central Yakutia (Central Siberia) due to retrogressive thaw slump activity controlled by insolation. Geomorphology 2015, 241, 31–40. [Google Scholar] [CrossRef]
  32. Boike, J.; Grau, T.; Heim, B.; Günther, F.; Langer, M.; Muster, S.; Gouttevin, I.; Lange, S. Satellite-derived changes in the permafrost landscape of central Yakutia, 2000–2011: Wetting, drying, and fires. Glob. Planet. Chang. 2016, 139, 116–127. [Google Scholar] [CrossRef]
  33. Nitze, I.; Grosse, G. Detection of landscape dynamics in the Arctic Lena Delta with temporally dense Landsat time-series stacks. Remote Sens. Environ. 2016, 181, 27–41. [Google Scholar] [CrossRef]
  34. Nitze, I.; Grosse, G.; Jones, B.M.; Arp, C.D.; Ulrich, M.; Fedorov, A.; Veremeeva, A. Landsat-Based Trend Analysis of Lake Dynamics across Northern Permafrost Regions. Remote Sens. 2017, 9, 640. [Google Scholar] [CrossRef]
  35. Nitze, I.; Grosse, G.; Jones, B.M.; Romanovsky, V.E.; Boike, J. Remote sensing quantifies widespread abundance of permafrost region disturbances across the Arctic and Subarctic. Nat. Commun. 2018, 9, 5423. [Google Scholar] [CrossRef]
  36. Ai, J.; Zhang, C.; Chen, L.; Li, D. Mapping Annual Land Use and Land Cover Changes in the Yangtze Estuary Region Using an Object-Based Classification Framework and Landsat Time Series Data. Sustainability 2020, 12, 659. [Google Scholar] [CrossRef]
  37. Nyland, K.E.; Gunn, G.E.; Shiklomanov, N.I.; Engstrom, R.N.; Streletskiy, D.A. Land Cover Change in the Lower Yenisei River Using Dense Stacking of Landsat Imagery in Google Earth Engine. Remote Sens. 2018, 10, 1226. [Google Scholar] [CrossRef]
  38. Iijima, Y.; Fedorov, A.N.; Park, H.; Suzuki, K.; Yabuki, H.; Maximov, T.C.; Ohata, T. Abrupt increase in soil temperature under conditions of increased precipitation in a permafrost region: The central Lena River basin. Permafr. Periglac. Process 2010, 21, 30–41. [Google Scholar] [CrossRef]
  39. Zakharova, E.A.; Kouraev, A.V.; Stephane, G.; Franck, G.; Desyatkin, R.V.; Desyatkin, A.R. Recent dynamics of hydro-ecosystems in thermokarst depressions in Central Siberia from satellite and in situ observations: Importance for agriculture and human life. Sci. Total Environ. 2018, 615, 1290–1304. [Google Scholar] [CrossRef] [PubMed]
  40. Fedorov, A.N.; Vasilyev, N.F.; Torgovkin, Y.I.; Shestakova, A.A.; Varlamov, S.P.; Zheleznyak, M.N.; Shepelev, V.V.; Konstantinov, P.Y.; Kalinicheva, S.S.; Basharin, N.I.; et al. Permafrost-Landscape Map of the Republic of Sakha (Yakutia) on a Scale 1:1,500,000. Geosciences 2018, 8, 465. [Google Scholar] [CrossRef]
  41. Zhu, Z.; Woodcock, C.E. Object-based cloud and cloud shadow detection in Landsat imagery. Remote Sens. Environ. 2012, 118, 83–94. [Google Scholar] [CrossRef]
  42. García, M.J.L.; Caselles, V. Mapping burns and natural reforestation using thematic mapper data. Geocarto Int. 1991, 6, 31–37. [Google Scholar] [CrossRef]
  43. Eidenshink, J.; Schwind, B.; Brewer, K.; Zhu, Z.-L.; Quayle, B.; Howard, S.A. A Project for monitoring trends in burn severity. Fire Ecol. 2007, 3, 3–21. [Google Scholar] [CrossRef]
  44. Hayasaka, H. Recent vegetation fire incidence in Russia. Glob. Environ. Res. 2011, 15, 5–13. [Google Scholar]
  45. Czudek, T.; Demek, J. Thermokarst in Siberia and its influence on the development of lowland relief. Quat. Res. 1970, 1, 103–120. [Google Scholar] [CrossRef]
  46. Fedorov, A.N.; Gavriliev, P.; Konstantinov, P.; Hiyama, T.; Iijima, Y.; Iwahana, G. Estimating the water balance of a thermokarst lake in the middle of the Lena River basin, eastern Siberia. Ecohydrology 2014, 7, 188–196. [Google Scholar] [CrossRef]
  47. Crate, S.; Ulrich, M.; Habeck, J.; Desyatkin, A.; Desyatkin, R.; Fedorov, A.; Hiyama, T.; Iijima, Y.; Ksenofontov, S.; Mészáros, C.; et al. Permafrost livelihoods: A transdisciplinary review and analysis of thermokarst-based systems of indigenous land use. Anthropocene 2017, 18, 89–104. [Google Scholar] [CrossRef]
  48. Czerniawska, J.; Chlachula, J. Climate-change induced permafrost degradation in Yakutia, East Siberia. Arctic 2020, 73, 509–528. [Google Scholar] [CrossRef]
  49. Hersbach, H.; Bell, B.; Berrisford, P.; Hirahara, S.; Horányi, A.; Muñoz-Sabater, J.; Nicolas, J.; Peubey, C.; Radu, R.; Schepers, D.; et al. The ERA5 global reanalysis. Q. J. R. Meteorol. Soc. 2020, 146, 1999–2049. [Google Scholar] [CrossRef]
Figure 1. Location of the study area in central Yakutia. The yellow rectangle indicates Landsat data coverage.
Remotesensing 16 01868 g001
Figure 2. Overview of two-stage land cover classification algorithm.
Remotesensing 16 01868 g002
Figure 3. NBR histogram for the entire study period for the burned (solid lines) and unburned (dashed lines) areas.
Remotesensing 16 01868 g003
Figure 4. Schematic illustration of (a) spatial and temporal dimensions of the time series Landsat data, (b) lateral staking of the multi-temporal data, and (c) simultaneous classification of laterally stacked multi-temporal Landsat data. Spectral reflectance of four classes, namely (d) class 1, (e) class 2, (f) class 3, and (g) class 4, of simultaneous unsupervised classification of the entire study period.
Remotesensing 16 01868 g004
Figure 5. Classification results of time series Landsat data.
Remotesensing 16 01868 g005
Figure 6. (a) Classification results of burned scar for the entire study period and (b) annual burned area derived from the Landsat data. Green, orange, and yellow polygons indicate the northern Aldan River, western Lena River, and eastern Lena River eco-sections. (c) Percentage of annual area burned within each eco-section.
Remotesensing 16 01868 g006
Figure 7. (a) The long-term change analysis area in the thermokarst terrain in the eastern Lena River eco-section (black grid), and the temporal changes in (b) forest, (c) grass, and (d) water classes within each grid cell over the entire study period. (e) Number and color assignment of each grid.
Remotesensing 16 01868 g007
Figure 8. Example of temporal changes in land cover class and piecewise linear model. Circles represent observed changes in class area density in the analysis grid cell and the blue solid line is the piecewise linear model fitted to the observation with slopes m 1 and m 2 , and break point τ .
Remotesensing 16 01868 g008
Figure 9. Spatial distribution of the estimated change rates m 1 (first row) and m 2 (second row), the break points τ (third row), and the coefficient of determination (R-squares; fourth row) for forest, grass, and water classes over the analysis area.
Remotesensing 16 01868 g009
Figure 10. Relationship between the change rates m 1 and m 2 in the southern area (grid numbers 11–18) of (a) forest, (b) grass, and (c) water classes.
Remotesensing 16 01868 g010
Figure 11. Relationship between the change rates m 1 and m 2 in the northern area (grid numbers 1–10) of (a) forest, (b) grass, and (c) water classes.
Remotesensing 16 01868 g011
Figure 12. (a) Classification of the thermokarst terrain into three regions: A, B, and C. Rate of areal change in (b) water, (c) grass, and (d) forest classes for regions A, B, and C.
Remotesensing 16 01868 g012
Figure 13. Temporal trends of climate parameters in regions A, B, and C. (a) Annual thawing degree days of air temperature, (b) annual freezing degree days of air temperature, (c) annual thawing degree days of soil temperature, (d) annual freezing degree days of soil temperature, (e) accumulated summer precipitation, and (f) accumulated winter precipitation. The title of each figure corresponds to the label and unit of the vertical axis.
Remotesensing 16 01868 g013
Table 1. Acquisition data of Landsat and Landsat satellite/sensor.
DateSatelliteSensor
9 August 2001Landsat-7ETM+
12 August 2002Landsat-7ETM+
17 August 2004Landsat-7ETM+
2 August 2007Landsat-5TM
23 August 2010Landsat-5TM
7 August 2012Landsat-7ETM+
24 August 2015Landsat-8OLI
8 August 2018Landsat-7ETM+
27 August 2019Landsat-7ETM+
Table 2. Accuracy analysis of classification results.
Producer Accuracy (%)Overall Accuracy (%)Kappa
YearFire ScarWaterForestGrassSoil
200197.599.799.993.299.296.60.948
200290.599.7100.094.998.497.30.960
200494.0100.0100.097.798.498.70.981
200791.597.599.590.598.895.70.940
201095.098.5100.095.998.898.20.974
201295.799.599.7100.062.093.70.912
201589.096.899.697.482.096.30.949
201891.7100.099.990.673.394.10.916
201994.996.398.599.170.295.40.935
Disclaimer/Publisher’s Note: The statements, opinions and data contained in all publications are solely those of the individual author(s) and contributor(s) and not of MDPI and/or the editor(s). MDPI and/or the editor(s) disclaim responsibility for any injury to people or property resulting from any ideas, methods, instructions or products referred to in the content.

