Abstract
In recent decades several methods have been developed to extract coastlines from remotely sensed images. In fact, this is one of the principal fields of remote sensing research that continues to receive attention, as testified by the thousands of scientific articles present in the main databases, such as SCOPUS, WoS, etc. The main issue is to automatize the whole process or at least a great part of it, so as to minimize the human error connected to photointerpretation and identification of training sites to support the classification of objects (basically soil and water) present in the observed scene. This article proposes a new fully automatic methodological approach for coastline extraction: it is based on the unsupervised classification of the most decorrelated fictitious band derived from Principal Component Analysis (PCA) applied to the satellite images. The experiments are carried out on datasets characterized by images with different geometric resolution, i.e., Landsat 9 Operational Land Imager (OLI) multispectral images (pixel size: 30 m), a Sentinel-2 dataset including blue, green, red and Near Infrared (NIR) bands (pixel size: 10 m) and a Sentinel-2 dataset including red edge, narrow NIR and Short-Wave Infrared (SWIR) bands (pixel size: 20 m). The results are very encouraging, given that the comparison between each extracted coastline and the corresponding real one generates, in all cases, residues that present a Root Mean Squared Error (RMSE) lower than the pixel size of the considered dataset. In addition, the PCA results are better than those achieved with Normalized Difference Water Index (NDWI) and Modified NDWI (MNDWI) applications.
1. Introduction
Satellite images are widely used for environmental monitoring since they permit access to remote locations and hazardous regions without difficulty [1]. There are several possible fields of application, including forestry [2], greenhouses [3], soil moisture [4], glaciers [5], archaeology [6], cultural heritage [7], landslides [8], subsidence phenomena [9], floods [10], effects of volcanic eruptions [11], etc. Moreover, there are also applications concerning the coastal and marine environment, such as the determination of the bathymetry [12], the identification of chlorophyll quantity [13] and the monitoring of erosion and nourishment phenomena [14], for which the identification of the coastline is necessary. Multiple techniques can be applied to satellite images, as well as those obtained from Unmanned Aerial Vehicles (UAVs) [15] or aerial surveys [16], to extract the coastline. Over the years, these techniques have developed more and more, with some requiring the calculation of appropriate indices or the application of classification methods.
The extraction of water features from optical images is typically based on the lower reflectance of the water compared to that of the soil in the infrared channels [17]; on the other hand, water has a peak of reflectance in the green channel.
Based on these principles, in 1996 McFeeters [18] introduced an index, namely the Normalized Difference Water Index (NDWI), that allows water to be discerned from the ground with excellent results. Successively, many other indices were developed for the identification of water bodies, such as the Modified NDWI (MNDWI) proposed by Xu [19] which uses green and SWIR bands, the Automated Water Extraction Index (AWEI) proposed by Feyisa et al. [20] which is a combination of green, Short-Wave Infrared (SWIR) and Near Infrared (NIR) bands, and the Water Index (WI2015) proposed by Fisher et al. [21] which makes use of green, red, NIR and two SWIR bands.
On the other hand, by means of classification techniques, supervised and unsupervised, it is possible to obtain thematic maps capable of representing the spatial variation of one or more specific features [22], such as water and land.
As is known, supervised techniques require some a priori knowledge, or a preliminary visual inspection, of the investigated area in order to achieve training sites [23,24]. However, since they need to meet some specific conditions [25], the intervention of an operator who must manually identify the training sites is required; this operation is obviously time consuming and subject to human error. On the contrary, unsupervised techniques are free from human errors, since they do not require the direct involvement of an operator and need execution times much shorter than supervised methods. In unsupervised classification, pixels are assigned to clusters without taking into account any external data but completely automatically [26]. However, unsupervised classification could generate mismatches between clusters and actual classes [27], and as a matter of fact, it is not always usable.
The automation of the shoreline identification process has been the subject of several studies in the past. In 2012 Latini et al. [28] developed a new neural network algorithm from Synthetic Aperture Radar (SAR) COSMO-SkyMed data. In 2015 Ebaid et al. [29] proposed a procedure based on edge detection methods and Geographic Information System (GIS) tools applied on infrared bands. In 2016 Saeed and Fatima [30] used a Sobel edge operator on DubaiSat images. In 2018 Mirsane et al. [31] integrated radar and optical satellite imagery and applied the wavelet method. In 2019 Dai et al. [32] used a water probability algorithm based on a group of repeat measurements. In 2020 Yang et al. [33] presented a comparative framework of sea–land segmentation for Landsat 8 Operational Land Imager (OLI) via semantic segmentation in deep learning techniques. In 2021 Domazetović et al. [34] developed a coastal extraction tool based on the combination of WorldView-2 multispectral imagery and a stereo-pair-derived digital surface model. Finally, in 2022 Aghdami-Nia et al. [35] developed a new framework based on a convolutional neural network to improve the performance of sea–land segmentation.
It is therefore clear that the most recent applications in this field aim to reduce calculation times and minimize human error. In this work we propose an innovative method for the extraction of the coastline that relies on the integration of Principal Component Analysis (PCA) and the unsupervised classification of the PCA products. In this way the involvement of the operator in the construction of the training sites and the manually conducted threshold research is totally eliminated and calculation times are reduced.
PCA is widely used in remote sensing, and it is in fact applied both for image classification [36] and to improve their visualization [37]. PCA is often used to assess coastline evolution over time [38,39,40]; nevertheless, its application for shoreline detection concerns just a part of the process, above all for enhancing the image geometric resolution (pan-sharpening) [41] or for reducing the number of hyperspectral bands [42].
This paper is organized as follows. In Section 2 the main characteristics of the used dataset (Landsat 9 OLI imagery and Sentinel-2 imagery) and the study areas are summarized. Section 3 presents the novel methodological approach: the PCA is introduced, explaining its capability to calculate a set of decorrelated bands of which the first component is submitted to unsupervised classification; then the K-means algorithm and the accuracy tests are described. Section 4 presents and discusses the results, comparing the levels of accuracy of the extracted coastlines. Section 5 concludes the paper with a generalization of the results.
2. Datasets
For this work two types of optical satellite imagery are used, i.e., Landsat 9 OLI and Sentinel-2, related to three different study areas that are located respectively in Campania, Sardinia and Sicily. Figure 1 shows the geolocation of the study areas in equirectangular WGS84 coordinates, in particular, the Sardinian coast is centered in the yellow box, the Campania coast in the red box and the Sicily coast in the green box.

Figure 1.
Geolocalization of the study areas: the rectangles delimit the three study areas located respectively in Campania (red), Sardinia (yellow) and Sicily (green); the map is in equirectangular projection and WGS 84 ellipsoidal coordinates (EPSG: 4326).
The first study area is part of the Gulf of Naples, located along the south-western coast of Italy (Campania region, province of Naples). The chosen coast extends from a location named Posillipo to the municipality of Vico Equense (Figure 2, top left). The study area opens to the Tyrrhenian Sea on the south-west and reaches Camaldoli hill in the north-west; it is bordered in the north-east by Vesuvius Volcano and in the south-east by the Sorrento Peninsula. The coastal morphology is characterized by an alternation of marine cliffs and narrow coastal plains [43,44].
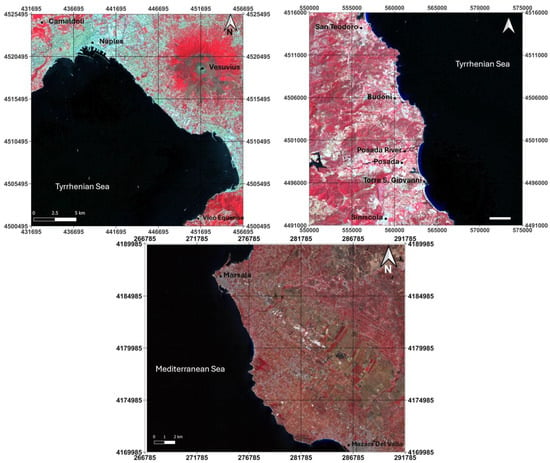
Figure 2.
The 3 study areas in false color compositions of the Landsat 9 OLI images in UTM/WGS 84 plane coordinates (EPSG: 32633): Campania on the left, Sardinia on the right and Sicily on the bottom.
The second study area is in the Sardinia region and the coastline measures approximately 40.6 km between the provinces of Olbia-Tempio and Nuoro, particularly it includes the municipalities of San Teodoro, Budoni, Posada and Siniscola. The area is characterized by large sandy coastal dunes interrupted by rocky shores [45] and human settlements. The southern part includes the Posada and Santa Caterina rivers, whose mouths are located on the sandy beach between Torre S. Giovanni and Mt. Orvili (Figure 2, top right) [46]. Finally, the sandy seafloor beneath the coast is strongly covered by Posidonia oceanica [47].
The third coastal area examined is located in the western part of Sicily (Figure 2, bottom). The coastline extends from the Port of Marsala to that of Mazara del Vallo. This region is a combination of a coastal plain in the first section, generated by sediments deposited by rivers [48]. Subsequently, there are rocky promontories that jut out into the sea alternating with long sandy beaches where it is very common to find sand dunes [49].
2.1. Landsat 9
On 27 September 2021, the Landsat 9 satellite was launched from Vandenberg Space Force Base in California, joining the same orbit as the previous Landsat 8 satellite (polar sun-synchronous orbit at 705 km altitude), 8 days out of phase. Entering service on 6 January 2022, every 99 min it makes a complete orbit (in 1 day it completes about 14 orbits) and in 16 days it observes the entire globe, with a swath of 185 km [50].
Landsat 9 replicates most of the functions of its predecessor, such as the Operational Land Imager (OLI) and the Thermal Infrared Sensor (TIRS), optical and thermal sensors, respectively. Specifically, the TIRS has a risk class B implementation (high priority, high national significance, high complexity) [51].
The OLI collects data for nine spectral bands with a geometric resolution of 30 m for all bands except for the panchromatic band, which is 15 m; the two thermal bands (TIRS) have a geometric resolution of 100 m. Data are collected simultaneously in the same area by OLI and TIR sensors.
For this work, a Landsat 9 image clip is used, for each study area, including the coastal, blue, red, NIR, Short-Wave Infrared-1 (SWIR-1) and Short-Wave Infrared-2 (SWIR-2) bands (as reported in Table 1).

Table 1.
Characteristics of Landsat 9 OLI Multispectral Bands used in this study.
The Landsat 9 images used in our experiments were acquired on 19 July 2022, for the study area of Campania, on 21 July 2020 for that of Sardinia and finally on 27 August 2021 for the study area of Sicily, as shown in Figure 2, in NIR red–green false color compositions.
2.2. Sentinel-2
Sentinel-2 images can be downloaded free of charge (the same as the Landsat dataset) from the Copernicus Open Access Hub [52], a service provided by the European Space Agency (ESA). The constellation is formed by two satellites called Sentinel-2A and Sentinel-2B, both carrying an optical instrument payload whose main characteristics are shown in Table 2 [53].

Table 2.
Characteristics of Sentinel-2 optical sensor.
The images used in this work were acquired by the Sentinel-2A satellite on the following dates: 16 July 2022 for the Campania area, 27 July 2020 for the Sardinia area and 15 August 2021 for the Sicilian area. The false color NIR red and green compositions are reported in Figure 3.

Figure 3.
The 3 study areas, in false color compositions of the Sentinel-2A images in UTM/WGS 84 plane coordinates (EPSG: 32633): Campania on the left, Sardinia on the right and Sicily on the bottom.
3. Methods
The experiments described in this paper follow the workflow represented in Figure 4.
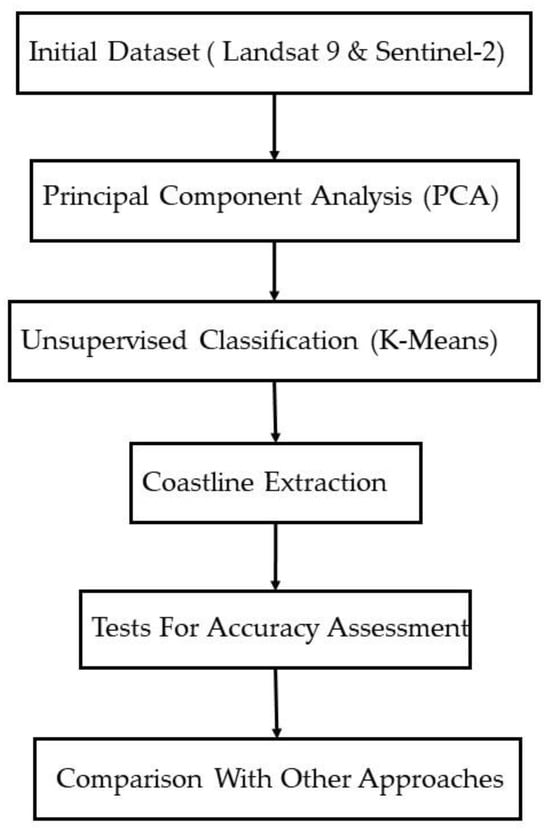
Figure 4.
Workflow of the adopted approach.
Landsat 9 OLI and Sentinel-2 images both undergo PCA. An unsupervised classification technique, K-means, is then applied to the PCA result and the coastline is extracted. Finally, tests are carried out to evaluate the accuracy of the results and they are compared with those obtained by the application of NDWI and MNDWI. The main characteristics of the above-mentioned methods are summarized in the following subsections.
3.1. Principal Component Analysis
Principal component analysis, also known as the Karhunen–Loève transform, is a technique used for data simplification [54]; it reduces the dimensionality of a dataset made up of a large number of correlated variables (as bands), while retaining as much variation as possible in the dataset [55]. This is obtained by transforming, through a linear combination of the variables, into a new set, called Principal Components (PCs), which are uncorrelated and ordered so that the first ones retain most of the variations present in all the original variables [56].
Principal component analysis has applications in many fields such as environmental science [57], chemistry [58] and remote sensing [59].
Starting from n multispectral bands, the principal components are obtained by matrix calculation as follows:
where Y is the vector of principal components, X is the vector of spectral values associated with each pixel, U is the vector of the mean associated with each band and T is the n × n unitary matrix derived from the covariance matrix Cx of the bands [60].
In this work, having different types of datasets, many transformations are applied. In particular, for the Landsat 9 OLI images (L9), the PCA was applied for the 7 bands with a 30 m × 30 m resolution. For Sentinel-2, two types of datasets are considered, 20 m × 20 m (S2–20 m) and 10 m × 10 m (–m): the first one (20 m) provides 9 bands (including B2, B3, B4 resampled to 20 m) while the latter (10 m) only 4 bands. Finally, for the application of coastline extraction, only the first component of each transformed dataset is considered, thus having 9 images to be subjected to classification using an unsupervised algorithm.
3.2. K-Means Clustering
Clustering, or group analysis, is the process of identifying natural groupings or clusters within multidimensional data based on some measure of similarity [61]. In many clustering algorithms this similarity is found on the basis of distance, and therefore whether or not it belongs to a set depends on how far the element under consideration is from the set itself.
One of the most widespread clustering algorithms is K-Means (KM) [62]; it is largely used for unsupervised classification of remotely sensed images and it allows accumulation of a set of elements in k clusters based on their degree of similarity. The choice of the number (k) of groups is of fundamental importance and is made a priori by the operator; the algorithm randomly chooses k observations from the dataset and uses these as the initial centroids (midpoints) of the clusters [63].
The procedure can be schematized as follows. Once the k value has been defined, the algorithm randomly assigns the centroids of the clusters; using Euclidean distance, each entry point is associated with the closest centroid group; the KM recalculates the mean of the points belonging to each cluster and repositions the new centroids and so on, until the algorithm converges.
In this study the application of the KM, on the first component of each dataset, obtains a two-cluster classification that largely converges to water and no-water as our experiments demonstrate.
3.3. Coastline Extraction
The raster files obtained following the application of K-means, representing two classes (water and no-water), undergo automatic vectorization to obtain the line that delineates the border between sea and land. This line represents the position of the sea/land intersection at an instant in time, in particular the instant of acquisition of the remote sensing image; for this reason, it is defined as an instantaneous coastline [64].
This clarification is necessary since the coastline has a dynamic nature, its position is variable not only over long periods of time due to erosion and nourishment but also within a day due to tidal phenomena: this last phenomenon can also be very accentuated in coasts presenting low slopes and strong tidal excursions [65].
Taking into account the date and time of image acquisition, it is possible to calculate the tide level of the area under examination. The tidal variation must then be applied to a digital terrain model in order to identify the real coastline [66].
However, in this article these operations are not carried out for two reasons:
- the purpose of our article is only to provide a method for extracting the instantaneous coastline from satellite images;
- the satellite images used (Landsat 9 OLI and Sentinel-2) have such a geometric resolution that the tidal variation for the areas examined is not appreciable.
The coastlines obtained through these operations are finally subjected to an accuracy assessment.
3.4. Accuracy Assessment
In this work, two different types of tests are carried out to evaluate the quality of the results: one aimed at ascertaining the positional accuracy of the extracted coastline, the other aimed at establishing the thematic accuracy of the K-means classification which, distinguishing between water and not water, lays the foundations for the definition of the shoreline. Regarding first type of tests, we compare the automatically extracted coastlines with the related manually vectorized ones that are achieved by means of visual interpretation on the true color RGB composition of the corresponding dataset. In particular, the Distributed Ratio Index (DRI) is considered, which takes into account the non-perfect overlap between the coastlines [67]. If the overlap does not occur perfectly, polygons are generated between the two lines. DRI is therefore obtained using the following formula:
where Ai is the area of the i-th polygon and Li is the length of the effective coastline on which it develops. This index represents the average shift between the two coastlines within the considered polygon, which is considered as residual. Statistical values (i.e., mean, maximum, minimum, RMSE) of the resulting DRIi are calculated. In remote sensing applications, the size of the pixel is used as the spatial unit for the accuracy evaluation [68]; therefore, it is correct to compare the RMSE of DRI with the pixel dimensions of the used images.
Additionally, in order to assess the thematic accuracy of the results, test sites are employed. Test sites serve as representative samples for the two classes being considered, namely water and no-water, ensuring that they are both sufficiently and significantly represented [69].
The determination of the test sites, in our case, relies on a visual analysis of multispectral images. By examining these images, it is possible to gather valuable insights regarding the accuracy of pixel classification, allowing for the identification of pixels that have been correctly classified as well as those that have been misclassified. To evaluate the accuracy of the remotely sensed image classification, a widely adopted approach based on the use of a confusion matrix is employed.
The confusion matrix serves as a table that establishes the connection between the classification outcomes and the ground truth data. The ground truth data are typically obtained through a visual examination of the same remotely sensed images or through alternative information sources such as maps or Global Navigation Satellite System (GNSS) surveys [70]. Rather than considering the entirety of the images, confusion matrices are constructed using data extracted from the test sites, allowing evaluation of the thematic accuracy of the considered classification method [71].
To numerically analyze the thematic accuracy of each classified image, three indices are employed: Producer Accuracy, User Accuracy and Overall Accuracy [72].
Producer Accuracy (PA) denotes the probability of correctly classifying a specific feature within a particular area. This is determined by dividing the number of pixels accurately classified within each category by the total number of reference pixels associated with that category [73]. For a generic class i, PAi is expressed as follows:
where NAi is the correctly classified pixels of classi, while PBi is the total pixels belonging to the class considered.
User Accuracy (UA) suggests the probability that an area classified into a given category corresponds to that specific category within the same area. It is calculated by dividing the number of pixels correctly classified within each category by the total number of pixels classified as belonging to that category [73]. For a generic class i, UA is given by the following formula:
where NAi is the number of correctly classified pixels of classi, and PCi is the number of the pixels that classify into classi.
Overall Accuracy (OA) represents the probability of accurately classifying all categories. It is computed by dividing the total number of correctly classified pixels by the total number of reference pixels [74]. Therefore, OA is calculated according to the following formula:
where Nai, NAj, … NAk indicate the number of pixels correctly classified for each class (i, j, …, k), while P is the total number of pixels used.
These indices provide a concise and informative summary of the thematic accuracy of the classification method employed in this study.
3.5. Result Comparison
Finally, to further analyze the performance of the proposed approach we apply two water indices, i.e., NDWI and MNDWI. The first index is defined by the following formulas related to the used dataset [18]:
The second index adopts the same type of formula as NDWI but uses a different combination of bands in order to improve the identification of water bodies, for example, in urban areas or in the presence of eutrophication phenomena. According to [75,76], in this study we apply MNDWI by the following formulas related to the used dataset:
Also known as NDWI-B to point out that the blue band replaces the green band, MNDWI is useful to identify not only large water bodies but also small water bodies as testified by different studies in the literature [75,77]. In addition, water pixels could present slightly higher reflectance values in the green band in the presence of chlorophyll synthesis due to submerged vegetation, seagrass, algae, etc. The deviation from the typical water spectral signature could make the distinction between water and no-water more difficult. The use of the blue band would avoid or mitigate this problem since the water pixels do not show greatly dissimilar reflectance values linked to the presence or absence of chlorophyll synthesis.
As shown in a previous study [78], starting from the images produced by the NDWI and MNDWI the K-means clustering is applied. The results are therefore subjected to automatic vectorization to extract the coastlines. Accuracy evaluation of each extracted coastline is carried out by applying the DRI and the confusion matrix. The results are finally compared with those obtained by applying PCA.
Furthermore, some studies highlight the effectiveness of infrared bands to distinguish water bodies [79,80]. For an additional analysis and limited to the study area of Sardinia, the coastline is extracted directly from the infrared bands treated with K-means. In particular, the following bands are considered: B5 and the composition B5, B6, B7 for the Landsat 9 OLI; B8A and composition B5, B6, B7, B8A, B11 and B12 for Sentinel-2 at 20 m; B8 for Sentinel-2 at 10 m. DRI is used for accuracy evaluation of the results.
4. Results and Discussion
The following table (Table 3) reports the coefficients to obtain the PCA-1 and the percentage of variance that this synthetic band includes.

Table 3.
Coefficients and Percentage of variance of the first component.
Considering that PCA-1 provides in all cases high values of standardized variance (in eight cases more than 90% and in the remaining case still higher than 85%), we do not use the other components (PCA-2, PCA-3) for the subsequent experiments.
Figure 5, Figure 6 and Figure 7 show the synthetic bands obtained from Landsat 9 OLI dataset, specifically the first component of PCA (PCA-1), NDWI and MNDWI.

Figure 5.
Landsat 9 OLI synthetic bands for Campania study area: PCA-1 on the left, NDWI on the right and MNDWI on the bottom.
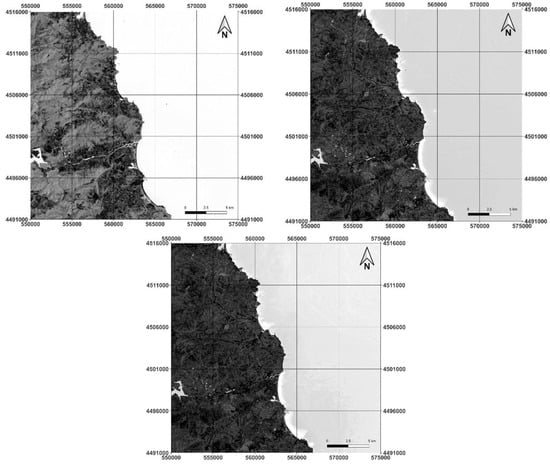
Figure 6.
Landsat 9 OLI synthetic bands for Sardinia study area: PCA-1 on the left, NDWI on the right and MNDWI on the bottom.
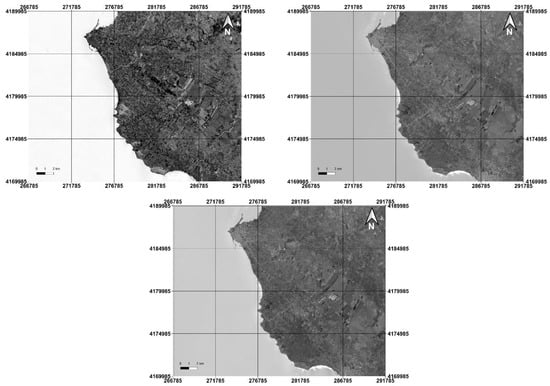
Figure 7.
Landsat 9 OLI synthetic bands for Sicily study area: PCA-1 on the left, NDWI on the right and MNDWI on the bottom.
By means of visual analysis, the image obtained by PCA presents a greater contrast between water and no-water, allowing the coast to be easily identified.
Figure 8, Figure 9 and Figure 10 show the results obtained using Sentinel-2 images with a resolution equal to 10 m, while Figure 11, Figure 12 and Figure 13 show the results obtained using only the bands with a geometric resolution equal to 10 m. Note that the first synthetic principal component (PCA-1) results from processing all images included in the package available on COH as S2–20 m in which there are also blue, green and red bands resampled from 10 m to 20 m.
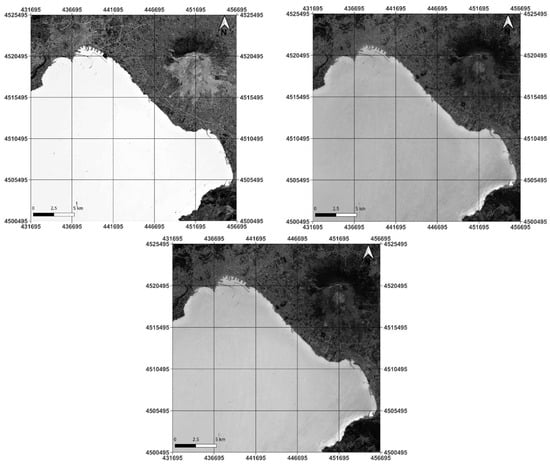
Figure 8.
Sentinel-2 (20 m) synthetic bands for Campania study area: PCA-1 on the left, NDWI on the right and MNDWI on the bottom.
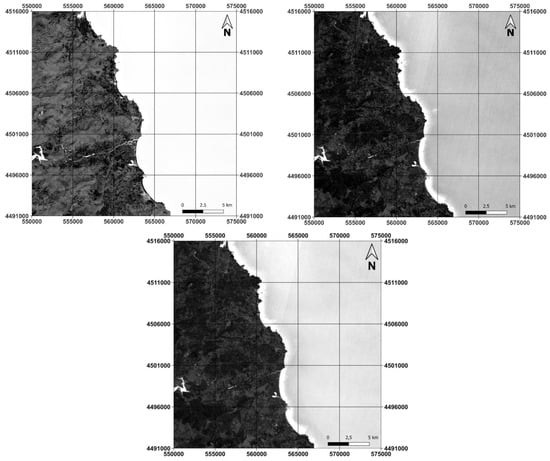
Figure 9.
Sentinel-2 (20 m) synthetic bands for Sardinia study area: PCA-1 on the left, NDWI on the right and MNDWI on the bottom.
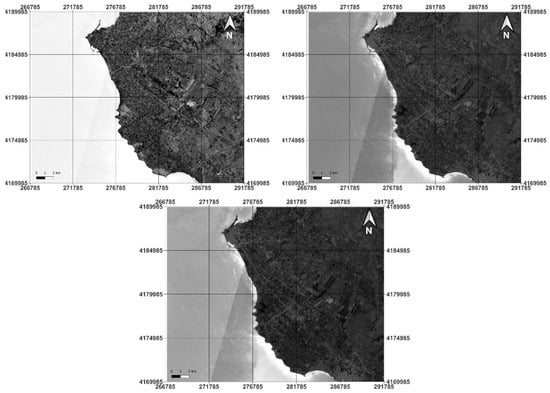
Figure 10.
Sentinel-2 (20 m) synthetic bands for Sicily study area: PCA-1 on the left, NDWI on the right and MNDWI on the bottom.
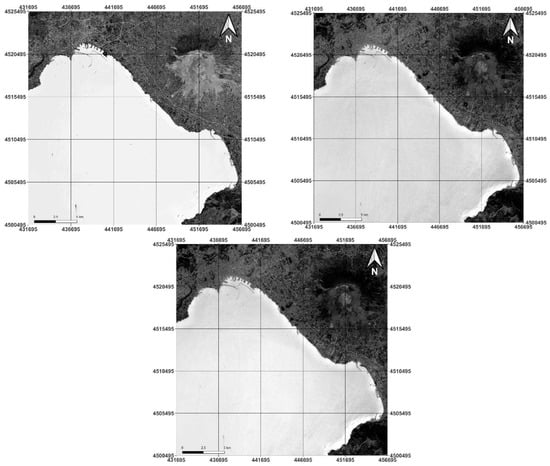
Figure 11.
Sentinel-2 (10 m) synthetic bands for Campania study area: PCA-1 on the left, NDWI on the right and MNDWI on the bottom.
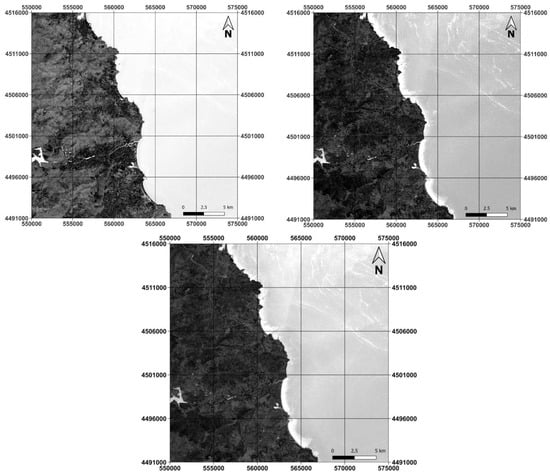
Figure 12.
Sentinel-2 (10 m) synthetic bands for Sardinia study area: PCA-1 on the left, NDWI on the right and MNDWI on the bottom.
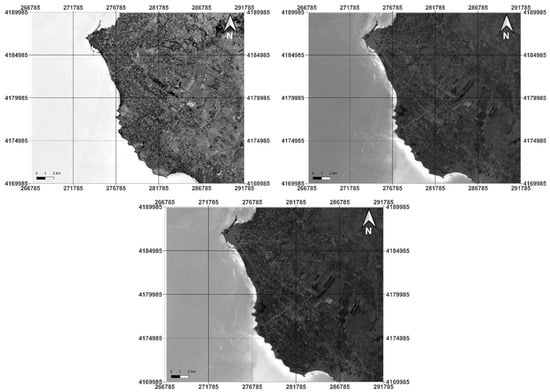
Figure 13.
Sentinel-2 (10 m) synthetic bands, Sicily study area: PCA-1 on the left, NDWI on the right and MNDWI on the bottom.
The Sentinel-2 results also show higher contrast in the PCA-1 image than in the NDWI and MNDWI images between land and sea. However, shallow waters tend to be very bright when applying NDWI and MNDWI, also giving in this case high contrast with the coast.
By applying the K-means algorithm to the previously obtained synthetic bands, two clusters are generated, representative of the water and no-water (soil and vegetation) classes.
To show the difference between the results of K-means applied to different synthetic bands, we select two zones, as reported in Figure 14: Zone A (Port of Naples) for the Landsat 9 OLI dataset concerning the Campania study area and Zone B (coastal area of San Teodoro) for the Sentinel-2 dataset (10 m) concerning the Sardinia study area.
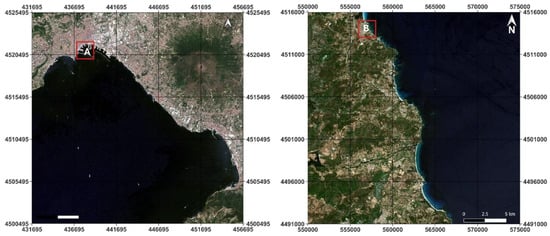
Figure 14.
Geolocation of the selected zones to show details of K-means results: Port of Naples (Zone A) on the left and coastal area of San Teodoro (Zone B) on the right.
Figure 15 shows the results that the application of K-means to synthetic images (i.e., PCA-1 and NDWI) derived from L9 generates Zone A (Port of Naples).
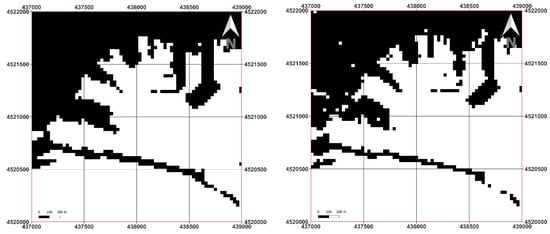
Figure 15.
K-means clustering in Zone A (Port of Naples) for synthetic images derived by L9: results for PCA-1 image on the left and for NDWI image on the right.
Figure 16 shows the results that the application of K-means to synthetic images (i.e., PCA-1 and NDWI) derived from –m generates Zone B (coastal area of San Teodoro).
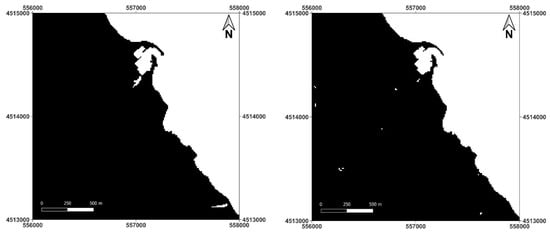
Figure 16.
K-means clustering in Zone B (coastal area of San Teodoro) for synthetic images derived by –m: results for PCA-1 image (on the left) and for NDWI image (on the right).
The coastlines are extracted from the classified images by means of automatic polygonization of the raster files. For testing the positional accuracy of the results, each line is compared with the coastline vectorized manually and analyzed by DRI; the results are shown in Table 4, Table 5 and Table 6.

Table 4.
Statistical values of DRI for the extracted coastlines from Landsat 9 OLI images.

Table 5.
Statistical values of DRI for the extracted coastlines from Sentinel-2 images (resolution: 20 m).

Table 6.
Statistical values of DRI for the extracted coastlines from Sentinel-2 images (resolution: 10 m).
The first column of the tables indicates the image from which the coastline is automatically extracted, according to the previously presented workflow. Starting from the manually vectorized coastline, the DRI values are calculated, and the statistical values are extracted and reported in the respective columns.
In the first analysis it can be noted that the use of the PCA transformation for this application confirms an excellent result.
As previously mentioned, we consider the pixel size as a reference to define the quality of the results, remembering that the pixel size for each dataset varies, in particular, the Landsat 9 OLI images are 30 m × 30 m, while the Sentinel-2 images have two formats, i.e., 20 m × 20 m and 10 m × 10 m.
Specifically for the Landsat images of the Campania study area, the RMSE value of the PCA method is 12.1 m which is lower compared to the NDWI (14.369 m). The greatest difference can be seen in the maximum values: NDWI reaches 50.574 m, almost double the pixels, while the maximum of the PCA method (34.170 m) is in the order of the pixel size. In addition, using the MNDWI the result in terms of RMSE (16.101 m) is higher than the other water index (the maximum value is 58.986 m), remaining, however, less effective in the PCA.
For the Sardinia area, the scenario respects the trend of the previous one, confirming the best performance of the PCA, with an RMSE value of 8.983 m, while the two water indices, NDWI and MNDWI, provide worse results with RMSE values of 12.490 m and 11.850 m, respectively.
Finally, again for the same type of sensor but with a different scenario located in the Sicilian area, the tests confirm the excellent performance of the PCA (RMSE = 8.864 m) which prevails over the other two methods, NDWI (RMSE = 12.525 m) and MNDWI (RMSE = 11.482 m).
By changing the type of dataset, the results confirm the validity of the proposed method; in fact, for S2–20 m, in the Campania region, the PCA has an RMSE value of 5.394 m while the NDWI has 7.650 m and MNDWI 9.1 m. The maximum values once again highlight the effectiveness of the PCA, as it has a lower value than the pixel size (19.569 m) unlike the two methods that exploit the water index which have higher values (maximum of NDWI is 25.842 m and that of MNDWI is 26.044 m).
In the Sardinia area, the RMSE value for the PCA is equal to 5.064 m, still lower than the value given by the NDWI, which is 6.464 m, and the value of the MNDWI is 6.192 m. The maximum value, even in this situation, presents an evident difference in the three methods considered; in fact, for the NDWI it is 34.952 m, much larger than the pixel size, for the MNDWI it is 20.065 m, almost equal to the pixel size, and for the PCA it is 19.883 m, below the resolution of the cell.
The extracted Sicilian coastline once again establishes the best performance of the PCA (RMSE of 5.4 m) which is better than the two water indices, NDWI (RMSE equal to 8.847 m) and MNDWI (RMSE equal to 8.462 m).
Finally, for the last dataset taken into consideration, –m, in the Campania area, the residuals significantly decrease for the PCA (RMSE equal to 2.924 m) but not in the same proportions for the NDWI and the MNDWI (RMSE equal to 4.927 m and 5.028 m, respectively); the efficiency of the PCA (14 m) is also highlighted by the maximum value of around 20 m for the two other methods.
In the Sardinian area the RMSE value for the NDWI method is 4.280 m and for MNDWI it is 3.982 m, both higher than the PCA value (3.736 m). In this situation, however, we note that the maximum value of the PCA (18.931 m) is slightly worse than that provided by the NDWI (17.544 m); this happens due to the incorrect attribution of one pixel which determines the movement of the coastline (otherwise the value would be 10 m lower), considering that the highest value after the maximum is approximately 4 m lower.
For the last study area, with –m, the situation is further confirmed. In fact, the two methods that use water indices have high RMSE values (that of NDWI is equal to 4.837 m and that of MNDWI is equal to 4.917 m) if compared to the PCA method (3.032 m). Finally, the maximum values remain high for the NDWI and MNDWI (20.816 m and 20.208 m, respectively), while for the PCA it is 16 m.
In summary, PCA always has excellent RMSE results compared to NDWI and MNDWI, the only difference found is in the maximum DRI value for –m in the study area of Sardinia, which instead has a slightly higher value.
It should also be noted that the MNDWI for all datasets presents better results than the NDWI in two out of three geographical areas, specifically Sardinia and Sicily. As previously remarked, the use of the blue band instead of the green band in MNDWI frees the identification of the water from the interference of submerged vegetation, including algae, which, if present, could make water pixels less easy to recognize. Investigations on the specificity of the considered areas and the analysis of the reflectance in the green band seem to confirm the presence of chlorophyll synthesis in the waters of Sicily and Sardinia, but this phenomenon is not of equal intensity in Campania.
To show the difference between the automatically vectorized coastlines obtained through the different adopted approaches, we select two zones, as reported in Figure 17: Zone C (Port of Torre del Greco) for the Landsat 9 OLI dataset and Zone D (coastal area of San Giovanni) for both Sentinel-2 datasets.
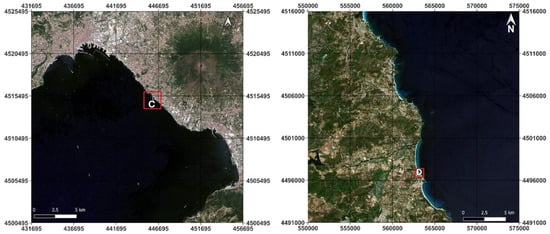
Figure 17.
Geolocation of the selected zones to show details of automatically vectorized coastlines obtained through PCA and through NDWI: Torre del Greco (Zone C) on the left and San Giovanni (Zone D) on the right.
Figure 18, Figure 19 and Figure 20 show details of the extracted coastlines to visualize the differences between PCA and NDWI results.

Figure 18.
Details of automatically vectorized coastlines extracted from Landsat 9 OLI images in the area of Torre del Greco (Zone C): on the left the coastline from PCA (in green), on the right the coastline from NDWI (in blue); in both cases the reference coastline resulting from RGB visual interpretation and manual vectorization (in red) is reported for comparison.
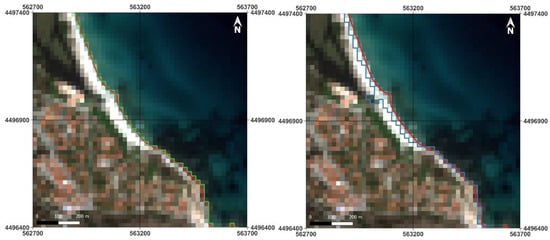
Figure 19.
Details of automatically vectorized coastlines extracted from S2–20 m in the area of San Giovanni (Zone D): on the left the coastline from PCA (in green), on the right the coastline from NDWI (in blue); in both cases the reference coastline resulting from RGB visual interpretation and manual vectorization (in red) is reported for comparison.
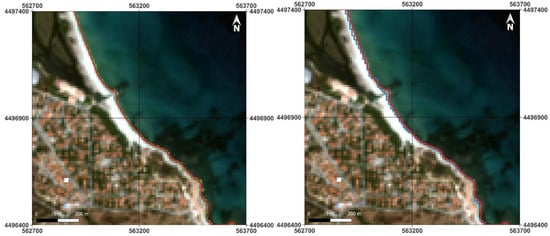
Figure 20.
Details of automatically vectorized coastlines extracted from –m in the area of San Giovanni (Zone D): on the left the coastline from PCA (in green), on the right the coastline from NDWI (in blue); in both cases the reference coastline resulting from RGB visual interpretation and manual vectorization (in red) is reported for comparison.
Compared to the results obtained by NDWI, the coastline achieved by PCA presents a greater similarity to the reference coastline in all images; particularly, the higher the resolution, the better the overlap between the reference coastline and the extracted one. This is easily explainable because as the size of the pixel decreases, its content, i.e., the area it encloses, becomes more homogeneous. In other words, near the coastline a 10 m pixel is more likely to contain only water or no water (land and/or vegetation) than a 20 m or 30 m pixel; therefore, the adopted classification method, whether based on PCA, NDWI or MNDWI, is better and correctly attributes pixels that are not “mixed” to a specific class.
Zone C of the Landsat 9 OLI image reported in Figure 18 largely concerns the Port of Torre Del Greco (Naples). The pier is built with dark-colored stones and, moreover, in the image there are boats on the dock, attributable to lighter pixels in the RGB image. The NDWI completely fails to classify the pier as no-water, identifying only the boats as such; on the contrary, the PCA correctly classifies both the pier and the boats as no-water. Finally, the coastline extracted by NDWI generally appears further back in all situations in which there are dark-colored rocks outlining the shore.
Zone D of the Sentinel-2 images reported in Figure 19 (S2–20 m) and Figure 20 (S2–10 m) includes a sandy beach, specifically the surroundings of a dry river mouth. Referring to Figure 19, the NDWI classifies the river mouth area entirely as water, while the PCA correctly classifies it as no-water. Furthermore, in general, along the beach the NDWI identifies the sand pixels closest to the shore as water rather than no-water (as PCA correctly does); this result could be due to the fact that the elements closest to the coast are wet and therefore they have a spectral signature closer to that of water than dry sand. Referring to Figure 20 the results obtained using NDWI seem more in line with those obtained using PCA, although a slight difference is still noted at the river mouth. As already noted, when analyzing the DRI results, the effectiveness of PCA with the –m dataset is reduced due to the fact that the number of available bands is reduced and the ability of the first component to enhance the differences between different components (e.g., sand and water) is affected.
In summary, although the increasing of resolution of the image reduces the differences between PCA, NDWI and MNDWI from visual investigation the results obtained using PCA are always more satisfactory than those obtained using NDWI and MNDWI.
Table 7, Table 8 and Table 9 show the thematic accuracy values of PCA, NDWI and MNDWI for Landsat 9 OLI, Sentinel-2 at 20 m and Sentinel-2 at 10 m.

Table 7.
Thematic accuracy values for classification of products derived from Landsat 9 OLI.

Table 8.
Thematic accuracy values for classification of products derived from Sentinel-2 (20 m).

Table 9.
Thematic accuracy values for classification of products derived from Sentinel-2 (10 m).
The closer the accuracy index values are to 100%, the more satisfactory the results are: in our case every index shows values above 87%. The results are very promising for the proposed method, since PCA shows higher OA values for each dataset compared with NDWI and MNDWI.
The best results are found when PCA is applied to Sentinel-2 images with a 20 m resolution: for all study areas the thematic accuracy is very high (OA = 98.99% for Campania, 99.38% for Sardinia, 99.14% for Sicily), being in every case better than NDWI and MNDWI.
If these values are compared with those of the synthetic bands derived from the Sentinel-2 dataset at 10 m, a slight drop in the performance of the PCA method can be noted for all the applied indices (OA = 98.55% for Campania, 98.99% for Sardinia, 99.13% for Sicily). The opposite happens for the NDWI and MNDWI, for which the indicators mostly show better results compared to the previous case. However, overall, PCA-1 remains better performing than the NDWI and MNDWI.
By analyzing the results relating to the Landsat 9 OLI images, it is still found that the best classification is obtained with PCA-1 for all three study areas considered. In particular, the OA values relating to PCA-1 (OA = 94.91% for Campania, 97.19% for Sardinia, 99.15% for Sicily) remain up to 1-2 percentage points above the corresponding values relating to NDWI (OA = 93.87% for Campania, 95.42% for Sardinia, 97.14% for Sicily) and MNDWI (OA = 91.43% for Campania, 96.88% for Sardinia, 98.41% for Sicily).
Considering the results of all datasets, it is therefore possible to identify a trend in the thematic accuracy with respect to the resolution: for the NDWI and MNDWI we can state that as the resolution increases, the thematic accuracy also improves, while this is not true for PCA-1 since the best results are found for S2–20 m. This result could be explained by the fact that PCA works on all available bands (four bands in the case of –m, nine bands in the case of S2–20 m) unlike NDWI which only works on two bands (green and NIR).
As already evident from the results obtained using the DRI and visual inspection, it can be seen that as the resolution increases the differences between PCA and NDWI and MNDWI become smaller.
Table 10 shows the results of accuracy evaluation carried out on the coastlines extracted from infrared bands treated with K-means.

Table 10.
Statistical values of DRI for the coastlines extracted from infrared bands treated with K-means.
5. Conclusions
The experiments described in this article concern three different datasets of satellite images: Landsat 9 OLI multispectral images (pixel size: 30 m), the Sentinel-2 dataset including blue, green, red and Near Infrared (NIR) bands (pixel size: 10 m) and the Sentinel-2 dataset including red edge, narrow NIR and Short-Wave Infrared (SWIR) bands (pixel size: 20 m). To have different areas to analyze, three geographical regions are identified: Campania (Gulf of Naples), the eastern part of Sardinia and the western part of Sicily. The tests highlight the effectiveness of the proposed approach for automatic coastline extraction based on the use of PCA and an unsupervised classification method, such as K-means.
The application of PCA on all the images available for each dataset generates a new dataset of highly decorrelated images of which the first (PCA-1), the most decorrelated of all, is used for further processing. This image shows a high contrast between water and no-water, which also visually appears higher than the synthetic NDWI and MNDWI images, generally adopted for the identification of water bodies. Therefore, unsupervised classification by application of K-means to PCA-1 seems natural and the experiments confirmed this expectation.
To establish the accuracy of the results the DRI is used, which provides the deviation between the reference coastline and the automatically extracted one; in addition, the thematic accuracy indices (PA, UA and OA) extracted from the confusion matrix related to the classification layer (water and no-water) are also used for the scope. We also employ the NDWI and MNDWI for comparison.
The outputs confirmed the validity of the proposed method. Indeed, the results are very encouraging: in all cases the PCA-1-based approach is more effective than NDWI- and MNDWI-based approaches, both in terms of positional accuracy (DRI) and thematic accuracy (confusion matrix). It is interesting to note that while the thematic accuracy of NDWI and MNDWI improves as the resolution of each dataset used increases, this does not happen for PCA, implying a probable dependence not only on the geometric resolution but also on the spectral resolution, or rather on the quantity and amplitude of the used bands.
This behavior can also be noted from the DRI analysis: the differences in the results obtained by PCA and NDWI (or MNDWI) decrease as the resolution increases, although PCA remains the best method in any case. This effect could once again be explained by a reduction in the available bands from S2–20 m (nine bands) to –m (four bands).
In light of what has been analyzed, with regard to the future developments of this work, further studies will focus on the possibility of extending the proposed approach to other types of satellite images, in particular those which have a higher resolution than Sentinel-2, in order to evaluate the effectiveness of the suggested method. Furthermore, the use of PCA including not only the first component but also the second and third components will be considered; specifically, supervised and unsupervised classification methods will be tested for the identification of features other than the coastline.
Author Contributions
C.P. conceived the article and designed the methodology; E.A. and F.G.F. conducted the bibliographic research and organized data collection; C.P. designed the experiments; E.A. carried out experiments on the Sentinel-2 dataset; F.G.F. carried out experiments on the Landsat 9 dataset; C.P. supervised the applications; E.A. and F.G.F. carried out the accuracy tests; all authors took part in result analysis and in writing the paper. All authors have read and agreed to the published version of the manuscript.
Funding
This research received no external funding.
Data Availability Statement
The study’s data are available upon request from the corresponding author for academic research and non-commercial purposes only. Restrictions apply to derivative images and models trained using the data, and proper referencing is required.
Acknowledgments
We acknowledge the constructive feedback of the four reviewers and the efficient editing.
Conflicts of Interest
The authors declare no conflicts of interest.
References
- Eugenio, F.; Martin, J.; Marcello, J.; Fraile-Nuez, E. Environmental monitoring of El Hierro Island submarine volcano, by combining low and high resolution satellite imagery. Int. J. Appl. Earth Obs. Geoinf. 2014, 29, 53–66. [Google Scholar] [CrossRef]
- John, E.; Bunting, P.; Hardy, A.; Silayo, D.S.; Masunga, E. A Forest Monitoring System for Tanzania. Remote Sens. 2021, 13, 3081. [Google Scholar] [CrossRef]
- Aguilar, M.A.; Jiménez-Lao, R.; Ladisa, C.; Aguilar, F.J.; Tarantino, E. Comparison of spectral indices extracted from Sentinel-2 images to map plastic covered greenhouses through an object-based approach. GISci. Remote Sens. 2022, 59, 822–842. [Google Scholar] [CrossRef]
- Mohanty, B.P.; Cosh, M.H.; Lakshmi, V.; Montzka, C. Soil moisture remote sensing: State-of-the-science. Vadose Zone J. 2017, 16, 1–9. [Google Scholar] [CrossRef]
- Paul, F.; Winsvold, S.H.; Kääb, A.; Nagler, T.; Schwaizer, G. Glacier remote sensing using Sentinel-2. Part II: Mapping glacier extents and surface facies, and comparison to Landsat 8. Remote Sens. 2016, 8, 575. [Google Scholar] [CrossRef]
- Gennaro, A.; Candiano, A.; Fargione, G.; Mangiameli, M.; Mussumeci, G. Multispectral remote sensing for post-dictive analysis of archaeological remains. A case study from Bronte (Sicily). Archaeol. Prospect. 2019, 26, 299–311. [Google Scholar] [CrossRef]
- Alicandro, M.; Candigliota, E.; Dominici, D.; Immordino, F.; Masin, F.; Pascucci, N.; Quaresima, R.; Zollini, S. Hyperspectral PRISMA and Sentinel-2 Preliminary Assessment Comparison in Alba Fucens and Sinuessa Archaeological Sites (Italy). Land 2022, 11, 2070. [Google Scholar] [CrossRef]
- Solari, L.; Del Soldato, M.; Raspini, F.; Barra, A.; Bianchini, S.; Confuorto, P.; Casagli, N.; Crosetto, M. Review of satellite interferometry for landslide detection in Italy. Remote Sens. 2020, 12, 1351. [Google Scholar] [CrossRef]
- Fabris, M. Monitoring the coastal changes of the Po River delta (Northern Italy) since 1911 using archival cartography, multi-temporal aerial photogrammetry and LiDAR data: Implications for coastline changes in 2100 AD. Remote Sens. 2021, 13, 529. [Google Scholar] [CrossRef]
- Franci, F.; Bitelli, G.; Mandanici, E.; Hadjimitsis, D.; Agapiou, A. Satellite remote sensing and GIS-based multi-criteria analysis for flood hazard mapping. Nat. Hazards 2016, 83, 31–51. [Google Scholar] [CrossRef]
- Caballero, I.; Román, A.; Tovar-Sánchez, A.; Navarro, G. Water quality monitoring with Sentinel-2 and Landsat-8 satellites during the 2021 volcanic eruption in La Palma (Canary Islands). Sci. Total Environ. 2022, 822, 153433. [Google Scholar] [CrossRef]
- Figliomeni, F.G.; Parente, C. Bathymetry from satellite images: A proposal for adapting the band ratio approach to IKONOS data. Appl. Geomat. 2023, 15, 565–581. [Google Scholar] [CrossRef]
- Kim, H.C.; Son, S.; Kim, Y.H.; Khim, J.S.; Nam, J.; Chang, W.K.; Lee, J.-H.; Lee, C.-H.; Ryu, J. Remote sensing and water quality indicators in the Korean West coast: Spatio-temporal structures of MODIS-derived chlorophyll-a and total suspended solids. Mar. Pollut. Bull. 2017, 121, 425–434. [Google Scholar] [CrossRef] [PubMed]
- Specht, M.; Specht, C.; Lewicka, O.; Makar, A.; Burdziakowski, P.; Dąbrowski, P. Study on the Coastline Evolution in Sopot (2008–2018) Based on Landsat Satellite Imagery. J. Mar. Sci. Eng. 2020, 8, 464. [Google Scholar] [CrossRef]
- Papakonstantinou, A.; Topouzelis, K.; Pavlogeorgatos, G. Coastline zones identification and 3D coastal mapping using UAV spatial data. ISPRS Int. J. Geo-Inf. 2016, 5, 75. [Google Scholar] [CrossRef]
- Costantino, D.; Pepe, M.; Dardanelli, G.; Baiocchi, V. Using optical Satellite and aerial imagery for automatic coastline mapping. Geogr. Tech. 2020, 15, 171–190. [Google Scholar] [CrossRef]
- Huang, C.; Chen, Y.; Zhang, S.; Wu, J. Detecting, extracting, and monitoring surface water from space using optical sensors: A review. Rev. Geophys. 2018, 56, 333–360. [Google Scholar] [CrossRef]
- McFeeters, S.K. The use of the Normalized Difference Water Index (NDWI) in the delineation of open water features. Int. J. Remote Sens. 1996, 17, 1425–1432. [Google Scholar] [CrossRef]
- Xu, H. Modification of normalised difference water index (NDWI) to enhance open water features in remotely sensed imagery. Int. J. Remote Sens. 2006, 27, 3025–3033. [Google Scholar] [CrossRef]
- Feyisa, G.L.; Meilby, H.; Fensholt, R.; Proud, S.R. Automated Water Extraction Index: A new technique for surface water mapping using Landsat imagery. Remote Sens. Environ. 2014, 140, 23–35. [Google Scholar] [CrossRef]
- Fisher, A.; Flood, N.; Danaher, T. Comparing Landsat water index methods for automated water classification in eastern Australia. Remote Sens. Environ. 2016, 175, 167–182. [Google Scholar] [CrossRef]
- Maglione, P.; Parente, C.; Santamaria, R.; Vallario, A. 3D thematic models of land cover from DTM and high-resolution remote sensing images WorldView-2. Rend. Online Soc. Geol. Ital. 2014, 30, 33–40. [Google Scholar] [CrossRef]
- Richards, J.A. Supervised Classification Techniques. In Remote Sensing Digital Image Analysis; Springer: Berlin/Heidelberg, Germany, 2013. [Google Scholar] [CrossRef]
- Schowengerdt, R.A. Techniques for Image Processing and Classifications in Remote Sensing; Academic Press: Cambridge, MA, USA, 2012. [Google Scholar]
- Alcaras, E.; Amoroso, P.P.; Parente, C.; Prezioso, G. Remotely Sensed Image Fast Classification and Smart Thematic Map Production. ISPRS Ann. Photogramm. Remote Sens. Spat. Inf. Sci. 2021, 46, 43–50. [Google Scholar] [CrossRef]
- Al-Doski, J.; Mansorl, S.B.; Shafri, H.Z.M. Image classification in remote sensing. J. Environ. Earth Sci. 2013, 3, 140–147. [Google Scholar]
- Hadjitodorov, S.T.; Kuncheva, L.I.; Todorova, L.P. Moderate diversity for better cluster ensembles. Inf. Fusion 2006, 7, 264–275. [Google Scholar] [CrossRef]
- Latini, D.; Del Frate, F.; Palazzo, F.; Minchella, A. Coastline extraction from SAR COSMO-SkyMed data using a new neural network algorithm. In Proceedings of the 2012 IEEE International Geoscience and Remote Sensing Symposium, Munich, Germany, 22–27 July 2012; IEEE: Piscataway, NJ, USA, 2012; pp. 5975–5977. [Google Scholar] [CrossRef]
- Ebaid, H.M.; Fawzy, H.E.D.; El Shouny, A.F. Automatic Coastline Extraction Using Satellite Images. IOSR J. Mech. Civ. Eng. 2015, 12, 81–86. [Google Scholar] [CrossRef]
- Saeed, A.M.; Fatima, A.M. Coastline extraction using satellite imagery and image processing techniques. Red 2016, 600, 720. [Google Scholar]
- Mirsane, H.; Maghsoudi, Y.; Emadi, R.; Mostafavi, M. Automatic Coastline Extraction Using Radar and Optical Satellite Imagery and Wavelet-IHS Fusion Method. Int. J. Coast. Offshore Eng. 2018, 2, 11–20. [Google Scholar] [CrossRef][Green Version]
- Dai, C.; Howat, I.M.; Larour, E.; Husby, E. Coastline extraction from repeat high resolution satellite imagery. Remote Sens. Environ. 2019, 229, 260–270. [Google Scholar] [CrossRef]
- Yang, T.; Jiang, S.; Hong, Z.; Zhang, Y.; Han, Y.; Zhou, R.; Wang, J.; Yang, S.; Tong, X.; Kuc, T.Y. Sea-land segmentation using deep learning techniques for landsat-8 OLI imagery. Mar. Geod. 2020, 43, 105–133. [Google Scholar] [CrossRef]
- Domazetović, F.; Šiljeg, A.; Marić, I.; Faričić, J.; Vassilakis, E.; Panđa, L. Automated Coastline Extraction Using the Very High Resolution WorldView (WV) Satellite Imagery and Developed Coastline Extraction Tool (CET). Appl. Sci. 2021, 11, 9482. [Google Scholar] [CrossRef]
- Aghdami-Nia, M.; Shah-Hosseini, R.; Rostami, A.; Homayouni, S. Automatic coastline extraction through enhanced sea-land segmentation by modifying Standard U-Net. Int. J. Appl. Earth Obs. Geoinf. 2022, 109, 102785. [Google Scholar] [CrossRef]
- Uddin, M.P.; Mamun, M.A.; Hossain, M.A. PCA-based feature reduction for hyperspectral remote sensing image classification. IETE Tech. Rev. 2021, 38, 377–396. [Google Scholar] [CrossRef]
- Shah, V.P.; Younan, N.H.; King, R.L. An efficient pan-sharpening method via a combined adaptive PCA approach and contourlets. IEEE Trans. Geosci. Remote Sens. 2008, 46, 1323–1335. [Google Scholar] [CrossRef]
- Tochamnanvita, T.; Muttitanon, W. Investigation of coastline changes in three provinces of Thailand using remote sensing. Int. Arch. Photogramm. Remote Sens. Spat. Inf. Sci. 2014, 40, 1079. [Google Scholar] [CrossRef]
- Rokni, K.; Ahmad, A.; Solaimani, K.; Hazini, S. A new approach for surface water change detection: Integration of pixel level image fusion and image classification techniques. Int. J. Appl. Earth Obs. Geoinf. 2015, 34, 226–234. [Google Scholar] [CrossRef]
- Paz-Delgado, M.V.; Payo, A.; Gómez-Pazo, A.; Beck, A.L.; Savastano, S. Shoreline Change from Optical and Sar Satellite Imagery at Macro-Tidal Estuarine, Cliffed Open-Coast and Gravel Pocket-Beach Environments. J. Mar. Sci. Eng. 2022, 10, 561. [Google Scholar] [CrossRef]
- Liu, Y.; Wang, X.; Ling, F.; Xu, S.; Wang, C. Analysis of coastline extraction from Landsat-8 OLI imagery. Water 2017, 9, 816. [Google Scholar] [CrossRef]
- Arslan, O.; Akyürek, Ö.; Kaya, Ş.; Şeker, D.Z. Dimension reduction methods applied to coastline extraction on hyperspectral imagery. Geocarto Int. 2020, 35, 376–390. [Google Scholar] [CrossRef]
- Ascione, A.; Aucelli, P.P.; Cinque, A.; Di Paola, G.; Mattei, G.; Ruello, M.; Russo Ermolli, E.; Santangelo, N.; Valente, E. Geomorphology of Naples and the Campi Flegrei: Human and natural landscapes in a restless land. J. Maps 2021, 17, 18–28. [Google Scholar] [CrossRef]
- Budillon, F.; Amodio, S.; Contestabile, P.; Alberico, I.; Innangi, S.; Molisso, F. The present-day nearshore submarine depositional terraces off the Campania coast (South-eastern Tyrrhenian Sea): An analysis of their morpho-bathymetric variability. In Proceedings of the IMEKO TC-19—Proceedings of the International Workshop on Metrology for the Sea, Naples, Italy, 5–7 October 2020; pp. 132–138. [Google Scholar]
- Pusceddu, N.; Batzella, T.; Kalb, C.; Ferraro, F.; Ibba, A.; De Muro, S. Short-term evolution of the Budoni beach on NE Sardinia (Italy). Rend. Online Della Soc. Geol. Ital. 2011, 17, 155–159. [Google Scholar] [CrossRef]
- Melis, R.T.; Di Rita, F.; French, C.; Marriner, N.; Montis, F.; Serreli, G.; Sulas, F.; Vacchi, M. 8000 years of coastal changes on a western Mediterranean island: A multiproxy approach from the Posada plain of Sardinia. Mar. Geol. 2018, 403, 93–108. [Google Scholar] [CrossRef]
- Simeone, S.; De Falco, G. Posidonia oceanica banquette removal: Sedimentological, geomorphological and ecological implications. J. Coast. Res. 2013, 65, 1045–1050. [Google Scholar] [CrossRef]
- Manno, G.; Re, C.L.; Ciraolo, G.; Maltese, A. Coupling a hydro-maritime model and remotely sensed techniques to assess the shoreline positioning uncertainty: The Marsala coast study case. In Proceedings of the Remote Sensing for Agriculture, Ecosystems, and Hydrology XII, Toulouse, France, 20–23 September 2010; SPIE: Bellingham, WA, USA, 2010; Volume 7824, pp. 396–403. [Google Scholar] [CrossRef][Green Version]
- Martorana, R.; Lombardo, L.; Messina, N.; Luzio, D. Integrated geophysical survey for 3D modelling of a coastal aquifer polluted by seawater. Near Surf. Geophys. 2014, 12, 45–59. [Google Scholar] [CrossRef]
- NASA—USGS. Landsat 9. 2022. Available online: https://landsat.gsfc.nasa.gov/satellites/landsat-9/ (accessed on 8 January 2024).
- Markham, B.L.; Jenstrom, D.; Masek, J.G.; Dabney, P.; Pedelty, J.A.; Barsi, J.A.; Montanaro, M. Landsat 9: Status and plans. In Proceedings of the Earth Observing Systems XXI, San Diego, CA, USA, 30 August–1 September 2016; SPIE: Bellingham, WA, USA, 2016; Volume 9972, pp. 127–132. [Google Scholar] [CrossRef]
- Copernicus Open Access Hub. 2023. Available online: https://scihub.copernicus.eu/ (accessed on 13 January 2023).
- Sentinel-2 User Handbook, ESA. 2015. Available online: https://sentinels.copernicus.eu/documents/247904/685211/Sentinel-2_User_Handbook (accessed on 13 January 2023).
- Hasan, B.M.S.; Abdulazeez, A.M. A review of principal component analysis algorithm for dimensionality reduction. J. Soft Comput. Data Min. 2021, 2, 20–30. [Google Scholar] [CrossRef]
- Roessner, U.; Nahid, A.; Chapman, B.; Hunter, A.; Bellgard, M. Metabolomics—The Combination of Analytical Biochemistry, Biology, and Informatics; Academic Press: Cambridge, MA, USA, 2011. [Google Scholar] [CrossRef]
- Jolliffe, I.T. Principal Component Analysis for Special Types of Data; Springer: New York, NY, USA, 2002; pp. 338–372. [Google Scholar] [CrossRef]
- Shaukat, S.S.; Rao, T.A.; Khan, M.A. Impact of sample size on principal component analysis ordination of an environmental data set: Effects on eigenstructure. Ekológia 2016, 35, 173. [Google Scholar] [CrossRef]
- Beattie, J.R.; Esmonde-White, F.W. Exploration of principal component analysis: Deriving principal component analysis visually using spectra. Appl. Spectrosc. 2021, 75, 361–375. [Google Scholar] [CrossRef] [PubMed]
- Estornell, J.; Martí-Gavilá, J.M.; Sebastiá, M.T.; Mengual, J. Principal component analysis applied to remote sensing. Model. Sci. Educ. Learn. 2013, 6, 83–89. [Google Scholar] [CrossRef]
- Ready, P.; Wintz, P. Information extraction, SNR improvement, and data compression in multispectral imagery. IEEE Trans. Commun. 1973, 21, 1123–1131. [Google Scholar] [CrossRef]
- Omran, M.G.; Engelbrecht, A.P.; Salman, A. An overview of clustering methods. Intell. Data Anal. 2007, 11, 583–605. [Google Scholar] [CrossRef]
- Hidayat, N.; Wardoyo, R.; Azhari, S.N.; Surjono, H.D. Enhanced performance of the automatic learning style detection model using a combination of modified K-means algorithm and naive bayesian. Int. J. Adv. Comput. Sci. Appl. 2020, 11, 638–648. [Google Scholar] [CrossRef]
- Alcaras, E.; Amoroso, P.P.; Figliomeni, F.G.; Parente, C.; Vallario, A. Machine Learning Approaches for Coastline Extraction from Sentinel-2 Images: K-means and K-Nearest Neighbour Algorithms in Comparison. In Proceedings of the Italian Conference on Geomatics and Geospatial Technologies, Genova, Italy, 20–24 June 2022; Springer International Publishing: Cham, Switzerland, 2022; pp. 368–379. [Google Scholar] [CrossRef]
- Modava, M.; Akbarizadeh, G.; Soroosh, M. Hierarchical coastline detection in SAR images based on spectral-textural features and global–local information. IET Radar Sonar Navig. 2019, 13, 2183–2195. [Google Scholar] [CrossRef]
- Zhang, Y.; Qiao, Q.; Liu, J.; Sang, H.; Yang, D.; Zhai, L.; Ning, L.; Yuan, X. Coastline changes in mainland China from 2000 to 2015. Int. J. Image Data Fusion 2022, 13, 95–112. [Google Scholar] [CrossRef]
- Aguilar, F.J.; Fernández, I.; Pérez, J.L.; López, A.; Aguilar, M.A.; Mozas, A.; Cardenal, J. Preliminary results on high accuracy estimation of shoreline change rate based on coastal elevation models. Int. Arch. Photogramm. Remote Sens. Spat. Inf. Sci. 2010, 33, 986–991. [Google Scholar]
- Alcaras, E.; Falchi, U.; Parente, C.; Vallario, A. Accuracy evaluation for coastline extraction from Pléiades imagery based on NDWI and IHS pan-sharpening application. Appl. Geomat. 2023, 15, 595–605. [Google Scholar] [CrossRef]
- Stehman, S.V.; Wickham, J.D. Pixels, blocks of pixels, and polygons: Choosing a spatial unit for thematic accuracy assessment. Remote Sens. Environ. 2011, 115, 3044–3055. [Google Scholar] [CrossRef]
- Nasr, M.; Zenati, H.; Dhieb, M. Using RS and GIS to mapping land cover of the Cap Bon (Tunisia). In Environmental Remote Sensing and GIS in Tunisia; Springer: Cham, Switzerland, 2021; pp. 117–142. [Google Scholar] [CrossRef]
- Story, M.; Congalton, R.G. Accuracy assessment: A user’s perspective. Photogramm. Eng. Remote Sens. 1986, 52, 397–399. [Google Scholar]
- Dibs, H.; Hasab, H.A.; Al-Rifaie, J.K.; Al-Ansari, N. An optimal approach for land-use/land-cover mapping by integration and fusion of multispectral landsat OLI images: Case study in Baghdad, Iraq. Water Air Soil Pollut. 2020, 231, 488. [Google Scholar] [CrossRef]
- Liu, C.; Frazier, P.; Kumar, L. Comparative assessment of the measures of thematic classification accuracy. Remote Sens. Environ. 2007, 107, 606–616. [Google Scholar] [CrossRef]
- Fung, T.; LeDrew, E. For change detection using various accuracy. Photogramm. Eng. Remote Sens. 1988, 54, 1449–1454. [Google Scholar]
- Comber, A.J. Geographically weighted methods for estimating local surfaces of overall, user and producer accuracies. Remote Sens. Lett. 2013, 4, 373–380. [Google Scholar] [CrossRef]
- Qu, W.; Lu, J.; Li, L.; Li, X. Research on automatic extraction of water bodies and wetlands on HJ satellite CCD images. Remote Sens. Inf. 2011, 4, 28–33. [Google Scholar]
- Alcaras, E.; Amoroso, P.P.; Figliomeni, F.G.; Parente, C.; Prezioso, G. Accuracy Evaluation of Coastline Extraction Methods in Remote Sensing: A Smart Procedure for Sentinel-2 Images. Int. Arch. Photogramm. Remote Sens. Spat. Inf. Sci. 2022, 48, 13–19. [Google Scholar] [CrossRef]
- Li, H.; Wang, X.; Dai, S.; Tian, G. Flood monitoring in Hainan Island based on HJ-CCD data. Trans. Chin. Soc. Agric. Eng. 2015, 31, 191–198. [Google Scholar]
- Alcaras, E.; Amoroso, P.P.; Baiocchi, V.; Falchi, U.; Parente, C. Unsupervised classification based approach for coastline extraction from Sentinel-2 imagery. In Proceedings of the 2021 International Workshop on Metrology for the Sea; Learning to Measure Sea Health Parameters (MetroSea), Reggio Calabria, Italy, 4–6 October 2021; IEEE: Piscataway, NJ, USA, 2021; pp. 423–427. [Google Scholar] [CrossRef]
- Yang, H.; Wang, Z.; Zhao, H.; Guo, Y. Water body extraction methods study based on RS and GIS. Procedia Environ. Sci. 2011, 10, 2619–2624. [Google Scholar] [CrossRef]
- Mondejar, J.P.; Tongco, A.F. Near infrared band of Landsat 8 as water index: A case study around Cordova and Lapu-Lapu City, Cebu, Philippines. Sustain. Environ. Res. 2019, 29, 16. [Google Scholar] [CrossRef]
Disclaimer/Publisher’s Note: The statements, opinions and data contained in all publications are solely those of the individual author(s) and contributor(s) and not of MDPI and/or the editor(s). MDPI and/or the editor(s) disclaim responsibility for any injury to people or property resulting from any ideas, methods, instructions or products referred to in the content. |
© 2024 by the authors. Licensee MDPI, Basel, Switzerland. This article is an open access article distributed under the terms and conditions of the Creative Commons Attribution (CC BY) license (https://creativecommons.org/licenses/by/4.0/).