
Monitoring Volcanic Plumes and Clouds Using Remote Sensing: A Systematic Review


Abstract
1. Introduction
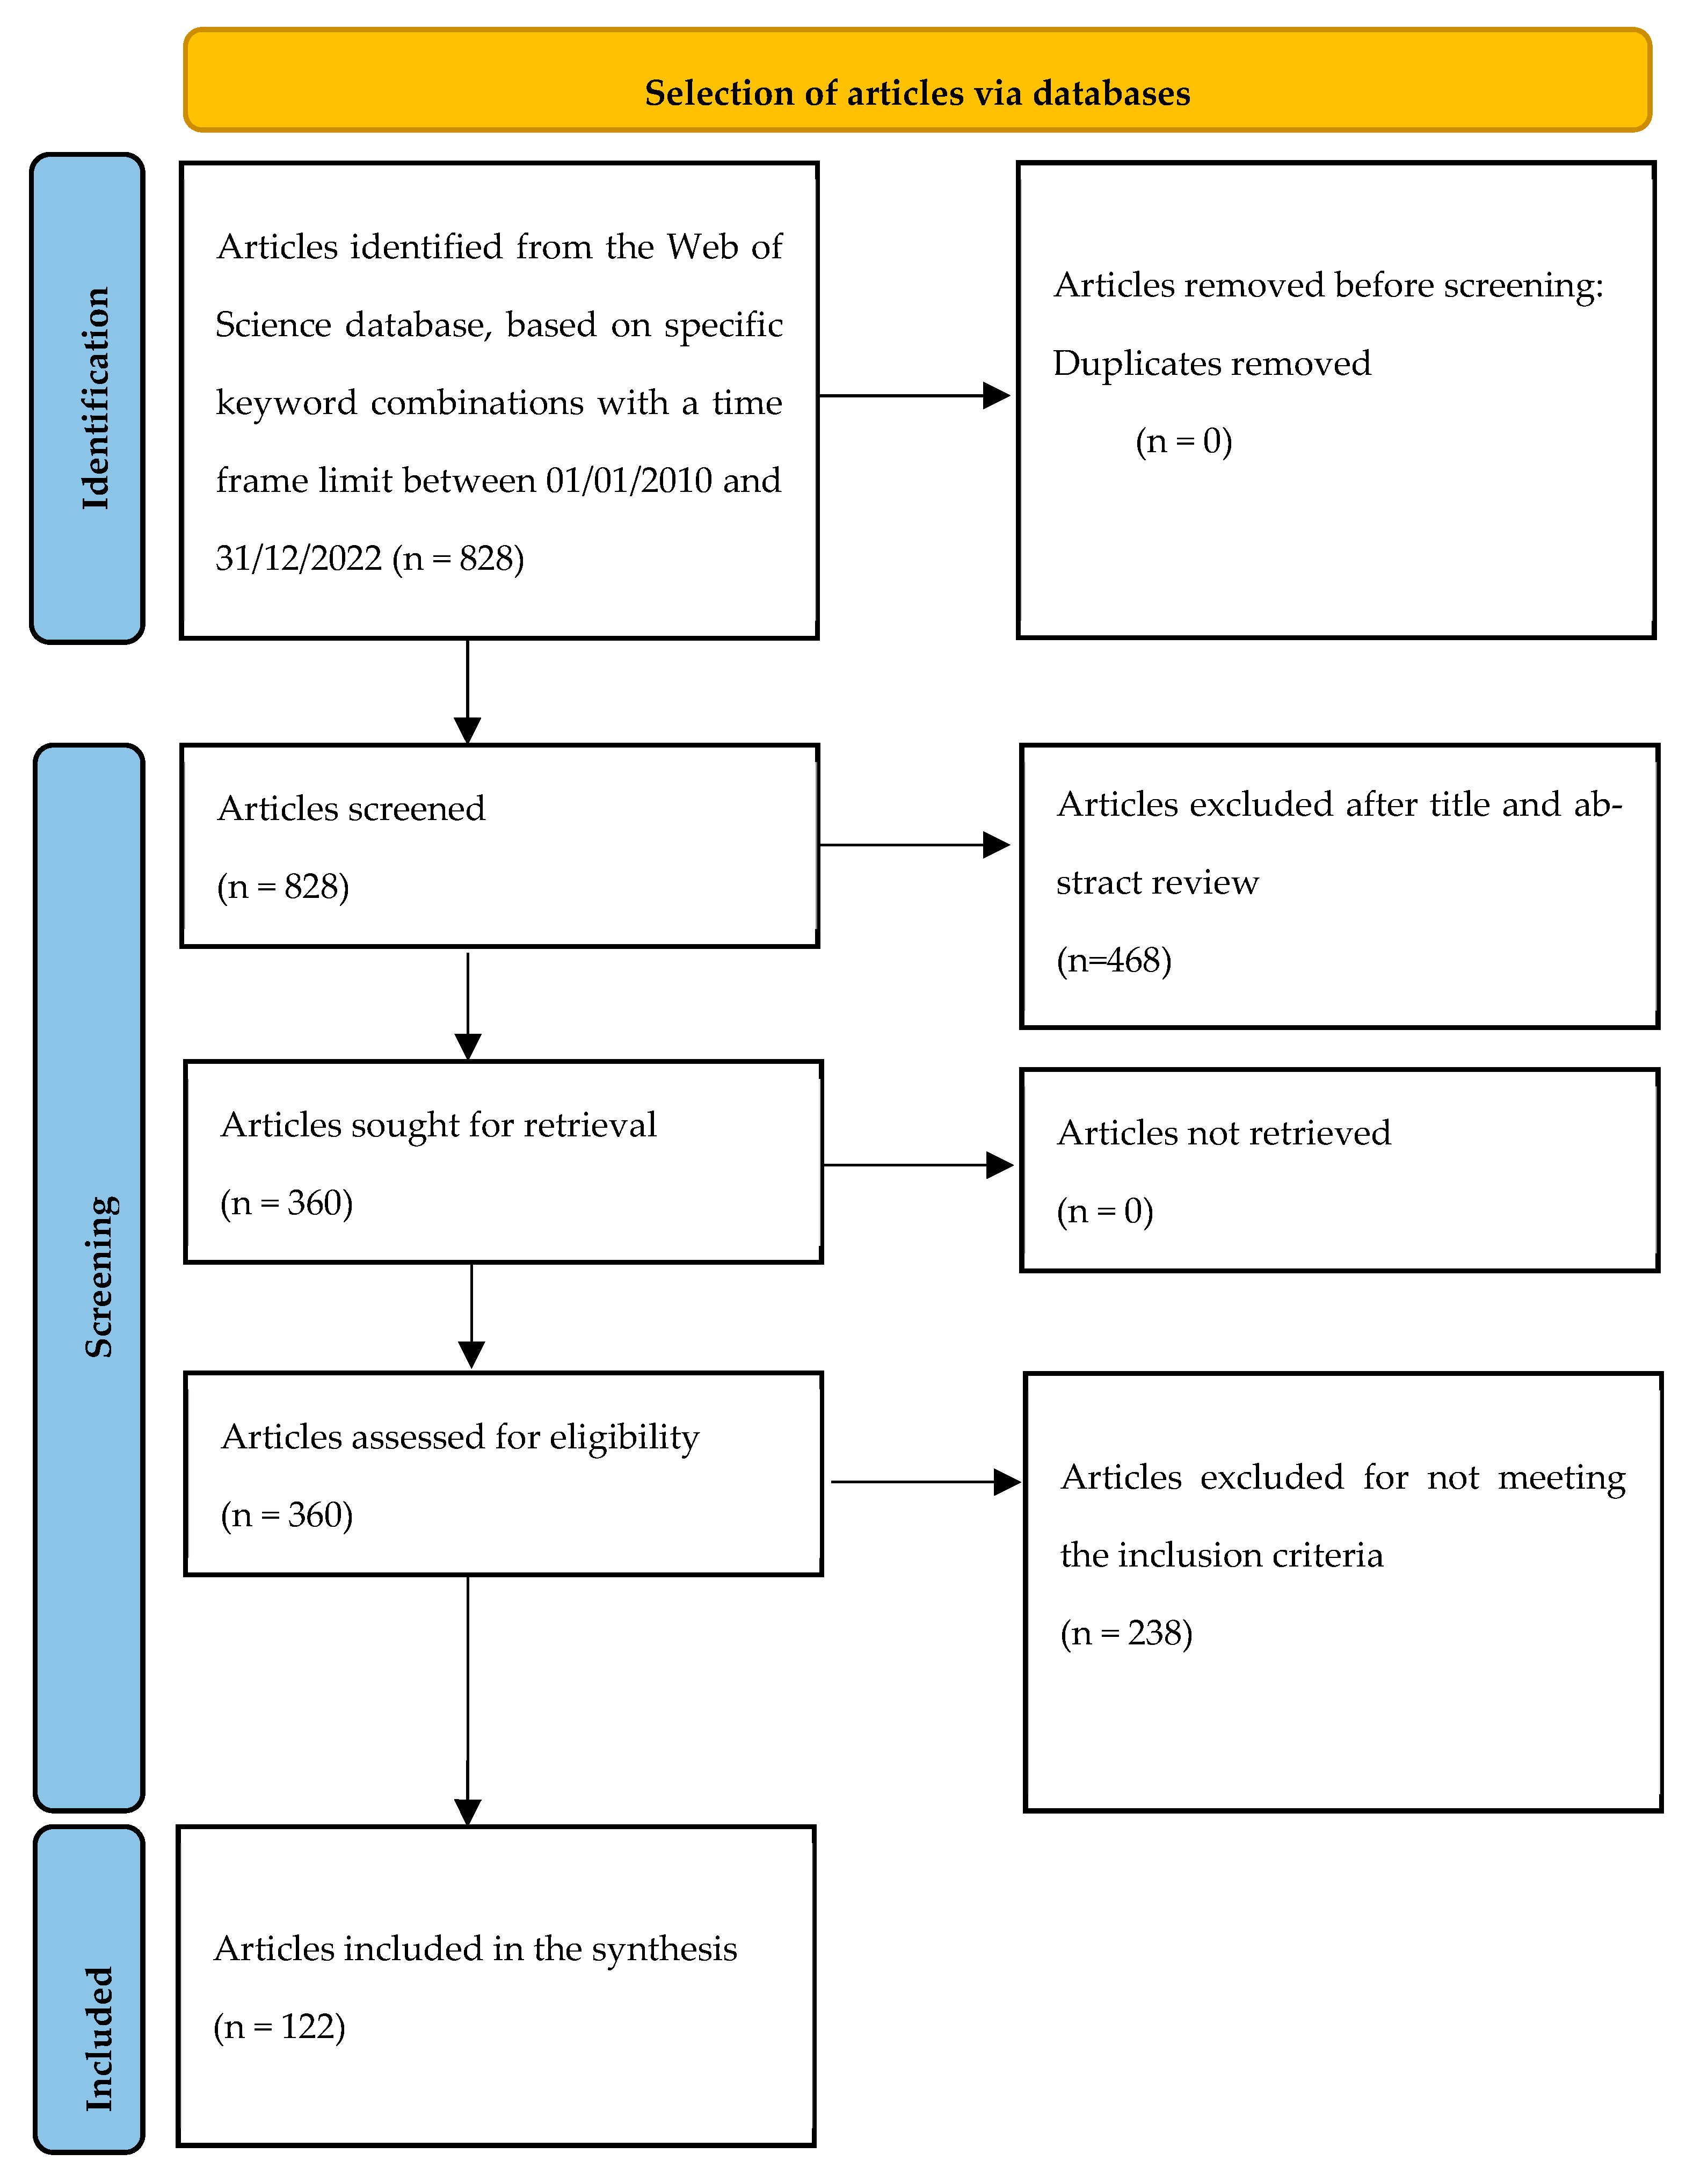
2. Methodology
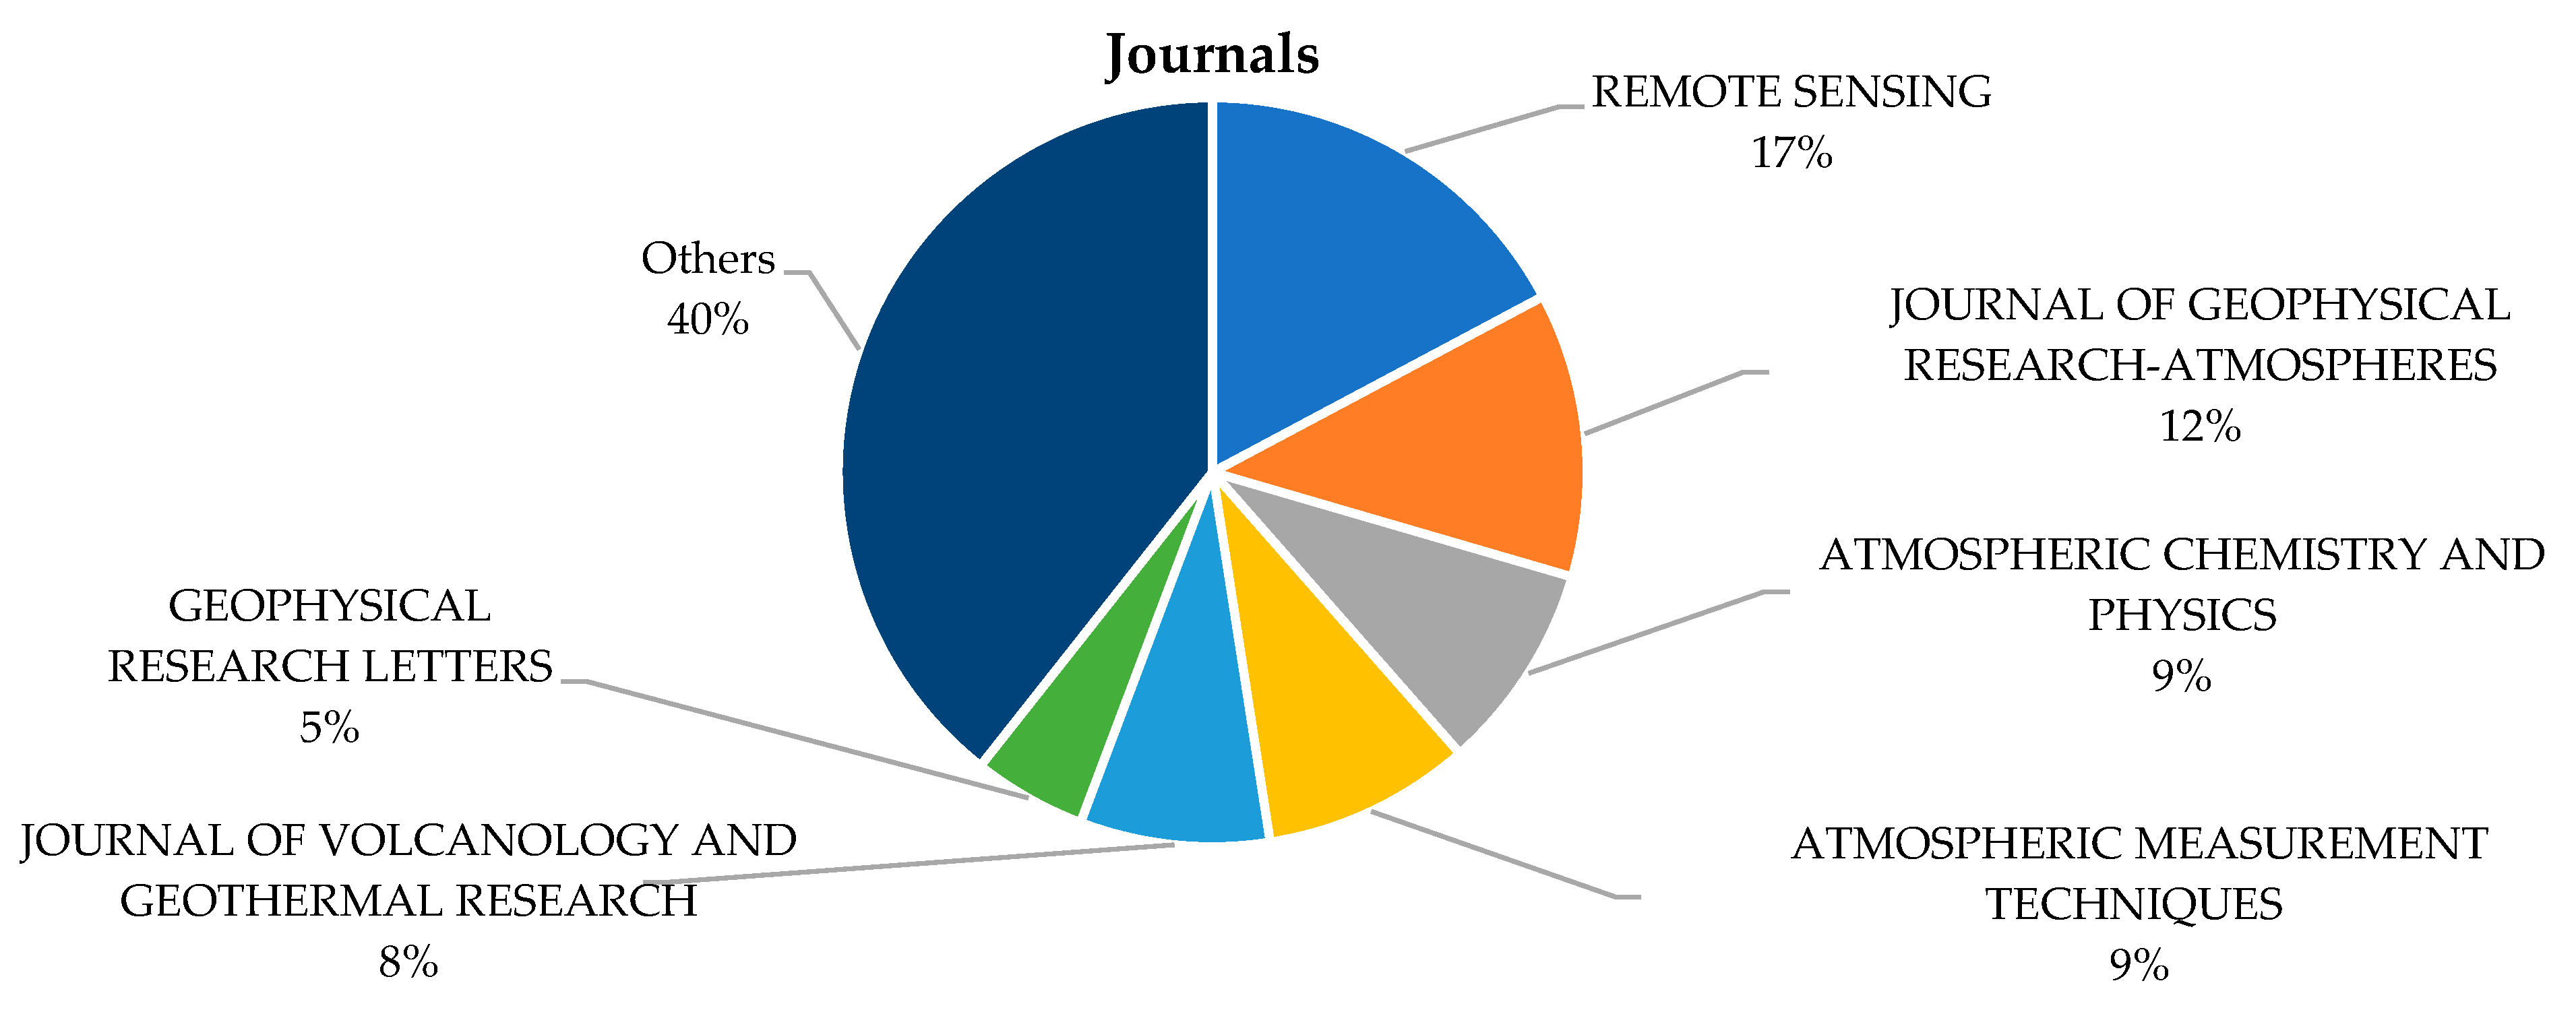
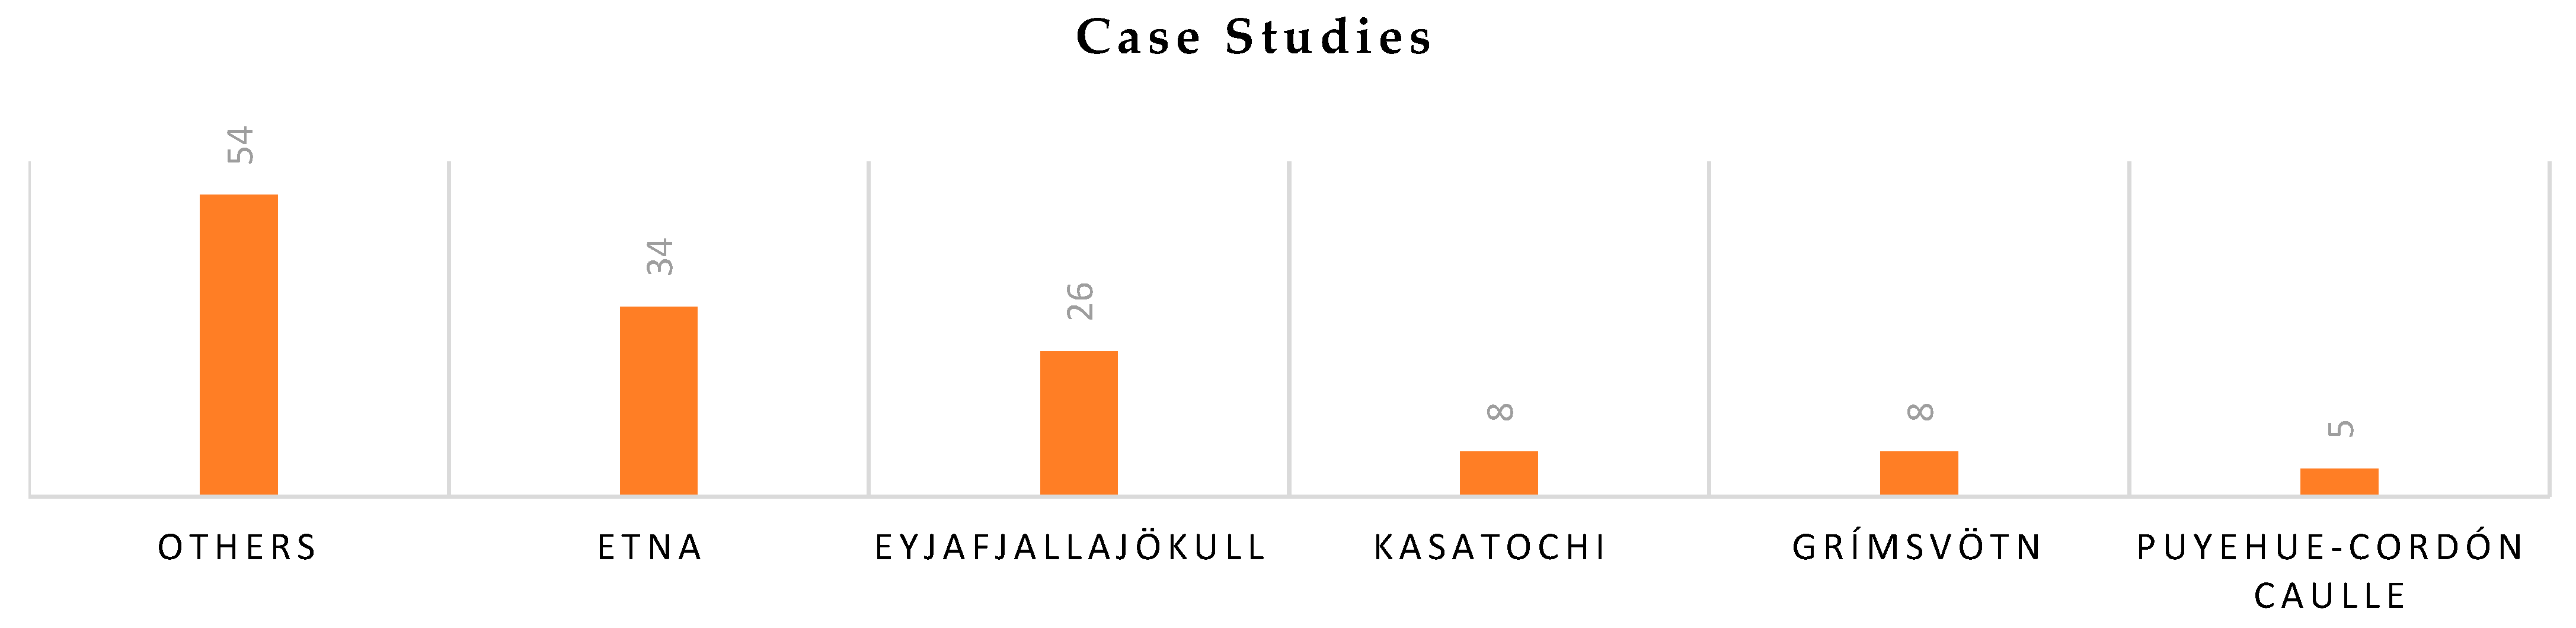
3. Results
4. Discussion
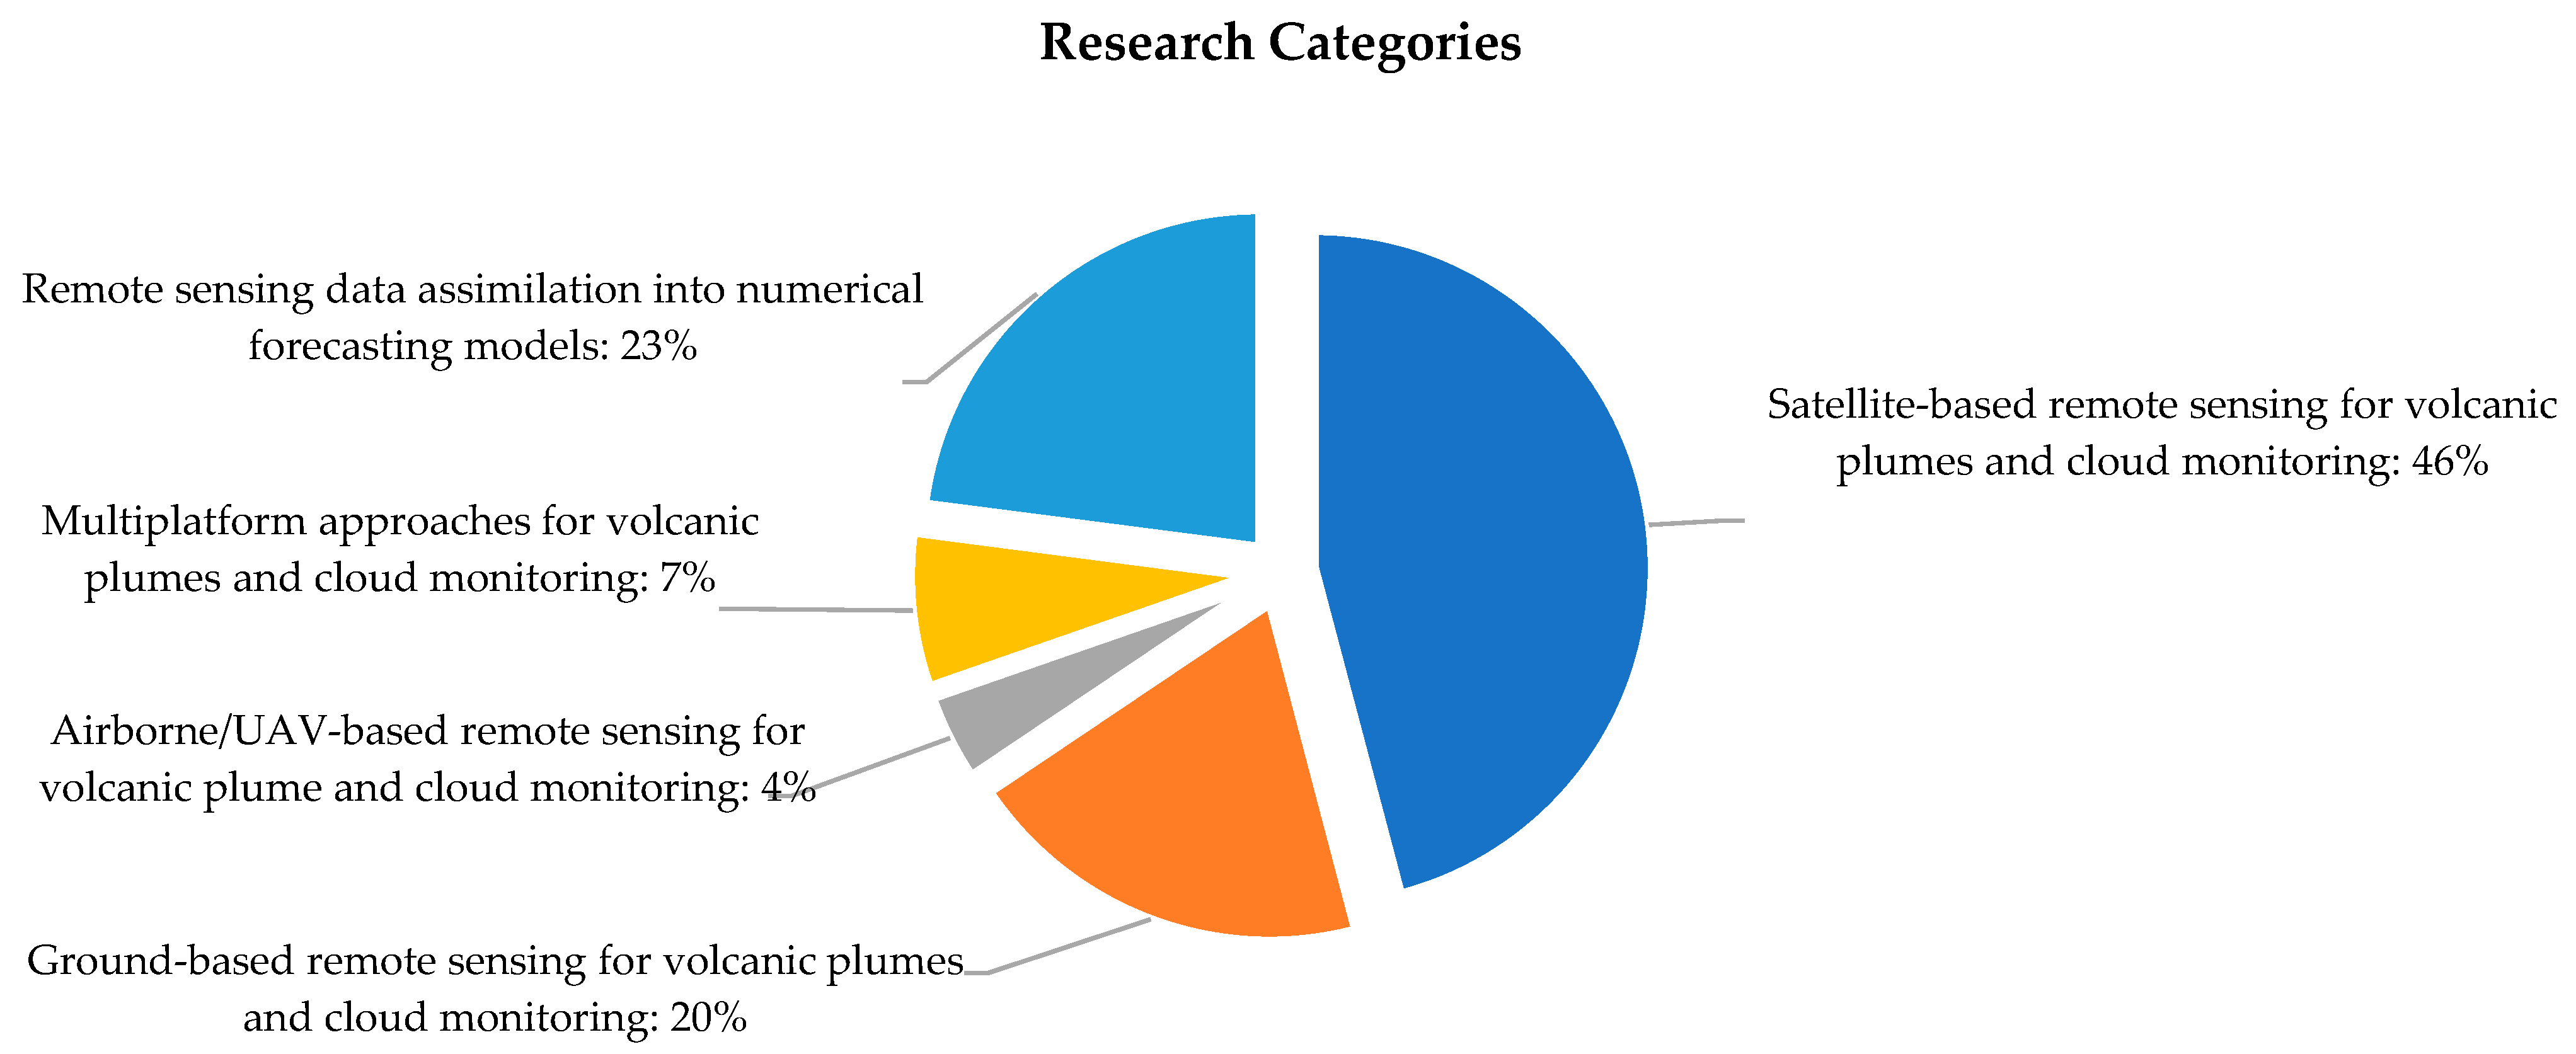
4.1. A-Satellite-Based Remote Sensing for Volcanic Plumes and Cloud Monitoring (n = 56)

| Reference | Case Study | Data Source | Retrieval Method | Main Outcomes |
|---|---|---|---|---|
| [11] | Kasatochi 2008 | MODIS, AVHRR, and AIRS | BTD, LUT, and least square fit method | Plume height ≈ 17 km. Total mass ash ≈ 0.46 ± 0.18 Tg. Total mass SO2 ≈ 2.65 ± 0.82 Tg. SO2 mass < 30–40% of the uncorrected values. |
| [31] | Etna 2002 | MODIS and SEVIRI | RSTash | Space–time detection of the evolution of ash clouds. |
| [12] | Kasatochi 2008 | IASI | BTD, RTM, and OE method | Plume height ≈ 12.5 ± 4 km. Total SO2 ejected mass ≈ 1.7 Tg. |
| [36] | Etna 2002, 2006/7 | AVHRR | BTD-Water Vapour C correction and RSTash | The capability of RSTash to account for water vapor content in the atmosphere without requiring any ancillary information. |
| [37] | Etna 2006/7 | MODIS, AVHRR, and SEVIRI | RSTash BT | The success and failure rates of RSTas identifying ash are 90.1% and 9.9%. |
| [38] | Eyjafjallajökull 2010 | SEVIRI, AIRS, GOME2, IASI, and OMI | OE method and RTM | Plume height ≈ 6 km. Total mass ash ≈ 1.05 Tg. Total mass SO2 ≈ 0.013–0.073 Tg. Plume altitude error = 20% or 15%. Ash mass loadings = 50%. SO2 loadings error = 400 DU. |
| [39] | Eyjafjallajökull 2010 | MODIS, MERSI, and VIRR | SWTD (BTD) and STVA | STVA is more sensitive to volcanic ash clouds than SWTD and provides comparable results to ARI and AAI. FY-3A-derived STVA is effective under complex meteorological conditions. |
| [40] | Etna 2000/01/02/03/06 & 08 | MISR | MINX V1.0 Software | Plume height ≈ 9.2 km. AOD = 0.03 ad 0.58. MINX tool uncertainties < 0.5 km. |
| [41] | Eyjafjallajökull 2010 | MISR | Research Aerosol Retrieval Algorithm and MISR V22 Standard algorithm | Plume height ≈ 9.5 km. Non-spherical grains = 60% of the AOD. Uncertainties using χ2 = 5% of the observed reflectance. |
| [42] | Eyjafjallajökull 2010 | SEVIRI and MODIS | BTD | R2 = 0.73 for AOT retrievals. |
| [21] | Eyjafjallajökull 2010 | SEVIRI | BTD and RTM | Plume height ≈ 6 km. Ash concentration= 5 mg/m−3. 4.8 Mt of ash and 0.2 Mt of SO2 were released. |
| [43] | Grímsvötn 2011 & Eyjafjallajökull 2010 | GOME-2, OMI, and SCIAMACHY | Linear Fit (LF) algorithm and DOAS | About 50–80% of the observations were correctly forecast (hits). |
| [44] | Eyjafjallajökull 2010 | MODIS and SEVIRI | CO2 Absorption method and BTD | Plume height ≈ 12 km (Starting). Plume height 3–4 km (Ending). Error = 0.6 km. With sub-pixel image matching, the estimates of shifts could be enhanced to about 10–20% of the pixel size. |
| [45] | Redoubt 2009 | MODIS, MISR, and AVHRR | BTD and MINX V1.0 Software | Plume height from 10.2 km (03/23/2009) to ≈ 20 km (event 8). Positive correlation between plume temperature height retrieval and optical depth. MISR can determine the heights of plumes when the satellite temperature method will produce very poor results. |
| [26] | Eyjafjallajökull 2010 | MODIS | Diffusion source detection algorithm combining SWTD with SO2 | The approach proposed by integrating the split window algorithm with the SO2 concentration distribution achieves an excellent detection effect of the volcanic ash cloud diffusion source and has a high consistency with volcanic ARI and AAI. |
| [46] | Shinmoedake 2011 | MTSAT-1R and MTSAT-2 Imager | RSTash and BT | Plume height ≈ 7.5 km. Mass eruptive rate ≈ 9.4 × 10⁵ kg/s (phase I) to 5.4 × 10⁵ kg/s (phase III)). Validation analysis success rates = 90.1%. |
| [30] | Eyjafjallajökull 2010 | MODIS | PCA | Band 36 has the largest contribution to the volcanic ash cloud with 72%, followed by bands 31 (67%) and 30 (65%). Bands 36, 31, and 30 are used to eventually detect volcanic ash after the sensitivity analysis. |
| [47] | Eyjafjallajökull 2010 | SEVIRI | NN, LUT, and VPR | Plume height ≈ 8 km. SO2 total mass maximum differences for all procedures = +/− 15% and +/− 10. |
| [48] | Grímsvötn 2011 | SEVIRI and IASI | (1D-Var) retrieval algorithm for ash and BTD method | SO2 remained for 2 weeks. Ash was composition was 50–52% SiO2. |
| [49] | Eyjafjallajökull 2010 & Grímsvötn 2011 | GOME-2 and IASI | ULB and Oxford Algorithms | R2 for SO2 mean loading Oxford and UBL = 0.85/SO2 loading estimated by IASI and GOME-2 = 0.64. |
| [50] | Eyjafjallajökull 2010 | SEVIRI | BTD and RTM | Uncertainty due to particle shape increases the error in the total mass of the ash cloud from about 40% to about 50%. |
| [51] | Eyjafjallajökull 2010 | MODIS | PCA | PCA method has good effect in the detection of volcanic ash clouds, whose spectral matching rate of volcanic ash reaches 74.65 and 76.35% and has high consistency with AAI distribution. |
| [52] | Etna 2011 | SEVIRI | VPR and LUT | Ash total mass = 1200 to 3000 tons/h. SO2 total mass = 1600 to 3500 tons/h. The results show good agreement between methods. |
| [53] | Kelud 2014 | AVHRR and IASI | BTD and RTM | Ash plume top ≈ 18 km. Underlying ice clouds reduce the ash needed to reproduce the measured IASI spectra by about a factor of 12. |
| [54] | Etna 2013 | MVIRI and SEVIRI | Ash cloud top height (ACTH) based on the apparent shift to Parallax | Plume top height of ≈ 8.5 km. ACTH accuracy is 700 m. |
| [55] | Eyjafjallajökull 2010 | MODIS | VPR and LUT | Total ash and SO2 masses differ by about 3 and 10%. Result accuracy reduces to about 50% when the SO2 is mixed with ice crystals. |
| [56] | Puyehue Cordón Caulle 2013 | MODIS | BTD | The MODIS-based altitude of the cloud ≈ 3.9 km (a.s.l.). Reverse absorption (BTD-based) ≈ 4.2 km (a.s.l.). MODIS cloud mask detected about 50% of the 16 March 2015 cloud. |
| [32] | Gunung Agung 2017 | AHI | RSTash | RSTASH performance coupled to high temporal resolution of Himawari-8 data may lead to an effective identification and tracking of ash clouds over East Asia and the Western Pacific region despite some limitations. |
| [57] | Eyjafjallajökull 2010 & Puyehue Cordón Caulle 2011 | SEVIRI, AGRI, and CALIOP | FY-4 algorithm using RTM, LSRM, and SWTD (ash detection) | Y-4 algorithm showed reasonable agreement with independent data for plume height. Bias = 0.037 km. Standard deviation = 2.80 km. R2 = 0.61. |
| [58] | Nabro 2011 & Puyehue Cordón Caulle 2011 | OMI, CALIOP, MODIS, AIRS, and GNSS | RO technique | Plume height agreement with RO and CALIOP: R2 = 0.94. Root mean square (r.m.s.) error = 930 m. |
| [59] | Eyjafjallajökull 2010 & Kasatochi 2008 | GOME-2 | Full Physics Inverse Learning Machine (FP_ILM) | Kasatochi SO2 plume at an altitude in the range 9–10 reaching 14 km (a.s.l.). Eyjafjallajökull plume heights are in the range 6–9 km (a.s.l.). Plume height retrieved with errors of 1 km for high SO2 total columns (>50 DU) and a plume height between 6 and 18 km. |
| [60] | Bogoslof 2017, Tinakula 2017 & Sierra Negra 2018 | EPIC | EPIC SO2 algorithm | Tinakula SO2 loadings 14 kt (21 October). |
| [61] | Calbuco 2015 | MODIS and VIIRS | BTD and parametric retrieval algorithm combined with BTD mask | Plume height = 21 km (a.s.l). Ash mass of 3.65 × 10⁹ kg. Mass loadings: VIIRS = 0.4 g/m2; MODIS = 1.4 g/m2; Fine ash ≈ 1% of total ash mass. |
| [62] | Etna 2013 | OLI, MODIS, and SEVIRI | “Dark pixel” procedure and PEM | Landsat cloud height varies from about 6 up to 9.5 km (a.s.l.). MODIS cloud height is 8.9 km (a.s.l.) with an uncertainty of +/− 500 m. SEVIRI clout top height is 10.5 km (a.s.l.) with an uncertainty of +/− 500 m. |
| [34] | Raikoke 2019 | TROPOMI | FP_ILM | SO2 plume height ≈ 13 km (a.s.l.). SO2 layer height with an accuracy better than 2 km for SO2 total column densities > 20 DU. |
| [63] | Holuhraun 2014 | IASI | OE method, Forward model, and DOAS technique | SO2 masses showed a maximum of 0.25 Tg. |
| [64] | Etna 2018 | MODIS | LSTM-CA | Total accuracy of volcanic ash cloud identification reached 96.1%. |
| [65] | Bogoslof 2016-17 | ABI, AVHRR, MODIS, and VIIRS | BTD | The 10 largest events each had a total erupted mass > 1 × 10⁹ k. Total mass for 28 events was 5.7 × 10¹⁰ kg. Maximum mass eruption rate 1 × 10⁵ to 4 × 10⁶ kg/s−1. 18 of the volcanic clouds reached > 8.5 km (a.s.l) with uncertainty of 10%. |
| [66] | Etna 2013 | OLI | Height-From-Shadow technique and Plume Elevation Model (PEM) | For cloud 1, 84 height measurements were made over the 7.7 km of its downwind extent. There was a gap of 22 km where no cloud was apparent. For cloud 2, for which there were 62 height measurements, extended 19.5 km to the image. |
| [22] | Etna 2018 | SEVIRI | MS2RWS (MeteoSat to Rapid Response Web Service) algorithm, AVHotRR routine | Volcanic plume height ≈ 8 km (a.s.l). Ash total mass ≈ 35 kt. SO2 total mass ≈ 100 kt. SO2 flux peaks ≈ 600/kg/s and mean of ≈ 185 kg/s. |
| [35] | Sinabung 2018 | TROMPOMI, AHI, SEVIRI, and CALIOP | VADGUS, FRESCO, O22CLD, and ROCINN algorithms | ROCINN height is very similar to the FRESCO R2 = 0.98 from 0.5 and 14 km. The O22CLD and ROCINN are corresponding. FRESCO heights exceeded 15 km (a.s.l). |
| [67] | Eyjafjallajökull 2010 & Puyehue-Cordón Caulle 2011 | SEVIRI and CALIOP | SDA, GA, LSSVR 1D-VAR, and BTD | ACTH combination between methods vs. CALIOP VTH Eyjafjallajökull 2010: SDA-GA-LSSVR R2 = 0.77; GA-LSSVR R2 = 0.74; LSSVR R2 = 0.67; 1D-VAR algorithm R2 = 0.38. Puyehue-Cordón Caulle 2011: SDA-GA-LSSVR R2 = 0.79; GA-LSSVR R2 = 0.68; LSSVR R2 = 0.60; 1D-VAR algorithm R2 = 0.27. |
| [68] | Etna 2018 | MODIS | FF–CNN–LSTM method | Classification accuracy 88.4%. Kappa coefficient = 0.8011 |
| [69] | Etna 2018 | SEVIRI, MODIS, VIIRS, TROPOMI, AIRS, and IASI | “Traverse” approach | Plume height ≈ 8 km (a.s.l.) Total SO2 flux uncertainty estimated to be about 45% (using SEVIRI). TROPOMI and IASI show more sensitivity. |
| [70] | Eyjafjallajökull 2010 | SEVIRI | BTD, LUT, and RTM based on DISORT | Mass concentration and optical depth at the wavelength of 0.355 mm. R2 = 0.79 and 0.73, respectively; root mean square error (RMSE) = 0.17 and 0.18; mean absolute error (MAE) = 0.11 and 0.14. |
| [71] | Etna 2012 | IASI | AEROIASI algorithm and RTM- TOVS | SO2 peaks at 9.5 km and 11.5 km. Total uncertainty for column mass concentration estimations 35%. |
| [72] | 2008 Kasatochi, 2014 Kelud, 2015 Calbuco & 2019 Raikoke | OMI | FP_IML | Plume height error 1–2 km. |
| [73] | Raikoke 2019 | TROPOMI, OMPS Limb profiler (LP) | DOAS and PCA | Plume height from 19 to 26 km (a.s.l). Error ≈ 200 m. Peak of stratospheric AOD recorded at a wavelength of 674 nm. |
| [74] | Raikoke 2019, Taal 2020, Nishinoshima 2020 & La Soufriére 2021 | TROPOMI, IASI, and CALIOP | FP_ILM and IASI ULB/LATMOS | SP5 LH, IASI/LATMOS, and mean difference results, respectively: Raikoke, 2019 = 10.18 ± 2.79 km/10.03 ± 0.99 km/−0.15 ± 2.83 km; Taal 2020 = 12.13 ± 3.95 km/ 9.51 ± 1.78 km/ −2.62 ± 3.0 km; Nishinoshima 2020 = 0.73 ± 1.97 km/ 8.0 ± 1.04 km/0.27 ± 2.79 km; La Soufrière 2021 = 14.94 ± 3.87 km/ 15.7 ± 1.16 km/0.76 ± 3.69 km; S5P SO2 LH and the CALIOP with bias at −2.5± 2 km. |
| [13] | Raikoke 2019, Sierra Negra 2018, Ulawun 2019 & Etna 2021 | TROPOMI | Iterative Covariance-Based Retrieval Algorithm (COBRA) | SO2 LH error by a factor of 2 to 3 compared to the DOAS algorithm. SO2 LH accuracy is 1–2 km for SO2 as low as 5DU. |
| [75] | Hunga Tonga-Hunga Ha’apai 2022 | ABI, AHI COSMIC-2, and Spire | Photogrammetry, Automated Stereo-Winds Method, and GNSS-RO technique | Plume height top at 50–55 km (a.s.l). GNSS-RO shows most of the plume mat 30–40 km (a.s.l). |
| [28] | Eyjafjallajökull 2010 | SEVIRI | VADUGS retrieval algorithm | Correlation (0.49), MAPE (90%), MPE (+55%), and RMSE (0.41 g m−2) show that VADGUS can distinguish between thinner and thicker ash pixels although cloud top height is usually strongly underestimated. |
| [76] | Eyjafjallajökull (2010) and Puyehue-Cordón Caulle (2011) | SEVIRI | VACOS algorithm | Probability of detection (POD) of more than 90% and a false alarm rate (FAR) of ca. 1%. Mean absolute error ≈ 40% or less for ash layers with an OT at 10.8 μm of 0.1 or more. ACTH error ≈ 10% for ash above 5 km. Effective radius error of 35% for radii of 0.6–6 μm. |
| [77] | Raikoke 2019 | Sentinel-3 SLSTR and MODIS | NN algorithm and BTD | Volcanic cloud detection accuracy of 93% to 99%. |
| [78] | Tonga-Hunga Há’apai 2022 | OMPS-LP | Multi-wavelength aerosol extinction algorithm (OMPS LP operational algorithm) | Top height registered was 50 km (a.s.l.). |
| [79] | Etna 2020 & 2022 | SEVIRI | Machine learning SVM and combination of TIR bands | Ash detection accuracy of 86%. |
4.2. B- Ground-Based Remote Sensing for Volcanic Plumes and Cloud Monitoring (n = 24)
4.3. C-Airborne/UAV-Based Remote Sensing for Volcanic Plumes and Cloud Monitoring (n = 5)
4.4. D-Multiplatform Approaches for Volcanic Plumes and Cloud Monitoring (n= 9)
4.5. E-Remote Sensing Data Assimilation into Numerical Forecasting Models (n = 28)
5. Conclusions
Supplementary Materials
Author Contributions
Funding
Data Availability Statement
Conflicts of Interest
References
- Carey, S.; Bursik, M. Chapter 32—Volcanic Plumes. In The Encyclopedia of Volcanoes, 2nd ed.; Sigurdsson, H., Ed.; Academic Press: Amsterdam, The Netherlands, 2015; pp. 571–585. ISBN 978-0-12-385938-9. [Google Scholar]
- Bonadonna, C.; Costa, A.; Folch, A.; Koyaguchi, T. Chapter 33—Tephra Dispersal and Sedimentation. In The Encyclopedia of Volcanoes, 2nd ed.; Sigurdsson, H., Ed.; Academic Press: Amsterdam, The Netherlands, 2015; pp. 587–597. ISBN 978-0-12-385938-9. [Google Scholar]
- Prata, A.J.; Barton, I.J.; Johnson, R.W.; Kamo, K.; Kingwell, J. Hazard from Volcanic ASH. Nature 1991, 354, 25. [Google Scholar] [CrossRef] [PubMed]
- Tupper, A.; Itikarai, I.; Richards, M.; Prata, F.; Carn, S.; Rosenfeld, D. Facing the Challenges of the International Airways Volcano Watch: The 2004/05 Eruptions of Manam, Papua New Guinea. Weather Forecast. 2007, 22, 175–191. [Google Scholar] [CrossRef]
- Wilson, T.M.; Stewart, C.; Sword-Daniels, V.; Leonard, G.S.; Johnston, D.M.; Cole, J.W.; Wardman, J.; Wilson, G.; Barnard, S.T. Volcanic Ash Impacts on Critical Infrastructure. Phys. Chem. Earth Parts A/B/C 2012, 45–46, 5–23. [Google Scholar] [CrossRef]
- Mori, T.; Kato, K. Sulfur Dioxide Emissions during the 2011 Eruption of Shinmoedake Volcano, Japan. Earth Planets Space 2013, 65, 573–580. [Google Scholar] [CrossRef]
- Petersen, G.N.; Bjornsson, H.; Arason, P.; von Löwis, S. Two Weather Radar Time Series of the Altitude of the Volcanic Plume during the May 2011 Eruption of Grimsvotn, Iceland. Earth Syst. Sci. Data 2012, 4, 121–127. [Google Scholar] [CrossRef]
- Segonne, C.; Huret, N.; Payan, S.; Gouhier, M.; Catoire, V. A Spectra Classification Methodology of Hyperspectral Infrared Images for Near Real-Time Estimation of the SO2 Emission Flux from Mount Etna with LARA Radiative Transfer Retrieval Model. Remote Sens. 2020, 12, 4107. [Google Scholar] [CrossRef]
- Gomez, C.; Kennedy, B. Capturing Volcanic Plumes in 3D with UAV-Based Photogrammetry at Yasur Volcano—Vanuatu. J. Volcanol. Geotherm. Res. 2018, 350, 84–88. [Google Scholar] [CrossRef]
- Turnbull, K.; Johnson, B.; Marenco, F.; Haywood, J.; Minikin, A.; Weinzierl, B.; Schlager, H.; Schumann, U.; Leadbetter, S.; Woolley, A. A Case Study of Observations of Volcanic Ash from the Eyjafjallajokull Eruption: 1. In Situ Airborne Observations. J. Geophys. Res. Atmos. 2012, 117, D00U12. [Google Scholar] [CrossRef]
- Corradini, S.; Merucci, L.; Prata, A.J.; Piscini, A. Volcanic Ash and SO2 in the 2008 Kasatochi Eruption: Retrievals Comparison from Different IR Satellite Sensors. J. Geophys. Res. Atmos. 2010, 115, D00L21. [Google Scholar] [CrossRef]
- Karagulian, F.; Clarisse, L.; Clerbaux, C.; Prata, A.J.; Hurtmans, D.; Coheur, P.F. Detection of Volcanic SO2, Ash, and H2SO4 Using the Infrared Atmospheric Sounding Interferometer (IASI). J. Geophys. Res. Atmos. 2010, 115, D00L02. [Google Scholar] [CrossRef]
- Theys, N.; Lerot, C.; Brenot, H.; van Gent, J.; De Smedt, I.; Clarisse, L.; Burton, M.; Varnam, M.; Hayer, C.; Esse, B.; et al. Improved Retrieval of SO2 Plume Height from TROPOMI Using an Iterative Covariance-Based Retrieval Algorithm. Atmos. Meas. Tech. 2022, 15, 4801–4817. [Google Scholar] [CrossRef]
- Webster, H.N.; Thomson, D.J.; Johnson, B.T.; Heard, I.P.C.; Turnbull, K.; Marenco, F.; Kristiansen, N.I.; Dorsey, J.; Minikin, A.; Weinzierl, B.; et al. Operational Prediction of Ash Concentrations in the Distal Volcanic Cloud from the 2010 Eyjafjallajokull Eruption. J. Geophys. Res. Atmos. 2012, 117, D00U08. [Google Scholar] [CrossRef]
- Calvari, S.; Biale, E.; Bonaccorso, A.; Cannata, A.; Carleo, L.; Currenti, G.; Di Grazia, G.; Ganci, G.; Iozzia, A.; Pecora, E.; et al. Explosive Paroxysmal Events at Etna Volcano of Different Magnitude and Intensity Explored through a Multidisciplinary Monitoring System. Remote Sens. 2022, 14, 4006. [Google Scholar] [CrossRef]
- Heue, K.P.; Brenninkmeijer, C.A.M.; Wagner, T.; Mies, K.; Dix, B.; Friess, U.; Martinsson, B.G.; Slemr, F.; van Velthoven, P.F.J. Observations of the 2008 Kasatochi Volcanic SO2 Plume by CARIBIC Aircraft DOAS and the GOME-2 Satellite. Atmos. Chem. Phys. 2010, 10, 4699–4713. [Google Scholar] [CrossRef]
- Bruckert, J.; Hoshyaripour, G.A.; Horváth, A.; Muser, L.O.; Prata, F.J.; Hoose, C.; Vogel, B. Online Treatment of Eruption Dynamics Improves the Volcanic Ash and SO2 Dispersion Forecast: Case of the 2019 Raikoke Eruption. Atmos. Chem. Phys. 2022, 22, 3535–3552. [Google Scholar] [CrossRef]
- D’Amours, R.; Malo, A.; Servranckx, R.; Bensimon, D.; Trudel, S.; Gauthier-Bilodeau, J.P. Application of the Atmospheric Lagrangian Particle Dispersion Model MLDP0 to the 2008 Eruptions of Okmok and Kasatochi Volcanoes. J. Geophys. Res. Atmos. 2010, 115, D00L11. [Google Scholar] [CrossRef]
- Mastin, L.G.; Guffanti, M.; Servranckx, R.; Webley, P.; Barsotti, S.; Dean, K.; Durant, A.; Ewert, J.W.; Neri, A.; Rose, W.I.; et al. A Multidisciplinary Effort to Assign Realistic Source Parameters to Models of Volcanic Ash-Cloud Transport and Dispersion during Eruptions. J. Volcanol. Geotherm. Res. 2009, 186, 10–21. [Google Scholar] [CrossRef]
- Monitoring VolCAniC ASh froM SPACE. 2010. Available online: https://elib.dlr.de/67813/1/STM-280_ash101004_V2.pdf (accessed on 17 May 2020).
- Labazuy, P.; Gouhier, M.; Harris, A.; Guéhenneux, Y.; Hervo, M.; Bergès, J.C.; Fréville, P.; Cacault, P.; Rivet, S. Near Real-Time Monitoring of the April-May 2010 Eyjafjallajokull Ash Cloud: An Example of a Web-Based, Satellite Data-Driven, Reporting System. Int. J. Environ. Pollut. 2012, 48, 262–272. [Google Scholar] [CrossRef]
- Corradini, S.; Guerrieri, L.; Stelitano, D.; Salerno, G.; Scollo, S.; Merucci, L.; Prestifilippo, M.; Musacchio, M.; Silvestri, M.; Lombardo, V.; et al. Near Real-Time Monitoring of the Christmas 2018 Etna Eruption Using SEVIRI and Products Validation. Remote Sens. 2020, 12, 1336. [Google Scholar] [CrossRef]
- Page, M.J.; McKenzie, J.E.; Bossuyt, P.M.; Boutron, I.; Hoffmann, T.C.; Mulrow, C.D.; Shamseer, L.; Tetzlaff, J.M.; Akl, E.A.; Brennan, S.E.; et al. The PRISMA 2020 Statement: An Updated Guideline for Reporting Systematic Reviews. Rev. Panam. Salud Publica Pan Am. J. Public Health 2022, 46, e112. [Google Scholar] [CrossRef]
- Mupepi, O.; Marambanyika, T.; Matsa, M.M.; Dube, T. A Systematic Review on Remote Sensing of Wetland Environments. Trans. R. Soc. S. Afr. 2024, 1–19. [Google Scholar] [CrossRef]
- Höhl, A.; Obadic, I.; Torres, M.Á.F.; Najjar, H.; Oliveira, D.; Akata, Z.; Dengel, A.; Zhu, X.X. Opening the Black-Box: A Systematic Review on Explainable AI in Remote Sensing. arXiv 2024, arXiv:2402.1379. [Google Scholar] [CrossRef]
- Li, C.F.; Dai, Y.Y.; Zhao, J.J.; Yin, J.Y.; Xue, D.; Zhou, S.Q. Diffusion Source Detection of Volcanic Ash Cloud Using MODIS Satellite Data. J. Indian Soc. Remote Sens. 2014, 42, 611–619. [Google Scholar] [CrossRef]
- Turner, W.; Rondinini, C.; Pettorelli, N.; Mora, B.; Leidner, A.K.; Szantoi, Z.; Buchanan, G.; Dech, S.; Dwyer, J.; Herold, M.; et al. Free and Open-Access Satellite Data Are Key to Biodiversity Conservation. Biol. Conserv. 2015, 182, 173–176. [Google Scholar] [CrossRef]
- Bugliaro, L.; Piontek, D.; Kox, S.; Schmidl, M.; Mayer, B.; Müller, R.; Vázquez-Navarro, M.; Peters, D.M.; Grainger, R.G.; Gasteiger, J.; et al. VADUGS: A Neural Network for the Remote Sensing of Volcanic Ash with MSG/SEVIRI Trained with Synthetic Thermal Satellite Observations Simulated with a Radiative Transfer Model. Nat. Hazards Earth Syst. Sci. 2022, 22, 1029–1054. [Google Scholar] [CrossRef]
- Prata, A.J. Infrared Radiative Transfer Calculations for Volcanic Ash Clouds. Geophys. Res. Lett. 1989, 16, 1293–1296. [Google Scholar] [CrossRef]
- Yin, J.-Y.; Dong, J.-S.; Li, C.-F.; Zhao, J.-J. A New Detection Method of Volcanic Ash Cloud Based on MODIS Image. J. Indian Soc. Remote Sens. 2015, 43, 429–437. [Google Scholar] [CrossRef]
- Marchese, F.; Ciampa, M.; Filizzola, C.; Lacava, T.; Mazzeo, G.; Pergola, N.; Tramutoli, V. On the Exportability of Robust Satellite Techniques (RST) for Active Volcano Monitoring. Remote Sens. 2010, 2, 1575–1588. [Google Scholar] [CrossRef]
- Marchese, F.; Falconieri, A.; Pergola, N.; Tramutoli, V. Monitoring the Agung (Indonesia) Ash Plume of November 2017 by Means of Infrared Himawari 8 Data. Remote Sens 2018, 10, 919. [Google Scholar] [CrossRef]
- Prata, A.J. Observations Of Volcanic Ash Clouds In The 10-12-Mu-M Window Using Avhrr/2 Data. Int. J. Remote Sens. 1989, 10, 751–761. [Google Scholar] [CrossRef]
- Hedelt, P.; Efremenko, D.S.; Loyola, D.G.; Spurr, R.; Clarisse, L. Sulfur Dioxide Layer Height Retrieval from Sentinel-5 Precursor/TROPOMI Using FP_ILM. Atmos. Meas. Tech. 2019, 12, 5503–5517. [Google Scholar] [CrossRef]
- de Laat, A.; Vazquez-Navarro, M.; Theys, N.; Stammes, P. Analysis of Properties of the 19 February 2018 Volcanic Eruption of Mount Sinabung in S5P/TROPOMI and Himawari-8 Satellite Data. Nat. Hazards Earth Syst. Sci. 2020, 20, 1203–1217. [Google Scholar] [CrossRef]
- Piscini, A.; Corradini, S.; Marchese, F.; Merucci, L.; Pergola, N.; Tramutoli, V. Volcanic Ash Cloud Detection from Space: A Comparison between the RSTASH Technique and the Water Vapour Corrected BTD Procedure. Geomat. Nat. Hazards Risk 2011, 2, 263–277. [Google Scholar] [CrossRef]
- Marchese, F.; Filizzola, C.; Mazzeo, G.; Pergola, N.; Sannazzaro, F.; Tramutoli, V. Assessment and Validation in Time Domain of a Robust Satellite Technique (RSTASH) for Ash Cloud Detection. Geomat. Nat. Hazards Risk 2011, 2, 247–262. [Google Scholar] [CrossRef]
- Thomas, H.E.; Prata, A.J. Sulphur Dioxide as a Volcanic Ash Proxy during the April-May 2010 Eruption of Eyjafjallajokull Volcano, Iceland. Atmos. Chem. Phys. 2011, 11, 6871–6880. [Google Scholar] [CrossRef]
- Zhu, L.; Liu, J.; Liu, C.; Wang, M. Satellite Remote Sensing of Volcanic Ash Cloud in Complicated Meteorological Conditions. Sci. China-Earth Sci. Sci. China Earth Sci. 2011, 54, 1789–1795. [Google Scholar] [CrossRef]
- Scollo, S.; Kahn, R.A.; Nelson, D.L.; Coltelli, M.; Diner, D.J.; Garay, M.J.; Realmuto, V.J. MISR Observations of Etna Volcanic Plumes. J. Geophys. Res. Atmos. 2012, 117, D06210. [Google Scholar] [CrossRef]
- Kahn, R.A.; Limbacher, J. Eyjafjallajökull Volcano Plume Particle-Type Characterization from Space-Based Multi-Angle Imaging. Atmos. Chem. Phys. 2012, 12, 9459–9477. [Google Scholar] [CrossRef]
- Christopher, S.A.; Feng, N.; Naeger, A.; Johnson, B.; Marenco, F. Satellite Remote Sensing Analysis of the 2010 Eyjafjallajokull Volcanic Ash Cloud over the North Sea during 4–18 May 2010. J. Geophys. Res. Atmos. 2012, 117, D00U20. [Google Scholar] [CrossRef]
- Flemming, J.; Inness, A. Volcanic Sulfur Dioxide Plume Forecasts Based on UV Satellite Retrievals for the 2011 Grimsvotn and the 2010 Eyjafjallajokull Eruption. J. Geophys. Res. Atmos. 2013, 118, 10172–10189. [Google Scholar] [CrossRef]
- Zaksek, K.; Hort, M.; Zaletelj, J.; Langmann, B. Monitoring Volcanic Ash Cloud Top Height through Simultaneous Retrieval of Optical Data from Polar Orbiting and Geostationary Satellites. Atmos. Chem. Phys. 2013, 13, 2589–2606. [Google Scholar] [CrossRef]
- Ekstrand, A.L.; Webley, P.W.; Garay, M.J.; Dehn, J.; Prakash, A.; Nelson, D.L.; Dean, K.G.; Steensen, T. A Multi-Sensor Plume Height Analysis of the 2009 Redoubt Eruption. J. Volcanol. Geotherm. Res. 2013, 259, 170–184. [Google Scholar] [CrossRef]
- Marchese, F.; Falconieri, A.; Pergola, N.; Tramutoli, V. A Retrospective Analysis of the Shinmoedake (Japan) Eruption of 26-27 January 2011 by Means of Japanese Geostationary Satellite Data. J. Volcanol. Geotherm. Res. 2014, 269, 1–13. [Google Scholar] [CrossRef]
- Corradini, S.; Pugnaghi, S.; Piscini, A.; Guerrieri, L.; Merucci, L.; Picchiani, M.; Chini, M. Volcanic Ash and SO2 Retrievals Using Synthetic MODIS TIR Data: Comparison between Inversion Procedures and Sensitivity Analysis. Ann. Geophys. 2014, 57. [Google Scholar] [CrossRef]
- Cooke, M.C.; Francis, P.N.; Millington, S.; Saunders, R.; Witham, C. Detection of the Grimsvotn 2011 Volcanic Eruption Plumes Using Infrared Satellite Measurements. Atmos. Sci. Lett. 2014, 15, 321–327. [Google Scholar] [CrossRef]
- Koukouli, M.E.; Clarisse, L.; Carboni, E.; van Gent, J.; Spinetti, C.; Balis, D.; Dimopoulos, S.; Grainger, R.; Theys, N.; Tampellini, L.; et al. Intercomparison of Metop-A SO2 Measurements during the 2010-2011 Icelandic Eruptions. Ann. Geophys. 2015, 57. [Google Scholar] [CrossRef]
- Kylling, A.; Kahnert, M.; Lindqvist, H.; Nousiainen, T. Volcanic Ash Infrared Signature: Porous Non-Spherical Ash Particle Shapes Compared to Homogeneous Spherical Ash Particles. Atmos. Meas. Tech. 2014, 7, 919–929. [Google Scholar] [CrossRef]
- Li, C.F.; Dai, Y.Y.; Zhao, J.J.; Zhou, S.Q.; Yin, J.Y.; Xue, D. Remote Sensing Monitoring of Volcanic Ash Clouds Based on PCA Method. Acta Geophys. 2015, 63, 432–450. [Google Scholar] [CrossRef]
- Guerrieri, L.; Merucci, L.; Corradini, S.; Pugnaghi, S. Evolution of the 2011 Mt. Etna Ash and SO2 Lava Fountain Episodes Using SEVIRI Data and VPR Retrieval Approach. J. Volcanol. Geotherm. Res. 2015, 291, 63–71. [Google Scholar] [CrossRef]
- Kylling, A. Ash and Ice Clouds during the Mt Kelud February 2014 Eruption as Interpreted from IASI and AVHRR/3 Observations. Atmos. Meas. Tech. 2016, 9, 2103–2117. [Google Scholar] [CrossRef]
- Merucci, L.; Zaksek, K.; Carboni, E.; Corradini, S. Stereoscopic Estimation of Volcanic Ash Cloud-Top Height from Two Geostationary Satellites. Remote Sens. 2016, 8, 206. [Google Scholar] [CrossRef]
- Pugnaghi, S.; Guerrieri, L.; Corradini, S.; Merucci, L. Real Time Retrieval of Volcanic Cloud Particles and SO2 by Satellite Using an Improved Simplified Approach. Atmos. Meas. Tech. 2016, 9, 3053–3062. [Google Scholar] [CrossRef]
- Toyos, G.; Mingari, L.; Pujol, G.; Villarosa, G. Investigating the Nature of an Ash Cloud Event in Southern Chile Using Remote Sensing: Volcanic Eruption or Resuspension? Remote Sens. Lett. 2017, 8, 146–155. [Google Scholar] [CrossRef]
- Zhu, L.; Li, J.; Zhao, Y.Y.; Gong, H.; Li, W.J. Retrieval of Volcanic Ash Height from Satellite-Based Infrared Measurements. J. Geophys. Res. Atmos. 2017, 122, 5364–5379. [Google Scholar] [CrossRef]
- Biondi, R.; Steiner, A.K.; Kirchengast, G.; Brenot, H.; Rieckh, T. Supporting the Detection and Monitoring of Volcanic Clouds: A Promising New Application of Global Navigation Satellite System Radio Occultation. Adv. Space Res. 2017, 60, 2707–2722. [Google Scholar] [CrossRef]
- Efremenko, D.S.; Loyola, D.G.; Hedelt, P.; Spurr, R.J.D. Volcanic SO2 Plume Height Retrieval from UV Sensors Using a Full-Physics Inverse Learning Machine Algorithm. Int. J. Remote Sens. 2017, 38, 1–27. [Google Scholar] [CrossRef]
- Carn, S.A.; Krotkov, N.A.; Fisher, B.L.; Li, C.; Prata, A.J. First Observations of Volcanic Eruption Clouds From the L1 Earth-Sun Lagrange Point by DSCOVR/EPIC. Geophys. Res. Lett. 2018, 45, 11456–11464. [Google Scholar] [CrossRef]
- Marzano, F.S.; Corradini, S.; Mereu, L.; Kylling, A.; Montopoli, M.; Cimini, D.; Merucci, L.; Stelitano, D. Multisatellite Multisensor Observations of a Sub-Plinian Volcanic Eruption: The 2015 Calbuco Explosive Event in Chile. IEEE Trans. Geosci. Remote Sens. 2018, 56, 2597–2612. [Google Scholar] [CrossRef]
- de Michele, M.; Raucoules, D.; Corradini, S.; Merucci, L.; Salerno, G.; Sellitto, P.; Carboni, E. Volcanic Cloud Top Height Estimation Using the Plume Elevation Model Procedure Applied to Orthorectified Landsat 8 Data. Test Case: 26 October 2013 Mt. Etna Eruption. Remote Sens. 2019, 11, 785. [Google Scholar] [CrossRef]
- Carboni, E.; Mather, T.A.; Schmidt, A.; Grainger, R.G.; Pfeffer, M.A.; Ialongo, I.; Theys, N. Satellite-Derived Sulfur Dioxide (SO2) Emissions from the 2014-2015 Holuhraun Eruption (Iceland). Atmos. Chem. Phys. 2019, 19, 4851–4862. [Google Scholar] [CrossRef]
- Liu, L.; Sun, X.K. Volcanic Ash Cloud Diffusion From Remote Sensing Image Using LSTM-CA Method. IEEE Access 2020, 8, 54681–54690. [Google Scholar] [CrossRef]
- Schneider, D.J.; Van Eaton, A.R.; Wallace, K.L. Satellite Observations of the 2016–2017 Eruption of Bogoslof Volcano: Aviation and Ash Fallout Hazard Implications from a Water-Rich Eruption. Bull. Volcanol. 2020, 82, 29. [Google Scholar] [CrossRef]
- Pailot-Bonnétat, S.; Harris, A.J.L.; Calvari, S.; De Michele, M.; Gurioli, L. Plume Height Time-Series Retrieval Using Shadow in Single Spatial Resolution Satellite Images. Remote Sens. 2020, 12, 3951. [Google Scholar] [CrossRef]
- Zhu, W.R.; Zhu, L.; Li, J.; Sun, H.F. Retrieving Volcanic Ash Top Height through Combined Polar Orbit Active and Geostationary Passive Remote Sensing Data. Remote Sens. 2020, 12, 953. [Google Scholar] [CrossRef]
- Liu, L.; Li, C.F.; Sun, X.K.; Zhao, J.J. Monitoring of Volcanic Ash Cloud from Heterogeneous Data Using Feature Fusion and Convolutional Neural Networks-Long Short-Term Memory. Neural Comput. Appl. 2021, 33, 667–679. [Google Scholar] [CrossRef]
- Corradini, S.; Guerrieri, L.; Brenot, H.; Clarisse, L.; Merucci, L.; Pardini, F.; Prata, A.J.; Realmuto, V.J.; Stelitano, D.; Theys, N. Tropospheric Volcanic SO2 Mass and Flux Retrievals from Satellite. The Etna December 2018 Eruption. Remote Sens. 2021, 13, 2225. [Google Scholar] [CrossRef]
- Filei, A.A.; Marenco, F. Retrieval of Volcanic Ash Parameters from Satellite Data. Russ. Meteorol. Hydrol. 2021, 46, 269–279. [Google Scholar] [CrossRef]
- Guermazi, H.; Sellitto, P.; Cuesta, J.; Eremenko, M.; Lachatre, M.; Mailler, S.; Carboni, E.; Salerno, G.; Caltabiano, T.; Menut, L.; et al. Quantitative Retrieval of Volcanic Sulphate Aerosols from IASI Observations. Remote Sens. 2021, 13, 1808. [Google Scholar] [CrossRef]
- Fedkin, N.M.; Li, C.; Krotkov, N.A.; Hedelt, P.; Loyola, D.G.; Dickerson, R.R.; Spurr, R. Volcanic SO2 Effective Layer Height Retrieval for the Ozone Monitoring Instrument (OMI) Using a Machine-Learning Approach. Atmos. Meas. Tech. 2021, 14, 3673–3691. [Google Scholar] [CrossRef]
- Gorkavyi, N.; Krotkov, N.; Li, C.; Lait, L.; Colarco, P.; Carn, S.; DeLand, M.; Newman, P.; Schoeberl, M.; Taha, G.; et al. Tracking Aerosols and SO2 Clouds from the Raikoke Eruption: 3D View from Satellite Observations. Atmos. Meas. Tech. 2021, 14, 7545–7563. [Google Scholar] [CrossRef]
- Koukouli, M.E.; Michailidis, K.; Hedelt, P.; Taylor, I.A.; Inness, A.; Clarisse, L.; Balis, D.; Efremenko, D.; Loyola, D.; Grainger, R.G.; et al. Volcanic SO2 Layer Height by TROPOMI/S5P: Evaluation against IASI/MetOp and CALIOP/CALIPSO Observations. Atmos. Chem. Phys. 2022, 22, 5665–5683. [Google Scholar] [CrossRef]
- Carr, J.L.; Horváth, A.; Wu, D.L.; Friberg, M.D. Stereo Plume Height and Motion Retrievals for the Record-Setting Hunga Tonga-Hunga Ha’apai Eruption of 15 January 2022. Geophys. Res. Lett. 2022, 49, e2022GL098131. [Google Scholar] [CrossRef]
- Piontek, D.; Bugliaro, L.; Kar, J.; Schumann, U.; Marenco, F.; Plu, M.; Voigt, C. The New Volcanic Ash Satellite Retrieval VACOS Using MSG/SEVIRI and Artificial Neural Networks: 2. Validation. Remote Sens. 2021, 13, 3128. [Google Scholar] [CrossRef]
- Petracca, I.; De Santis, D.; Picchiani, M.; Corradini, S.; Guerrieri, L.; Prata, F.; Merucci, L.; Stelitano, D.; Del Frate, F.; Salvucci, G.; et al. Volcanic Cloud Detection Using Sentinel-3 Satellite Data by Means of Neural Networks: The Raikoke 2019 Eruption Test Case. Atmos. Meas. Tech. 2022, 15, 7195–7210. [Google Scholar] [CrossRef]
- Taha, G.; Loughman, R.; Colarco, P.R.; Zhu, T.; Thomason, L.W.; Jaross, G.; Taha, G.; Loughman, R.; Colarco, P.R.; Zhu, T.; et al. Tracking the 2022 Hunga Tonga-Hunga Ha’apai Aerosol Cloud in the Upper and Middle Stratosphere Using Space-Based Observations. Geophys. Res. Lett. 2022, 49, e2022GL100091. [Google Scholar] [CrossRef] [PubMed]
- Torrisi, F.; Amato, E.; Corradino, C.; Mangiagli, S.; Del Negro, C. Characterization of Volcanic Cloud Components Using Machine Learning Techniques and SEVIRI Infrared Images. Sensors 2022, 22, 7712. [Google Scholar] [CrossRef] [PubMed]
- Wen, S.M.; Rose, W.I. Retrieval of Sizes and Total Masses of Particles in Volcanic Clouds Using AVHRR Bands 4 and 5. J. Geophys. Res. Atmos. 1994, 99, 5421–5431. [Google Scholar] [CrossRef]
- Prata, A.J.; Grant, I.F. Retrieval of Microphysical and Morphological Properties of Volcanic Ash Plumes from Satellite Data: Application to Mt Ruapehu, New Zealand. Q. J. R. Meteorol. Soc. 2001, 127, 2153–2179. [Google Scholar] [CrossRef]
- Scollo, S.; Boselli, A.; Coltelli, M.; Leto, G.; Pisani, G.; Spinelli, N.; Wang, X. Monitoring Etna Volcanic Plumes Using a Scanning LiDAR. Bull. Volcanol. 2012, 74, 2383–2395. [Google Scholar] [CrossRef]
- Pisani, G.; Boselli, A.; Coltelli, M.; Leto, G.; Pica, G.; Scollo, S.; Spinelli, N.; Wang, X. Lidar Depolarization Measurement of Fresh Volcanic Ash from Mt. Etna, Italy. Atmos. Environ. 2012, 62, 34–40. [Google Scholar] [CrossRef]
- Marzano, F.S.; Lamantea, M.; Montopoli, M.; Herzog, M.; Graf, H.; Cimini, D. Microwave Remote Sensing of the 2011 Plinian Eruption of the Grimsvotn Icelandic Volcano. Remote Sens. Environ. 2013, 129, 168–184. [Google Scholar] [CrossRef]
- Schneider, D.J.; Hoblitt, R.P. Doppler Weather Radar Observations of the 2009 Eruption of Redoubt Volcano, Alaska. J. Volcanol. Geotherm. Res. 2013, 259, 133–144. [Google Scholar] [CrossRef]
- Burton, M.R.; Salerno, G.G.; D’Auria, L.; Caltabiano, T.; Murè, F.; Maugeri, R. SO2 Flux Monitoring at Stromboli with the New Permanent INGV SO2 Camera System: A Comparison with the FLAME Network and Seismological Data. J. Volcanol. Geotherm. Res. 2015, 300, 95–102. [Google Scholar] [CrossRef]
- Lopez, T.; Thomas, H.E.; Prata, A.J.; Amigo, A.; Fee, D.; Moriano, D. Volcanic Plume Characteristics Determined Using an Infrared Imaging Camera. J. Volcanol. Geotherm. Res. 2015, 300, 148–166. [Google Scholar] [CrossRef]
- Scollo, S.; Boselli, A.; Coltelli, M.; Leto, G.; Pisani, G.; Prestifilippo, M.; Spinelli, N.; Wang, X. Volcanic Ash Concentration during the 12 August 2011 Etna Eruption. Geophys. Res. Lett. 2015, 42, 2634–2641. [Google Scholar] [CrossRef]
- Vidal, L.; Nesbitt, S.W.; Salio, P.; Farias, C.; Nicora, M.G.; Osores, M.S.; Mereu, L.; Marzano, F.S. C-Band Dual-Polarization Radar Observations of a Massive Volcanic Eruption in South America. IEEE J. Sel. Top. Appl. Earth Obs. Remote Sens. 2017, 10, 960–974. [Google Scholar] [CrossRef]
- Pfeffer, M.A.; Bergsson, B.; Barsotti, S.; Stefánsdóttir, G.; Galle, B.; Arellano, S.; Conde, V.; Donovan, A.; Ilyinskaya, E.; Burton, M.; et al. Ground-Based Measurements of the 2014-2015 Holuhraun Volcanic Cloud (Iceland). Geosciences 2018, 8, 29. [Google Scholar] [CrossRef]
- Sellitto, P.; Spampinato, L.; Salerno, G.G.; La Spina, A. Aerosol Optical Properties of Pacaya Volcano Plume Measured with a Portable Sun-Photometer. Geosciences 2018, 8, 36. [Google Scholar] [CrossRef]
- Mereu, L.; Scollo, S.; Mori, S.; Boselli, A.; Leto, G.; Marzano, F.S. Maximum-Likelihood Retrieval of Volcanic Ash Concentration and Particle Size From Ground-Based Scanning Lidar. IEEE Trans. Geosci. Remote Sens. 2018, 56, 5824–5842. [Google Scholar] [CrossRef]
- Freret-Lorgeril, V.; Donnadieu, F.; Scollo, S.; Provost, A.; Fréville, P.; Guéhenneux, Y.; Hervier, C.; Prestifilippo, M.; Coltelli, M. Mass Eruption Rates of Tephra Plumes During the 2011–2015 Lava Fountain Paroxysms at Mt. Etna From Doppler Radar Retrievals. Front. Earth Sci. 2018, 6, 73. [Google Scholar] [CrossRef]
- Wood, K.; Thomas, H.; Watson, M.; Calway, A.; Richardson, T.; Stebel, K.; Naismith, A.; Berthoud, L.; Lucas, J. Measurement of Three Dimensional Volcanic Plume Properties Using Multiple Ground Based Infrared Cameras. Isprs J. Remote Sens. 2019, 154, 163–175. [Google Scholar] [CrossRef]
- Poffo, D.A.; Caranti, G.M.; Comes, R.A.; Rodriguez, A. A New Ash Concentration Estimation Method Using Polarimetric Data: The RMA Observation of the 2015 Calbuco Eruption. Remote Sens. Appl. Soc. Environ. 2019, 13, 224–233. [Google Scholar] [CrossRef]
- Huret, N.; Segonne, C.; Payan, S.; Salerno, G.; Catoire, V.; Ferrec, Y.; Roberts, T.; Fossi, A.P.; Rodriguez, D.; Croizé, L.; et al. Infrared Hyperspectral and Ultraviolet Remote Measurements of Volcanic Gas Plume at MT Etna during IMAGETNA Campaign. Remote Sens. 2019, 11, 1175. [Google Scholar] [CrossRef]
- Marzano, F.S.; Mereu, L.; Scollo, S.; Donnadieu, F.; Bonadonna, C. Tephra Mass Eruption Rate From Ground-Based X-Band and L-Band Microwave Radars During the November 23, 2013, Etna Paroxysm. IEEE Trans. Geosci. Remote Sens. 2020, 58, 3314–3327. [Google Scholar] [CrossRef]
- Ilanko, T.; Pering, T.D.; Wilkes, T.C.; Woitischek, J.; D’Aleo, R.; Aiuppa, A.; McGonigle, A.J.S.; Edmonds, M.; Garaebiti, E. Ultraviolet Camera Measurements of Passive and Explosive (Strombolian) Sulphur Dioxide Emissions at Yasur Volcano, Vanuatu. Remote Sens. 2020, 12, 2703. [Google Scholar] [CrossRef]
- Fuchs, C.; Kuhn, J.; Bobrowski, N.; Platt, U. Quantitative Imaging of Volcanic SO2 Plumes Using Fabry-Perot Interferometer Correlation Spectroscopy. Atmos. Meas. Tech. 2021, 14, 295–307. [Google Scholar] [CrossRef]
- Mereu, L.; Scollo, S.; Boselli, A.; Leto, G.; Sanchez, R.Z.; Bonadonna, C.; Marzano, F.S. Dual-Wavelength Polarimetric Lidar Observations of the Volcanic Ash Cloud Produced during the 2016 Etna Eruption. Remote Sens. 2021, 13, 1728. [Google Scholar] [CrossRef]
- Sicard, M.; Córdoba-Jabonero, C.; Barreto, A.; Welton, E.J.; Gil-Díaz, C.; Carvajal-Perez, C.V.; Comerón, A.; García, O.; García, R.; López-Cayuela, M.A.; et al. Volcanic Eruption of Cumbre Vieja, La Palma, Spain: A First Insight to the Particulate Matter Injected in the Troposphere. Remote Sens. 2022, 14, 2470. [Google Scholar] [CrossRef]
- Bedoya-Velásquez, A.E.; Hoyos-Restrepo, M.; Barreto, A.; García, R.D.; Romero-Campos, P.M.; García, O.; Ramos, R.; Roininen, R.; Toledano, C.; Sicard, M.; et al. Estimation of the Mass Concentration of Volcanic Ash Using Ceilometers: Study of Fresh and Transported Plumes from La Palma Volcano. Remote Sens. 2022, 14, 5680. [Google Scholar] [CrossRef]
- Mori, T.; Hashimoto, T.; Terada, A.; Yoshimoto, M.; Kazahaya, R.; Shinohara, H.; Tanaka, R. Volcanic Plume Measurements Using a UAV for the 2014 Mt. Ontake Eruption. Earth Planets Space 2016, 68, 49. [Google Scholar] [CrossRef]
- Schellenberg, B.; Richardson, T.; Watson, M.; Greatwood, C.; Clarke, R.; Thomas, R.; Wood, K.; Freer, J.; Thomas, H.; Liu, E.; et al. Remote Sensing and Identification of Volcanic Plumes Using Fixed-Wing UAVs over Volcan de Fuego, Guatemala. J. Field Robot. 2019, 36, 1192–1211. [Google Scholar] [CrossRef]
- Brosch, E. Volcanic Ash and Small Uncrewed Aerial Vehicle (SUAV) Interaction: In-Situ Observations and Laboratory Experiments on Aircraft Failure. Front. Earth Sci. 2022, 10, 810962. [Google Scholar] [CrossRef]
- Spinei, E.; Carn, S.A.; Krotkov, N.A.; Mount, G.H.; Yang, K.; Krueger, A. Validation of Ozone Monitoring Instrument SO2 Measurements in the Okmok Volcanic Cloud over Pullman, WA, July 2008. J. Geophys. Res. Atmos. 2010, 115, D00L08. [Google Scholar] [CrossRef]
- Merucci, L.; Burton, M.; Corradini, S.; Salerno, G.G. Reconstruction of SO2 Flux Emission Chronology from Space-Based Measurements. J. Volcanol. Geotherm. Res. 2011, 206, 80–87. [Google Scholar] [CrossRef]
- Spinetti, C.; Salerno, G.G.; Caltabiano, T.; Carboni, E.; Clarisse, L.; Corradini, S.; Grainger, R.G.; Hedelt, P.A.; Koukouli, M.E.; Merucci, L.; et al. Volcanic SO2 by UV-TIR Satellite Retrievals: Validation by Using Ground-Based Network at Mt. Etna. Ann. Geophys. 2015, 57. [Google Scholar] [CrossRef]
- Ialongo, I.; Hakkarainen, J.; Kivi, R.; Anttila, P.; Krotkov, N.A.; Yang, K.; Li, C.; Tukiainen, S.; Hassinen, S.; Tamminen, J. Comparison of Operational Satellite SO2 Products with Ground-Based Observations in Northern Finland during the Icelandic Holuhraun Fissure Eruption. Atmos. Meas. Tech. 2015, 8, 2279–2289. [Google Scholar] [CrossRef]
- Corradini, S.; Montopoli, M.; Guerrieri, L.; Ricci, M.; Scollo, S.; Merucci, L.; Marzano, F.S.; Pugnaghi, S.; Prestifilippo, M.; Ventress, L.J.; et al. A Multi-Sensor Approach for Volcanic Ash Cloud Retrieval and Eruption Characterization: The 23 November 2013 Etna Lava Fountain. Remote Sens. 2016, 8, 58. [Google Scholar] [CrossRef]
- Scollo, S.; Prestifilippo, M.; Bonadonna, C.; Cioni, R.; Corradini, S.; Degruyter, W.; Rossi, E.; Silvestri, M.; Biale, E.; Carparelli, G.; et al. Near-Real-Time Tephra Fallout Assessment at Mt. Etna, Italy. Remote Sens. 2019, 11, 2987. [Google Scholar] [CrossRef]
- Freret-Lorgeril, V.; Bonadonna, C.; Corradini, S.; Donnadieu, F.; Guerrieri, L.; Lacanna, G.; Marzano, F.S.; Mereu, L.; Merucci, L.; Ripepe, M.; et al. Examples of Multi-Sensor Determination of Eruptive Source Parameters of Explosive Events at Mount Etna. Remote Sens. 2021, 13, 2097. [Google Scholar] [CrossRef]
- Scollo, S.; Folch, A.; Coltelli, M.; Realmuto, V.J. Three-Dimensional Volcanic Aerosol Dispersal: A Comparison between Multiangle Imaging Spectroradiometer (MISR) Data and Numerical Simulations. J. Geophys. Res. Atmos. 2010, 115, D24210. [Google Scholar] [CrossRef]
- Corradini, S.; Merucci, L.; Folch, A. Volcanic Ash Cloud Properties: Comparison Between MODIS Satellite Retrievals and FALL3D Transport Model. IEEE Geosci. Remote Sens. Lett. 2011, 8, 248–252. [Google Scholar] [CrossRef]
- Matthias, V.; Aulinger, A.; Bieser, J.; Cuesta, J.; Geyer, B.; Langmann, B.; Serikov, I.; Mattis, I.; Minikin, A.; Mona, L.; et al. The Ash Dispersion over Europe during the Eyjafjallajokull Eruption—Comparison of CMAQ Simulations to Remote Sensing and Air-Borne in-Situ Observations. Atmos. Environ. 2012, 48, 184–194. [Google Scholar] [CrossRef]
- Montopoli, M.; Cimini, D.; Lamantea, M.; Herzog, M.; Graf, H.F.; Marzano, F.S. Microwave Radiometric Remote Sensing of Volcanic Ash Clouds From Space: Model and Data Analysis. IEEE Trans. Geosci. Remote Sens. 2013, 51, 4678–4691. [Google Scholar] [CrossRef]
- Dacre, H.F.; Grant, A.L.M.; Johnson, B.T. Aircraft Observations and Model Simulations of Concentration and Particle Size Distribution in the Eyjafjallajokull Volcanic Ash Cloud. Atmos. Chem. Phys. 2013, 13, 1277–1291. [Google Scholar] [CrossRef]
- Boichu, M.; Menut, L.; Khvorostyanov, D.; Clarisse, L.; Clerbaux, C.; Turquety, S.; Coheur, P.F. Inverting for Volcanic SO2 Flux at High Temporal Resolution Using Spaceborne Plume Imagery and Chemistry-Transport Modelling: The 2010 Eyjafjallajokull Eruption Case Study. Atmos. Chem. Phys. 2013, 13, 8569–8584. [Google Scholar] [CrossRef]
- Osores, M.S.; Folch, A.; Collini, E.; Villarosa, G.; Durant, A.; Pujol, G.; Viramonte, J.G. Validation of the FALL3D Model for the 2008 Chaiten Eruption Using Field and Satellite Data. Andean Geol. 2013, 40, 262–276. [Google Scholar] [CrossRef]
- Spinetti, C.; Barsotti, S.; Neri, A.; Buongiorno, M.F.; Doumaz, F.; Nannipieri, L. Investigation of the Complex Dynamics and Structure of the 2010 Eyjafjallajokull Volcanic Ash Cloud Using Multispectral Images and Numerical Simulations. J. Geophys. Res. Atmos. 2013, 118, 4729–4747. [Google Scholar] [CrossRef]
- Moxnes, E.D.; Kristiansen, N.I.; Stohl, A.; Clarisse, L.; Durant, A.; Weber, K.; Vogel, A. Separation of Ash and Sulfur Dioxide during the 2011 Grimsvotn Eruption. J. Geophys. Res. Atmos. 2014, 119, 7477–7501. [Google Scholar] [CrossRef]
- Kristiansen, N.I.; Prata, A.J.; Stohl, A.; Carn, S.A. Stratospheric Volcanic Ash Emissions Fromthe 13 February 2014 Kelut Eruption. Geophys. Res. Lett. 2015, 42, 588–596. [Google Scholar] [CrossRef]
- Liu, J.; Salmond, J.A.; Dirks, K.N.; Lindsay, J.M. Validation of Ash Cloud Modelling with Satellite Retrievals: A Case Study of the 16-17 June 1996 Mount Ruapehu Eruption. Nat. Hazards 2015, 78, 973–993. [Google Scholar] [CrossRef]
- Crawford, A.M.; Stunder, B.J.B.; Ngan, F.; Pavolonis, M.J. Initializing HYSPLIT with Satellite Observations of Volcanic Ash: A Case Study of the 2008 Kasatochi Eruption. J. Geophys. Res. Atmos. 2016, 121, 10786–10803. [Google Scholar] [CrossRef]
- Dare, R.A.; Smith, D.H.; Naughton, M.J. Ensemble Prediction of the Dispersion of Volcanic Ash from the 13 February 2014 Eruption of Kelut, Indonesia. J. Appl. Meteorol. Clim. 2016, 55, 61–78. [Google Scholar] [CrossRef]
- Wilkins, K.L.; Western, L.M.; Watson, I.M. Simulating Atmospheric Transport of the 2011 Grimsvotn Ash Cloud Using a Data Insertion Update Scheme. Atmos. Environ. 2016, 141, 48–59. [Google Scholar] [CrossRef]
- Tanaka, H.L.; Nakamichi, H.; Iguchi, M. PUFF Model Prediction of Volcanic Ash Plume Dispersal for Sakurajima Using MP Radar Observation. Atmosphere 2020, 11, 1240. [Google Scholar] [CrossRef]
- Chai, T.F.; Crawford, A.; Stunder, B.; Pavolonis, M.J.; Draxler, R.; Stein, A. Improving Volcanic Ash Predictions with the HYSPLIT Dispersion Model by Assimilating MODIS Satellite Retrievals. Atmos. Chem. Phys. 2017, 17, 2865–2879. [Google Scholar] [CrossRef]
- Sorokin, A.A.; Girina, O.A.; Lupyan, E.A.; Mal’kovskii, S.I.; Balashov, I.V.; Efremov, V.Y.; Kramareva, L.S.; Korolev, S.P.; Romanova, I.M.; Simonenko, E. V Satellite Observations and Numerical Simulation Results for the Comprehensive Analysis of Ash Cloud Transport during the Explosive Eruptions of Kamchatka Volcanoes. Russ. Meteorol. Hydrol. 2017, 42, 759–765. [Google Scholar] [CrossRef]
- Poret, M.; Corradini, S.; Merucci, L.; Costa, A.; Andronico, D.; Montopoli, M.; Vulpiani, G.; Freret-Lorgeril, V. Reconstructing Volcanic Plume Evolution Integrating Satellite and Ground-Based Data: Application to the 23 November 2013 Etna Eruption. Atmos. Chem. Phys. 2018, 18, 4695–4714. [Google Scholar] [CrossRef]
- Wu, X.; Griessbach, S.; Hoffmann, L. Long-Range Transport of Volcanic Aerosol from the 2010 Merapi Tropical Eruption to Antarctica. Atmos. Chem. Phys. 2018, 18, 15859–15877. [Google Scholar] [CrossRef]
- Poret, M.; Costa, A.; Andronico, D.; Scollo, S.; Gouhier, M.; Cristaldi, A. Modeling Eruption Source Parameters by Integrating Field, Ground-Based, and Satellite-Based Measurements: The Case of the 23 February 2013 Etna Paroxysm. J. Geophys. Res. Solid Earth 2018, 123, 5427–5450. [Google Scholar] [CrossRef]
- Pardini, F.; Queisser, M.; Naismith, A.; Watson, I.M.; Clarisse, L.; Burton, M.R. Initial Constraints on Triggering Mechanisms of the Eruption of Fuego Volcano (Guatemala) from 3 June 2018 Using IASI Satellite Data. J. Volcanol. Geotherm. Res. 2019, 376, 54–61. [Google Scholar] [CrossRef]
- Clarisse, L.; Hurtmans, D.; Clerbaux, C.; Hadji-Lazaro, J.; Ngadi, Y.; Coheur, P.F. Retrieval of Sulphur Dioxide from the Infrared Atmospheric Sounding Interferometer (IASI). Atmos. Meas. Tech. 2012, 5, 581–594. [Google Scholar] [CrossRef]
- Williams, D.B.; Ramsey, M.S.; Wickens, D.J.; Karimi, B. Identifying Eruptive Sources of Drifting Volcanic Ash Clouds Using Back-Trajectory Modeling of Spaceborne Thermal Infrared Data. Bull. Volcanol. 2019, 81, 53. [Google Scholar] [CrossRef]
- Pardini, F.; Corradini, S.; Costa, A.; Ongaro, T.E.; Merucci, L.; Neri, A.; Stelitano, D.; Vitturi, M.D. Ensemble-Based Data Assimilation of Volcanic Ash Clouds from Satellite Observations: Application to the 24 December 2018 Mt. Etna Explosive Eruption. Atmosphere 2020, 11, 359. [Google Scholar] [CrossRef]
- Paez, P.A.; Cogliati, M.G.; Caselli, A.T.; Monasterio, A.M. An Analysis of Volcanic SO2 and Ash Emissions from Copahue Volcano. J. S. Am. Earth Sci. 2021, 110, 103365. [Google Scholar] [CrossRef]
- Gunda, G.K.T.; Champatiray, P.K.; Chauhan, M.; Chauhan, P.; Ansary, M.; Singh, A.; Ketholia, Y.; Balaji, S. Modelling of Volcanic Ash with HYSPLIT and Satellite Observations: A Case Study of the 2018 Barren Island Volcano Eruption Event, Andaman Territory, India. Curr. Sci. 2021, 121, 529–538. [Google Scholar] [CrossRef]
- Rizza, U.; Donnadieu, F.; Magazu, S.; Passerini, G.; Castorina, G.; Semprebello, A.; Morichetti, M.; Virgili, S.; Mancinelli, E. Effects of Variable Eruption Source Parameters on Volcanic Plume Transport: Example of the 23 November 2013 Paroxysm of Etna. Remote Sens. 2021, 13, 4037. [Google Scholar] [CrossRef]
- Amiridis, V.; Kampouri, A.; Gkikas, A.; Misios, S.; Gialitaki, A.; Marinou, E.; Rennie, M.; Benedetti, A.; Solomos, S.; Zanis, P.; et al. Aeolus winds impact on volcanic ash early warning systems for aviation. Sci. Rep. 2023, 13, 7531. [Google Scholar] [CrossRef]
- Mastin, L.G.; Van Eaton, A.R. Comparing Simulations of Umbrella-Cloud Growth and Ash Transport with Observations from Pinatubo, Kelud, and Calbuco Volcanoes. Atmosphere 2020, 11, 1038. [Google Scholar] [CrossRef]
- Poulidis, A.P.; Phillips, J.C.; Renfrew, I.A.; Barclay, J.; Hogg, A.; Jenkins, S.F.; Robertson, R.; Pyle, D.M. Meteorological Controls on Local and Regional Volcanic Ash Dispersal. Sci. Rep. 2018, 8, 6873. [Google Scholar] [CrossRef]
| Reference | Case Study | Data Source | Retrieval Method | Main Outcomes |
|---|---|---|---|---|
| [7] | Grímsvötn 2011 | C-band and X-band weather radar | Rainbow 5 Software | Plume top height ≈ 20 (21 May 2011). R2 = 0.67. |
| [82] | Etna 2010 | VAMP LiDAR | Klett–Fernald and Polarization LiDAR technique | Ash concentration estimation with an uncertainty of 50%. |
| [83] | Etna 2010 | VAMP LiDAR | Klett inversion | Plume height ≈ 5 km. Ash concentration = ±24,000 ± 6000 mg/m−3. Systematic uncertainty of 50% on the retrieved value of mass concentration is related to an effective radius of 10 mm for ash. |
| [6] | Shinmoedake 2011 | COMPUSS (USB2000 or USB2000+ spectrometers from Ocean Optics) | Differential optical absorption spectroscopy (DOAS) method | Total SO2 emission ≈ 280 kt. SO2 flux > 10,000 ton/day. |
| [84] | Grímsvötn 2011 | Keflavík C-band weather radar | VARR methodology | Plume top height ≈ 20. Mean MER ≈ 4.44 × 10¹¹. |
| [85] | Redoubt 2009 | Doppler C-Band Radar (MM-250C) | Standard atmospheric refraction model | Plume top height ≈ 19 km (3/26/09). |
| [86] | Stromboli 2013 | FLAME network of scanning UV spectrometers and SO2 camera monitoring system | Flux Automatic Measurement in real-time analysis | SO2 flux measured with SO2 camera agrees well with FLAME network. |
| [87] | Stromboli 2013, Karymsky 2011 & Láscar 2012 | NicAir IR Camera | Algorithm based on Temperature Difference and Optical flow method | Stromboli: Mean ash flux 53.0 ± 25.8 kg/s. Total fine ash emitted ≈ 4 t/SO2 masses ≈ 51–160 kg. Karymsky: Ash cloud height > 2000 m (a.v)/Total fine ash mass >10 t/Fine ash Mass flux of ≈ 150 kg/s. Láscar: SO2 mean flux ≈ 130 t day. Errors in fine ash SCDs in the range of 20–50%. |
| [88] | Etna 2011 | Visible and thermal cameras and LiDAR | Klett–Fernald algorithm | Plume top height ≈ 8.5–9 ± 0.5 km (12 August 2011). Concentration of volcanic ash fixed to 2450 kg/m3 with 55% of uncertainty. |
| [89] | Calbuco 2015 | C-band INVAP S.E. Radar system (5.6 GHz) | Standard atmospheric refraction model | Plume top height ≈ 22.8 ± 2.1 km (a.s.l.). |
| [90] | Bárðarbunga 2014–15 | UV-sensitive Ocean Optics Maya2000 Pro | DOAS Method | Post-eruption outgassing of SO2 = 3 ± 1.9 kg/s. |
| [91] | Pacaya 2011 | MIcrotops-II Sun-Photometer | Background atmosphere Correction | AODs < 0.1. |
| [92] | Etna 2010–2011 | Multi-Wavelength Raman LiDAR | VALR-ML methodology | Etna 2010: Ash average concentration is about 8.63 ± 6.04 mg/m3. Mean diameter is about 3.37 ± 2.04 μm. Concentration uncertainty 40% up to 43% and mean diameter 7%. Etna 2011: Ash plume height = 6.5–8 km (a.s.l). Average concentration is about 65.00 ± 37.3 mg/m3. Mean diameter is about 3.01 ± 1.2 μm. VALR estimations with backscattering coefficient error of 50%. |
| [93] | Etna 2011–2015 | L- Band Doppler Radar | VARR | Plume height 15 km (a.s.l.). MER from 2.96 × 10⁴ to 3.26 × 10⁶ kg/s. |
| [94] | Fuego 2017 | FLIR Photo n640 camera | Segmentation algorithm based on BTD, space carving algorithm, and Multiview 3D ash plume reconstruction | Plume height between 1000 m and >2000 m (a.v.). Volume between 2 × 10⁸ m3 and 8 × 10⁸ m3. |
| [95] | Calbuco 2015 | C-band INVAP S.E. radar system (5.6 GHz) | Concept of Equivalent Sphere | Plume height = 25 km (a.s.l.). Total emission was 2.34 × 10¹² kg. |
| [96] | Etna 2015 | FTIR single pixel and a UV camera | LATMOS Atmospheric Retrieval Algorithm (LARA) and DOAS ultraviolet spectroscopy | Underestimation of the SO2 slant column densities (SCDs) of the UV camera by a factor of 3.6. |
| [97] | Etna 2013 | L- and X-band Doppler Radar | VARR methodology MER estimation using SFA, MCA, and TPA methodologies | TPA-DB12 = 4.3 ± 1.0 × 10⁹ kg. TAO-MA09 = 1.7 ± 0.4 × 10⁹ kg. SFA using TIC data = 4.7 ± 1.3 × 10⁹ kg. SFA using L-band VDR = 4.2 ± 1.0 × 10⁹ kg. MCA using X-band MWR and SFA using X-band MWR = 3.9 ± 0.9 × 10⁹ kg. |
| [8] | Etna 2015 | Hyper IR Camera | LATMOS Atmospheric Retrieval Algorithm (LARA) | Accuracy of the classification with R2 = 0.94. SO2 flux error = 16%. |
| [98] | Yasur 2018 | PiCam UV | Optimal flow method and PIVlab in MATLAB | SO2 fluxes ranged from 4 to 5.1 kg s−1, uncertainty of −12.2% to +14.7. |
| [99] | Etna 2019 | UV-sensitive CMOS sensor | Imaging Fabry–Pérot interferometer correlation spectroscopy (IFPICS) | SO2 mass flux of = 84 ± 11 td−1. Limit for the SO2 measurement is 5.5 × 10¹⁷ molec. cm−2s−1/2. |
| [100] | Etna 2016 | Dual-Wavelength Polarimetric LiDAR | VALR Maximum Likelihood (ML), Single Regressive (SR), and Multi-Regressive (MR) | VALR and ML ash concentrations 0.1 μg/m3 and 1 mg/m3 and particle mean sizes of 0.1 μm and 6 μm, respectively. SR method differences are less than <10%. |
| [101] | Cumbre Vieja 2021 | Micropulse LiDAR | Polarization LiDAR Photometer Networking (POLIPHON) algorithm | Plume height ≈ 2.8 km (15 November). Highest ash load (18 October) with a range of 800–3200μg m−3. Ash backscatter coefficient, aerosol optical depth, volume, and particle depolarization ratios were, respectively, 3.6 (2.4) Mm−1sr−1, 0.52 (0.19), 0.13 (0.07), and 0.23 (0.13) on 18 October (15 November). |
| [102] | Cumbre Vieja 2021 | CL51 and CL61 ceilometers (LiDAR) and AERONET sun photometers | Wavelet Covariance Transform (WCT) method | Plume height ≈ 4 km (a.v.l). Ash mass concentration 313.7 μgm−3. |
| Reference | Case Study | Data Source | Retrieval Method | Main Outcomes |
|---|---|---|---|---|
| [10] | Eyjafjallajökull 2010 | FAAM Bae-146 airplane LiDAR and OPC | In situ airborne measurements of the ash cloud | Concentration of particles > 400 nm. Mass concentration 77 μgm−3. |
| [103] | Ontake 2014 | Multirotor UAV (αUAV series) with MultiGAS box (black box) InfReC G120EX, Nippon Avionics Co. Ltd., Japan | DOAS technique and plume sampling | SO2 flux > 2000 t/d at least until 20 h after the eruption. |
| [104] | Fuego 2018 | RiteWing Zephyr II Skywalker X8 | Secondary Electron Microscopy (SEM) ash collection | Appropriate collection mechanism, aerial sampling of ash, with a representative PSD from within a plume. |
| [105] | Stromboli | sUAV with a 4k camera | Interaction between motors and ash | Interactions with fine ash < 250 µm motor blockage happened. |
| [9] | Yasur 2018 | DJI Phantom-3 UAV | Photogrammetry | Plume volume ~3430 m3 ± 512 m3. |
| Reference | Case Study | DATA SOURCE | Retrieval Method | Main Outcomes |
|---|---|---|---|---|
| [106] | Okmok 2008 | CALIOP, OMI, and MFDOAS | LF algorithm, offline ISF, and DOAS technique | Plume heights ≈ 11.5 km ± 1.5 km. Vertical column density (VCD) = 1.75 ± 0.16 DU and 1.22 ± 0.18 DU (OMI) 3.11 ± 0.23 DU (DS-MFDOAS) (SO2). Total erupted mass (SO2) ≈ 0.6 Tg (OMI). |
| [16] | Kasatochi 2008 | CABRIC DOAS instrument and GOME-2 | DOAS technique, Monte Carlo Atmospheric Radiative Transfer and Inversion Model (McArtim) | R2 = 0.84 (SO2 vertical column by GOME-2 vs. averaged CARIBIC values). Plume heights ≈ 11 km. VCD ≈ 3 × 10¹⁷ molec/cm2 (SO2). Total erupted mass (SO2) ≈ 1.5–2.5 Tg. |
| [107] | Etna 2006 | UV Scanner DOAS (FLAME NETWORK), MODIS IASI | BTD, MODRAN (RTM), and DOAS technique | R2 = 0.87 (6 of December). SO2 flux ≈ 6700 t/d (FLAME SO2) and ≈ 5800 t/d (MODIS SO2) 6 of December. |
| [108] | Etna 2011 | MODIS, IASI, GOME-2, and UV Scanner DOAS (FLAME NETWORK) | IASI-UNIOX algorithm, ULB algorithm MODIS least square fit, and RAL product based on the Optimal estimation | FLAME SO2 mass = 4.5 Gg. Differences for satellite: MODIS = 10%; IASI = 15%; GOME-2 = 30%. SO2 flux correlation coefficient between MODIS and FLAME is 0.84. |
| [109] | Holuhraun 2014 | OMI, OMPS, and Brewer spectrophotometer | PCA, BRD, and LF | Brewer SO2 total column record value = 13.9 DU. 6 September SO2 columns are 2.59 DU from BRD algorithm and 2.79 DU for PCA with great agreement, while the Brewer measurement gives 4.4 DU. |
| [110] | Etna 2013 | SEVIRI, MODIS, IASI, DPX4, and Camera | VPR (SEVIRI), VARR (DPX4), BTD (MODIS/SEVIRI), and Optimal estimation with RTTOV (IASI) | 1–2% of total ash was airborne. Plume heights up to 12.6 km. Ash mass retrieval maximum difference before and after the multisensor approach is about 40%. |
| [111] | Etna 2011/2013 | SEVIRI and VIVOTEK IP8172P | BT of the coldest pixel with the atmospheric temperature profile and Visual methods | Plume height of 15 km (a.s.l.). Uncertainty of the plume height was set to +/− 500 m. |
| [112] | Etna 2011 | VOLDORAD-2B (V2B) scanning microwave weather radar (MWR), SEVIRI MODIS, and IR Camera | ECV, SFA, NSA, TPA, MCA, VPR-ash, and VPR-ICE | 2011 (Average MER): V2B = 3.1 ± 0.7 × 10⁵; MWR = 1.7 ± 0.6 × 10⁶ kg/s; IR Camera = 7.5 ± 4.7 × 10⁵ kg/s; SEVIRI = 2.7 ± 2.5 × 10⁴ kg/s; MODIS = 2.6 ± 3.1 × 10² kg/s. 2012 (Average MER): V2B = 1.5 ± 1.3 × 10⁵ kg/s; MWR = 1.4 ± 0.9 × 10⁵ kg/s; IR Camera = 8.6 ± 2.5 × 10⁴ kg/s; SEVIRI = 1.4 ± 1.8 × 10⁶ kg/s; MODIS = 2.6 ± 3.1 × 10² kg/s. |
| [15] | Etna 2020 to 2022 | INGV-OE monitoring system | GNSS, Infrasonic Stations, UV scanners, and VIS/IR cameras | Maximum plume heights (a.s.l.): 13–14 December 2020 = 5.5 km; 28 February 2021 = 12.6 km; 12 March 2021 = 9 km. |
| Reference | Case Study | Data Source | Retrieval Method | Main Outcomes |
|---|---|---|---|---|
| [113] | Etna 2001 & 2002 | MIRS and FALL3D Model | MINX V1.0 Software and Bouyant Plume Theory (BPT) | Plume height ≈ 5 km (23/07/2001) and 6 km (2002). |
| [18] | Kasatochi 2008 & Okmok 2008 | OMI, MFDOAS, AVHRR, and MLDP0 Model | LF algorithm, offline ISF, and DOAS technique and BT method | SO2 concentration = SO2—8.7 DU (18 July); 5.8 DU (19 July). Plume heights ≈ 10–16 km. |
| [114] | Etna 2002 | MODIS and FALL3D | BTD and MODRAN (RTM) | MODIS total ash mass ≈ 20 to 45 kt. FALL3D total ash mass ≈ 35 to 60 kt. Mean AOD ≈ 0.8 µm. Good agreement in the first 300 km. Retrieval errors = 40% and 30% for total ash mass and mean AOD. |
| [115] | Eyjafjallajökull 2010 | Three-dimensional Eulerian Chemistry Transport Model (CMAQ), AERONET Network DRL falcon | Comparison between model AOD and AERONET AOD | Agreement was achieved for lower emission heights. |
| [116] | Grímsvötn 2011 | C-band weather radar and ATHAM Model | VARR | The results show a good agreement between simulations and measurements. |
| [117] | Eyjafjallajökull 2010 | NAME Model and FAAN Bae-146 | Comparison between PSD Aircraft and NAME simulations | On 5 May, quantitative agreement between NAME simulations and observations for particles with diameters between 10.0 and 30.0 μm. |
| [118] | Eyjafjallajökull 2010 | IASI and CHIMERE Model | BTD | Inversion procedure combining IASI satellite observations and CHIMERE allows reconstruction of the SO2 flux. |
| [119] | Chaitén 2008 | MODIS and FALL3D Model | BTD | Agreement between simulations and observations; differences result from model. |
| [120] | Eyjafjallajökull 2010 | MERIS, ASTER, and VOL-CALPUFF Model | Shadow Technique and BTD and RTM | Plume heights 5–10 km. Retrieved remote sensing data and model reliable up to a scale of hundreds of kilometers, showing good agreement. |
| [121] | Grímsvötn 2011 | IASI and FLEXPART Model | Inversion Method | SO2 emission = 0.61 ± 0.25 Tg. Fina ash emission = 0.49 ± 0.1 Tg. Diameter = 2–28 µm Simulation bias = 44%. |
| [122] | Kelut 2014 | AHI and CALIOP FLEXPART | BTD | Most ash injected into 16–17 km. Modelled volcanic concentrations = 9 ± 3 mg m−3. |
| [123] | Ruapehu 1996 | GOES-9 and FLEXPART-WRF Models | BTD method | Plume ratio had a large effect on the model. Uncertainties of plume height do not have a significant impact on the model. The model performance is strongly dependent on the meteorological model. |
| [124] | Kasatochi 2008 | MODIS, CALIOP, and HYSPLIT Model | BTD method | MER calculated from observations: MERfine = 2.8 × 10⁴ kg s−1; MERfine = 2.8 × 10³ kg s−1; MERfine = 2.8 × 10⁵ kg s−1; MERfine = 2.8 × 10⁶ kg s−1. |
| [125] | Kelut 2014 | AHI and HYSPLIT Model | BTD and Geostationary Cloud Algorithm Testbed (GEOCAT) | Very good qualitative agreement between forecast and satellite observations of BT, BTD, and ash probability provided by GEOCAT. |
| [126] | Grímsvötn 2011 | SEVIRI and NAME Model | BTD | Clouds led to an average 6 to 12% reduction detection of ash. Simulations are in very good agreement with observations. |
| [127] | Sakurajima 2019 | X-band MP Radar and PUFF Model | Parallax-based method and the Plume Elevation Model (PEM) | Plume top 4 to 5.5 km (a.s.l.). Total ash emission was 8800 tons. Use of PUFF combined with MP radar data provides accurate results. |
| [128] | Kasatochi 2008 | MODIS, CALIOP, and HYSPLIT Model | Four-channel Algorithm | It is found that the emission estimates vary significantly with different variations in observations inputs. |
| [129] | Kamchatka & Kurilc Islands | MODIS and PUFF Model | VolSatView | A new tool developed for solving the problems of integrated monitoring of ash cloud transport. |
| [130] | Etna 2013 | AERONET network, SEVIRI, and FALL3D Model | BTD and LUT and Field data | Plume height ≈ 8.7 km (a.s.l.). TEM of ≈ 4.9 × 10⁹ kg. MER of ≈ 1.3 × 10⁶ kg/s. |
| [131] | Merapi 2010–11 | AIRS, MIPAS, and MPTRAC Model | MIPAS altitude-resolved aerosol cloud index (ACI) and Aerosol Index (AI) and AIRS-optimized SO2 index based on BT algorithm | Merapi sulfur contribution of 8800 t to Antarctic lower stratosphere. |
| [132] | Etna 2013 | SEVIRI, MODIS, Rada, IR Cameras, FPlume, and FALL3D Models | Integration of field, radar, and satellite TGSD to inversion results with FALL3D | Inversion TGSD yield 75 wt% of field data, 25 wt% of radar. Best matching PM20 for SEVIRI was from 3 to 6 to 9.0 wt%. |
| [133] | Fuego 2018 | IASI, PlumeTraj, and Plume-MoM Models | Elementary radiative transfer and a large lookup table (detailed in [134]) | ≈2 h 50 m climatic paroxysmal phase MER ≈ 1.4 kg s−1. Plume estimates 0.03 ± 0.004 km3. SO2 emission ≈ 130 Kt. |
| [135] | Puyehue-Cordón Caulle 2011 | MODIS and HYSPLIT Model | Geostatistical treatment of BTD results and HYSPLIT back-trajectory | Back trajectory accuracy of 80% within 60 km of the source volcano. |
| [136] | Etna 2018 | SEVIRI and Plume-Mom and HYSPLIT Models | Ensemble square root Kalman Filters (EnSRKFs) and VPR | Accurate knowledge of ESPs is not mandatory for model initialization with the use of EnKFs for ash forecasting. |
| [137] | Copahue 2016 | OMI, HYSPLIT Model | Aerosol Index from OMPS and OMI SO2 Algorithm | Good agreement between HYSPLIT SO2 concentrations and OMPS AI estimations. |
| [138] | Barren 2018 | Sentinel-2, MODIS, OMI LISS-IV, and HYSPLIT | MIROVA algorithm | Combination of sensor observations with HYSPLIT proven effective. |
| [17] | Raikoke 2019 | FPlume Model and Himawari | ICAN-ART integration with FPlume | Reduction of mass overestimation from 37% to 18%. Simulated spatial dispersion of the ash and SO2 agrees well with Himawari-8 as our SAL analysis. |
| [139] | Etna 2013 | V2B Radar, OMPS, VIIRS, SEVIRI, and WRF-CHIMERE | WRF-Chem model configured with eruption source parameters (ESPs) obtained elaborating the raw data from the VOLDORAD-2B (V2B) Doppler radar system | Good comparison with satellite retrievals. |
Disclaimer/Publisher’s Note: The statements, opinions and data contained in all publications are solely those of the individual author(s) and contributor(s) and not of MDPI and/or the editor(s). MDPI and/or the editor(s) disclaim responsibility for any injury to people or property resulting from any ideas, methods, instructions or products referred to in the content. |
© 2024 by the authors. Licensee MDPI, Basel, Switzerland. This article is an open access article distributed under the terms and conditions of the Creative Commons Attribution (CC BY) license (https://creativecommons.org/licenses/by/4.0/).
Share and Cite
Mota, R.; Pacheco, J.M.; Pimentel, A.; Gil, A. Monitoring Volcanic Plumes and Clouds Using Remote Sensing: A Systematic Review. Remote Sens. 2024, 16, 1789. https://doi.org/10.3390/rs16101789
Mota R, Pacheco JM, Pimentel A, Gil A. Monitoring Volcanic Plumes and Clouds Using Remote Sensing: A Systematic Review. Remote Sensing. 2024; 16(10):1789. https://doi.org/10.3390/rs16101789
Chicago/Turabian StyleMota, Rui, José M. Pacheco, Adriano Pimentel, and Artur Gil. 2024. "Monitoring Volcanic Plumes and Clouds Using Remote Sensing: A Systematic Review" Remote Sensing 16, no. 10: 1789. https://doi.org/10.3390/rs16101789
APA StyleMota, R., Pacheco, J. M., Pimentel, A., & Gil, A. (2024). Monitoring Volcanic Plumes and Clouds Using Remote Sensing: A Systematic Review. Remote Sensing, 16(10), 1789. https://doi.org/10.3390/rs16101789